Embed Size (px)
Citation preview

2016 US pay product guide
2
© Copyright 2016, Korn Ferry. All rights reserved.Table of Contents | haygroup.com
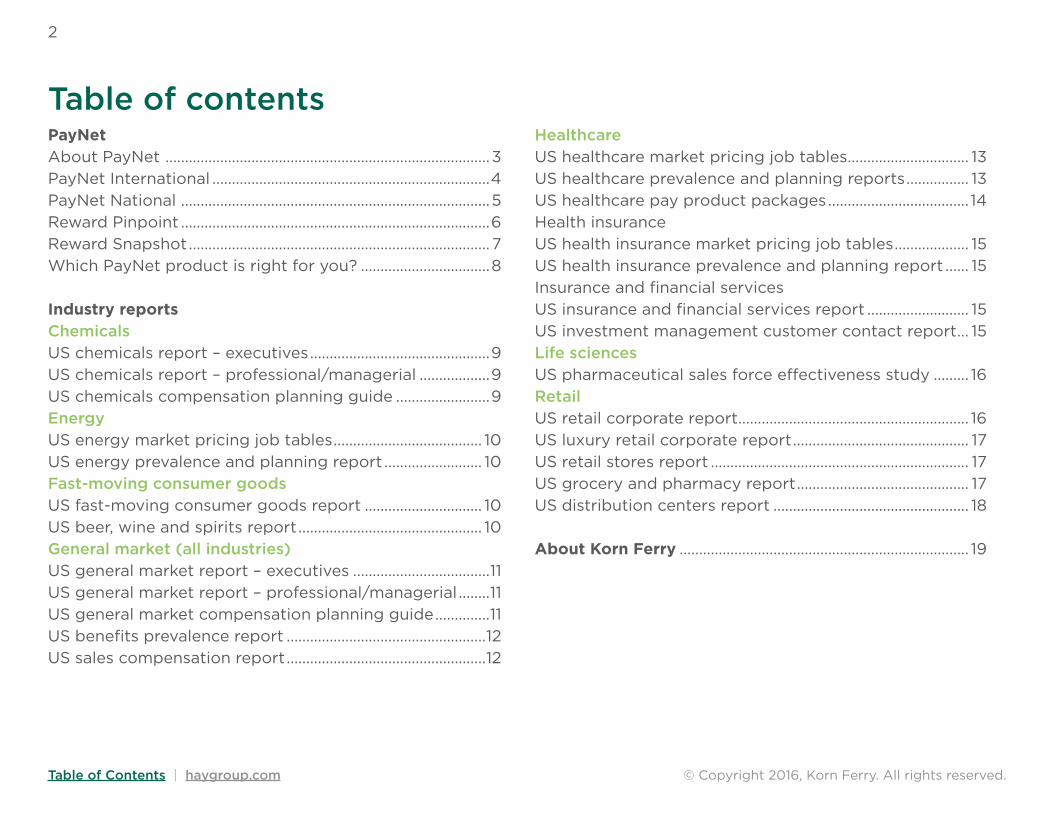
Table of contentsPayNetAbout PayNet ...................................................................................3PayNet International .......................................................................4PayNet National ...............................................................................5Reward Pinpoint ...............................................................................6Reward Snapshot ............................................................................. 7Which PayNet product is right for you? .................................8
Industry reportsChemicalsUS chemicals report – executives ..............................................9US chemicals report – professional/managerial ..................9US chemicals compensation planning guide ........................9EnergyUS energy market pricing job tables ...................................... 10US energy prevalence and planning report ......................... 10Fast-moving consumer goodsUS fast-moving consumer goods report .............................. 10US beer, wine and spirits report ............................................... 10General market (all industries)US general market report – executives ...................................11US general market report – professional/managerial ........11US general market compensation planning guide ..............11US benefits prevalence report ...................................................12US sales compensation report ...................................................12
HealthcareUS healthcare market pricing job tables ............................... 13US healthcare prevalence and planning reports ................ 13US healthcare pay product packages .................................... 14Health insuranceUS health insurance market pricing job tables ................... 15US health insurance prevalence and planning report ...... 15Insurance and financial servicesUS insurance and financial services report .......................... 15US investment management customer contact report ... 15Life sciencesUS pharmaceutical sales force effectiveness study ......... 16RetailUS retail corporate report ........................................................... 16US luxury retail corporate report ............................................. 17US retail stores report .................................................................. 17US grocery and pharmacy report ............................................ 17US distribution centers report .................................................. 18
About Korn Ferry .......................................................................... 19
3
© Copyright 2016, Korn Ferry. All rights reserved.Table of Contents | haygroup.com
PayNet®
PayNet is a powerful online tool that puts the world’s largest and most robust pay and benefits data at your fingertips. It encompasses data on 16 million employees from 24,000 organizations in more than 110 countries.
You can access it 24/7 to quickly query millions of combinations of jobs, pay and market conditions, using multiple approaches to extract information by job match or job size. It is based on our unique job mapping methodology – a quick and easy way to measure jobs in order to match them to the market.
This means:
�� You are comparing roles with similar size and scope across job families, organizations, industries and countries, regardless of job title
�� Unique jobs can be meaningfully compared to others and to the market
With PayNet, you can balance the demands of your employees with what your company can afford. Even though you access it online 24/7, the support isn’t virtual. We have local PayNet experts in every country, dedicated to helping you pay your people right, whether you need insight into local market conditions or a global overview.
How it worksChoose between:
�� PayNet International for consistent, comparable information across a number of countries
�� PayNet National for in-depth local information on a country specific reward market
To access PayNet, submit your organization’s data. Your dedicated Account Manager will support you through the process. The information you give us remains anonymous following strict confidentiality guidelines.
Get pay right for all your people, whatever they do, wherever they are in the world.Hay Group PayNet
Why PayNet?9,000 organizations worldwide, including 70% of the Fortune 500 are already using PayNet.�� Integrity: organizations can absolutely rely on our reward data
�� Accuracy: our robust processes and methodologies guarantee the most accurate data in the market
�� Simplicity: easy to use, intuitive tools accessible whenever you need them
�� Support: subscribers are supported by a network of local experts
4
© Copyright 2016, Korn Ferry. All rights reserved.Table of Contents | haygroup.com
PayNet International provides:�� World's first global total remuneration methodology
�� Interactive access to senior management and general employee level data
�� Consistency – our methodologies, remuneration aggregates, job models, and industries are consistent across all countries
�� Easy cross-country comparisons by job and levels of work
Become enabled to: �� Consistently compare every compensation and benefits element across
countries
�� Quickly understand salary movements and forecasts in each country without the need for time-consuming reconciliations
�� Access sector specific salary trends across key industries
What tools are included? �� Master Data: includes Core Data and Senior Roles
�� Core Data: a query tool to price ‘general employee level’ jobs
�� Senior Roles: our job pricing tool for senior management positions
�� Landscape: provides salary forecasts, industry and job family salary differentials and reward practice reports
PayNet InternationalPayNet International is a valuable tool for global HR managers who need consistent, comparable information across a number of countries. This makes it easier to keep your organization competitive, and makes it a more attractive place to work.
Available data elements: �� Base salary�� Short term variable payments�� Total cash �� Target incentive payment �� Total cash at target �� Total allowances �� Fixed annual cash �� Total earnings �� Total direct compensation �� Benefit values �� Total remuneration �� Fixed annual remuneration �� Total annual remuneration�� Total remuneration plus�� Total remuneration per diem�� Hay points
Pricing:US PayNet International Core Data, $6,045
US PayNet International Senior Roles, $6,045
US PayNet International Master Data, $9,545
Landscape, $1,000 (inclusive of all countries; no data requirement)
5
© Copyright 2016, Korn Ferry. All rights reserved.Table of Contents | haygroup.com
PayNet National offers in-depth local information on country specific reward markets. It enables you to consistently compare every tangible element of your total reward package for executives, managers, professionals, and support staff.
PayNet National
Pricing:US PayNet National, $7,500
(annual subscription)
US PayNet National provides organizations with reward information from over 2,300 organizations representing almost 2 million employees. Access data for 53 benchmark job families and over 1,000 positions.
Key features:�� Flexibility – define your market by industry, geography, ownership, and
organization size
�� Support – local dedicated account managers are ready to assist you with all your data needs
�� Ease of use – extract all the data you need in just three quick steps
The benefits:�� Set pay that reflects current market talent and your organization’s goals
– get an accurate view of what the market is paying to enable you to benchmark your reward and make informed choices.
�� Cut costs and improve profitability – basing your pay on market data can help you improve retention, streamline recruitment and target areas for savings.
�� Make like-for-like comparisons across boundaries – based on our unique job mapping methodology, you know you are comparing like with like across job families, organizations, industries and countries regardless of job title. Unique jobs can even be meaningfully compared to others and to the market.
Available US data elements: �� Midpoint base salary�� Base salary�� Fixed annual cash�� Fixed annual remuneration�� Short-term variable payments�� Short-term variable payments (% of base)�� Total cash�� Total earnings�� Target incentive�� Target incentive payment %�� Total cash at target�� Long term incentives�� Long term incentives (% of base)�� Total direct compensation�� Total direct compensation at target�� Benefit values�� Total allowances�� Total annual remuneration�� Total remuneration�� Total remuneration plus�� Total remuneration per diem�� Hay points
6
© Copyright 2016, Korn Ferry. All rights reserved.Table of Contents | haygroup.com
Reward Pinpoint gives you three reports that tell you exactly how much your whole rewards package is worth and how it compares to the market of your choice. It shows you exactly where your offering is competitive – and where it can be improved.
How does it work?�� Step 1: Simply choose the market that is relevant to you – by sector,
country or by a defined peer group. Your dedicated Account Manager will guide you through the easy process of submitting your data. However, if you are already a subscriber to Hay Group PayNet we can run the report for you straight away.
�� Step 2: Your data is compared to Hay Group’s reward database across 20 remuneration elements.
�� Step 3: You will receive three comprehensive ‘company versus market’ reports designed to meet the unique needs of all management levels within your organization. These reports include an executive summary, a detailed valuation analysis and a benefits prevalence analysis.
Key features of Reward Pinpoint:�� Customizable – choose the market and how the data are presented
�� Comprehensive – reports meet the needs of all management levels, presented in summary and by individual employee
�� Consistent – data in all countries produced and displayed in a globally consistent format
�� Reliable – based on a robust actuarial model using globally consistent methodologies
Need to know how your rewards measure up?Reward Pinpoint
Pricing:Reward Pinpoint is $4,000 for each ‘company versus market’ report available in all countries. A sample report is available upon request.
Available data elements: �� Base salary�� Short term variable payments�� Total cash�� Target incentive payment percent�� Total cash at target�� Long term incentive values�� Total direct compensation�� Death�� Disability�� Healthcare�� Retirement�� Savings�� Cars�� Other benefits�� Total benefits�� Total allowances�� Total remuneration�� Statutory�� Total remuneration plus�� Total remuneration per diem
7
© Copyright 2016, Korn Ferry. All rights reserved.Table of Contents | haygroup.com
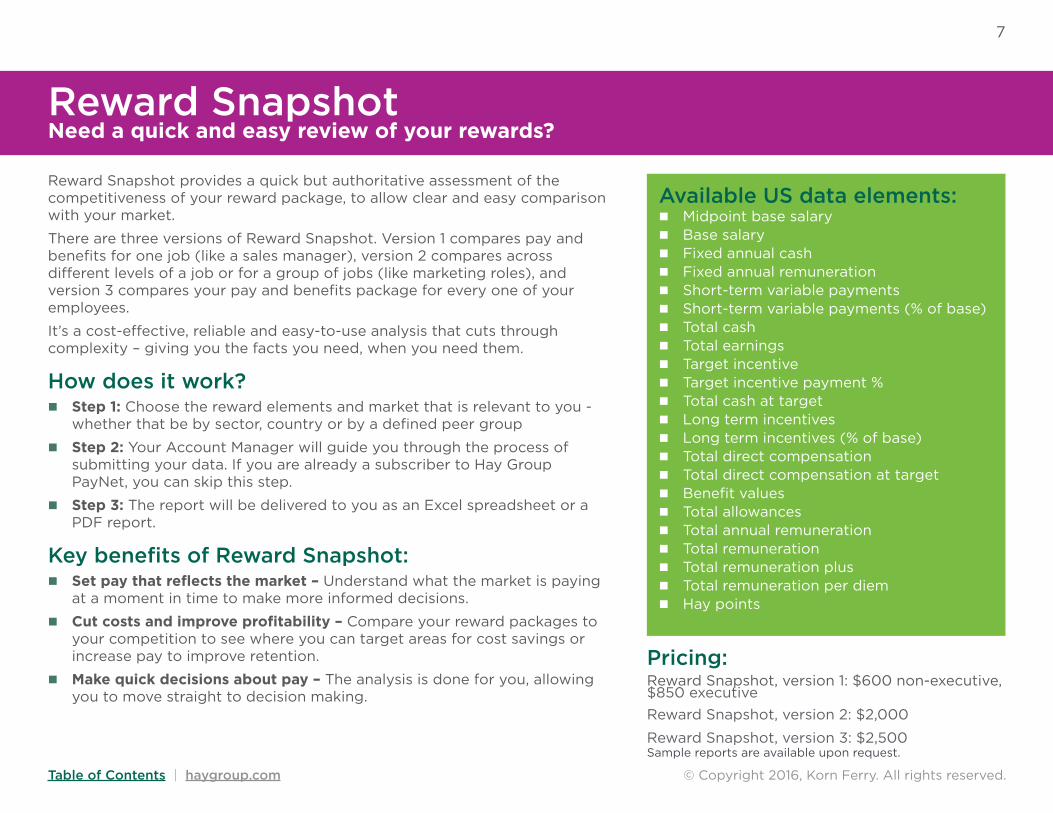
Reward Snapshot provides a quick but authoritative assessment of the competitiveness of your reward package, to allow clear and easy comparison with your market.
There are three versions of Reward Snapshot. Version 1 compares pay and benefits for one job (like a sales manager), version 2 compares across different levels of a job or for a group of jobs (like marketing roles), and version 3 compares your pay and benefits package for every one of your employees.
It’s a cost-effective, reliable and easy-to-use analysis that cuts through complexity – giving you the facts you need, when you need them.
How does it work?�� Step 1: Choose the reward elements and market that is relevant to you -
whether that be by sector, country or by a defined peer group
�� Step 2: Your Account Manager will guide you through the process of submitting your data. If you are already a subscriber to Hay Group PayNet, you can skip this step.
�� Step 3: The report will be delivered to you as an Excel spreadsheet or a PDF report.
Key benefits of Reward Snapshot:�� Set pay that reflects the market – Understand what the market is paying
at a moment in time to make more informed decisions.
�� Cut costs and improve profitability – Compare your reward packages to your competition to see where you can target areas for cost savings or increase pay to improve retention.
�� Make quick decisions about pay – The analysis is done for you, allowing you to move straight to decision making.
Need a quick and easy review of your rewards?Reward Snapshot
Pricing:Reward Snapshot, version 1: $600 non-executive, $850 executiveReward Snapshot, version 2: $2,000
Reward Snapshot, version 3: $2,500Sample reports are available upon request.
Available US data elements: �� Midpoint base salary�� Base salary�� Fixed annual cash�� Fixed annual remuneration�� Short-term variable payments�� Short-term variable payments (% of base)�� Total cash�� Total earnings�� Target incentive�� Target incentive payment %�� Total cash at target�� Long term incentives�� Long term incentives (% of base)�� Total direct compensation�� Total direct compensation at target�� Benefit values�� Total allowances�� Total annual remuneration�� Total remuneration�� Total remuneration plus�� Total remuneration per diem�� Hay points
8
© Copyright 2016, Korn Ferry. All rights reserved.Table of Contents | haygroup.com
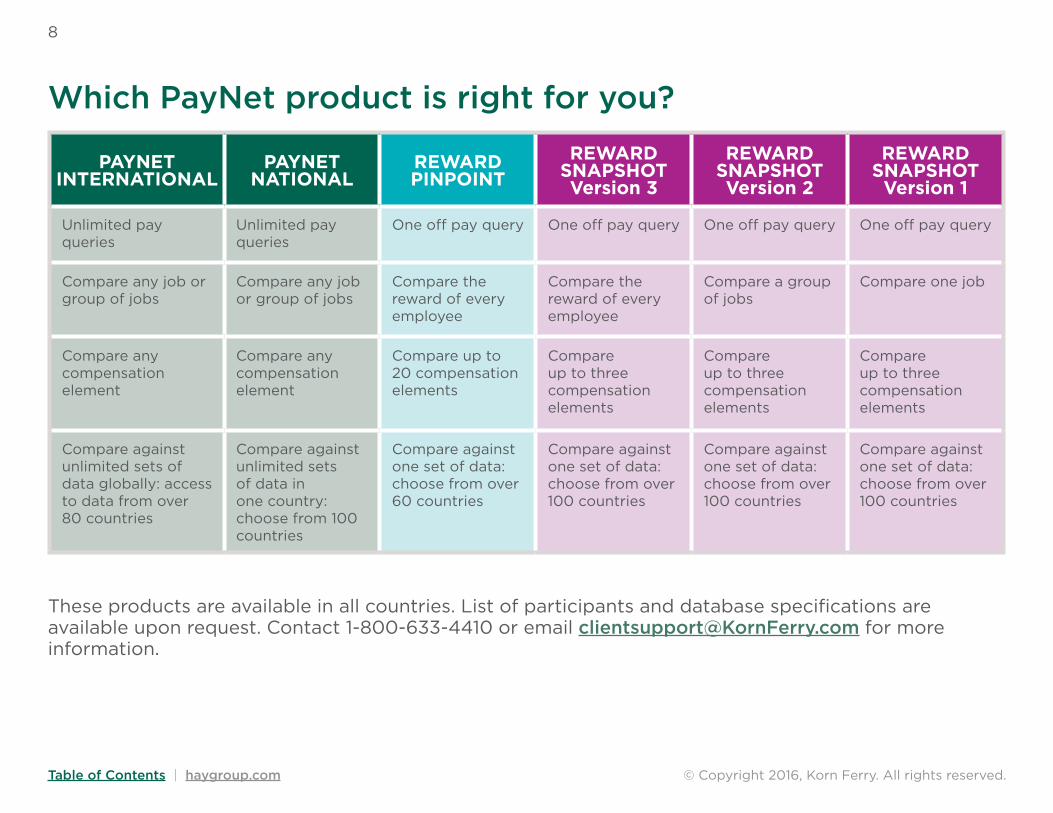
Which PayNet product is right for you?
PAYNET INTERNATIONAL
PAYNET NATIONAL
REWARD PINPOINT
REWARD SNAPSHOT Version 3
REWARD SNAPSHOT Version 2
REWARD SNAPSHOT
Version 1
Unlimited pay queries
Unlimited pay queries
One off pay query One off pay query One off pay query One off pay query
Compare any job or group of jobs
Compare any job or group of jobs
Compare the reward of every employee
Compare the reward of every employee
Compare a group of jobs
Compare one job
Compare any compensation element
Compare any compensation element
Compare up to 20 compensation elements
Compare up to three compensation elements
Compare up to three compensation elements
Compare up to three compensation elements
Compare against unlimited sets of data globally: access to data from over 80 countries
Compare against unlimited sets of data in one country: choose from 100 countries
Compare against one set of data: choose from over 60 countries
Compare against one set of data: choose from over 100 countries
Compare against one set of data: choose from over 100 countries
Compare against one set of data: choose from over 100 countries
These products are available in all countries. List of participants and database specifications are available upon request. Contact 1-800-633-4410 or email [email protected] for more information.
© Copyright 2016, Korn Ferry. All rights reserved.
9
Table of Contents | haygroup.com
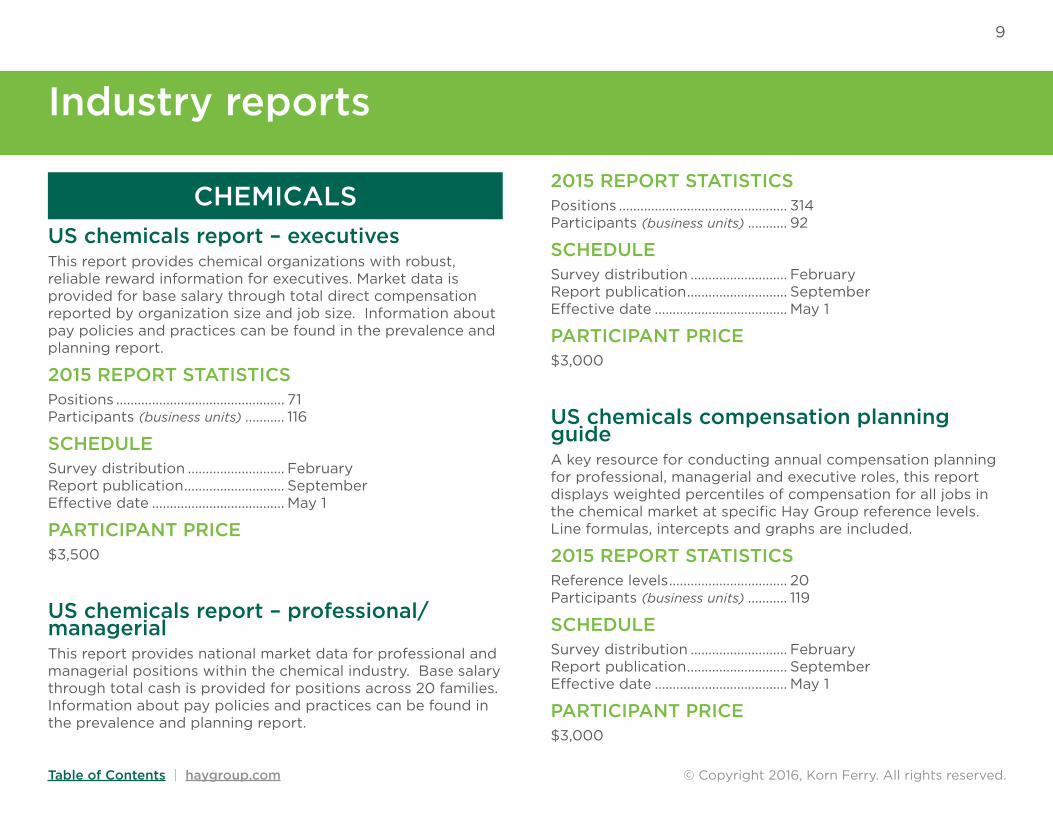
Industry reports
2015 REPORT STATISTICSPositions ............................................... 314 Participants (business units) ........... 92
SCHEDULESurvey distribution ........................... February Report publication ............................ September Effective date ..................................... May 1
PARTICIPANT PRICE$3,000
US chemicals compensation planning guideA key resource for conducting annual compensation planning for professional, managerial and executive roles, this report displays weighted percentiles of compensation for all jobs in the chemical market at specific Hay Group reference levels. Line formulas, intercepts and graphs are included.
2015 REPORT STATISTICSReference levels ................................. 20 Participants (business units) ........... 119
SCHEDULESurvey distribution ........................... February Report publication ............................ September Effective date ..................................... May 1
PARTICIPANT PRICE$3,000
US chemicals report – executivesThis report provides chemical organizations with robust, reliable reward information for executives. Market data is provided for base salary through total direct compensation reported by organization size and job size. Information about pay policies and practices can be found in the prevalence and planning report.
2015 REPORT STATISTICSPositions ............................................... 71 Participants (business units) ........... 116
SCHEDULESurvey distribution ........................... February Report publication ............................ September Effective date ..................................... May 1
PARTICIPANT PRICE$3,500
US chemicals report – professional/managerial This report provides national market data for professional and managerial positions within the chemical industry. Base salary through total cash is provided for positions across 20 families. Information about pay policies and practices can be found in the prevalence and planning report.
CHEMICALS
10
© Copyright 2016, Korn Ferry. All rights reserved.Table of Contents | haygroup.com
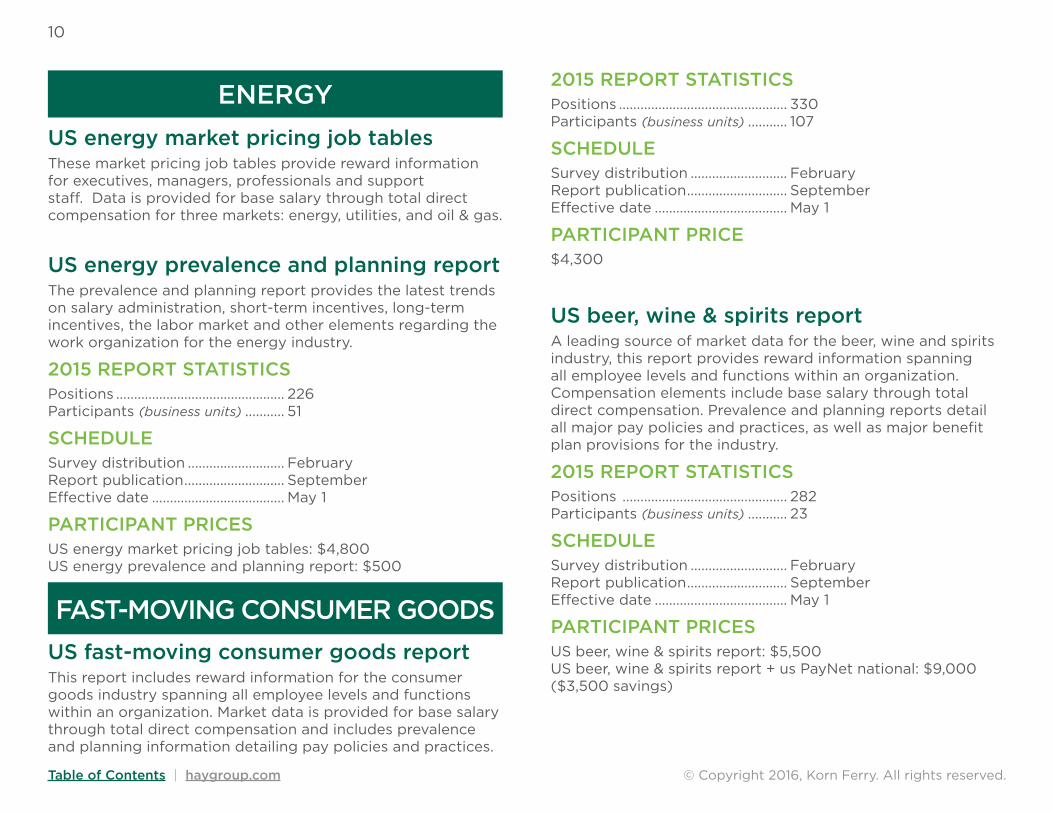
US energy market pricing job tables These market pricing job tables provide reward information for executives, managers, professionals and support staff. Data is provided for base salary through total direct compensation for three markets: energy, utilities, and oil & gas.
US energy prevalence and planning reportThe prevalence and planning report provides the latest trends on salary administration, short-term incentives, long-term incentives, the labor market and other elements regarding the work organization for the energy industry.
2015 REPORT STATISTICSPositions ............................................... 226 Participants (business units) ........... 51
SCHEDULESurvey distribution ........................... February Report publication ............................ September Effective date ..................................... May 1
PARTICIPANT PRICESUS energy market pricing job tables: $4,800 US energy prevalence and planning report: $500
ENERGY
US fast-moving consumer goods reportThis report includes reward information for the consumer goods industry spanning all employee levels and functions within an organization. Market data is provided for base salary through total direct compensation and includes prevalence and planning information detailing pay policies and practices.
FAST-MOVING CONSUMER GOODS
2015 REPORT STATISTICSPositions ............................................... 330 Participants (business units) ........... 107
SCHEDULESurvey distribution ........................... February Report publication ............................ September Effective date ..................................... May 1
PARTICIPANT PRICE$4,300
US beer, wine & spirits reportA leading source of market data for the beer, wine and spirits industry, this report provides reward information spanning all employee levels and functions within an organization. Compensation elements include base salary through total direct compensation. Prevalence and planning reports detail all major pay policies and practices, as well as major benefit plan provisions for the industry.
2015 REPORT STATISTICSPositions .............................................. 282 Participants (business units) ........... 23
SCHEDULESurvey distribution ........................... February Report publication ............................ September Effective date ..................................... May 1
PARTICIPANT PRICESUS beer, wine & spirits report: $5,500 US beer, wine & spirits report + us PayNet national: $9,000 ($3,500 savings)
© Copyright 2016, Korn Ferry. All rights reserved.
11
Table of Contents | haygroup.com
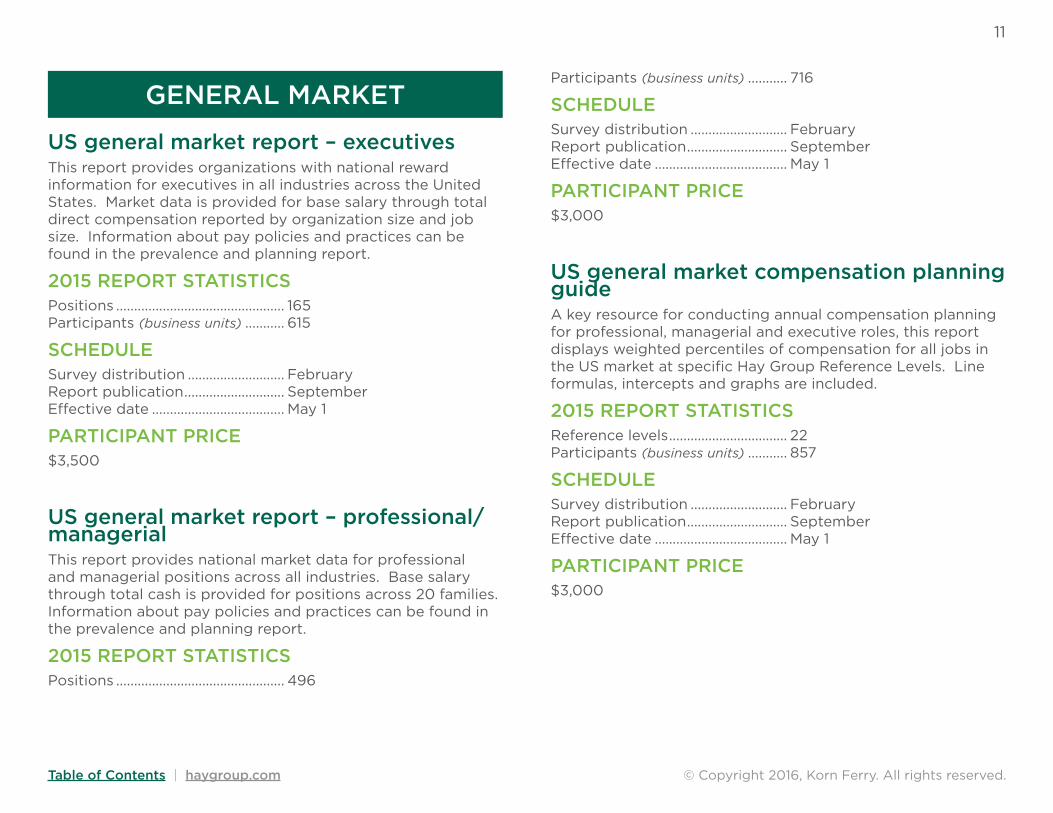
US general market report – executivesThis report provides organizations with national reward information for executives in all industries across the United States. Market data is provided for base salary through total direct compensation reported by organization size and job size. Information about pay policies and practices can be found in the prevalence and planning report.
2015 REPORT STATISTICSPositions ............................................... 165 Participants (business units) ........... 615
SCHEDULESurvey distribution ........................... February Report publication ............................ September Effective date ..................................... May 1
PARTICIPANT PRICE$3,500
US general market report – professional/managerialThis report provides national market data for professional and managerial positions across all industries. Base salary through total cash is provided for positions across 20 families. Information about pay policies and practices can be found in the prevalence and planning report.
2015 REPORT STATISTICSPositions ............................................... 496
GENERAL MARKETParticipants (business units) ........... 716
SCHEDULESurvey distribution ........................... February Report publication ............................ September Effective date ..................................... May 1
PARTICIPANT PRICE$3,000
US general market compensation planning guideA key resource for conducting annual compensation planning for professional, managerial and executive roles, this report displays weighted percentiles of compensation for all jobs in the US market at specific Hay Group Reference Levels. Line formulas, intercepts and graphs are included.
2015 REPORT STATISTICSReference levels ................................. 22 Participants (business units) ........... 857
SCHEDULESurvey distribution ........................... February Report publication ............................ September Effective date ..................................... May 1
PARTICIPANT PRICE$3,000
12
© Copyright 2016, Korn Ferry. All rights reserved.Table of Contents | haygroup.com
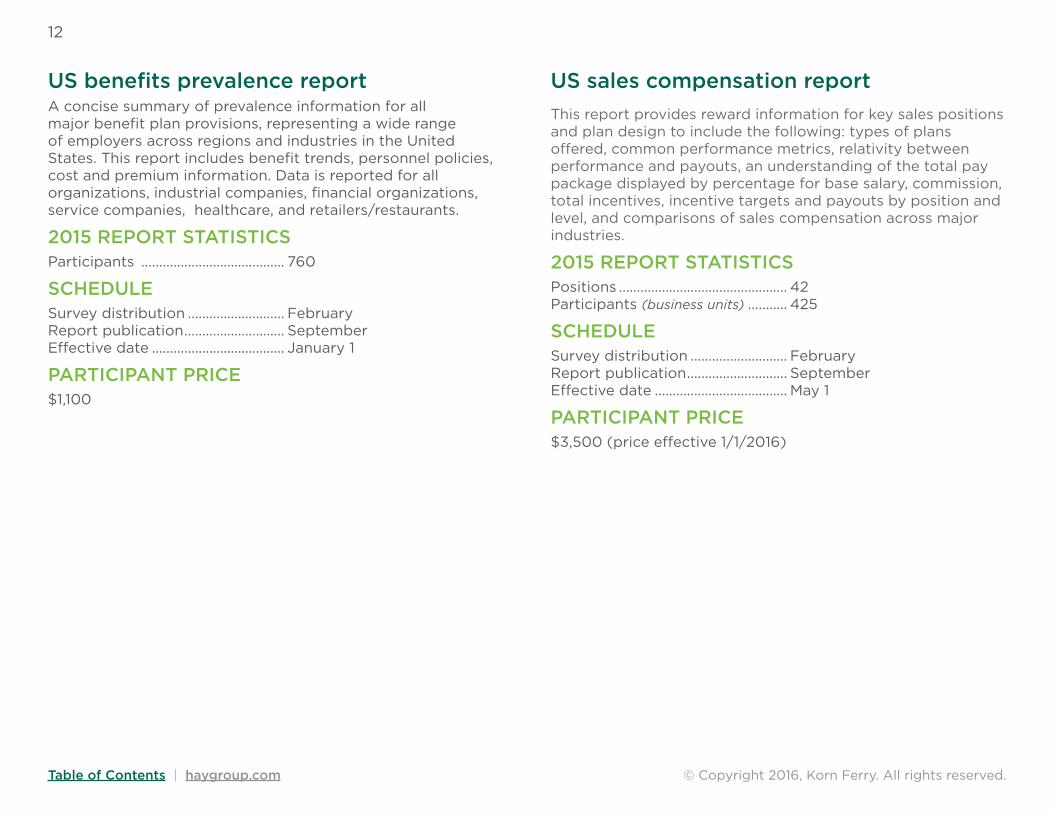
US benefits prevalence report A concise summary of prevalence information for all major benefit plan provisions, representing a wide range of employers across regions and industries in the United States. This report includes benefit trends, personnel policies, cost and premium information. Data is reported for all organizations, industrial companies, financial organizations, service companies, healthcare, and retailers/restaurants.
2015 REPORT STATISTICSParticipants ........................................ 760
SCHEDULESurvey distribution ........................... February Report publication ............................ September Effective date ..................................... January 1
PARTICIPANT PRICE$1,100
US sales compensation report This report provides reward information for key sales positions and plan design to include the following: types of plans offered, common performance metrics, relativity between performance and payouts, an understanding of the total pay package displayed by percentage for base salary, commission, total incentives, incentive targets and payouts by position and level, and comparisons of sales compensation across major industries.
2015 REPORT STATISTICSPositions ............................................... 42 Participants (business units) ........... 425
SCHEDULESurvey distribution ........................... February Report publication ............................ September Effective date ..................................... May 1
PARTICIPANT PRICE$3,500 (price effective 1/1/2016)
© Copyright 2016, Korn Ferry. All rights reserved.
13
Table of Contents | haygroup.com
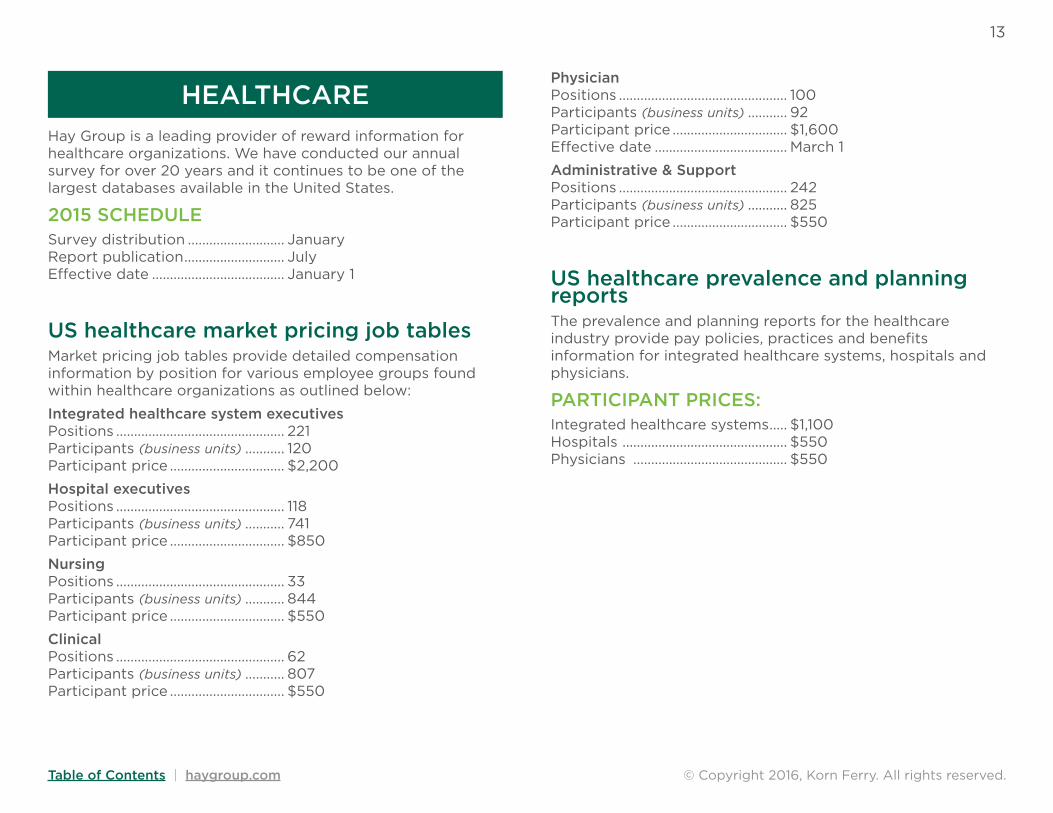
Physician Positions ............................................... 100 Participants (business units) ........... 92 Participant price ................................ $1,600 Effective date ..................................... March 1
Administrative & Support Positions ............................................... 242 Participants (business units) ........... 825 Participant price ................................ $550
US healthcare prevalence and planning reportsThe prevalence and planning reports for the healthcare industry provide pay policies, practices and benefits information for integrated healthcare systems, hospitals and physicians.
PARTICIPANT PRICES: Integrated healthcare systems ..... $1,100 Hospitals .............................................. $550 Physicians ........................................... $550
Hay Group is a leading provider of reward information for healthcare organizations. We have conducted our annual survey for over 20 years and it continues to be one of the largest databases available in the United States.
2015 SCHEDULESurvey distribution ........................... January Report publication ............................ July Effective date ..................................... January 1
US healthcare market pricing job tablesMarket pricing job tables provide detailed compensation information by position for various employee groups found within healthcare organizations as outlined below:
Integrated healthcare system executives Positions ............................................... 221 Participants (business units) ........... 120 Participant price ................................ $2,200
Hospital executives Positions ............................................... 118 Participants (business units) ........... 741 Participant price ................................ $850
Nursing Positions ............................................... 33 Participants (business units) ........... 844 Participant price ................................ $550
Clinical Positions ............................................... 62 Participants (business units) ........... 807 Participant price ................................ $550
HEALTHCARE
14
© Copyright 2016, Korn Ferry. All rights reserved.Table of Contents | haygroup.com
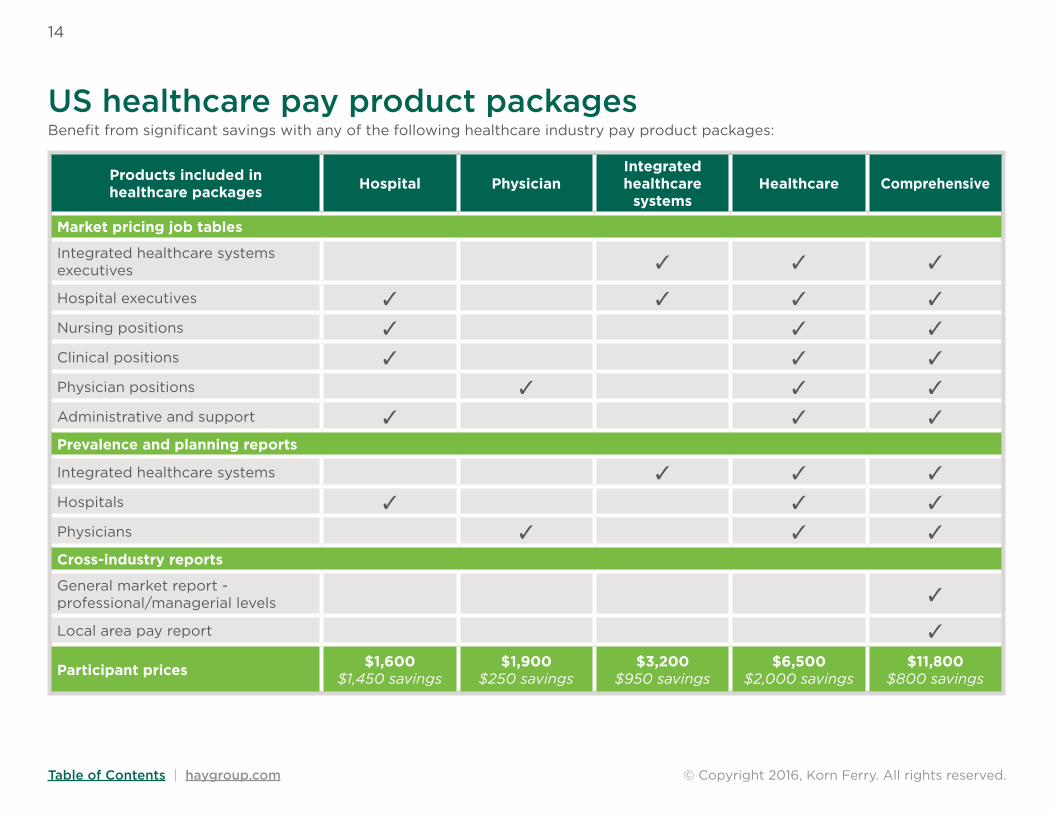
US healthcare pay product packagesBenefit from significant savings with any of the following healthcare industry pay product packages:
Products included in healthcare packages Hospital Physician
Integrated healthcare
systemsHealthcare Comprehensive
Market pricing job tables
Integrated healthcare systems executives ✓ ✓ ✓
Hospital executives ✓ ✓ ✓ ✓
Nursing positions ✓ ✓ ✓
Clinical positions ✓ ✓ ✓
Physician positions ✓ ✓ ✓
Administrative and support ✓ ✓ ✓
Prevalence and planning reports
Integrated healthcare systems ✓ ✓ ✓
Hospitals ✓ ✓ ✓
Physicians ✓ ✓ ✓
Cross-industry reports
General market report - professional/managerial levels ✓
Local area pay report ✓
Participant prices $1,600 $1,450 savings
$1,900 $250 savings
$3,200 $950 savings
$6,500 $2,000 savings
$11,800 $800 savings
© Copyright 2016, Korn Ferry. All rights reserved.
15
Table of Contents | haygroup.com
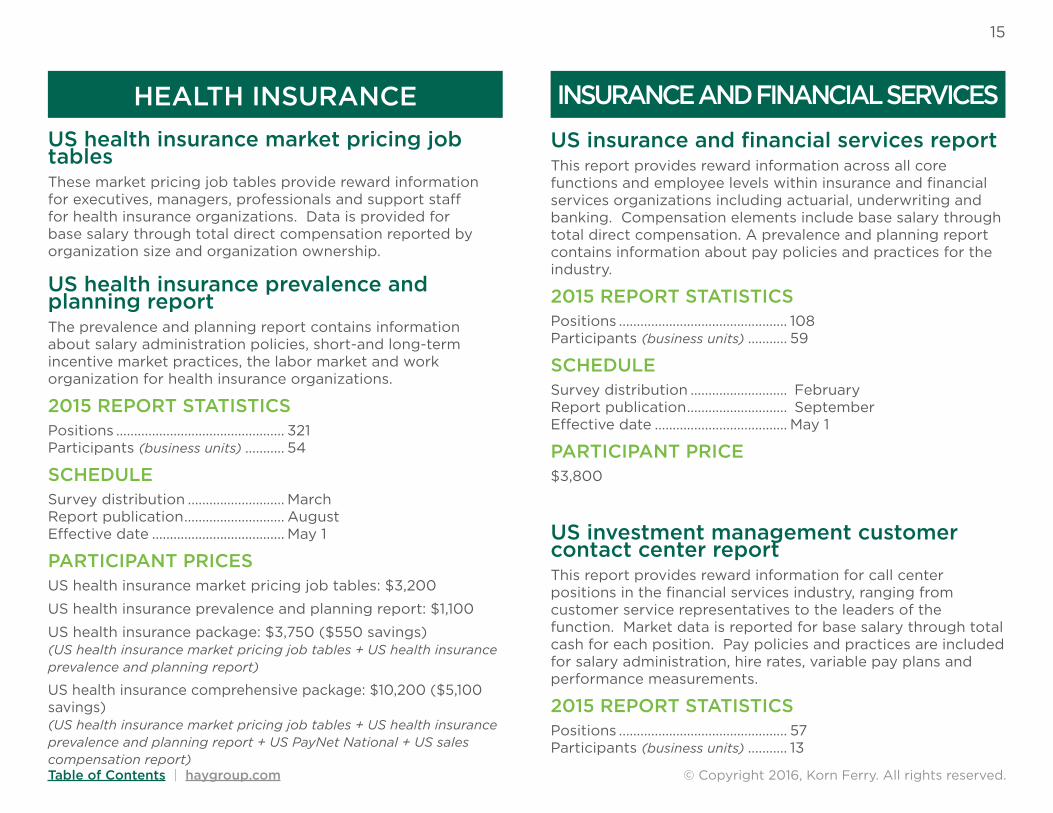
US health insurance market pricing job tablesThese market pricing job tables provide reward information for executives, managers, professionals and support staff for health insurance organizations. Data is provided for base salary through total direct compensation reported by organization size and organization ownership.
US health insurance prevalence and planning reportThe prevalence and planning report contains information about salary administration policies, short-and long-term incentive market practices, the labor market and work organization for health insurance organizations.
2015 REPORT STATISTICSPositions ............................................... 321 Participants (business units) ........... 54
SCHEDULESurvey distribution ........................... March Report publication ............................ August Effective date ..................................... May 1
PARTICIPANT PRICESUS health insurance market pricing job tables: $3,200
US health insurance prevalence and planning report: $1,100
US health insurance package: $3,750 ($550 savings) (US health insurance market pricing job tables + US health insurance prevalence and planning report)
US health insurance comprehensive package: $10,200 ($5,100 savings) (US health insurance market pricing job tables + US health insurance prevalence and planning report + US PayNet National + US sales compensation report)
HEALTH INSURANCE INSURANCE AND FINANCIAL SERVICES
US insurance and financial services reportThis report provides reward information across all core functions and employee levels within insurance and financial services organizations including actuarial, underwriting and banking. Compensation elements include base salary through total direct compensation. A prevalence and planning report contains information about pay policies and practices for the industry.
2015 REPORT STATISTICSPositions ............................................... 108 Participants (business units) ........... 59
SCHEDULESurvey distribution ........................... February Report publication ............................ September Effective date ..................................... May 1
PARTICIPANT PRICE$3,800
US investment management customer contact center reportThis report provides reward information for call center positions in the financial services industry, ranging from customer service representatives to the leaders of the function. Market data is reported for base salary through total cash for each position. Pay policies and practices are included for salary administration, hire rates, variable pay plans and performance measurements.
2015 REPORT STATISTICSPositions ............................................... 57 Participants (business units) ........... 13
16
© Copyright 2016, Korn Ferry. All rights reserved.Table of Contents | haygroup.com
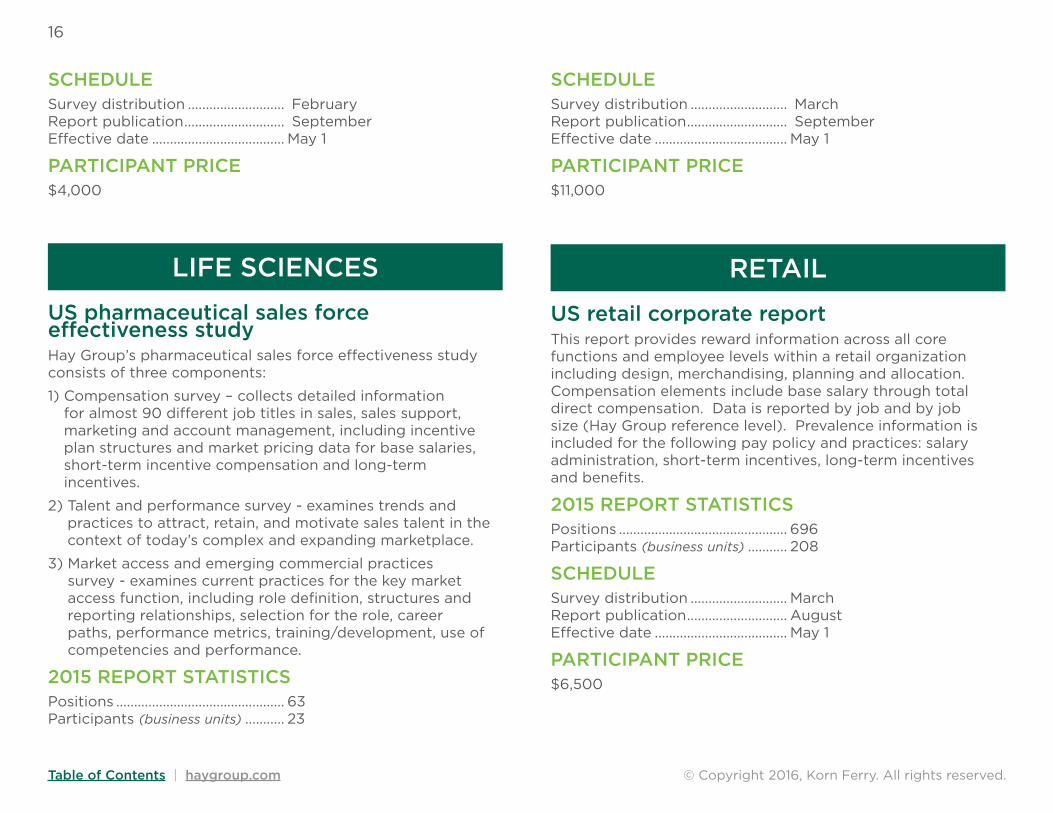
US pharmaceutical sales force effectiveness study Hay Group’s pharmaceutical sales force effectiveness study consists of three components:
1) Compensation survey – collects detailed information for almost 90 different job titles in sales, sales support, marketing and account management, including incentive plan structures and market pricing data for base salaries, short-term incentive compensation and long-term incentives.
2) Talent and performance survey - examines trends and practices to attract, retain, and motivate sales talent in the context of today’s complex and expanding marketplace.
3) Market access and emerging commercial practices survey - examines current practices for the key market access function, including role definition, structures and reporting relationships, selection for the role, career paths, performance metrics, training/development, use of competencies and performance.
2015 REPORT STATISTICSPositions ............................................... 63 Participants (business units) ........... 23
SCHEDULESurvey distribution ........................... February Report publication ............................ September Effective date ..................................... May 1
PARTICIPANT PRICE$4,000
LIFE SCIENCES
SCHEDULESurvey distribution ........................... March Report publication ............................ September Effective date ..................................... May 1
PARTICIPANT PRICE$11,000
RETAIL
US retail corporate reportThis report provides reward information across all core functions and employee levels within a retail organization including design, merchandising, planning and allocation. Compensation elements include base salary through total direct compensation. Data is reported by job and by job size (Hay Group reference level). Prevalence information is included for the following pay policy and practices: salary administration, short-term incentives, long-term incentives and benefits.
2015 REPORT STATISTICSPositions ............................................... 696 Participants (business units) ........... 208
SCHEDULESurvey distribution ........................... March Report publication ............................ August Effective date ..................................... May 1
PARTICIPANT PRICE$6,500
© Copyright 2016, Korn Ferry. All rights reserved.
17
Table of Contents | haygroup.com
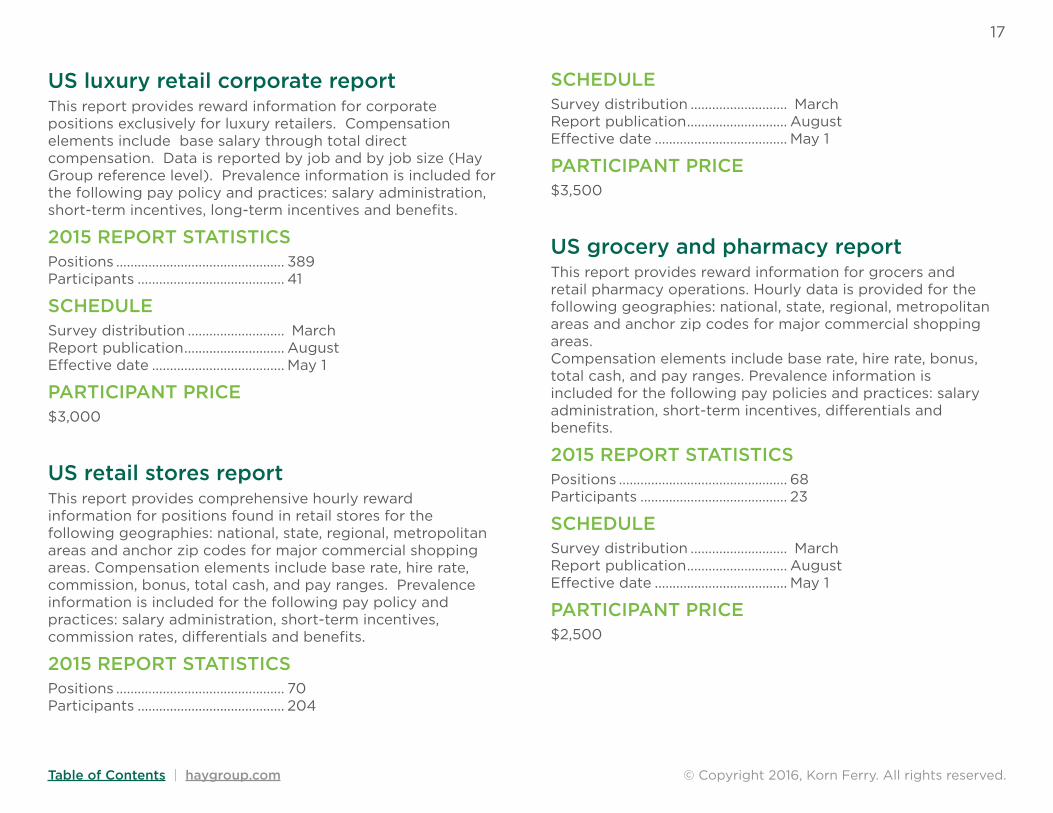
US luxury retail corporate reportThis report provides reward information for corporate positions exclusively for luxury retailers. Compensation elements include base salary through total direct compensation. Data is reported by job and by job size (Hay Group reference level). Prevalence information is included for the following pay policy and practices: salary administration, short-term incentives, long-term incentives and benefits.
2015 REPORT STATISTICSPositions ............................................... 389 Participants ......................................... 41
SCHEDULESurvey distribution ........................... March Report publication ............................ August Effective date ..................................... May 1
PARTICIPANT PRICE$3,000
US retail stores reportThis report provides comprehensive hourly reward information for positions found in retail stores for the following geographies: national, state, regional, metropolitan areas and anchor zip codes for major commercial shopping areas. Compensation elements include base rate, hire rate, commission, bonus, total cash, and pay ranges. Prevalence information is included for the following pay policy and practices: salary administration, short-term incentives, commission rates, differentials and benefits.
2015 REPORT STATISTICSPositions ............................................... 70 Participants ......................................... 204
SCHEDULESurvey distribution ........................... March Report publication ............................ August Effective date ..................................... May 1
PARTICIPANT PRICE$3,500
US grocery and pharmacy reportThis report provides reward information for grocers and retail pharmacy operations. Hourly data is provided for the following geographies: national, state, regional, metropolitan areas and anchor zip codes for major commercial shopping areas. Compensation elements include base rate, hire rate, bonus, total cash, and pay ranges. Prevalence information is included for the following pay policies and practices: salary administration, short-term incentives, differentials and benefits.
2015 REPORT STATISTICSPositions ............................................... 68 Participants ......................................... 23
SCHEDULESurvey distribution ........................... March Report publication ............................ August Effective date ..................................... May 1
PARTICIPANT PRICE$2,500
18
© Copyright 2016, Korn Ferry. All rights reserved.Table of Contents | haygroup.com
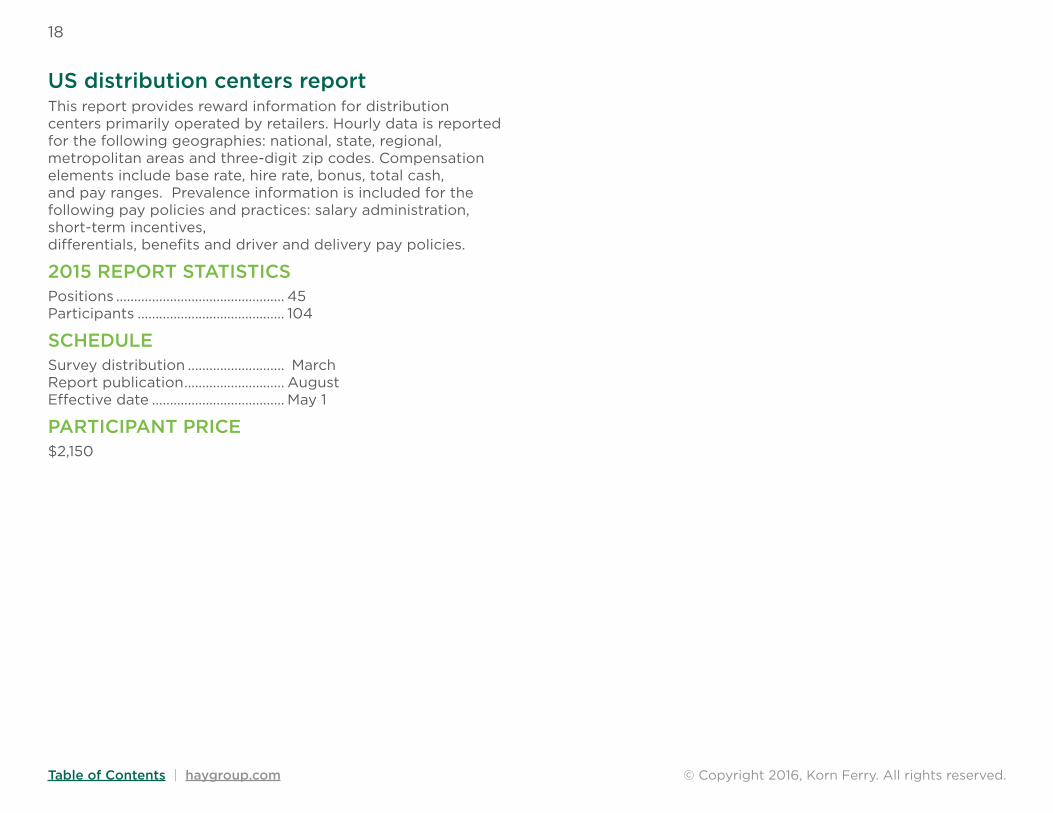
US distribution centers reportThis report provides reward information for distribution centers primarily operated by retailers. Hourly data is reported for the following geographies: national, state, regional, metropolitan areas and three-digit zip codes. Compensation elements include base rate, hire rate, bonus, total cash, and pay ranges. Prevalence information is included for the following pay policies and practices: salary administration, short-term incentives, differentials, benefits and driver and delivery pay policies.
2015 REPORT STATISTICSPositions ............................................... 45 Participants ......................................... 104
SCHEDULESurvey distribution ........................... March Report publication ............................ August Effective date ..................................... May 1
PARTICIPANT PRICE$2,150

© Copyright 2016, Korn Ferry. All rights reserved.
19
Table of Contents | haygroup.com
19
Contact us:
[email protected] or 800-633-4410 | haygroup.comlinkedin.com/company/hay-group | @HayGroup
About Korn Ferry Korn Ferry is the preeminent global people and organizational advisory firm. We help leaders, organizations and societies succeed by releasing the full power and potential of people. Our nearly 7,000 colleagues deliver services through our Executive Search, Hay Group and Futurestep divisions.