Embed Size (px)
Citation preview

Waste Audit Report 2016 Queen’s University – Kingston, ON
1
2016 WASTE AUDIT REPORT
Prepared for:
Queen’s University
207 Stuart Street
Kingston, ON
Prepared by:
GFL Environmental Inc.
242 Cherry Street
Toronto, ON
M5A 3L2
Date
October 4, 5 and 6, 2016
CONFIDENTIALITY CAUTION
This document contains information that is confidential and may be privileged.
The reader is hereby notified that any dissemination, distribution or copying of this plan is strictly prohibited.

Waste Audit Report 2016 Queen’s University- Kingston, ON
2
TABLE OF CONTENTS
EXECUTIVE SUMMARY .............................................................................................. ..3
1 INTRODUCTION ...................................................................................................... 6
2 WASTE AUDIT METHODOLGY .................................................................................. 7
3 WASTE AUDIT RESULTS ......................................................................................... 9
4 RECOMMENDATIONS ........................................................................................... 76
5 CONCLUSIONS ...................................................................................................... 79
MINISTRY OF ENVIRONMENT FORMS APPENDIX I - WASTE AUDIT SUMMARY SHEET ......................................................... 80 APPENDIX II - REPORT OF WASTE REDUCTION WORK PLAN .................................... 89
APPENDIX III - LIST OF AUDITED BUILDINGS…………………………………………….….. 100 APPENDIX IV - WASTE AUDIT PHOTOS…………………………………………………………….101

Waste Audit Report 2016 Queen’s University- Kingston, ON
3
EXECUTIVE SUMMARY
Queen’s University retained GFL Environmental to conduct a solid, non-hazardous waste audit for
the university located in Kingston, Ontario. A point of generation waste audit was performed for
the university campus on October 4, 5, and 6, 2016.
PURPOSE
The purpose of the waste audit was to identify, quantify and analyze the composition of the waste
stream generated from separate designated buildings and areas around the university campus,
and to ensure compliance with the requirements outlined in the Ministry of the Environment
Ontario (MOE) Regulations 102/94 and 103/94.
AUDIT METHODOLOGY
To collect an appropriate sample of waste for the audit, bags of waste (no more than 10 bags per
building) were collected from designated representative campus buildings, which were pre-
determined prior to the audit start. Please see Appendix III for the full listing of the audited
buildings. These buildings were chosen to be representative of different areas throughout the
campus. After a 24 hour collection period, Physical Plant Services collected bags from each of the
designated audit buildings and brought each sample to the onsite sorting area located in the
Biosciences Atrium on campus. GFL Environmental, along with student volunteers, received the
waste samples and conducted the audit and analysis of the waste stream from each building. An
overall survey was completed by the auditing team over the course of three (3) days; bags of
waste material were opened and separated into commodity type (paper, plastic, metal, glass,
organic and ‘other’) and the resulting sub categories. Each commodity type and sub category was
weighed individually and photographs were taken for inclusion in the waste audit report.
WASTE AUDIT RESULTS
The information contained in this report was gathered from the on-site point of generation waste
audit, discussions with Queen’s University personnel, and an analysis of the current waste
management handling practices used on site at the University. The figure below displays the total
projected annual waste categories as represented from the materials analyzed in the audit.

Waste Audit Report 2016 Queen’s University- Kingston, ON
4
Audited Waste Category Breakdown (kg/ year)
The following chart breaks down the audited waste to landfill sample into the following categories:
paper, plastics, metal, glass, household special waste (HSW), organics and an ‘other’ materials
category. This chart displays how much of each material category is generated and disposed of in
the general waste stream annually at Queen’s University.
TOTAL ANNUAL AUDITED LANDFILL WASTE
Total Materials Recycled and Sent to Landfill
The table below outlines data from landfill and recycling pickups in an annualized format. This
table breaks down how much of the total annual generated materials are comprised of disposed
landfill waste, versus diverted recyclables.
Material
Destination
Annual Total
Kilograms (kg) Metric Tonnes (t) Percent (%)
Landfill Waste 1,949,847.52 1,949.85 56.77
Recycled 1,484,770.00 1,484.77 43.23
Total Generated 3,434,620.00 3,434.62 100.00
DIVERSION RATE
The 2016 Waste Diversion Rate for Queen’s University is 43.23%.
355,476.89 305,895.45
25,803.22 24,239.95 5,215.87
1,015,836.74
217,379.40
-
200,000.00
400,000.00
600,000.00
800,000.00
1,000,000.00
1,200,000.00
Paper Plastics Metal Glass HSW Organics Other
An
nu
al A
mo
un
t G
en
era
ted
(kg
)
Commodity Categories

Waste Audit Report 2016 Queen’s University- Kingston, ON
5
RECOMMENDATIONS
Based on the waste audit findings, the top areas of focus should be on initiatives driven towards:
Improving organics program: Organic materials are the heaviest contributor to landfill
waste weight. By diverting organic waste from landfill, Queen’s University could potentially
divert 1,015,836.74 kg from landfill annually. A greater diversion rate could be captured
by expanding the organics program across campus to places such as public areas, rather
than just a few current select areas. Currently the Queen’s Centre, JDUC and Duncan
McArthur, dining rooms, campus food service outlets and Duncan Macarthur are already
participating; and there is a voluntary office organics recycling program.
Training and education: Continue to educate custodial employees, staff and students on
a semi-annual basis to help improve and continue the success of the program. There is a
custodial training program/presentation that will take place over the next year to custodial
teams.
Colour Coded Waste Watchers: Continue purchasing colour coded waste watchers
recycling stations with signage attached. Distribute across campus with posters created by
marketing and communications department.
o Already in place:
Duncan MacArthur
Goodes Hall
Kingston Hall
John Deutsch University Centre (JDUC)
Queen’s Centre
Isabel Bader Centre for the Performing Arts
Ontario Hall
Botterell Hall
Chernoff Hall
o Next to Receive:
Dupuis
Beamish Munro

Waste Audit Report 2016 Queen’s University- Kingston, ON
6
1 INTRODUCTION
Queen’s University retained GFL Environmental to conduct a solid, non-hazardous waste audit for
the University campus, located in Kingston, Ontario. A point of generation waste audit was
performed for the university over the course of three (3) days, October 4, 5, and 6, 2016.
The overall purpose of the waste audit is to identify, quantify and analyze the composition of the
waste stream to ensure compliance with the requirements outlined in the Ministry of the
Environment Ontario (MOE) Regulations 102/94 and 103/94. Under O.Reg. 102/94, all waste
audits must address:
Identify the amount, nature and composition of the waste generated in designated
functional areas of the campus;
How the waste is produced, including relevant management decisions and policies;
How the waste is managed; and
The extent to which materials or products used or sold consist of recycled or reused
materials or products.
Waste audits are also used to determine:
The ability to reduce, reuse and recycle materials from the existing waste stream;
Identify the overall diversion rates for all recyclable materials;
Identify further opportunities for greater diversion, and;
Pinpoint new recycling opportunities, and to enhance and strengthen the existing recycling
initiatives currently in place.
This analysis aids the formation of a Waste Reduction Work Plan; a plan to go forward with a
successful diversion program, drawing from the audit results and the subsequent diversion
recommendations made by GFL Environmental Inc., in partnership with input and insight from
Queen’s University.

Waste Audit Report 2016 Queen’s University- Kingston, ON
7
2 WASTE AUDIT METHODOLOGY
WASTE AUDIT PROCEDURE
To collect an appropriate sample of waste for the audit, a maximum of ten (10) bags were collected
from designated campus buildings, which were pre-determined prior to the audit start. Please see
Appendix III for the full listing of the audited buildings. These buildings were chosen to be
representative of specific waste generation areas throughout the campus. After a 24 hour
collection period, Physical Plant Services and custodial staff collected bags from each of the
designated buildings and brought each sample to the onsite sorting area located in the BioSciences
Atrium on campus. The GFL Environmental team, along with student volunteers, received the
waste samples and conducted the audit and analysis of the waste stream from each building. An
overall survey was completed by the auditing team over the course of three (3) days; bags of
waste material were opened and separated into commodity type (paper, plastic, metal, glass,
organic and ‘other’) and the resulting sub categories. Each commodity type and sub category was
weighed individually and photographs were taken for inclusion in the waste audit report.
COMMODITIES SORTED
The following is a list of commodities categories. The major categories of commodities sorted are
paper, plastic, metal, glass, household special waste, organics, and other materials. Within these
major categories are subcategories, and these help to further sort the commodities.
Paper
Newspaper
Magazines
Cardboard OCC
Boxboard Tissue boxes
Mixed paper Junk mail, fine papers
Molded pulp Egg cartons, take-out beverage trays
Other paper Mult-layered, cold beverage cups
Coffee cups Tim Hortons, Starbucks
Polycoat Containers Individual milk containers, juice containers
Aseptic Containers Juice boxes
Plastic
#1 PETE Soft drinks, disposable water bottles
#2 HDPE Large jugs, buckets
#3 PVC IV bags
#4 LDPE Recyclable
Film
Grocery bags, some shipping packaging
#5 PP Ziplock tupper ware, large yogurt tubs, margarine containers
#6 Styrofoam Take out styrofoam containers
#6 Styrofoam
(Packaging)
Styrofoam peanuts/ pellets used in packaging
#6 Clear/ Hard Coffee cup lids

Waste Audit Report 2016 Queen’s University- Kingston, ON
8
#7 Other Re-usable water bottles
Rigid Plastic Pens, tooth brushes, gift gards
Metal
Aluminum cans Pop cans
Aluminum foil Baking foil
Aerosal cans Hair spray
Steel cans Large soup cans
Scrap metal Wire hangers
Glass
Clear Clear, non-LCBO glass
Coloured Clear, non-LCBO glass
Other glass Ceramic
Household Special Waste (HSW)
Batteries AA, watch batteries
Toner cartridges Printer toner cartridges
Lightbulbs Fluorescent tubes
Organics
Food waste Apples, oranges, coffee grounds
Tissue/ Toweling Kleenex, paper towel
Beverage liquids Water, juice, pop
Other Materials
Other Many different other materials are found in audit samples. Additional
notes are made and entered into the raw data tables.
Note: Commodities sorted consists of materials found in the audit. However, additional materials known to
be generated at the facility may not have been in the audit sample. The additional materials have been
included in the audit results as part of the diversion program in place.
ANOMALIES
Anomalies are physical items or operational challenges that would alter the composition of the
waste stream as a one off occurrence. There were no anomalies found in the 2016 waste audit.

Waste Audit Report 2016 Queen’s University- Kingston, ON
9
3 AUDIT RESULTS
The following is an overview of the audit findings, which includes material stream quantities and
composition.
WASTE AUDITED STREAM
Based on the audit sample, the total amount of waste generated and disposed of as waste from
the entire campus at Queen’s University is estimated to be 5,342.05 kilograms (kg) or 5.34 metric
tonnes (t) during a 24-hour period or 1,949,847.52 kg (1,949.85 t) annually.
From the audited waste sample, organic materials represent 52.10%; paper materials represent
18.23%; plastic materials represent 15.69%; ‘other’ materials represent 11.15%, metal materials
represent 1.32%, glass materials represent 1.24% and HSW represents 0.27% of the total annual
waste disposed and sent to landfill.
Total Annual Waste Generated 2016*
COMMODITY CATEGORY Kg %
Organics 1,015,836.74 52.10
Paper 355,476.89 18.23
Plastics 305,895.45 15.69
‘Other’ 217,379.40 11.15
Metals 25,803.22 1.32
Glass 24,239.95 1.24
HSW 5,215.87 0.27
TOTAL 1,949,847.52 100.00

Waste Audit Report 2016 Queen’s University- Kingston, ON
10
Total Annual Waste Generated 2016*
*Figures are based on 24 hour waste audit sample. Annual projection is based on number of
operational days.
355,476.89 305,895.45
25,803.22 24,239.95 5,215.87
1,015,836.74
217,379.40
-
200,000.00
400,000.00
600,000.00
800,000.00
1,000,000.00
1,200,000.00
Paper Plastics Metal Glass HSW Organics Other
An
nu
al A
mo
un
t G
en
era
ted
(kg
)
Commodity Categories
Paper18.23%Plastics
15.69%Metal1.32%
Glass1.24%
HSW0.27%
Organics52.10%
Other11.15%

Waste Audit Report 2016 Queen’s University – Kingston, ON
11
The following tables and graphs illustrate the breakdown of materials generated and disposed of
as waste at each of the designated Queen’s University audit buildings/areas by commodity
category. Those categories are: paper, plastic, metal, glass, organics ‘other’ and HSW materials.
Tindall Underground Parking
NAME: Tindall Underground
ADDRESS:
DATE: (KGS) (KGS) (KGS) (KGS)
PAPER % % Annual Waste Monthly Weekly Daily
Newspaper 0.00% - - - -
Magazines 0.00% - - - -
Cardboard 0.00% - - - -
Boxboard 29.85% 1,840.90 153.41 25.22 5.04
Mixed Papers 0.00% - - - -
Molded Pulp 0.00% - - - -
Kraft Paper 9.95% 613.63 51.14 8.41 1.68
Other Paper 29.85% 1,840.90 153.41 25.22 5.04
Coffee Cups 29.85% 1,840.90 153.41 25.22 5.04
Polycoat Containers 0.50% 30.68 2.56 0.42 0.08
Total Paper 28.51% 100.00% 6,167.00 513.92 84.48 16.90
PLASTICS
# 1 PETE Soft Drinks 0.82% 30.68 2.56 0.42 0.08
# 2 HDPE 0.00% - - - -
# 3 PVC 0.00% - - - -
# 4 LDPE Recyclable Film 0.00% - - - -
# 5 PP 16.39% 613.63 51.14 8.41 1.68
# 6 PS (Styrofoam) 0.82% 30.68 2.56 0.42 0.08
# 6 PS (Clear/Hard) 0.00% - - - -
# 7 Other 0.00% - - - -
Non-Recyclable Film 65.57% 2,454.53 204.54 33.62 6.72
Rigid Plastics 16.39% 613.63 51.14 8.41 1.68
Plastic Strapping 0.00% - - - -
Total Plastics 17.30% 100.00% 3,743.15 311.93 51.28 10.26
METALS
Aluminum Cans 48.78% 613.63 51.14 8.41 1.68
Aluminum Foil 48.78% 613.63 51.14 8.41 1.68
Aerosal Cans 2.44% 30.68 2.56 0.42 0.08
Steel 0.00% - - - -
Scrap Metal 0.00% - - - -
Total Metals 5.82% 100.00% 1,257.95 104.83 17.23 3.45
GLASS
Glass (Clear/ Coloured) 0.00% - - - -
Other Glass 0.00% - - - -
Total Glass 0.00% 0.00% - - - -
HSW
Batteries 0.00% - - - -
Toner Cartridges 0.00% - - - -
Lightbulbs 0.00% - - - -
Total HSW 0.00% 0.00% - - - -
ORGANICS
Food Waste 72.73% 4,909.05 409.09 67.25 13.45
Tissue / Toweling 27.27% 1,840.90 153.41 25.22 5.04
Beverage Liquids 0.00% - - - -
Compostables 0.00% - - - -
Total Organics 31.21% 100.00% 6,749.95 562.50 92.47 18.49
OTHER MATERIALS
Animal Bedding 99.17% 3,681.79 306.82 50.44 10.09
Latex Gloves 0.83% 30.68 2.56 0.42 0.08
0.00% - - - -
0.00% - - - -
Total Other 17.16% 100.00% 3,712.47 309.37 50.86 10.17
TOTAL ANNUAL WASTE 100.00% 21,630.52 1,802.54 296.31 59.26
Total Annual Divertable Materials 57.02% 12,334.00
Total Annual Non-Divertable Materials 42.98% 9,296.52
WASTE AUDIT DATA
*The highlighted items are not acceptable items for recycling in the regular recycling bin.

Waste Audit Report 2016 Queen’s University- Kingston, ON
12
Sorted Waste Material Breakdown
The above pie chart shows the breakdown of materials found in the audited waste sample from
Tindall Underground Parking.
Non-Divertable vs. Divertable Materials Found in Sample
The pie chart above depicts what percentage of the waste sample from Tindall Underground
Parking was recyclable or divertable materials, and what percentage was waste or non-
divertable materials.
Paper28.51%
Plastics17.30%
Metal5.82%
Glass0.00%
HSW0.00%
Organics31.21%
Other17.16%
Total Annual Divertable Materials57.02%
Total Annual Non-Divertable
Materials42.98%

Waste Audit Report 2016 Queen’s University- Kingston, ON
13
Leonard Hall – Dining Hall
NAME: Leonard Hall - Dining Hall
ADDRESS:
DATE: (KGS) (KGS) (KGS) (KGS)
PAPER % % Annual Waste Monthly Weekly Daily
Newspaper 0.00% - - - -
Magazines 0.00% - - - -
Cardboard 0.00% - - - -
Boxboard 0.82% 30.68 2.56 0.42 0.08
Mixed Papers 0.00% - - - -
Molded Pulp 0.00% - - - -
Kraft Paper 0.82% 30.68 2.56 0.42 0.08
Other Paper 98.36% 3,681.79 306.82 50.44 10.09
Coffee Cups 0.00% - - - -
Polycoat Containers 0.00% - - - -
Total Paper 2.97% 100.00% 3,743.15 311.93 51.28 10.26
PLASTICS
# 1 PETE Soft Drinks 0.00% - - - -
# 2 HDPE 0.00% - - - -
# 3 PVC 0.00% - - - -
# 4 LDPE Recyclable Film 0.00% - - - -
# 5 PP 0.00% - - - -
# 6 PS (Styrofoam) 0.00% - - - -
# 6 PS (Clear/Hard) 0.00% - - - -
# 7 Other 0.00% - - - -
Non-Recyclable Film 99.76% 12,886.27 1,073.86 176.52 35.30
Rigid Plastics 0.24% 30.68 2.56 0.42 0.08
Plastic Strapping 0.00% - - - -
Total Plastics 10.26% 100.00% 12,916.95 1,076.41 176.94 35.39
METALS
Aluminum Cans 0.00% - - - -
Aluminum Foil 100.00% 30.68 2.56 0.42 0.08
Aerosal Cans 0.00% - - - -
Steel 0.00% - - - -
Scrap Metal 0.00% - - - -
Total Metals 0.02% 100.00% 30.68 2.56 0.42 0.08
GLASS
Glass (Clear/ Coloured) 0.00% - - - -
Other Glass 0.00% - - - -
Total Glass 0.00% 0.00% - - - -
HSW
Batteries 0.00% - - - -
Toner Cartridges 0.00% - - - -
Lightbulbs 0.00% - - - -
Total HSW 0.00% 0.00% - - - -
ORGANICS
Food Waste 92.11% 85,908.45 7,159.04 1,176.83 235.37
Tissue / Toweling 7.89% 7,363.58 613.63 100.87 20.17
Beverage Liquids 0.00% - - - -
Compostables 0.00% - - - -
Total Organics 74.06% 100.00% 93,272.03 7,772.67 1,277.70 255.54
OTHER MATERIALS
Textiles 76.78% 12,272.64 1,022.72 168.12 33.62
Latex Gloves 23.22% 3,712.47 309.37 50.86 10.17
0.00% - - - -
0.00% - - - -
Total Other 12.69% 100.00% 15,985.11 1,332.09 218.97 43.79
TOTAL ANNUAL WASTE 100.00% 125,947.92 10,495.66 1,725.31 345.06
Total Annual Divertable Materials 74.10% 93,333.39
Total Annual Non-Divertable Materials 25.90% 32,614.53
WASTE AUDIT DATA
*The highlighted items are not acceptable items for recycling in the regular recycling bin.

Waste Audit Report 2016 Queen’s University- Kingston, ON
14
Sorted Waste Material Breakdown
The above pie chart shows the breakdown of materials found in the audited waste sample from
Leonard Hall – Dining Hall.
Non-Divertable vs. Divertable Materials Found in Sample
The pie chart above depicts what percentage of the waste sample from Tindall Underground
Parking was recyclable or divertable materials, and what percentage was waste or non-divertable
materials.
Paper2.97%
Plastics10.26%
Metal0.02%Glass
0.00%HSW
0.00%
Organics74.06%
Other12.69%
Total Annual Divertable Materials74.10%
Total Annual Non-Divertable
Materials25.90%

Waste Audit Report 2016 Queen’s University – Kingston, ON
15
Fleming Hall
NAME: Fleming
ADDRESS:
DATE: (KGS) (KGS) (KGS) (KGS)
PAPER % % Annual Waste Monthly Weekly Daily
Newspaper 0.00% - - - -
Magazines 0.00% - - - -
Cardboard 33.11% 3,068.16 255.68 42.03 8.41
Boxboard 0.00% - - - -
Mixed Papers 39.74% 3,681.79 306.82 50.44 10.09
Molded Pulp 0.33% 30.68 2.56 0.42 0.08
Kraft Paper 6.62% 613.63 51.14 8.41 1.68
Other Paper 13.25% 1,227.26 102.27 16.81 3.36
Coffee Cups 6.62% 613.63 51.14 8.41 1.68
Polycoat Containers 0.33% 30.68 2.56 0.42 0.08
Total Paper 14.40% 100.00% 9,265.84 772.15 126.93 25.39
PLASTICS
# 1 PETE Soft Drinks 10.42% 613.63 51.14 8.41 1.68
# 2 HDPE 10.42% 613.63 51.14 8.41 1.68
# 3 PVC 0.00% - - - -
# 4 LDPE Recyclable Film 0.52% 30.68 2.56 0.42 0.08
# 5 PP 10.42% 613.63 51.14 8.41 1.68
# 6 PS (Styrofoam) 36.46% 2,147.71 178.98 29.42 5.88
# 6 PS (Clear/Hard) 0.00% - - - -
# 7 Other 0.00% - - - -
Non-Recyclable Film 10.42% 613.63 51.14 8.41 1.68
Rigid Plastics 21.35% 1,257.95 104.83 17.23 3.45
Plastic Strapping 0.00% - - - -
Total Plastics 9.16% 100.00% 5,890.87 490.91 80.70 16.14
METALS
Aluminum Cans 0.00% - - - -
Aluminum Foil 0.00% - - - -
Aerosal Cans 0.00% - - - -
Steel 0.00% - - - -
Scrap Metal 0.00% - - - -
Total Metals 0.00% 0.00% - - - -
GLASS
Glass (Clear/ Coloured) 0.00% - - - -
Other Glass 0.00% - - - -
Total Glass 0.00% 0.00% - - - -
HSW
Batteries 100.00% 30.68 2.56 0.58 0.08
Toner Cartridges 0.00% - - - -
Lightbulbs 0.00% - - - -
Total HSW 0.05% 100.00% 30.68 2.56 0.58 0.08
ORGANICS
Food Waste 72.35% 25,772.54 2,147.71 353.05 70.61
Tissue / Toweling 27.56% 9,818.11 818.18 134.49 26.90
Beverage Liquids 0.00% - - - -
Compostables 0.09% 30.68 2.56 0.42 0.08
Total Organics 55.36% 100.00% 35,621.33 2,968.44 487.96 97.59
OTHER MATERIALS
Textiles 4.54% 613.63 51.14 8.41 1.68
Latex Gloves 0.23% 30.68 2.56 0.42 0.08
Textbooks 95.24% 12,886.27 1,073.86 176.52 35.30
0.00% - - - -
Total Other 21.03% 100.00% 13,530.58 1,127.55 185.35 37.07
TOTAL ANNUAL WASTE 100.00% 64,339.29 5,361.61 881.52 176.27
Total Annual Divertable Materials 70.82% 45,562.16
Total Annual Non-Divertable Materials 29.18% 18,777.13
WASTE AUDIT DATA
*The highlighted items are not acceptable items for recycling in the regular recycling bin.

Waste Audit Report 2016 Queen’s University- Kingston, ON
16
Sorted Waste Material Breakdown
The above pie chart shows the breakdown of materials found in the audited waste sample from
Fleming Hall.
Non-Divertable vs. Divertable Materials Found in Sample
The pie chart above depicts what percentage of the waste sample from Fleming Hall was
recyclable or divertable materials, and what percentage was waste or non-divertable materials.
Paper14.40%
Plastics9.16%
Metal0.00%
Glass0.00%
HSW0.05%
Organics55.36% Other
21.03%
Total Annual Divertable Materials70.82%
Total Annual Non-Divertable
Materials29.18%

Waste Audit Report 2016 Queen’s University – Kingston, ON
17
Queen’s Centre SLC
NAME: Queen's Centre SLC
ADDRESS:
DATE: (KGS) (KGS) (KGS) (KGS)
PAPER % % Annual Waste Monthly Weekly Daily
Newspaper 0.00% - - - -
Magazines 0.00% - - - -
Cardboard 0.00% - - - -
Boxboard 8.26% 613.63 51.14 8.41 1.68
Mixed Papers 0.41% 30.68 2.56 0.42 0.08
Molded Pulp 8.26% 613.63 51.14 8.41 1.68
Kraft Paper 41.32% 3,068.16 255.68 42.03 8.41
Other Paper 8.26% 613.63 51.14 8.41 1.68
Coffee Cups 33.06% 2,454.53 204.54 33.62 6.72
Polycoat Containers 0.41% 30.68 2.56 0.42 0.08
Total Paper 21.15% 100.00% 7,424.94 618.75 101.71 20.34
PLASTICS
# 1 PETE Soft Drinks 24.69% 1,227.26 102.27 16.81 3.36
# 2 HDPE 0.00% - - - -
# 3 PVC 0.00% - - - -
# 4 LDPE Recyclable Film 0.00% - - - -
# 5 PP 12.35% 613.63 51.14 8.41 1.68
# 6 PS (Styrofoam) 0.62% 30.68 2.56 0.42 0.08
# 6 PS (Clear/Hard) 49.38% 2,454.53 204.54 33.62 6.72
# 7 Other 0.00% - - - -
Non-Recyclable Film 0.62% 30.68 2.56 0.42 0.08
Rigid Plastics 12.35% 613.63 51.14 8.41 1.68
Plastic Strapping 0.00% - - - -
Total Plastics 14.16% 100.00% 4,970.42 414.20 68.09 13.62
METALS
Aluminum Cans 100.00% 613.63 51.14 8.41 1.68
Aluminum Foil 0.00% - - - -
Aerosal Cans 0.00% - - - -
Steel 0.00% - - - -
Scrap Metal 0.00% - - - -
Total Metals 1.75% 100.00% 613.63 51.14 8.41 1.68
GLASS
Glass (Clear/ Coloured) 0.00% - - - -
Other Glass 100.00% 2,454.53 204.54 46.27 6.72
Total Glass 6.99% 100.00% 2,454.53 204.54 46.27 6.72
HSW
Batteries 0.00% - - - -
Toner Cartridges 0.00% - - - -
Lightbulbs 0.00% - - - -
Total HSW 0.00% 0.00% - - - -
ORGANICS
Food Waste 78.13% 15,340.79 1,278.40 210.15 42.03
Tissue / Toweling 6.25% 1,227.26 102.27 16.81 3.36
Beverage Liquids 0.00% - - - -
Compostables 15.63% 3,068.16 255.68 42.03 8.41
Total Organics 55.94% 100.00% 19,636.22 1,636.35 268.99 53.80
OTHER MATERIALS
Textiles 0.00% - - - -
Latex Gloves 0.00% - - - -
Textbooks 0.00% - - - -
0.00% - - - -
Total Other 0.00% 0.00% - - - -
TOTAL ANNUAL WASTE 100.00% 35,099.74 2,924.98 493.46 96.16
Total Annual Divertable Materials 89.34% 31,356.58
Total Annual Non-Divertable Materials 10.66% 3,743.15
WASTE AUDIT DATA
*The highlighted items are not acceptable items for recycling in the regular recycling bin.

Waste Audit Report 2016 Queen’s University- Kingston, ON
18
Sorted Waste Material Breakdown
The above pie chart shows the breakdown of materials found in the audited waste sample from
Queen’s Centre SLC.
Non-Divertable vs. Divertable Materials Found in Sample
The pie chart above depicts what percentage of the waste sample from Queen’s Centre SLC was
recyclable or divertable materials, and what percentage was waste or non-divertable materials.
Paper21.15%
Plastics14.16%
Metal1.75%
Glass6.99%
HSW0.00%
Organics55.94%
Other0.00%
Total Annual Divertable Materials89.34%
Total Annual Non-Divertable
Materials10.66%

Waste Audit Report 2016 Queen’s University – Kingston, ON
19
Queen’s Centre, Athletics & Recreation Centre (ARC)
NAME: Queen's Centre ARC
ADDRESS:
DATE: (KGS) (KGS) (KGS) (KGS)
PAPER % % Annual Waste Monthly Weekly Daily
Newspaper 0.00% - - - -
Magazines 0.00% - - - -
Cardboard 7.48% 1,840.90 153.41 25.22 5.04
Boxboard 14.96% 3,681.79 306.82 50.44 10.09
Mixed Papers 0.12% 30.68 2.56 0.42 0.08
Molded Pulp 0.12% 30.68 2.56 0.42 0.08
Kraft Paper 24.94% 6,136.32 511.36 84.06 16.81
Other Paper 24.94% 6,136.32 511.36 84.06 16.81
Coffee Cups 22.44% 5,522.69 460.22 75.65 15.13
Polycoat Containers 4.99% 1,227.26 102.27 16.81 3.36
Total Paper 18.80% 100.00% 24,606.63 2,050.55 337.08 67.42
PLASTICS
# 1 PETE Soft Drinks 31.50% 7,363.58 613.63 100.87 20.17
# 2 HDPE 5.25% 1,227.26 102.27 16.81 3.36
# 3 PVC 0.00% - - - -
# 4 LDPE Recyclable Film 0.13% 30.68 2.56 0.42 0.08
# 5 PP 23.62% 5,522.69 460.22 75.65 15.13
# 6 PS (Styrofoam) 0.13% 30.68 2.56 0.42 0.08
# 6 PS (Clear/Hard) 13.12% 3,068.16 255.68 42.03 8.41
# 7 Other 0.00% - - - -
Non-Recyclable Film 18.37% 4,295.42 357.95 58.84 11.77
Rigid Plastics 7.87% 1,840.90 153.41 25.22 5.04
Plastic Strapping 0.00% - - - -
Total Plastics 17.87% 100.00% 23,379.37 1,948.28 320.27 64.05
METALS
Aluminum Cans 100.00% 3,068.16 255.68 42.03 8.41
Aluminum Foil 0.00% - - - -
Aerosal Cans 0.00% - - - -
Steel 0.00% - - - -
Scrap Metal 0.00% - - - -
Total Metals 2.34% 100.00% 3,068.16 255.68 42.03 8.41
GLASS
Glass (Clear/ Coloured) 0.00% - - - -
Other Glass 100.00% 3,068.16 255.68 57.83 8.41
Total Glass 2.34% 100.00% 3,068.16 255.68 57.83 8.41
HSW
Batteries 0.00% - - - -
Toner Cartridges 0.00% - - - -
Lightbulbs 0.00% - - - -
Total HSW 0.00% 0.00% - - - -
ORGANICS
Food Waste 84.15% 42,340.59 3,528.38 580.01 116.00
Tissue / Toweling 9.76% 4,909.05 409.09 67.25 13.45
Beverage Liquids 0.00% - - - -
Compostables 6.10% 3,068.16 255.68 42.03 8.41
Total Organics 38.45% 100.00% 50,317.81 4,193.15 689.29 137.86
OTHER MATERIALS
Textiles 60.39% 15,954.43 1,329.54 218.55 43.71
Latex Gloves 0.12% 30.68 2.56 0.42 0.08
#1 Water Bottles 2.32% 613.63 51.14 8.41 1.68
Vacuum Bags 13.94% 3,681.79 306.82 50.44 10.09
Residual Waste 23.23% 6,136.32 511.36 84.06 16.81
0.00% - - - -
Total Other 20.19% 100.00% 26,416.85 2,201.40 361.87 72.37
TOTAL ANNUAL WASTE 100.00% 130,856.98 10,904.75 1,808.36 358.51
Total Annual Divertable Materials 68.07% 89,068.65
Total Annual Non-Divertable Materials 31.93% 41,788.32
WASTE AUDIT DATA
*The highlighted items are not acceptable items for recycling in the regular recycling bin.

Waste Audit Report 2016 Queen’s University- Kingston, ON
20
Sorted Waste Material Breakdown
The above pie chart shows the breakdown of materials found in the audited waste sample from
Queen’s Centre, ARC.
Non-Divertable vs. Divertable Materials Found in Sample
The pie chart above depicts what percentage of the waste sample from Queen’s Centre, ARC was
recyclable or divertable materials, and what percentage was waste or non-divertable materials.
Paper18.80%
Plastics17.87%
Metal2.34%
Glass2.34%
HSW0.00%
Organics38.45%
Other20.19%
Total Annual Divertable Materials68.07%
Total Annual Non-
Divertable Materials31.93%

Waste Audit Report 2016 Queen’s University – Kingston, ON
21
John Orr Tower
NAME: John Orr Tower
ADDRESS:
DATE: (KGS) (KGS) (KGS) (KGS)
PAPER % % Annual Waste Monthly Weekly Daily
Newspaper 0.00% - - - -
Magazines 0.00% - - - -
Cardboard 53.44% 4,295.42 357.95 58.84 11.77
Boxboard 0.00% - - - -
Mixed Papers 0.38% 30.68 2.56 0.42 0.08
Molded Pulp 0.38% 30.68 2.56 0.42 0.08
Kraft Paper 0.00% - - - -
Other Paper 15.27% 1,227.26 102.27 16.81 3.36
Coffee Cups 0.00% - - - -
Polycoat Containers 30.53% 2,454.53 204.54 33.62 6.72
Total Paper 8.69% 100.00% 8,038.58 669.88 110.12 22.02
PLASTICS
# 1 PETE Soft Drinks 12.05% 1,227.26 102.27 16.81 3.36
# 2 HDPE 18.07% 1,840.90 153.41 25.22 5.04
# 3 PVC 0.00% - - - -
# 4 LDPE Recyclable Film 0.00% - - - -
# 5 PP 6.02% 613.63 51.14 8.41 1.68
# 6 PS (Styrofoam) 18.07% 1,840.90 153.41 25.22 5.04
# 6 PS (Clear/Hard) 0.00% - - - -
# 7 Other 0.00% - - - -
Non-Recyclable Film 42.17% 4,295.42 357.95 58.84 11.77
Rigid Plastics 3.61% 368.18 30.68 5.04 1.01
Plastic Strapping 0.00% - - - -
Total Plastics 11.02% 100.00% 10,186.29 848.86 139.54 27.91
METALS
Aluminum Cans 66.67% 1,227.26 102.27 16.81 3.36
Aluminum Foil 33.33% 613.63 51.14 8.41 1.68
Aerosal Cans 0.00% - - - -
Steel 0.00% - - - -
Scrap Metal 0.00% - - - -
Total Metals 1.99% 100.00% 1,840.90 153.41 25.22 5.04
GLASS
Glass (Clear/ Coloured) 100.00% 1,227.26 102.27 23.13 3.36
Other Glass 0.00% - - - -
Total Glass 1.33% 100.00% 1,227.26 102.27 23.13 3.36
HSW
Batteries 0.00% - - - -
Toner Cartridges 0.00% - - - -
Lightbulbs 0.00% - - - -
Total HSW 0.00% 0.00% - - - -
ORGANICS
Food Waste 93.58% 62,590.44 5,215.87 857.40 171.48
Tissue / Toweling 6.42% 4,295.42 357.95 58.84 11.77
Beverage Liquids 0.00% - - - -
Compostables 0.00% - - - -
Total Organics 72.33% 100.00% 66,885.86 5,573.82 916.24 183.25
OTHER MATERIALS
Textiles 57.14% 2,454.53 204.54 33.62 6.72
Latex Gloves 0.00% - - - -
#1 Water Bottles 14.29% 613.63 51.14 8.41 1.68
Diapers 28.57% 1,227.26 102.27 16.81 3.36
Residual Waste 0.00% - - - -
0.00% - - - -
Total Other 4.64% 100.00% 4,295.42 357.95 58.84 11.77
TOTAL ANNUAL WASTE 100.00% 92,474.31 7,706.19 1,273.09 253.35
Total Annual Divertable Materials 86.33% 79,833.50
Total Annual Non-Divertable Materials 13.67% 12,640.81
WASTE AUDIT DATA
*The highlighted items are not acceptable items for recycling in the regular recycling bin.

Waste Audit Report 2016 Queen’s University- Kingston, ON
22
Sorted Waste Material Breakdown
The above pie chart shows the breakdown of materials found in the audited waste sample from
John Orr Tower.
Non-Divertable vs. Divertable Materials Found in Sample
The pie chart above depicts what percentage of the waste sample from John Orr Tower was
recyclable or divertable materials, and what percentage was waste or non-divertable materials.
Paper8.69%
Plastics11.02%
Metal1.99%
Glass1.33%
HSW0.00%
Organics72.33%
Other4.64%
Total Annual Divertable Materials86.33%
Total Annual Non-
Divertable Materials13.67%

Waste Audit Report 2016 Queen’s University- Kingston, ON
23
An Clachan Complex
NAME: An Clachan
ADDRESS:
DATE: (KGS) (KGS) (KGS) (KGS)
PAPER % % Annual Waste Monthly Weekly Daily
Newspaper 0.00% - - - -
Magazines 0.00% - - - -
Cardboard 29.52% 7,363.58 613.63 100.87 20.17
Boxboard 7.38% 1,840.90 153.41 25.22 5.04
Mixed Papers 51.66% 12,886.27 1,073.86 176.52 35.30
Molded Pulp 0.12% 30.68 2.56 0.42 0.08
Kraft Paper 0.00% - - - -
Other Paper 8.61% 2,147.71 178.98 29.42 5.88
Coffee Cups 2.46% 613.63 51.14 8.41 1.68
Polycoat Containers 0.12% 30.68 2.56 0.42 0.08
Aseptic Containers 0.12% 30.68 2.56 0.42 0.08
Total Paper 13.81% 100.00% 24,944.13 2,078.68 341.70 68.34
PLASTICS
# 1 PETE Soft Drinks 7.84% 613.63 51.14 8.41 1.68
# 2 HDPE 7.84% 613.63 51.14 8.41 1.68
# 3 PVC 0.00% - - - -
# 4 LDPE Recyclable Film 0.00% - - - -
# 5 PP 7.84% 613.63 51.14 8.41 1.68
# 6 PS (Styrofoam) 8.24% 644.31 53.69 8.83 1.77
# 6 PS (Clear/Hard) 0.39% 30.68 2.56 0.42 0.08
# 7 Other 0.00% - - - -
Non-Recyclable Film 67.06% 5,246.55 437.21 71.87 14.37
Rigid Plastics 0.78% 61.36 5.11 0.84 0.17
Plastic Strapping 0.00% - - - -
Total Plastics 4.33% 100.00% 7,823.81 651.98 107.18 21.44
METALS
Aluminum Cans 33.33% 613.63 51.14 8.41 1.68
Aluminum Foil 33.33% 613.63 51.14 8.41 1.68
Aerosal Cans 33.33% 613.63 51.14 8.41 1.68
Steel 0.00% - - - -
Scrap Metal 0.00% - - - -
Total Metals 1.02% 100.00% 1,840.90 153.41 25.22 5.04
GLASS
Glass (Clear/ Coloured) 0.00% - - - -
Other Glass 100.00% 613.63 51.14 11.57 1.68
Total Glass 0.34% 100.00% 613.63 51.14 11.57 1.68
HSW
Batteries 0.00% - - - -
Toner Cartridges 0.00% - - - -
Appliances 100.00% 4,295.42 357.95 80.97 11.77
Total HSW 2.38% 100.00% 4,295.42 357.95 80.97 11.77
ORGANICS
Food Waste 95.83% 99,408.35 8,284.03 1,361.76 272.35
Tissue / Toweling 4.17% 4,326.10 360.51 59.26 11.85
Beverage Liquids 0.00% - - - -
Compostables 0.00% - - - -
Total Organics 57.41% 100.00% 103,734.45 8,644.54 1,421.02 284.20
OTHER MATERIALS
Textiles 19.67% 7,363.58 613.63 100.87 20.17
Latex Gloves 0.00% - - - -
#1 Water Bottles 1.64% 613.63 51.14 8.41 1.68
Diapers 78.69% 29,454.33 2,454.53 403.48 80.70
Residual Waste 0.00% - - - -
0.00% - - - -
Total Other 20.72% 100.00% 37,431.54 3,119.29 512.76 102.55
TOTAL ANNUAL WASTE 100.00% 180,683.88 15,056.99 2,500.41 495.02
Total Annual Divertable Materials 73.78% 133,311.51
Total Annual Non-Divertable Materials 26.22% 47,372.37
WASTE AUDIT DATA
*The highlighted items are not acceptable items for recycling in the regular recycling bin.

Waste Audit Report 2016 Queen’s University- Kingston, ON
24
Sorted Waste Material Breakdown
The above pie chart shows the breakdown of materials found in the audited waste sample from
An Clachan Complex.
Non-Divertable vs. Divertable Materials Found in Sample
The pie chart above depicts what percentage of the waste sample from An Clachan Complex was
recyclable or divertable materials, and what percentage was waste or non-divertable materials.
Paper13.81%
Plastics4.33%
Metal1.02%
Glass0.34%
HSW2.38%
Organics57.41% Other
20.72%
Total Annual Divertable Materials73.78%
Total Annual Non-
Divertable Materials26.22%

Waste Audit Report 2016 Queen’s University- Kingston, ON
25
Stauffer Library
NAME: Stauffer Library
ADDRESS:
DATE: (KGS) (KGS) (KGS) (KGS)
PAPER % % Annual Waste Monthly Weekly Daily
Newspaper 0.00% - - - -
Magazines 0.00% - - - -
Cardboard 2.22% 613.63 51.14 8.41 1.68
Boxboard 6.65% 1,840.90 153.41 25.22 5.04
Mixed Papers 4.43% 1,227.26 102.27 16.81 3.36
Molded Pulp 0.11% 30.68 2.56 0.42 0.08
Kraft Paper 22.17% 6,136.32 511.36 84.06 16.81
Other Paper 8.87% 2,454.53 204.54 33.62 6.72
Coffee Cups 53.22% 14,727.16 1,227.26 201.74 40.35
Polycoat Containers 2.22% 613.63 51.14 8.41 1.68
Aseptic Containers 0.11% 30.68 2.56 0.42 0.08
Total Paper 32.82% 100.00% 27,674.79 2,306.23 379.11 75.82
PLASTICS
# 1 PETE Soft Drinks 16.11% 3,681.79 306.82 50.44 10.09
# 2 HDPE 0.13% 30.68 2.56 0.42 0.08
# 3 PVC 0.00% - - - -
# 4 LDPE Recyclable Film 0.13% 30.68 2.56 0.42 0.08
# 5 PP 8.05% 1,840.90 153.41 25.22 5.04
# 6 PS (Styrofoam) 0.13% 30.68 2.56 0.42 0.08
# 6 PS (Clear/Hard) 13.42% 3,068.16 255.68 42.03 8.41
# 7 Other 0.13% 30.68 2.56 0.42 0.08
Non-Recyclable Film 59.06% 13,499.90 1,124.99 184.93 36.99
Rigid Plastics 2.82% 644.31 53.69 8.83 1.77
Plastic Strapping 0.00% - - - -
Total Plastics 27.11% 100.00% 22,857.78 1,904.82 313.12 62.62
METALS
Aluminum Cans 75.00% 1,840.90 153.41 25.22 5.04
Aluminum Foil 12.50% 306.82 25.57 4.20 0.84
Aerosal Cans 0.00% - - - -
Steel 0.00% - - - -
Scrap Metal 12.50% 306.82 25.57 4.20 0.84
Total Metals 2.91% 100.00% 2,454.53 204.54 33.62 6.72
GLASS
Glass (Clear/ Coloured) 0.00% - - - -
Other Glass 0.00% - - - -
Total Glass 0.00% 0.00% - - - -
HSW
Batteries 0.00% - - - -
Toner Cartridges 0.00% - - - -
Appliances 0.00% - - - -
Total HSW 0.00% 0.00% - - - -
ORGANICS
Food Waste 74.51% 23,318.01 1,943.17 319.42 63.88
Tissue / Toweling 17.65% 5,522.69 460.22 75.65 15.13
Beverage Liquids 0.00% - - - -
Compostables 7.84% 2,454.53 204.54 33.62 6.72
Total Organics 37.12% 100.00% 31,295.22 2,607.94 428.70 85.74
OTHER MATERIALS
Textiles 0.00% - - - -
Latex Gloves 0.00% - - - -
#1 Water Bottles 100.00% 30.68 2.56 0.42 0.08
Diapers 0.00% - - - -
Residual Waste 0.00% - - - -
0.00% - - - -
Total Other 0.04% 100.00% 30.68 2.56 0.42 0.08
TOTAL ANNUAL WASTE 100.00% 84,313.01 7,026.08 1,154.97 230.99
Total Annual Divertable Materials 79.84% 67,315.41
Total Annual Non-Divertable Materials 20.16% 16,997.60
WASTE AUDIT DATA
*The highlighted items are not acceptable items for recycling in the regular recycling bin.

Waste Audit Report 2016 Queen’s University- Kingston, ON
26
Sorted Waste Material Breakdown
The above pie chart shows the breakdown of materials found in the audited waste sample from
Stauffer Library.
Non-Divertable vs. Divertable Materials Found in Sample
The pie chart above depicts what percentage of the waste sample from Stauffer Library was
recyclable or divertable materials, and what percentage was waste or non-divertable materials.
Paper32.82%
Plastics27.11%
Metal2.91%
Glass0.00%
HSW0.00%
Organics37.12%
Other0.04%
Total Annual Divertable Materials79.84%
Total Annual Non-
Divertable Materials20.16%

Waste Audit Report 2016 Queen’s University- Kingston, ON
27
Kingston Hall
NAME: Kingston Hall
ADDRESS:
DATE: (KGS) (KGS) (KGS) (KGS)
PAPER % % Annual Waste Monthly Weekly Daily
Newspaper 0.00% - - - -
Magazines 0.00% - - - -
Cardboard 0.00% - - - -
Boxboard 5.56% 613.63 51.14 8.41 1.68
Mixed Papers 16.67% 1,840.90 153.41 25.22 5.04
Molded Pulp 0.00% - - - -
Kraft Paper 11.11% 1,227.26 102.27 16.81 3.36
Other Paper 33.33% 3,681.79 306.82 50.44 10.09
Coffee Cups 27.78% 3,068.16 255.68 42.03 8.41
Polycoat Containers 5.56% 613.63 51.14 8.41 1.68
Aseptic Containers 0.00% - - - -
Total Paper 40.40% 100.00% 11,045.37 920.45 151.31 30.26
PLASTICS
# 1 PETE Soft Drinks 28.44% 1,840.90 153.41 25.22 5.04
# 2 HDPE 0.00% - - - -
# 3 PVC 0.00% - - - -
# 4 LDPE Recyclable Film 19.43% 1,257.95 104.83 17.23 3.45
# 5 PP 0.00% - - - -
# 6 PS (Styrofoam) 0.00% - - - -
# 6 PS (Clear/Hard) 0.00% - - - -
# 7 Other 0.00% - - - -
Non-Recyclable Film 47.39% 3,068.16 255.68 42.03 8.41
Rigid Plastics 4.74% 306.82 25.57 4.20 0.84
Plastic Strapping 0.00% - - - -
Total Plastics 23.68% 100.00% 6,473.82 539.48 88.68 17.74
METALS
Aluminum Cans 50.00% 306.82 25.57 4.20 0.84
Aluminum Foil 0.00% - - - -
Aerosal Cans 0.00% - - - -
Steel 0.00% - - - -
Scrap Metal 50.00% 306.82 25.57 4.20 0.84
Total Metals 2.24% 100.00% 613.63 51.14 8.41 1.68
GLASS
Glass (Clear/ Coloured) 0.00% - - - -
Other Glass 0.00% - - - -
Total Glass 0.00% 0.00% - - - -
HSW
Batteries 0.00% - - - -
Toner Cartridges 0.00% - - - -
Appliances 0.00% - - - -
Total HSW 0.00% 0.00% - - - -
ORGANICS
Food Waste 64.29% 5,522.69 460.22 75.65 15.13
Tissue / Toweling 28.57% 2,454.53 204.54 33.62 6.72
Beverage Liquids 0.00% - - - -
Compostables 7.14% 613.63 51.14 8.41 1.68
Total Organics 31.43% 100.00% 8,590.85 715.90 117.68 23.54
OTHER MATERIALS
Textiles 0.00% - - - -
Latex Gloves 50.00% 306.82 25.57 4.20 0.84
#1 Water Bottles 50.00% 306.82 25.57 4.20 0.84
Diapers 0.00% - - - -
Residual Waste 0.00% - - - -
0.00% - - - -
Total Other 2.24% 100.00% 613.63 51.14 8.41 1.68
TOTAL ANNUAL WASTE 100.00% 27,337.30 2,278.11 374.48 74.90
Total Annual Divertable Materials 71.94% 19,666.90
Total Annual Non-Divertable Materials 28.06% 7,670.40
WASTE AUDIT DATA
*The highlighted items are not acceptable items for recycling in the regular recycling bin.

Waste Audit Report 2016 Queen’s University- Kingston, ON
28
Sorted Waste Material Breakdown
The above pie chart shows the breakdown of materials found in the audited waste sample from
Kingston Hall.
Non-Divertable vs. Divertable Materials Found in Sample
The pie chart above depicts what percentage of the waste sample from Kingston Hall was
recyclable or divertable materials, and what percentage was waste or non-divertable materials.
Paper40.40%
Plastics23.68%
Metal2.24%
Glass0.00%
HSW0.00%
Organics31.43%
Other2.24%
Total Annual Divertable Materials71.94%
Total Annual Non-
Divertable Materials28.06%

Waste Audit Report 2016 Queen’s University- Kingston, ON
29
Richardson Hall
NAME: Richardson Hall
ADDRESS:
DATE: (KGS) (KGS) (KGS) (KGS)
PAPER % % Annual Waste Monthly Weekly Daily
Newspaper 0.00% - - - -
Magazines 0.00% - - - -
Cardboard 0.00% - - - -
Boxboard 32.79% 1,227.26 102.27 16.81 3.36
Mixed Papers 16.39% 613.63 51.14 8.41 1.68
Molded Pulp 0.00% - - - -
Kraft Paper 0.82% 30.68 2.56 0.42 0.08
Other Paper 32.79% 1,227.26 102.27 16.81 3.36
Coffee Cups 16.39% 613.63 51.14 8.41 1.68
Polycoat Containers 0.82% 30.68 2.56 0.42 0.08
Aseptic Containers 0.00% - - - -
Total Paper 21.86% 100.00% 3,743.15 311.93 51.28 10.26
PLASTICS
# 1 PETE Soft Drinks 0.96% 30.68 2.56 0.42 0.08
# 2 HDPE 0.96% 30.68 2.56 0.42 0.08
# 3 PVC 0.00% - - - -
# 4 LDPE Recyclable Film 9.62% 306.82 25.57 4.20 0.84
# 5 PP 0.00% - - - -
# 6 PS (Styrofoam) 0.00% - - - -
# 6 PS (Clear/Hard) 1.92% 61.36 5.11 0.84 0.17
# 7 Other 0.00% - - - -
Non-Recyclable Film 67.31% 2,147.71 178.98 29.42 5.88
Rigid Plastics 19.23% 613.63 51.14 8.41 1.68
Plastic Strapping 0.00% - - - -
Total Plastics 18.64% 100.00% 3,190.89 265.91 43.71 8.74
METALS
Aluminum Cans 0.00% - - - -
Aluminum Foil 0.00% - - - -
Aerosal Cans 0.00% - - - -
Steel 100.00% 30.68 2.56 0.42 0.08
Scrap Metal 0.00% - - - -
Total Metals 0.18% 100.00% 30.68 2.56 0.42 0.08
GLASS
Glass (Clear/ Coloured) 0.00% - - - -
Other Glass 0.00% - - - -
Total Glass 0.00% 0.00% - - - -
HSW
Batteries 0.00% - - - -
Toner Cartridges 0.00% - - - -
Hand Sanitizer 100.00% 613.63 51.14 11.57 1.68
Total HSW 3.58% 100.00% 613.63 51.14 11.57 1.68
ORGANICS
Food Waste 62.07% 5,522.69 460.22 75.65 15.13
Tissue / Toweling 34.48% 3,068.16 255.68 42.03 8.41
Beverage Liquids 0.00% - - - -
Compostables 3.45% 306.82 25.57 4.20 0.84
Total Organics 51.97% 100.00% 8,897.66 741.47 121.89 24.38
OTHER MATERIALS
Textiles 4.76% 30.68 2.56 0.42 0.08
Latex Gloves 0.00% - - - -
#1 Water Bottles 0.00% - - - -
Diapers 0.00% - - - -
K Cups 95.24% 613.63 51.14 8.41 1.68
0.00% - - - -
Total Other 3.76% 100.00% 644.31 53.69 8.83 1.77
TOTAL ANNUAL WASTE 100.00% 17,120.33 1,426.69 237.69 46.91
Total Annual Divertable Materials 72.94% 12,487.41
Total Annual Non-Divertable Materials 27.06% 4,632.92
WASTE AUDIT DATA
*The highlighted items are not acceptable items for recycling in the regular recycling bin.

Waste Audit Report 2016 Queen’s University- Kingston, ON
30
Sorted Waste Material Breakdown
The above pie chart shows the breakdown of materials found in the audited waste sample from
Richardson Hall.
Non-Divertable vs. Divertable Materials Found in Sample
The pie chart above depicts what percentage of the waste sample from Richardson Hall was
recyclable or divertable materials, and what percentage was waste or non-divertable materials.
Paper21.86%
Plastics18.64%
Metal0.18%
Glass0.00%
HSW3.58%
Organics51.97%
Other3.76%
Total Annual Divertable Materials72.94%
Total Annual Non-
Divertable Materials27.06%

Waste Audit Report 2016 Queen’s University- Kingston, ON
31
Queen’s Day Care
NAME: Daycare
ADDRESS:
DATE: (KGS) (KGS) (KGS) (KGS)
PAPER % % Annual Waste Monthly Weekly Daily
Newspaper 0.00% - - - -
Magazines 0.00% - - - -
Cardboard 0.00% - - - -
Boxboard 0.00% - - - -
Mixed Papers 0.00% - - - -
Molded Pulp 0.00% - - - -
Kraft Paper 0.00% - - - -
Other Paper 50.00% 30.68 2.56 0.42 0.08
Coffee Cups 50.00% 30.68 2.56 0.42 0.08
Polycoat Containers 0.00% - - - -
Aseptic Containers 0.00% - - - -
Total Paper 0.25% 100.00% 61.36 5.11 0.84 0.17
PLASTICS
# 1 PETE Soft Drinks 0.00% - - - -
# 2 HDPE 50.00% 30.68 2.56 0.42 0.08
# 3 PVC 0.00% - - - -
# 4 LDPE Recyclable Film 0.00% - - - -
# 5 PP 0.00% - - - -
# 6 PS (Styrofoam) 0.00% - - - -
# 6 PS (Clear/Hard) 0.00% - - - -
# 7 Other 0.00% - - - -
Non-Recyclable Film 50.00% 30.68 2.56 0.42 0.08
Rigid Plastics 0.00% - - - -
Plastic Strapping 0.00% - - - -
Total Plastics 0.25% 100.00% 61.36 5.11 0.84 0.17
METALS
Aluminum Cans 0.00% - - - -
Aluminum Foil 0.00% - - - -
Aerosal Cans 0.00% - - - -
Steel 0.00% - - - -
Scrap Metal 0.00% - - - -
Total Metals 0.00% 0.00% - - - -
GLASS
Glass (Clear/ Coloured) 0.00% - - - -
Other Glass 0.00% - - - -
Total Glass 0.00% 0.00% - - - -
HSW
Batteries 0.00% - - - -
Toner Cartridges 0.00% - - - -
Hand Sanitizer 0.00% - - - -
Total HSW 0.00% 0.00% - - - -
ORGANICS
Food Waste 95.83% 14,113.53 1,176.13 193.34 38.67
Tissue / Toweling 4.17% 613.63 51.14 8.41 1.68
Beverage Liquids 0.00% - - - -
Compostables 0.00% - - - -
Total Organics 59.70% 100.00% 14,727.16 1,227.26 201.74 40.35
OTHER MATERIALS
Textiles 0.00% - - - -
Latex Gloves 0.00% - - - -
#1 Water Bottles 0.00% - - - -
Diapers 100.00% 9,818.11 818.18 134.49 26.90
K Cups 0.00% - - - -
0.00% - - - -
Total Other 39.80% 100.00% 9,818.11 818.18 134.49 26.90
TOTAL ANNUAL WASTE 100.00% 24,668.00 2,055.67 337.92 67.58
Total Annual Divertable Materials 59.95% 14,788.53
Total Annual Non-Divertable Materials 40.05% 9,879.47
WASTE AUDIT DATA
*The highlighted items are not acceptable items for recycling in the regular recycling bin.
Waste Audit Report 2016 Queen’s University- Kingston, ON
32
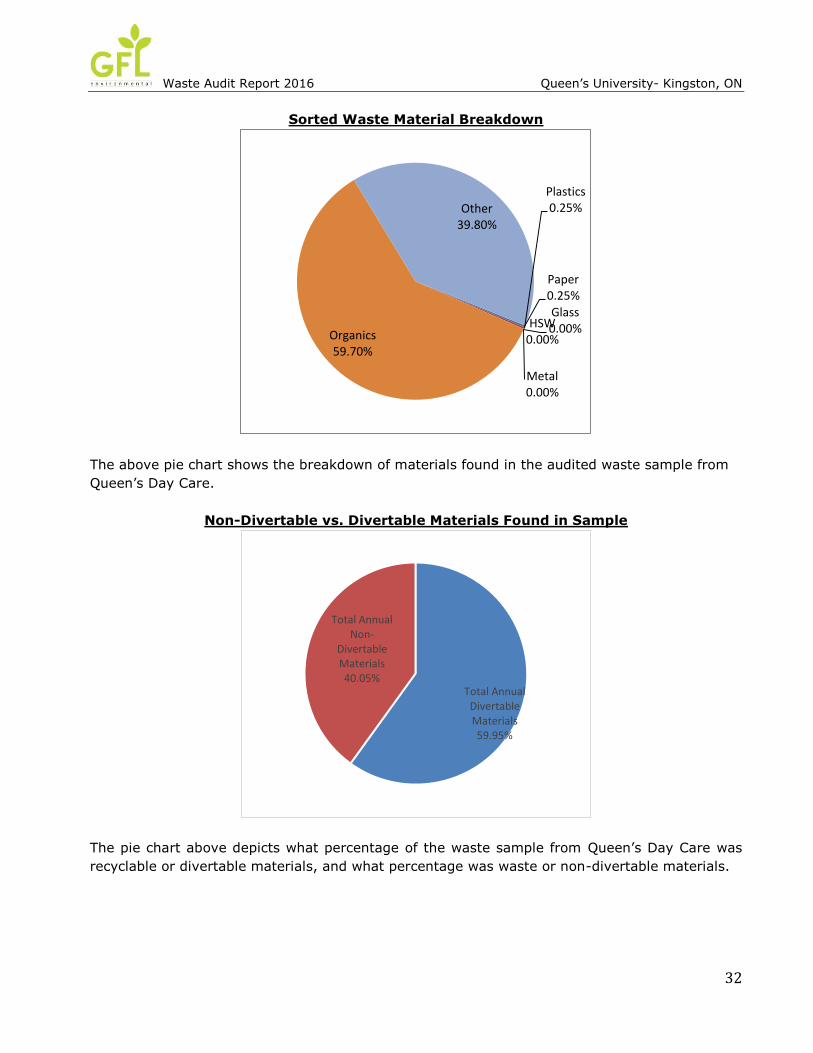
Sorted Waste Material Breakdown
The above pie chart shows the breakdown of materials found in the audited waste sample from
Queen’s Day Care.
Non-Divertable vs. Divertable Materials Found in Sample
The pie chart above depicts what percentage of the waste sample from Queen’s Day Care was
recyclable or divertable materials, and what percentage was waste or non-divertable materials.
Paper0.25%
Plastics0.25%
Metal0.00%
Glass0.00%HSW
0.00%Organics59.70%
Other39.80%
Total Annual Divertable Materials59.95%
Total Annual Non-
Divertable Materials40.05%

Waste Audit Report 2016 Queen’s University- Kingston, ON
33
Gordon Hall
NAME: Gordon Hall
ADDRESS:
DATE: (KGS) (KGS) (KGS) (KGS)
PAPER % % Annual Waste Monthly Weekly Daily
Newspaper 0.00% - - - -
Magazines 0.00% - - - -
Cardboard 0.00% - - - -
Boxboard 10.36% 613.63 51.14 8.41 1.68
Mixed Papers 25.91% 1,534.08 127.84 21.01 4.20
Molded Pulp 0.00% - - - -
Kraft Paper 1.04% 61.36 5.11 0.84 0.17
Other Paper 21.24% 1,257.95 104.83 17.23 3.45
Coffee Cups 31.09% 1,840.90 153.41 25.22 5.04
Polycoat Containers 10.36% 613.63 51.14 8.41 1.68
Aseptic Containers 0.00% - - - -
Total Paper 25.87% 100.00% 5,921.55 493.46 81.12 16.22
PLASTICS
# 1 PETE Soft Drinks 22.83% 644.31 53.69 8.83 1.77
# 2 HDPE 0.00% - - - -
# 3 PVC 0.00% - - - -
# 4 LDPE Recyclable Film 0.00% - - - -
# 5 PP 10.87% 306.82 25.57 4.20 0.84
# 6 PS (Styrofoam) 1.09% 30.68 2.56 0.42 0.08
# 6 PS (Clear/Hard) 21.74% 613.63 51.14 8.41 1.68
# 7 Other 0.00% - - - -
Non-Recyclable Film 21.74% 613.63 51.14 8.41 1.68
Rigid Plastics 21.74% 613.63 51.14 8.41 1.68
Plastic Strapping 0.00% - - - -
Total Plastics 12.33% 100.00% 2,822.71 235.23 38.67 7.73
METALS
Aluminum Cans 0.00% - - - -
Aluminum Foil 0.00% - - - -
Aerosal Cans 0.00% - - - -
Steel 0.00% - - - -
Scrap Metal 100.00% 613.63 51.14 8.41 1.68
Total Metals 2.68% 100.00% 613.63 51.14 8.41 1.68
GLASS
Glass (Clear/ Coloured) 0.00% - - - -
Other Glass 100.00% 1,227.26 102.27 23.13 3.36
Total Glass 5.36% 100.00% 1,227.26 102.27 23.13 3.36
HSW
Batteries 0.00% - - - -
Toner Cartridges 0.00% - - - -
Hand Sanitizer 0.00% - - - -
Total HSW 0.00% 0.00% - - - -
ORGANICS
Food Waste 66.48% 7,363.58 613.63 100.87 20.17
Tissue / Toweling 33.24% 3,681.79 306.82 50.44 10.09
Beverage Liquids 0.00% - - - -
Compostables 0.28% 30.68 2.56 0.42 0.08
Total Organics 48.39% 100.00% 11,076.05 923.00 151.73 30.35
OTHER MATERIALS
Textiles 0.00% - - - -
Latex Gloves 50.00% 613.63 51.14 8.41 1.68
#1 Water Bottles 0.00% - - - -
Diapers 0.00% - - - -
K Cups 50.00% 613.63 51.14 8.41 1.68
0.00% - - - -
Total Other 5.36% 100.00% 1,227.26 102.27 16.81 3.36
TOTAL ANNUAL WASTE 100.00% 22,888.47 1,907.37 319.86 62.71
Total Annual Divertable Materials 78.28% 17,918.05
Total Annual Non-Divertable Materials 21.72% 4,970.42
WASTE AUDIT DATA
*The highlighted items are not acceptable items for recycling in the regular recycling bin.

Waste Audit Report 2016 Queen’s University- Kingston, ON
34
Sorted Waste Material Breakdown
The above pie chart shows the breakdown of materials found in the audited waste sample from
Gordon Hall.
Non-Divertable vs. Divertable Materials Found in Sample
The pie chart above depicts what percentage of the waste sample from Gordon Hall was recyclable
or divertable materials, and what percentage was waste or non-divertable materials.
Paper25.87%
Plastics12.33%
Metal2.68%
Glass5.36%
HSW0.00%
Organics48.39%
Other5.36%
Total Annual
Divertable Materials78.28%
Total Annual Non-
Divertable Materials21.72%

Waste Audit Report 2016 Queen’s University- Kingston, ON
35
Outdoor Waste Containers
NAME: Outdoor Waste Containers
ADDRESS:
DATE: (KGS) (KGS) (KGS) (KGS)
PAPER % % Annual Waste Monthly Weekly Daily
Newspaper 0.00% - - - -
Magazines 0.00% - - - -
Cardboard 11.74% 3,681.79 306.82 50.44 10.09
Boxboard 7.83% 2,454.53 204.54 33.62 6.72
Mixed Papers 0.00% - - - -
Molded Pulp 0.10% 30.68 2.56 0.42 0.08
Kraft Paper 1.96% 613.63 51.14 8.41 1.68
Other Paper 37.18% 11,659.00 971.58 159.71 31.94
Coffee Cups 35.23% 11,045.37 920.45 151.31 30.26
Polycoat Containers 5.97% 1,871.58 155.96 25.64 5.13
Aseptic Containers 0.00% - - - -
Total Paper 25.97% 100.00% 31,356.58 2,613.05 429.54 85.91
PLASTICS
# 1 PETE Soft Drinks 36.12% 4,909.05 409.09 67.25 13.45
# 2 HDPE 0.45% 61.36 5.11 0.84 0.17
# 3 PVC 0.00% - - - -
# 4 LDPE Recyclable Film 0.23% 30.68 2.56 0.42 0.08
# 5 PP 22.57% 3,068.16 255.68 42.03 8.41
# 6 PS (Styrofoam) 9.03% 1,227.26 102.27 16.81 3.36
# 6 PS (Clear/Hard) 27.09% 3,681.79 306.82 50.44 10.09
# 7 Other 0.00% - - - -
Non-Recyclable Film 0.00% - - - -
Rigid Plastics 4.51% 613.63 51.14 8.41 1.68
Plastic Strapping 0.00% - - - -
Total Plastics 11.26% 100.00% 13,591.94 1,132.66 186.19 37.24
METALS
Aluminum Cans 100.00% 1,840.90 153.41 25.22 5.04
Aluminum Foil 0.00% - - - -
Aerosal Cans 0.00% - - - -
Steel 0.00% - - - -
Scrap Metal 0.00% - - - -
Total Metals 1.52% 100.00% 1,840.90 153.41 25.22 5.04
GLASS
Glass (Clear/ Coloured) 100.00% 306.82 25.57 5.78 0.84
Other Glass 0.00% - - - -
Total Glass 0.25% 100.00% 306.82 25.57 5.78 0.84
HSW
Batteries 0.00% - - - -
Toner Cartridges 0.00% - - - -
Hand Sanitizer 0.00% - - - -
Total HSW 0.00% 0.00% - - - -
ORGANICS
Food Waste 94.92% 68,726.76 5,727.23 941.46 188.29
Tissue / Toweling 2.54% 1,840.90 153.41 25.22 5.04
Beverage Liquids 0.00% - - - -
Compostables 2.54% 1,840.90 153.41 25.22 5.04
Total Organics 59.97% 100.00% 72,408.55 6,034.05 991.90 198.38
OTHER MATERIALS
Textiles 0.00% - - - -
Latex Gloves 0.00% - - - -
#1 Water Bottles 100.00% 1,227.26 102.27 16.81 3.36
Diapers 0.00% - - - -
K Cups 0.00% - - - -
0.00% - - - -
Total Other 1.02% 100.00% 1,227.26 102.27 16.81 3.36
TOTAL ANNUAL WASTE 100.00% 120,732.05 10,061.00 1,655.44 330.77
Total Annual Divertable Materials 87.80% 106,004.89
Total Annual Non-Divertable Materials 12.20% 14,727.16
WASTE AUDIT DATA
*The highlighted items are not acceptable items for recycling in the regular recycling bin.

Waste Audit Report 2016 Queen’s University- Kingston, ON
36
Sorted Waste Material Breakdown
The above pie chart shows the breakdown of materials found in the audited waste sample from
Outdoor Waste Containers.
Non-Divertable vs. Divertable Materials Found in Sample
The pie chart above depicts what percentage of the waste sample from the Outdoor Waste
Containers was recyclable or divertable materials, and what percentage was waste or non-
divertable materials.
Paper25.97%
Plastics11.26%
Metal1.52%
Glass0.25%
HSW0.00%
Organics59.97%
Other1.02%
Total Annual
Divertable Materials87.80%
Total Annual Non-
Divertable Materials12.20%

Waste Audit Report 2016 Queen’s University- Kingston, ON
37
Chernoff Hall
NAME: Chernoff Hall
ADDRESS:
DATE: (KGS) (KGS) (KGS) (KGS)
PAPER % % Annual Waste Monthly Weekly Daily
Newspaper 0.00% - - - -
Magazines 0.00% - - - -
Cardboard 0.00% - - - -
Boxboard 16.62% 1,840.90 153.41 25.22 5.04
Mixed Papers 5.54% 613.63 51.14 8.41 1.68
Molded Pulp 0.28% 30.68 2.56 0.42 0.08
Kraft Paper 11.08% 1,227.26 102.27 16.81 3.36
Other Paper 5.54% 613.63 51.14 8.41 1.68
Coffee Cups 49.86% 5,522.69 460.22 75.65 15.13
Polycoat Containers 0.00% - - - -
Aseptic Containers 11.08% 1,227.26 102.27 16.81 3.36
Total Paper 19.34% 100.00% 11,076.05 923.00 151.73 30.35
PLASTICS
# 1 PETE Soft Drinks 19.87% 1,840.90 153.41 25.22 5.04
# 2 HDPE 0.00% - - - -
# 3 PVC 0.00% - - - -
# 4 LDPE Recyclable Film 6.95% 644.31 53.69 8.83 1.77
# 5 PP 13.25% 1,227.26 102.27 16.81 3.36
# 6 PS (Styrofoam) 13.25% 1,227.26 102.27 16.81 3.36
# 6 PS (Clear/Hard) 13.25% 1,227.26 102.27 16.81 3.36
# 7 Other 0.00% - - - -
Non-Recyclable Film 0.00% - - - -
Rigid Plastics 33.44% 3,098.84 258.24 42.45 8.49
Plastic Strapping 0.00% - - - -
Total Plastics 16.18% 100.00% 9,265.84 772.15 126.93 25.39
METALS
Aluminum Cans 50.00% 306.82 25.57 4.20 0.84
Aluminum Foil 50.00% 306.82 25.57 4.20 0.84
Aerosal Cans 0.00% - - - -
Steel 0.00% - - - -
Scrap Metal 0.00% - - - -
Total Metals 1.07% 100.00% 613.63 51.14 8.41 1.68
GLASS
Glass (Clear/ Coloured) 0.00% - - - -
Other Glass 0.00% - - - -
Total Glass 0.00% 0.00% - - - -
HSW
Batteries 100.00% 30.68 2.56 0.58 0.08
Toner Cartridges 0.00% - - - -
Hand Sanitizer 0.00% - - - -
Total HSW 0.05% 100.00% 30.68 2.56 0.58 0.08
ORGANICS
Food Waste 74.51% 26,999.80 2,249.98 369.86 73.97
Tissue / Toweling 25.40% 9,204.48 767.04 126.09 25.22
Beverage Liquids 0.00% - - - -
Compostables 0.08% 30.68 2.56 0.42 0.08
Total Organics 63.26% 100.00% 36,234.96 3,019.58 496.37 99.27
OTHER MATERIALS
Textiles 0.00% - - - -
Latex Gloves 50.00% 30.68 2.56 0.42 0.08
#1 Water Bottles 0.00% - - - -
Diapers 0.00% - - - -
K Cups 50.00% 30.68 2.56 0.42 0.08
0.00% - - - -
Total Other 0.11% 100.00% 61.36 5.11 0.84 0.17
TOTAL ANNUAL WASTE 100.00% 57,282.53 4,773.54 784.85 156.94
Total Annual Divertable Materials 90.73% 51,974.61
Total Annual Non-Divertable Materials 9.27% 5,307.91
WASTE AUDIT DATA
*The highlighted items are not acceptable items for recycling in the regular recycling bin.

Waste Audit Report 2016 Queen’s University- Kingston, ON
38
Sorted Waste Material Breakdown
The above pie chart shows the breakdown of materials found in the audited waste sample from
Chernoff Hall.
Non-Divertable vs. Divertable Materials Found in Sample
The pie chart above depicts what percentage of the waste sample from Chernoff Hall was
recyclable or divertable materials, and what percentage was waste or non-divertable materials.
Paper19.34%
Plastics16.18%Metal
1.07%
Glass0.00%
HSW0.05%
Organics63.26%
Other0.11%
Total Annual Divertable Materials90.73%
Total Annual Non-
Divertable Materials
9.27%

Waste Audit Report 2016 Queen’s University- Kingston, ON
39
Dupuis Hall
NAME: Dupuis Hall
ADDRESS:
DATE: (KGS) (KGS) (KGS) (KGS)
PAPER % % Annual Waste Monthly Weekly Daily
Newspaper 0.00% - - - -
Magazines 0.00% - - - -
Cardboard 2.24% 306.82 25.57 4.20 0.84
Boxboard 6.73% 920.45 76.70 12.61 2.52
Mixed Papers 13.45% 1,840.90 153.41 25.22 5.04
Molded Pulp 1.12% 153.41 12.78 2.10 0.42
Kraft Paper 4.71% 644.31 53.69 8.83 1.77
Other Paper 13.45% 1,840.90 153.41 25.22 5.04
Coffee Cups 49.33% 6,749.95 562.50 92.47 18.49
Polycoat Containers 4.48% 613.63 51.14 8.41 1.68
Aseptic Containers 4.48% 613.63 51.14 8.41 1.68
Total Paper 25.50% 100.00% 13,683.99 1,140.33 187.45 37.49
PLASTICS
# 1 PETE Soft Drinks 30.42% 2,454.53 204.54 33.62 6.72
# 2 HDPE 0.00% - - - -
# 3 PVC 0.00% - - - -
# 4 LDPE Recyclable Film 0.38% 30.68 2.56 0.42 0.08
# 5 PP 7.60% 613.63 51.14 8.41 1.68
# 6 PS (Styrofoam) 7.60% 613.63 51.14 8.41 1.68
# 6 PS (Clear/Hard) 22.81% 1,840.90 153.41 25.22 5.04
# 7 Other 0.38% 30.68 2.56 0.42 0.08
Non-Recyclable Film 23.19% 1,871.58 155.96 25.64 5.13
Rigid Plastics 7.60% 613.63 51.14 8.41 1.68
Plastic Strapping 0.00% - - - -
Total Plastics 15.04% 100.00% 8,069.26 672.44 110.54 22.11
METALS
Aluminum Cans 50.00% 306.82 25.57 4.20 0.84
Aluminum Foil 0.00% - - - -
Aerosal Cans 0.00% - - - -
Steel 50.00% 306.82 25.57 4.20 0.84
Scrap Metal 0.00% - - - -
Total Metals 1.14% 100.00% 613.63 51.14 8.41 1.68
GLASS
Glass (Clear/ Coloured) 0.00% - - - -
Other Glass 0.00% - - - -
Total Glass 0.00% 0.00% - - - -
HSW
Batteries 0.00% - - - -
Toner Cartridges 0.00% - - - -
Hand Sanitizer 0.00% - - - -
Total HSW 0.00% 0.00% - - - -
ORGANICS
Food Waste 74.47% 21,477.11 1,789.76 294.21 58.84
Tissue / Toweling 8.51% 2,454.53 204.54 33.62 6.72
Beverage Liquids 0.00% - - - -
Compostables 17.02% 4,909.05 409.09 67.25 13.45
Total Organics 53.74% 100.00% 28,840.69 2,403.39 395.08 79.02
OTHER MATERIALS
Textiles 0.00% - - - -
Latex Gloves 0.00% - - - -
#1 Water Bottles 0.00% - - - -
Diapers 0.00% - - - -
K Cups 100.00% 2,454.53 204.54 33.62 6.72
0.00% - - - -
Total Other 4.57% 100.00% 2,454.53 204.54 33.62 6.72
TOTAL ANNUAL WASTE 100.00% 53,662.10 4,471.84 735.10 147.02
Total Annual Divertable Materials 86.16% 46,237.16
Total Annual Non-Divertable Materials 13.84% 7,424.94
WASTE AUDIT DATA
*The highlighted items are not acceptable items for recycling in the regular recycling bin.

Waste Audit Report 2016 Queen’s University- Kingston, ON
40
Sorted Waste Material Breakdown
The above pie chart shows the breakdown of materials found in the audited waste sample from
Dupuis Hall.
Non-Divertable vs. Divertable Materials Found in Sample
The pie chart above depicts what percentage of the waste sample from Dupuis Hall was recyclable
or divertable materials, and what percentage was waste or non-divertable materials.
Paper25.50%
Plastics15.04%
Metal1.14%
Glass0.00%
HSW0.00%
Organics53.74%
Other4.57%
Total Annual Divertable Materials86.16%
Total Annual Non-
Divertable Materials13.84%

Waste Audit Report 2016 Queen’s University- Kingston, ON
41
Bruce Wing
NAME: Bruce Wing
ADDRESS:
DATE: (KGS) (KGS) (KGS) (KGS)
PAPER % % Annual Waste Monthly Weekly Daily
Newspaper 0.00% - - - -
Magazines 0.00% - - - -
Cardboard 0.00% - - - -
Boxboard 8.66% 613.63 51.14 8.41 1.68
Mixed Papers 0.43% 30.68 2.56 0.42 0.08
Molded Pulp 0.00% - - - -
Kraft Paper 0.00% - - - -
Other Paper 17.32% 1,227.26 102.27 16.81 3.36
Coffee Cups 60.61% 4,295.42 357.95 58.84 11.77
Polycoat Containers 8.66% 613.63 51.14 8.41 1.68
Aseptic Containers 4.33% 306.82 25.57 4.20 0.84
Total Paper 16.95% 100.00% 7,087.45 590.62 97.09 19.42
PLASTICS
# 1 PETE Soft Drinks 8.26% 613.63 51.14 8.41 1.68
# 2 HDPE 0.00% - - - -
# 3 PVC 0.00% - - - -
# 4 LDPE Recyclable Film 0.41% 30.68 2.56 0.42 0.08
# 5 PP 8.26% 613.63 51.14 8.41 1.68
# 6 PS (Styrofoam) 8.26% 613.63 51.14 8.41 1.68
# 6 PS (Clear/Hard) 8.26% 613.63 51.14 8.41 1.68
# 7 Other 0.00% - - - -
Non-Recyclable Film 24.79% 1,840.90 153.41 25.22 5.04
Rigid Plastics 41.74% 3,098.84 258.24 42.45 8.49
Plastic Strapping 0.00% - - - -
Total Plastics 17.75% 100.00% 7,424.94 618.75 101.71 20.34
METALS
Aluminum Cans 50.00% 306.82 25.57 4.20 0.84
Aluminum Foil 50.00% 306.82 25.57 4.20 0.84
Aerosal Cans 0.00% - - - -
Steel 0.00% - - - -
Scrap Metal 0.00% - - - -
Total Metals 1.47% 100.00% 613.63 51.14 8.41 1.68
GLASS
Glass (Clear/ Coloured) 0.00% - - - -
Other Glass 0.00% - - - -
Total Glass 0.00% 0.00% - - - -
HSW
Batteries 0.00% - - - -
Toner Cartridges 0.00% - - - -
Hand Sanitizer 0.00% - - - -
Total HSW 0.00% 0.00% - - - -
ORGANICS
Food Waste 57.50% 14,113.53 1,176.13 193.34 38.67
Tissue / Toweling 40.00% 9,818.11 818.18 134.49 26.90
Beverage Liquids 0.00% - - - -
Compostables 2.50% 613.63 51.14 8.41 1.68
Total Organics 58.69% 100.00% 24,545.27 2,045.44 336.24 67.25
OTHER MATERIALS
Textiles 0.00% - - - -
Latex Gloves 85.71% 1,840.90 153.41 25.22 5.04
#1 Water Bottles 0.00% - - - -
Diapers 0.00% - - - -
K Cups 14.29% 306.82 25.57 4.20 0.84
0.00% - - - -
Total Other 5.14% 100.00% 2,147.71 178.98 29.42 5.88
TOTAL ANNUAL WASTE 100.00% 41,819.01 3,484.92 572.86 114.57
Total Annual Divertable Materials 77.92% 32,583.85
Total Annual Non-Divertable Materials 22.08% 9,235.16
WASTE AUDIT DATA
*The highlighted items are not acceptable items for recycling in the regular recycling bin.
Waste Audit Report 2016 Queen’s University- Kingston, ON
42
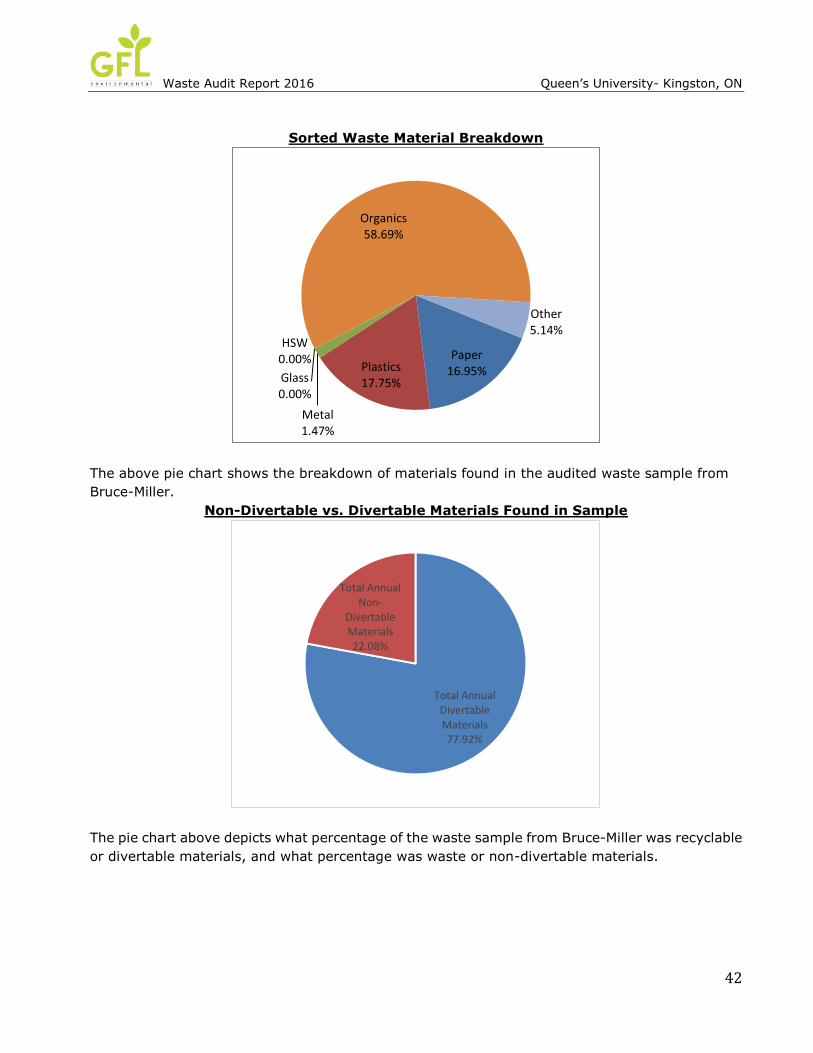
Sorted Waste Material Breakdown
The above pie chart shows the breakdown of materials found in the audited waste sample from
Bruce-Miller.
Non-Divertable vs. Divertable Materials Found in Sample
The pie chart above depicts what percentage of the waste sample from Bruce-Miller was recyclable
or divertable materials, and what percentage was waste or non-divertable materials.
Paper16.95%Plastics
17.75%
Metal1.47%
Glass0.00%
HSW0.00%
Organics58.69%
Other5.14%
Total Annual Divertable Materials77.92%
Total Annual Non-
Divertable Materials22.08%

Waste Audit Report 2016 Queen’s University- Kingston, ON
43
Beamish-Munro Hall
NAME: Beamish-Munro Hall
ADDRESS:
DATE: (KGS) (KGS) (KGS) (KGS)
PAPER % % Annual Waste Monthly Weekly Daily
Newspaper 0.00% - - - -
Magazines 0.00% - - - -
Cardboard 0.00% - - - -
Boxboard 4.73% 613.63 51.14 8.41 1.68
Mixed Papers 9.69% 1,257.95 104.83 17.23 3.45
Molded Pulp 0.24% 30.68 2.56 0.42 0.08
Kraft Paper 14.18% 1,840.90 153.41 25.22 5.04
Spiral Wound 4.73% 613.63 51.14 8.41 1.68
Other Paper 28.37% 3,681.79 306.82 50.44 10.09
Coffee Cups 37.83% 4,909.05 409.09 67.25 13.45
Polycoat Containers 0.00% - - - -
Aseptic Containers 0.24% 30.68 2.56 0.42 0.08
Total Paper 31.40% 100.00% 12,978.31 1,081.53 177.79 35.56
PLASTICS
# 1 PETE Soft Drinks 28.17% 2,454.53 204.54 33.62 6.72
# 2 HDPE 0.00% - - - -
# 3 PVC 0.00% - - - -
# 4 LDPE Recyclable Film 0.35% 30.68 2.56 0.42 0.08
# 5 PP 7.04% 613.63 51.14 8.41 1.68
# 6 PS (Styrofoam) 14.08% 1,227.26 102.27 16.81 3.36
# 6 PS (Clear/Hard) 0.35% 30.68 2.56 0.42 0.08
# 7 Other 21.13% 1,840.90 153.41 25.22 5.04
Non-Recyclable Film 28.17% 2,454.53 204.54 33.62 6.72
Rigid Plastics 0.70% 61.36 5.11 0.84 0.17
Plastic Strapping 0.00% - - - -
Total Plastics 21.08% 100.00% 8,713.57 726.13 119.36 23.87
METALS
Aluminum Cans 50.00% 306.82 25.57 4.20 0.84
Aluminum Foil 0.00% - - - -
Aerosal Cans 0.00% - - - -
Steel 50.00% 306.82 25.57 4.20 0.84
Scrap Metal 0.00% - - - -
Total Metals 1.48% 100.00% 613.63 51.14 8.41 1.68
GLASS
Glass (Clear/ Coloured) 100.00% 613.63 51.14 11.57 1.68
Other Glass 0.00% - - - -
Total Glass 1.48% 100.00% 613.63 51.14 11.57 1.68
HSW
Batteries 0.00% - - - -
Toner Cartridges 0.00% - - - -
Hand Sanitizer 0.00% - - - -
Total HSW 0.00% 0.00% - - - -
ORGANICS
Food Waste 66.67% 12,272.64 1,022.72 168.12 33.62
Tissue / Toweling 30.00% 5,522.69 460.22 75.65 15.13
Beverage Liquids 0.00% - - - -
Compostables 3.33% 613.63 51.14 8.41 1.68
Total Organics 44.54% 100.00% 18,408.95 1,534.08 252.18 50.44
OTHER MATERIALS
Textiles 0.00% - - - -
Latex Gloves 0.00% - - - -
#1 Water Bottles 0.00% - - - -
Diapers 0.00% - - - -
K Cups 0.00% - - - -
0.00% - - - -
Total Other 0.00% 0.00% - - - -
TOTAL ANNUAL WASTE 100.00% 41,328.10 3,444.01 569.30 113.23
Total Annual Divertable Materials 77.58% 32,062.26
Total Annual Non-Divertable Materials 22.42% 9,265.84
WASTE AUDIT DATA
*The highlighted items are not acceptable items for recycling in the regular recycling bin.

Waste Audit Report 2016 Queen’s University- Kingston, ON
44
Sorted Waste Material Breakdown
The above pie chart shows the breakdown of materials found in the audited waste sample from
Beamish-Munro Hall.
Non-Divertable vs. Divertable Materials Found in Sample
The pie chart above depicts what percentage of the waste sample from Tindall Beamish-Munro
Hall was recyclable or divertable materials, and what percentage was waste or non-divertable
materials.
Paper31.40%
Plastics21.08%
Metal1.48%
Glass1.48%
HSW0.00%
Organics44.54%
Other0.00%
Total Annual Divertable Materials77.58%
Total Annual Non-
Divertable Materials22.42%

Waste Audit Report 2016 Queen’s University- Kingston, ON
45
SKHS – School of Kinesiology and Health Studies
NAME: SKHS - School of Kin
ADDRESS:
DATE: (KGS) (KGS) (KGS) (KGS)
PAPER % % Annual Waste Monthly Weekly Daily
Newspaper 0.00% - - - -
Magazines 0.00% - - - -
Cardboard 0.00% - - - -
Boxboard 11.09% 1,840.90 153.41 25.22 5.04
Mixed Papers 11.09% 1,840.90 153.41 25.22 5.04
Molded Pulp 0.00% - - - -
Kraft Paper 3.70% 613.63 51.14 8.41 1.68
Spiral Wound 0.00% - - - -
Other Paper 40.67% 6,749.95 562.50 92.47 18.49
Coffee Cups 33.27% 5,522.69 460.22 75.65 15.13
Polycoat Containers 0.18% 30.68 2.56 0.42 0.08
Aseptic Containers 0.00% - - - -
Total Paper 28.15% 100.00% 16,598.74 1,383.23 227.38 45.48
PLASTICS
# 1 PETE Soft Drinks 26.25% 3,068.16 255.68 42.03 8.41
# 2 HDPE 0.00% - - - -
# 3 PVC 0.00% - - - -
# 4 LDPE Recyclable Film 0.00% - - - -
# 5 PP 10.76% 1,257.95 104.83 17.23 3.45
# 6 PS (Styrofoam) 5.25% 613.63 51.14 8.41 1.68
# 6 PS (Clear/Hard) 10.50% 1,227.26 102.27 16.81 3.36
# 7 Other 0.00% - - - -
Non-Recyclable Film 31.50% 3,681.79 306.82 50.44 10.09
Rigid Plastics 15.75% 1,840.90 153.41 25.22 5.04
Plastic Strapping 0.00% - - - -
Total Plastics 19.82% 100.00% 11,689.69 974.14 160.13 32.03
METALS
Aluminum Cans 100.00% 1,227.26 102.27 16.81 3.36
Aluminum Foil 0.00% - - - -
Aerosal Cans 0.00% - - - -
Steel 0.00% - - - -
Scrap Metal 0.00% - - - -
Total Metals 2.08% 100.00% 1,227.26 102.27 16.81 3.36
GLASS
Glass (Clear/ Coloured) 0.00% - - - -
Other Glass 0.00% - - - -
Total Glass 0.00% 0.00% - - - -
HSW
Batteries 0.00% - - - -
Toner Cartridges 0.00% - - - -
Hand Sanitizer 0.00% - - - -
Total HSW 0.00% 0.00% - - - -
ORGANICS
Food Waste 70.21% 20,249.85 1,687.49 277.40 55.48
Tissue / Toweling 25.53% 7,363.58 613.63 100.87 20.17
Beverage Liquids 0.00% - - - -
Compostables 4.26% 1,227.26 102.27 16.81 3.36
Total Organics 48.91% 100.00% 28,840.69 2,403.39 395.08 79.02
OTHER MATERIALS
Textiles 0.00% - - - -
Latex Gloves 100.00% 613.63 51.14 8.41 1.68
#1 Water Bottles 0.00% - - - -
Diapers 0.00% - - - -
K Cups 0.00% - - - -
0.00% - - - -
Total Other 1.04% 100.00% 613.63 51.14 8.41 1.68
TOTAL ANNUAL WASTE 100.00% 58,970.01 4,914.17 807.81 161.56
Total Annual Divertable Materials 77.11% 45,470.12
Total Annual Non-Divertable Materials 22.89% 13,499.90
WASTE AUDIT DATA
*The highlighted items are not acceptable items for recycling in the regular recycling bin.

Waste Audit Report 2016 Queen’s University- Kingston, ON
46
Sorted Waste Material Breakdown
The above pie chart shows the breakdown of materials found in the audited waste sample from
SKHS.
Non-Divertable vs. Divertable Materials Found in Sample
The pie chart above depicts what percentage of the waste sample from SKHS was recyclable or
divertable materials, and what percentage was waste or non-divertable materials.
Paper28.15%
Plastics19.82%
Metal2.08%
Glass0.00%
HSW0.00%
Organics48.91%
Other1.04%
Total Annual Divertable Materials77.11%
Total Annual Non-
Divertable Materials22.89%

Waste Audit Report 2016 Queen’s University- Kingston, ON
47
Cancer Research Institute
NAME: Cancer Research
ADDRESS:
DATE: (KGS) (KGS) (KGS) (KGS)
PAPER % % Annual Waste Monthly Weekly Daily
Newspaper 0.00% - - - -
Magazines 0.00% - - - -
Cardboard 31.58% 920.45 76.70 12.61 2.52
Boxboard 10.53% 306.82 25.57 4.20 0.84
Mixed Papers 1.05% 30.68 2.56 0.42 0.08
Molded Pulp 0.00% - - - -
Kraft Paper 11.58% 337.50 28.12 4.62 0.92
Spiral Wound 0.00% - - - -
Other Paper 1.05% 30.68 2.56 0.42 0.08
Coffee Cups 42.11% 1,227.26 102.27 16.81 3.36
Polycoat Containers 1.05% 30.68 2.56 0.42 0.08
Aseptic Containers 1.05% 30.68 2.56 0.42 0.08
Total Paper 7.53% 100.00% 2,914.75 242.90 39.93 7.99
PLASTICS
# 1 PETE Soft Drinks 0.49% 30.68 2.56 0.42 0.08
# 2 HDPE 9.76% 613.63 51.14 8.41 1.68
# 3 PVC 0.00% - - - -
# 4 LDPE Recyclable Film 0.00% - - - -
# 5 PP 0.49% 30.68 2.56 0.42 0.08
# 6 PS (Styrofoam) 0.49% 30.68 2.56 0.42 0.08
# 6 PS (Clear/Hard) 9.76% 613.63 51.14 8.41 1.68
# 7 Other 0.00% - - - -
Non-Recyclable Film 78.05% 4,909.05 409.09 67.25 13.45
Rigid Plastics 0.98% 61.36 5.11 0.84 0.17
Plastic Strapping 0.00% - - - -
Total Plastics 16.24% 100.00% 6,289.73 524.14 86.16 17.23
METALS
Aluminum Cans 50.00% 306.82 25.57 4.20 0.84
Aluminum Foil 50.00% 306.82 25.57 4.20 0.84
Aerosal Cans 0.00% - - - -
Steel 0.00% - - - -
Scrap Metal 0.00% - - - -
Total Metals 1.58% 100.00% 613.63 51.14 8.41 1.68
GLASS
Glass (Clear/ Coloured) 0.00% - - - -
Other Glass 0.00% - - - -
Total Glass 0.00% 0.00% - - - -
HSW
Batteries 0.00% - - - -
Toner Cartridges 0.00% - - - -
Hand Sanitizer 0.00% - - - -
Total HSW 0.00% 0.00% - - - -
ORGANICS
Food Waste 28.86% 7,977.21 664.77 109.28 21.86
Tissue / Toweling 71.03% 19,636.22 1,636.35 268.99 53.80
Beverage Liquids 0.00% - - - -
Compostables 0.11% 30.68 2.56 0.42 0.08
Total Organics 71.39% 100.00% 27,644.11 2,303.68 378.69 75.74
OTHER MATERIALS
Textiles 48.78% 613.63 51.14 8.41 1.68
Latex Gloves 2.44% 30.68 2.56 0.42 0.08
#1 Water Bottles 0.00% - - - -
Diapers 0.00% - - - -
K Cups 48.78% 613.63 51.14 8.41 1.68
0.00% - - - -
Total Other 3.25% 100.00% 1,257.95 104.83 17.23 3.45
TOTAL ANNUAL WASTE 100.00% 38,720.17 3,226.68 530.41 106.08
Total Annual Divertable Materials 82.96% 32,123.62
Total Annual Non-Divertable Materials 17.04% 6,596.54
WASTE AUDIT DATA
*The highlighted items are not acceptable items for recycling in the regular recycling bin.

Waste Audit Report 2016 Queen’s University- Kingston, ON
48
Sorted Waste Material Breakdown
The above pie chart shows the breakdown of materials found in the audited waste sample from
the Cancer Research Institute.
Non-Divertable vs. Divertable Materials Found in Sample
The pie chart above depicts what percentage of the waste sample from the Cancer Research
Institute was recyclable or divertable materials, and what percentage was waste or non-divertable
materials.
Paper7.53%
Plastics16.24%
Metal1.58%
Glass0.00%
HSW0.00%
Organics71.39%
Other3.25%
Total Annual Divertable Materials82.96%
Total Annual Non-
Divertable Materials…

Waste Audit Report 2016 Queen’s University- Kingston, ON
49
Louise D. Acton Building
NAME: Louise D. Acton
ADDRESS:
DATE: (KGS) (KGS) (KGS) (KGS)
PAPER % % Annual Waste Monthly Weekly Daily
Newspaper 0.00% - - - -
Magazines 0.00% - - - -
Cardboard 0.00% - - - -
Boxboard 1.56% 30.68 2.56 0.42 0.08
Mixed Papers 31.25% 613.63 51.14 8.41 1.68
Molded Pulp 0.00% - - - -
Kraft Paper 1.56% 30.68 2.56 0.42 0.08
Spiral Wound 0.00% - - - -
Other Paper 1.56% 30.68 2.56 0.42 0.08
Coffee Cups 62.50% 1,227.26 102.27 16.81 3.36
Polycoat Containers 1.56% 30.68 2.56 0.42 0.08
Aseptic Containers 0.00% - - - -
Total Paper 11.83% 100.00% 1,963.62 163.64 26.90 5.38
PLASTICS
# 1 PETE Soft Drinks 30.08% 1,227.26 102.27 16.81 3.36
# 2 HDPE 0.00% - - - -
# 3 PVC 0.00% - - - -
# 4 LDPE Recyclable Film 0.00% - - - -
# 5 PP 0.00% - - - -
# 6 PS (Styrofoam) 0.75% 30.68 2.56 0.42 0.08
# 6 PS (Clear/Hard) 7.52% 306.82 25.57 4.20 0.84
# 7 Other 0.75% 30.68 2.56 0.42 0.08
Non-Recyclable Film 60.15% 2,454.53 204.54 33.62 6.72
Rigid Plastics 0.00% - - - -
Plastic Strapping 0.75% 30.68 2.56 0.42 0.08
Total Plastics 24.58% 100.00% 4,080.65 340.05 55.90 11.18
METALS
Aluminum Cans 50.00% 306.82 25.57 4.20 0.84
Aluminum Foil 50.00% 306.82 25.57 4.20 0.84
Aerosal Cans 0.00% - - - -
Steel 0.00% - - - -
Scrap Metal 0.00% - - - -
Total Metals 3.70% 100.00% 613.63 51.14 8.41 1.68
GLASS
Glass (Clear/ Coloured) 0.00% - - - -
Other Glass 0.00% - - - -
Total Glass 0.00% 0.00% - - - -
HSW
Batteries 0.00% - - - -
Toner Cartridges 0.00% - - - -
Hand Sanitizer 0.00% - - - -
Total HSW 0.00% 0.00% - - - -
ORGANICS
Food Waste 49.84% 4,909.05 409.09 67.25 13.45
Tissue / Toweling 50.16% 4,939.74 411.64 67.67 13.53
Beverage Liquids 0.00% - - - -
Compostables 0.00% - - - -
Total Organics 59.33% 100.00% 9,848.79 820.73 134.91 26.98
OTHER MATERIALS
Textiles 0.00% - - - -
Latex Gloves 33.33% 30.68 2.56 0.42 0.08
#1 Water Bottles 33.33% 30.68 2.56 0.42 0.08
Diapers 33.33% 30.68 2.56 0.42 0.08
K Cups 0.00% - - - -
0.00% - - - -
Total Other 0.55% 100.00% 92.04 7.67 1.26 0.25
TOTAL ANNUAL WASTE 100.00% 16,598.74 1,383.23 227.38 45.48
Total Annual Divertable Materials 82.26% 13,653.31
Total Annual Non-Divertable Materials 17.74% 2,945.43
WASTE AUDIT DATA
*The highlighted items are not acceptable items for recycling in the regular recycling bin.

Waste Audit Report 2016 Queen’s University- Kingston, ON
50
Sorted Waste Material Breakdown
The above pie chart shows the breakdown of materials found in the audited waste sample from
Louise D. Acton Building.
Non-Divertable vs. Divertable Materials Found in Sample
The pie chart above depicts what percentage of the waste sample from the Louise D. Acton Building
was recyclable or divertable materials, and what percentage was waste or non-divertable
materials.
Paper11.83%
Plastics24.58%
Metal3.70%
Glass0.00%
HSW0.00%
Organics59.33%
Other0.55%
Total Annual Divertable Materials82.26%
Total Annual Non-
Divertable Materials17.74%

Waste Audit Report 2016 Queen’s University- Kingston, ON
51
Botterell Hall
NAME: Botterell Hall
ADDRESS:
DATE: (KGS) (KGS) (KGS) (KGS)
PAPER % % Annual Waste Monthly Weekly Daily
Newspaper 0.00% - - - -
Magazines 0.00% - - - -
Cardboard 0.00% - - - -
Boxboard 13.04% 3,681.79 306.82 50.44 10.09
Mixed Papers 23.91% 6,749.95 562.50 92.47 18.49
Molded Pulp 0.00% - - - -
Kraft Paper 10.87% 3,068.16 255.68 42.03 8.41
Spiral Wound 0.00% - - - -
Other Paper 30.43% 8,590.85 715.90 117.68 23.54
Coffee Cups 19.57% 5,522.69 460.22 75.65 15.13
Polycoat Containers 2.17% 613.63 51.14 8.41 1.68
Aseptic Containers 0.00% - - - -
Total Paper 14.78% 100.00% 28,227.06 2,352.26 386.67 77.33
PLASTICS
# 1 PETE Soft Drinks 2.70% 1,227.26 102.27 16.81 3.36
# 2 HDPE 4.05% 1,840.90 153.41 25.22 5.04
# 3 PVC 0.00% - - - -
# 4 LDPE Recyclable Film 2.70% 1,227.26 102.27 16.81 3.36
# 5 PP 6.76% 3,068.16 255.68 42.03 8.41
# 6 PS (Styrofoam) 2.70% 1,227.26 102.27 16.81 3.36
# 6 PS (Clear/Hard) 5.41% 2,454.53 204.54 33.62 6.72
# 7 Other 16.22% 7,363.58 613.63 100.87 20.17
Non-Recyclable Film 41.89% 19,022.59 1,585.22 260.58 52.12
Rigid Plastics 17.57% 7,977.21 664.77 109.28 21.86
Plastic Strapping 0.00% - - - -
Total Plastics 23.78% 100.00% 45,408.75 3,784.06 622.04 124.41
METALS
Aluminum Cans 50.00% 613.63 51.14 8.41 1.68
Aluminum Foil 50.00% 613.63 51.14 8.41 1.68
Aerosal Cans 0.00% - - - -
Steel 0.00% - - - -
Scrap Metal 0.00% - - - -
Total Metals 0.64% 100.00% 1,227.26 102.27 16.81 3.36
GLASS
Glass (Clear/ Coloured) 100.00% 1,840.90 153.41 34.70 5.04
Other Glass 0.00% - - - -
Total Glass 0.96% 100.00% 1,840.90 153.41 34.70 5.04
HSW
Batteries 0.00% - - - -
Toner Cartridges 0.00% - - - -
Hand Sanitizer 0.00% - - - -
Total HSW 0.00% 0.00% - - - -
ORGANICS
Food Waste 37.97% 18,408.95 1,534.08 252.18 50.44
Tissue / Toweling 51.90% 25,158.90 2,096.58 344.64 68.93
Beverage Liquids 0.00% - - - -
Compostables 10.13% 4,909.05 409.09 67.25 13.45
Total Organics 25.38% 100.00% 48,476.91 4,039.74 664.07 132.81
OTHER MATERIALS
Textiles 0.93% 613.63 51.14 8.41 1.68
Latex Gloves 12.12% 7,977.21 664.77 109.28 21.86
#1 Water Bottles 0.00% - - - -
Autoclaved Medical Waste 83.92% 55,226.86 4,602.24 756.53 151.31
K Cups 3.03% 1,994.30 166.19 27.32 5.46
0.00% - - - -
Total Other 34.46% 100.00% 65,812.01 5,484.33 901.53 180.31
TOTAL ANNUAL WASTE 100.00% 190,992.89 15,916.07 2,625.82 523.27
Total Annual Divertable Materials 42.09% 80,385.76
Total Annual Non-Divertable Materials 57.91% 110,607.13
WASTE AUDIT DATA
*The highlighted items are not acceptable items for recycling in the regular recycling bin.

Waste Audit Report 2016 Queen’s University- Kingston, ON
52
Sorted Waste Material Breakdown
The above pie chart shows the breakdown of materials found in the audited waste sample from
Botterell Hall.
Non-Divertable vs. Divertable Materials Found in Sample
The pie chart above depicts what percentage of the waste sample from Botterell Hall was
recyclable or divertable materials, and what percentage was waste or non-divertable materials.
Paper14.78%Plastics
23.78%Metal0.64%
Glass0.96%
HSW0.00%
Organics25.38%
Other34.46%
Total Annual Divertable Materials42.09%
Total Annual Non-
Divertable Materials57.91%

Waste Audit Report 2016 Queen’s University- Kingston, ON
53
Dunning Hall
NAME: Dunning Hall
ADDRESS:
DATE: (KGS) (KGS) (KGS) (KGS)
PAPER % % Annual Waste Monthly Weekly Daily
Newspaper 0.00% - - - -
Magazines 0.00% - - - -
Cardboard 0.00% - - - -
Boxboard 14.73% 2,454.53 204.54 33.62 6.72
Mixed Papers 18.60% 3,098.84 258.24 42.45 8.49
Molded Pulp 0.00% - - - -
Kraft Paper 7.37% 1,227.26 102.27 16.81 3.36
Spiral Wound 0.00% - - - -
Other Paper 11.05% 1,840.90 153.41 25.22 5.04
Coffee Cups 47.88% 7,977.21 664.77 109.28 21.86
Polycoat Containers 0.37% 61.36 5.11 0.84 0.17
Aseptic Containers 0.00% - - - -
Total Paper 27.36% 100.00% 16,660.10 1,388.34 228.22 45.64
PLASTICS
# 1 PETE Soft Drinks 13.25% 1,227.26 102.27 16.81 3.36
# 2 HDPE 0.00% - - - -
# 3 PVC 0.00% - - - -
# 4 LDPE Recyclable Film 6.62% 613.63 51.14 8.41 1.68
# 5 PP 6.62% 613.63 51.14 8.41 1.68
# 6 PS (Styrofoam) 13.25% 1,227.26 102.27 16.81 3.36
# 6 PS (Clear/Hard) 13.25% 1,227.26 102.27 16.81 3.36
# 7 Other 0.00% - - - -
Non-Recyclable Film 46.36% 4,295.42 357.95 58.84 11.77
Rigid Plastics 0.66% 61.36 5.11 0.84 0.17
Plastic Strapping 0.00% - - - -
Total Plastics 15.21% 100.00% 9,265.84 772.15 126.93 25.39
METALS
Aluminum Cans 50.00% 306.82 25.57 4.20 0.84
Aluminum Foil 50.00% 306.82 25.57 4.20 0.84
Aerosal Cans 0.00% - - - -
Steel 0.00% - - - -
Scrap Metal 0.00% - - - -
Total Metals 1.01% 100.00% 613.63 51.14 8.41 1.68
GLASS
Glass (Clear/ Coloured) 100.00% 613.63 51.14 11.57 1.68
Other Glass 0.00% - - - -
Total Glass 1.01% 100.00% 613.63 51.14 11.57 1.68
HSW
Batteries 0.00% - - - -
Toner Cartridges 0.00% - - - -
Hand Sanitizer 0.00% - - - -
Total HSW 0.00% 0.00% - - - -
ORGANICS
Food Waste 61.82% 20,863.48 1,738.62 285.80 57.16
Tissue / Toweling 36.36% 12,272.64 1,022.72 168.12 33.62
Beverage Liquids 0.00% - - - -
Compostables 1.82% 613.63 51.14 8.41 1.68
Total Organics 55.42% 100.00% 33,749.75 2,812.48 462.33 92.47
OTHER MATERIALS
Textiles 0.00% - - - -
Latex Gloves 0.00% - - - -
#1 Water Bottles 0.00% - - - -
Autoclaved Medical Waste 0.00% - - - -
K Cups 0.00% - - - -
0.00% - - - -
Total Other 0.00% 0.00% - - - -
TOTAL ANNUAL WASTE 100.00% 60,902.95 5,075.25 837.45 166.86
Total Annual Divertable Materials 87.30% 53,171.19
Total Annual Non-Divertable Materials 12.70% 7,731.76
WASTE AUDIT DATA
*The highlighted items are not acceptable items for recycling in the regular recycling bin.

Waste Audit Report 2016 Queen’s University- Kingston, ON
54
Sorted Waste Material Breakdown
The above pie chart shows the breakdown of materials found in the audited waste sample from
Dunning Hall.
Non-Divertable vs. Divertable Materials Found in Sample
The pie chart above depicts what percentage of the waste sample Dunning Hall was recyclable or
divertable materials, and what percentage was waste or non-divertable materials.
Paper27.36%
Plastics15.21%
Metal1.01%
Glass1.01%
HSW0.00%
Organics55.42%
Other0.00%
Total Annual Divertable Materials87.30%
Total Annual Non-
Divertable Materials12.70%

Waste Audit Report 2016 Queen’s University- Kingston, ON
55
Mackintosh-Corry Hall
NAME: Mackintosh-Corry Hall
ADDRESS:
DATE: (KGS) (KGS) (KGS) (KGS)
PAPER % % Annual Waste Monthly Weekly Daily
Newspaper 0.00% - - - -
Magazines 0.00% - - - -
Cardboard 2.53% 613.63 51.14 8.41 1.68
Boxboard 12.64% 3,068.16 255.68 42.03 8.41
Mixed Papers 10.11% 2,454.53 204.54 33.62 6.72
Molded Pulp 1.26% 306.82 25.57 4.20 0.84
Kraft Paper 7.59% 1,840.90 153.41 25.22 5.04
Spiral Wound 0.00% - - - -
Other Paper 17.70% 4,295.42 357.95 58.84 11.77
Coffee Cups 45.64% 11,076.05 923.00 151.73 30.35
Polycoat Containers 2.53% 613.63 51.14 8.41 1.68
Aseptic Containers 0.00% - - - -
Total Paper 26.60% 100.00% 24,269.14 2,022.43 332.45 66.49
PLASTICS
# 1 PETE Soft Drinks 9.28% 1,227.26 102.27 16.81 3.36
# 2 HDPE 0.00% - - - -
# 3 PVC 0.00% - - - -
# 4 LDPE Recyclable Film 0.00% - - - -
# 5 PP 18.79% 2,485.21 207.10 34.04 6.81
# 6 PS (Styrofoam) 9.28% 1,227.26 102.27 16.81 3.36
# 6 PS (Clear/Hard) 18.56% 2,454.53 204.54 33.62 6.72
# 7 Other 0.00% - - - -
Non-Recyclable Film 16.24% 2,147.71 178.98 29.42 5.88
Rigid Plastics 27.84% 3,681.79 306.82 50.44 10.09
Plastic Strapping 0.00% - - - -
Total Plastics 14.49% 100.00% 13,223.77 1,101.98 181.15 36.23
METALS
Aluminum Cans 50.00% 306.82 25.57 4.20 0.84
Aluminum Foil 50.00% 306.82 25.57 4.20 0.84
Aerosal Cans 0.00% - - - -
Steel 0.00% - - - -
Scrap Metal 0.00% - - - -
Total Metals 0.67% 100.00% 613.63 51.14 8.41 1.68
GLASS
Glass (Clear/ Coloured) 100.00% 1,227.26 102.27 23.13 3.36
Other Glass 0.00% - - - -
Total Glass 1.34% 100.00% 1,227.26 102.27 23.13 3.36
HSW
Batteries 100.00% 61.36 5.11 1.16 0.17
Toner Cartridges 0.00% - - - -
Hand Sanitizer 0.00% - - - -
Total HSW 0.07% 100.00% 61.36 5.11 1.16 0.17
ORGANICS
Food Waste 79.72% 34,977.01 2,914.75 479.14 95.83
Tissue / Toweling 16.78% 7,363.58 613.63 100.87 20.17
Beverage Liquids 0.00% - - - -
Compostables 3.50% 1,534.08 127.84 21.01 4.20
Total Organics 48.08% 100.00% 43,874.67 3,656.22 601.02 120.20
OTHER MATERIALS
Textiles 0.00% - - - -
Latex Gloves 0.00% - - - -
#1 Water Bottles 7.69% 613.63 51.14 8.41 1.68
Electonics/Appliances 92.31% 7,363.58 613.63 100.87 20.17
K Cups 0.00% - - - -
0.00% - - - -
Total Other 8.74% 100.00% 7,977.21 664.77 109.28 21.86
TOTAL ANNUAL WASTE 100.00% 91,247.05 7,603.92 1,256.60 249.99
Total Annual Divertable Materials 78.48% 71,610.83
Total Annual Non-Divertable Materials 21.52% 19,636.22
WASTE AUDIT DATA
*The highlighted items are not acceptable items for recycling in the regular recycling bin.

Waste Audit Report 2016 Queen’s University- Kingston, ON
56
Sorted Waste Material Breakdown
The above pie chart shows the breakdown of materials found in the audited waste sample from
Mackintosh-Corry Hall.
Non-Divertable vs. Divertable Materials Found in Sample
The pie chart above depicts what percentage of the waste sample from Mackintosh-Corry Hall was
recyclable or divertable materials, and what percentage was waste or non-divertable materials.
Paper26.60%
Plastics14.49%
Metal0.67%
Glass1.34%
HSW0.07%
Organics48.08%
Other8.74%
Total Annual Divertable Materials78.48%
Total Annual Non-
Divertable Materials21.52%

Waste Audit Report 2016 Queen’s University- Kingston, ON
57
JDUC – John Deutsch University Centre
NAME: JDUC
ADDRESS:
DATE: (KGS) (KGS) (KGS) (KGS)
PAPER % % Annual Waste Monthly Weekly Daily
Newspaper 0.00% - - - -
Magazines 0.00% - - - -
Cardboard 8.52% 920.45 76.70 12.61 2.52
Boxboard 2.84% 306.82 25.57 4.20 0.84
Mixed Papers 0.28% 30.68 2.56 0.42 0.08
Molded Pulp 0.28% 30.68 2.56 0.42 0.08
Kraft Paper 17.05% 1,840.90 153.41 25.22 5.04
Spiral Wound 0.00% - - - -
Other Paper 51.14% 5,522.69 460.22 75.65 15.13
Coffee Cups 18.47% 1,994.30 166.19 27.32 5.46
Polycoat Containers 1.42% 153.41 12.78 2.10 0.42
Aseptic Containers 0.00% - - - -
Total Paper 29.38% 100.00% 10,799.92 899.99 147.94 29.59
PLASTICS
# 1 PETE Soft Drinks 7.63% 613.63 51.14 8.41 1.68
# 2 HDPE 0.00% - - - -
# 3 PVC 0.00% - - - -
# 4 LDPE Recyclable Film 0.38% 30.68 2.56 0.42 0.08
# 5 PP 7.63% 613.63 51.14 8.41 1.68
# 6 PS (Styrofoam) 15.27% 1,227.26 102.27 16.81 3.36
# 6 PS (Clear/Hard) 22.90% 1,840.90 153.41 25.22 5.04
# 7 Other 0.00% - - - -
Non-Recyclable Film 38.55% 3,098.84 258.24 42.45 8.49
Rigid Plastics 7.63% 613.63 51.14 8.41 1.68
Plastic Strapping 0.00% - - - -
Total Plastics 21.87% 100.00% 8,038.58 669.88 110.12 22.02
METALS
Aluminum Cans 33.33% 30.68 2.56 0.42 0.08
Aluminum Foil 33.33% 30.68 2.56 0.42 0.08
Aerosal Cans 0.00% - - - -
Steel 0.00% - - - -
Scrap Metal 33.33% 30.68 2.56 0.42 0.08
Total Metals 0.25% 100.00% 92.04 7.67 1.26 0.25
GLASS
Glass (Clear/ Coloured) 0.00% - - - -
Other Glass 100.00% 3,068.16 255.68 57.83 8.41
Total Glass 8.35% 100.00% 3,068.16 255.68 57.83 8.41
HSW
Batteries 0.00% - - - -
Toner Cartridges 0.00% - - - -
Hand Sanitizer 0.00% - - - -
Total HSW 0.00% 0.00% - - - -
ORGANICS
Food Waste 63.64% 8,590.85 715.90 117.68 23.54
Tissue / Toweling 22.73% 3,068.16 255.68 42.03 8.41
Beverage Liquids 0.00% - - - -
Compostables 13.64% 1,840.90 153.41 25.22 5.04
Total Organics 36.73% 100.00% 13,499.90 1,124.99 184.93 36.99
OTHER MATERIALS
Textiles 97.56% 1,227.26 102.27 16.81 3.36
Latex Gloves 2.44% 30.68 2.56 0.42 0.08
#1 Water Bottles 0.00% - - - -
Electonics/Appliances 0.00% - - - -
K Cups 0.00% - - - -
0.00% - - - -
Total Other 3.42% 100.00% 1,257.95 104.83 17.23 3.45
TOTAL ANNUAL WASTE 100.00% 36,756.54 3,063.05 519.32 100.70
Total Annual Divertable Materials 59.68% 21,937.34
Total Annual Non-Divertable Materials 40.32% 14,819.21
WASTE AUDIT DATA
*The highlighted items are not acceptable items for recycling in the regular recycling bin.

Waste Audit Report 2016 Queen’s University- Kingston, ON
58
Sorted Waste Material Breakdown
The above pie chart shows the breakdown of materials found in the audited waste sample from
JDUC.
Non-Divertable vs. Divertable Materials Found in Sample
The pie chart above depicts what percentage of the waste sample from JDUC was recyclable or
divertable materials, and what percentage was waste or non-divertable materials.
Paper29.38%
Plastics21.87%
Metal0.25%
Glass8.35%
HSW0.00%
Organics36.73%
Other3.42%
Total Annual Divertable Materials59.68%
Total Annual Non-
Divertable Materials40.32%

Waste Audit Report 2016 Queen’s University- Kingston, ON
59
Barrie Street Offices
NAME: Barrie Street Offices
ADDRESS:
DATE: (KGS) (KGS) (KGS) (KGS)
PAPER % % Annual Waste Monthly Weekly Daily
Newspaper 0.00% - - - -
Magazines 0.00% - - - -
Cardboard 0.00% - - - -
Boxboard 28.17% 1,227.26 102.27 16.81 3.36
Mixed Papers 14.08% 613.63 51.14 8.41 1.68
Molded Pulp 0.00% - - - -
Kraft Paper 14.79% 644.31 53.69 8.83 1.77
Spiral Wound 0.00% - - - -
Other Paper 28.17% 1,227.26 102.27 16.81 3.36
Coffee Cups 14.08% 613.63 51.14 8.41 1.68
Polycoat Containers 0.70% 30.68 2.56 0.42 0.08
Aseptic Containers 0.00% - - - -
Total Paper 21.19% 100.00% 4,356.79 363.07 59.68 11.94
PLASTICS
# 1 PETE Soft Drinks 0.00% - - - -
# 2 HDPE 0.00% - - - -
# 3 PVC 0.00% - - - -
# 4 LDPE Recyclable Film 0.00% - - - -
# 5 PP 24.85% 1,257.95 104.83 17.23 3.45
# 6 PS (Styrofoam) 12.12% 613.63 51.14 8.41 1.68
# 6 PS (Clear/Hard) 1.21% 61.36 5.11 0.84 0.17
# 7 Other 0.00% - - - -
Non-Recyclable Film 48.48% 2,454.53 204.54 33.62 6.72
Rigid Plastics 13.33% 674.99 56.25 9.25 1.85
Plastic Strapping 0.00% - - - -
Total Plastics 24.63% 100.00% 5,062.46 421.87 69.35 13.87
METALS
Aluminum Cans 0.00% - - - -
Aluminum Foil 0.00% - - - -
Aerosal Cans 0.00% - - - -
Steel 100.00% 613.63 51.14 8.41 1.68
Scrap Metal 0.00% - - - -
Total Metals 2.99% 100.00% 613.63 51.14 8.41 1.68
GLASS
Glass (Clear/ Coloured) 0.00% - - - -
Other Glass 0.00% - - - -
Total Glass 0.00% 0.00% - - - -
HSW
Batteries 100.00% 30.68 2.56 0.58 0.08
Toner Cartridges 0.00% - - - -
Hand Sanitizer 0.00% - - - -
Total HSW 0.15% 100.00% 30.68 2.56 0.58 0.08
ORGANICS
Food Waste 40.00% 3,681.79 306.82 50.44 10.09
Tissue / Toweling 60.00% 5,522.69 460.22 75.65 15.13
Beverage Liquids 0.00% - - - -
Compostables 0.00% - - - -
Total Organics 44.78% 100.00% 9,204.48 767.04 126.09 25.22
OTHER MATERIALS
Textiles 2.38% 30.68 2.56 0.42 0.08
Latex Gloves 2.38% 30.68 2.56 0.42 0.08
#1 Water Bottles 0.00% - - - -
Electonics/Appliances 0.00% - - - -
K Cups 95.24% 1,227.26 102.27 16.81 3.36
0.00% - - - -
Total Other 6.27% 100.00% 1,288.63 107.39 17.65 3.53
TOTAL ANNUAL WASTE 100.00% 20,556.66 1,713.06 281.76 56.32
Total Annual Divertable Materials 69.55% 14,297.62
Total Annual Non-Divertable Materials 30.45% 6,259.04
WASTE AUDIT DATA
*The highlighted items are not acceptable items for recycling in the regular recycling bin.

Waste Audit Report 2016 Queen’s University- Kingston, ON
60
Sorted Waste Material Breakdown
The above pie chart shows the breakdown of materials found in the audited waste sample from
the Barre Street Offices.
Non-Divertable vs. Divertable Materials Found in Sample
The pie chart above depicts what percentage of the waste sample from the Barre Street Offices
was recyclable or divertable materials, and what percentage was waste or non-divertable
materials.
Paper21.19%
Plastics24.63%
Metal2.99%
Glass0.00%
HSW0.15% Organics
44.78%
Other6.27%
Total Annual Divertable Materials69.55%
Total Annual Non-
Divertable Materials30.45%
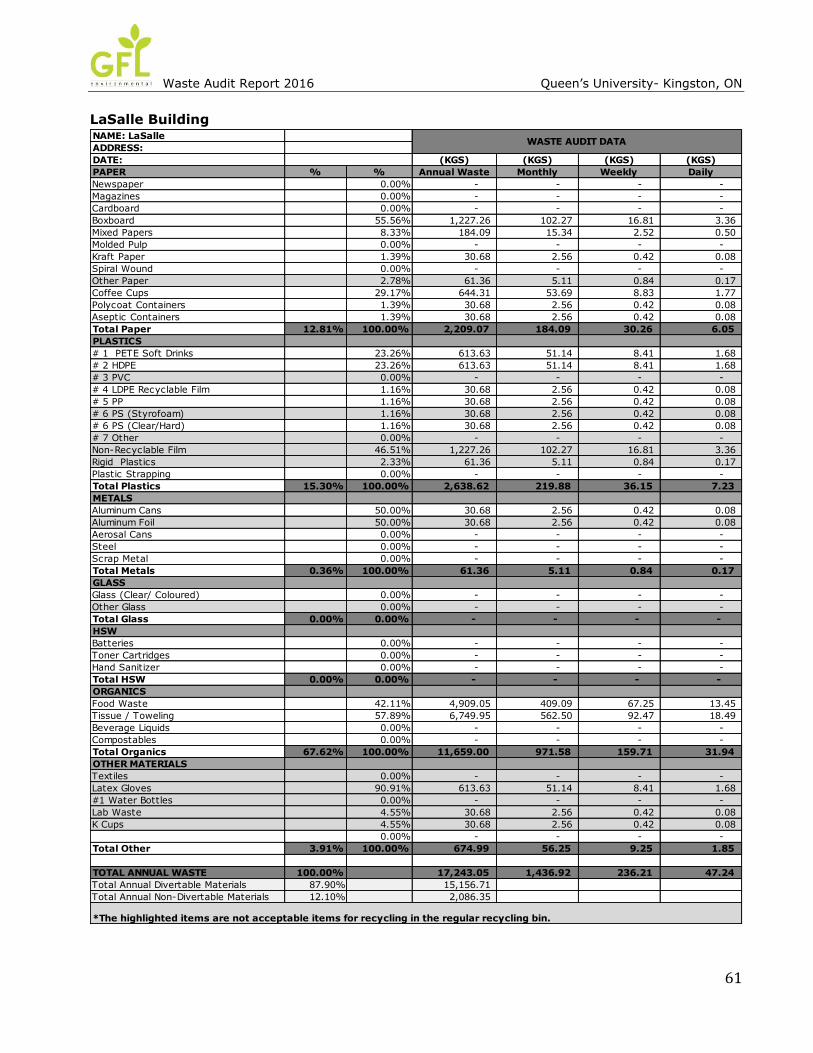
Waste Audit Report 2016 Queen’s University- Kingston, ON
61
LaSalle Building
NAME: LaSalle
ADDRESS:
DATE: (KGS) (KGS) (KGS) (KGS)
PAPER % % Annual Waste Monthly Weekly Daily
Newspaper 0.00% - - - -
Magazines 0.00% - - - -
Cardboard 0.00% - - - -
Boxboard 55.56% 1,227.26 102.27 16.81 3.36
Mixed Papers 8.33% 184.09 15.34 2.52 0.50
Molded Pulp 0.00% - - - -
Kraft Paper 1.39% 30.68 2.56 0.42 0.08
Spiral Wound 0.00% - - - -
Other Paper 2.78% 61.36 5.11 0.84 0.17
Coffee Cups 29.17% 644.31 53.69 8.83 1.77
Polycoat Containers 1.39% 30.68 2.56 0.42 0.08
Aseptic Containers 1.39% 30.68 2.56 0.42 0.08
Total Paper 12.81% 100.00% 2,209.07 184.09 30.26 6.05
PLASTICS
# 1 PETE Soft Drinks 23.26% 613.63 51.14 8.41 1.68
# 2 HDPE 23.26% 613.63 51.14 8.41 1.68
# 3 PVC 0.00% - - - -
# 4 LDPE Recyclable Film 1.16% 30.68 2.56 0.42 0.08
# 5 PP 1.16% 30.68 2.56 0.42 0.08
# 6 PS (Styrofoam) 1.16% 30.68 2.56 0.42 0.08
# 6 PS (Clear/Hard) 1.16% 30.68 2.56 0.42 0.08
# 7 Other 0.00% - - - -
Non-Recyclable Film 46.51% 1,227.26 102.27 16.81 3.36
Rigid Plastics 2.33% 61.36 5.11 0.84 0.17
Plastic Strapping 0.00% - - - -
Total Plastics 15.30% 100.00% 2,638.62 219.88 36.15 7.23
METALS
Aluminum Cans 50.00% 30.68 2.56 0.42 0.08
Aluminum Foil 50.00% 30.68 2.56 0.42 0.08
Aerosal Cans 0.00% - - - -
Steel 0.00% - - - -
Scrap Metal 0.00% - - - -
Total Metals 0.36% 100.00% 61.36 5.11 0.84 0.17
GLASS
Glass (Clear/ Coloured) 0.00% - - - -
Other Glass 0.00% - - - -
Total Glass 0.00% 0.00% - - - -
HSW
Batteries 0.00% - - - -
Toner Cartridges 0.00% - - - -
Hand Sanitizer 0.00% - - - -
Total HSW 0.00% 0.00% - - - -
ORGANICS
Food Waste 42.11% 4,909.05 409.09 67.25 13.45
Tissue / Toweling 57.89% 6,749.95 562.50 92.47 18.49
Beverage Liquids 0.00% - - - -
Compostables 0.00% - - - -
Total Organics 67.62% 100.00% 11,659.00 971.58 159.71 31.94
OTHER MATERIALS
Textiles 0.00% - - - -
Latex Gloves 90.91% 613.63 51.14 8.41 1.68
#1 Water Bottles 0.00% - - - -
Lab Waste 4.55% 30.68 2.56 0.42 0.08
K Cups 4.55% 30.68 2.56 0.42 0.08
0.00% - - - -
Total Other 3.91% 100.00% 674.99 56.25 9.25 1.85
TOTAL ANNUAL WASTE 100.00% 17,243.05 1,436.92 236.21 47.24
Total Annual Divertable Materials 87.90% 15,156.71
Total Annual Non-Divertable Materials 12.10% 2,086.35
WASTE AUDIT DATA
*The highlighted items are not acceptable items for recycling in the regular recycling bin.

Waste Audit Report 2016 Queen’s University- Kingston, ON
62
Sorted Waste Material Breakdown
The above pie chart shows the breakdown of materials found in the audited waste sample from
the LaSalle Building.
Non-Divertable vs. Divertable Materials Found in Sample
The pie chart above depicts what percentage of the waste sample from the LaSalle Building was
recyclable or divertable materials, and what percentage was waste or non-divertable materials.
Paper12.81%
Plastics15.30%
Metal0.36%
Glass0.00%
HSW0.00%
Organics67.62%
Other3.91%
Total Annual Divertable Materials87.90%
Total Annual Non-
Divertable Materials12.10%

Waste Audit Report 2016 Queen’s University- Kingston, ON
63
Campus Book Store
NAME: Campus Book Store
ADDRESS:
DATE: (KGS) (KGS) (KGS) (KGS)
PAPER % % Annual Waste Monthly Weekly Daily
Newspaper 1.61% 30.68 2.56 0.42 0.08
Magazines 0.00% - - - -
Cardboard 0.00% - - - -
Boxboard 1.61% 30.68 2.56 0.42 0.08
Mixed Papers 96.77% 1,840.90 153.41 25.22 5.04
Molded Pulp 0.00% - - - -
Kraft Paper 0.00% - - - -
Other Paper 0.00% - - - -
Coffee Cups 0.00% - - - -
Polycoat Containers 0.00% - - - -
Aseptic Containers 0.00% - - - -
Total Paper 32.80% 100.00% 1,902.26 158.52 26.06 5.21
PLASTICS
# 1 PETE Soft Drinks 1.56% 30.68 2.56 0.42 0.08
# 2 HDPE 1.56% 30.68 2.56 0.42 0.08
# 3 PVC 0.00% - - - -
# 4 LDPE Recyclable Film 1.56% 30.68 2.56 0.42 0.08
# 5 PP 0.00% - - - -
# 6 PS (Styrofoam) 0.00% - - - -
# 6 PS (Clear/Hard) 0.00% - - - -
# 7 Other 0.00% - - - -
Non-Recyclable Film 93.75% 1,840.90 153.41 25.22 5.04
Rigid Plastics 1.56% 30.68 2.56 0.42 0.08
Plastic Strapping 0.00% - - - -
Total Plastics 33.86% 100.00% 1,963.62 163.64 26.90 5.38
METALS
Aluminum Cans 0.00% - - - -
Aluminum Foil 0.00% - - - -
Aerosal Cans 0.00% - - - -
Steel 0.00% - - - -
Scrap Metal 0.00% - - - -
Total Metals 0.00% 0.00% - - - -
GLASS
Glass (Clear/ Coloured) 0.00% - - - -
Other Glass 100.00% 1,227.26 102.27 23.13 3.36
Total Glass 21.16% 100.00% 1,227.26 102.27 23.13 3.36
HSW
Batteries 0.00% - - - -
Toner Cartridges 0.00% - - - -
Hand Sanitizer 0.00% - - - -
Total HSW 0.00% 0.00% - - - -
ORGANICS
Food Waste 0.00% - - - -
Tissue / Toweling 50.00% 30.68 2.56 0.42 0.08
Beverage Liquids 0.00% - - - -
Compostables 50.00% 30.68 2.56 0.42 0.08
Total Organics 1.06% 100.00% 61.36 5.11 0.84 0.17
OTHER MATERIALS
Textiles 0.00% - - - -
Latex Gloves 0.00% - - - -
#1 Water Bottles 0.00% - - - -
Foam 100.00% 644.31 53.69 8.83 1.77
K Cups 0.00% - - - -
0.00% - - - -
Total Other 11.11% 100.00% 644.31 53.69 8.83 1.77
TOTAL ANNUAL WASTE 100.00% 5,798.82 483.24 85.76 15.89
Total Annual Divertable Materials 35.45% 2,055.67
Total Annual Non-Divertable Materials 64.55% 3,743.15
WASTE AUDIT DATA
*The highlighted items are not acceptable items for recycling in the regular recycling bin.

Waste Audit Report 2016 Queen’s University- Kingston, ON
64
Sorted Waste Material Breakdown
The above pie chart shows the breakdown of materials found in the audited waste sample from
the Campus Book Store.
Non-Divertable vs. Divertable Materials Found in Sample
The pie chart above depicts what percentage of the waste sample from Tindall the Campus Book
Store was recyclable or divertable materials, and what percentage was waste or non-divertable
materials.
Paper32.80%
Plastics33.86%
Metal0.00%
Glass21.16% HSW
0.00%
Organics1.06%
Other11.11%
Total Annual Divertable Materials35.45%
Total Annual Non-
Divertable Materials64.55%

Waste Audit Report 2016 Queen’s University- Kingston, ON
65
Rideau Building
NAME: Rideau
ADDRESS:
DATE: (KGS) (KGS) (KGS) (KGS)
PAPER % % Annual Waste Monthly Weekly Daily
Newspaper 0.00% - - - -
Magazines 0.00% - - - -
Cardboard 16.39% 613.63 51.14 8.41 1.68
Boxboard 16.39% 613.63 51.14 8.41 1.68
Mixed Papers 32.79% 1,227.26 102.27 16.81 3.36
Molded Pulp 0.00% - - - -
Kraft Paper 0.00% - - - -
Other Paper 16.39% 613.63 51.14 8.41 1.68
Coffee Cups 16.39% 613.63 51.14 8.41 1.68
Polycoat Containers 0.82% 30.68 2.56 0.42 0.08
Aseptic Containers 0.82% 30.68 2.56 0.42 0.08
Total Paper 13.19% 100.00% 3,743.15 311.93 51.28 10.26
PLASTICS
# 1 PETE Soft Drinks 16.60% 1,227.26 102.27 16.81 3.36
# 2 HDPE 0.00% - - - -
# 3 PVC 0.00% - - - -
# 4 LDPE Recyclable Film 0.00% - - - -
# 5 PP 8.30% 613.63 51.14 8.41 1.68
# 6 PS (Styrofoam) 0.00% - - - -
# 6 PS (Clear/Hard) 0.41% 30.68 2.56 0.42 0.08
# 7 Other 0.00% - - - -
Non-Recyclable Film 16.60% 1,227.26 102.27 16.81 3.36
Rigid Plastics 58.09% 4,295.42 357.95 58.84 11.77
Plastic Strapping 0.00% - - - -
Total Plastics 26.05% 100.00% 7,394.26 616.19 101.29 20.26
METALS
Aluminum Cans 50.00% 613.63 51.14 8.41 1.68
Aluminum Foil 0.00% - - - -
Aerosal Cans 0.00% - - - -
Steel 0.00% - - - -
Scrap Metal 50.00% 613.63 51.14 8.41 1.68
Total Metals 4.32% 100.00% 1,227.26 102.27 16.81 3.36
GLASS
Glass (Clear/ Coloured) 0.00% - - - -
Other Glass 0.00% - - - -
Total Glass 0.00% 0.00% - - - -
HSW
Batteries 0.00% - - - -
Toner Cartridges 0.00% - - - -
Hand Sanitizer 0.00% - - - -
Total HSW 0.00% 0.00% - - - -
ORGANICS
Food Waste 49.90% 7,363.58 613.63 100.87 20.17
Tissue / Toweling 49.90% 7,363.58 613.63 100.87 20.17
Beverage Liquids 0.00% - - - -
Compostables 0.21% 30.68 2.56 0.42 0.08
Total Organics 52.00% 100.00% 14,757.84 1,229.82 202.16 40.43
OTHER MATERIALS
Textiles 97.56% 1,227.26 102.27 16.81 3.36
Latex Gloves 0.00% - - - -
#1 Water Bottles 2.44% 30.68 2.56 0.42 0.08
Foam 0.00% - - - -
K Cups 0.00% - - - -
0.00% - - - -
Total Other 4.43% 100.00% 1,257.95 104.83 17.23 3.45
TOTAL ANNUAL WASTE 100.00% 28,380.47 2,365.04 388.77 77.75
Total Annual Divertable Materials 73.95% 20,986.21
Total Annual Non-Divertable Materials 26.05% 7,394.26
WASTE AUDIT DATA
*The highlighted items are not acceptable items for recycling in the regular recycling bin.

Waste Audit Report 2016 Queen’s University- Kingston, ON
66
Sorted Waste Material Breakdown
The above pie chart shows the breakdown of materials found in the audited waste sample from
the Rideau Building.
Non-Divertable vs. Divertable Materials Found in Sample
The pie chart above depicts what percentage of the waste sample from the Rideau Building was
recyclable or divertable materials, and what percentage was waste or non-divertable materials.
Paper13.19%Plastics
26.05%
Metal4.32%
Glass0.00%
HSW0.00%
Organics52.00%
Other4.43%
Total Annual
Divertable Materials73.95%
Total Annual Non-
Divertable Materials26.05%

Waste Audit Report 2016 Queen’s University- Kingston, ON
67
Goodes Hall – The Smith School of Business
NAME: Goodes Hall
ADDRESS:
DATE: (KGS) (KGS) (KGS) (KGS)
PAPER % % Annual Waste Monthly Weekly Daily
Newspaper 0.00% - - - -
Magazines 0.00% - - - -
Cardboard 0.00% - - - -
Boxboard 4.12% 613.63 51.14 8.41 1.68
Mixed Papers 41.15% 6,136.32 511.36 84.06 16.81
Molded Pulp 4.12% 613.63 51.14 8.41 1.68
Kraft Paper 5.14% 767.04 63.92 10.51 2.10
Other Paper 8.23% 1,227.26 102.27 16.81 3.36
Coffee Cups 37.04% 5,522.69 460.22 75.65 15.13
Polycoat Containers 0.00% - - - -
Aseptic Containers 0.21% 30.68 2.56 0.42 0.08
Total Paper 29.00% 100.00% 14,911.25 1,242.60 204.26 40.85
PLASTICS
# 1 PETE Soft Drinks 25.24% 2,454.53 204.54 33.62 6.72
# 2 HDPE 15.77% 1,534.08 127.84 21.01 4.20
# 3 PVC 0.32% 30.68 2.56 0.42 0.08
# 4 LDPE Recyclable Film 0.32% 30.68 2.56 0.42 0.08
# 5 PP 6.31% 613.63 51.14 8.41 1.68
# 6 PS (Styrofoam) 0.00% - - - -
# 6 PS (Clear/Hard) 6.31% 613.63 51.14 8.41 1.68
# 7 Other 1.58% 153.41 12.78 2.10 0.42
Non-Recyclable Film 37.85% 3,681.79 306.82 50.44 10.09
Rigid Plastics 6.31% 613.63 51.14 8.41 1.68
Plastic Strapping 0.00% - - - -
Total Plastics 18.91% 100.00% 9,726.06 810.51 133.23 26.65
METALS
Aluminum Cans 83.33% 153.41 12.78 2.10 0.42
Aluminum Foil 0.00% - - - -
Aerosal Cans 0.00% - - - -
Steel 16.67% 30.68 2.56 0.42 0.08
Scrap Metal 0.00% - - - -
Total Metals 0.36% 100.00% 184.09 15.34 2.52 0.50
GLASS
Glass (Clear/ Coloured) 25.00% 613.63 51.14 11.57 1.68
Other Glass 75.00% 1,840.90 153.41 34.70 5.04
Total Glass 4.77% 100.00% 2,454.53 204.54 46.27 6.72
HSW
Batteries 0.00% - - - -
Toner Cartridges 0.00% - - - -
Hand Sanitizer 0.00% - - - -
Total HSW 0.00% 0.00% - - - -
ORGANICS
Food Waste 87.18% 20,863.48 1,738.62 285.80 57.16
Tissue / Toweling 7.69% 1,840.90 153.41 25.22 5.04
Beverage Liquids 0.00% - - - -
Compostables 5.13% 1,227.26 102.27 16.81 3.36
Total Organics 46.54% 100.00% 23,931.64 1,994.30 327.83 65.57
OTHER MATERIALS
Textiles 0.00% - - - -
Latex Gloves 14.29% 30.68 2.56 0.42 0.08
#1 Water Bottles 71.43% 153.41 12.78 2.10 0.42
Foam 0.00% - - - -
K Cups 14.29% 30.68 2.56 0.42 0.08
0.00% - - - -
Total Other 0.42% 100.00% 214.77 17.90 2.94 0.59
TOTAL ANNUAL WASTE 100.00% 51,422.34 4,285.20 717.06 140.88
Total Annual Divertable Materials 84.90% 43,659.90
Total Annual Non-Divertable Materials 15.10% 7,762.44
WASTE AUDIT DATA
*The highlighted items are not acceptable items for recycling in the regular recycling bin.

Waste Audit Report 2016 Queen’s University- Kingston, ON
68
Sorted Waste Material Breakdown
The above pie chart shows the breakdown of materials found in the audited waste sample from
Goodes Hall.
Non-Divertable vs. Divertable Materials Found in Sample
The pie chart above depicts what percentage of the waste sample from Goodes Hall was recyclable
or divertable materials, and what percentage was waste or non-divertable materials.
Paper29.00%
Plastics18.91%
Metal0.36%
Glass4.77%
HSW0.00% Organics
46.54%
Other0.42%
Total Annual
Divertable Materials84.90%
Total Annual Non-
Divertable Materials15.10%

Waste Audit Report 2016 Queen’s University- Kingston, ON
69
Brant House Residence
NAME: Brant House
ADDRESS:
DATE: (KGS) (KGS) (KGS) (KGS)
PAPER % % Annual Waste Monthly Weekly Daily
Newspaper 0.00% - - - -
Magazines 0.00% - - - -
Cardboard 0.00% - - - -
Boxboard 19.05% 613.63 51.14 8.41 1.68
Mixed Papers 0.95% 30.68 2.56 0.42 0.08
Molded Pulp 0.00% - - - -
Kraft Paper 1.90% 61.36 5.11 0.84 0.17
Other Paper 38.10% 1,227.26 102.27 16.81 3.36
Coffee Cups 20.00% 644.31 53.69 8.83 1.77
Polycoat Containers 9.52% 306.82 25.57 4.20 0.84
Aseptic Containers 10.48% 337.50 28.12 4.62 0.92
Total Paper 6.42% 100.00% 3,221.57 268.46 44.13 8.83
PLASTICS
# 1 PETE Soft Drinks 39.22% 2,454.53 204.54 33.62 6.72
# 2 HDPE 0.49% 30.68 2.56 0.42 0.08
# 3 PVC 0.00% - - - -
# 4 LDPE Recyclable Film 0.00% - - - -
# 5 PP 9.80% 613.63 51.14 8.41 1.68
# 6 PS (Styrofoam) 0.49% 30.68 2.56 0.42 0.08
# 6 PS (Clear/Hard) 0.49% 30.68 2.56 0.42 0.08
# 7 Other 0.49% 30.68 2.56 0.42 0.08
Non-Recyclable Film 39.22% 2,454.53 204.54 33.62 6.72
Rigid Plastics 9.80% 613.63 51.14 8.41 1.68
Plastic Strapping 0.00% - - - -
Total Plastics 12.48% 100.00% 6,259.04 521.59 85.74 17.15
METALS
Aluminum Cans 50.00% 30.68 2.56 0.42 0.08
Aluminum Foil 50.00% 30.68 2.56 0.42 0.08
Aerosal Cans 0.00% - - - -
Steel 0.00% - - - -
Scrap Metal 0.00% - - - -
Total Metals 0.12% 100.00% 61.36 5.11 0.84 0.17
GLASS
Glass (Clear/ Coloured) 0.00% - - - -
Other Glass 0.00% - - - -
Total Glass 0.00% 0.00% - - - -
HSW
Batteries 0.00% - - - -
Toner Cartridges 0.00% - - - -
Hand Sanitizer 0.00% - - - -
Total HSW 0.00% 0.00% - - - -
ORGANICS
Food Waste 71.43% 21,477.11 1,789.76 294.21 58.84
Tissue / Toweling 20.41% 6,136.32 511.36 84.06 16.81
Beverage Liquids 0.00% - - - -
Compostables 8.16% 2,454.53 204.54 33.62 6.72
Total Organics 59.94% 100.00% 30,067.96 2,505.66 411.89 82.38
OTHER MATERIALS
Textiles 0.58% 61.36 5.11 0.84 0.17
Latex Gloves 0.29% 30.68 2.56 0.42 0.08
#1 Water Bottles 0.29% 30.68 2.56 0.42 0.08
Sanitary Napkins 98.84% 10,431.74 869.31 142.90 28.58
K Cups 0.00% - - - -
0.00% - - - -
Total Other 21.04% 100.00% 10,554.47 879.54 144.58 28.92
TOTAL ANNUAL WASTE 100.00% 50,164.40 4,180.37 687.18 137.44
Total Annual Divertable Materials 70.21% 35,222.46
Total Annual Non-Divertable Materials 29.79% 14,941.93
WASTE AUDIT DATA
*The highlighted items are not acceptable items for recycling in the regular recycling bin.

Waste Audit Report 2016 Queen’s University- Kingston, ON
70
Sorted Waste Material Breakdown
The above pie chart shows the breakdown of materials found in the audited waste sample from
the Brant House Residences.
Non-Divertable vs. Divertable Materials Found in Sample
The pie chart above depicts what percentage of the waste sample from the Brant House Residences
was recyclable or divertable materials, and what percentage was waste or non-divertable
materials.
Paper6.42%
Plastics12.48%
Metal0.12%
Glass0.00%
HSW0.00%
Organics59.94% Other
21.04%
Total Annual
Divertable Materials70.21%
Total Annual Non-
Divertable Materials29.79%

Waste Audit Report 2016 Queen’s University- Kingston, ON
71
Leggett Hall
NAME: Leggett Hall
ADDRESS:
DATE: (KGS) (KGS) (KGS) (KGS)
PAPER % % Annual Waste Monthly Weekly Daily
Newspaper 0.00% - - - -
Magazines 0.00% - - - -
Cardboard 3.45% 306.82 25.57 4.20 0.84
Boxboard 20.69% 1,840.90 153.41 25.22 5.04
Mixed Papers 15.52% 1,380.67 115.06 18.91 3.78
Molded Pulp 0.00% - - - -
Kraft Paper 1.72% 153.41 12.78 2.10 0.42
Other Paper 36.21% 3,221.57 268.46 44.13 8.83
Coffee Cups 8.62% 767.04 63.92 10.51 2.10
Polycoat Containers 6.90% 613.63 51.14 8.41 1.68
Aseptic Containers 6.90% 613.63 51.14 8.41 1.68
Total Paper 12.51% 100.00% 8,897.66 741.47 121.89 24.38
PLASTICS
# 1 PETE Soft Drinks 11.02% 1,227.26 102.27 16.81 3.36
# 2 HDPE 11.02% 1,227.26 102.27 16.81 3.36
# 3 PVC 0.00% - - - -
# 4 LDPE Recyclable Film 0.55% 61.36 5.11 0.84 0.17
# 5 PP 16.53% 1,840.90 153.41 25.22 5.04
# 6 PS (Styrofoam) 0.28% 30.68 2.56 0.42 0.08
# 6 PS (Clear/Hard) 11.02% 1,227.26 102.27 16.81 3.36
# 7 Other 0.00% - - - -
Non-Recyclable Film 38.57% 4,295.42 357.95 58.84 11.77
Rigid Plastics 11.02% 1,227.26 102.27 16.81 3.36
Plastic Strapping 0.00% - - - -
Total Plastics 15.65% 100.00% 11,137.42 928.12 152.57 30.51
METALS
Aluminum Cans 92.31% 1,840.90 153.41 25.22 5.04
Aluminum Foil 0.00% - - - -
Aerosal Cans 7.69% 153.41 12.78 2.10 0.42
Steel 0.00% - - - -
Scrap Metal 0.00% - - - -
Total Metals 2.80% 100.00% 1,994.30 166.19 27.32 5.46
GLASS
Glass (Clear/ Coloured) 0.00% - - - -
Other Glass 0.00% - - - -
Total Glass 0.00% 0.00% - - - -
HSW
Batteries 0.00% - - - -
Toner Cartridges 0.00% - - - -
Hand Sanitizer 0.00% - - - -
Total HSW 0.00% 0.00% - - - -
ORGANICS
Food Waste 65.33% 30,067.96 2,505.66 411.89 82.38
Tissue / Toweling 25.33% 11,659.00 971.58 159.71 31.94
Beverage Liquids 0.00% - - - -
Compostables 9.33% 4,295.42 357.95 58.84 11.77
Total Organics 64.68% 100.00% 46,022.38 3,835.20 630.44 126.09
OTHER MATERIALS
Textiles 0.00% - - - -
Latex Gloves 0.99% 30.68 2.56 0.42 0.08
#1 Water Bottles 59.41% 1,840.90 153.41 25.22 5.04
Sanitary Napkins 19.80% 613.63 51.14 8.41 1.68
K Cups 19.80% 613.63 51.14 8.41 1.68
0.00% - - - -
Total Other 4.36% 100.00% 3,098.84 258.24 42.45 8.49
TOTAL ANNUAL WASTE 100.00% 71,150.61 5,929.22 974.67 194.93
Total Annual Divertable Materials 83.10% 59,123.42
Total Annual Non-Divertable Materials 16.90% 12,027.18
WASTE AUDIT DATA
*The highlighted items are not acceptable items for recycling in the regular recycling bin.

Waste Audit Report 2016 Queen’s University- Kingston, ON
72
Sorted Waste Material Breakdown
The above pie chart shows the breakdown of materials found in the audited waste sample from
Leggett Hall.
Non-Divertable vs. Divertable Materials Found in Sample
The pie chart above depicts what percentage of the waste sample from Leggett Hall was recyclable
or divertable materials, and what percentage was waste or non-divertable materials.
Paper12.51%
Plastics15.65%
Metal2.80%
Glass0.00%
HSW0.00%
Organics64.68%
Other4.36%
Total Annual Divertable Materials83.10%
Total Annual Non-
Divertable Materials16.90%

Waste Audit Report 2016 Queen’s University- Kingston, ON
73
Victoria Hall
NAME: Victoria Hall
ADDRESS:
DATE: (KGS) (KGS) (KGS) (KGS)
PAPER % % Annual Waste Monthly Weekly Daily
Newspaper 0.00% - - - -
Magazines 0.00% - - - -
Cardboard 23.26% 1,534.08 127.84 21.01 4.20
Boxboard 23.26% 1,534.08 127.84 21.01 4.20
Mixed Papers 5.12% 337.50 28.12 4.62 0.92
Molded Pulp 0.00% - - - -
Kraft Paper 0.47% 30.68 2.56 0.42 0.08
Other Paper 19.07% 1,257.95 104.83 17.23 3.45
Coffee Cups 9.77% 644.31 53.69 8.83 1.77
Polycoat Containers 18.60% 1,227.26 102.27 16.81 3.36
Aseptic Containers 0.47% 30.68 2.56 0.42 0.08
Total Paper 9.50% 100.00% 6,596.54 549.71 90.36 18.07
PLASTICS
# 1 PETE Soft Drinks 14.93% 1,840.90 153.41 25.22 5.04
# 2 HDPE 0.25% 30.68 2.56 0.42 0.08
# 3 PVC 0.00% - - - -
# 4 LDPE Recyclable Film 0.00% - - - -
# 5 PP 4.98% 613.63 51.14 8.41 1.68
# 6 PS (Styrofoam) 0.25% 30.68 2.56 0.42 0.08
# 6 PS (Clear/Hard) 4.98% 613.63 51.14 8.41 1.68
# 7 Other 0.00% - - - -
Non-Recyclable Film 69.65% 8,590.85 715.90 117.68 23.54
Rigid Plastics 4.98% 613.63 51.14 8.41 1.68
Plastic Strapping 0.00% - - - -
Total Plastics 17.77% 100.00% 12,334.00 1,027.83 168.96 33.79
METALS
Aluminum Cans 0.00% - - - -
Aluminum Foil 0.00% - - - -
Aerosal Cans 0.00% - - - -
Steel 0.00% - - - -
Scrap Metal 0.00% - - - -
Total Metals 0.00% 0.00% - - - -
GLASS
Glass (Clear/ Coloured) 71.43% 3,068.16 255.68 57.83 8.41
Other Glass 28.57% 1,227.26 102.27 23.13 3.36
Total Glass 6.19% 100.00% 4,295.42 357.95 80.97 11.77
HSW
Batteries 0.00% - - - -
Hazardous Waste 100.00% 153.41 12.78 2.89 0.42
Hand Sanitizer 0.00% - - - -
Total HSW 0.22% 100.00% 153.41 12.78 2.89 0.42
ORGANICS
Food Waste 72.86% 31,295.22 2,607.94 428.70 85.74
Tissue / Toweling 17.14% 7,363.58 613.63 100.87 20.17
Beverage Liquids 0.00% - - - -
Compostables 10.00% 4,295.42 357.95 58.84 11.77
Total Organics 61.89% 100.00% 42,954.23 3,579.52 588.41 117.68
OTHER MATERIALS
Textiles 40.00% 1,227.26 102.27 16.81 3.36
Latex Gloves 20.00% 613.63 51.14 8.41 1.68
#1 Water Bottles 20.00% 613.63 51.14 8.41 1.68
Sanitary Napkins 20.00% 613.63 51.14 8.41 1.68
K Cups 0.00% - - - -
0.00% - - - -
Total Other 4.42% 100.00% 3,068.16 255.68 42.03 8.41
TOTAL ANNUAL WASTE 100.00% 69,401.76 5,783.48 973.62 190.14
Total Annual Divertable Materials 78.69% 54,613.23
Total Annual Non-Divertable Materials 21.31% 14,788.53
WASTE AUDIT DATA
*The highlighted items are not acceptable items for recycling in the regular recycling bin.

Waste Audit Report 2016 Queen’s University- Kingston, ON
74
Sorted Waste Material Breakdown
The above pie chart shows the breakdown of materials found in the audited waste sample from
Victoria Hall.
Non-Divertable vs. Divertable Materials Found in Sample
The pie chart above depicts what percentage of the waste sample from Leggett Hall was recyclable
or divertable materials, and what percentage was waste or non-divertable materials.
Paper9.50%
Plastics17.77%
Metal0.00%
Glass6.19%
HSW0.22%
Organics61.89%
Other4.42%
Total Annual
Divertable Materials78.69%
Total Annual Non-
Divertable Materials21.31%
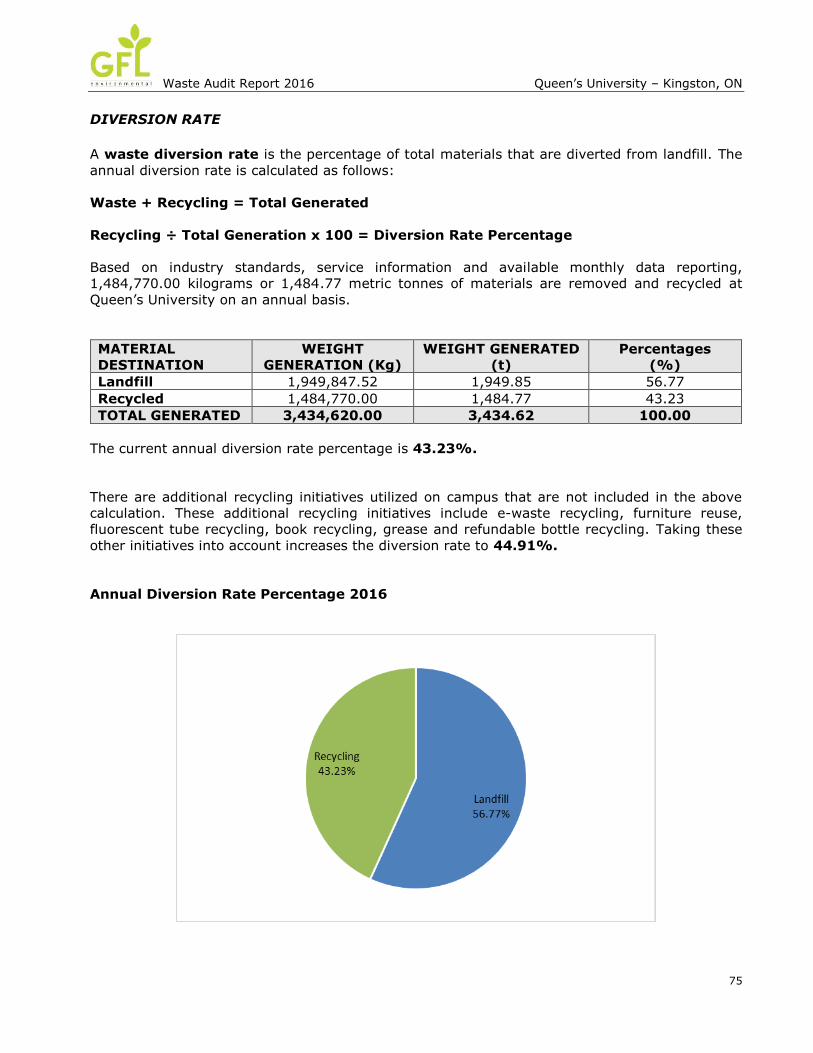
Waste Audit Report 2016 Queen’s University – Kingston, ON
75
DIVERSION RATE
A waste diversion rate is the percentage of total materials that are diverted from landfill. The
annual diversion rate is calculated as follows:
Waste + Recycling = Total Generated
Recycling ÷ Total Generation x 100 = Diversion Rate Percentage
Based on industry standards, service information and available monthly data reporting,
1,484,770.00 kilograms or 1,484.77 metric tonnes of materials are removed and recycled at
Queen’s University on an annual basis.
MATERIAL
DESTINATION
WEIGHT
GENERATION (Kg)
WEIGHT GENERATED
(t)
Percentages
(%)
Landfill 1,949,847.52 1,949.85 56.77
Recycled 1,484,770.00 1,484.77 43.23
TOTAL GENERATED 3,434,620.00 3,434.62 100.00
The current annual diversion rate percentage is 43.23%.
There are additional recycling initiatives utilized on campus that are not included in the above
calculation. These additional recycling initiatives include e-waste recycling, furniture reuse,
fluorescent tube recycling, book recycling, grease and refundable bottle recycling. Taking these
other initiatives into account increases the diversion rate to 44.91%.
Annual Diversion Rate Percentage 2016

Waste Audit Report 2016 Queen’s University- Kingston, ON
76
5 RECOMMENDATIONS TO INCREASE DIVERSION
Based on the waste audit results, it is important to identify the main areas of concern and focus
on where improvements can be made. Taking on one initiative at a time will increase chances of
success. Whether changes need to be made to the existing program itself or increasing education
and awareness, narrowing down the options and targeting an issue every quarter or semi-
annually, will result in attainable results.
In order to improve the effectiveness of the recycling program at Queen’s University, there are
several initiatives to take into consideration. To divert as much material from landfill as possible
it would be beneficial for the University to direct all recycling efforts towards further source
separating recyclable materials. Organic materials represented the most significant amount of the
overall waste-to-landfill sample generated over the waste audit sample collection period, followed
by paper materials.
IMPROVE ORGANICS RECYCLING
52.10% of the landfill waste sample was found to be organic waste material. As organic materials
are the heaviest contributor to overall disposal figures, diverting as much organic waste from the
waste stream as possible will greatly increase the diversion rate and reduce the amount of waste
sent to landfill annually. Organic materials should go into the appropriate recycling containers
provided. A greater diversion rate could be captured by expanding the organics program across
campus to places such as public areas, rather than just a few current select areas. Currently the
Queen’s Centre, JDUC and Duncan McArthur, dining rooms, campus food service outlets are
already participating; and there is a voluntary office organics recycling program that is not
enforced.
IMPROVE PAPER RECYCLING
From the waste audit sample, paper materials contributed to 18.23% of the overall waste to landfill
sample. Coffee cups (28.22%) and mixed recyclable papers (14.68%) accounted for the highest
subcategories of paper materials found in the waste. These items are currently recyclable through
the existing recycling program. It is recommended to communicate that these items are all
recyclable and that they should be placed into the paper recycling stream, with the exception of
paper cups, which should be incorporated into the bottles and cans stream. An information blitz
regarding coffee cup recycling should be displayed in the Stauffer Library, as a large volume of
coffee cups are still being disposed of as waste.
IMPROVE POINT-OF-GENERATION RECYCLING
It is recommended to conduct internal waste assessments throughout the campus on a regular,
unscheduled basis. Staff and students should not be aware of when these assessments are to be
done, to ensure accuracy of results. The goal is to determine which area(s) need improvements.
Continuing to post proper signage, providing plenty of recycling bins and continuing education will
help to improve the source separation of these items and capture recyclable materials. In addition,

Waste Audit Report 2016 Queen’s University- Kingston, ON
77
continue purchasing colour coded waste watcher recycling stations with signage attached.
Distribute across campus with posters created by marketing and communications department.
o Already in place: Duncan McArthur, Goodes, Kingston, JDUC, Queen’s Centre,
Isabel Bader Performing Arts, Ontario Hall, Botterell Hall, Chernoff
o To Receive: Dupuis, Beamish-Munro
SIGNAGE AND EDUCATION
Employee and Student Education
Educational information should be displayed on an ‘Environmental Board’ in every building and
frequently updated to encourage and engage employee and student participation. Posting
information in the area near the recycling receptacles and/or in common areas will show
management initiative and engage employees. While education and training on waste reduction
should be ongoing, formal education should take place sporadically (for example, 1-2 times per
year).
Visitor Education
Clear, visible guidelines and signage are very important to the success of the recycling program.
All areas of the campus should be equipped with appropriate signage to clearly indicate to visitors,
who are not familiar with the program at Queen’s, which materials are accepted in the receptacles
and to remind them of the importance of their involvement in the recycling program. Recycling
guidelines should be posted wherever receptacles and collection containers are stationed.

Waste Audit Report 2016 Queen’s University- Kingston, ON
78
MONITORING AND EVALUATION
One of the keys to a successful recycling program is gathering quantifiable results to follow the
progress of the program over the course of time. Ensure that a waste audit is completed regularly
and keep track of the data results year to year to compare disposal and recycling rates. Receive
monthly diversion reports and display or send out results in a newsletter to reach all employees
to pinpoint where improvements can be made.
It is suggested that waste and recycling disposal areas be monitored so that the number of
receptacles and pick up schedule can be adjusted as necessary. Maintain up-to-date records of
waste diversion initiatives (e.g. diversion charts, educational or promotional efforts etc.) to see if
changes need to be made to the recycling program.
CONTINUAL PROGRAM REVIEW
The success of the existing recycling program should be continually reviewed by facility
management in order to establish goals and monitor improvement over time. This should include
but not be limited to:
The adequacy and accessibility of available bins.
The disposal methods used by employees of the building, and the location of signage or
labels on bins.
The assessment of how materials are being sorted and the potential for new materials to
be recycled as the hauler systems and industry changes.
As always, please post and make available the MOE work plan for all employees, and sign
documents in all applicable areas.

Waste Audit Report 2016 Queen’s University- Kingston, ON
79
6 CONCLUSION
Based on audit figures, Queen’s University generates 3,434,620.00 kg (3,434.62 t) of material
annually, 1,484,770.00 kg (1,484.77 t) of which is sent for recycling and 1,949,850.00 kg
(1,949.85 t) which is disposed of as waste.
In order to address and monitor the effectiveness of the recycling program at Queen’s
University, consider the following suggestions to improve the existing program and efforts of
employees and visitors:
Provide recycling receptacles wherever garbage bins exist so that there are no excuses
for not participating in the recycling program.
Ensure that adequate signage is placed on or above all recycling receptacles and that the
signage remains consistent throughout the building
Education throughout the campus can be promoted through promotional and awareness
events (especially during Earth Month in April and Waste Reduction Week in October).
Provide employees and students with information on recycling procedures and services on
the Sustainability Office website.
The success of these initiatives depends on the involvement of all parties, from management to
employees. The more involved all parties are in the waste reduction and diversion goals of Queen’s
University, the greater the success of the program.

Waste Audit Report 2016 Queen’s University- Kingston, ON
80
MOE Forms
APPENDIX I – WASTE AUDIT SUMMARY SHEET
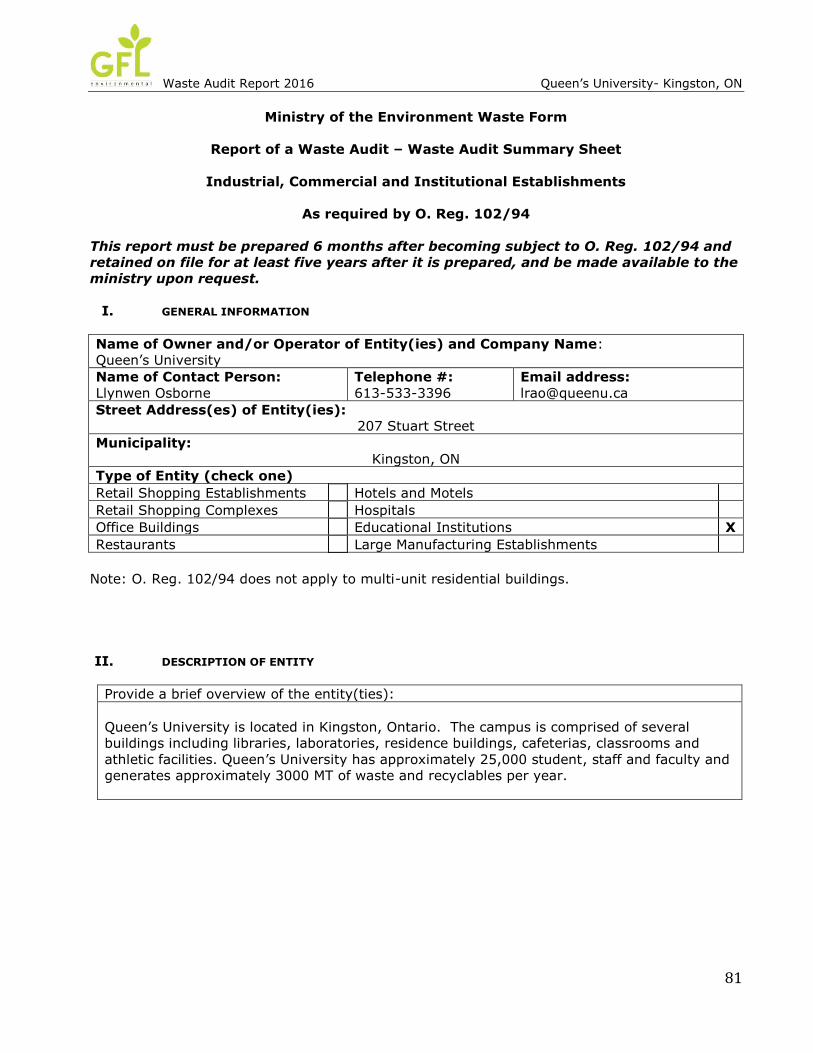
Waste Audit Report 2016 Queen’s University- Kingston, ON
81
Ministry of the Environment Waste Form
Report of a Waste Audit – Waste Audit Summary Sheet
Industrial, Commercial and Institutional Establishments
As required by O. Reg. 102/94
This report must be prepared 6 months after becoming subject to O. Reg. 102/94 and
retained on file for at least five years after it is prepared, and be made available to the
ministry upon request.
I. GENERAL INFORMATION
Name of Owner and/or Operator of Entity(ies) and Company Name:
Queen’s University
Name of Contact Person:
Llynwen Osborne
Telephone #:
613-533-3396
Email address:
Street Address(es) of Entity(ies):
207 Stuart Street
Municipality:
Kingston, ON
Type of Entity (check one)
Retail Shopping Establishments Hotels and Motels
Retail Shopping Complexes Hospitals
Office Buildings Educational Institutions X
Restaurants Large Manufacturing Establishments
Note: O. Reg. 102/94 does not apply to multi-unit residential buildings.
II. DESCRIPTION OF ENTITY
Provide a brief overview of the entity(ties):
Queen’s University is located in Kingston, Ontario. The campus is comprised of several
buildings including libraries, laboratories, residence buildings, cafeterias, classrooms and
athletic facilities. Queen’s University has approximately 25,000 student, staff and faculty and
generates approximately 3000 MT of waste and recyclables per year.

Waste Audit Report 2016 Queen’s University- Kingston, ON
82
III. HOW WASTE IS PRODUCED AND DECISIONS AFFECTING THE PRODUCTION
OF WASTE
Categories of Waste How Is the Waste Produced and What Management
Decisions/Policies Affect Its Production?
Newspaper
The Queen’s Gazette and the Queen’s Journal are printed and
distributed to buildings on campus as well as electronically
available. Material is deposited into designated comingled
container for recycling.
Magazines Generated by participants. Material is deposited into designated
paper only container for recycling.
Cardboard Generated by participants from deliveries/packaging. Cardboard
containers are collected in main compactor and sorted.
Boxboard Generated by participants from packaged products. Material is
deposited into designated comingled container for recycling.
Mixed paper
Generated by participants from office areas, residences and
classrooms. Paper fibres are deposited into designated container
for shredding or recycling.
Molded Pulp Generated by participants from protective packaging. Material is
deposited into designated comingled container for recycling.
Kraft Paper Generated by participants from packaging. Material is deposited
into designated comingled container for recycling.
Other Paper Generated from food packaging. Material is deposited into
designated container for waste.
Coffee Cups
Generated by participants – cups from outside facility, and from
within the facility. Material is deposited into designated
commingled or cans, glass, plastic container for recycling.
Polycoat Containers Generated by participants from food packaging. Material is
deposited into designated comingled container for recycling.
Aseptic Containers Generated by participants from food packaging. Material is
deposited into designated comingled container for recycling.
PETE #1 plastic beverage
bottles and clam shells
Beverage bottles generated by staff, students and guests. There is
a ban the sale of bottled water on the campus. Clam shell
containers are generated in back of house from food packaging.
Material is deposited into designated comingled container for
recycling.
HDPE #2 plastics jugs,
crates, totes and drums
Generated by participants from food/condiment packaging, and
from cleaning products. Containers should be empty before
deposited into designated comingled container for recycling.
LDPE #4 Recyclable Film Generated by participants from packaging. Material is deposited
into designated container for recycling.
PP #5 Generated by participants from food packaging. Material is
deposited into designated comingled container for recycling.
PS #6 (Styrofoam)
Generated by participants from food insulation and packaging for
food items. Material is deposited into designated container for
recycling (cans, glass, plastic stream).
PS #6 (Clear/Hard)
Generated by participants at facility. Material from food packaging,
coffee cup lids and cold beverage cups. Material is deposited into
designated container for recycling.

Waste Audit Report 2016 Queen’s University- Kingston, ON
83
Non-Recyclable Film Generated by participants from packaging and cafeteria. Material
is deposited into designated container for waste.
Rigid Plastics
Generated by participants – cups from outside facility, and from
within the facility. Material is deposited into designated container
for recycling.
Plastic Strapping Generated by participants from food packaging. Material is
deposited into designated comingled container for recycling.
Aluminum Food
/Beverage Cans
Generated by participants from food packaging. Material is
deposited into designated comingled container for recycling.
Steel Food /Beverage
Cans
Beverage bottles generated by staff and guests. Clam shell
containers are generated in back of house from food packaging.
Material is deposited into designated comingled container for
recycling.
Glass Food /Beverage
Containers
Generated by participants from food/condiment packaging, and
from cleaning products. Containers should be empty before
deposited into designated comingled container for recycling.
Food Waste Generated by participants from packaging. Material is deposited
into designated container for recycling.
Tissue/Toweling Generated by participants from food packaging. Material is
deposited into designated comingled container for recycling.
Beverage Liquids
Generated by kitchen staff from food insulation and packaging for
food items. Material is deposited into designated container for
waste.
Animal Bedding Generated by participants. Material is deposited into designated
container for waste.
Latex Gloves Generated by participants. Material is deposited into designated
container for waste.
Textiles Generated by participants. Material is deposited into designated
container for waste.
Textbooks
Generated by participants. Textbooks for Change collection boxes
are provided across the campus for textbook donation to divert
material from landfill.
Vacuum Bag Generated by participants. Material is deposited into designated
container for waste.
Residual Waste
(sweepings)
Generated by participants. Material is deposited into designated
container for waste.
Diapers Generated by participants. Material is deposited into designated
container for waste.
Coffee Pods Generated by participants. Material is deposited into designated
container for waste.
Lab Waste Generated by participants. Material is deposited into designated
container for waste.
Electronics/Appliances
Generated by participants. Material is deposited into designated
collection containers for diversion. Online electronic waste pick up
program in place. Material is sent to e-waste processing facility.
Foam Generated by participants. Material is deposited into designated d
container for waste.
Autoclaved Medical
Waste
Generated by participants. Material is deposited into designated
container for waste.
Sanitary Napkins Generated by participants. Material is deposited into designated
container for waste.

Waste Audit Report 2016 Queen’s University- Kingston, ON
84
IV. MANAGEMENT OF WASTE
Category Waste to be Disposed Reused or Recycled Waste
Newspaper
Participants deposit newsprint into the
recycling bins provided. Majority of
newsprint is provided digitally to
guests.
Magazines Participants deposit magazines into
the recycling bins provided.
Cardboard
Staff flattens all cardboard and
deposits into designated collection
bins for recycling.
Boxboard Staff flattens all boxboard and
deposits into designated bins.
Mixed paper Participants deposit mixed papers into
shredding bins or paper recycling bins.
Molded Pulp
Participants deposit molded pulp
materials into designated recycling
bins.
Kraft Paper
Participants deposit kraft paper
materials into designated recycling
bins.
Other Paper Participants place in
waste bins.
Coffee Cups Participants deposit coffee cups with
lids into designated recycling bins.
Polycoat Containers
Participants deposit polycot cartons
(i.e. milk cartons) into designated
bins.
Aseptic Containers Participants deposit aseptic containers
(i.e. juice boxes) into designated bins.
PETE #1 plastic
beverage bottles and
clam shells
Participants deposit water/soda
bottles, clamshells and other PETE #1
plastics into designated recycling
totes. There is a campus-wide ban on
the sale of bottle water.
HDPE #2 plastics jugs,
crates, totes and drums
Participants deposit into designated
recycling totes and collection
containers.
LDPE #4 Recyclable Film
Participants deposit into designated
recycling totes and collection
containers.
PP #5
Participants deposit into designated
recycling totes and collection
containers.
PS #6 (Styrofoam)
Participants deposit into designated
recycling totes and collection
containers.

Waste Audit Report 2016 Queen’s University- Kingston, ON
85
PS #6 (Clear/Hard)
Participants deposit into designated
recycling totes and collection
containers.
Non-Recyclable Film Participants place in
waste bins.
Rigid Plastics Participants place in
waste bins.
Plastic Strapping Participants deposit plastic strapping
into designated recycling bins.
Aluminum Food
/Beverage Cans
Participants deposit aluminum food
and beverage cans into designated
recycling bins.
Steel Food /Beverage
Cans
Participants deposit steel food and
beverage cans into designated
recycling bins.
Glass Food /Beverage
Containers
Participants deposit glass food and
beverage containers into designated
recycling bins.
Food Waste
Participants deposit food waste into
organic bins in all applicable areas.
Food services staff deposits food
waste from kitchen areas into
designated organic totes.
Tissue/Toweling
Participants deposit tissue and
toweling in organics program from
kitchen and food service areas.
Beverage Liquids
Participants are to deposit remaining
liquids down the drain and place
container into the appropriate
recycling container.
Animal Bedding Participants place in
waste bins.
Latex Gloves Participants place in
waste bins.
Textiles Participants place in
waste bins.
Textbooks
Textbook for Change collection boxes
are provided in buildings on campus
for textbook donation. Textbooks are
also recycled or sold back to the book
store to be re-sold.
Vacuum Bag Participants place in
waste bins.
Residual Waste Participants place in
waste bins.
Diapers Participants place in
waste bins.
Coffee Pods Participants place in
waste bins.
Lab Waste Participants place in
waste bins.

Waste Audit Report 2016 Queen’s University- Kingston, ON
86
Electronics/Appliances
Participants place in designated
collection containers. Online electronic
waste pick up request program in
place. Material is sent to a processing
facility for e-waste recycling.
Foam Participants place in
waste bins.
Autoclaved Medical
Waste
Participants place in
waste bins.
Sanitary Napkins Participants place in
waste bins.

Waste Audit Report 2016 Queen’s University- Kingston, ON
87
V. ESTIMATED QUANTITY OF WASTE PRODUCED ANNUALLY
Queen's University
October 4,5,6/ 2016
Categories of Waste"A" Base Year
(2015)
"B" Current
Year (2016)
"C" Change
(A-B)
"A" Base Year
(2015)
"B" Current
Year (2016)
"C" Change
(A-B)
"A" Base Year
(2015)
"B" Current
Year (2016)
"C" Change
(A-B)
Newspaper - 37.75 37.75 - 37.72 37.72 - 0.03 0.03
Magazines - 12.57 12.57 - 12.57 12.57 - - -
Cardboard - 88.95 88.95 - 62.87 62.87 - 26.08 26.08
Boxboard - 132.45 132.45 - 94.31 94.31 - 38.14 38.14
Mixed Papers - 240.81 240.81 - 188.62 188.62 - 52.19 52.19
Molded Pulp - 14.53 14.53 - 12.57 12.57 - 1.96 1.96
Kraft Paper - 39.18 39.18 - 6.29 6.29 - 32.89 32.89
Other Paper - 60.17 60.17 - - - - 60.17 60.17
Coffee Cups - 276.37 276.37 - 176.04 176.04 - 100.33 100.33
Polycoat Containers - 76.59 76.59 - 37.72 37.72 - 38.87 38.87
Aseptic Containers - 4.82 4.82 - - - - 4.82 4.82
# 1 PETE Soft Drinks - 252.97 252.97 - 215.42 215.42 - 37.55 37.55
# 2 HDPE - 31.66 31.66 - 13.90 13.90 - 17.76 17.76
# 3 PVC - 3.10 3.10 - - - - 3.10 3.10
# 4 LDPE Recyclable Film - 23.37 23.37 - 20.85 20.85 - 2.52 2.52
# 5 PP - 44.60 44.60 - 20.85 20.85 - 23.75 23.75
# 6 PS (Styrofoam) - 17.92 17.92 - - - - 17.92 17.92
# 6 PS (Clear/Hard) - 102.80 102.80 - 76.44 76.44 - 26.36 26.36
# 7 Other - 10.16 10.16 - - - - 10.16 10.16
Non-Recyclable Film - 89.10 89.10 - - - - 89.10 89.10
Rigid Plastics - 63.30 63.30 - - - - 63.30 63.30
Plastic Strapping - 14.39 14.39 - - - - 14.39 14.39
Aluminum Cans - 75.60 75.60 - 61.89 61.89 - 13.71 13.71
Aluminum Foil - 8.87 8.87 - 2.61 2.61 - 6.26 6.26
Aerosal Cans - 2.67 2.67 - - - - 2.67 2.67
Steel - 1.02 1.02 - 0.65 0.65 - 0.37 0.37
Scrap Metal - 89.07 89.07 - 86.28 86.28 - 2.79 2.79
Glass (Clear/ Coloured) - 26.94 26.94 - 21.72 21.72 - 5.22 5.22
Other Glass - 19.02 19.02 - - - - 19.02 19.02
Food Waste - 1,000.34 1,000.34 - 242.50 242.50 - 757.84 757.84
Tissue / Toweling - 239.16 239.16 - 38.44 38.44 - 200.72 200.72
Beverage Liquids - 26.07 26.07 - 8.87 8.87 - 17.20 17.20
Compostables - 46.00 46.00 - 5.93 5.93 - 40.07 40.07
Batteries - 0.06 0.06 - - - - 0.06 0.06
Toner Cartridges - 0.25 0.25 - - - - 0.25 0.25
Lightbulbs - 4.91 4.91 - - - - 4.91 4.91
Book Recycling - 39.71 39.71 - 39.71 39.71 - - -
#1 PETE Water Bottles - 6.12 6.12 - - - - 6.12 6.12
Animal Bedding - 15.95 15.95 - - - - 15.95 15.95
Latex Gloves - 16.59 16.59 - - - - 16.59 16.59
Textiles - 31.41 31.41 - - - - 31.41 31.41
Textbooks - 13.50 13.50 - - - - 13.50 13.50
Vacuum Bag - 3.68 3.68 - - - - 3.68 3.68
Residual Waste - 6.14 6.14 - - - - 6.14 6.14
Diapers - 40.53 40.53 - - - - 40.53 40.53
Coffee Pods - 9.14 9.14 - - - - 9.14 9.14
Lab Waste - 0.03 0.03 - - - - 0.03 0.03
Electronics/Appliances - 7.36 7.36 - - - - 7.36 7.36
Foam - 0.65 0.65 - - - - 0.65 0.65
Autoclaved Medical Waste - 55.23 55.23 - - - - 55.23 55.23
Sanitary Napkins - 11.04 11.04 - - - - 11.04 11.04
- 3,434.61 3,434.61 - 1,484.77 1,484.77 - 1,949.84 1,949.84
Percent Change (C÷A x 100)
* Highlighted items are not currently recyclable through service provider.
Generated Recycled Disposed
ESTIMATED QUANTITY OF WASTE PRODUCED ANNUALLY

Waste Audit Report 2016 Queen’s University- Kingston, ON
88
VI. TO WHICH MATERIALS OR PRODUCTS USED OR SOLD BY ENTITY
CONSIST OF
RECYCLED OR REUSED MATERIALS OR PRODUCTS
1. Do you have a management policy in place that promotes the purchasing and/or use
of materials or products that consist of recycled and/or reused materials or products?
If yes, please describe.
Not at this time.
2. Do you have plans to increase the extent to which materials or products used or sold*
consist of recycled or reused materials or products? If yes, please describe.
Not at this time.
* Information regarding materials or products “sold” that consist of recycled or
reused materials or products is only required from owner(s) of retail shopping
establishments and the owner(s) or operator(s) of large manufacturing
establishments.
Please attach any additional page(s) as required to answer the above questions
I hereby certify that the information provided in this Report of Waste Audit is
complete and correct.
Signature of authorized
official:
Title: Date:

Waste Audit Report 2016 Queen’s University- Kingston, ON
89
MOE Forms
APPENDIX II- REPORT OF WASTE REDUCTION WORK PLAN

Waste Audit Report 2016 Queen’s University- Kingston, ON
90
Ministry of the Environment Waste Form
Report of a Waste Audit
Industrial, Commercial and Institutional Establishments
As required by O. Reg. 102/94
This report must be prepared 6 months after becoming subject to O. Reg. 102/94
and retained on file for at least five years after it is prepared, and be made
available to the ministry upon request.
I. GENERAL INFORMATION
Name of Owner and/or Operator of Entity(ies) and Company Name:
Queen’s University
Name of Contact Person:
Llywen Osborne
Telephone #:
613-533-3396
Email address:
Street Address(es) of Entity(ies):
207 Stuart Street
Municipality:
Kingston, ON
Type of Entity (check one)
Retail Shopping Establishments Hotels and Motels
Retail Shopping Complexes Hospitals
Office Buildings X Educational Institutions
Restaurants Large Manufacturing Establishments
II. DESCRIPTION OF ENTITY
Provide a brief overview of the entity(ties):
Queen’s University is located in Kingston, Ontario. The campus is comprised of several
buildings including libraries, laboratories, residence buildings, cafeterias, classrooms and
athletic facilities. Queen’s University has approximately 25,000 student, staff and faculty and
generates approximately 3000 MT of waste and recyclables per year.

Waste Audit Report 2016 Queen’s University- Kingston, ON
91
III. PLANS TO REDUCE, REUSE AND RECYCLE
Waste Category
Source Separation and 3Rs Program
Newspaper
Reduce: Provide digital copies of newspaper to participants.
Reuse: Newsprint can be reused for moving and shipping as
packaging.
Recycle: Through education and awareness, ensure all participants
understand current recycling programs and initiatives.
Magazines
Reduce: Encourage use of electronic documents only and to think
before purchasing.
Reuse: Magazines are shared in guest common areas.
Recycle: Through education and awareness, ensure all participants
understand current recycling programs and initiatives.
Cardboard
Reduce: Encourage suppliers to provide goods in reusable containers.
Purchase supplies in bulk to avoid excess packaging.
Reuse: Cardboard boxes can be reused for moving and shipping.
Recycle: Through education and awareness, ensure all participants
understand current recycling programs and initiatives.
Boxboard
Reduce: Encourage suppliers to provide goods in reusable containers.
Purchase supplies in bulk to avoid excess packaging.
Reuse: Boxboard can be reused for packaging small goods.
Recycle: Through education and awareness, ensure all participants
understand current recycling programs and initiatives.
Mixed paper
Reduce: Encourage use of electronic documents only and to think
before printing.
Reuse: Reuse one sided documents for other print jobs.
Recycle: Through education and awareness, ensure all participants
understand current recycling programs and initiatives.
Molded Pulp
Reduce: Encourage suppliers to provide goods in reusable containers.
Purchase supplies in bulk to avoid excess packaging.
Reuse: Reuse for packaging and protecting small goods.
Recycle: Through education and awareness, ensure all participants
understand current recycling programs and initiatives.
Kraft Paper
Reduce: Encourage suppliers to provide goods packaged in reusable
products.
Reuse: Reuse for packaging and protecting small goods.
Recycle: Through education and awareness, ensure all participants
understand current recycling programs and initiatives.
Other Paper
Reduce: Encourage suppliers to provide goods packaged in reusable
products. Refuse products packaged in this material.
Reuse: N/A
Recycle: Material is not recyclable. Through education and
awareness, ensure all participants understand current recycling
programs and initiatives.
Coffee Cups
Reduce: Encourage suppliers to provide goods packaged in reusable
products. Refuse products packaged in this material; bring a reusable
mug.

Waste Audit Report 2016 Queen’s University- Kingston, ON
92
Reuse: N/A
Recycle: Through education and awareness, ensure all participants
understand current recycling programs and initiatives.
Polycoat Containers
Reduce: Encourage suppliers to provide goods packaged in reusable
products. Refuse products packaged in this material.
Reuse: N/A
Recycle: Through education and awareness, ensure all participants
understand current recycling programs and initiatives.
PETE #1 plastic
beverage bottles and
clam shells
Reduce: Encourage suppliers to provide goods in bulk to cut down on
amount of material produced. Promote reusable containers to visitors,
students and staff, as there is a campus-wide ban on the sale of
bottled water on campus.
Reuse: Reuse material for water throughout the day.
Recycle: Through education and awareness, ensure all participants
understand current recycling programs and initiatives.
HDPE #2 plastics
jugs, crates, totes
and drums
Reduce: Encourage suppliers to provide goods in bulk to cut down on
amount of material produced.
Reuse: Containers are reused in kitchen areas for collection of organic
waste (i.e. large white tubs).
Recycle: Through education and awareness, ensure all participants
understand current recycling programs and initiatives.
LDPE #4 Recyclable
Film
Reduce: Encourage suppliers to provide goods in bulk to cut down on
amount of material produced.
Reuse: Use plastic bags for other uses such as in back-of house small
garbage containers (i.e. in employee offices/washrooms); use as
protective packaging for shipments.
Recycle: Through education and awareness, ensure all participants
understand current recycling programs and initiatives.
PP #5
Reduce: Encourage suppliers to provide goods in bulk to cut down on
amount of material produced.
Reuse: Reuse container for food or snacks throughout the day.
Recycle: Through education and awareness, ensure all participants
understand current recycling programs and initiatives.
PS #6 (Styrofoam)
Reduce: Encourage suppliers to provide goods packaged in reusable
products. Refuse products packaged in this material.
Reuse: Reuse as protective packaging for shipments.
Recycle: Through education and awareness, ensure all participants
understand current recycling programs and initiatives.
PS #6 (Clear/Hard)
Reduce: Encourage suppliers to provide goods in bulk to cut down on
amount of material produced.
Reuse: N/A
Recycle: Through education and awareness, ensure all participants
understand current recycling programs and initiatives.
Non-Recyclable Film
Reduce: Encourage suppliers to provide goods packaged in reusable
products. Refuse products packaged in this material.
Reuse: Reuse as protective packaging for shipments.
Recycle: Material is not recyclable. Through education and awareness,
ensure all participants understand current recycling programs and
initiatives.
Rigid Plastics Reduce: Encourage suppliers to provide goods packaged in reusable
products. Refuse products packaged in this material.

Waste Audit Report 2016 Queen’s University- Kingston, ON
93
Reuse: N/A
Recycle: Material is not recyclable. Through education and
awareness, ensure all participants understand current recycling
programs and initiatives.
Plastic Strapping
Reduce: Encourage suppliers to provide goods in alterative material,
other than plastic.
Reuse: Reuse current material for shipping/receiving and packaging.
Recycle: Through education and awareness, ensure all participants
understand current recycling programs and initiatives.
Aluminum Food
/Beverage Cans
Reduce: Encourage suppliers to provide goods in bulk to cut down on
amount of material produced.
Reuse: N/A
Recycle: Through education and awareness, ensure all participants
understand current recycling programs and initiatives.
Steel Food /Beverage
Cans
Reduce: Encourage suppliers to provide goods in bulk to cut down on
amount of material produced.
Reuse: N/A
Recycle: Through education and awareness, ensure all participants
understand current recycling programs and initiatives.
Glass Food /Beverage
Containers
Reduce: Encourage suppliers to provide goods in bulk to cut down on
amount of material produced.
Reuse: N/A
Recycle: Through education and awareness, ensure all participants
understand current recycling programs and initiatives.
Food Waste
Reduce: Encourage suppliers to provide goods in bulk to cut down on
amount of material produced.
Reuse: N/A
Recycle: Through education and awareness, ensure all participants
understand current recycling programs and initiatives.
Tissue/Toweling
Reduce: N/A
Reuse: N/A
Recycle: Program in place. Through education and awareness, ensure
all participants understand current recycling programs and initiatives.
Beverage Liquids
Reduce: N/A
Reuse: N/A
Recycle: Program in place. Through education and awareness, ensure
all participants understand current recycling programs and initiatives.
Animal Bedding
Reduce: N/A
Reuse: N/A
Recycle: Material is not recyclable. Through education and
awareness, ensure all participants understand current recycling
programs and initiatives.
Latex Gloves
Reduce: N/A
Reuse: N/A
Recycle: Material is not recyclable. Through education and
awareness, ensure all participants understand current recycling
programs and initiatives.
Textiles Reduce: N/A
Reuse: N/A

Waste Audit Report 2016 Queen’s University- Kingston, ON
94
Recycle: Material is not recyclable. Through education and
awareness, ensure all participants understand current recycling
programs and initiatives.
Textbooks
Reduce: Encourage digital purchase of textbooks and resource
material on campus.
Reuse: Sell to Campus Book Store or TriColor Bookstore or deposit in
Textbooks for Change collection boxes available in buildings on
campus.
Recycle: Hardcover books are recycled once covers are removed; soft
cover are recyclable. Through education and awareness, ensure all
participants understand current recycling programs and initiatives.
Vacuum Bag
Reduce: N/A
Reuse: N/A
Recycle: Material is not recyclable. Through education and
awareness, ensure all participants understand current recycling
programs and initiatives.
Residual Waste
Reduce: N/A
Reuse: N/A
Recycle: Material is not recyclable. Through education and
awareness, ensure all participants understand current recycling
programs and initiatives.
Diapers
Reduce: N/A
Reuse: N/A
Recycle: Material is not recyclable. Through education and
awareness, ensure all participants understand current recycling
programs and initiatives.
Coffee Pods
Reduce: Encourage campus users to purchase alternative coffee
systems to reduce this form of waste or to purchase recyclable coffee
pods.
Reuse: N/A
Recycle: Material is not recyclable. Through education and
awareness, ensure all participants understand current recycling
programs and initiatives.
Lab Waste
Reduce: N/A
Reuse: N/A
Recycle: Material is not recyclable. Through education and
awareness, ensure all participants understand current recycling
programs and initiatives.
Electronics/Appliances
Reduce: Have broken material repaired before considering disposal.
Reuse: If repairable, repurpose equipment or donate to a cause. Also,
there is a furniture use program in place on campus, as well as an
online item exchange network.
Recycle: Through education and awareness, ensure all participants
understand current recycling programs and initiatives.
Foam
Reduce: N/A
Reuse: N/A
Recycle: Material is not recyclable. Through education and
awareness, ensure all participants understand current recycling
programs and initiatives.
Autoclaved Medical
Waste
Reduce: N/A
Reuse: N/A
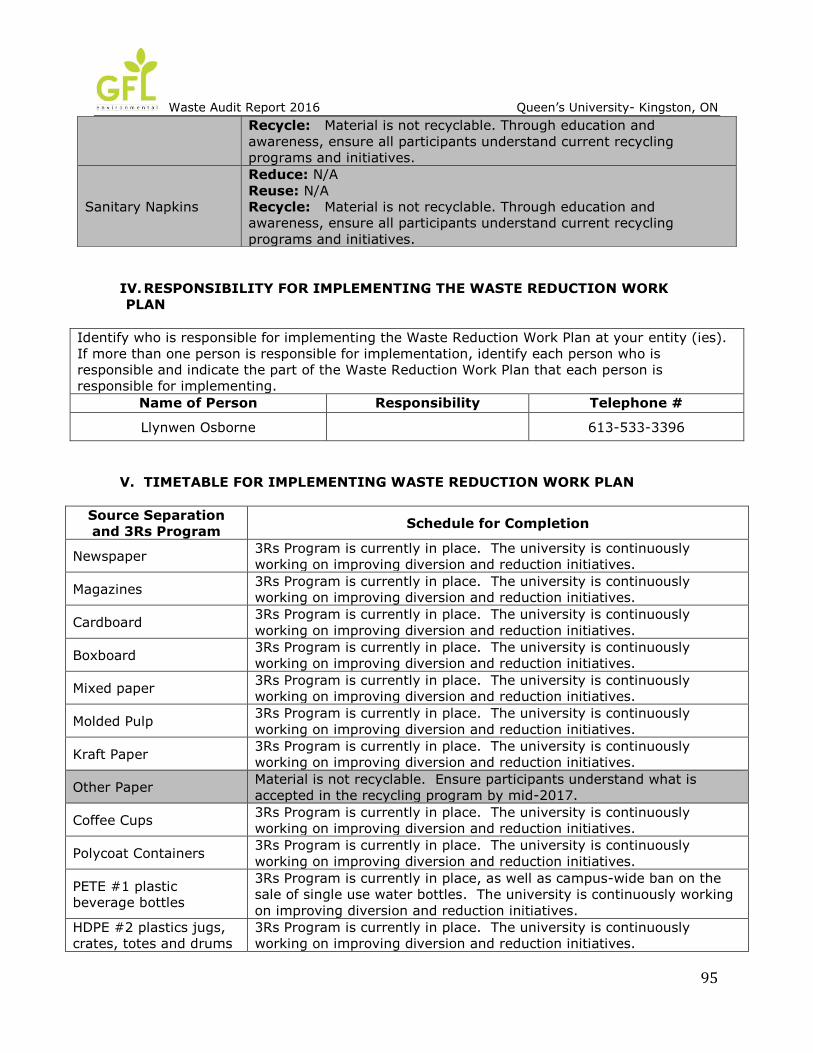
Waste Audit Report 2016 Queen’s University- Kingston, ON
95
IV. RESPONSIBILITY FOR IMPLEMENTING THE WASTE REDUCTION WORK
PLAN
Identify who is responsible for implementing the Waste Reduction Work Plan at your entity (ies).
If more than one person is responsible for implementation, identify each person who is
responsible and indicate the part of the Waste Reduction Work Plan that each person is
responsible for implementing.
Name of Person Responsibility Telephone #
Llynwen Osborne 613-533-3396
V. TIMETABLE FOR IMPLEMENTING WASTE REDUCTION WORK PLAN
Source Separation
and 3Rs Program Schedule for Completion
Newspaper 3Rs Program is currently in place. The university is continuously
working on improving diversion and reduction initiatives.
Magazines 3Rs Program is currently in place. The university is continuously
working on improving diversion and reduction initiatives.
Cardboard 3Rs Program is currently in place. The university is continuously
working on improving diversion and reduction initiatives.
Boxboard 3Rs Program is currently in place. The university is continuously
working on improving diversion and reduction initiatives.
Mixed paper 3Rs Program is currently in place. The university is continuously
working on improving diversion and reduction initiatives.
Molded Pulp 3Rs Program is currently in place. The university is continuously
working on improving diversion and reduction initiatives.
Kraft Paper 3Rs Program is currently in place. The university is continuously
working on improving diversion and reduction initiatives.
Other Paper Material is not recyclable. Ensure participants understand what is
accepted in the recycling program by mid-2017.
Coffee Cups 3Rs Program is currently in place. The university is continuously
working on improving diversion and reduction initiatives.
Polycoat Containers 3Rs Program is currently in place. The university is continuously
working on improving diversion and reduction initiatives.
PETE #1 plastic
beverage bottles
3Rs Program is currently in place, as well as campus-wide ban on the
sale of single use water bottles. The university is continuously working
on improving diversion and reduction initiatives. HDPE #2 plastics jugs,
crates, totes and drums
3Rs Program is currently in place. The university is continuously
working on improving diversion and reduction initiatives.
Recycle: Material is not recyclable. Through education and
awareness, ensure all participants understand current recycling
programs and initiatives.
Sanitary Napkins
Reduce: N/A
Reuse: N/A
Recycle: Material is not recyclable. Through education and
awareness, ensure all participants understand current recycling
programs and initiatives.

Waste Audit Report 2016 Queen’s University- Kingston, ON
96
LDPE #4 Recyclable Film 3Rs Program is currently in place. The university is continuously
working on improving diversion and reduction initiatives.
PP #5 3Rs Program is currently in place. The university is continuously
working on improving diversion and reduction initiatives.
PS #6 (clear/hard) 3Rs Program is currently in place. The facility is continuously working
on improving diversion and reduction initiatives.
PS #6 (Styrofoam) 3Rs Program is currently in place. The university is continuously
working on improving diversion and reduction initiatives.
Rigid Plastics Material is not recyclable. Ensure participants understand what is
accepted in the recycling program by mid-2017.
Non- recyclable film Material is not recyclable. Ensure participants understand what is
accepted in the recycling program by mid-2017.
Plastic Strapping 3Rs Program is currently in place. The university is continuously
working on improving diversion and reduction initiatives. Aluminum Food
/Beverage Cans
3Rs Program is currently in place. The university is continuously
working on improving diversion and reduction initiatives. Steel Food /Beverage
Cans
3Rs Program is currently in place. The university is continuously
working on improving diversion and reduction initiatives. Glass Food /Beverage
Containers
3Rs Program is currently in place. The university is continuously
working on improving diversion and reduction initiatives.
Food Waste 3Rs Program is currently in place. The university is continuously
working on improving diversion and reduction initiatives.
Animal Bedding Material is not recyclable. Ensure participants understand what is
accepted in the recycling program by mid-2017.
Latex Gloves Material is not recyclable. Ensure participants understand what is
accepted in the recycling program by mid-2017.
Textiles Material is not recyclable. Ensure participants understand what is
accepted in the recycling program by mid-2017.
Textbooks 3Rs Program is currently in place. The university is continuously
working on improving diversion and reduction initiatives.
Vacuum Bag Material is not recyclable. Ensure participants understand what is
accepted in the recycling program by mid-2017.
Residual Waste Material is not recyclable. Ensure participants understand what is
accepted in the recycling program by mid-2017.
Diapers Material is not recyclable. Ensure participants understand what is
accepted in the recycling program by mid-2017.
Coffee Pods Material is not recyclable. Ensure participants understand what is
accepted in the recycling program by mid-2017.
Lab Waste Material is not recyclable. Ensure participants understand what is
accepted in the recycling program by mid-2017.
Electronics/Appliances 3Rs Program is currently in place. The university is continuously
working on improving diversion and reduction initiatives.
Foam Material is not recyclable. Ensure participants understand what is
accepted in the recycling program by mid-2017.
Autoclaved Medical
Waste
Material is not recyclable. Ensure participants understand what is
accepted in the recycling program by mid-2017.
Sanitary Napkins Material is not recyclable. Ensure participants understand what is
accepted in the recycling program by mid-2017.

Waste Audit Report 2016 Queen’s University- Kingston, ON
97
VI. COMMUNICATION TO STAFF, CUSTOMERS, GUESTS AND VISITORS
A copy of the Waste Reduction Work Plan will be posted in an area where most employees will see
it and will be made available to employees upon request.
To ensure all participants in the recycling program understand how to properly dispose of materials,
all campus buildings are being audited to ensure the availability, visibility and accessibility of
recycling stations.

Waste Audit Report 2016 Queen’s University- Kingston, ON
98
VII. ESTIMATED WASTE PRODUCED BY MATERIAL TYPE AND THE PROJECTED
AMOUNT TO BE DIVERTED BY THE 3 Rs
Material Categories
(as stated in Part III)
Estimated
Annual
Waste Produced
(tonnes)
Name of Proposed
3Rs Program (as stated in Part III)
Projections to Reduce,
Reuse or Recycle Waste (tonnes)
Estimated
Annual Amount to
be Diverted
(%)
Reduce Reuse Recycle
Example: Fine Paper
1.8 t Fine Paper 3Rs
Program 200 t 100 t 1.2 t 60%
Newspaper 37.75 Mixed Paper Fibres Recycling
22.65 60.00
Magazines 12.57 Mixed Paper Fibres Recycling
7.54 60.00
Cardboard 88.95 Mixed Paper Fibres Recycling
53.37 60.00
Boxboard 132.45 Mixed Paper Fibres Recycling
79.47 60.00
Mixed Papers 240.81 Mixed Paper Fibres Recycling
144.49 60.00
Molded Pulp 14.53 Mixed Paper Fibres Recycling
8.72 60.00
Kraft Paper 39.18 Mixed Paper Fibres Recycling
23.51 60.00
Other Paper 60.17 Waste 6.02 10.00
Coffee Cups 276.37 Mixed Paper Fibres Recycling
165.82 60.00
Polycoat Containers 76.59 Mixed Paper Fibres Recycling
45.96 60.00
Aseptic Containers 4.82 Mixed Paper Fibres Recycling
2.89 60.00
# 1 PETE Soft Drinks 252.97 Commingled Recycling 151.78 60.00
# 2 HDPE 31.66 Commingled Recycling 19.00 60.00
# 3 PVC 3.10 Waste 0.31 10.00
# 4 LDPE Recyclable Film
23.37 Commingled Recycling
14.02 60.00
# 5 PP 44.60 Commingled Recycling 26.76 60.00
# 6 PS (Styrofoam) 17.92 Commingled Recycling 10.75 60.00
# 6 PS (Clear/Hard) 102.80 Commingled Recycling 61.68 60.00
# 7 Other 10.16 Waste 1.02 10.00
Non-Recyclable Film 89.10 Waste 8.91 10.00
Rigid Plastics 63.30 Waste 6.33 10.00
Plastic Strapping 14.39 Commingled Recycling 8.63 60.00
Aluminum Cans 75.60 Commingled Recycling 45.36 60.00
Aluminum Foil 8.87 Commingled Recycling 5.32 60.00
Aerosol Cans 2.67 Commingled Recycling 1.60 60.00
Steel 1.02 Commingled Recycling 0.61 60.00

Waste Audit Report 2016 Queen’s University- Kingston, ON
99
* Estimated Waste Produced = Waste Diverted (3Rs) + Waste Disposed ** Estimated Waste Diversion Rate = Amount of Waste Diverted (3Rs) ÷ Estimated Waste Produced x 100%
I hereby certify that the information provided in this Waste Reduction Work Plan is complete and correct.
Signature of authorized
official:
Title: Date:
Scrap Metal 89.07 Commingled Recycling 53.44 60.00
Glass (Clear/ Coloured)
26.94 Commingled Recycling
16.16 60.00
Other Glass 19.02 Commingled Recycling 1.90 10.00
Food Waste 1,000.34 Organics Recycling 600.20 60.00
Tissue / Toweling 239.16 Organics Recycling 143.50 60.00
Beverage Liquids 26.07 Organics Recycling 15.64 60.00
Compostable Packaging
46.00 Organics Recycling
27.60 60.00
Batteries 0.06 Alternative Diversion Program
0.04 60.00
Toner Cartridges 0.25 Alternative Diversion Program
0.15 60.00
Lightbulbs 4.91 Alternative Diversion Program
2.95 60.00
Book Recycling 39.71 Alternative Diversion Program
23.83 23.83 60.00
#1 PETE Water Bottles
6.12 Commingled Recycling
3.67 60.00
Animal Bedding 15.95 Waste 1.60 10.00
Latex Gloves 16.59 Waste 1.66 10.00
Textiles 31.41 Alternative Diversion Program
3.14 10.00
Textbooks 13.50 Alternative Diversion Program
8.77 60.00
Vacuum Bag 3.68 Waste 0.37 10.00
Residual Waste 6.14 Waste 0.61 10.00
Diapers 40.53 Waste 4.05 10.00
Coffee Pods 9.14 Alternative Diversion Program
0.91 10.00
Lab Waste 0.03 Waste 0.00 10.00
Electronics/Appliances
7.36 Alternative Diversion Program
0.74 10.00
Foam 0.65 Waste 0.06 10.00
Autoclaved Medical Waste
55.23 Waste
5.52 10.00
Sanitary Napkins 11.04 Waste 1.10 22.65 10.00

Waste Audit Report 2016 Queen’s University- Kingston, ON
100
APPENDIX III – LIST OF AUDITED BUILDINGS
The following is a listing of the groupings of different types of buildings and areas on the
Queen’s campus. The buildings identified in brackets are the buildings/areas that were
audited during the on-site, campus-wide waste audit.
Group 1: Residences (John Orr Tower and An Clachan #06-12 (west campus housing))
Group 2: Offices (Barrie Street Offices)
Group 3: Medical Offices, Offices, Labs (LaSalle Building, Cancer Research, Louise D.
Acton)
Group 4: Stores (not audited)
Group 5: Central Heating Plant (not audited)
Group 6: Conference Centre (Donald Gordon Centre, not audited)
Group 7: Large Auditorium (Grant Hall, not audited)
Group 8: Library; offices (Stauffer Library)
Group 9: Offices (Fleming Hall/ Pollock Wing, Gordon Hall, Richardson Hall, Rideau
Building)
Group 10: Offices, Classrooms (Dunning Hall, Kingston Hall)
Group 11: Offices, Classrooms, Labs (Chernoff Hall, Dupuis Hall, Bruce/Miller, School of
Kinesiology)
Group 12: Offices, meeting rooms, food outlets, classrooms, labs (Mackintosh-Corry
Hall, Botterell Hall, Beamish Munro Hall, Goodes Hall)
Group 13: Offices, classrooms, labs, library (Duncan McArthur Hall, not audited)
Group 14: Offices, meeting rooms, food outlets, gyms, locker rooms, underground
parking (Queen’s Centre, ARC and SLC each audited separately; John Deutsch University
Centre, Campus Bookstore)
Group 15: N/A
Group 16: Outdoor stadium (Richardson Stadium, not audited)
Group 17: Underground parking (Tindall Field/Union Street garage)
Group 18: Residence with no food service (Leggett Hall, Brant House)
Group 19: Residence with food service (Leonard Hall dining room)
Group 20: Residence with food service, offices (Victoria Hall)
Group 21: Outdoor waste containers
Group 22: Union Street Daycare

Waste Audit Report 2016 Queen’s University- Kingston, ON
101
APPENDIX IV – PHOTOS FROM WASTE AUDIT

Waste Audit Report 2016 Queen’s University- Kingston, ON
102

Waste Audit Report 2016 Queen’s University- Kingston, ON
103

Waste Audit Report 2016 Queen’s University- Kingston, ON
104

Waste Audit Report 2016 Queen’s University- Kingston, ON
105

Waste Audit Report 2016 Queen’s University- Kingston, ON
106

Waste Audit Report 2016 Queen’s University- Kingston, ON
107

Waste Audit Report 2016 Queen’s University- Kingston, ON
108

Waste Audit Report 2016 Queen’s University- Kingston, ON
109
Leonard Kitchen

Waste Audit Report 2016 Queen’s University- Kingston, ON
110
Mackintosh-Corry Hall

Waste Audit Report 2016 Queen’s University- Kingston, ON
111

Waste Audit Report 2016 Queen’s University- Kingston, ON
112

Waste Audit Report 2016 Queen’s University- Kingston, ON
113