Embed Size (px)
Citation preview
PREMIER GATEWAY SECONDARY PLAN
WATER AND WASTEWATER SERVICING
FUNCTIONAL SERVICING PLAN
Town of Halton Hills
Submitted to: Macaulay Shiomi Howson Inc.
Submitted by: Amec Foster Wheeler Environment & Infrastructure, a Division of Amec Foster Wheeler Americas Limited
3450 Harvester Road, Suite 100 Burlington, ON L7N 3W5
Tel: (905) 335-2353 Fax: (905) 335-1414
June 2017 Project No. TP115042

Premier Gateway Secondary Plan Lands Amec Foster Wheeler Water and Wastewater Functional Servicing Plan – Halton Hills Environment & Infrastructure
TABLE OF CONTENTS
Section ............................................................................................................................ Page No.
1. INTRODUCTION...............................................................................................................1 1.1 Study Area ........................................................................................................................ 1 1.2 Existing Conditions and Land Use ....................................................................................2 1.3 Planning Context............................................................................................................... 2 1.4 Methodology...................................................................................................................... 3 2. WASTEWATER SERVICING EVALUATION ...................................................................5 2.1 Approach to Wastewater Servicing ...................................................................................5 2.2 Existing Wastewater Services...........................................................................................5 2.3 Demand Evaluation...........................................................................................................8 2.4 Proposed Wastewater Servicing .......................................................................................9 3. WATER SERVICING EVALUATION ..............................................................................11 3.1 Approach to Water Servicing ..........................................................................................11 3.2 Existing Water Services ..................................................................................................11 3.3 Demand Evaluation.........................................................................................................14 3.4 Water System Evaluation................................................................................................15 3.5 Proposed Water Servicing Plan ......................................................................................16 4. CONCLUSIONS AND RECOMMENDATIONS ..............................................................17
List of Tables
Table 3.1 Water System Design Criteria………………………………………………………………………..14 Table 3.2 Water Demand Estimates…………………………………………………………………………….15
List of Figures
Figure 1-1 Study Area ................................................................................................................................. 1 Figure 1-2 Elevation Contours .................................................................................................................... 2 Figure 1-3 Land Use Plan for Premier Gateway ......................................................................................... 3 Figure 2-1 Local Wastewater Collection System Schematic ...................................................................... 6 Figure 2-2 Existing Wastewater Services ................................................................................................... 7 Figure 2-3 Halton Region Planning Context – Premier Gateway Wastewater Collection System ............. 8 Figure 2-4 Proposed Wastewater Servicing Concept ............................................................................... 10 Figure 3-1 Existing and Planned Water Services in and Around the Subject Lands ................................ 12 Figure 3-2 Existing and Planned Water Services in South Halton ........................................................... 13 Figure 3-3 Proposed Water Servicing Plan ............................................................................................... 16
List of Appendices
Appendix A Planning Context Inputs Appendix B Wastewater Evaluation Appendix C Water Evaluation
Amec Foster Wheeler Environment & Infrastructure is committed to achieving sustainability through balancing economic growth, social responsibility and environmental protection.
Learn more at: http://amecfw.com/aboutus/sustainability.htm.
Table of Contents - i
Premier Gateway Secondary Plan Lands Amec Foster Wheeler Water and Wastewater Functional Servicing Plan – Halton Hills Environment & Infrastructure
1. INTRODUCTION
Amec Foster Wheeler was retained by Macaulay Shiomi Howson as a sub-consultant to prepare a Functional Servicing Plan for the Premier Gateway Secondary Plan (PGSP) Lands in the Town of Halton Hills.
The purpose of this report is to review the existing water and wastewater services accessible to the site, confirm their capacity, and describe servicing concepts for the site. The analysis of the water and wastewater services has been based on the water and wastewater Halton Region’s hydraulic models. The servicing concepts are prepared in accordance with the land use and transportation planning framework for the PGSP Lands.
1.1 Study Area
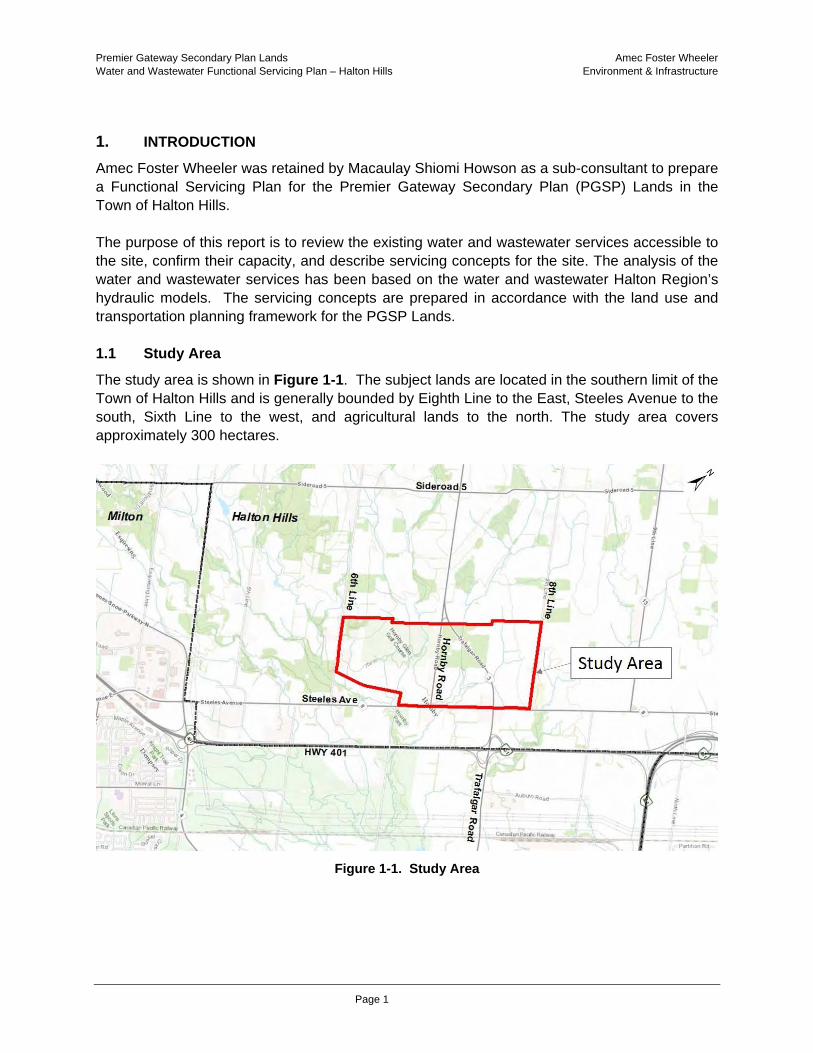
The study area is shown in Figure 1-1. The subject lands are located in the southern limit of the Town of Halton Hills and is generally bounded by Eighth Line to the East, Steeles Avenue to the south, Sixth Line to the west, and agricultural lands to the north. The study area covers approximately 300 hectares.
Figure 1-1. Study Area
Page 1

Premier Gateway Secondary Plan Lands Amec Foster Wheeler Water and Wastewater Functional Servicing Plan – Halton Hills Environment & Infrastructure
1.2 Existing Conditions and Land Use
Current land uses within the study area are primarily agricultural, and woodlot. The Hornby Glen Golf Course is in the north-west quadrant of the site. There are 23 residential properties along Hornby Road, 19 residential properties along Sixth Line, four residential properties along Eighth Line, and a few residential and commercial properties along Steeles Avenue within the study area.
The site slopes from north-west to south-east, and from north-east to south-west. The developable lands range in elevation approximately 230 m at the north-west corner of the study area to approximately 194 m in the south part of the study area. The elevation contours are presented in Figure 1-2.
Figure 1-2. Elevation Contours
1.3 Planning Context
This Functional Servicing Plan is based on a planning concept developed for the Premier Gateway Lands and provided to Amec Foster Wheeler March 2017.
The planned land use for Premier Gateway is shown in Figure 1-3.
The new lands are designated as employment lands with a proposed employment population of 8307.
Background material for the Planning Context Inputs is included in Appendix A.
Page 2

Premier Gateway Secondary Plan Lands Amec Foster Wheeler Water and Wastewater Functional Servicing Plan – Halton Hills Environment & Infrastructure
Figure 1-3. Land Use Plan for Premier Gateway
1.4 Methodology
The analysis is based on Halton Region’s most recent water and wastewater models as provided in February 2017. The Halton Region Planning Model is developed and updated within the Sustainable Halton Master Planning process for the Region’s water and wastewater infrastructure. This information along with existing contour mapping and existing wastewater collection and water distribution system forms the basis of the existing water and wastewater servicing, as well as an understanding of the planned projects to 2031.
The planning and design of water and wastewater infrastructure followed recognized standards and planning documents including:
Design Guidelines for Sewage Works, MOE, 2008; Design Guidelines for Drinking Water Systems, MOE, 2008; Region of Halton Water and Wastewater Facilities Design Manual (last updated
January 2012); Region of Halton Water and Wastewater Linear Design Manual (last updated April 2015); Sustainable Halton Water and Wastewater Master Plan, 2011; Water and Wastewater Model provided by Halton Region:
o InfoWater – Updated 13 May 2016 o InfoSewer – Updated 27 September 2016.
Page 3

Premier Gateway Secondary Plan Lands Amec Foster Wheeler Water and Wastewater Functional Servicing Plan – Halton Hills Environment & Infrastructure
The following are the key steps to developing a servicing strategy for the PGSP:
1. Assess the available capacity of existing system using the provided model. 2. Identify options for extending services into the Service Area 3. Review the performance of the proposed servicing options. 4. Develop preferred strategy
Page 4

Premier Gateway Secondary Plan Lands Amec Foster Wheeler Water and Wastewater Functional Servicing Plan – Halton Hills Environment & Infrastructure
2. WASTEWATER SERVICING EVALUATION
2.1 Approach to Wastewater Servicing
The Halton Region wastewater model provides the following information that is used to confirm the system’s available capacity:
Physical characteristics of sewer system, the sewer system from Premier Gateway study area to the Mid-Halton wastewater treatment plant, i.e. size, diameter, elevations and slopes of the sewer system;
Baseline and projected demands on the wastewater collection system. The baseline and projected demands are included as peak wet weather flows for 2016 (Baseline from last Master Plan Update,) 2021, 2026 and 2031 future conditions;
Modelled performance of baseline and projected demands through the wastewater treatment system.
The following steps were undertaken to evaluate the wastewater capacity:
1. Evaluate suitable connection points to the system; 2. Utilize Halton Model to verify downstream trunk conveyance capacity; 3. Add demands to the 2031 wet weather flow model associated with the demand in the
built-out Premier Gateway Study Area and run model to confirm hydraulic conditions with these flows.
The planning scenarios utilized in Halton’s wastewater model have a steady-state flow generation approach. Actual flow dynamics in the system may vary due to the flow attenuation that occurs with the storage within the system, and due to the variability associated with inflow & infiltration (I&I). The I&I component may vary with time.
The steady-state approach to demand evaluation is conservative and allows for high-level planning of infrastructure development. This approach is suitable for the review of steady state peak downstream capacity for this project. The model is used to establish peak flow servicing but is limited for evaluating other impacts such as: inflow infiltration, basement flooding, and overflow issues. These issues can be better understood with a more comprehensive time varying model that is calibrated with actual observed flow and rainfall data.
2.2 Existing Wastewater Services
The lands are within the Mid-Halton Wastewater Treatment Plant Service area. The primary receiving system is described in this report as the Steeles Avenue West Sewer System. There is an approximate available capacity of 210 L/s in this system for the Premier Gateway Lands, this available capacity will increase to 400 L/s with the planned diversion of flows from HHPS #3. A portion of this capacity can be diverted in the future to what is described as the Eighth Line / Trafalgar Trunk Sewer to Georgetown. Details on the planning flows and capacities taken from information in the Halton Model are provided in Appendix B.
Page 5

Premier Gateway Secondary Plan Lands Amec Foster Wheeler Water and Wastewater Functional Servicing Plan – Halton Hills Environment & Infrastructure
The evaluation of existing conditions is presented schematically in Figure 2-1 and shown in Plan View in Figure 2-2. The overall context of the Region’s wastewater collection system is given in Figure 2-3. The evaluation of the existing capacities is based on the pipe dimensions and slopes as shown in the Halton model. The forcemain capacities are evaluated based on the pipe size and the maximum permissible velocity. The pump capacities are shown as per the Halton Region model.
Existing System Issues
The following issues are noted from the review of the Halton Planning model:
1. Pump capacities for HHPS #2 are higher than the receiving forcemain. At this time it is not known whether this is a real issue or simply a model coding issue.
2. Planned design flows along Steeles Sewer exceed the full pipe capacity flow in bottleneck areas with low slope. Note that flows higher than the full pipe capacity can be conveyed with minor surcharging. Given that the sewers in these areas are not connected to basements, this may be acceptable. For the purpose of this study, a limiting capacity of 400 L/s is assigned to the Steeles Avenue Sewer System based on the characteristics of the existing sewers (size and slopes).
3. The planning design flows in the Halton model were provided without the sewershed and population tables. The existing flows are given based on flows shown directly in the model. Flows shown are taken from the flows shown in the gravity pipes in the model runs as shown in Appendix B.
Figure 2-1 Local Wastewater Collection System Schematic
Page 6
Premier Gateway Secondary Plan Lands Amec Foster Wheeler Water and Wastewater Functional Servicing Plan – Halton Hills Environment & Infrastructure
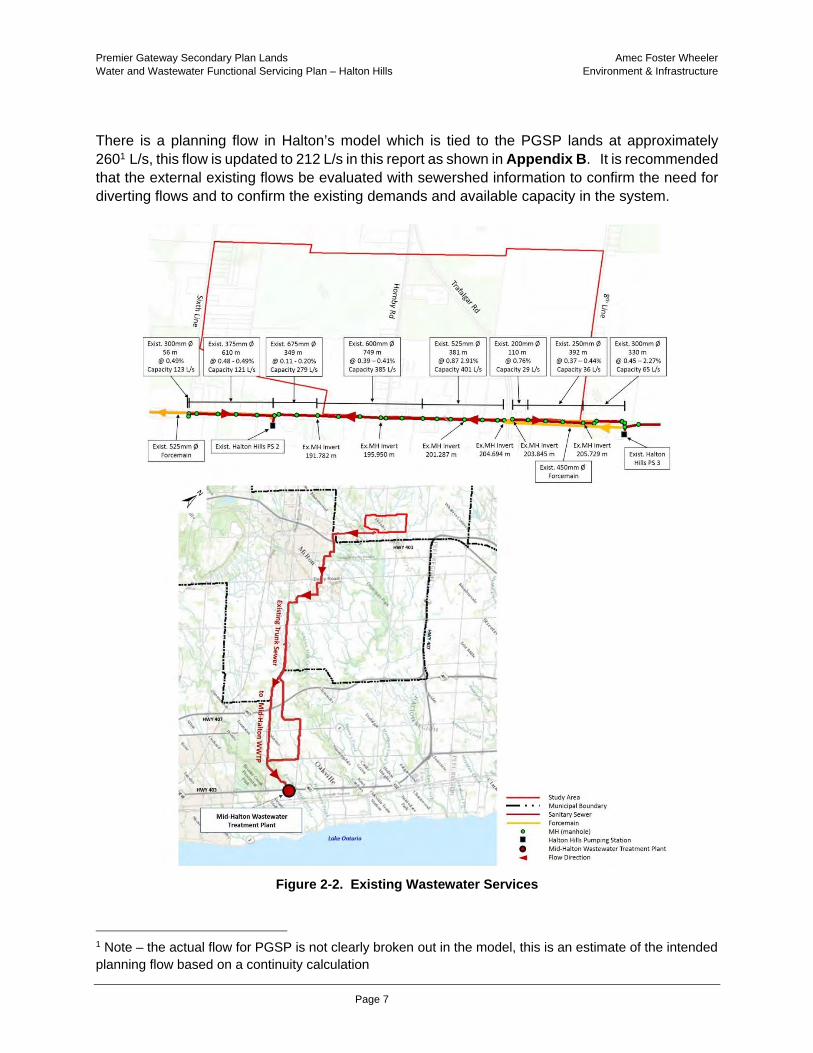
There is a planning flow in Halton’s model which is tied to the PGSP lands at approximately 2601 L/s, this flow is updated to 212 L/s in this report as shown in Appendix B. It is recommended that the external existing flows be evaluated with sewershed information to confirm the need for diverting flows and to confirm the existing demands and available capacity in the system.
Figure 2-2. Existing Wastewater Services
1 Note – the actual flow for PGSP is not clearly broken out in the model, this is an estimate of the intended planning flow based on a continuity calculation
Page 7

Premier Gateway Secondary Plan Lands Amec Foster Wheeler Water and Wastewater Functional Servicing Plan – Halton Hills Environment & Infrastructure
Figure 2-3. Halton Region Planning Context – Premier Gateway Wastewater Collection System
2.3 Demand Evaluation
The design flow for the Premier Gateway development is estimated based on Halton’s design criteria as follows:
Premier Gateway - Equivalent Population Estimate - 125 persons/ha (light industrial), 90 persons/ha (commercial), 55 persons/ha (prop. employment which permits exist. residential) yield a total service population of 21,326 for the proposed development of Premier Gateway.
Page 8
Premier Gateway Secondary Plan Lands Amec Foster Wheeler Water and Wastewater Functional Servicing Plan – Halton Hills Environment & Infrastructure
Note that this method provides a conservative flow estimate as the population exceeds the planning population estimates of 8307 included in Appendix A.
Population Based Flow: 275 L/person-day Peaking Factor: Modified Harmon Peak Factor Inflow Infiltration Allowance: 0.28 L/s-ha
This evaluation provides a conservative estimate as it includes the full catchment area as contributing to inflow infiltration as well as a conservative population estimate.
The total estimated demand from the Premier Gateway Lands is 212 L/s. The calculation is provided in Appendix B. The demand associated with the lesser population is 134 L/s.
The design of the local sewer system in this evaluation is based on the higher flow. Limits on the receiving sewers can be evaluated based on a reduced flow if required.
2.4 Proposed Wastewater Servicing
A wastewater servicing plan consisting of a sewer network along the proposed roads and outletting to the Steeles Avenue Sewer System has been conceptually designed and is shown in Figure 2-4. A review of the topography confirms that these connections can be completed by gravity to the connection points as shown in the figure.
The detailed implementation needs to consider the following:
1. A full review of the external sewersheds to confirm / or reduce the flows in Halton’s Planning model to within the full pipe capacity flow, and/or a hydraulic grade line based – risk review to verify potential impacts on buildings / basements that may be affected by the surcharging resulting from the flows in the Steeles Avenue Sewer;
2. The ultimate flow in the Steeles Avenue Sewer System can be reduced by diverting a portion of it through the planned Eighth Line / Trafalgar sewer system.
Page 9

Premier Gateway Secondary Plan Lands Amec Foster Wheeler Water and Wastewater Functional Servicing Plan – Halton Hills Environment & Infrastructure
Figure 2-4. Proposed Wastewater Servicing Concept
The available capacity (210 L/s) is sufficient for servicing 90% of the demand associated with the proposed Premier Gateway Secondary Plan (212 L/s).
Page 10
Premier Gateway Secondary Plan Lands Amec Foster Wheeler Water and Wastewater Functional Servicing Plan – Halton Hills Environment & Infrastructure
3. WATER SERVICING EVALUATION
3.1 Approach to Water Servicing
The demands associated with the PGSP were estimated for design conditions including average day demand, peak hourly demand, as well as max day with fire scenarios.
A review of the existing infrastructure and connection points to Milton M5L Zone were identified.
A system evaluation was conducted to evaluate how the planned system can support the demands associated with the proposed development of the PGSP. This includes confirming the pressure zone requirements, storage, and levels of service for average day, peak hourly, and fire flow conditions.
A preferred servicing plan, which provides the watermain infrastructure within the proposed road alignments for the PGSP was provided. The new layout supports the level of service provided for in the Halton Region Planning model while re-aligning infrastructure along the proposed Rights of Way. Opportunities for system improvement and optimization are provided where practical.
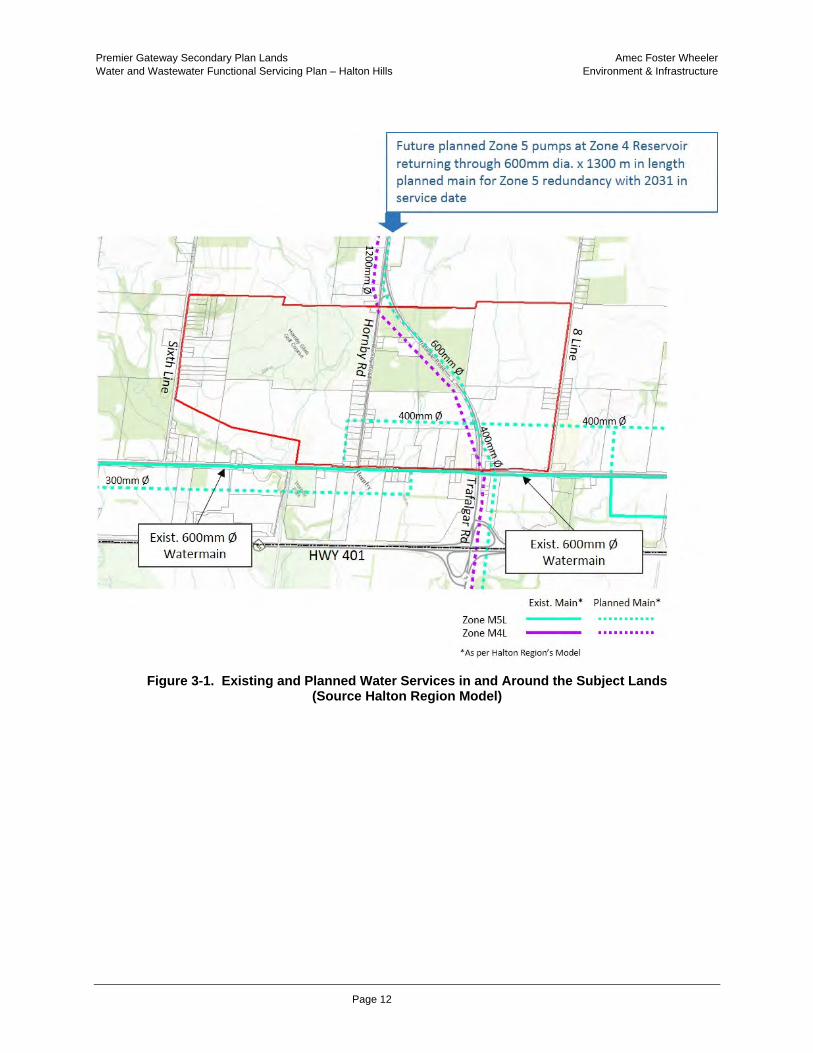
3.2 Existing Water Services
The PGSP lands are within the Milton Lake-based Water Supply System with Pressure Zone M5L. Water to pressure zone M5L is pumped from Oakville Zone 01 through Kitchen Reservoir and pumping station. The lands are currently accessible to Zone 5 watermains to the south. Zone M5L is serviced by a storage system which includes a 20 ML reservoir and integrates with the storage in other zones.
Currently the Milton M5L pressure zone is supplied by the water treatment plants at Lake Ontario and pumped through a series of pumping stations and reservoirs north to Milton.
The Halton planning context for the water distribution system development is shown in Figure 3-1 and in Figure 3-2.
Page 11
Premier Gateway Secondary Plan Lands Amec Foster Wheeler Water and Wastewater Functional Servicing Plan – Halton Hills Environment & Infrastructure
Figure 3-1. Existing and Planned Water Services in and Around the Subject Lands (Source Halton Region Model)
Page 12

Premier Gateway Secondary Plan Lands Amec Foster Wheeler Water and Wastewater Functional Servicing Plan – Halton Hills Environment & Infrastructure
Figure 3-2. Existing and Planned Water Services in South Halton (Source - Halton Region Model)
Page 13
Premier Gateway Secondary Plan Lands Amec Foster Wheeler Water and Wastewater Functional Servicing Plan – Halton Hills Environment & Infrastructure
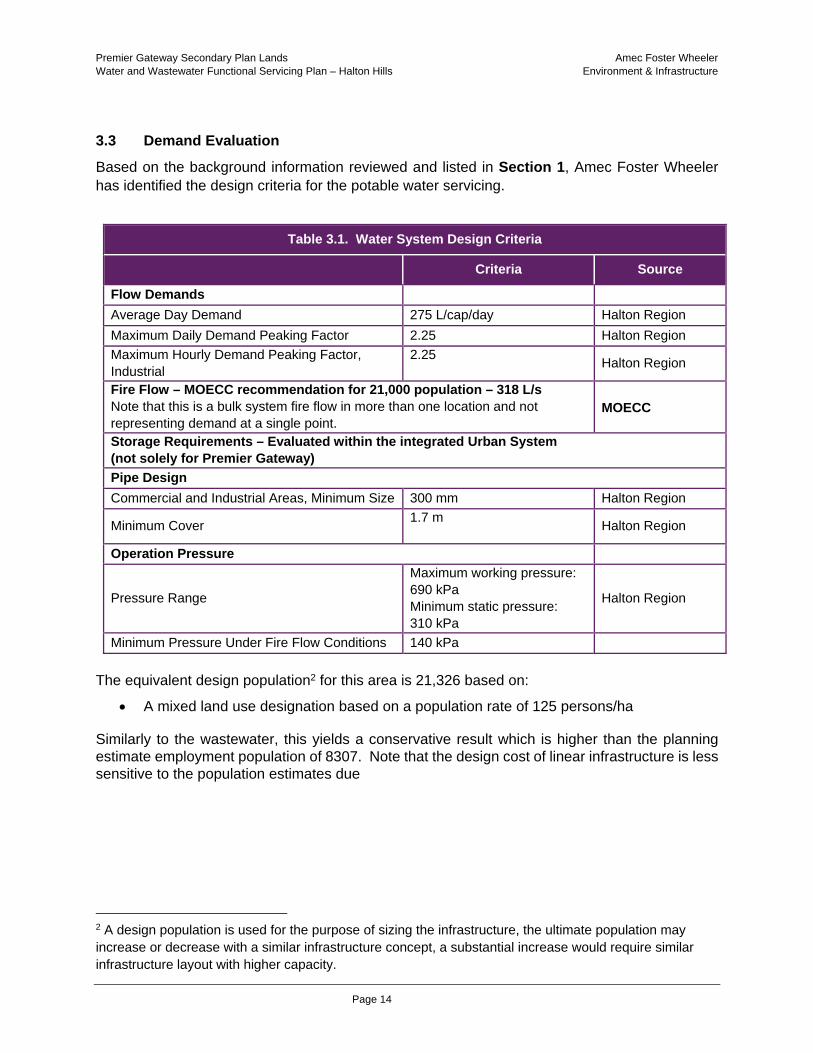
3.3 Demand Evaluation
Based on the background information reviewed and listed in Section 1, Amec Foster Wheeler has identified the design criteria for the potable water servicing.
Table 3.1. Water System Design Criteria
Criteria Source
Flow Demands
Average Day Demand 275 L/cap/day Halton Region
Maximum Daily Demand Peaking Factor 2.25 Halton Region
Maximum Hourly Demand Peaking Factor, Industrial
2.25 Halton Region
Fire Flow – MOECC recommendation for 21,000 population – 318 L/s Note that this is a bulk system fire flow in more than one location and not representing demand at a single point.
MOECC
Storage Requirements – Evaluated within the integrated Urban System (not solely for Premier Gateway)
Pipe Design
Commercial and Industrial Areas, Minimum Size 300 mm Halton Region
Minimum Cover 1.7 m
Halton Region
Operation Pressure
Pressure Range
Maximum working pressure: 690 kPa Minimum static pressure: 310 kPa
Halton Region
Minimum Pressure Under Fire Flow Conditions 140 kPa
The equivalent design population2 for this area is 21,326 based on:
A mixed land use designation based on a population rate of 125 persons/ha
Similarly to the wastewater, this yields a conservative result which is higher than the planning estimate employment population of 8307. Note that the design cost of linear infrastructure is less sensitive to the population estimates due
2 A design population is used for the purpose of sizing the infrastructure, the ultimate population may increase or decrease with a similar infrastructure concept, a substantial increase would require similar infrastructure layout with higher capacity.
Page 14

Premier Gateway Secondary Plan Lands Amec Foster Wheeler Water and Wastewater Functional Servicing Plan – Halton Hills Environment & Infrastructure
The following demands are estimated to review the system capacity for the Premier Gateway development as calculated in Table 3.1 and Table 3.2.
Average Day Demand – 5.9 MLD Max Day Demand – 13.2 MLD Peak Hour Demand – 152.7 L/s Fire Flow – 318 L/s
Table 3.2. Water Demand Estimates
Area (ha) Type Population Factor
(Persons/ha )
Population Demand Factor
(l/person/day)
Average Day Demand
(MLD) (L/s`)
170.6 Mixed Industrial Commercial
125 person/ha
21,326 275 5.9 67.9
Peak Hourly Factor (Halton Guidelines) x 2.25
Peak Hour Demand 13.2 152.7
Max Day Factor (Halton Guidelines) x 2.25
Max Day Demand 13.2 152.7
3.4 Water System Evaluation
The system performance was evaluated with the 2031 background demands and the demands shown in Section 3.3.
An analysis with Halton’s model confirms the following:
Peak Hourly Demand: System pressures are within the operating criteria range of 310 kPa to 690 KPa with the Premier Gateway Peak Hourly Demand and 2031 System Background Demands – without the operation of the planned Z 5 pumps and 600 mm return line.
Max Day + Fire Demand: System pressures are within the operating criteria range (above 140KPa) with the Premier Gateway Peak Hourly Demand and 2031 System Background Demands – without the operation of the planned Z 5 pumps and 600 mm return line.
Storage Evaluation
The evaluation of the water distribution system requirements is not presented in this report. Storage can be integrated with Master Planning for the Milton Lake-based pressure zone.
Pressure Zone Considerations
Based on the operating HGL range of 260.35 – 267.05 meters above sea level (masl) in the Zone 5 reservoir, buildings with a finished floor elevation of 197 – 229 masl are suited for service from Zone M5L. The existing topography of the site is suitable for integration within Zone M5L.
Page 15
Premier Gateway Secondary Plan Lands Amec Foster Wheeler Water and Wastewater Functional Servicing Plan – Halton Hills Environment & Infrastructure
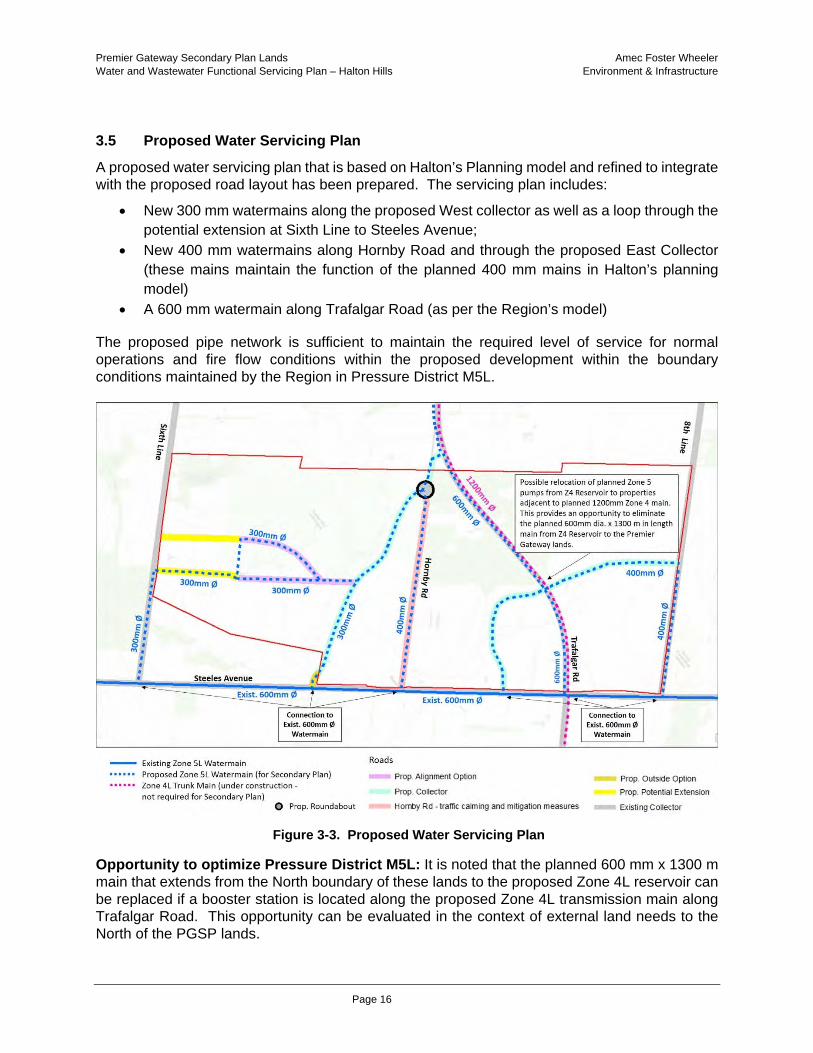
3.5 Proposed Water Servicing Plan
A proposed water servicing plan that is based on Halton’s Planning model and refined to integrate with the proposed road layout has been prepared. The servicing plan includes:
New 300 mm watermains along the proposed West collector as well as a loop through the potential extension at Sixth Line to Steeles Avenue;
New 400 mm watermains along Hornby Road and through the proposed East Collector (these mains maintain the function of the planned 400 mm mains in Halton’s planning model)
A 600 mm watermain along Trafalgar Road (as per the Region’s model)
The proposed pipe network is sufficient to maintain the required level of service for normal operations and fire flow conditions within the proposed development within the boundary conditions maintained by the Region in Pressure District M5L.
Figure 3-3. Proposed Water Servicing Plan
Opportunity to optimize Pressure District M5L: It is noted that the planned 600 mm x 1300 m main that extends from the North boundary of these lands to the proposed Zone 4L reservoir can be replaced if a booster station is located along the proposed Zone 4L transmission main along Trafalgar Road. This opportunity can be evaluated in the context of external land needs to the North of the PGSP lands.
Page 16

APPENDIX A
Planning Context Inputs

AIR P OTO
Traf
alga
r Rd
Traf
alga
r Rd
Preliminary Natural Heritage System
Study Area
Secondary Plan Area
Proposed Relocated Drainage Feature
Employment
Enhancement Area
Proposed Employment (maximum 75ha)
Supportive Commercial
Future Strategic Employment
Cemetery
Existing Buildings Subject to Further Study of Natural Heritage System
Wetland to be replicated as an Enhancement Area in Natural Heritage System
Existing Commercial
Proposed Employment which permits Existing Residential
Employment which permits Existing Residential
Collector Roads
Arterial Roads
Buffer for existing residential uses
Road Alignment Options (one to be built)
Potential Road Option Outside Study Area
Hornby Road traffic calming and mitigation measures to be determined
Need for Extention to Sixth Line subject to Area Transportation Study
Minimum Distance Separation (MDS)
Roundabout
Intersection alignment subject to further Study
Steeles Ave
Highway 401
Ho
rnb
y R
oa
d
Eig
hth
Lin
e
Six
th L
ine
Six
th L
ine
Trafalgar Rd
Town of Halton Hills Premier Gateway Secondary Plan
Preferred Land Use Concept
*Subject to separate Regional and Local O˜cial Plan Amendment
*Subject to reÿnement through Subwatershed Study
*subject to pending Municipal Comprehensive Review
0 260 520 130 Metres
Date: March 2017
This Draft Preferred Land Use Concept is provided for discussion purposes and will be subject to change. When ÿnalized it will form the basis for detailed land use designations and policies in the Secondary Plan
*
Potential Relocation
Potential Relocation
Potential Relocation
Relocate
*
±
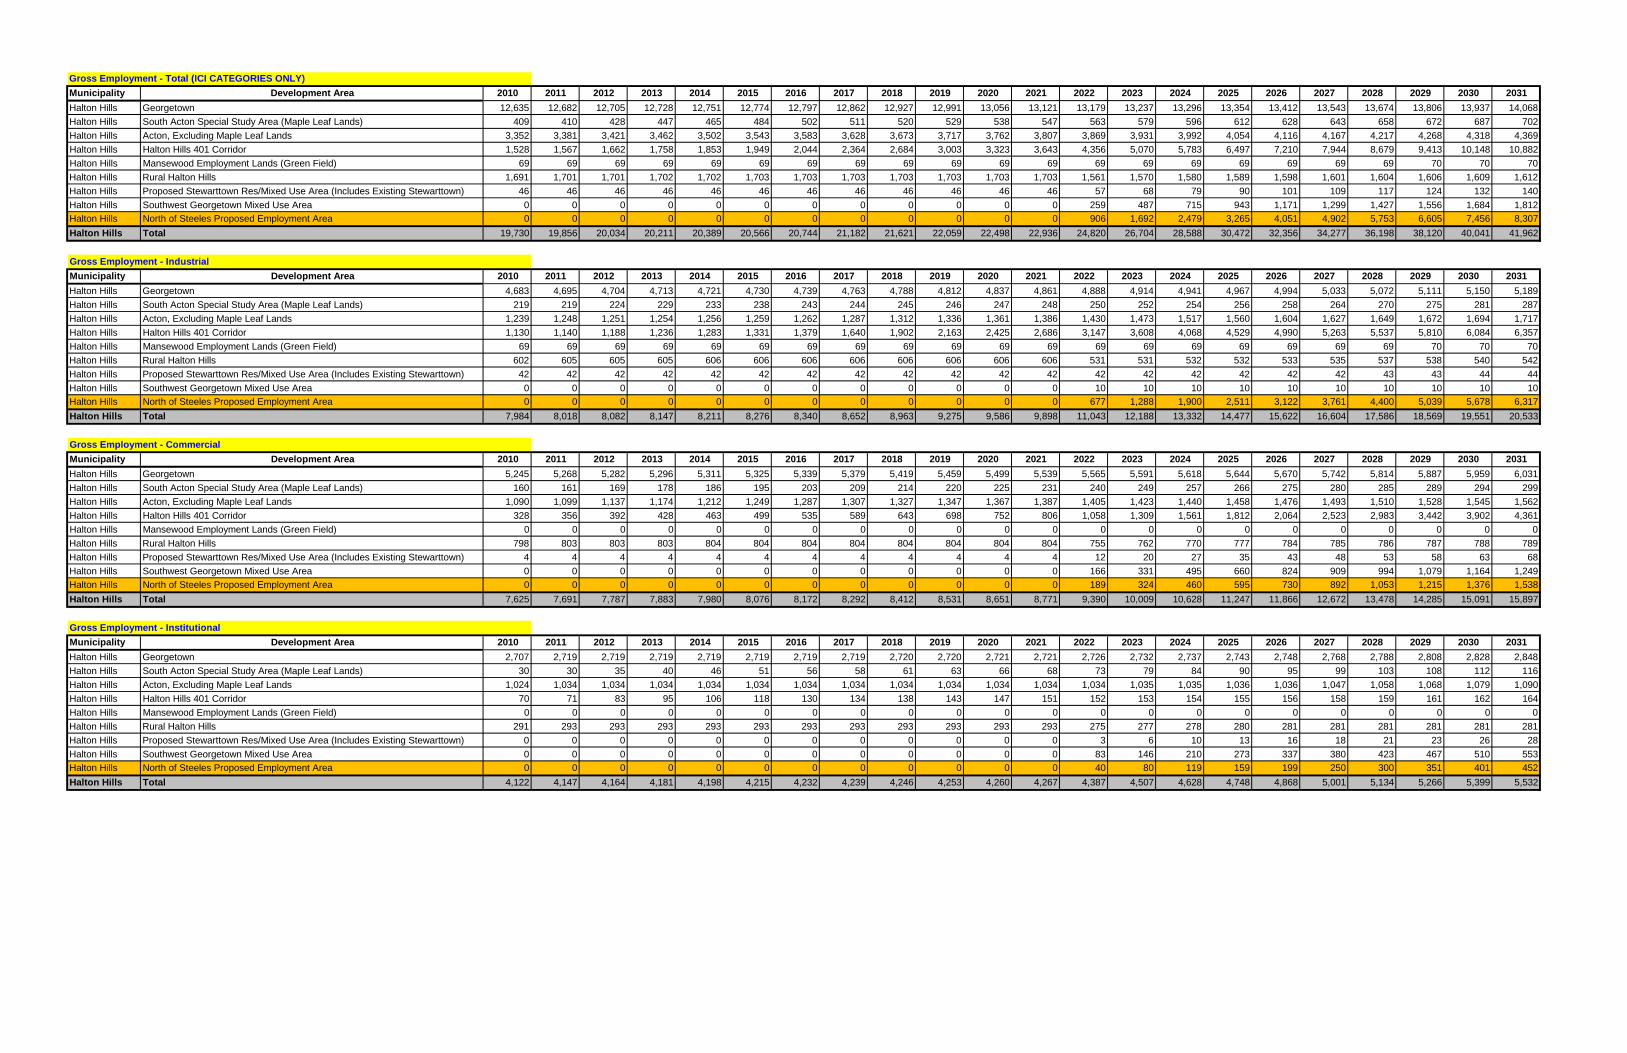
Gross Employment - Total (ICI CATEGORIES ONLY)
Municipality Development Area 2010 2011 2012 2013 2014 2015 2016 2017 2018 2019 2020 2021 2022 2023 2024 2025 2026 2027 2028 2029 2030 2031
Halton Hills Georgetown 12,635 12,682 12,705 12,728 12,751 12,774 12,797 12,862 12,927 12,991 13,056 13,121 13,179 13,237 13,296 13,354 13,412 13,543 13,674 13,806 13,937 14,068
Halton Hills South Acton Special Study Area (Maple Leaf Lands) 409 410 428 447 465 484 502 511 520 529 538 547 563 579 596 612 628 643 658 672 687 702
Halton Hills Acton, Excluding Maple Leaf Lands 3,352 3,381 3,421 3,462 3,502 3,543 3,583 3,628 3,673 3,717 3,762 3,807 3,869 3,931 3,992 4,054 4,116 4,167 4,217 4,268 4,318 4,369
Halton Hills Halton Hills 401 Corridor 1,528 1,567 1,662 1,758 1,853 1,949 2,044 2,364 2,684 3,003 3,323 3,643 4,356 5,070 5,783 6,497 7,210 7,944 8,679 9,413 10,148 10,882
Halton Hills Mansewood Employment Lands (Green Field) 69 69 69 69 69 69 69 69 69 69 69 69 69 69 69 69 69 69 69 70 70 70
Halton Hills Rural Halton Hills 1,691 1,701 1,701 1,702 1,702 1,703 1,703 1,703 1,703 1,703 1,703 1,703 1,561 1,570 1,580 1,589 1,598 1,601 1,604 1,606 1,609 1,612
Halton Hills Proposed Stewarttown Res/Mixed Use Area (Includes Existing Stewarttown) 46 46 46 46 46 46 46 46 46 46 46 46 57 68 79 90 101 109 117 124 132 140
Halton Hills Southwest Georgetown Mixed Use Area 0 0 0 0 0 0 0 0 0 0 0 0 259 487 715 943 1,171 1,299 1,427 1,556 1,684 1,812
Halton Hills North of Steeles Proposed Employment Area 0 0 0 0 0 0 0 0 0 0 0 0 906 1,692 2,479 3,265 4,051 4,902 5,753 6,605 7,456 8,307
Halton Hills Total 19,730 19,856 20,034 20,211 20,389 20,566 20,744 21,182 21,621 22,059 22,498 22,936 24,820 26,704 28,588 30,472 32,356 34,277 36,198 38,120 40,041 41,962
Gross Employment - Industrial
Municipality Development Area 2010 2011 2012 2013 2014 2015 2016 2017 2018 2019 2020 2021 2022 2023 2024 2025 2026 2027 2028 2029 2030 2031
Halton Hills Georgetown 4,683 4,695 4,704 4,713 4,721 4,730 4,739 4,763 4,788 4,812 4,837 4,861 4,888 4,914 4,941 4,967 4,994 5,033 5,072 5,111 5,150 5,189
Halton Hills South Acton Special Study Area (Maple Leaf Lands) 219 219 224 229 233 238 243 244 245 246 247 248 250 252 254 256 258 264 270 275 281 287
Halton Hills Acton, Excluding Maple Leaf Lands 1,239 1,248 1,251 1,254 1,256 1,259 1,262 1,287 1,312 1,336 1,361 1,386 1,430 1,473 1,517 1,560 1,604 1,627 1,649 1,672 1,694 1,717
Halton Hills Halton Hills 401 Corridor 1,130 1,140 1,188 1,236 1,283 1,331 1,379 1,640 1,902 2,163 2,425 2,686 3,147 3,608 4,068 4,529 4,990 5,263 5,537 5,810 6,084 6,357
Halton Hills Mansewood Employment Lands (Green Field) 69 69 69 69 69 69 69 69 69 69 69 69 69 69 69 69 69 69 69 70 70 70
Halton Hills Rural Halton Hills 602 605 605 605 606 606 606 606 606 606 606 606 531 531 532 532 533 535 537 538 540 542
Halton Hills Proposed Stewarttown Res/Mixed Use Area (Includes Existing Stewarttown) 42 42 42 42 42 42 42 42 42 42 42 42 42 42 42 42 42 42 43 43 44 44
Halton Hills Southwest Georgetown Mixed Use Area 0 0 0 0 0 0 0 0 0 0 0 0 10 10 10 10 10 10 10 10 10 10
Halton Hills North of Steeles Proposed Employment Area 0 0 0 0 0 0 0 0 0 0 0 0 677 1,288 1,900 2,511 3,122 3,761 4,400 5,039 5,678 6,317
Halton Hills Total 7,984 8,018 8,082 8,147 8,211 8,276 8,340 8,652 8,963 9,275 9,586 9,898 11,043 12,188 13,332 14,477 15,622 16,604 17,586 18,569 19,551 20,533
Gross Employment - Commercial
Municipality Development Area 2010 2011 2012 2013 2014 2015 2016 2017 2018 2019 2020 2021 2022 2023 2024 2025 2026 2027 2028 2029 2030 2031
Halton Hills Georgetown 5,245 5,268 5,282 5,296 5,311 5,325 5,339 5,379 5,419 5,459 5,499 5,539 5,565 5,591 5,618 5,644 5,670 5,742 5,814 5,887 5,959 6,031
Halton Hills South Acton Special Study Area (Maple Leaf Lands) 160 161 169 178 186 195 203 209 214 220 225 231 240 249 257 266 275 280 285 289 294 299
Halton Hills Acton, Excluding Maple Leaf Lands 1,090 1,099 1,137 1,174 1,212 1,249 1,287 1,307 1,327 1,347 1,367 1,387 1,405 1,423 1,440 1,458 1,476 1,493 1,510 1,528 1,545 1,562
Halton Hills Halton Hills 401 Corridor 328 356 392 428 463 499 535 589 643 698 752 806 1,058 1,309 1,561 1,812 2,064 2,523 2,983 3,442 3,902 4,361
Halton Hills Mansewood Employment Lands (Green Field) 0 0 0 0 0 0 0 0 0 0 0 0 0 0 0 0 0 0 0 0 0 0
Halton Hills Rural Halton Hills 798 803 803 803 804 804 804 804 804 804 804 804 755 762 770 777 784 785 786 787 788 789
Halton Hills Proposed Stewarttown Res/Mixed Use Area (Includes Existing Stewarttown) 4 4 4 4 4 4 4 4 4 4 4 4 12 20 27 35 43 48 53 58 63 68
Halton Hills Southwest Georgetown Mixed Use Area 0 0 0 0 0 0 0 0 0 0 0 0 166 331 495 660 824 909 994 1,079 1,164 1,249
Halton Hills North of Steeles Proposed Employment Area 0 0 0 0 0 0 0 0 0 0 0 0 189 324 460 595 730 892 1,053 1,215 1,376 1,538
Halton Hills Total 7,625 7,691 7,787 7,883 7,980 8,076 8,172 8,292 8,412 8,531 8,651 8,771 9,390 10,009 10,628 11,247 11,866 12,672 13,478 14,285 15,091 15,897
Gross Employment - Institutional
Municipality Development Area 2010 2011 2012 2013 2014 2015 2016 2017 2018 2019 2020 2021 2022 2023 2024 2025 2026 2027 2028 2029 2030 2031
Halton Hills Georgetown 2,707 2,719 2,719 2,719 2,719 2,719 2,719 2,719 2,720 2,720 2,721 2,721 2,726 2,732 2,737 2,743 2,748 2,768 2,788 2,808 2,828 2,848
Halton Hills South Acton Special Study Area (Maple Leaf Lands) 30 30 35 40 46 51 56 58 61 63 66 68 73 79 84 90 95 99 103 108 112 116
Halton Hills Acton, Excluding Maple Leaf Lands 1,024 1,034 1,034 1,034 1,034 1,034 1,034 1,034 1,034 1,034 1,034 1,034 1,034 1,035 1,035 1,036 1,036 1,047 1,058 1,068 1,079 1,090
Halton Hills Halton Hills 401 Corridor 70 71 83 95 106 118 130 134 138 143 147 151 152 153 154 155 156 158 159 161 162 164
Halton Hills Mansewood Employment Lands (Green Field) 0 0 0 0 0 0 0 0 0 0 0 0 0 0 0 0 0 0 0 0 0 0
Halton Hills Rural Halton Hills 291 293 293 293 293 293 293 293 293 293 293 293 275 277 278 280 281 281 281 281 281 281
Halton Hills Proposed Stewarttown Res/Mixed Use Area (Includes Existing Stewarttown) 0 0 0 0 0 0 0 0 0 0 0 0 3 6 10 13 16 18 21 23 26 28
Halton Hills Southwest Georgetown Mixed Use Area 0 0 0 0 0 0 0 0 0 0 0 0 83 146 210 273 337 380 423 467 510 553
Halton Hills North of Steeles Proposed Employment Area 0 0 0 0 0 0 0 0 0 0 0 0 40 80 119 159 199 250 300 351 401 452
Halton Hills Total 4,122 4,147 4,164 4,181 4,198 4,215 4,232 4,239 4,246 4,253 4,260 4,267 4,387 4,507 4,628 4,748 4,868 5,001 5,134 5,266 5,399 5,532

APPENDIX B
Wastewater Evaluation
Sanitary Sewer Design Relevant Information from Halton Region Planning Model

Premier Gateway Water and Wastewater Servicing Functional Servicing Plan Project No. TP115042
DESKTOP EVALUATION OF SEWER CAPACITY IN PREMIER GATEWAY
Flow Factors Peak factor Manning's n 0.013
Residential 275 l/person‐day Modified Harmon:( 1 + 14/(4+(P/1000)^.5))*.8
Type 3 Employment 275 l/person‐day Babbitt: 5/(P/1000)^.5 125.0 Extraneous 0.28 l/s‐ha
persons/ha Population or equivalents Dry weather Flow (l/s) Extrane Full Sewershed Area Employment ous Design Pipe Pipe Pipe Full Flow Flow
(ha) (ha) Incremental Cumulative Peak Peak Flow Flow US US DS DS MH length Slope Diameter Velocity Capacit % Model IDs Area Increment Cumulative Type 3 Res Emp Res Emp Average Factor Flow (l/s) (l/s) US MH DS MH Invert DS Invert Obvert Obvert drop (m) (%) (mm) (m/s) y (l/s) Utilized
Demand and Conceptual Design of Sewer on Future Road "A"
A1 27.3 27 24.2 0 3030 0 3030 9.6 2.75 27 8 34 PA1 PA2 200.400 198.493 200.700 198.793 0.025 127.1 1.50% 300 1.68 118 28.9% 27 0 0 0 3030 9.6 2.75 27 8 34 PA2 PA3 198.493 197.023 198.793 197.323 0.025 113.1 1.30% 300 1.56 110 31.0% 27 0 0 0 3030 9.6 2.75 27 8 34 PA3 PA4 197.023 196.397 197.323 196.697 0.025 52.1 1.20% 300 1.50 106 32.3% 27 0 0 0 3030 9.6 2.75 27 8 34 PA4 PB4 196.397 194.924 196.697 195.224 0.025 147.3 1.00% 300 1.37 97 35.3%
Demand and Conceptual Design of Sewer on Future Road "B"
B1, B2, B3 36.8 37 31.5 0 3933 0 3933 12.5 2.67 33 10 44 PB1 PB2 196.350 195.750 196.800 196.200 0.025 150.0 0.40% 450 1.13 180 24.3% 37 0 0 0 3933 12.5 2.67 33 10 44 PB2 PB3 195.725 195.125 196.175 195.575 0.025 150.0 0.40% 450 1.13 180 24.3% 37 0 0 0 3933 12.5 2.67 33 10 44 PB3 PB4 195.100 194.740 195.550 195.190 0.025 120.0 0.30% 450 0.98 156 28.0%
B4 3.9 68 0 0 0 6963 22.2 2.49 55 19 74 PB4 PB5 194.715 194.625 195.165 195.075 0.025 30.1 0.30% 450 0.98 156 47.5% 68 0 0 0 6963 22.2 2.49 55 19 74 PB5 PC6 194.600 194.150 195.050 194.600 0.025 150.0 0.30% 450 0.98 156 47.5%
Demand and Conceptual Design of Sewer on Future Road "C"
C1, C2 10.9 11 3.1 0 388 0 388 1.2 3.22 4 3 7 PC1 PC2 200.650 198.865 200.950 199.165 0.025 119.0 1.50% 300 1.68 118 5.9% C3 6.10 17 3.9 0 483 0 871 2.8 3.07 9 5 13 PC2 PC3 198.840 197.456 199.140 197.756 0.025 145.7 0.95% 300 1.33 94 14.1%
17 0 0 0 871 2.8 3.07 9 5 13 PC3 PC4 197.431 196.519 197.731 196.819 0.025 96.0 0.95% 300 1.33 94 14.1% C4 1.90 19 0 0 0 871 2.8 3.07 9 5 14 PC4 PC5 196.494 195.610 196.794 195.910 0.025 93.0 0.95% 300 1.33 94 14.6%
19 0 0 0 871 2.8 3.07 9 5 14 PC5 PC6 195.585 194.310 195.885 194.610 0.225 85.0 1.50% 300 1.68 118 11.7% C5 7.10 94 4.7 0 582 0 8416 26.8 2.42 65 26 91 PC6 PC7 194.085 193.635 194.610 194.160 0.025 150.0 0.30% 525 1.09 236 38.7%
94 0 0 0 8416 26.8 2.42 65 26 91 PC7 PC8 193.610 193.160 194.135 193.685 0.025 150.0 0.30% 525 1.09 236 38.7% C6 8.90 103 4.7 0 582 0 8998 28.6 2.40 69 29 98 PC8 PC9 193.135 192.800 193.660 193.325 0.025 112.0 0.30% 525 1.09 236 41.4%
103 0 0 0 8998 28.6 2.40 69 29 98 PC9 PC10 192.775 192.536 193.300 193.061 0.025 79.6 0.30% 525 1.09 236 41.4% 103 0 0 0 8998 28.6 2.40 69 29 98 PC10 Ex. MH 192.511 191.941 193.036 192.466 0.025 114.0 0.50% 525 1.40 304 32.1%
Demand and Conceptual Design of Sewer on Hornby Road
H1, H2 15.9 16 3.1 0 388 0 388 1.2 3.22 4 4 8 PH1 PH2 201.900 201.104 202.200 201.404 0.025 113.7 0.70% 300 1.14 81 10.4% 16 0 0 0 388 1.2 3.22 4 4 8 PH2 PH3 201.104 200.279 201.404 200.579 0.025 150.0 0.55% 300 1.01 72 11.8%
H3 4.5 20 0 0 0 388 1.2 3.22 4 6 10 PH3 PH4 200.279 199.454 200.579 199.754 0.025 150.0 0.55% 300 1.01 72 13.5% H4 16.8 37 11.2 0 1403 0 1791 5.7 2.90 17 10 27 PH4 PH5 199.454 198.830 199.754 199.130 0.025 113.5 0.55% 300 1.01 72 37.6%
37 0 0 0 1791 5.7 2.90 17 10 27 PH5 PH6 198.830 198.006 199.130 198.306 0.025 149.8 0.55% 300 1.01 72 37.6% H5 3.1 40 0 0 0 1791 5.7 2.90 17 11 28 PH6 PH7 198.006 197.107 198.306 197.407 0.025 149.8 0.60% 300 1.06 75 37.1%
40 0 0 0 1791 5.7 2.90 17 11 28 PH7 Ex. MH 197.107 196.209 197.407 196.509 0.025 149.6 0.60% 300 1.06 75 37.1%
Demand and Conceptual Design of Sewer on Planned Road "D"
D1, D2 56.5 57 43.9 0 5488 0 5488 17.5 2.57 45 16 61 PD1 PD2 207.050 206.300 207.500 206.750 0.025 150.0 0.50% 450 1.27 202 30.1% 57 0 0 0 5488 17.5 2.57 45 16 61 PD2 PD3 206.300 206.126 206.750 206.576 0.025 86.8 0.20% 450 0.80 128 47.6% 57 0 0 0 5488 17.5 2.57 45 16 61 PD3 PD4 206.126 205.913 206.576 206.363 0.025 106.9 0.20% 450 0.80 128 47.6% 57 0 0 0 5488 17.5 2.57 45 16 61 PD4 PD5 205.913 205.613 206.363 206.063 0.025 150.0 0.20% 450 0.80 128 47.6%
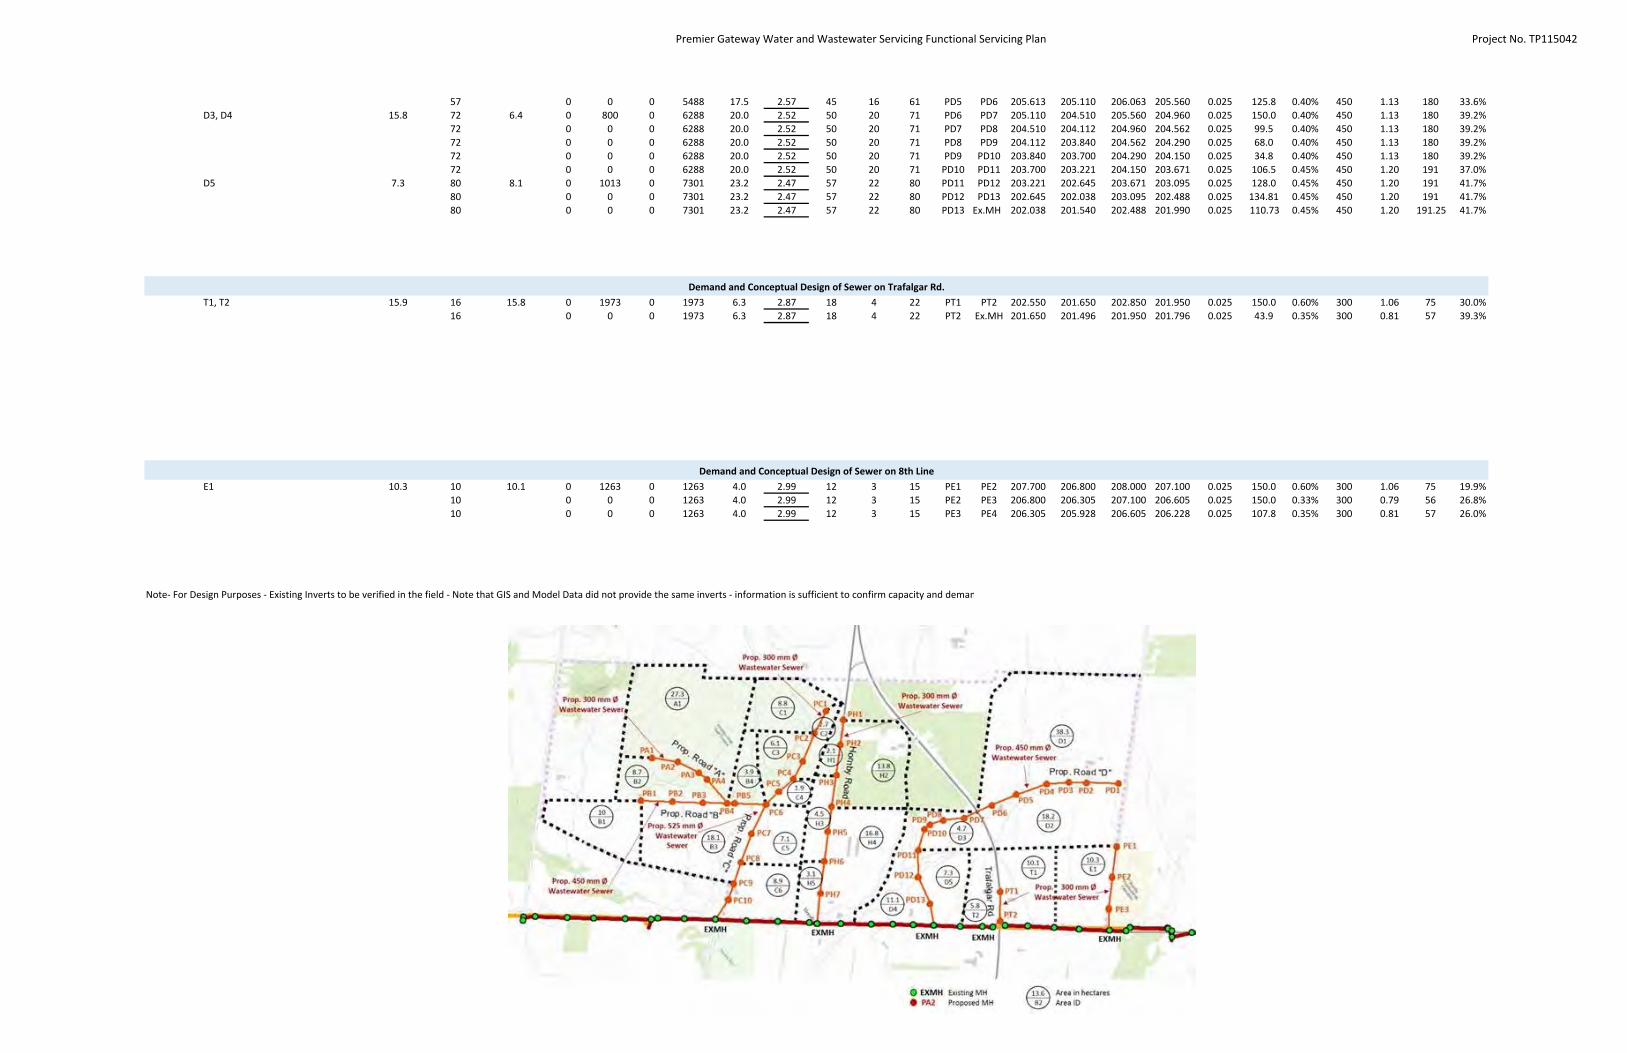
Premier Gateway Water and Wastewater Servicing Functional Servicing Plan Project No. TP115042
57 0 0 0 5488 17.5 2.57 45 16 61 PD5 PD6 205.613 205.110 206.063 205.560 0.025 125.8 0.40% 450 1.13 180 33.6% D3, D4 15.8 72 6.4 0 800 0 6288 20.0 2.52 50 20 71 PD6 PD7 205.110 204.510 205.560 204.960 0.025 150.0 0.40% 450 1.13 180 39.2%
72 0 0 0 6288 20.0 2.52 50 20 71 PD7 PD8 204.510 204.112 204.960 204.562 0.025 99.5 0.40% 450 1.13 180 39.2% 72 0 0 0 6288 20.0 2.52 50 20 71 PD8 PD9 204.112 203.840 204.562 204.290 0.025 68.0 0.40% 450 1.13 180 39.2% 72 0 0 0 6288 20.0 2.52 50 20 71 PD9 PD10 203.840 203.700 204.290 204.150 0.025 34.8 0.40% 450 1.13 180 39.2% 72 0 0 0 6288 20.0 2.52 50 20 71 PD10 PD11 203.700 203.221 204.150 203.671 0.025 106.5 0.45% 450 1.20 191 37.0%
D5 7.3 80 8.1 0 1013 0 7301 23.2 2.47 57 22 80 PD11 PD12 203.221 202.645 203.671 203.095 0.025 128.0 0.45% 450 1.20 191 41.7% 80 0 0 0 7301 23.2 2.47 57 22 80 PD12 PD13 202.645 202.038 203.095 202.488 0.025 134.81 0.45% 450 1.20 191 41.7% 80 0 0 0 7301 23.2 2.47 57 22 80 PD13 Ex.MH 202.038 201.540 202.488 201.990 0.025 110.73 0.45% 450 1.20 191.25 41.7%
Demand and Conceptual Design of Sewer on Trafalgar Rd.
T1, T2 15.9 16 15.8 0 1973 0 1973 6.3 2.87 18 4 22 PT1 PT2 202.550 201.650 202.850 201.950 0.025 150.0 0.60% 300 1.06 75 30.0% 16 0 0 0 1973 6.3 2.87 18 4 22 PT2 Ex.MH 201.650 201.496 201.950 201.796 0.025 43.9 0.35% 300 0.81 57 39.3%
E1 10.3 10 10 10
10.1 0 0 0
1263 0 0
0 0 0
Demand and Conceptual Design of Sewer on 8th Line
1263 4.0 2.99 12 3 15 1263 4.0 2.99 12 3 15 1263 4.0 2.99 12 3 15
PE1 PE2 PE3
PE2 PE3 PE4
207.700 206.800 206.305
206.800 206.305 205.928
208.000 207.100 206.605
207.100 206.605 206.228
0.025 0.025 0.025
150.0 150.0 107.8
0.60% 0.33% 0.35%
300 300 300
1.06 0.79 0.81
75 56 57
19.9% 26.8% 26.0%
Note‐ For Design Purposes ‐ Existing Inverts to be verified in the field ‐ Note that GIS and Model Data did not provide the same inverts ‐ information is sufficient to confirm capacity and deman

Premier Gateway Water and Wastewater Project No. TP115042 Servicing Functional Servicing Plan
TORAL DEMAND SUMMARY ‐ PREMIER GATEWAY LANDS
Flow Factors Peak factor
Residential 275 l/person‐day Modified Harmon:( 1 + 14/(4+(P/1000)^.5))*.8
Type 3 125.0
Employment Extraneous
275 l/person‐day 0.28 l/s‐ha
Babbitt: 5/(P/1000)^.5
Area
persons/ha Sewershed Area Employment
(ha) (ha) Increment Cumulative Type 3
Population or equivalents
Incremental Cumulative Res Emp Res Emp
Dry weather Flow (l/s)
Peak Peak Average Factor Flow
Extraneous Flow (l/s)
Design Flow (l/s)
PE3 PT2 PD13 PH7 PC10
10.3 15.9 79.6 40.3 102.9
10.3 26.2 105.8 146.1 249.0
0 0 0 0 0
1263 1973 7301 1791 8998
0 0 0 0 0
1263 3236 10538 12328 21326
4.0 10.3 33.5 39.2 67.9
2.99 2.73 2.35 2.29 2.10
12 28 79 90 143
3 7 30 41 70
15 35 108 131 212

Assignment of Developable Areas to Sewersheds Drainage Area Plan Assignment
Developable Area ‐ Secondary Plan Area (ha) % ID % ID % ID % ID Area‐1 35.8 ha 100% D1 35.8 ha 0.0 ha 0.0 ha 0.0 ha Area‐2 42.1 ha 38% T1 24% E1 39% D5 &D2 15.8 ha 10.1 ha 16.2 ha 0.0 ha Area‐3 6.4 ha 100% D4 6.4 ha 0.0 ha 0.0 ha 0.0 ha Area‐4 11.2 ha 100% H4 11.2 ha 0.0 ha 0.0 ha 0.0 ha Area‐5 15.5 ha 30% C6 30% C5 20% C2 20% H1 4.7 ha 4.7 ha 3.1 ha 3.1 ha Area‐6 3.9 ha 100% C3 3.9 ha 0.0 ha 0.0 ha 0.0 ha Area‐7 32.3 ha 75% A1 25% B2 24.2 ha 8.1 ha 0.0 ha 0.0 ha Area‐8 5.8 ha 100% B1 5.8 ha 0.0 ha 0.0 ha 0.0 ha Area‐9 14.0 ha 100% B3 14.0 ha 0.0 ha 0.0 ha 0.0 ha Area‐10 3.6 ha 100% B3 3.6 ha 0.0 ha 0.0 ha 0.0 ha
A1 24.2 ha B1 5.8 ha B2 8.1 ha B3 17.6 ha C2 3.1 ha C3 3.9 ha C5 4.7 ha C6 4.7 ha D1 35.8 ha D2 8.1 ha D5 8.1 ha D4 6.4 ha E1 10.1 ha H1 3.1 ha H4 11.2 ha T1 15.8 ha

Steeles Avenue Sewer Characteristics in Critical Section
Slope Range Velocity Range Full Flow Capacity Range 525 mm 0.87% 2.91% 1.85 m/s 3.39 m/s 401 l/s 734 l/s 600 mm 0.39% 0.41% 1.36 m/s 1.39 m/s 383 l/s 393 l/s 675 mm 0.11% 0.20% 0.78 m/s 1.05 m/s 279 l/s 376 l/s

Total Wastewater Flow (L/s) along Steeles Avenue
• “2016-PEAK-WWF-OF, without overflow” Scenario from Halton Region Hydraulic Model

Total Wastewater Flow (L/s) along Steeles Avenue
• “2021-PEAK-WWF-OF, without overflow” Scenario from Halton Region Hydraulic Model

Total Wastewater Flow (L/s) along Steeles Avenue
• “2026-PEAK-WWF-OF, without overflow” Scenario from Halton Region Hydraulic Model

Total Wastewater Flow (L/s) along Steeles Avenue
• “2031-PEAK-WWF-OF, without overflow” Scenario from Halton Region Hydraulic Model

APPENDIX C
Water Evaluation

Modelling Analysis Summary Premier Gateway Phase 1 B Employment Area
The proposed watermain modelling was carried out for Maximum Day Plus Fire Flow and Peak Hourly Demand scenarios using InfoWater model. Modelling was carried out under 2031 demand conditions.
The following demands were used to check the system capacity for the proposed watermain analysis.
Max Day Demand – 152.7 L/s Peak Hour Demand – 152.7 L/s (Max Day Factor and Peak Hour Factor are same according to
Halton Guidelines) Fire Flow – 318 L/s
The original model “InfoWater May13-2016-Z2PS-ValveIDs” was analyzed with 2031 Maximum Day Demand condition at background for the following two scenarios.
1.) Maximum Day Demand of the service area plus Fire Flow
In this analysis, Max Day Demand of 152.7 L/s and Fire flow of 318 L/s were evaluated with 2031 Max Day Demand of the system at the background. Z 5 pumps and 600 mm return line were out of operation during the simualtion. Resulting system pressures were within the operating criteria range (above 140 kPa or 20 psi). The following is the screenshot of the results where pressure ranges are in psi unit.
System Pressures at Max Day Demand plus Fire Flow
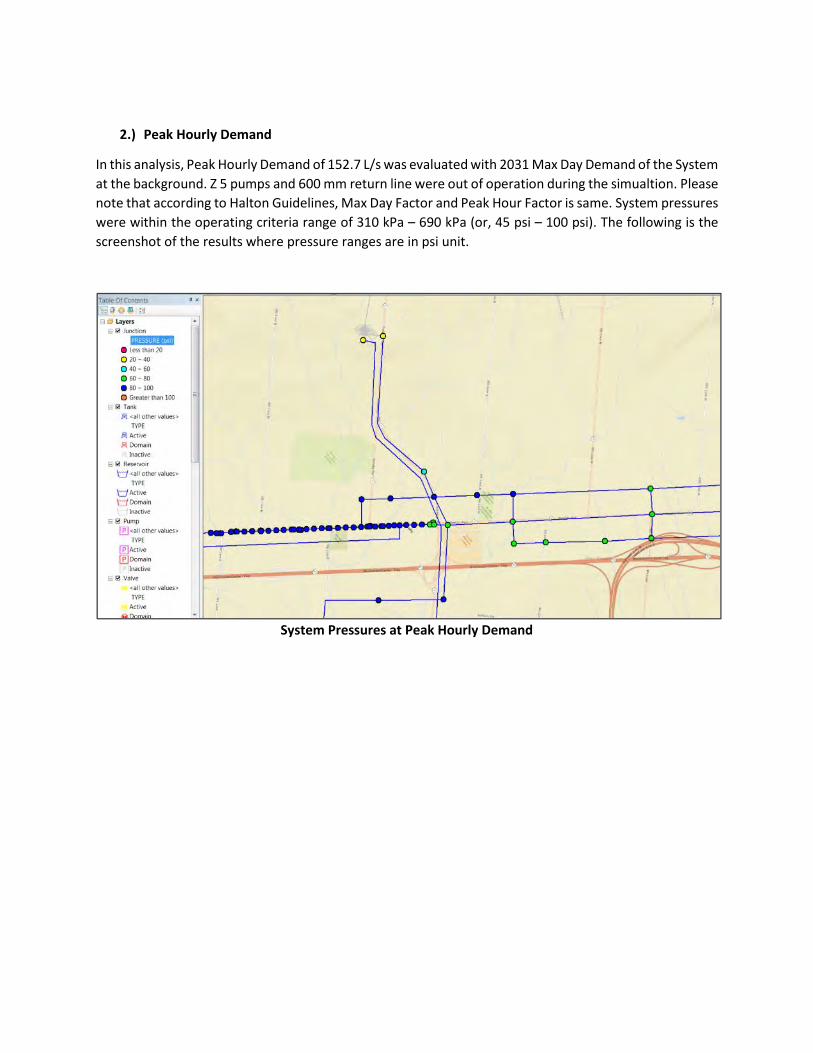
2.) Peak Hourly Demand
In this analysis, Peak Hourly Demand of 152.7 L/s was evaluated with 2031 Max Day Demand of the System at the background. Z 5 pumps and 600 mm return line were out of operation during the simualtion. Please note that according to Halton Guidelines, Max Day Factor and Peak Hour Factor is same. System pressures were within the operating criteria range of 310 kPa – 690 kPa (or, 45 psi – 100 psi). The following is the screenshot of the results where pressure ranges are in psi unit.
System Pressures at Peak Hourly Demand