Embed Size (px)
Citation preview
2017-2018 ANNUAL INSTITUTIONAL REVIEW
Written by: Katiina Dull President
With Supporting Reports by: Dr. LeeAnn Stone, Dean of Instruction
Mike Krauss, Dean of Administrative Services Travis Goode, Dean of Students
Aaron Kolberg, Interim Music Department Chair Kim Wimmer, Theatre Department Chair
Mohammad Shahisamann, Breadth-of-Knowledge Department Chair E. Jingle di Niet, Dance Department Chair
The Young Americans College of the Performing Arts is the post-secondary educational division of The Young Americans, Inc. located in Corona, California. The mission is to provide members of The Young Americans with a performance-based education
emphasizing artistry, leadership, communication, and collaboration. The Associate of Arts and certificate
program of study offered provide developing artists with skills, knowledge, and experiences that will be
foundational for their future as performers, teachers, and leaders.
2017-2018 Annual Institutional Report | Introduction
PRESIDENT’S SUMMARY
The 2017-2018 Academic Year was without question a turning point in the progression and
development of The Young Americans College of the Performing Arts, the highlight being the granting of
accreditation from ACCJC in January, 2018.
The efforts undertaken by the entire college division to complete the ISER at the end of the 2016-2017
academic year and prepare for the site-visit that occurred in October, 2018 were herculean. In addition
to the enormity of the workload, the quality of work put forth and the high level of commitment was
something we should all be proud of. The ISER provided us with an invaluably deep understanding of our
institutional mission and values. Through the process we were honest about areas of improvement and
diligent in developing plans to address those areas. The site-visit was executed in a manner that
transparently reflected the values and uniqueness of YACPA. Through transparency and clarity, we were
able to demonstrate fulfillment of all ACCJC standards without losing sight of the culture and values that
define YACPA.
As a small school, every individual -- from our Board of Directors to our students-- was intimately involved in the accreditation process. So when we were notified of our success in gaining that accreditation, the impact was one of both heightened pride, and exhausted relief. The moment of standing before our student body and sharing our good news is a career highlight that will live with me forever. For despite the extraordinary effort involved, the value that accreditation added to our students' educational process was always the clear and driving goal for this effort. The "icing on the cake", and what constitutes a very personal validation of my leadership, is that we jumped directly to accreditation, bypassing the multi-year candidacy process. Accreditation brings with it responsibility. As I reflect upon the remainder of the year I see how
influential the ISER process was to maintaining institutional focus on continuous improvement
processes. While there are no major areas of concern, there is a sense of fatigue and subsequent
relaxing of those processes that has worked its way in. As a developing institution the challenge for
2018-2019 is to reengaged the continuous improvement process in a consistent and sustainable
manner.
Accreditation also brings opportunity. The validity accreditation brings opens doors to support financial
aid, F-1 visa programs, and transferability. Each of these opportunities opens a door to enhance the
student experience and reduce barriers to enrollment. The coming years will bring exciting new ventures
for YACPA and increased opportunities to define ourselves as an institution of quality, excellence, and
relevance.
2017-2018 Annual Institutional Report | Table of Contents
TABLE OF CONTENTS
DATA SUMMARY ......................................................................................................................................... 2
DISAGGREGATED DATA ............................................................................................................................. 6
STATUS OF PRIORITIES IDENTIFIED IN THE 2016-2017 ANNUAL REPORT ........................................ 8
DEPARTMENT REPORT OVERVIEW ........................................................................................................ 12
INSTITUTIONAL EFFECTIVENESS: STUDENT LEARNING ..................................................................... 13
INSTITUTIONAL EFFECTIVENESS: STUDENT ACHEIVEMENT ............................................................. 16
INSTITUTIONAL EFFECTIVENESS: ACADEMIC QUALITY ..................................................................... 18
FINANCIAL – YACPA Division ................................................................................................................... 21
2015-2020 STRATEGIC PLAN STATUS REPORT .................................................................................... 23
INSTITUTIONAL PRIORITIES FOR 2018-2019 ....................................................................................... 31
Supporting Documents
Accessible at: 2017-2018 Institutional Annual Review
1. Annual Academic Instructional Review 2017-2018 1.1 Annual Music Department Review 1.2 Annual Theatre Department Review 1.3 Annual Dance Department Review 1.4 Annual Breadth of Knowledge Department Review 1.5 Library Department Review 2. Administrative Services Annual Review Report 2.1 Recruitment & Enrollment Plan 3. Student Services Annual Review
3.1 Freshman Student Satisfaction Survey Report 2017-2018 3.2 Sophomore Student Satisfaction Survey Report 2017-2018
4. ACCJC Site-Team Report 5. Program Learning Outcome Results 6. Data Files
6.1 17-18 Data Files 6.2 17-18 Course Completion Data 6.3 2017-2018 Faculty Load Assessment 6.4 Historical Course Completion Data
2017-2018 Annual Institutional Report | Data Summary Page 2
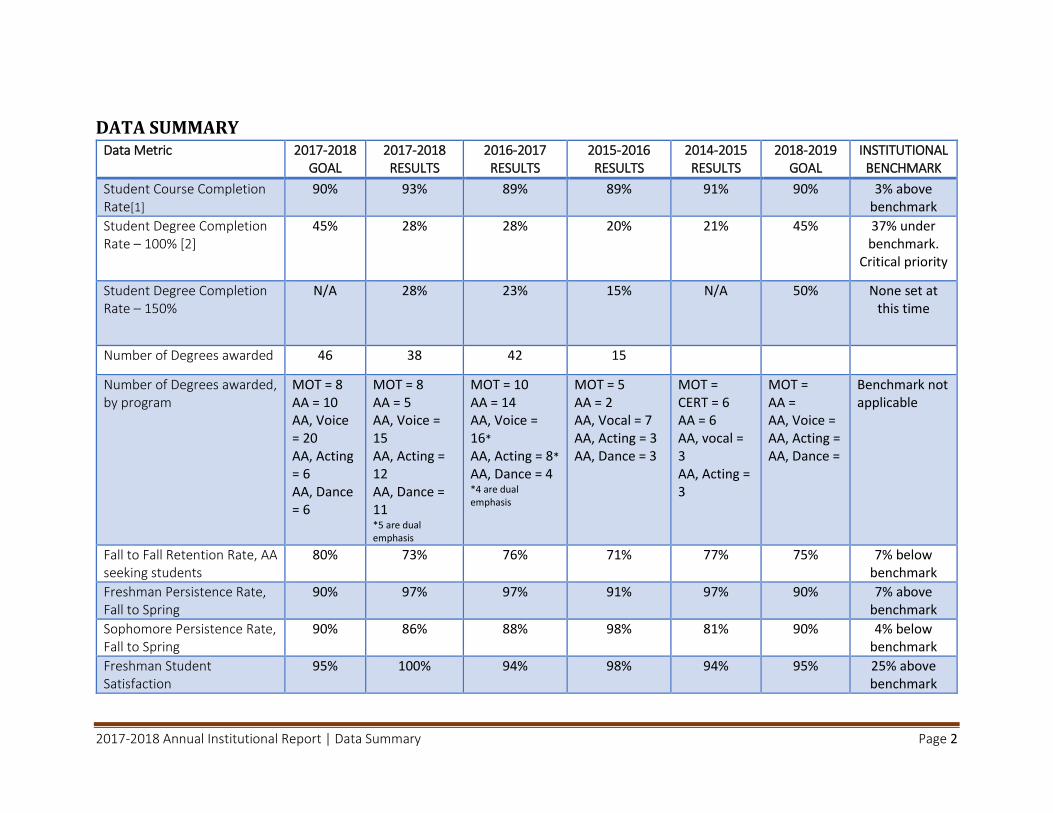
DATA SUMMARY Data Metric 2017-2018
GOAL 2017-2018 RESULTS
2016-2017 RESULTS
2015-2016 RESULTS
2014-2015 RESULTS
2018-2019 GOAL
INSTITUTIONAL BENCHMARK
Student Course Completion Rate[1]
90% 93% 89% 89% 91% 90% 3% above benchmark
Student Degree Completion Rate – 100% [2]
45% 28% 28% 20% 21% 45% 37% under benchmark.
Critical priority
Student Degree Completion Rate – 150%
N/A 28% 23% 15% N/A 50% None set at this time
Number of Degrees awarded 46 38 42 15
Number of Degrees awarded, by program
MOT = 8 AA = 10 AA, Voice = 20 AA, Acting = 6 AA, Dance = 6
MOT = 8 AA = 5 AA, Voice = 15 AA, Acting = 12 AA, Dance = 11 *5 are dual emphasis
MOT = 10 AA = 14 AA, Voice = 16* AA, Acting = 8* AA, Dance = 4 *4 are dual emphasis
MOT = 5 AA = 2 AA, Vocal = 7 AA, Acting = 3 AA, Dance = 3
MOT = CERT = 6 AA = 6 AA, vocal = 3 AA, Acting = 3
MOT = AA = AA, Voice = AA, Acting = AA, Dance =
Benchmark not applicable
Fall to Fall Retention Rate, AA seeking students
80% 73% 76% 71% 77% 75% 7% below benchmark
Freshman Persistence Rate, Fall to Spring
90% 97% 97% 91% 97% 90% 7% above benchmark
Sophomore Persistence Rate, Fall to Spring
90% 86% 88% 98% 81% 90% 4% below benchmark
Freshman Student Satisfaction
95% 100% 94% 98% 94% 95% 25% above benchmark
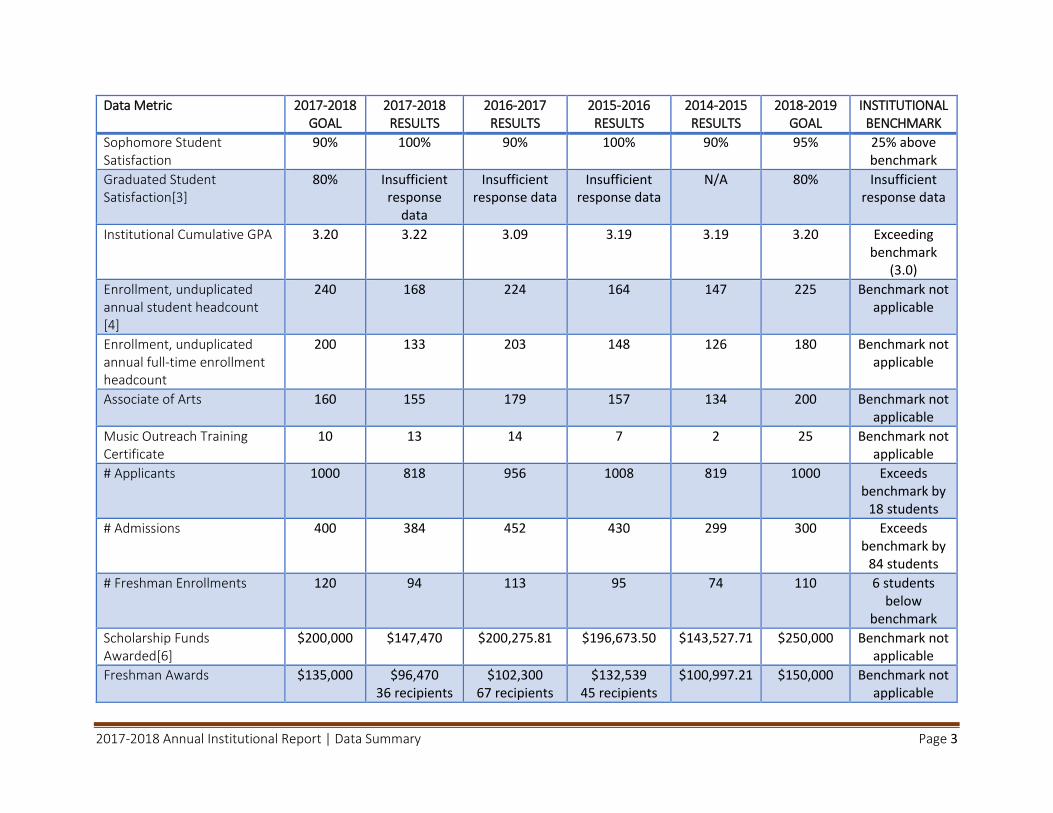
2017-2018 Annual Institutional Report | Data Summary Page 3
Data Metric 2017-2018 GOAL
2017-2018 RESULTS
2016-2017 RESULTS
2015-2016 RESULTS
2014-2015 RESULTS
2018-2019 GOAL
INSTITUTIONAL BENCHMARK
Sophomore Student Satisfaction
90% 100% 90% 100% 90% 95% 25% above benchmark
Graduated Student Satisfaction[3]
80% Insufficient response
data
Insufficient response data
Insufficient response data
N/A 80% Insufficient response data
Institutional Cumulative GPA 3.20 3.22 3.09 3.19 3.19 3.20 Exceeding benchmark
(3.0)
Enrollment, unduplicated annual student headcount [4]
240 168 224 164 147 225 Benchmark not applicable
Enrollment, unduplicated annual full-time enrollment headcount
200 133 203 148 126 180 Benchmark not applicable
Associate of Arts 160 155 179 157 134 200 Benchmark not applicable
Music Outreach Training Certificate
10 13 14 7 2 25 Benchmark not applicable
# Applicants 1000 818 956 1008 819 1000
Exceeds benchmark by
18 students
# Admissions 400 384 452 430 299 300 Exceeds benchmark by
84 students
# Freshman Enrollments 120 94 113 95 74 110 6 students below
benchmark
Scholarship Funds Awarded[6]
$200,000 $147,470 $200,275.81 $196,673.50 $143,527.71 $250,000 Benchmark not applicable
Freshman Awards $135,000 $96,470 36 recipients
$102,300 67 recipients
$132,539 45 recipients
$100,997.21 $150,000 Benchmark not applicable
2017-2018 Annual Institutional Report | Data Summary Page 4
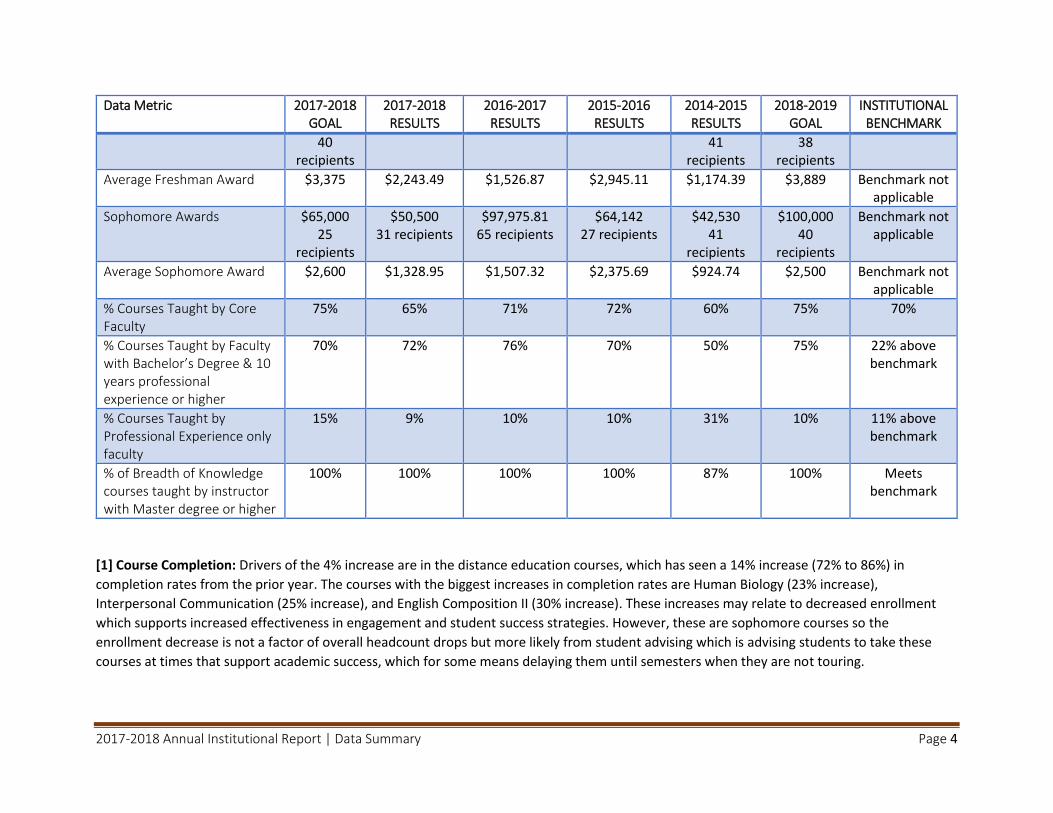
Data Metric 2017-2018 GOAL
2017-2018 RESULTS
2016-2017 RESULTS
2015-2016 RESULTS
2014-2015 RESULTS
2018-2019 GOAL
INSTITUTIONAL BENCHMARK
40 recipients
41 recipients
38 recipients
Average Freshman Award $3,375 $2,243.49 $1,526.87 $2,945.11 $1,174.39 $3,889 Benchmark not applicable
Sophomore Awards $65,000 25
recipients
$50,500 31 recipients
$97,975.81 65 recipients
$64,142 27 recipients
$42,530 41
recipients
$100,000 40
recipients
Benchmark not applicable
Average Sophomore Award $2,600 $1,328.95 $1,507.32 $2,375.69 $924.74 $2,500 Benchmark not applicable
% Courses Taught by Core Faculty
75% 65% 71% 72% 60% 75% 70%
% Courses Taught by Faculty with Bachelor’s Degree & 10 years professional experience or higher
70% 72% 76% 70% 50% 75% 22% above benchmark
% Courses Taught by Professional Experience only faculty
15% 9% 10% 10% 31% 10% 11% above benchmark
% of Breadth of Knowledge courses taught by instructor with Master degree or higher
100% 100% 100% 100% 87% 100% Meets benchmark
[1] Course Completion: Drivers of the 4% increase are in the distance education courses, which has seen a 14% increase (72% to 86%) in
completion rates from the prior year. The courses with the biggest increases in completion rates are Human Biology (23% increase),
Interpersonal Communication (25% increase), and English Composition II (30% increase). These increases may relate to decreased enrollment
which supports increased effectiveness in engagement and student success strategies. However, these are sophomore courses so the
enrollment decrease is not a factor of overall headcount drops but more likely from student advising which is advising students to take these
courses at times that support academic success, which for some means delaying them until semesters when they are not touring.
2017-2018 Annual Institutional Report | Data Summary Page 5
[2] Degree Completion Rate: Remains static from prior year at 28%. In analyzing the students who are not completing within the 100%
completion rate the following was noted:
There are 14 students still pursuing the AA degree into Fall 2018
56 students became inactive since their entrance term. Of those who became inactive 1 cited health reasons, 1 cited financial
reasons, 1 cited other reasons, and the remaining 53 cited personal reasons
3 students did not complete their freshman year
18 students did not return to begin their sophomore year
12 students withdrew between the fall and spring semesters in their sophomore year
23 students did not complete over the summer 2018 term or return in fall 2018 to complete
Focusing retention efforts on the students close to completion but not fully completing is an improvement action planned for 2018-2019.
Additionally, the impact of receiving accreditation may change this outcome going forward as well.
[3] Graduation Satisfaction: Response rates from graduates remain too low for any of the data to be meaningful or reflective. Improvement
action has been identified for this area and will require direct outreach.
[4] Unduplicated Headcount: This number fell dramatically in the 2017-2018 academic year. The largest driver was the decline in freshman
enrollment: 98 in fall 2016 to 68 in fall 2017. Further compounding the headcount decline was the retention rate decline of 3%.
[5] Applicants: The drop in the number of applicants for the fall 2017 entrance term predicates the drop-in enrollment. Actions plans to enhance
recruitment and thus address applicants and enrollment levels were developed during the year and are attached as supplemental materials of
this report.
[6] Scholarship Awards: The decline in scholarship funds is two-fold. Awards were refocused to boost average award amount, knowing the
overall number of students receiving aid would decline. Furthermore, as enrollment levels fell below projections and revenue projects declines,
awards made as institutional expenses were cut due to insufficient funding to support the awards.
[7] Core Faculty: The decline in percentage of courses taught by course faculty was due to a key faculty member taking family medical leave on
short notice. To cover the full load of courses normally taught by the faculty member, teaching assignments were given to non-core faculty
members on an interim basis. Faculty member has returned for the 2018-2019 academic year.
2017-2018 Annual Institutional Report | Disaggregated Data Page 6
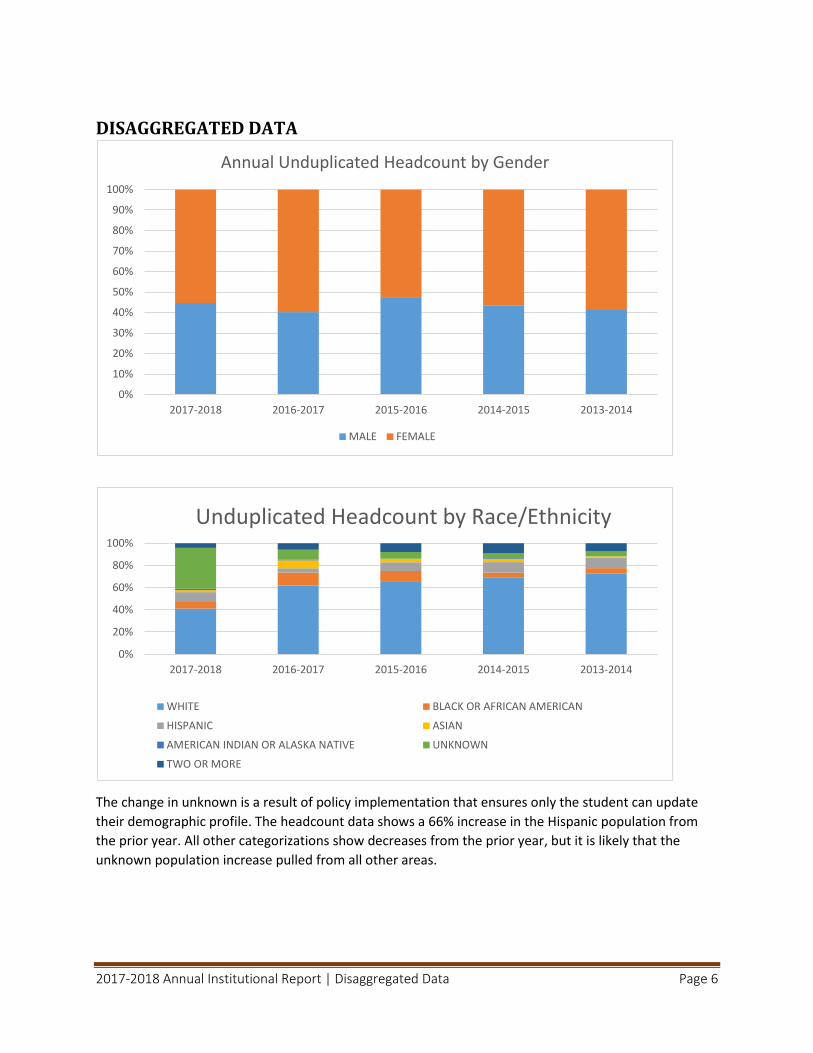
DISAGGREGATED DATA
The change in unknown is a result of policy implementation that ensures only the student can update
their demographic profile. The headcount data shows a 66% increase in the Hispanic population from
the prior year. All other categorizations show decreases from the prior year, but it is likely that the
unknown population increase pulled from all other areas.
0%
10%
20%
30%
40%
50%
60%
70%
80%
90%
100%
2017-2018 2016-2017 2015-2016 2014-2015 2013-2014
Annual Unduplicated Headcount by Gender
MALE FEMALE
0%
20%
40%
60%
80%
100%
2017-2018 2016-2017 2015-2016 2014-2015 2013-2014
Unduplicated Headcount by Race/Ethnicity
WHITE BLACK OR AFRICAN AMERICAN
HISPANIC ASIAN
AMERICAN INDIAN OR ALASKA NATIVE UNKNOWN
TWO OR MORE
2017-2018 Annual Institutional Report | Disaggregated Data Page 7
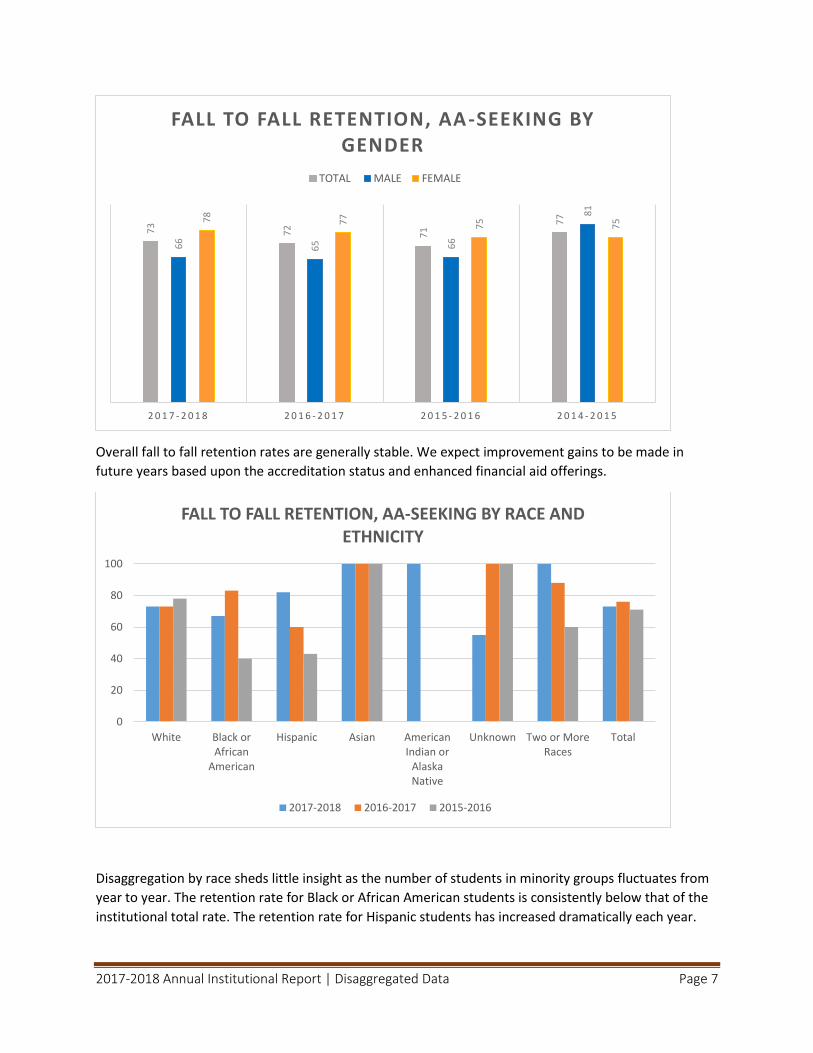
Overall fall to fall retention rates are generally stable. We expect improvement gains to be made in
future years based upon the accreditation status and enhanced financial aid offerings.
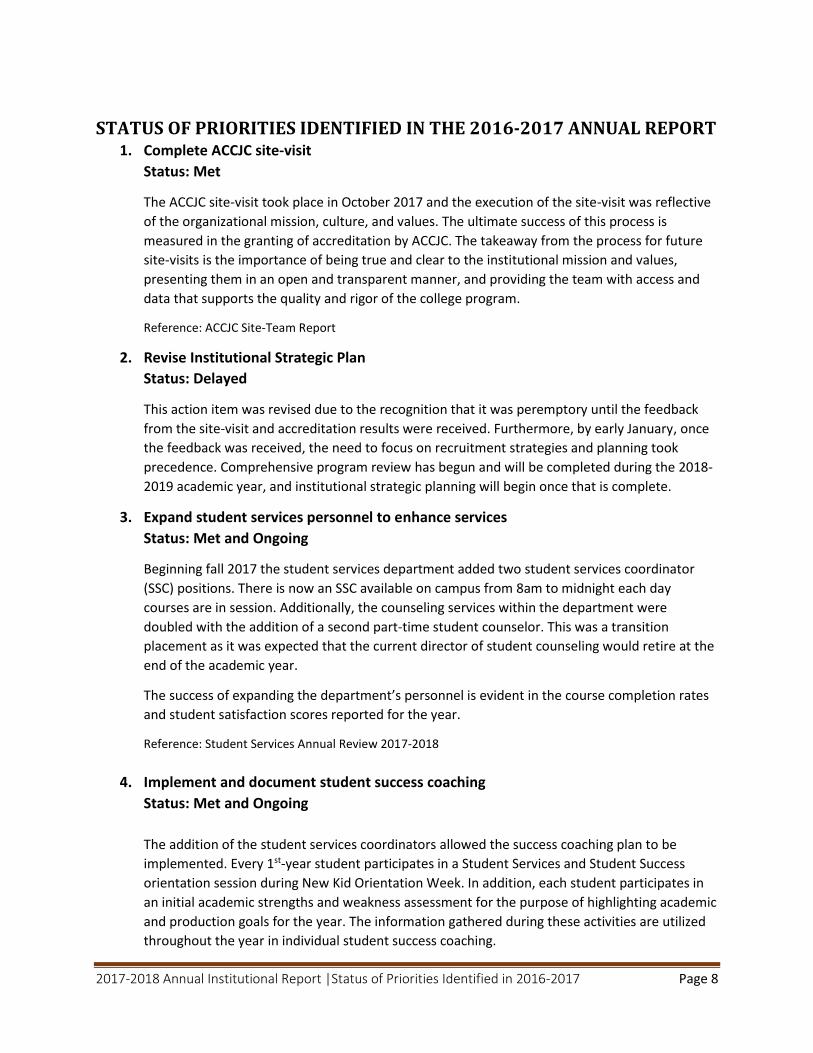
Disaggregation by race sheds little insight as the number of students in minority groups fluctuates from
year to year. The retention rate for Black or African American students is consistently below that of the
institutional total rate. The retention rate for Hispanic students has increased dramatically each year.
73
72
71
77
66
65 66
81
78
77
75
75
2 0 1 7 - 2 0 1 8 2 0 1 6 - 2 0 1 7 2 0 1 5 - 2 0 1 6 2 0 1 4 - 2 0 1 5
FALL TO FALL RETENTION, AA-SEEKING BY GENDER
TOTAL MALE FEMALE
0
20
40
60
80
100
White Black orAfrican
American
Hispanic Asian AmericanIndian or
AlaskaNative
Unknown Two or MoreRaces
Total
FALL TO FALL RETENTION, AA-SEEKING BY RACE AND ETHNICITY
2017-2018 2016-2017 2015-2016
2017-2018 Annual Institutional Report |Status of Priorities Identified in 2016-2017 Page 8
STATUS OF PRIORITIES IDENTIFIED IN THE 2016-2017 ANNUAL REPORT 1. Complete ACCJC site-visit
Status: Met
The ACCJC site-visit took place in October 2017 and the execution of the site-visit was reflective
of the organizational mission, culture, and values. The ultimate success of this process is
measured in the granting of accreditation by ACCJC. The takeaway from the process for future
site-visits is the importance of being true and clear to the institutional mission and values,
presenting them in an open and transparent manner, and providing the team with access and
data that supports the quality and rigor of the college program.
Reference: ACCJC Site-Team Report
2. Revise Institutional Strategic Plan
Status: Delayed
This action item was revised due to the recognition that it was peremptory until the feedback
from the site-visit and accreditation results were received. Furthermore, by early January, once
the feedback was received, the need to focus on recruitment strategies and planning took
precedence. Comprehensive program review has begun and will be completed during the 2018-
2019 academic year, and institutional strategic planning will begin once that is complete.
3. Expand student services personnel to enhance services
Status: Met and Ongoing
Beginning fall 2017 the student services department added two student services coordinator
(SSC) positions. There is now an SSC available on campus from 8am to midnight each day
courses are in session. Additionally, the counseling services within the department were
doubled with the addition of a second part-time student counselor. This was a transition
placement as it was expected that the current director of student counseling would retire at the
end of the academic year.
The success of expanding the department’s personnel is evident in the course completion rates
and student satisfaction scores reported for the year.
Reference: Student Services Annual Review 2017-2018
4. Implement and document student success coaching
Status: Met and Ongoing
The addition of the student services coordinators allowed the success coaching plan to be
implemented. Every 1st-year student participates in a Student Services and Student Success
orientation session during New Kid Orientation Week. In addition, each student participates in
an initial academic strengths and weakness assessment for the purpose of highlighting academic
and production goals for the year. The information gathered during these activities are utilized
throughout the year in individual student success coaching.
2017-2018 Annual Institutional Report |Status of Priorities Identified in 2016-2017 Page 9
Students are able to meet with Student Services Coordinators (SSCs) to discuss and devise strategies for academic as well as personal success. Students meet with SSCs in both one-to-one and small group settings. Reference: Student Services Annual Review 2017-2018
5. Improve course completion in distance education courses
Status: Ongoing
The course completion rate for distance education courses increased from 72% in 2016-2017 to 86% for 2017-2018. Headcount enrollment in distance education courses dropped by 22% from the prior year. This decrease is 9% higher than the overall decrease in unduplicated enrollment in the AA program. The enrollment drop in these courses is driven by academic success advising for low performing students who are finding alternate ways to complete the course requirements rather than take the courses in a distance education format and then fail the course. The exception to this trend is ENG 112 and the practicum-based courses. ENG 112 has a course completion rate increase of 30% (42% to 72%) with an enrollment decrease of just 9%. The practicum courses all had enrollment increases as well as course completion rate increases. Reference: Course Completion Data Table
6. Continue to improve student body diversity to be more reflective of global community
Status: Ongoing
Evaluating this goal is challenging given the transition to ensuring race and ethnicity
demographics are completed by the student and not by a staff member. This has led to an
increase of the unknown category in race and ethnicity of 24%, and now accounts for 38% of the
student body.
Given the enrollment drop of freshman from fall 2016 to fall 2017, recruitment and enrollment
management planning was undertaken. Successful implementation of this newly-developed
recruitment plan will have cross-over into addressing the diversity of the student body.
Reference: Administrative Services Annual Review Report
7. Continue developing information literacy programs
Status: Ongoing
The librarians have worked with various members of the core faculty to design the library pages to accommodate and reflect the needs of their programs. Two trials to databases were organized for faculty to explore additional licensed programmatic resources. Communication with Chairs and Dean of Instruction has increased as the library works to attain an increase in assignments requiring the use of the library. Reference: Library Department Annual Report 2017-2018
2017-2018 Annual Institutional Report |Status of Priorities Identified in 2016-2017 Page 10
8. Improve processes related to faculty evaluation and development
a. Establish comprehensive annual review process for core faculty Status: Met The annual evaluation process for core faculty members was begun. The process
includes utilizing the review form for self-assessment and collaborative review with the
appropriate department chair and dean of instruction.
b. Build faculty pedagogical skills Status: Met This goal was kicked off at the beginning of last academic year with an assignment for
each instructor to share their “statement of philosophy” around their teaching
practices. These statements were shared out during a full faculty meeting. Faculty who
have no formal teacher training background dug into the assignment, reflected on their
teaching, mapped it to our institution’s goals, and reported back. The exchange was
particularly rich with engagement, and even those faculty with less formal teaching
experience found the exercise helpful.
Fast forward from that meeting to this year’s New Kids orientation, and the outcome of
our “pedagogical development” efforts was fully demonstrated. As our department
chairs and faculty introduced their programs to our New Kids, they all expressed a
common, cohesive perspective on what “teaching” and “learning” means at YACPA. At
this point, one could ask any one of our faculty—including our most recent—about what
teaching and learning means to them, and they would express similar thoughts about
the value of engagement, student-centered learning, growth mindset, etc. and would be
able to provide examples of what that looks like in their classroom—all concrete
evidence of our pedagogical development efforts aimed at creating a defined culture of
student-centered teaching and learning at YACPA.
Reference: Annual Academic Instructional Report 2017-2018
c. Evaluate tour class facilitation
Status: Delayed
To date, due to the logistics, tour classes and their associated instructors have not been
observed and evaluated as all other on-campus courses are on a regular 2-year rotation.
During the 2016-17 academic year, we had hoped to figure out a means to coordinate
observation of the practicum courses by the Dean of Instruction at at least one site. That
did not happen. We do have a plan for this academic year, involving GoReact, which we
now have access to for use with all of our students (freshmen and sophomores). That
process involves students recording their work (or being recorded) as well as recorded
feedback from instructor of record. “Observation” will be remote, but with concrete
documentation that can be reviewed and retained.
2017-2018 Annual Institutional Report |Status of Priorities Identified in 2016-2017 Page 11
Reference: Annual Academic Instructional Report 2017-2018
9. Implement streamlined process for communication, reporting, and documentation
a. Further development of academic advising process
Status: Partially Met & Ongoing
Efforts were made to continue improving academic advising to connect the dots between entrance to program, progress throughout, and next steps afterward for students. Efforts included webpage updates highlighting program and emphasis options, utilization of student degree audits to highlight progress, and advising sessions offered to sophomores wanting to explore post-graduation options. We are currently developing and researching steps for providing more focused and comprehensive advising to students.
Reference: Administrative Services Annual Review Report
b. Integrated process for SLO/PLO reporting
Status: Not Met
Personnel bandwidth has left this goal largely unaddressed. The decisions to end the TK-
20 contract was made, replacement efforts have been weak. It is anticipated that Populi
will be releasing a module for these areas in the coming year. This further stalled efforts
to develop a system.
c. EOL program for equipment and technology
Status: Delayed Was not addressed in 2017-2018. Implementation of an organization-wide inventory
system in 2018-2019 will bring this into focus and priority.
2017-2018 Annual Institutional Report |Department Report Overview Page 12
DEPARTMENT REPORT OVERVIEW Department Reports are attached in supplemental documents
Administrative Services: The administrative services department reported four partially-met goals for 2017-2018. The scope of each goal involves a multi-year process to achieve a fully-met status. Improvement plans are established to guide continued development towards meeting goals.
Student Services: The student services department met all goals for the year.
Instruction: The instructional division reported four met and one not-met goals for 2017-2018. One goal from 2016-2017 that was unmet fulfilled its action plan and is considered met and ongoing. The unmet goal continues to be the observation of the practicum courses given the associated logistical challenges. This will be rectified in spring semester of 2018-2019 as the tour will be in the Southern California area.
Music Department: Reported one goal met and two goals partially met.
Dance Department: Reported meeting all 3 goals. Theatre Department: Reported one met goal and two partially-met goals. Breadth-of-Knowledge Department: Reported three met goals.
Library Department: Reported one goal partially met.
2017-2018 Annual Institutional Report |Institutional Effectiveness: Student Learning Page 13
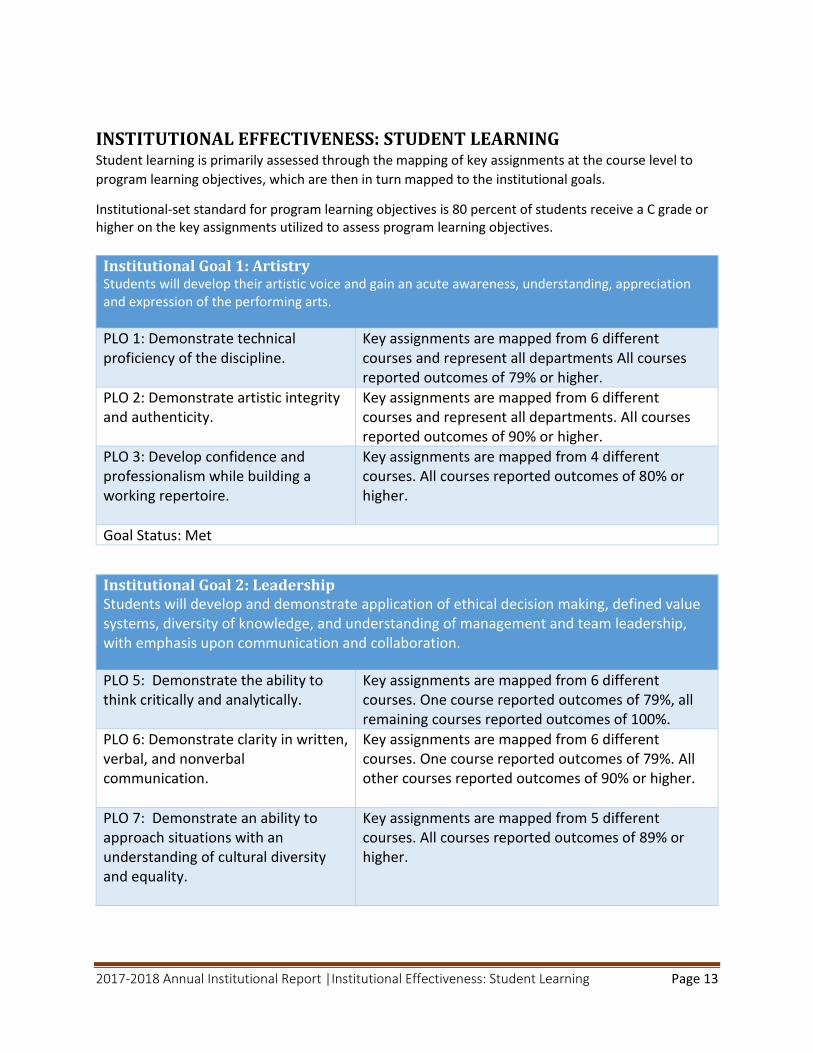
INSTITUTIONAL EFFECTIVENESS: STUDENT LEARNING Student learning is primarily assessed through the mapping of key assignments at the course level to
program learning objectives, which are then in turn mapped to the institutional goals.
Institutional-set standard for program learning objectives is 80 percent of students receive a C grade or higher on the key assignments utilized to assess program learning objectives.
Institutional Goal 1: Artistry Students will develop their artistic voice and gain an acute awareness, understanding, appreciation and expression of the performing arts.
PLO 1: Demonstrate technical proficiency of the discipline.
Key assignments are mapped from 6 different courses and represent all departments All courses reported outcomes of 79% or higher.
PLO 2: Demonstrate artistic integrity and authenticity.
Key assignments are mapped from 6 different courses and represent all departments. All courses reported outcomes of 90% or higher.
PLO 3: Develop confidence and professionalism while building a working repertoire.
Key assignments are mapped from 4 different courses. All courses reported outcomes of 80% or higher.
Goal Status: Met
Institutional Goal 2: Leadership Students will develop and demonstrate application of ethical decision making, defined value systems, diversity of knowledge, and understanding of management and team leadership, with emphasis upon communication and collaboration.
PLO 5: Demonstrate the ability to think critically and analytically.
Key assignments are mapped from 6 different courses. One course reported outcomes of 79%, all remaining courses reported outcomes of 100%.
PLO 6: Demonstrate clarity in written, verbal, and nonverbal communication.
Key assignments are mapped from 6 different courses. One course reported outcomes of 79%. All other courses reported outcomes of 90% or higher.
PLO 7: Demonstrate an ability to approach situations with an understanding of cultural diversity and equality.
Key assignments are mapped from 5 different courses. All courses reported outcomes of 89% or higher.
2017-2018 Annual Institutional Report |Institutional Effectiveness: Student Learning Page 14
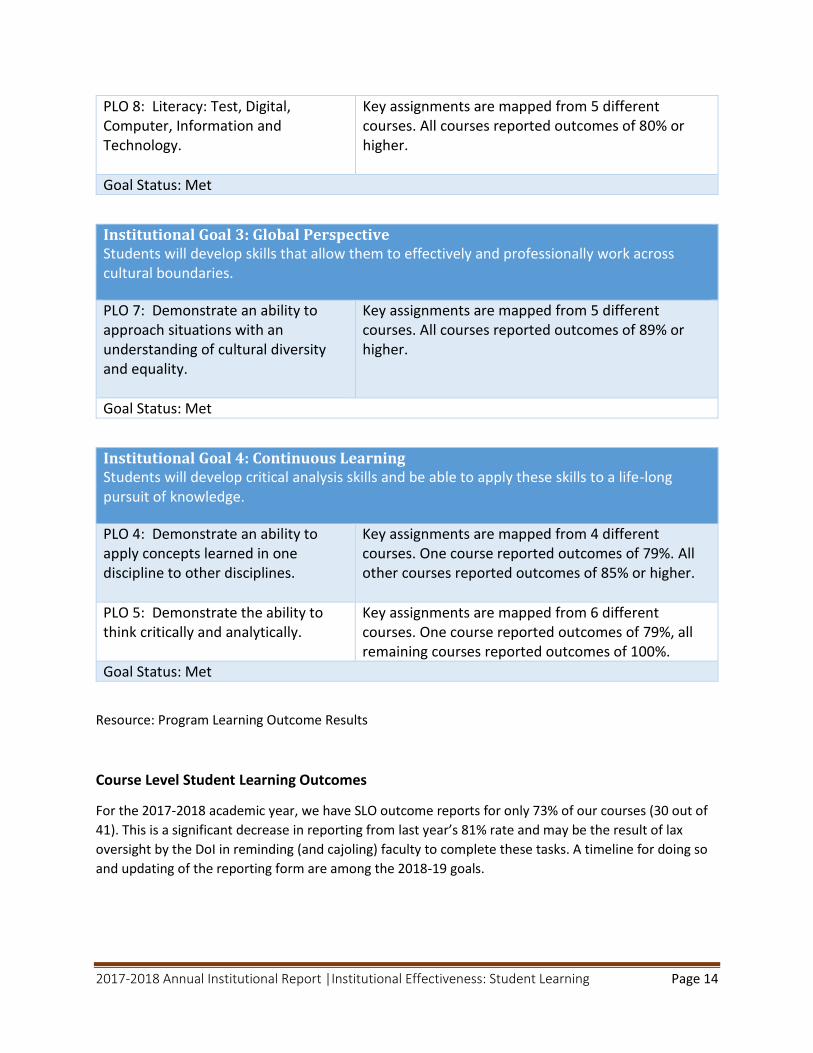
PLO 8: Literacy: Test, Digital, Computer, Information and Technology.
Key assignments are mapped from 5 different courses. All courses reported outcomes of 80% or higher.
Goal Status: Met
Institutional Goal 3: Global Perspective Students will develop skills that allow them to effectively and professionally work across cultural boundaries.
PLO 7: Demonstrate an ability to approach situations with an understanding of cultural diversity and equality.
Key assignments are mapped from 5 different courses. All courses reported outcomes of 89% or higher.
Goal Status: Met
Institutional Goal 4: Continuous Learning Students will develop critical analysis skills and be able to apply these skills to a life-long pursuit of knowledge.
PLO 4: Demonstrate an ability to apply concepts learned in one discipline to other disciplines.
Key assignments are mapped from 4 different courses. One course reported outcomes of 79%. All other courses reported outcomes of 85% or higher.
PLO 5: Demonstrate the ability to think critically and analytically.
Key assignments are mapped from 6 different courses. One course reported outcomes of 79%, all remaining courses reported outcomes of 100%.
Goal Status: Met
Resource: Program Learning Outcome Results
Course Level Student Learning Outcomes
For the 2017-2018 academic year, we have SLO outcome reports for only 73% of our courses (30 out of
41). This is a significant decrease in reporting from last year’s 81% rate and may be the result of lax
oversight by the DoI in reminding (and cajoling) faculty to complete these tasks. A timeline for doing so
and updating of the reporting form are among the 2018-19 goals.
2017-2018 Annual Institutional Report |Institutional Effectiveness: Student Learning Page 15
Seventy percent (70%) of the courses reporting SLO results (21 out of 30) hit or exceeded all of their
goals for student outcomes on their selected objectives (down from 89% the previous year). Of the nine
that did not, six had one LO that didn’t reach goal and three missed two targets.
Specific interventions (for 2018-2019 implementation) for the courses that did not meet their outcomes
have been documented and discussed with faculty. The overwhelming majority of issues relate to
students simply not submitting a completed assignment. Most of the interventions proposed for these
instances include having students complete the assignment in class. We will also discuss whether
increasing the point value of these assignments might make a difference; the significance of the learning
task may not be expressed well in its point value and thus students may not consider the assignment as
particularly important. Another common issue across courses are terminology and concept quizzes (be
they for dance, theater, or other); our students tend to generally do more poorly on these. Interventions
here include testing students closer to the time of introduction, repeated practice paring action to term
(for dance at least), and we will discuss whether some form of student-led demonstration/quizzing may
also be beneficial.
Reference: Annual Academic Instructional Report 2017-2018
2017-2018 Annual Institutional Report |Institutional Effectiveness: Student Achievement Page 16
INSTITUTIONAL EFFECTIVENESS: STUDENT ACHEIVEMENT Student achievement is measured by specific points of completion, monitored for longitudinal trends, and disaggregated based upon programs of study, modes of delivery, gender, and race and ethnicity. Course Completion: The course completion rate increased by 4% from the prior year and it exceed institutional-set standards. The increased also occurred in the first year of implementation of setting a 70% final score or C as the passing level for each course. The recommendation from faculty for the change was the impact it would have on student effort in the course. The course of most concern with the change in passing level was Music Theory I. To address the concern, a placement test was developed and a music fundamental course developed for those students who didn’t place into MU 130. The course completion rate for music fundamentals was 93% and music theory I was 83%. The year over year increase in Music Theory I was 7%. The total enrollment level from the prior year decreased by 20% which may also have impacted student achievement. Course completion disaggregated by department shows the three arts departments (Music, Theatre, and Dance) having course completion rates above the institutional-set standard of 90%. The breadth of knowledge department reports an 85% course completion rate, which is an increase of 10% from the prior year. Course completion disaggregated by mode of delivery shows a 9-point gap between face-to-face and
distance education courses. In the prior year the gap was 23 points. The courses with the biggest
increases in completion rates are Human Biology (23% increase), Interpersonal Communication (25%
increase), and English Composition II (30% increase). These are sophomore courses, so the enrollment
decrease is not a factor of overall headcount drops but more likely from student advising which is
encouraging students to take these courses at times that align with their touring schedules.
Course completion disaggregated by gender shows an overall gap of 6 points with female student completion rate at 96% and the male completion rate at 90%. Both rates are meeting or above the institutional-set standard and thus are not concerning. Course completion disaggregated by race and ethnicity shows all categories reporting course completion rates between 90% and 94% with the exception of Asian students. The course completion rate for Asian students is 50%. The unduplicated headcount of Asian students for the reporting year was 3. Thus the sample size is too small for the course completion rate to be reflective of the Asian student population as a whole. Degree Completion:
Remains static from prior year at 28%. In analyzing the students who are not completing within the
100% completion rate the following was noted:
There are 14 students still pursuing the AA degree into Fall 2018
2017-2018 Annual Institutional Report |Institutional Effectiveness: Student Achievement Page 17
56 students became inactive since their entrance term. Of those who became inactive 1
cited health reasons, 1 cited financial reasons, 1 cited other reasons, and the remaining
53 cited personal reasons
3 students did not complete their freshman year
18 students did not return to begin their sophomore year
12 students withdrew between the fall and spring semesters in their sophomore year
23 students did not complete over the summer 2018 term or return in fall 2018 to
complete
Focusing retention efforts on the students close to completion but not fully completing is an
improvement action planned for 2018-2019. Additionally, the impact of receiving accreditation may
change this outcome going forward as well.
Disaggregated data by emphasis, gender and ethnicity do not have sufficient longitudinal data for this small of a population size and thus provide little insight at this time.
2017-2018 Annual Institutional Report |Institutional Effectiveness: Academic Quality Page 18
INSTITUTIONAL EFFECTIVENESS: ACADEMIC QUALITY Academic quality is measured by retention rates, student feedback, graduate feedback, faculty assignments, institutional aid awards, and expense allocations. These factors combined help ensure the academic experience is reflective of the student body and supportive of their educational and personal goals.
Retention Rates: The-fall to-fall retention rate for AA-seeking students was 3% above the institutional
bench mark of 70% and 3% lower than the 2016-2017 year. When disaggregated by gender, the male
rate increased by 22% and the female rate fell by 12%. This is due to the impact that casting of Young
American tours has with student retention, and the imbalance in gender in the fall 2016 freshman class.
As the tour casts are choral-based the cast membership is evenly male and female to cover all choral
parts (bass, tenor, alto, soprano). The odds of a female student making a cast were greatly reduced and
thus impacted retention into second year.
The fall-to- spring retention rate for freshman (97%) remained unchanged from the prior year. The
sophomore fall-to-spring retention rate decreased by 2%. Disaggregation by gender reveals further
casting impacts as the male sophomore fall-to- spring retention rate increased by 8% from the prior year
while the female rate decreased by 9%.
Student Feedback: The student satisfaction surveys conducted by student services of both first-year and
second-year students both reported satisfaction results of 100%. The first-year student survey has 82%
of the cohort reporting. The second-year has student survey has 29% of the cohort reporting.
First-Year consensus is overwhelmingly positive, with concerns in areas generally reported each year,
and are reflective of the student learning and growth process. 22% report they do not feel that they
have a voice in the organizational community; this is a topic for further discussion and analysis.
The second-year results indicated no areas of concern: however, those response rates were too low to
be reliable and truly reflective of the student experience.
Reference: Freshman Student Satisfaction Survey Report 2017-2018 and Sophomore Student Satisfaction Survey
Report 2017-2018
Graduate Feedback: Data received is still too limited and insignificant to draw any conclusions. A
contributing factor is the carryover of YACPA graduates remaining as YA cast members for another year
or more, thus they do not perceive themselves as graduates and are unable to respond.
Faculty Assignments: As a performing arts institution, professional experience carries significant importance and provides a necessary bridge between theory and application for students. However, the balance between professional experience and academic credentials must be maintained across the institution and thus the following benchmarks were developed to ensure the overall faculty mix is committed to the development and sustainability of the College, and also sufficient in the number and qualifications to deliver quality of educational programs and services in alignment with institutional mission and purposes.
% Courses Taught by Core Faculty: Measures the percentage of curriculum offered in an academic year that is instructed by a core faculty member. Core faculty members are the
2017-2018 Annual Institutional Report |Institutional Effectiveness: Academic Quality Page 19
equivalent of full-time faculty in regards to their commitment to the development and sustainability of the College and their active participation in planning, curriculum development, and institutional effectiveness. The institutional-set standard is for a minimum of 70% of course work to be assigned to core faculty. 65% of course were taught by core faculty members in 2017-2018. The decline in percentage of courses taught by course faculty was due to a key faculty member taking family medical leave on short notice. To cover the full load of courses normally taught by the faculty member teaching assignments were given to non-core faculty members on an interim basis. Faculty member has returned for the 2018-2019 academic year. % Courses Breadth-of-Knowledge Courses Taught by faculty with Masters Degrees: Measures courses mapped to breadth-of-knowledge goals, which tend to be more academic and theoretical in nature than our performance courses. The institutional-set standard is a minimum of 100% of course work to be assigned to faculty holding a Masters degree or higher.
100% of breadth-of-knowledge required courses were taught by faculty holding a Masters degree or higher.
% Courses Taught by Bachelors with 10-years’ Experience: Measures the percentage of curriculum offered in an academic year that is instructed by faculty members who hold a Bachelor’s degree and ten years’ professional experience as a minimum set of credentials. The institutional-set standard is a minimum of 50% of courses offered are to be assigned to faculty holding at least a Bachelor’s degree and ten years’ professional experience. 72% of courses were taught by faculty holding a Bachelor’s degree and 10-years’ experience or higher. % Courses Taught by Subject Specialist Faculty: Measures the percentage of curriculum offered in an academic year that this instructed by faculty with professional experience only. The institutional-set standard is a maximum of 20% of courses offered.
3% of courses were taught by subject specialist faculty.
Reference: 2017-2018 Faculty Load Assessment
Expense Allocations: As a measure of academic quality, expense allocations provide measures to help ensure resources are allocated in alignment with supporting student learning needs. The College currently is allocating resources in response to annual review and priorities established by faculty, staff and leadership; institutional-set benchmarks are not purposeful at this time.
2017-2018 Annual Institutional Report |Institutional Effectiveness: Academic Quality Page 20
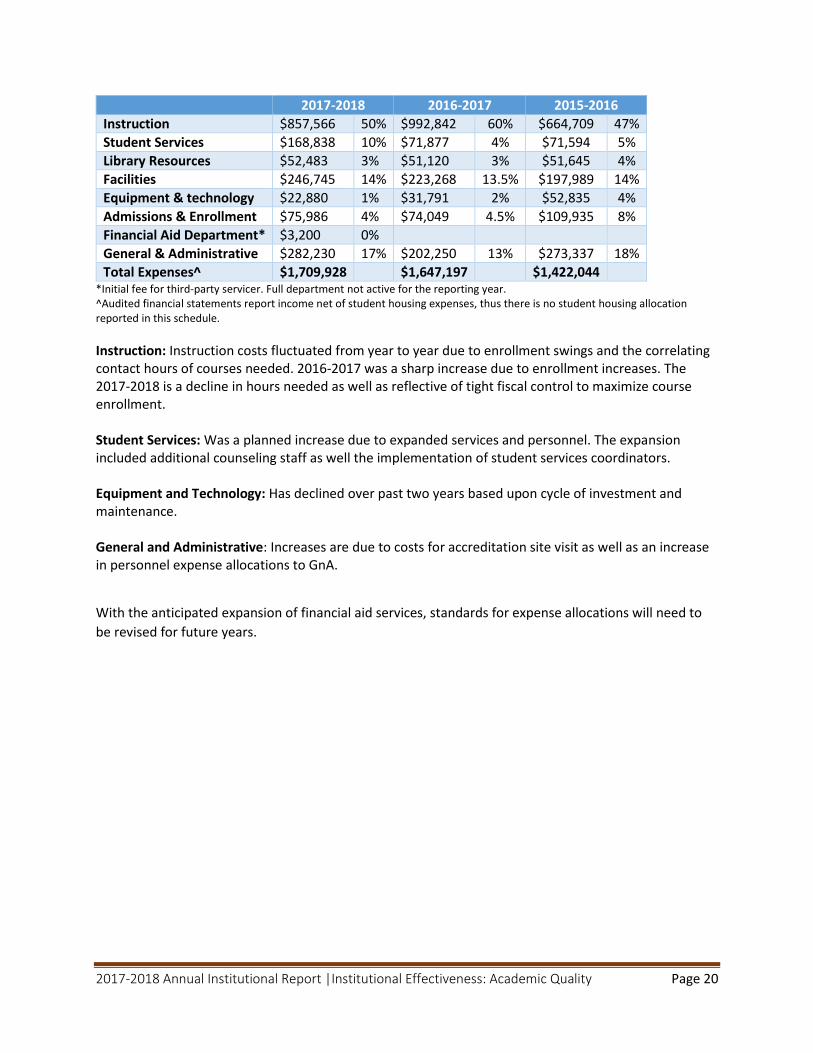
2017-2018 2016-2017 2015-2016
Instruction $857,566 50% $992,842 60% $664,709 47%
Student Services $168,838 10% $71,877 4% $71,594 5%
Library Resources $52,483 3% $51,120 3% $51,645 4%
Facilities $246,745 14% $223,268 13.5% $197,989 14%
Equipment & technology $22,880 1% $31,791 2% $52,835 4%
Admissions & Enrollment $75,986 4% $74,049 4.5% $109,935 8%
Financial Aid Department* $3,200 0%
General & Administrative $282,230 17% $202,250 13% $273,337 18%
Total Expenses^ $1,709,928 $1,647,197 $1,422,044 *Initial fee for third-party servicer. Full department not active for the reporting year. ^Audited financial statements report income net of student housing expenses, thus there is no student housing allocation reported in this schedule.
Instruction: Instruction costs fluctuated from year to year due to enrollment swings and the correlating contact hours of courses needed. 2016-2017 was a sharp increase due to enrollment increases. The 2017-2018 is a decline in hours needed as well as reflective of tight fiscal control to maximize course enrollment. Student Services: Was a planned increase due to expanded services and personnel. The expansion included additional counseling staff as well the implementation of student services coordinators. Equipment and Technology: Has declined over past two years based upon cycle of investment and maintenance. General and Administrative: Increases are due to costs for accreditation site visit as well as an increase in personnel expense allocations to GnA.
With the anticipated expansion of financial aid services, standards for expense allocations will need to
be revised for future years.
2017-2018 Annual Institutional Report |Financials Page 21
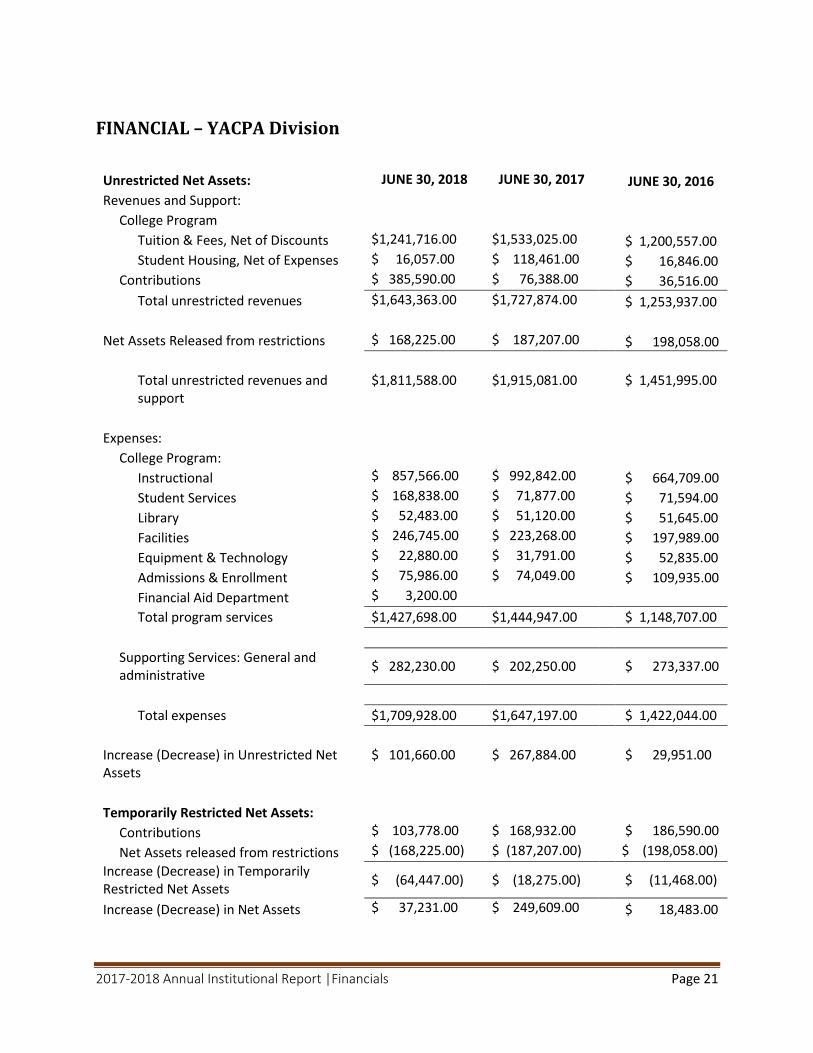
FINANCIAL – YACPA Division
Unrestricted Net Assets: JUNE 30, 2018 JUNE 30, 2017 JUNE 30, 2016
Revenues and Support:
College Program
Tuition & Fees, Net of Discounts $1,241,716.00 $1,533,025.00 $ 1,200,557.00
Student Housing, Net of Expenses $ 16,057.00 $ 118,461.00 $ 16,846.00
Contributions $ 385,590.00 $ 76,388.00 $ 36,516.00
Total unrestricted revenues $1,643,363.00 $1,727,874.00 $ 1,253,937.00
Net Assets Released from restrictions $ 168,225.00 $ 187,207.00 $ 198,058.00
Total unrestricted revenues and support
$1,811,588.00 $1,915,081.00 $ 1,451,995.00
Expenses:
College Program:
Instructional $ 857,566.00 $ 992,842.00 $ 664,709.00
Student Services $ 168,838.00 $ 71,877.00 $ 71,594.00
Library $ 52,483.00 $ 51,120.00 $ 51,645.00
Facilities $ 246,745.00 $ 223,268.00 $ 197,989.00
Equipment & Technology $ 22,880.00 $ 31,791.00 $ 52,835.00
Admissions & Enrollment $ 75,986.00 $ 74,049.00 $ 109,935.00
Financial Aid Department $ 3,200.00
Total program services $1,427,698.00 $1,444,947.00 $ 1,148,707.00
Supporting Services: General and administrative
$ 282,230.00 $ 202,250.00 $ 273,337.00
Total expenses $1,709,928.00 $1,647,197.00 $ 1,422,044.00
Increase (Decrease) in Unrestricted Net Assets
$ 101,660.00 $ 267,884.00 $ 29,951.00
Temporarily Restricted Net Assets:
Contributions $ 103,778.00 $ 168,932.00 $ 186,590.00
Net Assets released from restrictions $ (168,225.00) $ (187,207.00) $ (198,058.00)
Increase (Decrease) in Temporarily Restricted Net Assets
$ (64,447.00) $ (18,275.00) $ (11,468.00)
Increase (Decrease) in Net Assets $ 37,231.00 $ 249,609.00 $ 18,483.00
2017-2018 Annual Institutional Report |Financials Page 22
The enrollment drop in the freshman class of 2017 from 2016 had a significant impact upon the financial
operations for the entire fiscal year. The contributed revenue allocations from the parent entity filled
the gap and helped ensure expense cuts were not damaging to the student learning experience.
The increased expenses in student services were planned and contracted prior to enrollment level
realities. It was determined, given the feedback from the prior year, that continuing with those
improvement plans was necessary to ensure the student learning experience was stabilized and
developed in a manner that would allow the institution to successfully and sustainably support student
learning experiences as enrollment levels rebuild to the fall 2016 level.
Recognizing the tuition rates had remained unchanged for four years while the overhead and
operational expenses have continued to rise, a full review and assessment of tuition and break-even
points was completed. The analysis sought to find a tuition rate that was sufficient to ensure financial
stability while limiting enrollment suppression impacts.
References:
The Young Americans, Inc. Audited Financial Statements
YACPA Tuition Analysis Report
2017-2018 Annual Institutional Report |2015-2020 Strategic Plan Status Report Page 23
2015-2020 STRATEGIC PLAN STATUS REPORT GOAL 1: Improve Student Success
OBJECTIVE METRIC TARGET CURRENT STATUS
1. Increase completion rate of programs of study.
% completers within 100% of stated completion time (2.5years)/# enrolled who in program with target completion date
65% 28% CRITICAL AREA OF FOCUS
2. Decrease achievement gaps between student performances in general education courses as compared to major related/performance-based courses.
Course completion rate for breadth of knowledge courses compared to course completion rate for performance core courses.
Breadth of Knowledge course completion rate = 80% Performance Core course completion rate = 90%
Targets met for first year. Sustainability now the goal. Breadth of Knowledge course completion rate = 85% Performance Core average final score = 96%
3. Increase student engagement in learning support services.
# of students with GPAs lower than 2.5 utilizing success coaching. % of students seeking support from student services.
Success Coaching = 90% Student Services = 50%
On track for completion although metrics may differ.
4. Develop and integrate student information literacy program.
Increase in library resources and collections Student participation in library orientation Number of course syllabi with embedded library assignments
Number of library resources to meet information needs 100% 100% Breadth courses and 75% all other courses
On track to meet target by end of plan. Virtual library implemented with multiple databases added. 100% of freshman and sophomore students completed orientation.
2017-2018 Annual Institutional Report |2015-2020 Strategic Plan Status Report Page 24
ACTION ITEMS
1. Implement collection and tracking of educational goal planning for students. (Student Services | Objective 1)
Student surveys conducted upon arrival on campus for freshman students.
Sophomore academic advising was implemented. 2018-2019 plans include dedicated office hours and increased
outreach to students.
2. Implement academic advising procedures and services for students. (Administrative Services | Objective 1)
In progress.
3. Establish defined tutoring services available to students to support persistence. (Student Services | Objective 1 & 2)
Completed: Robust program was implemented in 2016-2017.
4. Assess program sequencing and timelines with consideration to student’s educational goals. (President | Objective 1)
Course scheduling and sequencing was adjusted in the prior two years. Comprehensive program review is slated for
2018-2019. The quality focus essay in the 2017 ISER provides details on this process and planning.
5. Assess course scheduling with feedback from faculty and students on course scheduling changes that became effective Fall
2015. (President | Objective 1)
Completed in Spring 2016. Adjustments made to August session and course sequencing.
6. Appoint Breadth of Knowledge department chair to lead cross-curricular development with all departments towards meeting
breadth of knowledge learning outcomes. (Dean of Instruction | Objective 1 & 2)
Completed.
7. Assess outcomes with feedback from faculty and students on implementation of intensive style courses for breadth of
knowledge courses. (Dean of Instruction | Objective 2)
2017-2018 Annual Institutional Report |2015-2020 Strategic Plan Status Report Page 25
Completed. Determined that intensive courses are not beneficial as it adds to the stress students feel and diminishes
opportunities for deeper thought and subject exploration.
8. Develop and implement robust faculty orientation and mentoring program to fully integrate new, non-arts based faculty into
the institutional culture and dynamics of arts-focused students. (Dean of Instruction | Objective 2)
Completed and ongoing. Orientation process and checklist for faculty was devised and implemented in 2016-2017.
Additionally, a faculty survey was conducted in spring 2017. Faculty survey will be repeated every two years.
9. Improve orientation activities for students to increase preparedness and awareness of support services. (Student Services |
Objective 3)
Completed and ongoing. Orientation sessions have expanded and cover a range of areas in relation to student
preparedness and awareness.
10. Strengthen collaboration between faculty and student services staff. (Student Services | Objective 3)
Completed and ongoing. Early alert systems and advising notification systems are in place and provides a bridge
between faculty and student services personnel.
Mid semester full-faculty meetings continue to be a key element to collaboration.
11. Implement success coaching plan for freshman and sophomores. (Student Services | Objective 3)
In progress.
12. Complete an information need analysis. (Library Services | Objective 4)
Library has implemented a feedback process for faculty and students. Additional years of data need to be collected to
provide baseline trends and indicators of success or improvements.
13. Develop a central curated library with resources to meet information needs. (Library Services | Objective 4)
In progress.
2017-2018 Annual Institutional Report |2015-2020 Strategic Plan Status Report Page 26
14. Develop and deliver student library orientation. (Library Services | Objective 4)
Completed and ongoing with 100% freshman and 100% of sophomores receiving library orientation in 2016-2017.
Process of orientation is repeatable and thus sustainable.
15. Conduct GAP analysis of syllabi. (Library Services | Objective 4)
In progress and ongoing.
16. Aid faculty in embedding library-based assignments into syllabi and course planning. (Library Services | Objective 4)
In progress and ongoing.
Goal 2: Increase Student Access
OBJECTIVE METRIC TARGET CURRENT STATUS
1. Admit foreign students % of student body that are foreign students 15% of student body are foreign students
SEVIS application for F-1 pending.
2. Increase scholarship support available to students.
Dollar amount awarded to students % of students receiving scholarship support Average Award Amount
$300,000 annually
75%
$2,070 (30%)
Falling off track with fluctuations in development
messaging and loss of prominent scholarship donor.
3. Attain regional accreditation.
Eligibility Approval Candidacy Approval Initial Accreditation
Spring 2016
Fall 2017
Spring 2020
Completed – June 2016 Completed – January, 2018 Completed – January, 2018
4. Offer a full range of financial aid assistance to students.
Participation in federal financial aid programs
Fall 2018 More likely to be fall 2019 based upon timeline for
application process.
2017-2018 Annual Institutional Report |2015-2020 Strategic Plan Status Report Page 27
ACTION ITEMS
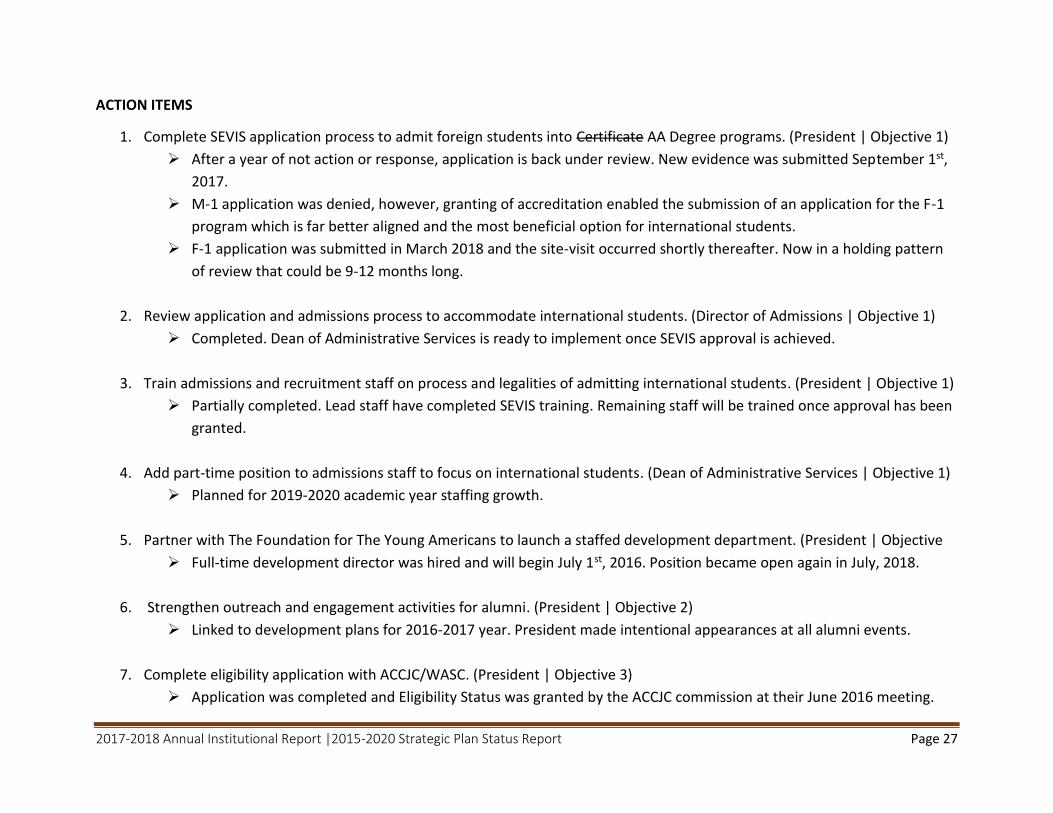
1. Complete SEVIS application process to admit foreign students into Certificate AA Degree programs. (President | Objective 1)
After a year of not action or response, application is back under review. New evidence was submitted September 1st,
2017.
M-1 application was denied, however, granting of accreditation enabled the submission of an application for the F-1
program which is far better aligned and the most beneficial option for international students.
F-1 application was submitted in March 2018 and the site-visit occurred shortly thereafter. Now in a holding pattern
of review that could be 9-12 months long.
2. Review application and admissions process to accommodate international students. (Director of Admissions | Objective 1)
Completed. Dean of Administrative Services is ready to implement once SEVIS approval is achieved.
3. Train admissions and recruitment staff on process and legalities of admitting international students. (President | Objective 1)
Partially completed. Lead staff have completed SEVIS training. Remaining staff will be trained once approval has been
granted.
4. Add part-time position to admissions staff to focus on international students. (Dean of Administrative Services | Objective 1)
Planned for 2019-2020 academic year staffing growth.
5. Partner with The Foundation for The Young Americans to launch a staffed development department. (President | Objective
Full-time development director was hired and will begin July 1st, 2016. Position became open again in July, 2018.
6. Strengthen outreach and engagement activities for alumni. (President | Objective 2)
Linked to development plans for 2016-2017 year. President made intentional appearances at all alumni events.
7. Complete eligibility application with ACCJC/WASC. (President | Objective 3)
Application was completed and Eligibility Status was granted by the ACCJC commission at their June 2016 meeting.
2017-2018 Annual Institutional Report |2015-2020 Strategic Plan Status Report Page 28
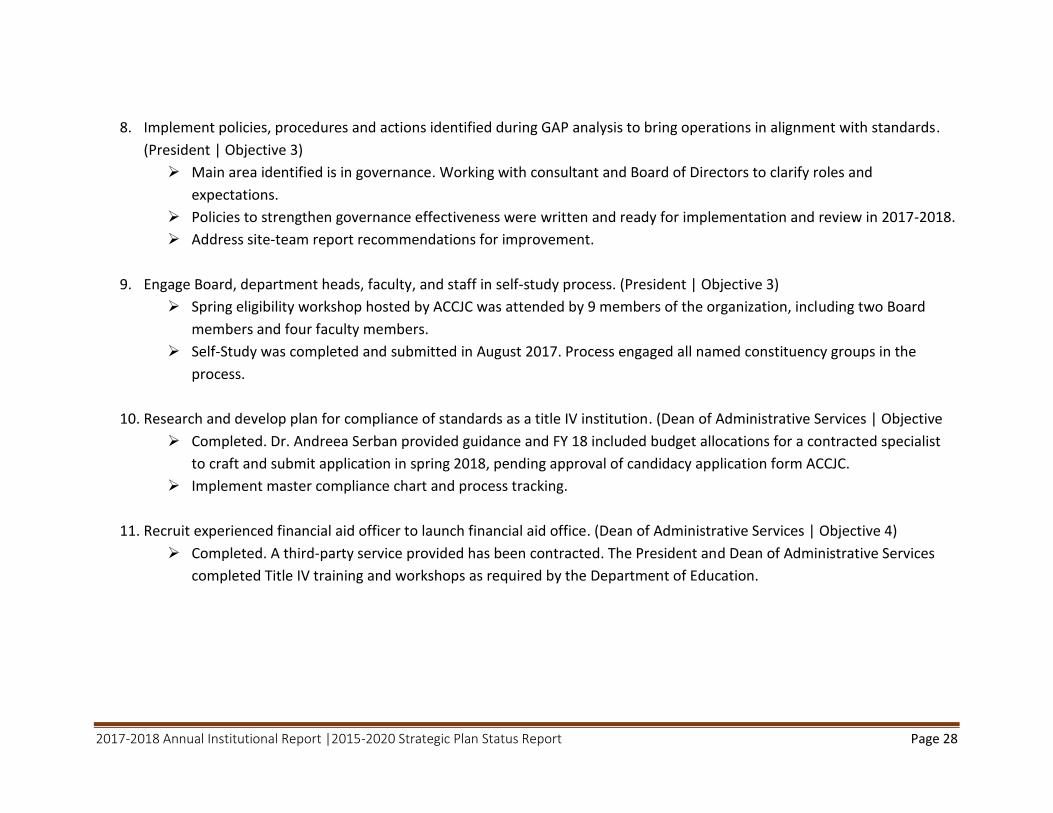
8. Implement policies, procedures and actions identified during GAP analysis to bring operations in alignment with standards.
(President | Objective 3)
Main area identified is in governance. Working with consultant and Board of Directors to clarify roles and
expectations.
Policies to strengthen governance effectiveness were written and ready for implementation and review in 2017-2018.
Address site-team report recommendations for improvement.
9. Engage Board, department heads, faculty, and staff in self-study process. (President | Objective 3)
Spring eligibility workshop hosted by ACCJC was attended by 9 members of the organization, including two Board
members and four faculty members.
Self-Study was completed and submitted in August 2017. Process engaged all named constituency groups in the
process.
10. Research and develop plan for compliance of standards as a title IV institution. (Dean of Administrative Services | Objective
Completed. Dr. Andreea Serban provided guidance and FY 18 included budget allocations for a contracted specialist
to craft and submit application in spring 2018, pending approval of candidacy application form ACCJC.
Implement master compliance chart and process tracking.
11. Recruit experienced financial aid officer to launch financial aid office. (Dean of Administrative Services | Objective 4)
Completed. A third-party service provided has been contracted. The President and Dean of Administrative Services
completed Title IV training and workshops as required by the Department of Education.
2017-2018 Annual Institutional Report |2015-2020 Strategic Plan Status Report Page 29
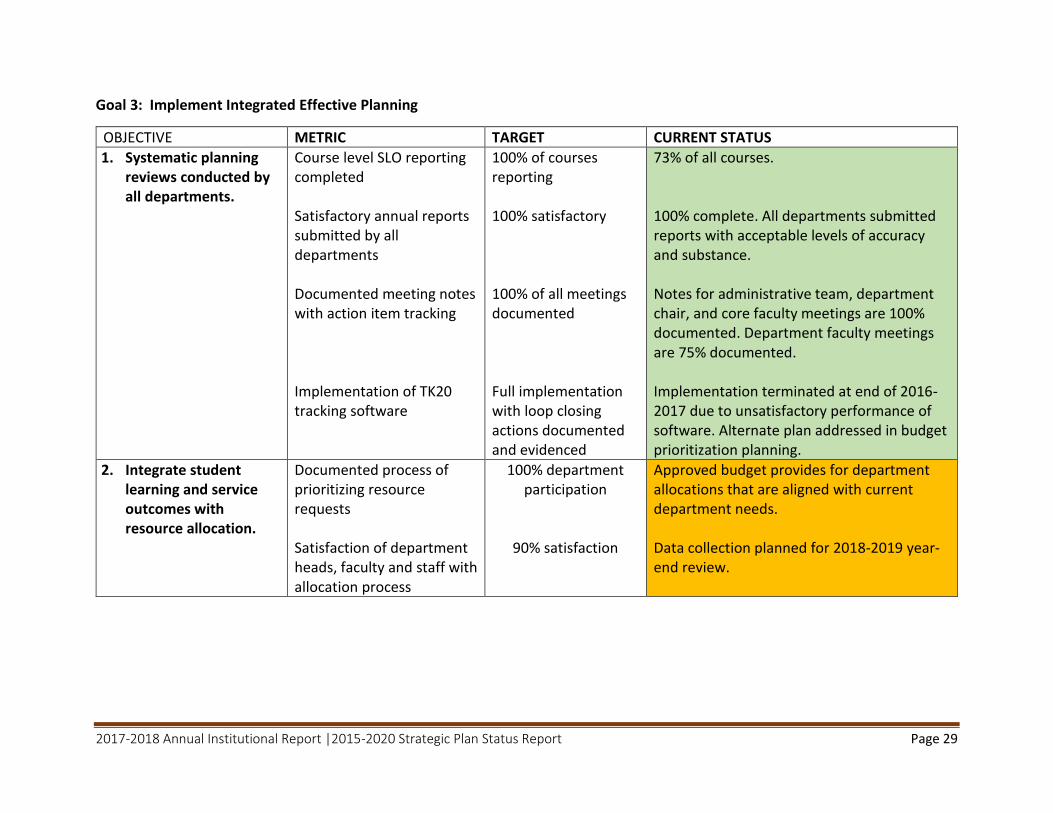
Goal 3: Implement Integrated Effective Planning
OBJECTIVE METRIC TARGET CURRENT STATUS
1. Systematic planning reviews conducted by all departments.
Course level SLO reporting completed Satisfactory annual reports submitted by all departments Documented meeting notes with action item tracking Implementation of TK20 tracking software
100% of courses reporting 100% satisfactory 100% of all meetings documented Full implementation with loop closing actions documented and evidenced
73% of all courses. 100% complete. All departments submitted reports with acceptable levels of accuracy and substance. Notes for administrative team, department chair, and core faculty meetings are 100% documented. Department faculty meetings are 75% documented. Implementation terminated at end of 2016-2017 due to unsatisfactory performance of software. Alternate plan addressed in budget prioritization planning.
2. Integrate student learning and service outcomes with resource allocation.
Documented process of prioritizing resource requests Satisfaction of department heads, faculty and staff with allocation process
100% department participation
90% satisfaction
Approved budget provides for department allocations that are aligned with current department needs. Data collection planned for 2018-2019 year-end review.
2017-2018 Annual Institutional Report |2015-2020 Strategic Plan Status Report Page 30
ACTION ITEMS
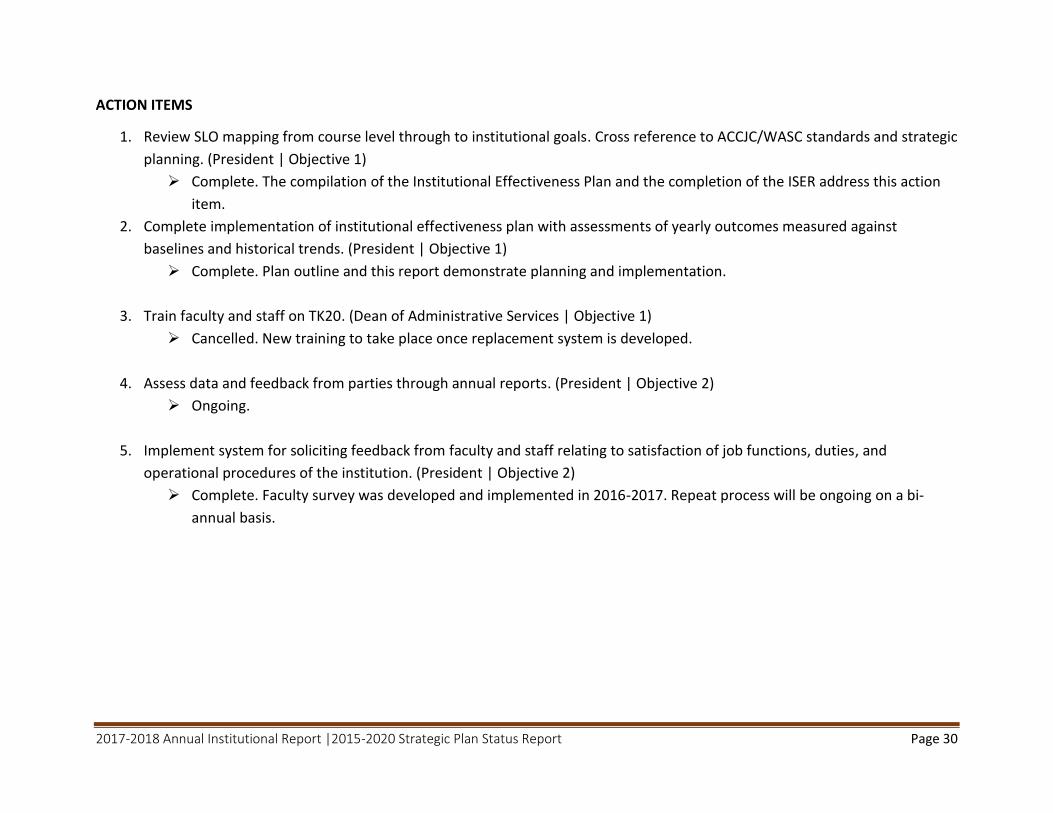
1. Review SLO mapping from course level through to institutional goals. Cross reference to ACCJC/WASC standards and strategic
planning. (President | Objective 1)
Complete. The compilation of the Institutional Effectiveness Plan and the completion of the ISER address this action
item.
2. Complete implementation of institutional effectiveness plan with assessments of yearly outcomes measured against
baselines and historical trends. (President | Objective 1)
Complete. Plan outline and this report demonstrate planning and implementation.
3. Train faculty and staff on TK20. (Dean of Administrative Services | Objective 1)
Cancelled. New training to take place once replacement system is developed.
4. Assess data and feedback from parties through annual reports. (President | Objective 2)
Ongoing.
5. Implement system for soliciting feedback from faculty and staff relating to satisfaction of job functions, duties, and
operational procedures of the institution. (President | Objective 2)
Complete. Faculty survey was developed and implemented in 2016-2017. Repeat process will be ongoing on a bi-
annual basis.
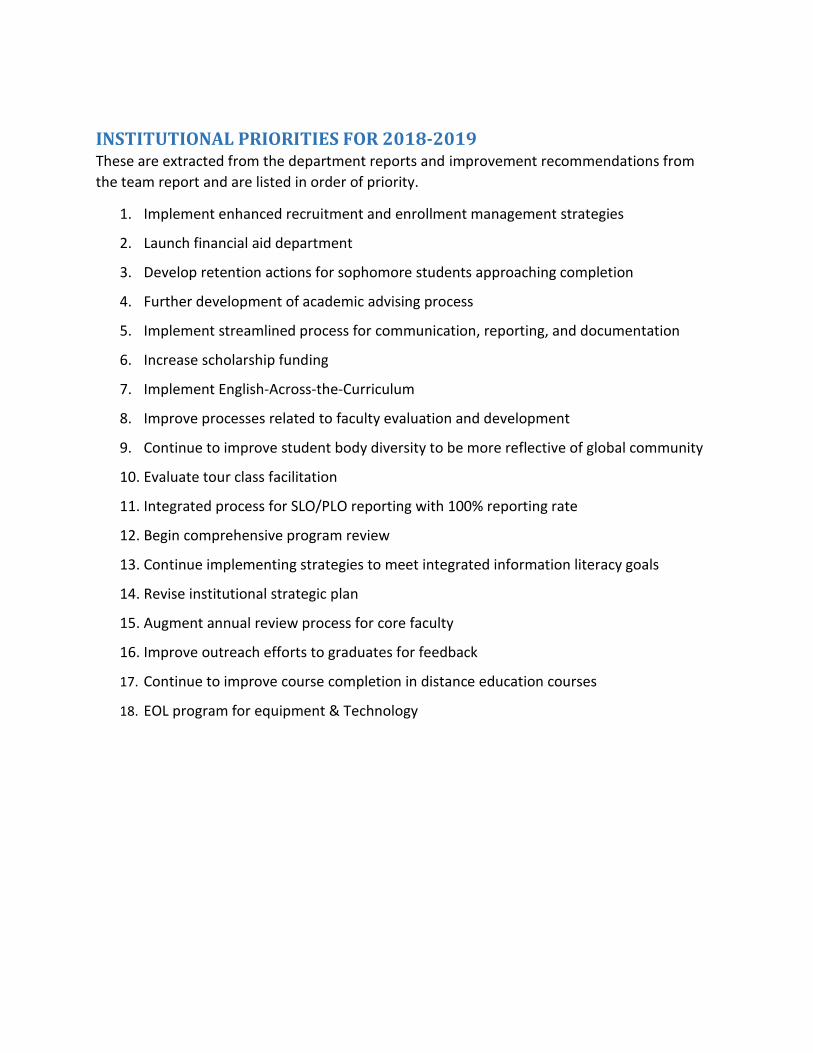
INSTITUTIONAL PRIORITIES FOR 2018-2019 These are extracted from the department reports and improvement recommendations from
the team report and are listed in order of priority.
1. Implement enhanced recruitment and enrollment management strategies
2. Launch financial aid department
3. Develop retention actions for sophomore students approaching completion
4. Further development of academic advising process
5. Implement streamlined process for communication, reporting, and documentation
6. Increase scholarship funding
7. Implement English-Across-the-Curriculum
8. Improve processes related to faculty evaluation and development
9. Continue to improve student body diversity to be more reflective of global community
10. Evaluate tour class facilitation
11. Integrated process for SLO/PLO reporting with 100% reporting rate
12. Begin comprehensive program review
13. Continue implementing strategies to meet integrated information literacy goals
14. Revise institutional strategic plan
15. Augment annual review process for core faculty
16. Improve outreach efforts to graduates for feedback
17. Continue to improve course completion in distance education courses
18. EOL program for equipment & Technology