Embed Size (px)
Citation preview

2017-2018 SEASON FINAL REGISTRATION REPORTS
Materials Included: 2016-17 & 2017-18 Comparison by Group ………………………………… 2 2017-18 USA Hockey Member Counts ………………………………… 3 2017-18 8 and Under Report ………………………………… 4 2017-18 Players & Girls/Women by District . ………………………………… 5 2017-18 Players by District and State ………………………………… 6 2017-18 Girls/Women by District and State ………………………………… 7 2017-18 High School Team by District and State ………………………………… 8 2017-18 USA Hockey Junior Teams ………………………………… 9 2017-18 Ice Officials by State ………………………………… 10 2016-17 USA Hockey Member Counts (for comparison) ………………………………………… 11


USA HOCKEY, INC. Registration Comparison by Group
2016-17 and 2017-18
All Players Adult 17-18 15-16 13-14 11-12 9-10 7-8 6&U2017-18 562,145 179,631 28,962 43,994 59,106 62,960 64,530 61,660 61,3022016-17 555,175 180,400 29,223 43,933 58,666 63,635 62,845 58,426 58,047Difference 6,970 -769 -261 61 440 -675 1,685 3,234 3,255% Difference 1.26% -0.43% -0.89% 0.14% 0.75% -1.06% 2.68% 5.54% 5.61%
Male Adult 17-18 15-16 13-14 11-12 9-10 7-8 6&U2017-18 482,790 161,259 25,448 38,131 50,585 53,111 53,896 50,931 49,4292016-17 479,343 162,360 25,808 38,220 50,250 53,975 52,963 48,718 47,049Difference 3,447 -1,101 -360 -89 335 -864 933 2,213 2,380% Difference 0.72% -0.68% -1.39% -0.23% 0.67% -1.60% 1.76% 4.54% 5.06%
Female Adult 17-18 15-16 13-14 11-12 9-10 7-8 6&U2017-18 79,355 18,372 3,514 5,863 8,521 9,849 10,634 10,729 11,8732016-17 75,832 18,040 3,415 5,713 8,416 9,660 9,882 9,708 10,998Difference 3,523 332 99 150 105 189 752 1,021 875% Difference 4.65% 1.84% 2.90% 2.63% 1.25% 1.96% 7.61% 10.52% 7.96%
Youth Players Coaches Officials Total Players, Coaches, Officials2017-18 382,514 58,645 25,330 646,1202016-17 374,775 57,801 24,768 637,744Difference 7,739 844 562 8,376% Difference 2.06% 1.46% 2.27% 1.31%
Non-Participants (Administrators, Team Managers/Volunteers, Parents) total: 532,591 Grand Total: 1,178,711
Valid SafeSport Training: 119,090
Page 2Comparison by Group

2017-18 USA HOCKEY
MEMBER COUNTS
P=Paid PY=Unpaid Total Total Total Players,Players 6 & Younger Players Coaches Players & Coaches Officials Coaches, Officials
ATLANTIC 35,419 2,434 37,853 4,000 41,853 2,152 44,005
CENTRAL 59,357 8,036 67,393 7,420 74,813 3,535 78,348
MASSACHUSETTS 41,946 6,629 48,575 6,258 54,833 1,891 56,724
MICHIGAN 44,442 4,297 48,739 4,725 53,464 2,114 55,578
MID-AMERICAN 36,332 3,819 40,151 4,358 44,509 1,805 46,314
MINNESOTA 47,912 9,722 57,634 9,567 67,201 2,404 69,605
NEW ENGLAND 28,622 5,251 33,873 4,348 38,221 1,794 40,015
NEW YORK 43,644 6,459 50,103 5,317 55,420 2,200 57,620
NORTHERN PLAINS 14,235 2,537 16,772 1,797 18,569 1,341 19,910
PACIFIC 50,712 4,140 54,852 3,264 58,116 1,854 59,970
ROCKY MOUNTAIN 45,782 3,530 49,312 3,643 52,955 2,002 54,957
SOUTHEASTERN 52,440 4,448 56,888 3,948 60,836 2,238 63,074
TOTALS 500,843 61,302 562,145 58,645 620,790 25,330 646,120
NON-PARTICIPANTS (Administrators, Team Managers/Volunteers, Parents): 532,591 Grand Total 1,178,711
DISTRICT
Page 317-18 FINAL Member Counts

2017-18 NATIONAL 8 UNDER REGISTRATION FINAL RESULTS
USA Hockey has focused specifically on the 8 & under age category in a long-term approach to grow participation
in youth hockey. The data below reports on the results from the 2017-18 registration season.
Data can be read from left to right, beginning with FINAL totals from the 2016-17 season, then FINAL totals from
the 2017-18 season and the difference (+/-). The Full Year Goal for 2017-18 from the 2 and 2 Challenge is next, and
then the percentage of fulfillment of that goal.
NATIONAL BOYS & GIRLS 8U
2016‐17 2017‐18 *+/‐ 2 AND 2 AS %
FINAL FINAL VS. ACTUAL FULL‐YR GOAL OF GOAL
TOTAL 115,694 122,135 6,441 120,738 101.2%
NEW 52,076 55,769 3,693 54,598 102.1%
RETAINED 63,618 66,366 2,748 66,140 100.3%
NATIONAL BOYS 8U
2016‐17 2017‐18 *+/‐
FINAL FINAL VS. ACTUAL
TOTAL 95,136 99,603 4,467
NEW 41,346 44,052 2,706
RETAINED 53,790 55,551 1,761
NATIONAL GIRLS 8U
2016‐17 2017‐18 *+/‐
FINAL FINAL VS. ACTUAL
TOTAL 20,558 22,532 1,974
NEW 10,730 11,717 987
RETAINED 9,828 10,815 987
NATIONAL BOYS & GIRLS 7 & 8
2016‐17 2017‐18 *+/‐ %
FINAL FINAL GROWTH GROWTH
TOTAL 57,845 61,056 3,211 5.6%
NEW 16,358 18,149 1,791 10.9%
RETAINED 41,487 42,907 1,420 3.4%
NATIONAL BOYS & GIRLS 6U
2016‐17 2017‐18 *+/‐ %
FINAL FINAL GROWTH GROWTH
TOTAL 57,849 61,079 3,230 5.6%
NEW 35,718 37,620 1,902 5.3%
RETAINED 22,131 23,459 1,328 6.0%
Page 48 Under Report

USA Hockey Ice Registration by District 2017-2018
PLAYERS BY DISTRICT
District Totals 19&over 17‐18 15‐16 13‐14 11‐12 9‐10 7‐8 6&U
Atlantic 37,853 11,751 2,954 4,163 4,527 4,368 4,053 3,603 2,434
Central 67,393 17,297 3,460 5,450 7,496 8,583 8,933 8,138 8,036
Massachusetts 48,575 4,901 3,092 5,252 7,415 7,462 7,416 6,408 6,629
Michigan 48,739 23,032 2,322 3,171 4,183 3,946 4,084 3,704 4,297
Mid‐American 40,151 12,808 2,465 3,345 4,310 4,420 4,470 4,514 3,819
Minnesota 57,634 8,714 2,116 3,787 7,234 8,326 8,658 9,077 9,722
New England 33,873 5,365 1,814 3,003 4,641 4,877 4,653 4,269 5,251
New York 50,103 13,763 2,805 4,349 5,559 5,624 5,782 5,762 6,459
Northern Plains 16,772 4,130 754 1,143 1,654 1,976 2,285 2,293 2,537
Pacific 54,852 29,074 2,007 2,876 3,529 4,163 4,534 4,529 4,140
Rocky Mountain 49,312 23,114 2,361 3,444 3,970 4,293 4,409 4,191 3,530
Southeastern 56,888 25,682 2,812 4,011 4,588 4,922 5,253 5,172 4,448
Totals 562,145 179,631 28,962 43,994 59,106 62,960 64,530 61,660 61,302
GIRLS/WOMEN BY DISTRICT
District Totals 19&over 17‐18 15‐16 13‐14 11‐12 9‐10 7‐8 6&U
Atlantic 3,617 879 257 350 438 480 440 445 328
Central 8,702 1,816 333 604 923 1,059 1,205 1,262 1,500
Massachusetts 10,855 1,521 606 1,060 1,461 1,524 1,581 1,497 1,605
Michigan 5,041 1,808 268 367 432 478 479 532 677
Mid‐American 3,308 753 170 268 360 401 420 505 431
Minnesota 13,883 1,920 410 714 1,559 2,179 2,298 2,375 2,428
New England 6,787 892 316 528 935 967 980 885 1,284
New York 5,992 1,048 289 532 688 734 796 818 1,087
Northern Plains 3,367 720 178 294 354 379 472 437 533
Pacific 6,702 2,894 226 360 471 577 718 695 761
Rocky Mountain 5,929 2,499 247 391 443 555 605 624 565
Southeastern 5,172 1,622 214 395 457 516 640 654 674
Totals 79,355 18,372 3,514 5,863 8,521 9,849 10,634 10,729 11,873
Page 5Registration by District

USA HOCKEY, INC.
Players by District and State
2017-2018
District State Total 19&over 17-18 15-16 13-14 11-12 9-10 7-8 6&U
Atlantic DE 1,036 313 102 113 107 101 105 120 75
Atlantic E PA 17,319 6,235 1,428 1,798 1,921 1,842 1,635 1,442 1,018
Atlantic NJ 19,498 5,203 1,424 2,252 2,499 2,425 2,313 2,041 1,341
Central IL 32,578 9,232 1,851 3,117 3,799 4,175 4,259 3,405 2,740
Central IA 3,731 1,061 214 261 340 445 462 473 475
Central KS 1,663 884 66 94 149 149 140 116 65
Central MO 7,604 1,349 480 762 870 994 1,034 1,076 1,039
Central NE 1,981 375 137 180 241 287 293 265 203
Central WI 19,836 4,396 712 1,036 2,097 2,533 2,745 2,803 3,514
Massachusetts MA 48,575 4,901 3,092 5,252 7,415 7,462 7,416 6,408 6,629
Michigan MI 48,739 23,032 2,322 3,171 4,183 3,946 4,084 3,704 4,297
Mid-American IN 6,389 2,544 367 491 647 657 656 557 470
Mid-American KY 1,855 870 87 92 144 114 151 183 214
Mid-American OH 15,686 5,462 884 1,220 1,624 1,760 1,806 1,659 1,271
Mid-American W PA 15,018 3,591 1,080 1,467 1,798 1,742 1,709 1,963 1,668
Mid-American WV 1,203 341 47 75 97 147 148 152 196
Minnesota MN 57,634 8,714 2,116 3,787 7,234 8,326 8,658 9,077 9,722
New England CT 13,004 1,760 780 1,313 1,878 1,984 1,923 1,630 1,736
New England ME 6,628 1,480 305 495 828 821 700 722 1,277
New England NH 5,846 627 384 617 869 892 886 787 784
New England RI 3,988 550 236 355 516 568 564 525 674
New England VT 4,407 948 109 223 550 612 580 605 780
New York NY 50,103 13,763 2,805 4,349 5,559 5,624 5,782 5,762 6,459
Northern Plains MT 4,765 2,685 179 193 269 334 372 379 354
Northern Plains ND 6,891 509 241 471 839 991 1,170 1,240 1,430
Northern Plains SD 2,928 424 213 300 334 388 442 378 449
Northern Plains WY 2,188 512 121 179 212 263 301 296 304
Pacific AK 8,664 4,117 293 458 641 712 692 778 973
Pacific CA 31,690 16,804 1,240 1,699 2,021 2,426 2,669 2,725 2,106
Pacific HI 286 214 2 8 7 12 17 14 12
Pacific NV 1,592 955 56 84 79 120 118 97 83
Pacific OR 2,737 1,671 78 121 187 208 184 154 134
Pacific WA 9,883 5,313 338 506 594 685 854 761 832
Rocky Mountain AZ 8,617 4,098 390 532 625 669 714 762 827
Rocky Mountain CO 15,222 5,001 881 1,391 1,548 1,635 1,761 1,707 1,298
Rocky Mountain ID 3,617 1,834 156 201 278 304 333 272 239
Rocky Mountain NM 1,412 597 69 87 115 138 122 132 152
Rocky Mountain OK 973 295 41 55 74 112 127 137 132
Rocky Mountain TX 15,026 8,957 567 747 913 1,080 1,078 982 702
Rocky Mountain UT 4,445 2,332 257 431 417 355 274 199 180
Southeastern AL 2,043 780 44 104 139 165 228 267 316
Southeastern AR 385 140 11 27 31 36 36 55 49
Southeastern DC 1,362 647 29 56 87 104 118 157 164
Southeastern FL 15,057 8,618 583 856 1,005 1,056 1,093 1,074 772
Southeastern GA 2,213 488 207 289 293 281 271 212 172
Southeastern LA 548 256 17 18 20 47 66 61 63
Southeastern MD 10,742 4,261 669 972 1,035 990 1,023 1,003 789
Southeastern MS 302 132 13 8 14 26 35 43 31
Southeastern NC 6,982 3,121 329 447 580 629 615 654 607
Southeastern SC 2,446 1,460 97 119 133 160 169 156 152
Southeastern TN 4,740 1,822 245 334 311 380 552 546 550
Southeastern VA 10,068 3,957 568 781 940 1,048 1,047 944 783
Totals 562,145 179,631 28,962 43,994 59,106 62,960 64,530 61,660 61,302
Page 6
Players by District State

USA HOCKEY, INC.
Girls/Women by District and State
2017-18
District State Total 20&Over 19 17-18 15-16 13-14 11-12 9-10 7-8 6&U
Atlantic DE 115 32 2 7 8 10 11 13 22 10
Atlantic E PA 1,751 483 21 170 191 226 210 177 156 117
Atlantic NJ 1,751 310 31 80 151 202 259 250 267 201
Central IL 3,372 767 26 178 308 410 415 441 445 382
Central IA 355 59 10 12 25 28 41 54 61 65
Central KS 100 42 2 2 6 5 18 12 5 8
Central MO 771 169 4 22 54 67 92 111 123 129
Central NE 231 52 8 13 12 31 34 29 29 23
Central WI 3,873 651 26 106 199 382 459 558 599 893
Massachusetts MA 10,855 1,459 62 606 1,060 1,461 1,524 1,581 1,497 1,605
Michigan MI 5,041 1,744 64 268 367 432 478 479 532 677
Mid-American IN 507 128 8 18 33 62 70 64 55 69
Mid-American KY 155 63 1 2 7 8 16 11 23 24
Mid-American OH 1,195 295 14 72 91 131 149 151 161 131
Mid-American W PA 1,321 204 26 75 127 151 144 169 242 183
Mid-American WV 130 14 - 3 10 8 22 25 24 24
Minnesota MN 13,883 1,862 58 410 714 1,559 2,179 2,298 2,375 2,428
New England CT 2,556 280 21 130 237 383 383 413 321 388
New England ME 1,257 161 2 48 89 179 166 138 140 334
New England NH 1,107 138 14 80 96 148 138 156 151 186
New England RI 655 99 8 23 34 65 85 88 103 150
New England VT 1,212 160 9 35 72 160 195 185 170 226
New York NY 5,992 995 53 289 532 688 734 796 818 1,087
Northern Plains MT 998 493 8 53 54 71 75 84 86 74
Northern Plains ND 1,460 65 12 52 135 165 206 260 237 328
Northern Plains SD 472 23 1 42 67 70 54 81 56 78
Northern Plains WY 437 109 9 31 38 48 44 47 58 53
Pacific AK 1,987 924 11 64 109 144 159 143 184 249
Pacific CA 2,963 1,163 21 113 174 211 262 375 351 293
Pacific HI 26 14 - 1 1 - - 4 2 4
Pacific NV 107 53 1 3 5 7 12 9 10 7
Pacific OR 311 137 4 8 9 23 35 35 32 28
Pacific WA 1,308 556 10 37 62 86 109 152 116 180
Rocky Mountain AZ 757 209 10 33 50 59 70 101 107 118
Rocky Mountain CO 2,689 1,156 35 106 174 185 254 279 293 207
Rocky Mountain ID 713 337 1 39 49 59 68 60 44 56
Rocky Mountain NM 224 60 4 8 13 20 28 23 28 40
Rocky Mountain OK 67 7 - 1 - 3 13 12 15 16
Rocky Mountain TX 953 405 7 31 49 70 82 104 106 99
Rocky Mountain UT 526 261 7 29 56 47 40 26 31 29
Southeastern AL 213 47 4 4 8 12 14 24 41 59
Southeastern AR 34 6 - - - 1 2 6 10 9
Southeastern DC 263 74 1 4 6 26 20 30 33 69
Southeastern FL 903 370 13 29 61 84 77 96 101 72
Southeastern GA 173 47 - 8 26 19 21 21 16 15
Southeastern LA 65 14 - 2 4 4 5 11 10 15
Southeastern MD 1,410 420 17 83 153 137 148 166 156 130
Southeastern MS 23 4 - 1 1 1 1 5 5 5
Southeastern NC 640 177 8 15 44 53 65 77 95 106
Southeastern SC 124 41 1 5 5 12 17 14 19 10
Southeastern TN 344 85 7 10 15 27 29 49 52 70
Southeastern VA 980 270 16 53 72 81 117 141 116 114
Totals 79,355 17,694 678 3,514 5,863 8,521 9,849 10,634 10,729 11,873
Page 7
Girls/Women by State
USA HOCKEY, INC.
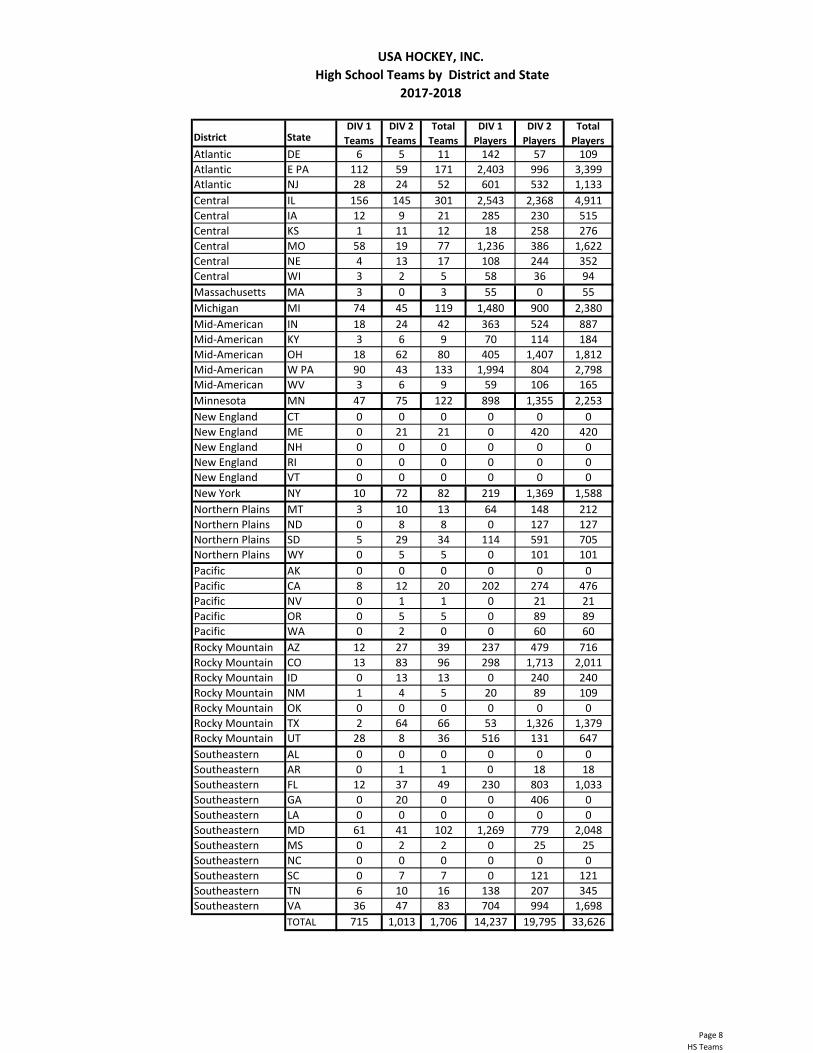
High School Teams by District and State
2017‐2018
District State DIV 1
Teams
DIV 2
Teams
Total
Teams
DIV 1
Players
DIV 2
Players
Total
Players
Atlantic DE 6 5 11 142 57 109
Atlantic E PA 112 59 171 2,403 996 3,399
Atlantic NJ 28 24 52 601 532 1,133
Central IL 156 145 301 2,543 2,368 4,911
Central IA 12 9 21 285 230 515
Central KS 1 11 12 18 258 276
Central MO 58 19 77 1,236 386 1,622
Central NE 4 13 17 108 244 352
Central WI 3 2 5 58 36 94
Massachusetts MA 3 0 3 55 0 55
Michigan MI 74 45 119 1,480 900 2,380
Mid‐American IN 18 24 42 363 524 887
Mid‐American KY 3 6 9 70 114 184
Mid‐American OH 18 62 80 405 1,407 1,812
Mid‐American W PA 90 43 133 1,994 804 2,798
Mid‐American WV 3 6 9 59 106 165
Minnesota MN 47 75 122 898 1,355 2,253
New England CT 0 0 0 0 0 0
New England ME 0 21 21 0 420 420
New England NH 0 0 0 0 0 0
New England RI 0 0 0 0 0 0
New England VT 0 0 0 0 0 0
New York NY 10 72 82 219 1,369 1,588
Northern Plains MT 3 10 13 64 148 212
Northern Plains ND 0 8 8 0 127 127
Northern Plains SD 5 29 34 114 591 705
Northern Plains WY 0 5 5 0 101 101
Pacific AK 0 0 0 0 0 0
Pacific CA 8 12 20 202 274 476
Pacific NV 0 1 1 0 21 21
Pacific OR 0 5 5 0 89 89
Pacific WA 0 2 0 0 60 60
Rocky Mountain AZ 12 27 39 237 479 716
Rocky Mountain CO 13 83 96 298 1,713 2,011
Rocky Mountain ID 0 13 13 0 240 240
Rocky Mountain NM 1 4 5 20 89 109
Rocky Mountain OK 0 0 0 0 0 0
Rocky Mountain TX 2 64 66 53 1,326 1,379
Rocky Mountain UT 28 8 36 516 131 647
Southeastern AL 0 0 0 0 0 0
Southeastern AR 0 1 1 0 18 18
Southeastern FL 12 37 49 230 803 1,033
Southeastern GA 0 20 0 0 406 0
Southeastern LA 0 0 0 0 0 0
Southeastern MD 61 41 102 1,269 779 2,048
Southeastern MS 0 2 2 0 25 25
Southeastern NC 0 0 0 0 0 0
Southeastern SC 0 7 7 0 121 121
Southeastern TN 6 10 16 138 207 345
Southeastern VA 36 47 83 704 994 1,698
TOTAL 715 1,013 1,706 14,237 19,795 33,626
Page 8
HS Teams

USA HOCKEY, INC.
Junior Teams
2017-18
District State Tier I Tier II Tier III Major TOTAL
Atlantic DE 0Atlantic NJ 1 4 5Atlantic E. PA 2 8 10Central IL 2 1 1 4Central IA 5 1 6Central KS 1 1Central MO 1 1Central NE 3 3Central WI 2 2 4 8Massachusetts MA 1 10 11Michigan MI 2 1 2 5Mid-American IN 1 1Mid-American KY 0Mid-American OH 1 1Mid-American W. PA 1 1 2Mid-American WV 0Minnesota MN 3 8 11New England CT 2 2New England ME 2 2New England NH 4 4New England RI 0New England VT 2 2New York NY 10 10Northern Plains MT 5 5Northern Plains ND 1 2 3Northern Plains SD 1 2 3Northern Plains WY 2 2Pacific AK 2 2Pacific CA 0Pacific HI 0Pacific NV 0Pacific OR 1 1 2Pacific WA 2 4 6Rocky Mtn AZ 0Rocky Mtn CO 5 5Rocky Mtn ID 0Rocky Mtn NM 0Rocky Mtn OK 0Rocky Mtn TX 4 3 7Rocky Mtn UT 0Southeastern AL 0Southeastern AR 0Southeastern DC 0Southeastern FL 0Southeastern GA 1 1Southeastern LA 1 1 2Southeastern MD 0Southeastern MS 0Southeastern NC 0Southeastern SC 0Southeastern TN 0Southeastern VA 0
TOTAL 17 23 79 8 127
Page 917-18 Jr Teams by State/District

USA HOCKEY, INC.Officials by District and State
2017-18
Officials by State
District State AFFL. LEVEL 1 LEVEL 2 LEVEL 3 LEVEL 4 TOTAL CHANGEAtlantic DE 0 18 10 26 2 56 5Atlantic NJ 3 548 213 403 54 1,221 27Atlantic E PA 5 325 104 380 60 874 38Central IL 5 602 261 452 101 1,421 -6Central IA 1 78 31 52 16 178 1Central KS 0 21 20 17 7 65 -4Central MO 1 176 61 122 55 415 43Central NE 1 56 28 35 0 120 1Central WI 5 544 327 396 55 1,327 -10Massachusetts MA 4 1,045 272 520 50 1,891 33Michigan MI 3 1,048 309 682 63 2,105 -9Mid-American IN 1 159 50 93 24 327 39Mid-American KY 0 34 10 27 1 72 -9Mid-American OH 2 408 96 192 34 732 106Mid-American W.PA 4 283 87 215 35 624 28Mid-American WV 0 24 15 20 0 59 -28Minnesota MN 4 998 435 877 83 2,397 47New England CT 1 360 97 202 51 711 68New England ME 2 167 45 72 14 300 -12New England NH 2 173 67 138 8 388 -2New England RI 2 56 29 67 1 155 18New England VT 1 105 41 71 21 239 -13Northern Plains MT 0 143 49 76 14 282 14Northern Plains ND 0 386 124 165 8 683 86Northern Plains SD 0 113 41 60 1 215 22Northern Plains WY 0 107 23 30 1 161 28New York NY 4 915 355 772 150 2,196 8Pacific AK 0 171 54 77 22 324 -16Pacific CA 1 371 189 297 29 887 -78Pacific HI 0 6 8 6 0 20 -2Pacific NV 0 30 14 25 4 73 15Pacific OR 0 60 19 40 5 124 4Pacific WA 2 232 63 110 18 425 15Rocky Mountain AZ 5 131 52 86 17 291 -9Rocky Mountain CO 2 399 146 244 39 830 57Rocky Mountain ID 1 108 28 54 10 201 -4Rocky Mountain NM 1 24 7 26 2 60 3Rocky Mountain OK 0 37 5 17 0 59 -1Rocky Mountain TX 4 164 81 145 30 424 10Rocky Mountain UT 0 49 26 43 18 136 -12Southeastern AL 0 39 6 26 4 75 8Southeastern AR 1 9 3 8 0 21 -5Southeastern DC 0 5 3 6 7 21 1Southeastern FL 2 260 89 174 35 560 41Southeastern GA 0 72 46 65 8 191 -41Southeastern LA 1 11 2 2 1 17 0Southeastern MD 1 134 63 116 12 326 18Southeastern MS 0 2 1 1 3 7 -2Southeastern NC 0 136 53 91 23 303 12Southeastern SC 0 51 24 23 3 101 1Southeastern TN 1 86 13 30 9 139 8Southeastern VA 1 235 78 139 25 478 16
2 9 1 10 1 23 476 11,723 4,274 8,023 1,234 25,330 562
Non-US ResTOTAL

2016-17 USA HOCKEY
MEMBER COUNTS
P=Paid PY=Unpaid Total Total Total Players,Players 6 & Younger Players Coaches Players & Coaches Officials Coaches, Officials
ATLANTIC 35,704 2,310 38,014 3,946 41,960 2,085 44,045
CENTRAL 58,585 7,424 66,009 7,258 73,267 3,517 76,784
MASSACHUSETTS 42,714 6,624 49,338 6,230 55,568 1,855 57,423
MICHIGAN 45,915 4,191 50,106 4,851 54,957 2,117 57,074
MID-AMERICAN 35,502 3,658 39,160 4,250 43,410 1,668 45,078
MINNESOTA 47,895 9,284 57,179 9,339 66,518 2,349 68,867
NEW ENGLAND 29,272 5,049 34,321 4,245 38,566 1,738 40,304
NEW YORK 43,777 6,265 50,042 5,363 55,405 2,195 57,600
NORTHERN PLAINS 14,117 2,552 16,669 1,762 18,431 1,197 19,628
PACIFIC 48,803 3,442 52,245 3,142 55,387 1,909 57,296
ROCKY MOUNTAIN 43,935 3,228 47,163 3,745 50,908 1,963 52,871
SOUTHEASTERN 50,909 4,020 54,929 3,670 58,599 2,175 60,774
TOTALS 497,128 58,047 555,175 57,801 612,976 24,768 637,744
NON-PARTICIPANTS (Administrators, Team Managers/Volunteers, Parents): 515,996 Grand Total 1,153,740
DISTRICT
Page 1116-17 FINAL Member Counts