Embed Size (px)
Citation preview
5150 Snead Dr., Fort Collins, CO 80525 - www.FCLWD.com - Phone: (970) 226-3104
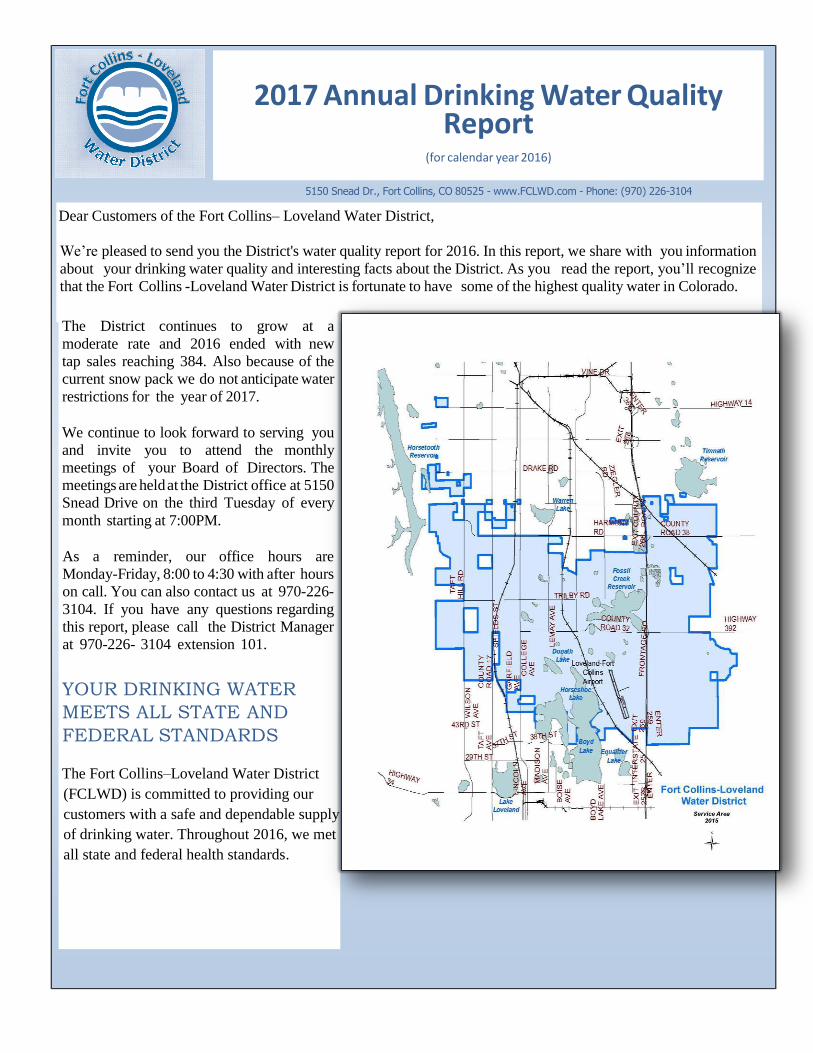
Dear Customers of the Fort Collins– Loveland Water District,
We’re pleased to send you the District's water quality report for 2016. In this report, we share with you information
about your drinking water quality and interesting facts about the District. As you read the report, you’ll recognize
that the Fort Collins -Loveland Water District is fortunate to have some of the highest quality water in Colorado.
The District continues to grow at a
moderate rate and 2016 ended with new
tap sales reaching 384. Also because of the
current snow pack we do not anticipate water
restrictions for the year of 2017.
We continue to look forward to serving you
and invite you to attend the monthly
meetings of your Board of Directors. The
meetings are held at the District office at 5150
Snead Drive on the third Tuesday of every
month starting at 7:00PM.
As a reminder, our office hours are
Monday-Friday, 8:00 to 4:30 with after hours
on call. You can also contact us at 970-226-
3104. If you have any questions regarding
this report, please call the District Manager
at 970-226- 3104 extension 101.
YOUR DRINKING WATER
MEETS ALL STATE AND
FEDERAL STANDARDS The Fort Collins–Loveland Water District
(FCLWD) is committed to providing our
customers with a safe and dependable supply
of drinking water. Throughout 2016, we met
all state and federal health standards.
2017 Annual Drinking Water Quality
Report (for calendar year 2016)
2017 ANNUAL DRINKING WATER QUALITY REPORT FOR CALENDAR YEAR 2016 Page 2
FORT COLLINS - LOVELAND WATER DISTRICT
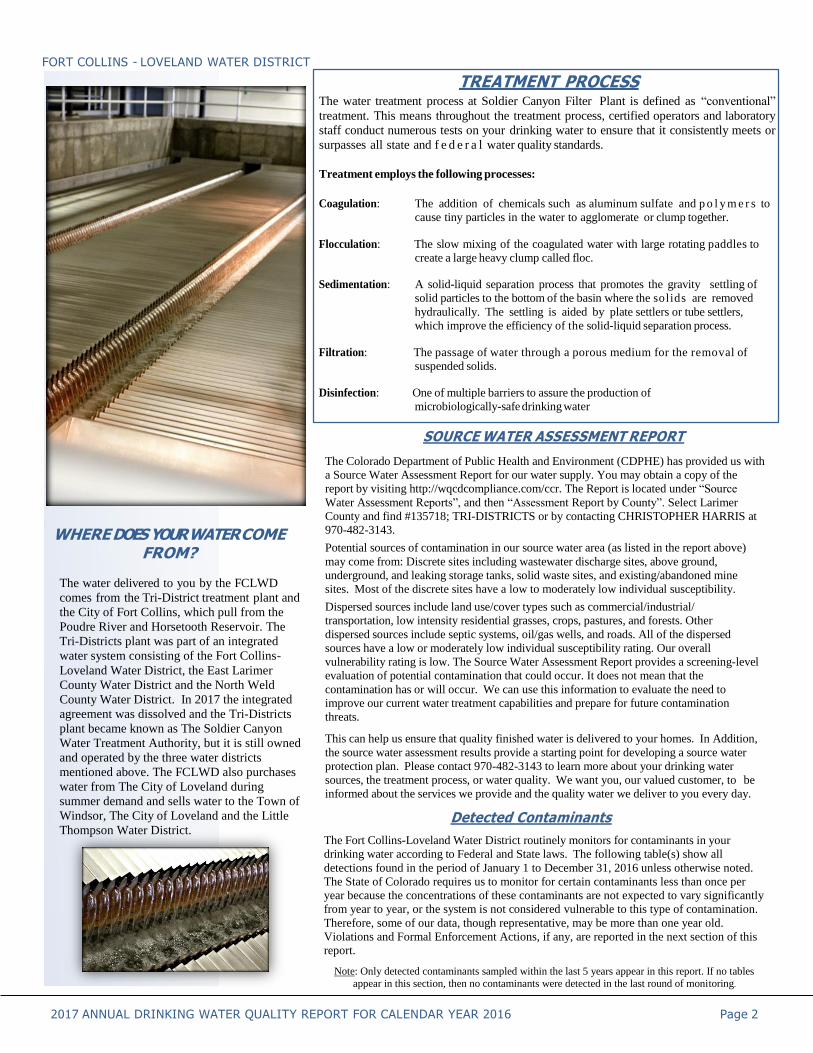
TREATMENT PROCESS The water treatment process at Soldier Canyon Filter Plant is defined as “conventional”
treatment. This means throughout the treatment process, certified operators and laboratory
staff conduct numerous tests on your drinking water to ensure that it consistently meets or
surpasses all state and f e d e r a l water quality standards.
Treatment employs the following processes:
Coagulation: The addition of chemicals such as aluminum sulfate and p o l y m e r s to
cause tiny particles in the water to agglomerate or clump together.
Flocculation: The slow mixing of the coagulated water with large rotating paddles to
create a large heavy clump called floc.
Sedimentation: A solid-liquid separation process that promotes the gravity settling of
solid particles to the bottom of the basin where the solids are removed
hydraulically. The settling is aided by plate settlers or tube settlers,
which improve the efficiency of the solid-liquid separation process.
Filtration: The passage of water through a porous medium for the removal of
suspended solids.
Disinfection: One of multiple barriers to assure the production of
microbiologically-safe drinking water
SOURCE WATER ASSESSMENT REPORT
WHERE DOES YOUR WATER COME FROM?
The water delivered to you by the FCLWD
comes from the Tri-District treatment plant and
the City of Fort Collins, which pull from the
Poudre River and Horsetooth Reservoir. The
Tri-Districts plant was part of an integrated
water system consisting of the Fort Collins-
Loveland Water District, the East Larimer
County Water District and the North Weld
County Water District. In 2017 the integrated
agreement was dissolved and the Tri-Districts
plant became known as The Soldier Canyon
Water Treatment Authority, but it is still owned
and operated by the three water districts
mentioned above. The FCLWD also purchases
water from The City of Loveland during
summer demand and sells water to the Town of
Windsor, The City of Loveland and the Little
Thompson Water District.
The Colorado Department of Public Health and Environment (CDPHE) has provided us with
a Source Water Assessment Report for our water supply. You may obtain a copy of the
report by visiting http://wqcdcompliance.com/ccr. The Report is located under “Source
Water Assessment Reports”, and then “Assessment Report by County”. Select Larimer
County and find #135718; TRI-DISTRICTS or by contacting CHRISTOPHER HARRIS at
970-482-3143.
Potential sources of contamination in our source water area (as listed in the report above)
may come from: Discrete sites including wastewater discharge sites, above ground,
underground, and leaking storage tanks, solid waste sites, and existing/abandoned mine
sites. Most of the discrete sites have a low to moderately low individual susceptibility.
Dispersed sources include land use/cover types such as commercial/industrial/
transportation, low intensity residential grasses, crops, pastures, and forests. Other
dispersed sources include septic systems, oil/gas wells, and roads. All of the dispersed
sources have a low or moderately low individual susceptibility rating. Our overall
vulnerability rating is low. The Source Water Assessment Report provides a screening-level
evaluation of potential contamination that could occur. It does not mean that the
contamination has or will occur. We can use this information to evaluate the need to
improve our current water treatment capabilities and prepare for future contamination
threats.
This can help us ensure that quality finished water is delivered to your homes. In Addition,
the source water assessment results provide a starting point for developing a source water
protection plan. Please contact 970-482-3143 to learn more about your drinking water
sources, the treatment process, or water quality. We want you, our valued customer, to be
informed about the services we provide and the quality water we deliver to you every day.
Detected Contaminants
The Fort Collins-Loveland Water District routinely monitors for contaminants in your
drinking water according to Federal and State laws. The following table(s) show all
detections found in the period of January 1 to December 31, 2016 unless otherwise noted.
The State of Colorado requires us to monitor for certain contaminants less than once per
year because the concentrations of these contaminants are not expected to vary significantly
from year to year, or the system is not considered vulnerable to this type of contamination.
Therefore, some of our data, though representative, may be more than one year old.
Violations and Formal Enforcement Actions, if any, are reported in the next section of this
report.
Note: Only detected contaminants sampled within the last 5 years appear in this report. If no tables
appear in this section, then no contaminants were detected in the last round of monitoring.
2017 ANNUAL DRINKING WATER QUALITY REPORT FOR CALENDAR YEAR 2016 Page 3
LEAD AND DRINKING WATER
If present, elevated levels of lead can cause serious health problems (especially for pregnant women and young children). It is possible that lead
levels at your home may be higher than other homes in the community as a result of materials used in your home’s plumbing. If you are concerned
about lead in your water, you may wish to have your water tested. When your water has been sitting for several hours, you can minimize the
potential for lead exposure by flushing your tap for 30 seconds to 2 minutes before using water for drinking or cooking. Additional information on
lead in drinking water, testing methods and steps you can take to minimize exposure is available from the Safe Drinking Water Hotline at 1-800-
426-4791 or visit: www.epa.gov/safewater/lead(http://water.epa.gov/drink/info/lead/index.cfm.
Definitions of Terms Used In
Report Fort Collins - Loveland Water District - FCLWD ID#
CO0135292
City of Fort Collins - FC ID# CO0135291
City of Loveland- LVD ID# CO135485 Tri Districts - TD ID# CO0135718
Action Level (AL): The concentration of a
contaminant, which, if exceeded, tr iggers
treatment or other requirements, which a water
system must follow.
Maximum Contaminant Level (MCL): The highest level
of a contaminant allowed in drinking water. MCL's
are set as close to the MCLGs as feasible using the
best available treatment technology.
Maximum Contaminant Level Goal (MCLG): The
level of a contaminant in drinking water, below
which there is no known or expected risk to
health. MCLGs allow for a margin of safety.
Maximum Residual Disinfectant Level (MRDL): The
highest level of a disinfectant allowed in drinking
water. There is convincing evidence that addition of a
disinfectant is necessary for control of microbial
contaminants.
Maximum Residual Disinfectant Level Goal (MRDLG):
The level of a drinking water disinfectant, below
which there is no known or unexpected risk to health.
MRDLGs do not reflect the benefits of the use of
disinfectants to control micro-bialcontaminants.
Nephelometric Turbidity Unit (NTU): A measure of the
clarity of water. Turbidity in excess of 5 NTU is just
noticeable to the average person.
Parts per billion (ppb) or Micrograms per liter
(µg/l): One part per billion corresponds to one
minute in 2,000 years or one penny in
$10,000,000.
Parts per million (ppm) or Milligrams per liter
(mg/l): One part per million corresponds to one
minute in two years or one penny in $10,000.
PicoCuries per Liter (pCi/l): A measure of radioactivity in
water.
Treatment Technique (TT): A treatment technique is
a required process intended to reduce the level of
a contaminant in drinking water.
Average of Individual Samples: The typical value.
Mathematically it is the sum o f values divided by the
number of samples.
Range of Individual Samples: The lowest value to the highest value.
Gross Alpha, Including RA, Excluding RN & U: This is
the gross alpha particle activity compliance value. It
includes radium-226, but excludes radon 222 and
uranium.
Parts per trillion = Nanograms per litter (ppt =
nanograms/L): One part per trillion corresponds to one minute in 2,000,000 years, or a single penny in
$10,000,000,000.
Parts per quadrillion = Picograms per liter (ppq =
pictograms/L): One part per quadrillion
Violation: A failure to meet a Colorado Primary Drinking Water Regulation.
Formal Enforcement Action: An escalated action taken
by the State (due to the number and/or severity of
violations) to bring a non-compliant water system
back into compliance by a certain time, with an
enforceable consequence if the schedule is not
met.
IMPORTANT INFORMATION
“Esta informacion es importane, si no la pueden leer, necesitan que alguien se la pueda traducir”
“The sources of drinking water (both tap water and bottled water) include rivers, lakes,
streams, ponds, reservoirs, springs, and wells. As water travels, over the surface of the land or through the ground, it dissolves naturally occurring minerals and, in some cases, radioactive material, and can pick up substances resulting from the presence
of animals or from human activity. Contaminants that may be present in source water include:
Microbial contaminants, such as viruses and bacteria that may come from sewage treatment plants, septic systems, agricultural livestock operations, and wild life.
Inorganic contaminants, such as salts and metals, urban stormwater runoff industrial or domestic mining, or farming.
Pesticides and herbicides that may come from a variety of sources, such as agricu ltu re urban stormwater runoff, and residential uses.
Organic chemical contaminants, including synthetic and volatile organic chemicals,
which are by products of industrial processes and petroleum production, and also
may come from gas stations, urban stormwater runoff, and septic systems. Radioactive
contaminants that can be naturally occurring or be the result of oil and gas production
and mining activities.”
“In order to ensure that tap water is safe to drink, the Colorado Department of Public
Health and Environment prescribes regulations that limit the amount of certain
contaminants in water provided by public water systems. The Food and Drug
Administration regulations establish limits for contaminants in bottled water that must
provide the same protection for public health.”
“All drinking water, including bottled water, may reasonably be expected to contain at
least small amounts of some contaminants. The presence of contaminants does not
necessarily indicate that the water poses a health risk. Immunocompromised persons,
such as persons with cancer undergoing chemotherapy, per sons who have undergone
organ transplants, people with HIVAIDS or other immune system disorders, some elderly,
and infants can be particularly at risk for infections. These people should seek advice about
drinking water from their health care providers. More information about contaminants and
potential health effects, or to receive a copy of the U.S. Environmental Protection
Agency (EPA) and the U.S. Centers for Disease Control (CDC) guidelines on appropriate
means to lessen the risk of infection by cryptosporidium
and microbiological contaminants, call the EPA Safe Drinking Water Hotline at 1-800-
426-4791.” or by visiting http://water.epa.gov/drink/contaminants.
2017 ANNUAL DRINKING WATER QUALITY REPORT FOR CALENDAR YEAR 2016 Page 4
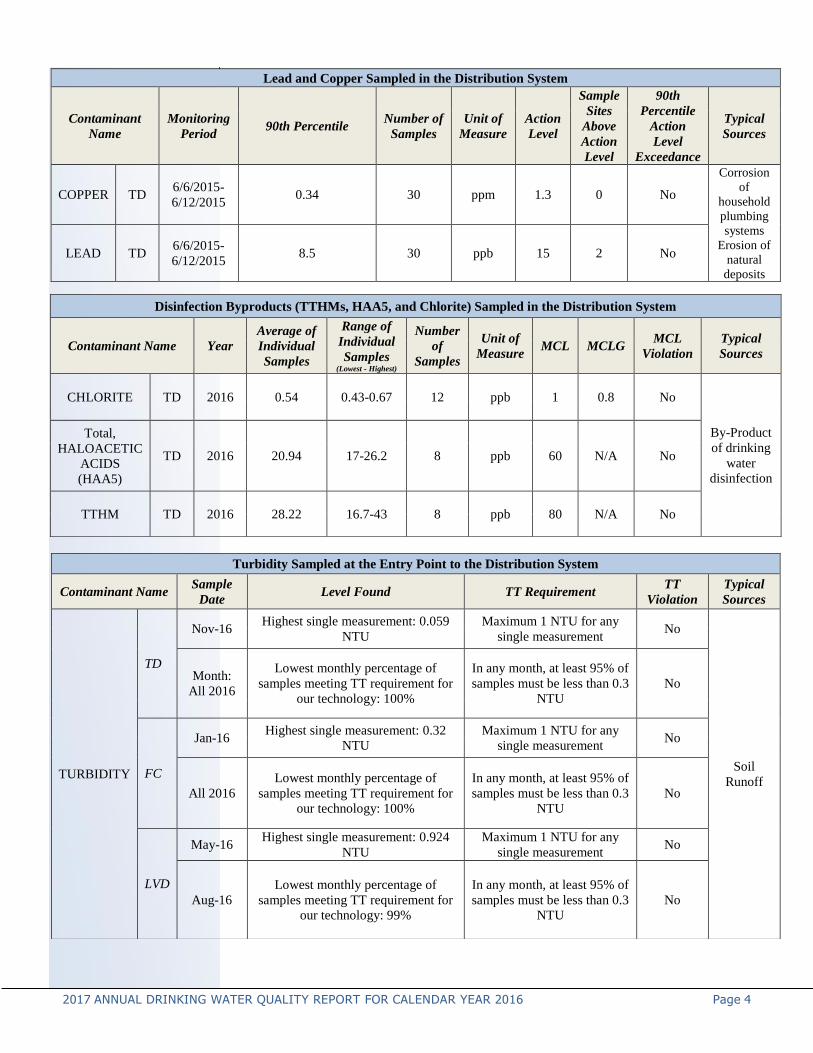
Lead and Copper Sampled in the Distribution System
Contaminant
Name
Monitoring
Period 90th Percentile
Number of
Samples
Unit of
Measure
Action
Level
Sample
Sites
Above
Action
Level
90th
Percentile
Action
Level
Exceedance
Typical
Sources
COPPER TD 6/6/2015-
6/12/2015 0.34 30 ppm 1.3 0 No
Corrosion
of
household
plumbing
systems
Erosion of
natural
deposits
LEAD TD 6/6/2015-
6/12/2015 8.5 30 ppb 15 2 No
Disinfection Byproducts (TTHMs, HAA5, and Chlorite) Sampled in the Distribution System
Contaminant Name Year
Average of
Individual
Samples
Range of
Individual
Samples (Lowest - Highest)
Number
of
Samples
Unit of
Measure MCL MCLG
MCL
Violation
Typical
Sources
CHLORITE TD 2016 0.54 0.43-0.67 12 ppb 1 0.8 No
By-Product
of drinking
water
disinfection
Total,
HALOACETIC
ACIDS
(HAA5)
TD 2016 20.94 17-26.2 8 ppb 60 N/A No
TTHM TD 2016 28.22 16.7-43 8 ppb 80 N/A No
Turbidity Sampled at the Entry Point to the Distribution System
Contaminant Name Sample
Date Level Found TT Requirement
TT
Violation
Typical
Sources
TURBIDITY
TD
Nov-16 Highest single measurement: 0.059
NTU
Maximum 1 NTU for any
single measurement No
Soil
Runoff
Month:
All 2016
Lowest monthly percentage of
samples meeting TT requirement for
our technology: 100%
In any month, at least 95% of
samples must be less than 0.3
NTU
No
FC
Jan-16 Highest single measurement: 0.32
NTU
Maximum 1 NTU for any
single measurement No
All 2016
Lowest monthly percentage of
samples meeting TT requirement for
our technology: 100%
In any month, at least 95% of
samples must be less than 0.3
NTU
No
LVD
May-16 Highest single measurement: 0.924
NTU
Maximum 1 NTU for any
single measurement No
Aug-16
Lowest monthly percentage of
samples meeting TT requirement for
our technology: 99%
In any month, at least 95% of
samples must be less than 0.3
NTU
No
2017 ANNUAL DRINKING WATER QUALITY REPORT FOR CALENDAR YEAR 2016 Page 5
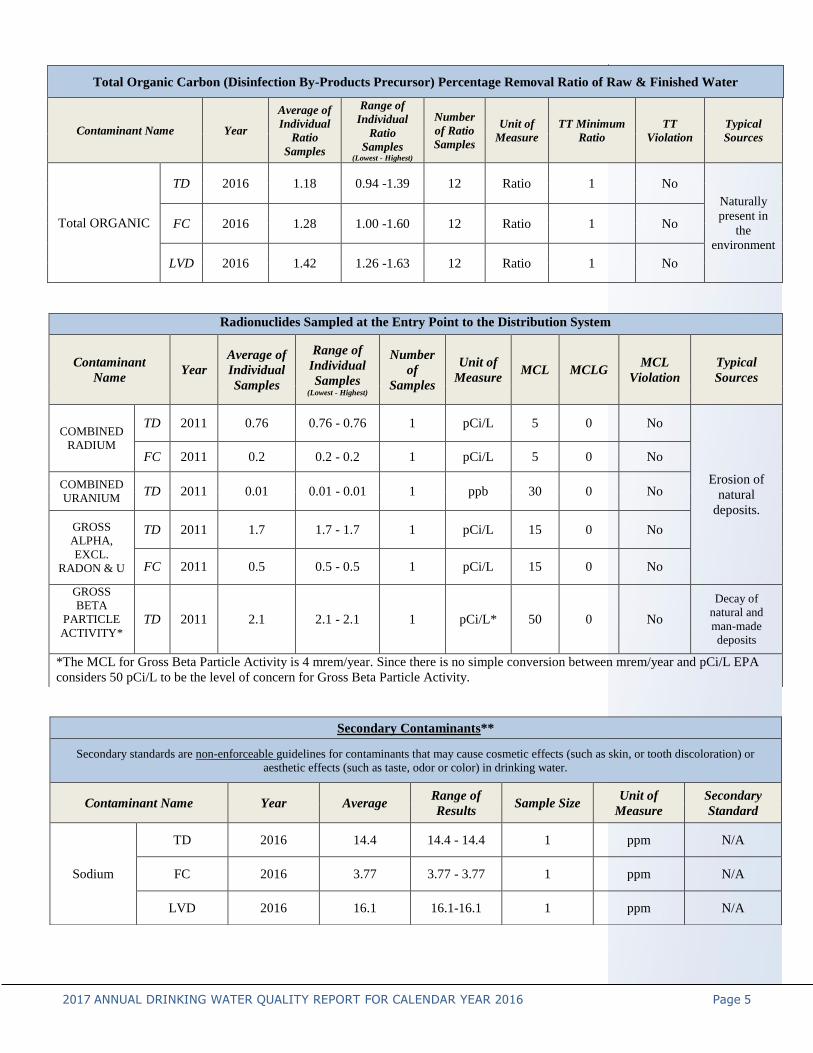
Total Organic Carbon (Disinfection By-Products Precursor) Percentage Removal Ratio of Raw & Finished Water
Contaminant Name Year
Average of
Individual
Ratio
Samples
Range of
Individual
Ratio
Samples (Lowest - Highest)
Number
of Ratio
Samples
Unit of
Measure
TT Minimum
Ratio
TT
Violation
Typical
Sources
Total ORGANIC
TD 2016 1.18 0.94 -1.39 12 Ratio 1 No
Naturally
present in
the
environment
FC 2016 1.28 1.00 -1.60 12 Ratio 1 No
LVD 2016 1.42 1.26 -1.63 12 Ratio 1 No
Radionuclides Sampled at the Entry Point to the Distribution System
Contaminant
Name Year
Average of
Individual
Samples
Range of
Individual
Samples (Lowest - Highest)
Number
of
Samples
Unit of
Measure MCL MCLG
MCL
Violation
Typical
Sources
COMBINED
RADIUM
TD 2011 0.76 0.76 - 0.76 1 pCi/L 5 0 No
Erosion of
natural
deposits.
FC 2011 0.2 0.2 - 0.2 1 pCi/L 5 0 No
COMBINED
URANIUM TD 2011 0.01 0.01 - 0.01 1 ppb 30 0 No
GROSS
ALPHA,
EXCL.
RADON & U
TD 2011 1.7 1.7 - 1.7 1 pCi/L 15 0 No
FC 2011 0.5 0.5 - 0.5 1 pCi/L 15 0 No
GROSS
BETA
PARTICLE
ACTIVITY*
TD 2011 2.1 2.1 - 2.1 1 pCi/L* 50 0 No
Decay of
natural and
man-made
deposits
*The MCL for Gross Beta Particle Activity is 4 mrem/year. Since there is no simple conversion between mrem/year and pCi/L EPA
considers 50 pCi/L to be the level of concern for Gross Beta Particle Activity.
Secondary Contaminants**
Secondary standards are non-enforceable guidelines for contaminants that may cause cosmetic effects (such as skin, or tooth discoloration) or
aesthetic effects (such as taste, odor or color) in drinking water.
Contaminant Name Year Average Range of
Results Sample Size
Unit of
Measure
Secondary
Standard
Sodium
TD 2016 14.4 14.4 - 14.4 1 ppm N/A
FC 2016 3.77 3.77 - 3.77 1 ppm N/A
LVD 2016 16.1 16.1-16.1 1 ppm N/A
2017 ANNUAL DRINKING WATER QUALITY REPORT FOR CALENDAR YEAR 2016 Page 6
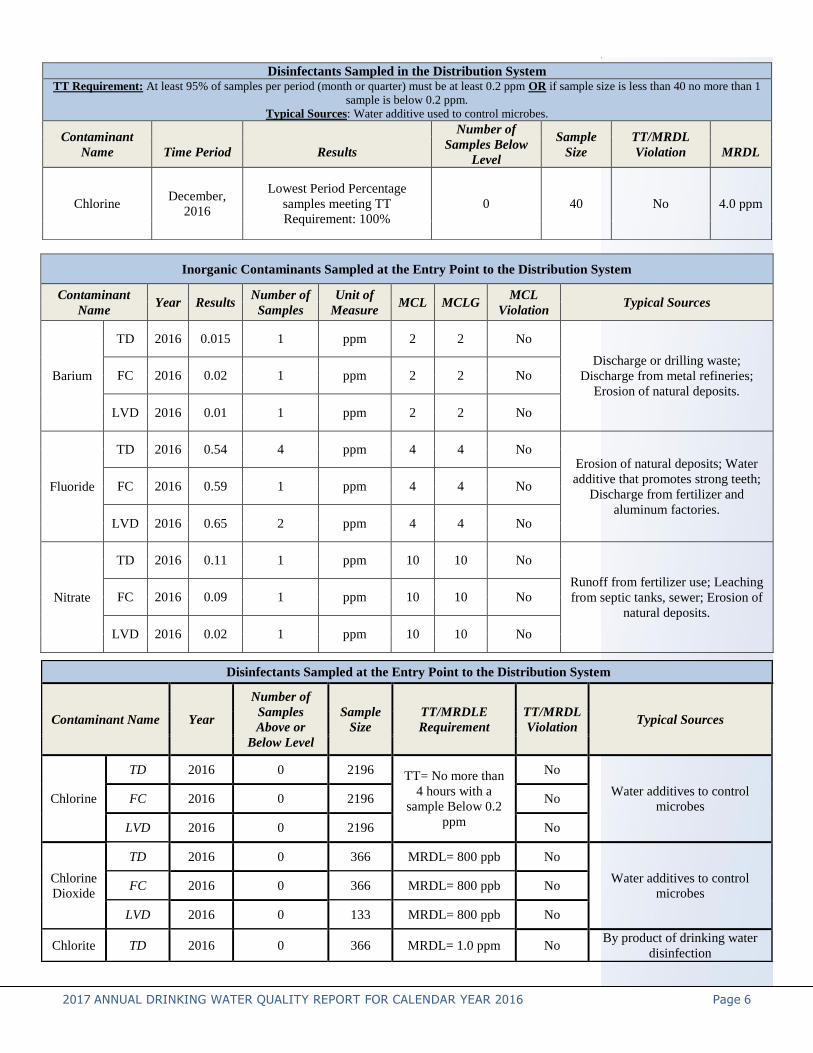
Disinfectants Sampled in the Distribution System TT Requirement: At least 95% of samples per period (month or quarter) must be at least 0.2 ppm OR if sample size is less than 40 no more than 1
sample is below 0.2 ppm.
Typical Sources: Water additive used to control microbes.
Contaminant
Name
Time Period
Results
Number of
Samples Below
Level
Sample
Size
TT/MRDL
Violation
MRDL
Chlorine December,
2016
Lowest Period Percentage
samples meeting TT
Requirement: 100%
0 40 No 4.0 ppm
Inorganic Contaminants Sampled at the Entry Point to the Distribution System
Contaminant
Name Year Results
Number of
Samples
Unit of
Measure MCL MCLG
MCL
Violation Typical Sources
Barium
TD 2016 0.015 1 ppm 2 2 No
Discharge or drilling waste;
Discharge from metal refineries;
Erosion of natural deposits.
FC 2016 0.02 1 ppm 2 2 No
LVD 2016 0.01 1 ppm 2 2 No
Fluoride
TD 2016 0.54 4 ppm 4 4 No Erosion of natural deposits; Water
additive that promotes strong teeth;
Discharge from fertilizer and
aluminum factories.
FC 2016 0.59 1 ppm 4 4 No
LVD 2016 0.65 2 ppm 4 4 No
Nitrate
TD 2016 0.11 1 ppm 10 10 No
Runoff from fertilizer use; Leaching
from septic tanks, sewer; Erosion of
natural deposits.
FC 2016 0.09 1 ppm 10 10 No
LVD 2016 0.02 1 ppm 10 10 No
Disinfectants Sampled at the Entry Point to the Distribution System
Contaminant Name Year
Number of
Samples
Above or
Below Level
Sample
Size
TT/MRDLE
Requirement
TT/MRDL
Violation Typical Sources
Chlorine
TD 2016 0 2196 TT= No more than
4 hours with a
sample Below 0.2
ppm
No
Water additives to control
microbes FC 2016 0 2196 No
LVD 2016 0 2196 No
Chlorine
Dioxide
TD 2016 0 366 MRDL= 800 ppb No
Water additives to control
microbes FC 2016 0 366 MRDL= 800 ppb No
LVD 2016 0 133 MRDL= 800 ppb No
Chlorite TD 2016 0 366 MRDL= 1.0 ppm No By product of drinking water
disinfection
2017 ANNUAL DRINKING WATER QUALITY REPORT FOR CALENDAR YEAR 2016 Page 7
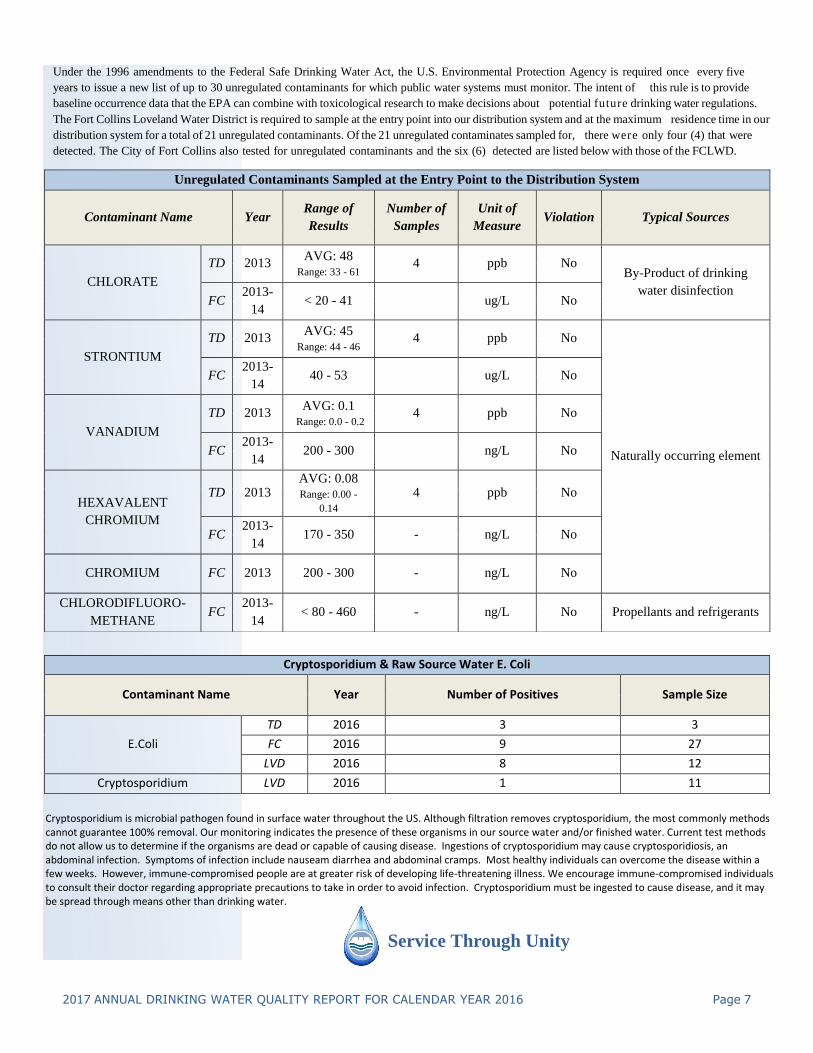
Under the 1996 amendments to the Federal Safe Drinking Water Act, the U.S. Environmental Protection Agency is required once every five
years to issue a new list of up to 30 unregulated contaminants for which public water systems must monitor. The intent of this rule is to provide
baseline occurrence data that the EPA can combine with toxicological research to make decisions about potential future drinking water regulations.
The Fort Collins Loveland Water District is required to sample at the entry point into our distribution system and at the maximum residence time in our
distribution system for a total of 21 unregulated contaminants. Of the 21 unregulated contaminates sampled for, there were only four (4) that were
detected. The City of Fort Collins also tested for unregulated contaminants and the six (6) detected are listed below with those of the FCLWD.
Service Through Unity
Unregulated Contaminants Sampled at the Entry Point to the Distribution System
Contaminant Name Year Range of
Results
Number of
Samples
Unit of
Measure Violation Typical Sources
CHLORATE
TD 2013 AVG: 48
Range: 33 - 61 4 ppb No
By-Product of drinking
water disinfection FC
2013-
14 < 20 - 41 ug/L No
STRONTIUM
TD 2013 AVG: 45
Range: 44 - 46 4 ppb No
Naturally occurring element
FC 2013-
14 40 - 53 ug/L No
VANADIUM
TD 2013 AVG: 0.1
Range: 0.0 - 0.2 4 ppb No
FC 2013-
14 200 - 300 ng/L No
HEXAVALENT
CHROMIUM
TD 2013 AVG: 0.08
Range: 0.00 -
0.14
4 ppb No
FC 2013-
14 170 - 350 - ng/L No
CHROMIUM FC 2013 200 - 300 - ng/L No
CHLORODIFLUORO-
METHANE FC
2013-
14 < 80 - 460 - ng/L No Propellants and refrigerants
Cryptosporidium & Raw Source Water E. Coli
Contaminant Name Year Number of Positives Sample Size
E.Coli
TD 2016 3 3
FC 2016 9 27
LVD 2016 8 12
Cryptosporidium LVD 2016 1 11
Cryptosporidium is microbial pathogen found in surface water throughout the US. Although filtration removes cryptosporidium, the most commonly methods cannot guarantee 100% removal. Our monitoring indicates the presence of these organisms in our source water and/or finished water. Current test methods do not allow us to determine if the organisms are dead or capable of causing disease. Ingestions of cryptosporidium may cause cryptosporidiosis, an abdominal infection. Symptoms of infection include nauseam diarrhea and abdominal cramps. Most healthy individuals can overcome the disease within a few weeks. However, immune-compromised people are at greater risk of developing life-threatening illness. We encourage immune-compromised individuals to consult their doctor regarding appropriate precautions to take in order to avoid infection. Cryptosporidium must be ingested to cause disease, and it may be spread through means other than drinking water.