Embed Size (px)
Citation preview

© 2017 James Dines & Co, Inc, PO Box 22, Belvedere, CA 94920
The information contained in this update may be acted on only by a subscriber and only after a review and understanding of the information contained in previous issues of The Dines Letter
(TDL) plus the “Introductory Subscriber Kit” sent to all new subscribers to The Dines Letter (TDLrs). All conditions and restrictions contained in The Dines Letter are incorporated into this
update by reference and apply as if fully set forth herein.
January 4, 2017
VOLUME 57 NUMBER 1&2
DJI 19,942.16
DJT 9,115.72
DJU 659.28
NASDAQ 5,477.00
Gold 1,164.70
Silver 16.49
2017 ANNUAL FORECAST ISSUE DOUBLE ISSUE
Page 1. Which Way Stock Markets? Which Stocks to Buy? 5. Will Trump Trigger a Gold and Silver Bull Market?
7. TDL’s Latest on Silver; a Sensational Prediction! 9. Raw Materials and Even Uranium 10. Biggest Winners in 2016 11. When Inflation? And Gold? 12. Debt’s Impact on Gold 15. Latest from “The Original Potbug”; Go For Blood! 17. Latest on Geopolitics in the World 20. Health: The Coming Physical Immortality 21. TPG: TDL’s Political Gamut, Optimistic? 24. Nostradinesus: Terror Will Come to Russia 27. Seasonalities, For Advanced Market Students 31. TDL’s Long-Term Charts 35. Presstime Gold Flash; Proof that Trump is a Goldbug?
TABLE OF CONTENTS
What’s the use of worrying? It never was worthwhile, So, pack up your troubles in your old kit-bag, And smile, smile, smile. George Asaf (1915)
He buys honey too dear who licks it from thorns. Proverb
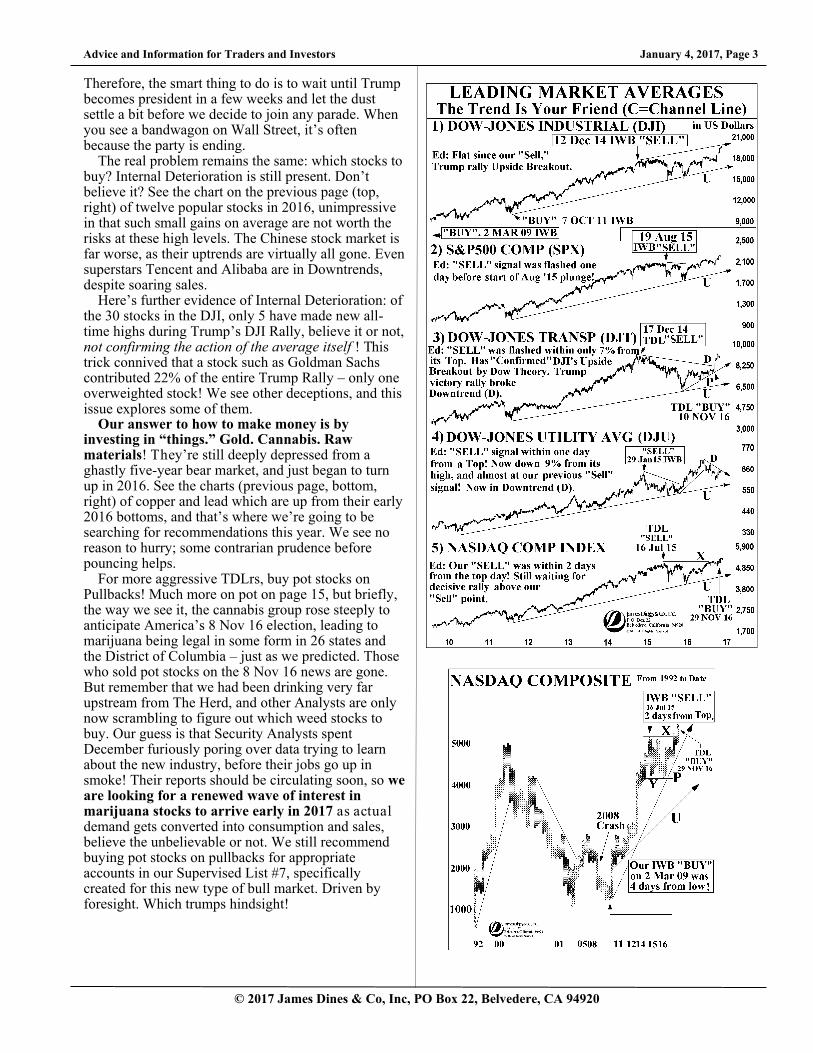
One of the very best calls in TDL’s history was the “Buy” signal within only four days from the rock bottom low of this bull market, at 6,763 on 2 Mar 09, daring to buy when the frightened world was in the throes of the notorious banking crisis and stock-market crash. (See “A” on chart, at bottom right). Subsequently, the DJI (Dow-Jones Industrial Index) rose relentlessly for six straight years, during which we correctly maintained our optimistic stance.
But on 12 Dec 14 we issued a “Sell” signal (at Q)because we observed one of the telltale signs of a Top – “Internal Deterioration” – one of our discoveries – when increasing numbers of leading stocks stop going up, and even decline. Internal Deterioration is so subtle that it doesn’t always show up in traditional Advance/Decline Indicators.
We remained bearish for the next two years (2015 and 2016) despite numerous False Upside Breakouts (with one brief and unimportant exception). In those two years the leading averages flattened out (see X,Y), and we knew it was either a Top or a platform for a new upward leg. Similarly, averages worldwide also began
to flatten out. International currencies began declining in 2016, and many of China’s stocks also developed miserable Internal Deterioration. We were convinced that there was a risk of the market
WHICH WAY STOCK MARKETS?
WHICH STOCKS TO BUY?
January 4, 2017, Page 2 Advice and Information for Traders and Investors
© 2017 James Dines & Co, Inc, PO Box 22, Belvedere, CA 94920
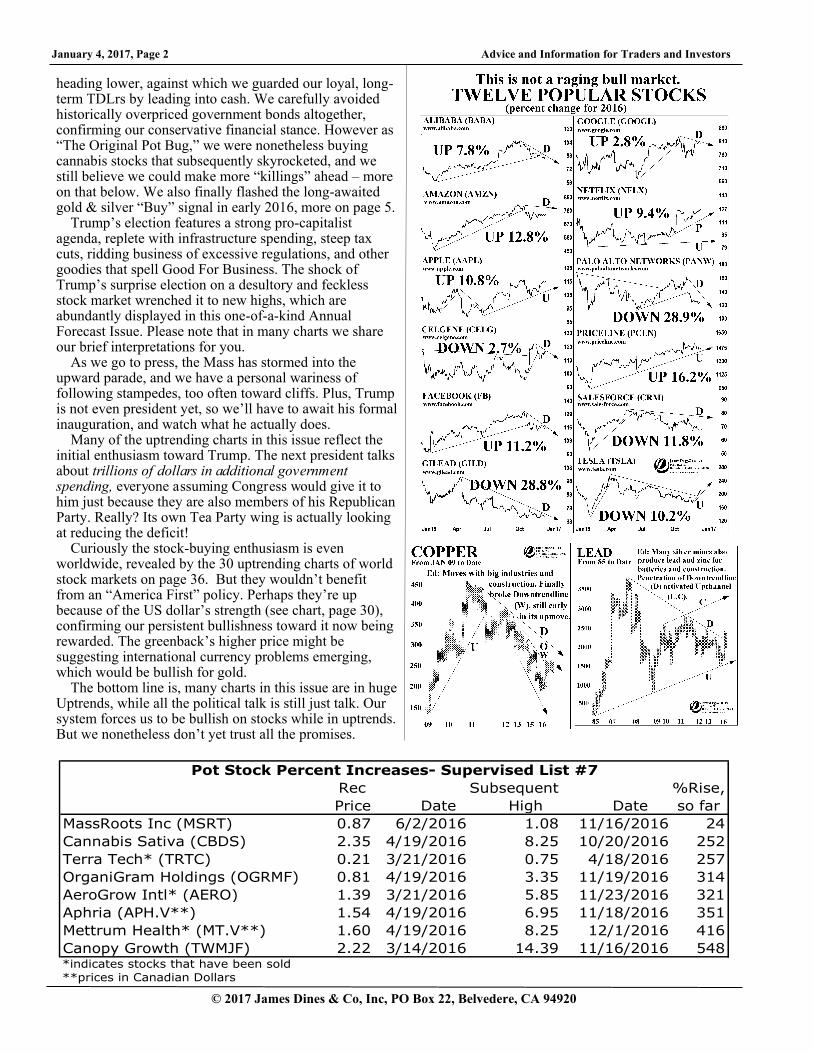
heading lower, against which we guarded our loyal, long-term TDLrs by leading into cash. We carefully avoided historically overpriced government bonds altogether, confirming our conservative financial stance. However as “The Original Pot Bug,” we were nonetheless buying cannabis stocks that subsequently skyrocketed, and we still believe we could make more “killings” ahead – more on that below. We also finally flashed the long-awaited gold & silver “Buy” signal in early 2016, more on page 5.
Trump’s election features a strong pro-capitalist agenda, replete with infrastructure spending, steep tax cuts, ridding business of excessive regulations, and other goodies that spell Good For Business. The shock of Trump’s surprise election on a desultory and feckless stock market wrenched it to new highs, which are abundantly displayed in this one-of-a-kind Annual Forecast Issue. Please note that in many charts we share our brief interpretations for you.
As we go to press, the Mass has stormed into the upward parade, and we have a personal wariness of following stampedes, too often toward cliffs. Plus, Trump is not even president yet, so we’ll have to await his formal inauguration, and watch what he actually does.
Many of the uptrending charts in this issue reflect the initial enthusiasm toward Trump. The next president talks about trillions of dollars in additional government spending, everyone assuming Congress would give it to him just because they are also members of his Republican Party. Really? Its own Tea Party wing is actually looking at reducing the deficit!
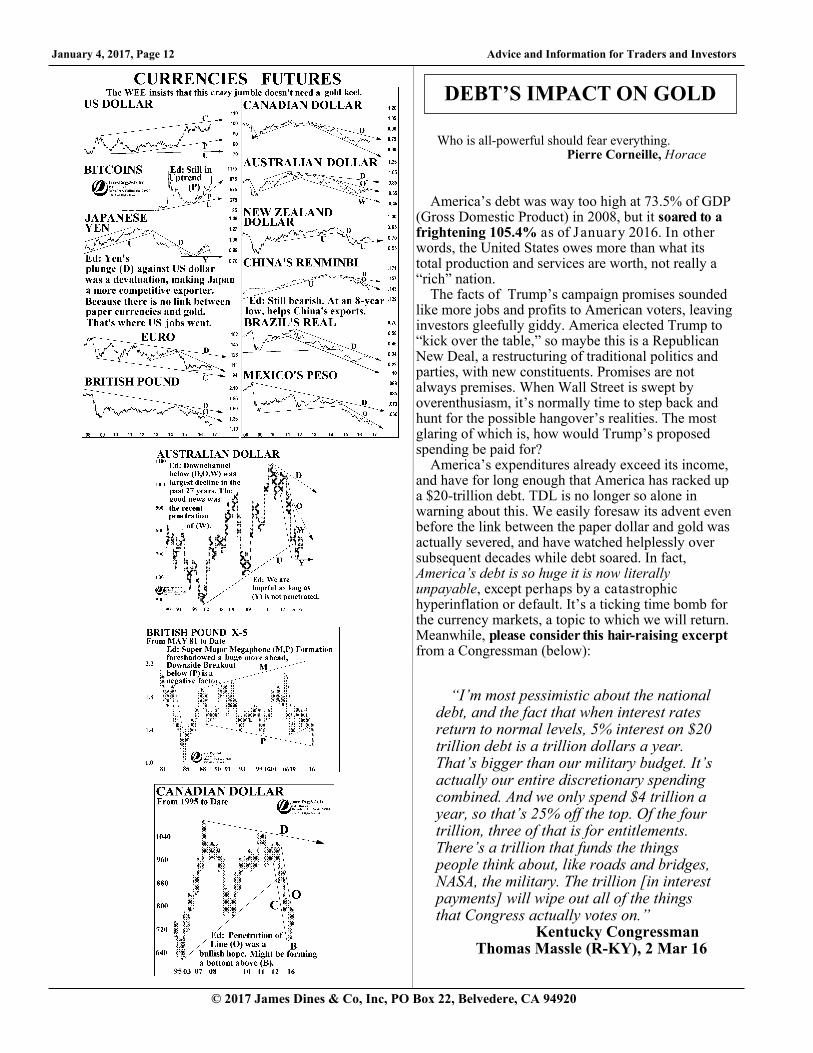
Curiously the stock-buying enthusiasm is even worldwide, revealed by the 30 uptrending charts of world stock markets on page 36. But they wouldn’t benefit from an “America First” policy. Perhaps they’re up because of the US dollar’s strength (see chart, page 30), confirming our persistent bullishness toward it now being rewarded. The greenback’s higher price might be suggesting international currency problems emerging, which would be bullish for gold.
The bottom line is, many charts in this issue are in huge Uptrends, while all the political talk is still just talk. Our system forces us to be bullish on stocks while in uptrends. But we nonetheless don’t yet trust all the promises.
Rec Subsequent %Rise,
Price Date High Date so far
MassRoots Inc (MSRT) 0.87 6/2/2016 1.08 11/16/2016 24
Cannabis Sativa (CBDS) 2.35 4/19/2016 8.25 10/20/2016 252
Terra Tech* (TRTC) 0.21 3/21/2016 0.75 4/18/2016 257
OrganiGram Holdings (OGRMF) 0.81 4/19/2016 3.35 11/19/2016 314
AeroGrow Intl* (AERO) 1.39 3/21/2016 5.85 11/23/2016 321
Aphria (APH.V**) 1.54 4/19/2016 6.95 11/18/2016 351
Mettrum Health* (MT.V**) 1.60 4/19/2016 8.25 12/1/2016 416
Canopy Growth (TWMJF) 2.22 3/14/2016 14.39 11/16/2016 548*indicates stocks that have been sold
**prices in Canadian Dollars
Pot Stock Percent Increases- Supervised List #7
Advice and Information for Traders and Investors January 4, 2017, Page 3
© 2017 James Dines & Co, Inc, PO Box 22, Belvedere, CA 94920
Therefore, the smart thing to do is to wait until Trump becomes president in a few weeks and let the dust settle a bit before we decide to join any parade. When you see a bandwagon on Wall Street, it’s often because the party is ending.
The real problem remains the same: which stocks to buy? Internal Deterioration is still present. Don’t believe it? See the chart on the previous page (top, right) of twelve popular stocks in 2016, unimpressive in that such small gains on average are not worth the risks at these high levels. The Chinese stock market is far worse, as their uptrends are virtually all gone. Even superstars Tencent and Alibaba are in Downtrends, despite soaring sales.
Here’s further evidence of Internal Deterioration: of the 30 stocks in the DJI, only 5 have made new all-time highs during Trump’s DJI Rally, believe it or not, not confirming the action of the average itself ! This trick connived that a stock such as Goldman Sachs contributed 22% of the entire Trump Rally – only one overweighted stock! We see other deceptions, and this issue explores some of them.
Our answer to how to make money is by investing in “things.” Gold. Cannabis. Raw materials! They’re still deeply depressed from a ghastly five-year bear market, and just began to turn up in 2016. See the charts (previous page, bottom, right) of copper and lead which are up from their early 2016 bottoms, and that’s where we’re going to be searching for recommendations this year. We see no reason to hurry; some contrarian prudence before pouncing helps.
For more aggressive TDLrs, buy pot stocks on Pullbacks! Much more on pot on page 15, but briefly, the way we see it, the cannabis group rose steeply to anticipate America’s 8 Nov 16 election, leading to marijuana being legal in some form in 26 states and the District of Columbia – just as we predicted. Those who sold pot stocks on the 8 Nov 16 news are gone. But remember that we had been drinking very far upstream from The Herd, and other Analysts are only now scrambling to figure out which weed stocks to buy. Our guess is that Security Analysts spent December furiously poring over data trying to learn about the new industry, before their jobs go up in smoke! Their reports should be circulating soon, so we are looking for a renewed wave of interest in marijuana stocks to arrive early in 2017 as actual demand gets converted into consumption and sales, believe the unbelievable or not. We still recommend buying pot stocks on pullbacks for appropriate accounts in our Supervised List #7, specifically created for this new type of bull market. Driven by foresight. Which trumps hindsight!
January 4, 2017, Page 4 Advice and Information for Traders and Investors
© 2017 James Dines & Co, Inc, PO Box 22, Belvedere, CA 94920
Advice and Information for Traders and Investors January 4, 2017, Page 5
© 2017 James Dines & Co, Inc, PO Box 22, Belvedere, CA 94920
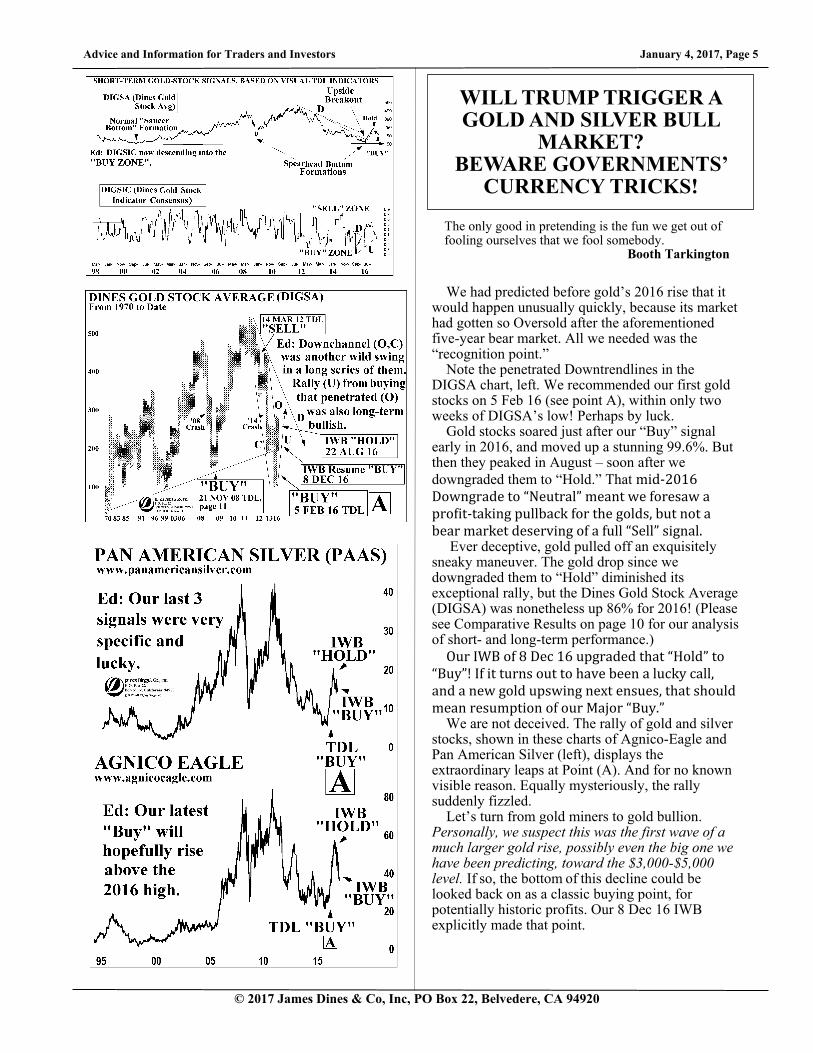
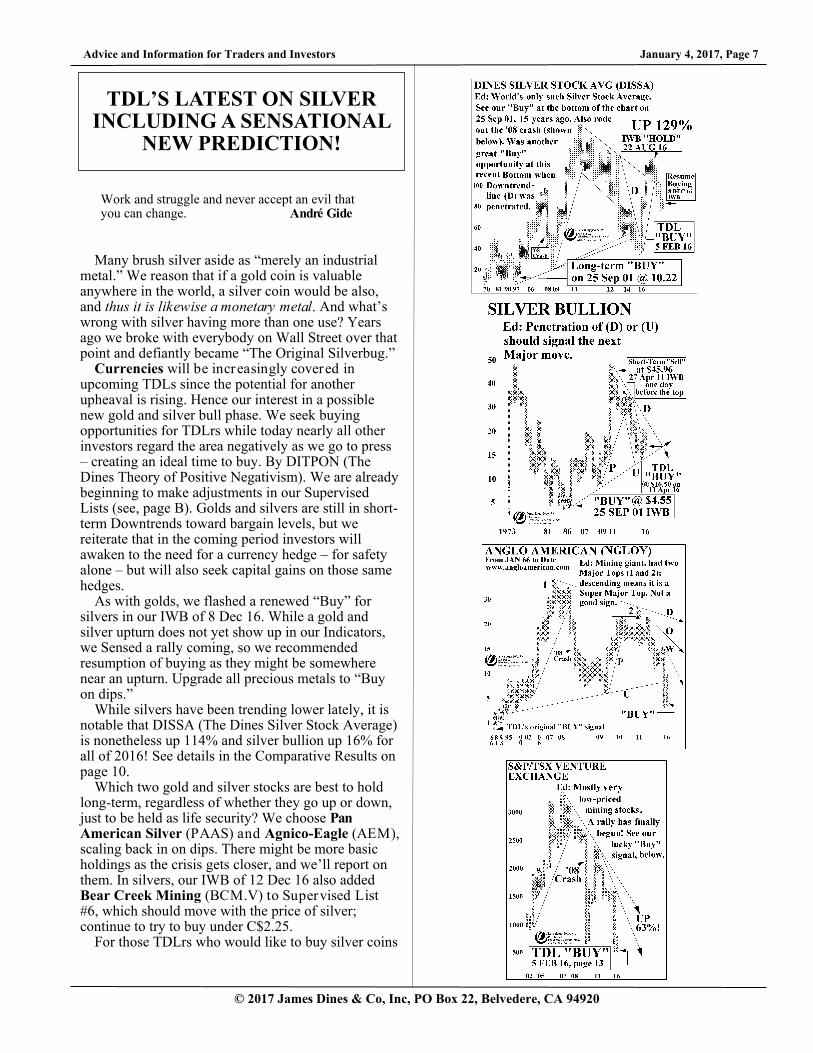
We had predicted before gold’s 2016 rise that it would happen unusually quickly, because its market had gotten so Oversold after the aforementioned five-year bear market. All we needed was the “recognition point.”
Note the penetrated Downtrendlines in the DIGSA chart, left. We recommended our first gold stocks on 5 Feb 16 (see point A), within only two weeks of DIGSA’s low! Perhaps by luck.
Gold stocks soared just after our “Buy” signal early in 2016, and moved up a stunning 99.6%. But then they peaked in August – soon after we
downgraded them to “Hold.” That mid-2016 Downgrade to “Neutral” meant we foresaw a profit-taking pullback for the golds, but not a bear market deserving of a full “Sell” signal.
Ever deceptive, gold pulled off an exquisitely sneaky maneuver. The gold drop since we downgraded them to “Hold” diminished its exceptional rally, but the Dines Gold Stock Average (DIGSA) was nonetheless up 86% for 2016! (Please see Comparative Results on page 10 for our analysis of short- and long-term performance.)
Our IWB of 8 Dec 16 upgraded that “Hold” to “Buy”! If it turns out to have been a lucky call, and a new gold upswing next ensues, that should mean resumption of our Major “Buy.”
We are not deceived. The rally of gold and silver stocks, shown in these charts of Agnico-Eagle and Pan American Silver (left), displays the extraordinary leaps at Point (A). And for no known visible reason. Equally mysteriously, the rally suddenly fizzled.
Let’s turn from gold miners to gold bullion. Personally, we suspect this was the first wave of a much larger gold rise, possibly even the big one we have been predicting, toward the $3,000-$5,000 level. If so, the bottom of this decline could be looked back on as a classic buying point, for potentially historic profits. Our 8 Dec 16 IWB explicitly made that point.
WILL TRUMP TRIGGER A GOLD AND SILVER BULL
MARKET? BEWARE GOVERNMENTS’
CURRENCY TRICKS!
The only good in pretending is the fun we get out of fooling ourselves that we fool somebody. Booth Tarkington
January 4, 2017, Page 6 Advice and Information for Traders and Investors
© 2017 James Dines & Co, Inc, PO Box 22, Belvedere, CA 94920
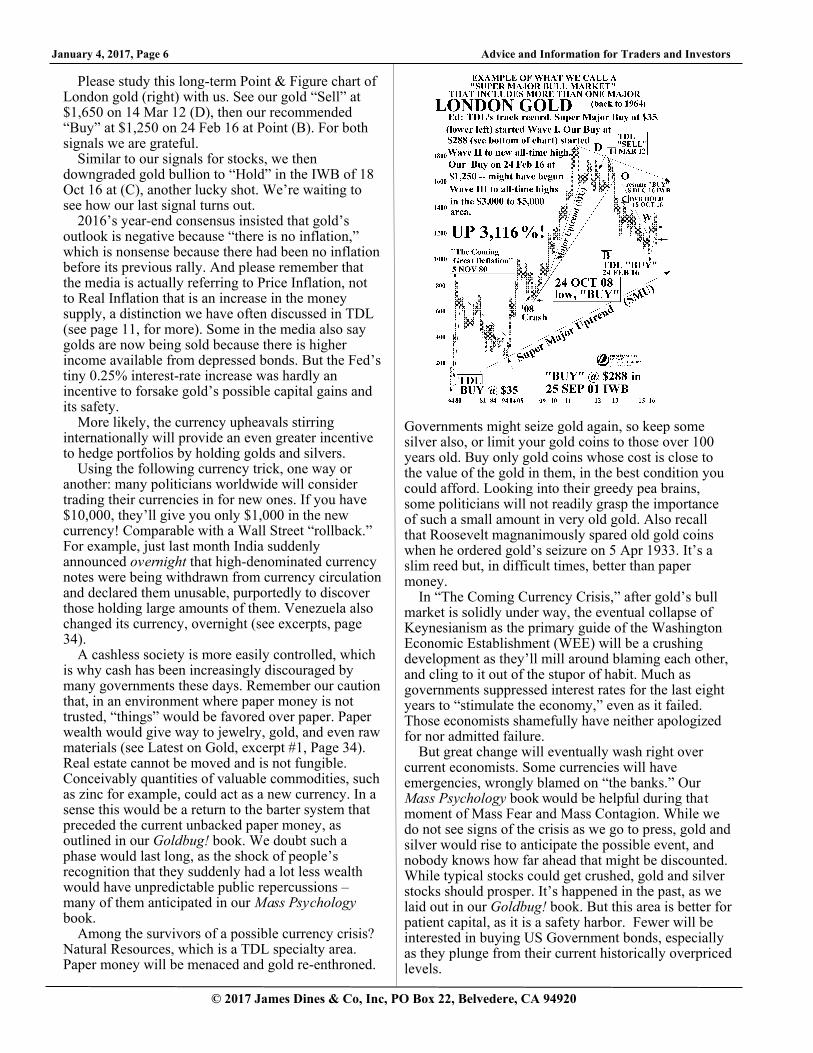
Please study this long-term Point & Figure chart of London gold (right) with us. See our gold “Sell” at $1,650 on 14 Mar 12 (D), then our recommended “Buy” at $1,250 on 24 Feb 16 at Point (B). For both signals we are grateful.
Similar to our signals for stocks, we then downgraded gold bullion to “Hold” in the IWB of 18 Oct 16 at (C), another lucky shot. We’re waiting to see how our last signal turns out.
2016’s year-end consensus insisted that gold’s outlook is negative because “there is no inflation,” which is nonsense because there had been no inflation before its previous rally. And please remember that the media is actually referring to Price Inflation, not to Real Inflation that is an increase in the money supply, a distinction we have often discussed in TDL (see page 11, for more). Some in the media also say golds are now being sold because there is higher income available from depressed bonds. But the Fed’s tiny 0.25% interest-rate increase was hardly an incentive to forsake gold’s possible capital gains and its safety.
More likely, the currency upheavals stirring internationally will provide an even greater incentive to hedge portfolios by holding golds and silvers.
Using the following currency trick, one way or another: many politicians worldwide will consider trading their currencies in for new ones. If you have $10,000, they’ll give you only $1,000 in the new currency! Comparable with a Wall Street “rollback.” For example, just last month India suddenly announced overnight that high-denominated currency notes were being withdrawn from currency circulation and declared them unusable, purportedly to discover those holding large amounts of them. Venezuela also changed its currency, overnight (see excerpts, page 34).
A cashless society is more easily controlled, which is why cash has been increasingly discouraged by many governments these days. Remember our caution that, in an environment where paper money is not trusted, “things” would be favored over paper. Paper wealth would give way to jewelry, gold, and even raw materials (see Latest on Gold, excerpt #1, Page 34). Real estate cannot be moved and is not fungible. Conceivably quantities of valuable commodities, such as zinc for example, could act as a new currency. In a sense this would be a return to the barter system that preceded the current unbacked paper money, as outlined in our Goldbug! book. We doubt such a phase would last long, as the shock of people’s recognition that they suddenly had a lot less wealth would have unpredictable public repercussions – many of them anticipated in our Mass Psychology book.
Among the survivors of a possible currency crisis? Natural Resources, which is a TDL specialty area. Paper money will be menaced and gold re-enthroned.
Governments might seize gold again, so keep some silver also, or limit your gold coins to those over 100 years old. Buy only gold coins whose cost is close to the value of the gold in them, in the best condition you could afford. Looking into their greedy pea brains, some politicians will not readily grasp the importance of such a small amount in very old gold. Also recall that Roosevelt magnanimously spared old gold coins when he ordered gold’s seizure on 5 Apr 1933. It’s a slim reed but, in difficult times, better than paper money.
In “The Coming Currency Crisis,” after gold’s bull market is solidly under way, the eventual collapse of Keynesianism as the primary guide of the Washington Economic Establishment (WEE) will be a crushing development as they’ll mill around blaming each other, and cling to it out of the stupor of habit. Much as governments suppressed interest rates for the last eight years to “stimulate the economy,” even as it failed. Those economists shamefully have neither apologized for nor admitted failure.
But great change will eventually wash right over current economists. Some currencies will have emergencies, wrongly blamed on “the banks.” Our Mass Psychology book would be helpful during that moment of Mass Fear and Mass Contagion. While we do not see signs of the crisis as we go to press, gold and silver would rise to anticipate the possible event, and nobody knows how far ahead that might be discounted. While typical stocks could get crushed, gold and silver stocks should prosper. It’s happened in the past, as we laid out in our Goldbug! book. But this area is better for patient capital, as it is a safety harbor. Fewer will be interested in buying US Government bonds, especially as they plunge from their current historically overpriced levels.
Advice and Information for Traders and Investors January 4, 2017, Page 7
© 2017 James Dines & Co, Inc, PO Box 22, Belvedere, CA 94920
Many brush silver aside as “merely an industrial metal.” We reason that if a gold coin is valuable anywhere in the world, a silver coin would be also, and thus it is likewise a monetary metal. And what’s wrong with silver having more than one use? Years ago we broke with everybody on Wall Street over that point and defiantly became “The Original Silverbug.”
Currencies will be increasingly covered in upcoming TDLs since the potential for another upheaval is rising. Hence our interest in a possible new gold and silver bull phase. We seek buying opportunities for TDLrs while today nearly all other investors regard the area negatively as we go to press – creating an ideal time to buy. By DITPON (The Dines Theory of Positive Negativism). We are already beginning to make adjustments in our Supervised Lists (see, page B). Golds and silvers are still in short-term Downtrends toward bargain levels, but we reiterate that in the coming period investors will awaken to the need for a currency hedge – for safety alone – but will also seek capital gains on those same hedges.
As with golds, we flashed a renewed “Buy” for silvers in our IWB of 8 Dec 16. While a gold and silver upturn does not yet show up in our Indicators, we Sensed a rally coming, so we recommended resumption of buying as they might be somewhere near an upturn. Upgrade all precious metals to “Buy on dips.”
While silvers have been trending lower lately, it is notable that DISSA (The Dines Silver Stock Average) is nonetheless up 114% and silver bullion up 16% for all of 2016! See details in the Comparative Results on page 10.
Which two gold and silver stocks are best to hold long-term, regardless of whether they go up or down, just to be held as life security? We choose Pan American Silver (PAAS) and Agnico-Eagle (AEM), scaling back in on dips. There might be more basic holdings as the crisis gets closer, and we’ll report on them. In silvers, our IWB of 12 Dec 16 also added Bear Creek Mining (BCM.V) to Supervised List #6, which should move with the price of silver; continue to try to buy under C$2.25.
For those TDLrs who would like to buy silver coins
TDL’S LATEST ON SILVER INCLUDING A SENSATIONAL
NEW PREDICTION!
Work and struggle and never accept an evil that you can change. André Gide
January 4, 2017, Page 8 Advice and Information for Traders and Investors
© 2017 James Dines & Co, Inc, PO Box 22, Belvedere, CA 94920
we recommend as our first choice, the beautiful Walking Liberty half-dollar coin, still easily obtained near its Melt Price in “brilliant, uncirculated” – even proof condition. It is wise to stretch your budget as much as feasible when purchasing such gold and silver coins because they should rise in their eventual bull market first and farthest, driven by speculators joining the current numismatists. As sage advice, never maintain such coins anywhere near your residence or on your person, and keep your ownership confidential.
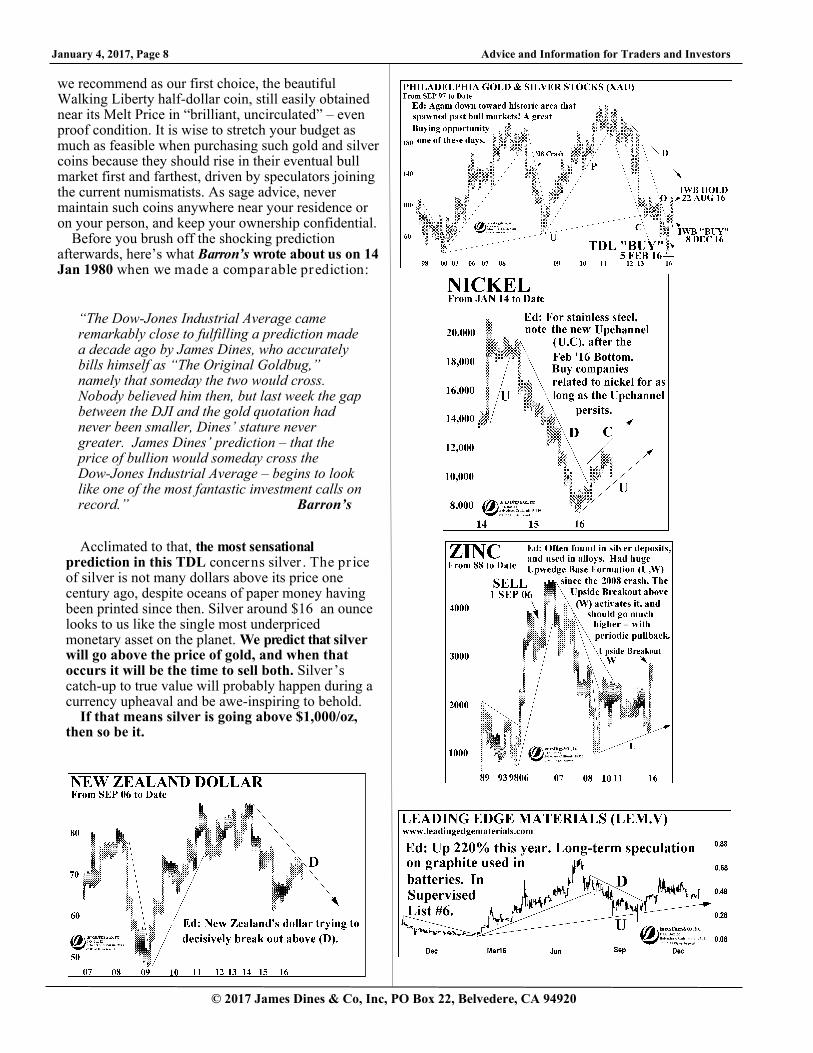
Before you brush off the shocking prediction afterwards, here’s what Barron’s wrote about us on 14 Jan 1980 when we made a comparable prediction:
“The Dow-Jones Industrial Average came remarkably close to fulfilling a prediction made a decade ago by James Dines, who accurately bills himself as “The Original Goldbug,” namely that someday the two would cross. Nobody believed him then, but last week the gap between the DJI and the gold quotation had never been smaller, Dines’ stature never greater. James Dines’ prediction – that the price of bullion would someday cross the Dow-Jones Industrial Average – begins to look like one of the most fantastic investment calls on record.” Barron’s
Acclimated to that, the most sensational prediction in this TDL concerns silver . The pr ice of silver is not many dollars above its price one century ago, despite oceans of paper money having been printed since then. Silver around $16 an ounce looks to us like the single most underpriced monetary asset on the planet. We predict that silver will go above the price of gold, and when that occurs it will be the time to sell both. Silver ’s catch-up to true value will probably happen during a currency upheaval and be awe-inspiring to behold.
If that means silver is going above $1,000/oz, then so be it.

Advice and Information for Traders and Investors January 4, 2017, Page 9
© 2017 James Dines & Co, Inc, PO Box 22, Belvedere, CA 94920
Prices of Raw Materials are still in uptrends, normally bullish for the economy. But how much of the projected demand represents China’s desperate buying to boost its own economy, plus Trump’s increasing American infrastructure spending? And how long might that last? Much of the “Trump Rally” was based on his construction background and vows to rebuild America’s infrastructure, as mentioned, which require natural resources. We recall a past raw materials boom when we successfully predicted China’s infrastructure needs provided the best way to invest in that country after Mao’s death, because its stock market was so underdeveloped at the time we couldn’t figure out which Chinese stocks to recommend to our loyal, long-term TDLrs.
Here we are again. If Trump could pull it off, raw materials should be at the forefront of investment opportunities. We share some of our personal raw materials charts in this TDL, so you could see for yourself, not comparably available elsewhere. We will be studying these in 2017’s upcoming TDLs for new stock recommendations. Also, see Freeport-McMoran (right), already up 366%, recommended by TDL at $5.57 on 5 Feb 16, a neat shot near rock bottom (E).
More charts of industrial metals appear on the previous page. We have repeatedly presented these for over a year in TDL, now quietly in Saucer Bottom Base Formations even while the group has been drenched in public pessimism.
Uranium: Recapitulating our latest Inter im Warning Bulletin (12 Dec 16), Trump rejects climate change, even calling it a hoax. It’s not easy trying to figure out what he’ll actually do about increased emissions from a booming and resurgent coal industry. Somewhere ahead we suspect he’ll include nuclear power in America’s energy mix to make up for coal’s increased emissions. Why? Perhaps it’s because he conspicuously (to us) has not used the words “nuclear power.” We’re not aware of any other prominent forecaster being bullish on uranium these days. Understandably so, with uranium ore’s price locked in a Downtrend. Trump tweeted on 22 Dec 16 that the US should greatly expand its nuclear capability in response to Putin’s speech, which might be perceived as a favorable starting point for a nuclear energy policy as well.
When we predicted the last bull market in uranium
TDL’S LATEST ON RAW MATERIALS. EVEN URANIUM.
Everyone else at the table got up to dance, except him and me. There I was trapped. Trapped like a trap in a trap. Dorothy Parker, After Such Pleasures
stocks we partially based it on an Upside Breakout in the price action of uranium itself, within less than one dollar from the low at $7.10/lb. This time, Alternation would indicate that uranium stocks would lead uranium metal’s price.
We’ve been monitoring uranium stocks daily for years, waiting for a resumption of their Super Major Uptrends (consisting of more than one Major). Fission Uranium, already in our Supervised List #6, jumped 41%, from C$.49 on 7 Nov 16 to C$.69 on 12 Dec 16, most of the impressive gain in only 3 trading sessions! Other uranium stocks are also edging up, an apparent Confirmation of our recent increasing focus on uranium. Even beaten-down Cameco (CCJ) has risen 46% from $7.40 to $10.77 since 1 Nov 16.
The raw-materials bear market of the last five years is over, accelerated by President-elect Trump’s pledge to “rebuild America.” Indeed, steel and coal prices have been big beneficiaries. An equal amount invested into each of the low-priced stocks in Supervised List #6 should be a very rewarding portfolio in the next couple of years, if Trump succeeds.

January 4, 2017, Page 10 Advice and Information for Traders and Investors
© 2017 James Dines & Co, Inc, PO Box 22, Belvedere, CA 94920
BIGGEST WINNERS: 2016 Comparative Annual Results At the moment, the financial news media is strongly celebrating the Trump rally as leading stock
market indices keep making new all-time highs. The jump started on 9 Nov 16, as Trump's election along with Republican control of Congress effectively changed the market’s narrative that had previously stalled for the last 2 years. Shifting our focus from currently evolving trendlines to a longer and more sobering perspective of annual results, we find surprising and unexpected highly ranked performance from shares in silver, gold and palladium, and in silver and gold bullions – particularly in 2016. See left-hand column, in bold font. Much of our bullishness on the natural resource sector was based on its deeply Oversold condition that existed at the start of 2016, and the accompanying results show sufficient profits were generated to weather the current Consolidation so far.
Broad market indices including the tech sector also figured prominently in 2016 with double-digit gains. Ranks #5, 7, 8, 9 and 10 went to the DJT, DJU, DJI, Morgan Stanley Hi Tech Index and the S&P 500 respectively. Thanks to the Federal Reserve's easy-money policy, investors were drawn to the "passive" investments we discussed in our last TDL (4 Nov 16, page 4), driving indices higher.
It is notable too that gold (#11) and the resource-heavy NYSE MKT (#13), outperformed Mutual Funds (#14), perhaps echoing the resurgence of commodities on the one hand, and the woes of major hedge funds that did not fare well on the other hand, despite late 2016’s strength in market averages.
Current Outlook: Just peeking into “Sell” territory. DIGFOI is possibly reflecting current market strength and will reach a Top within the next few months. DIGFOI contains no theoretical backward projections – all entries were calculated at the time, by your editor, personally – and is surely the market's longest-running Technical summation of its type.
Advice and Information for Traders and Investors January 4, 2017, Page 11
© 2017 James Dines & Co, Inc, PO Box 22, Belvedere, CA 94920
As previously mentioned, new subscribers should please be clear that “inflation” does not mean “higher prices.” This incorrect definition is cleverly used by sly economists to conceal what is really happening. In fact, inflation is an increase in the money supply that sometimes, but not always results in higher prices. The distinction is profound. “Real Inflation” never exists when the money supply is stable and honest, truthfully representing the postponed pleasures of savers – not yet looted by the State’s printing presses.
When there is no link between paper and anything tangible, currencies fluctuate like boats without keels, vulnerable to sudden capsizing, which menaces prosperity because currencies need to be stable as a measure of value, to replace inefficient barter. Gold is the most traditional store of wealth and a common price denominator of items to be traded. Goldbugs insist that paper money must be a valid medium of exchange, an honest store of value, an invariable unit of measure, also linked to gold and/or silver in some way.
In recent years, the financial media and economists have been publicly baffled by the mystery of why there has been so little Price Inflation despite all the currency printed. That untold trillions of dollars have been created without resulting in what governments loosely and simply call inflation has left the WEE (Washington Economic Establishment) bewildered, albeit grateful. Economists claim that there is no inflation, partially because they insist on defining inflation as higher prices. The reality is that rising Price Inflation began to roll over into a Real Deflation during the 2008 stock-market smash. We include the stock market in our definition of the money supply. Thus, the paper printed since 2008 was largely swallowed by that Real Deflation, usually by creating real downside pressure on prices – or bankruptcies – like the stock and bond crashes starting around 2008.
In fact, the amount of paper money in Real
FOR SERIOUS MARKET STUDENTS: WHEN WILL INFLATION SUDDENLY
LEAP INTO THE HEADLINES? AND GOLD?
Reality is a crutch for people who can’t cope with drugs. Lily Tomlin, Trust Me (I’m a Doctor)
Inflation has soared to stratospheric levels, and has been having a huge impact on the economy, temporarily staving off the full brunt of Price Deflation.
Normally trillions of dollars being printed and squandered worldwide cause prices to rise naturally, with more pieces of paper chasing the same amount of goods and services. Fair enough. But eventually the cyclical deflationary liquidation of all that surplus paper wipes out that unbacked paper, and that’s what a Real Deflation is – the cure of a previous Real Inflation. Again, since Real Deflations wipe out excess paper through bankruptcies, or crashes in bonds and stocks. Our predicted “The Coming Bond Crash” should be an example of excess fiat money disappearing into what we once labelled “Money Heaven.”
In fact, the very lack of higher prices despite big deficits is a key to recognizing that a deflation is present. In other words, the so-called mystery is that the currency cycle is now at a stage of liquidation of surplus paper. We believe that is partially why the whole world has been in a state of economic malaise for the last eight years; because as noted, nearly all nations followed the same Keynesian madness of economics that states running up non-stop debt and printing too much paper money was a path to infinite prosperity. This folly has been rejected by TDL since the link between gold and paper dollars was severed. Indeed, it has caused the very economic trouble that is a source of the unrest among the middle class in America that paved the way for Trump to win, and is now spreading to many other countries worldwide, by Mass Contagion. The middle class has been feeling sated while eating ersatz bread – fortified with sawdust to save wheat – but now are malnourished enough to demand jobs.
If the Federal Reserve, part of the WEE, tries to inflate the deflation away by accelerating the printing presses, it instead risks being punished by a hyperinflation, which would be even worse. We blame the Keynesian economists all America’s presidents have blindly followed for many decades.
Even less discussed anywhere these days is hyperinflation, explained in detail in our Goldbug! book. We describe a hyperinflation as the “supernova of inflations.” Hyperinflations occur when there is an acceleration of overprinting during a deflation that brings runaway higher prices for whichever reason. A hyperinflation is a collapse of a currency. Current examples these days are Venezuela and Zimbabwe, with many others at risk, including Brazil, Japan, India and possibly America. We are grateful to report we see no hyperinflation as of today, depending on what Trump actually does once he is in office after 20 Jan 2017. A year of hope, but with serious risk for mistakes.
To truly understand the above, we recommend our Goldbug! book, deemed “The Bible of the Goldbugs.”
January 4, 2017, Page 12 Advice and Information for Traders and Investors
© 2017 James Dines & Co, Inc, PO Box 22, Belvedere, CA 94920
America’s debt was way too high at 73.5% of GDP (Gross Domestic Product) in 2008, but it soared to a frightening 105.4% as of January 2016. In other words, the United States owes more than what its total production and services are worth, not really a “rich” nation.
The facts of Trump’s campaign promises sounded like more jobs and profits to American voters, leaving investors gleefully giddy. America elected Trump to “kick over the table,” so maybe this is a Republican New Deal, a restructuring of traditional politics and parties, with new constituents. Promises are not always premises. When Wall Street is swept by overenthusiasm, it’s normally time to step back and hunt for the possible hangover’s realities. The most glaring of which is, how would Trump’s proposed spending be paid for?
America’s expenditures already exceed its income, and have for long enough that America has racked up a $20-trillion debt. TDL is no longer so alone in warning about this. We easily foresaw its advent even before the link between the paper dollar and gold was actually severed, and have watched helplessly over subsequent decades while debt soared. In fact, America’s debt is so huge it is now literally unpayable, except perhaps by a catastrophic hyperinflation or default. It’s a ticking time bomb for the currency markets, a topic to which we will return. Meanwhile, please consider this hair-raising excerpt from a Congressman (below):
DEBT’S IMPACT ON GOLD
Who is all-powerful should fear everything. Pierre Corneille, Horace
“I’m most pessimistic about the national debt, and the fact that when interest rates return to normal levels, 5% interest on $20 trillion debt is a trillion dollars a year. That’s bigger than our military budget. It’s actually our entire discretionary spending combined. And we only spend $4 trillion a year, so that’s 25% off the top. Of the four trillion, three of that is for entitlements. There’s a trillion that funds the things people think about, like roads and bridges, NASA, the military. The trillion [in interest payments] will wipe out all of the things that Congress actually votes on.” Kentucky Congressman Thomas Massle (R-KY), 2 Mar 16

Advice and Information for Traders and Investors January 4, 2017, Page 13
© 2017 James Dines & Co, Inc, PO Box 22, Belvedere, CA 94920
Perhaps there’s no point in our worrying any longer about America’s debt. World trade is such that America could not possibly earn enough money exporting to other nations, particularly since they are more interested in exporting into our market. Our new president might make a meaningful change in trajectory, but we’ll need to see trendlines actually broken before altering our conclusions. We would not be surprised by Trump announcing, out of the blue, that America would only pay a percentage of its debt to bond holders, perhaps 50%, which would cause Government bond markets to plunge. However the Fourteenth Amendment to the US Constitution says, in section 4, “The validity of the public debt of the United States, authorized by law . . . shall not be questioned.” This might inhibit Trump.
Once more, let it sink in that while America’s debt is still postponable, it’s impossible to pay. If you spent one-million dollars a day, every single day, since Julius Caesar was born on 12 July 100BC, you could not spend as much as one trillion dollars. And America owes $19.9 trillion, rising around one trillion a year. It would be unrealistic to expect the American public to endure suffering comparable with conditions of the First Great Depression of the early 1930s to repay it – if only because this time so many people have guns.
Something about debt is going to break. Much of it was run up when interest rates were near zero, suppressed by the Keynesian economists in the Fed, to conceal their borrowing costs. The inevitable consequences belie what is widely called “cheap money” to borrow. When interest rates rise to historically “normal” heights, they will have the impact cited in the Congressman’s excerpt (on the previous page). It’s never too early to begin pondering on what that might mean, or your taking precautions to survive.
But, there’s more. America’s total debt (state, mortgage, auto, student) is another $40 trillion dollars, double the federal debt! It’s out-of-control, and unstoppable, but politicians have just been going with it, assuming they’d be safely dead before America’s unlimited credit card got cancelled. Since trouble will be expressed as a currency crisis, we again conclude that it is wise to buy gold and silver stocks and coins. Thus resurfaces our original prediction of gold and silver rising in what we call a “Super Major” bull market, consisting of several Major ones. The chart of gold bullion (top, right, page 6) back to 1964 shows two of them so far as part of the first and second Major waves. Again, we predict that somewhere yet ahead is the wave that should carry gold to our longstanding long-term target of at least $3,000/oz to $5,000/oz. Waiting for that wave, we pondered which gold and silver stocks should benefit most from higher prices. Which
might have the most upside potential? Please refer to our feature on silver in this issue (page 7), for specific recommendations.
Let’s return to how Trump might pay for the tax cuts and increased spending for the military and infrastructure. The biggest menace as we see it is the continued piling of more debt on to America’s already towering load. Is Trump’s plan akin to just another government stimulus injection of more paper money that might lead to Price Inflation, or even a hyperinflation? His proposed spending has been estimated to add a budget deficit of $8 trillion over the next 10 years, 40% over the current $20 trillion, measurably not much different from the recent deficits. Trump explains this away, saying it will be “deficit neutral” by blocking unfair imports, charging foreign exporters for access to American markets and enacting an “America First” business stance, with heavy tariffs, even if it leaves America a closed unit by reducing current free trade. We once more ponder whether the era of international free trade is ending, as it did during what we call “The First Great Depression.” Is Trump really planning to use access to the US market as a bargaining chip? We have many dizzying considerations, and see these parsed nowhere else yet.
January 4, 2017, Page 14 Advice and Information for Traders and Investors
© 2017 James Dines & Co, Inc, PO Box 22, Belvedere, CA 94920
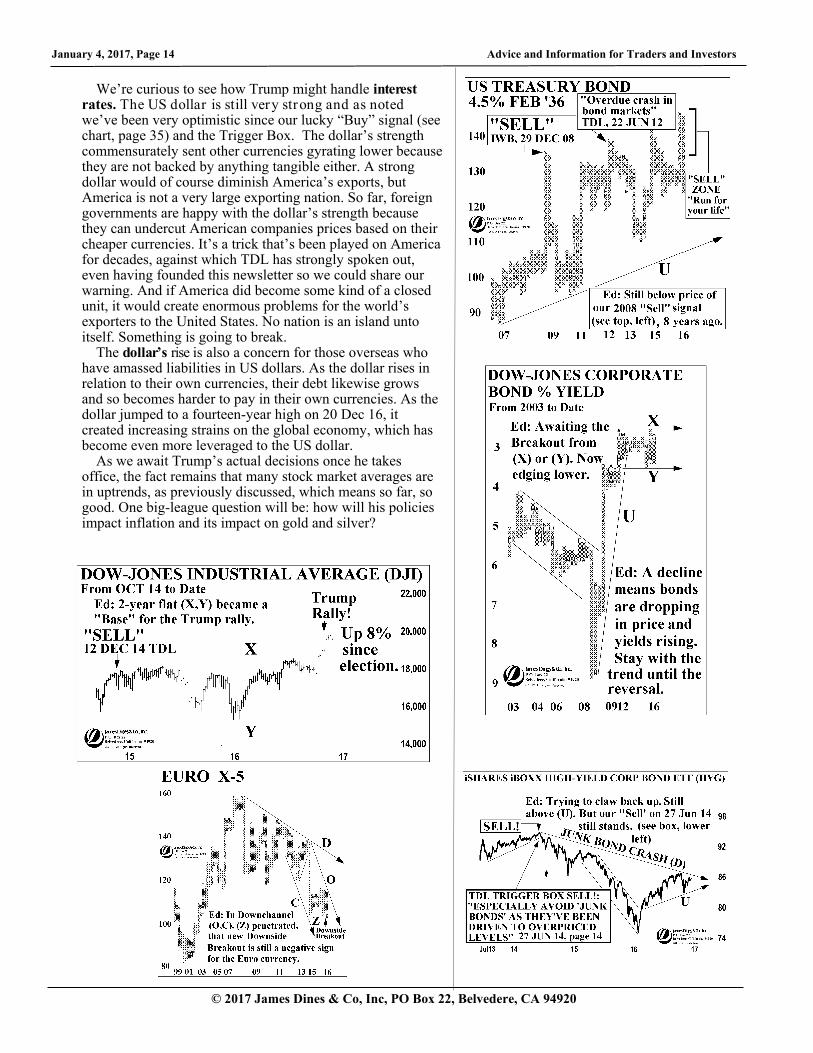
We’re curious to see how Trump might handle interest rates. The US dollar is still very strong and as noted we’ve been very optimistic since our lucky “Buy” signal (see chart, page 35) and the Trigger Box. The dollar’s strength commensurately sent other currencies gyrating lower because they are not backed by anything tangible either. A strong dollar would of course diminish America’s exports, but America is not a very large exporting nation. So far, foreign governments are happy with the dollar’s strength because they can undercut American companies prices based on their cheaper currencies. It’s a trick that’s been played on America for decades, against which TDL has strongly spoken out, even having founded this newsletter so we could share our warning. And if America did become some kind of a closed unit, it would create enormous problems for the world’s exporters to the United States. No nation is an island unto itself. Something is going to break.
The dollar’s rise is also a concern for those overseas who have amassed liabilities in US dollars. As the dollar rises in relation to their own currencies, their debt likewise grows and so becomes harder to pay in their own currencies. As the dollar jumped to a fourteen-year high on 20 Dec 16, it created increasing strains on the global economy, which has become even more leveraged to the US dollar.
As we await Trump’s actual decisions once he takes office, the fact remains that many stock market averages are in uptrends, as previously discussed, which means so far, so good. One big-league question will be: how will his policies impact inflation and its impact on gold and silver?
Advice and Information for Traders and Investors January 4, 2017, Page 15
© 2017 James Dines & Co, Inc, PO Box 22, Belvedere, CA 94920
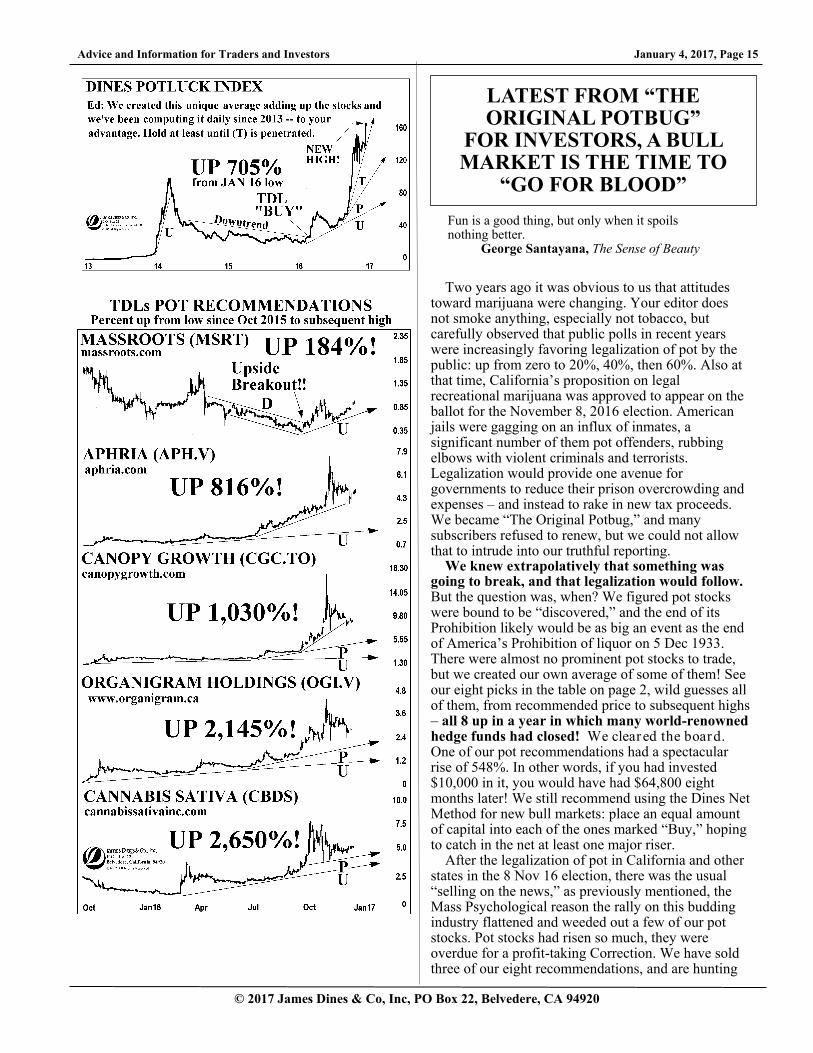
Two years ago it was obvious to us that attitudes toward marijuana were changing. Your editor does not smoke anything, especially not tobacco, but carefully observed that public polls in recent years were increasingly favoring legalization of pot by the public: up from zero to 20%, 40%, then 60%. Also at that time, California’s proposition on legal recreational marijuana was approved to appear on the ballot for the November 8, 2016 election. American jails were gagging on an influx of inmates, a significant number of them pot offenders, rubbing elbows with violent criminals and terrorists. Legalization would provide one avenue for governments to reduce their prison overcrowding and expenses – and instead to rake in new tax proceeds. We became “The Original Potbug,” and many subscribers refused to renew, but we could not allow that to intrude into our truthful reporting.
We knew extrapolatively that something was going to break, and that legalization would follow. But the question was, when? We figured pot stocks were bound to be “discovered,” and the end of its Prohibition likely would be as big an event as the end of America’s Prohibition of liquor on 5 Dec 1933. There were almost no prominent pot stocks to trade, but we created our own average of some of them! See our eight picks in the table on page 2, wild guesses all of them, from recommended price to subsequent highs – all 8 up in a year in which many world-renowned hedge funds had closed! We cleared the board. One of our pot recommendations had a spectacular rise of 548%. In other words, if you had invested $10,000 in it, you would have had $64,800 eight months later! We still recommend using the Dines Net Method for new bull markets: place an equal amount of capital into each of the ones marked “Buy,” hoping to catch in the net at least one major riser.
After the legalization of pot in California and other states in the 8 Nov 16 election, there was the usual “selling on the news,” as previously mentioned, the Mass Psychological reason the rally on this budding industry flattened and weeded out a few of our pot stocks. Pot stocks had risen so much, they were overdue for a profit-taking Correction. We have sold three of our eight recommendations, and are hunting
LATEST FROM “THE ORIGINAL POTBUG”
FOR INVESTORS, A BULL MARKET IS THE TIME TO
“GO FOR BLOOD”
Fun is a good thing, but only when it spoils nothing better. George Santayana, The Sense of Beauty
January 4, 2017, Page 16 Advice and Information for Traders and Investors
© 2017 James Dines & Co, Inc, PO Box 22, Belvedere, CA 94920
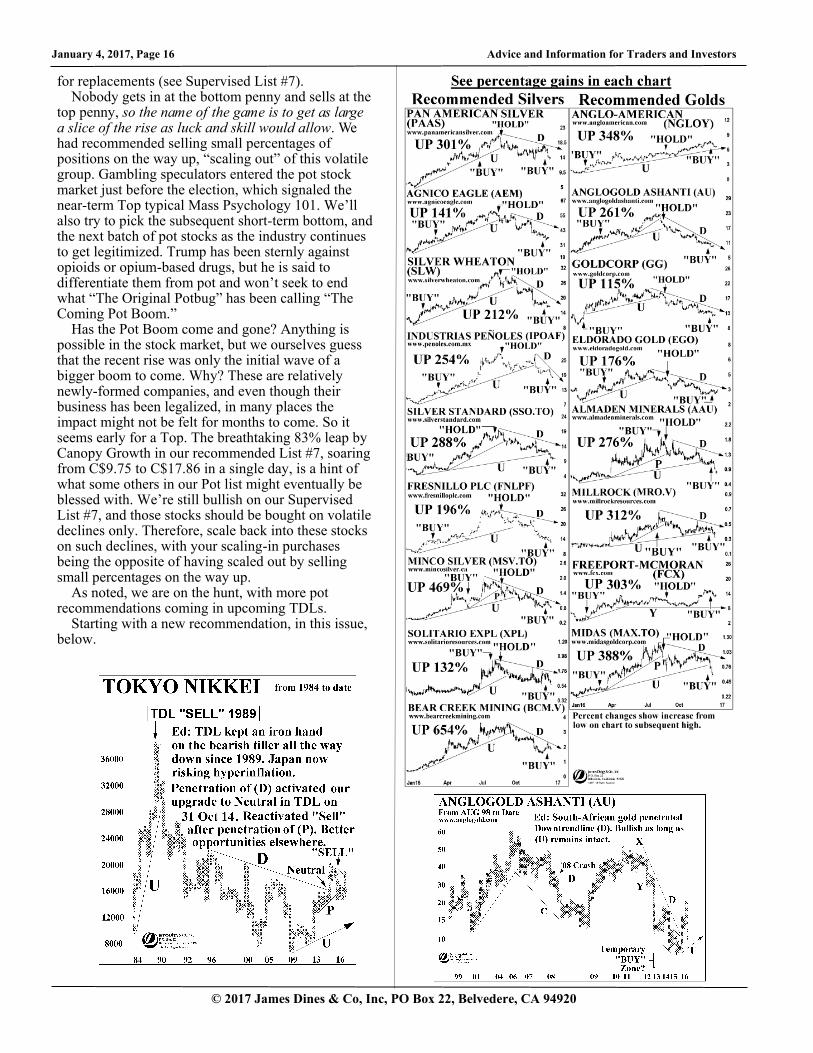
for replacements (see Supervised List #7). Nobody gets in at the bottom penny and sells at the
top penny, so the name of the game is to get as large a slice of the rise as luck and skill would allow. We had recommended selling small percentages of positions on the way up, “scaling out” of this volatile group. Gambling speculators entered the pot stock market just before the election, which signaled the near-term Top typical Mass Psychology 101. We’ll also try to pick the subsequent short-term bottom, and the next batch of pot stocks as the industry continues to get legitimized. Trump has been sternly against opioids or opium-based drugs, but he is said to differentiate them from pot and won’t seek to end what “The Original Potbug” has been calling “The Coming Pot Boom.”
Has the Pot Boom come and gone? Anything is possible in the stock market, but we ourselves guess that the recent rise was only the initial wave of a bigger boom to come. Why? These are relatively newly-formed companies, and even though their business has been legalized, in many places the impact might not be felt for months to come. So it seems early for a Top. The breathtaking 83% leap by Canopy Growth in our recommended List #7, soaring from C$9.75 to C$17.86 in a single day, is a hint of what some others in our Pot list might eventually be blessed with. We’re still bullish on our Supervised List #7, and those stocks should be bought on volatile declines only. Therefore, scale back into these stocks on such declines, with your scaling-in purchases being the opposite of having scaled out by selling small percentages on the way up.
As noted, we are on the hunt, with more pot recommendations coming in upcoming TDLs.
Starting with a new recommendation, in this issue, below.
Advice and Information for Traders and Investors January 4, 2017, Page 17
© 2017 James Dines & Co, Inc, PO Box 22, Belvedere, CA 94920
That the whole world is quivering with change unmasks it as a Mass Psychological phenomenon, and the reason for the patriotism and nationalism, which we define as rejection of elites by the masses, is covered in our “TPG” feature, page 21. In life as well as nations we have often pointed out that the injustices from the Versailles Treaty (28 Jun 1919) haunt the world order today.
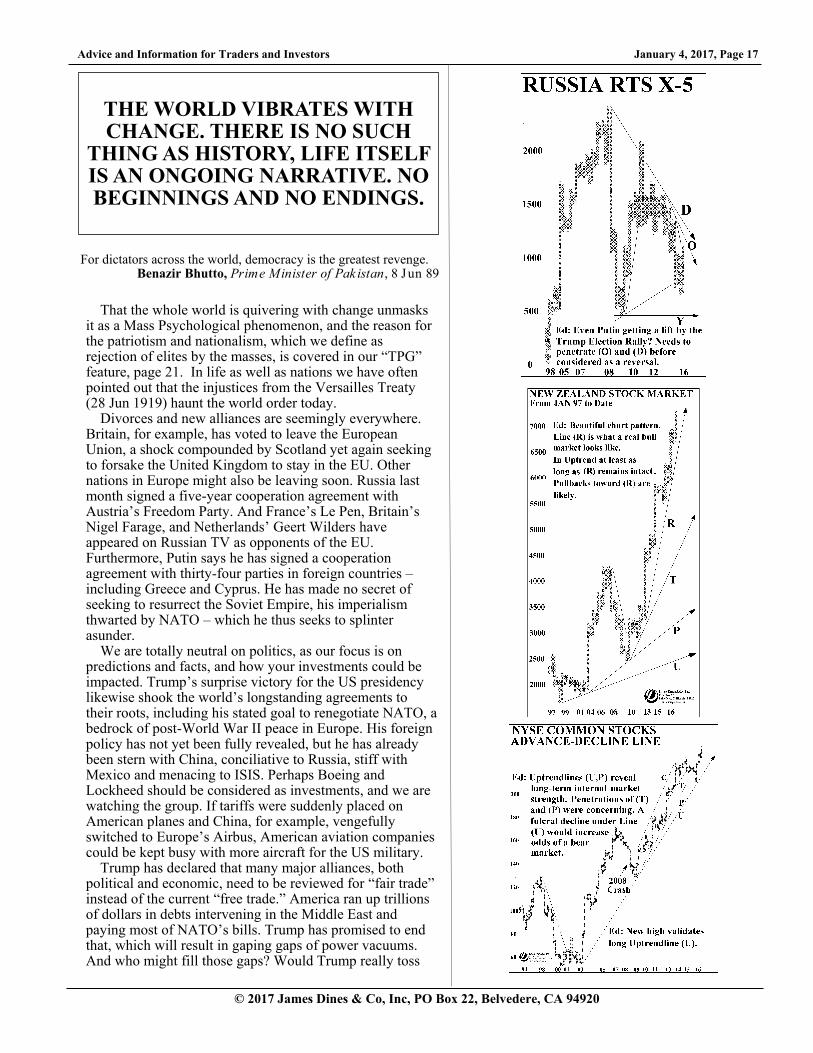
Divorces and new alliances are seemingly everywhere. Britain, for example, has voted to leave the European Union, a shock compounded by Scotland yet again seeking to forsake the United Kingdom to stay in the EU. Other nations in Europe might also be leaving soon. Russia last month signed a five-year cooperation agreement with Austria’s Freedom Party. And France’s Le Pen, Britain’s Nigel Farage, and Netherlands’ Geert Wilders have appeared on Russian TV as opponents of the EU. Furthermore, Putin says he has signed a cooperation agreement with thirty-four parties in foreign countries – including Greece and Cyprus. He has made no secret of seeking to resurrect the Soviet Empire, his imperialism thwarted by NATO – which he thus seeks to splinter asunder.
We are totally neutral on politics, as our focus is on predictions and facts, and how your investments could be impacted. Trump’s surprise victory for the US presidency likewise shook the world’s longstanding agreements to their roots, including his stated goal to renegotiate NATO, a bedrock of post-World War II peace in Europe. His foreign policy has not yet been fully revealed, but he has already been stern with China, conciliative to Russia, stiff with Mexico and menacing to ISIS. Perhaps Boeing and Lockheed should be considered as investments, and we are watching the group. If tariffs were suddenly placed on American planes and China, for example, vengefully switched to Europe’s Airbus, American aviation companies could be kept busy with more aircraft for the US military.
Trump has declared that many major alliances, both political and economic, need to be reviewed for “fair trade” instead of the current “free trade.” America ran up trillions of dollars in debts intervening in the Middle East and paying most of NATO’s bills. Trump has promised to end that, which will result in gaping gaps of power vacuums. And who might fill those gaps? Would Trump really toss
THE WORLD VIBRATES WITH CHANGE. THERE IS NO SUCH
THING AS HISTORY, LIFE ITSELF IS AN ONGOING NARRATIVE. NO BEGINNINGS AND NO ENDINGS.
For dictators across the world, democracy is the greatest revenge. Benazir Bhutto, Prime Minister of Pak istan, 8 Jun 89
January 4, 2017, Page 18 Advice and Information for Traders and Investors
© 2017 James Dines & Co, Inc, PO Box 22, Belvedere, CA 94920
dependent Europe and the Middle East out the door, or might he negotiate something else?
China looms large in our thinking. A very aggressive military hegemony, demanding control of all the South and East China Seas including historic international waters, it will surely be challenged by Trump. The only other power capable of challenging China would be Russia, its recent new ally, with the possible exception of two smaller powers in Asia, Japan and South Korea – were Trump to obtain nuclear weapons for them.
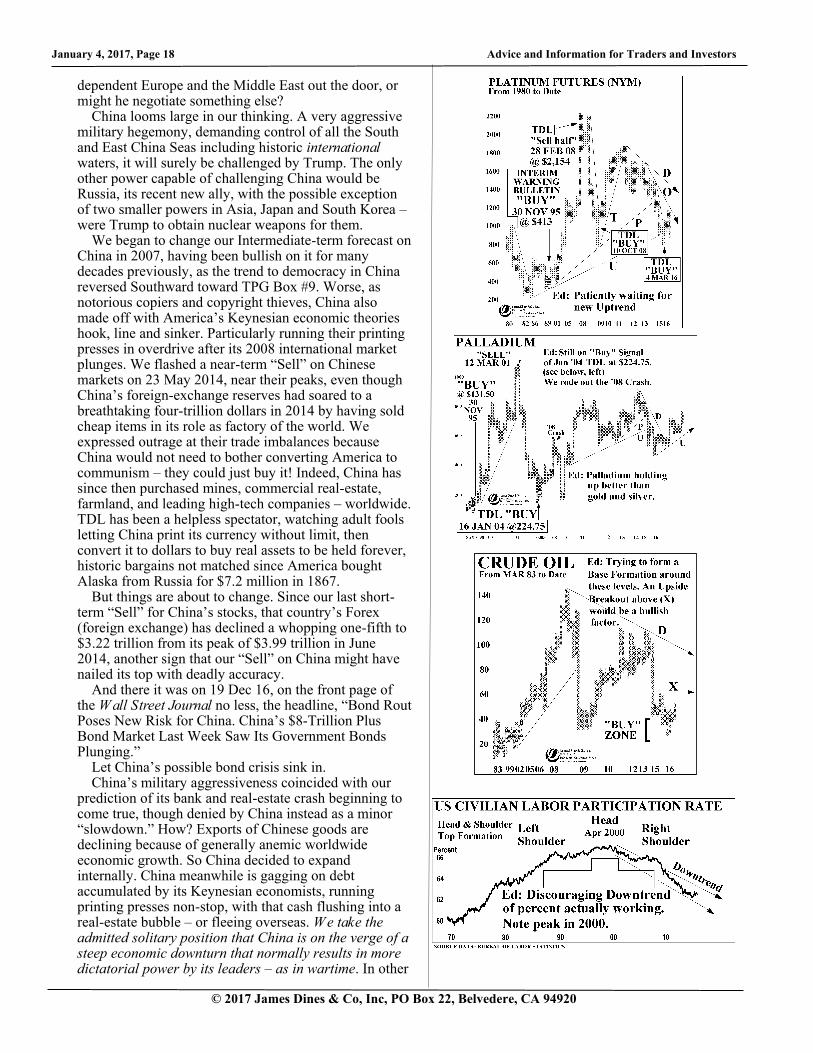
We began to change our Intermediate-term forecast on China in 2007, having been bullish on it for many decades previously, as the trend to democracy in China reversed Southward toward TPG Box #9. Worse, as notorious copiers and copyright thieves, China also made off with America’s Keynesian economic theories hook, line and sinker. Particularly running their printing presses in overdrive after its 2008 international market plunges. We flashed a near-term “Sell” on Chinese markets on 23 May 2014, near their peaks, even though China’s foreign-exchange reserves had soared to a breathtaking four-trillion dollars in 2014 by having sold cheap items in its role as factory of the world. We expressed outrage at their trade imbalances because China would not need to bother converting America to communism – they could just buy it! Indeed, China has since then purchased mines, commercial real-estate, farmland, and leading high-tech companies – worldwide. TDL has been a helpless spectator, watching adult fools letting China print its currency without limit, then convert it to dollars to buy real assets to be held forever, historic bargains not matched since America bought Alaska from Russia for $7.2 million in 1867.
But things are about to change. Since our last short-term “Sell” for China’s stocks, that country’s Forex (foreign exchange) has declined a whopping one-fifth to $3.22 trillion from its peak of $3.99 trillion in June 2014, another sign that our “Sell” on China might have nailed its top with deadly accuracy.
And there it was on 19 Dec 16, on the front page of the Wall Street Journal no less, the headline, “Bond Rout Poses New Risk for China. China’s $8-Trillion Plus Bond Market Last Week Saw Its Government Bonds Plunging.”
Let China’s possible bond crisis sink in. China’s military aggressiveness coincided with our
prediction of its bank and real-estate crash beginning to come true, though denied by China instead as a minor “slowdown.” How? Exports of Chinese goods are declining because of generally anemic worldwide economic growth. So China decided to expand internally. China meanwhile is gagging on debt accumulated by its Keynesian economists, running printing presses non-stop, with that cash flushing into a real-estate bubble – or fleeing overseas. We take the admitted solitary position that China is on the verge of a steep economic downturn that normally results in more dictatorial power by its leaders – as in wartime. In other
Advice and Information for Traders and Investors January 4, 2017, Page 19
© 2017 James Dines & Co, Inc, PO Box 22, Belvedere, CA 94920
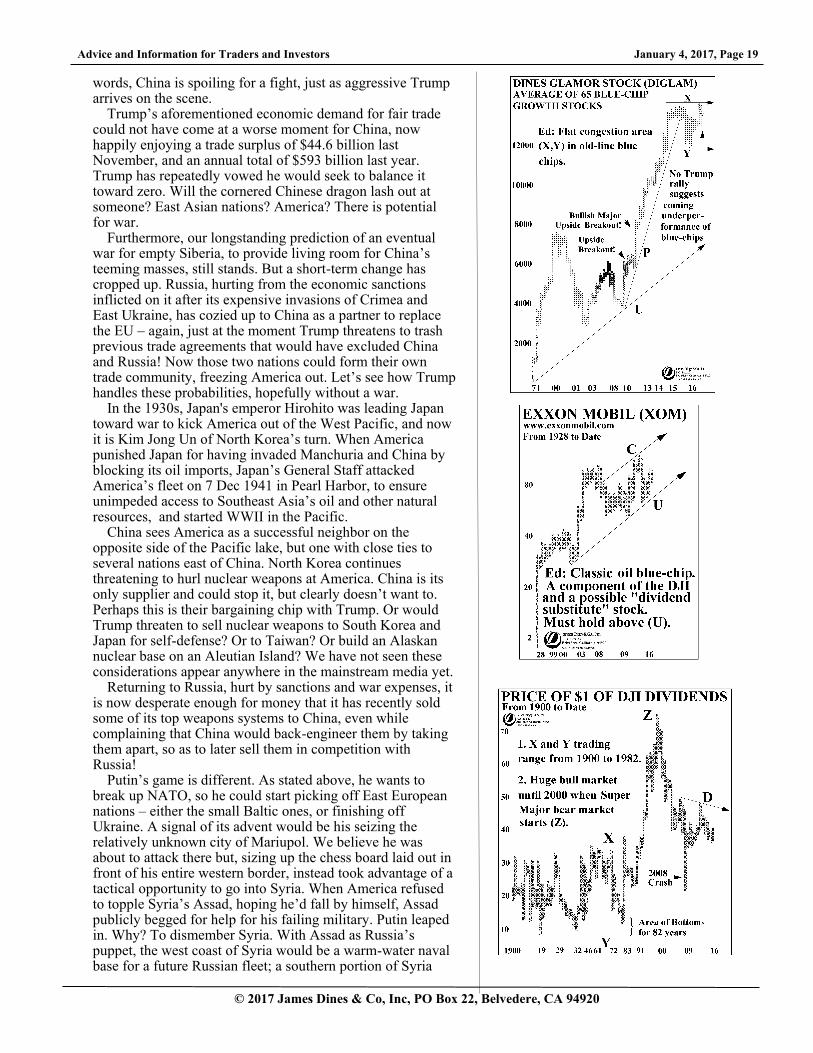
words, China is spoiling for a fight, just as aggressive Trump arrives on the scene.
Trump’s aforementioned economic demand for fair trade could not have come at a worse moment for China, now happily enjoying a trade surplus of $44.6 billion last November, and an annual total of $593 billion last year. Trump has repeatedly vowed he would seek to balance it toward zero. Will the cornered Chinese dragon lash out at someone? East Asian nations? America? There is potential for war.
Furthermore, our longstanding prediction of an eventual war for empty Siberia, to provide living room for China’s teeming masses, still stands. But a short-term change has cropped up. Russia, hurting from the economic sanctions inflicted on it after its expensive invasions of Crimea and East Ukraine, has cozied up to China as a partner to replace the EU – again, just at the moment Trump threatens to trash previous trade agreements that would have excluded China and Russia! Now those two nations could form their own trade community, freezing America out. Let’s see how Trump handles these probabilities, hopefully without a war.
In the 1930s, Japan's emperor Hirohito was leading Japan toward war to kick America out of the West Pacific, and now it is Kim Jong Un of North Korea’s turn. When America punished Japan for having invaded Manchuria and China by blocking its oil imports, Japan’s General Staff attacked America’s fleet on 7 Dec 1941 in Pearl Harbor, to ensure unimpeded access to Southeast Asia’s oil and other natural resources, and started WWII in the Pacific.
China sees America as a successful neighbor on the opposite side of the Pacific lake, but one with close ties to several nations east of China. North Korea continues threatening to hurl nuclear weapons at America. China is its only supplier and could stop it, but clearly doesn’t want to. Perhaps this is their bargaining chip with Trump. Or would Trump threaten to sell nuclear weapons to South Korea and Japan for self-defense? Or to Taiwan? Or build an Alaskan nuclear base on an Aleutian Island? We have not seen these considerations appear anywhere in the mainstream media yet.
Returning to Russia, hurt by sanctions and war expenses, it is now desperate enough for money that it has recently sold some of its top weapons systems to China, even while complaining that China would back-engineer them by taking them apart, so as to later sell them in competition with Russia!
Putin’s game is different. As stated above, he wants to break up NATO, so he could start picking off East European nations – either the small Baltic ones, or finishing off Ukraine. A signal of its advent would be his seizing the relatively unknown city of Mariupol. We believe he was about to attack there but, sizing up the chess board laid out in front of his entire western border, instead took advantage of a tactical opportunity to go into Syria. When America refused to topple Syria’s Assad, hoping he’d fall by himself, Assad publicly begged for help for his failing military. Putin leaped in. Why? To dismember Syria. With Assad as Russia’s puppet, the west coast of Syria would be a warm-water naval base for a future Russian fleet; a southern portion of Syria
January 4, 2017, Page 20 Advice and Information for Traders and Investors
© 2017 James Dines & Co, Inc, PO Box 22, Belvedere, CA 94920
would be allied with Iran to encircle its mortal enemy Saudi Arabia; a northern part of Syria to Turkey and/or the Kurds; and nothing for America or Europe except floods of refugees that would push ex-NATO members falling into Putin’s lap. Putin had to hurry before Trump took office, plus he needed to crush Assad’s opponents quickly so as to cut Russia’s expenses. Thus, Putin employed Russian brutality that led to horrors in Aleppo using outlawed poison gas and barrel bombs on civilians, butchery of the type seen in Chechnya after its uprising – just kill everybody and then deny accusations of war crimes. National Low States bring “surprising bad luck.”
Russia will pay the price for getting into a multi-century civil war on the Shias’ side, disregarding the large Sunni majority in Russia. We again predict that bombs will soon be going off in Russia, as first predicted in the TDL of 7 Jul 2000, believe the unbelievable or not. For more see our Nostradinesus feature, page 24. Sadly, Russia’s Islamic nightmares have only just begun, and will last for centuries to come. We’ll get back to Russia and India in future TDLs. TDL is “The Original India Bug.”
Bottom line: the risk of war in 2017 is rising, gold and silver would be the traditional beneficiaries, and we could see a serious upmove in those two metals in 2017.
Is there any good news? Yes. As noted, TPG (see feature on page 21) projects a period of peace and prosperity, although its precise timing is uncertain.
1. We have long been bravely predicting physical immortality, and even now few believe it. Actually, we had been pondering it for many years, before our first announcement. We first reported our conclusion on 7 Nov 1981, as the keynote speaker at the James Blanchard conference in New Orleans, at that time we spoke out about immortality cautiously because it was such a scorned position. We predicted that the secret of aging would be discovered “within twenty-five years,” and indeed 90% of the human genome had been mapped by 2001. Since aging must be somewhere in that genome, and it is of finite length, we figured that human ingenuity would locate our time clock and change it. And the disease progeria should disclose its location. Also some viruses are immortal, so they already have cracked their own genetic secret.
Indeed, there have been a storm of discoveries relating to aging since our last update, and heavy-duty computerized analysis begun by numerous institutions.
One breakthrough is CRISPR, which stands for “clustered regularly interspaced short palindromic repeats.” Using this gene-altering tool, that promises to cure to everything from blindness to cancer, scientists can now manipulate the genes of any living creature with unprecedented ease. It can even be used to destroy an entire species, and we personally believe it should be done for any mosquito that carries human-killing diseases. (For a more detailed discussion of CRISPR, please see TDL of 5 Aug 16, page 11.)
The excerpts in this issue (pages 21 and 33) share some of the discoveries that should encourage everyone reading this to take better care of themselves, because we all might last far longer than we suspect. We hereby predict that somebody reading this newsletter will be immortal, believe the unbelievable or not!
Finally, we suggest reading the book The Immortality Edge by Michael Fossel, MD, Greta Blackburn, and Dave Woynarowski, MD, published by Wiley.
TDL’S LATEST ON HEALTH: “THE COMING PHYSICAL
IMMORTALITY”
Every time a human dies, a library burns. Anders Sandberg
(Legal Disclaimer: Since we are not doctors, never follow anything based on the Health Features in TDL, without first consulting with your doctor or other trusted health professional.)
Advice and Information for Traders and Investors January 4, 2017, Page 21
© 2017 James Dines & Co, Inc, PO Box 22, Belvedere, CA 94920
At the Salk Institute in California, the first attempt to reverse aging by reprogramming the genome has rejuvenated the organs of mice and lengthened their life spans by 30%. The issue of the journal Cell is “novel and exciting,” said Jan Vijg, an expert of aging at the Albert Einstein College of Medicine in New York. The finding is based on an animal’s biological clock being able to be wound back to a more youthful state. Ten years ago, the Japanese biologist Shinya Yamanaka amazed researchers by identifying four critical genes that reset the clock of the fertilized egg. The four genes are so powerful that they will reprogram even the genome of skin or intestinal cells back to the embryonic state. The clock of the aging process is created by the epigenome, the system of proteins that clads the cell’s DNA and controls which genes are active and which are suppressed. Only in the last few years have biologists come to realize that the state of the epigenome may be a major cause of aging. Nicholas Wade, New Y ork Times, 16 Dec 16 Ed: Science is closing in on “The Coming Secrets of Aging,” the goal being Physical Immortality, believe the unbelievable or not.
2. More wonderful news! We first reported on Ebola on 28 Aug 1998, followed by in-depth coverage beginning with the TDL of 28 Mar 14, with periodic updates since that time. When the world’s international health organizations did not take Ebola seriously, because they said it merely killed briefly and then disappeared, TDL was infuriated. It had not disappeared – it was so deadly it killed everybody in an African village and of course seemingly disappeared. TDL spoke out forcefully about Ebola’s danger, to no avail.
At the onset of the last Ebola outbreak, on 28 Mar 14 (page 10), months before its peak, TDL broke the news of a new epidemic in the latest episode of “The Coming Germ Wars.” We warned TDLrs to avoid travel to any affected areas. After many deaths, proper disease control tamed it.
Finally, last month, the medical establishment developed a vaccine (rVSV-ZEBOV) that, in fact, has been declared 100% effective on one strain of the virus! We ourselves, would get that vaccination if traveling anywhere in Africa, or any area with that past history. Because this mutating pathogen will be back.
(For more on health, please turn to page 33 for our carefully selected, and important excerpts.)
Libraries worldwide are loaded with books on psychology, but they’re all about individuals. Oddly, we are aware of only three books ever written on Mass Psychology, one of them admittedly dared to have been written by your editor. The dearth of information on this topic is odd because we all obviously react to each other in crowds, swept up as if by an invisible force in a mob, or in strong stock-market movements of the moment. Indeed, one is going on today, as the worldwide Mass has produced a rising number of powerful nationalist leaders that sent many stock markets skyward.
It’s no coincidence that this is happening across the world at the same time. Turkey for example is becoming a police state, power expanded on the pretext of state security by Erdogan seeking revenge for a failed coup against him. The Philippines’ leader openly admitted on television to having personally fatally shot drug dealers. China is slipping back to Mao Tse Tung’s tight communist controls. Russia’s Putin, as noted, dreams of resurrecting Soviet imperialism. Egypt. Syria. Venezuela’s socialism is sinking into a King Lear madness. A phenomenon spreading with the ease of ink dropped into a glass of water. Last but not least is North Korea; we often refer to George Orwell’s book 1984, whose futurology is proving to have been the work of a visionary genius.
Mass Psychology ripples through the work we will leave behind, which could be interpreted as our utter rejection of Keynesian economics, that features irresponsible excess debt and deficits. Sometimes we ponder whether Keynesian economics is the cause or effect of Mass Psychology. The chicken and the egg conundrum.
The worldwide acceptance of Keynesian economics by governments, hatched during the agony of what we call the “First” Great Depression, perhaps echoes to what we call “The Second Great Depression” – palliatively described these days as “The Great Recession of 2008.” We see the refusal to use the “depression” word as denial, therefore concealing a truth.
We have struggled for decades to decipher the secrets of Mass Psychology’s impact on the stock market, and we share with you our latest update to TPG (TDL’S Political Gamut) on page 22. We often include TPG in our predicting, a type of Rosetta Stone you yourself could use in the future.
TDL’S LATEST ON TPG (THE POLITICAL GAMUT)
What Does Brand-New Northward Trend Mean?
If there had been any formidable body of cannibals in the country he would have promised to provide them with free missionaries, fattened at taxpayers’ expense. H L Mencken
January 4, 2017, Page 22 Advice and Information for Traders and Investors
© 2017 James Dines & Co, Inc, PO Box 22, Belvedere, CA 94920
Advice and Information for Traders and Investors January 4, 2017, Page 23
© 2017 James Dines & Co, Inc, PO Box 22, Belvedere, CA 94920
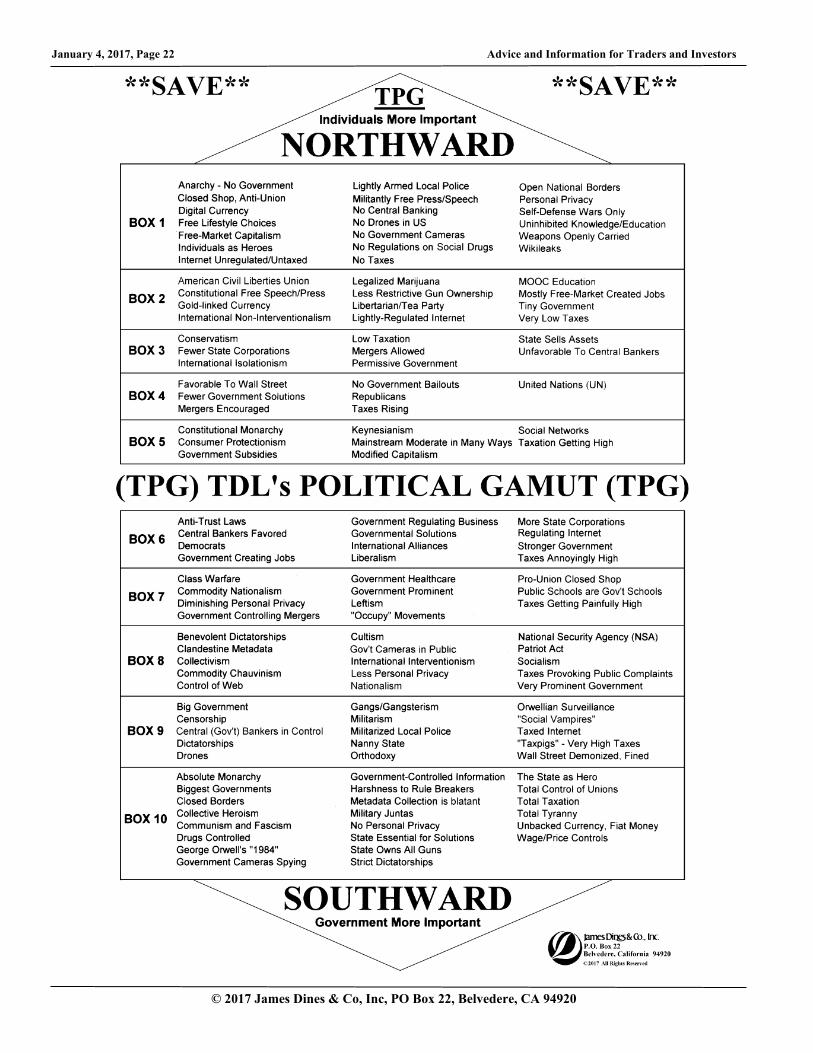
The accompanying graphic is quite simple: the box on top is very little government, descending in stages to total government in the bottom box. That’s it.
There is nothing to agree or disagree with, as the chart is as neutral as an alphabet, a measuring stick, or a vertical piano keyboard. Everybody could find the box somewhere on TPG with which they most. Please find the box that is closest to your views.
Fascinatingly, the Gamut is one of our key predicting tools, first shared with the world in detail in our Mass Psychology book (page 111). Let us demonstrate how TPG might be useful to you now. It can be used as a gauge for where America’s politics currently sits, near the top or bottom of TPG. The key insight: At either antipode one could anticipate directional change in the Mass Mind beginning to express itself. In other words, a r ise toward 1-3 or a decline toward 8-10, should result in a surprise turn!
COULD TPG PREDICT PROSPERITY
AND WARS? Could TPG help us predict war, or prosperity?
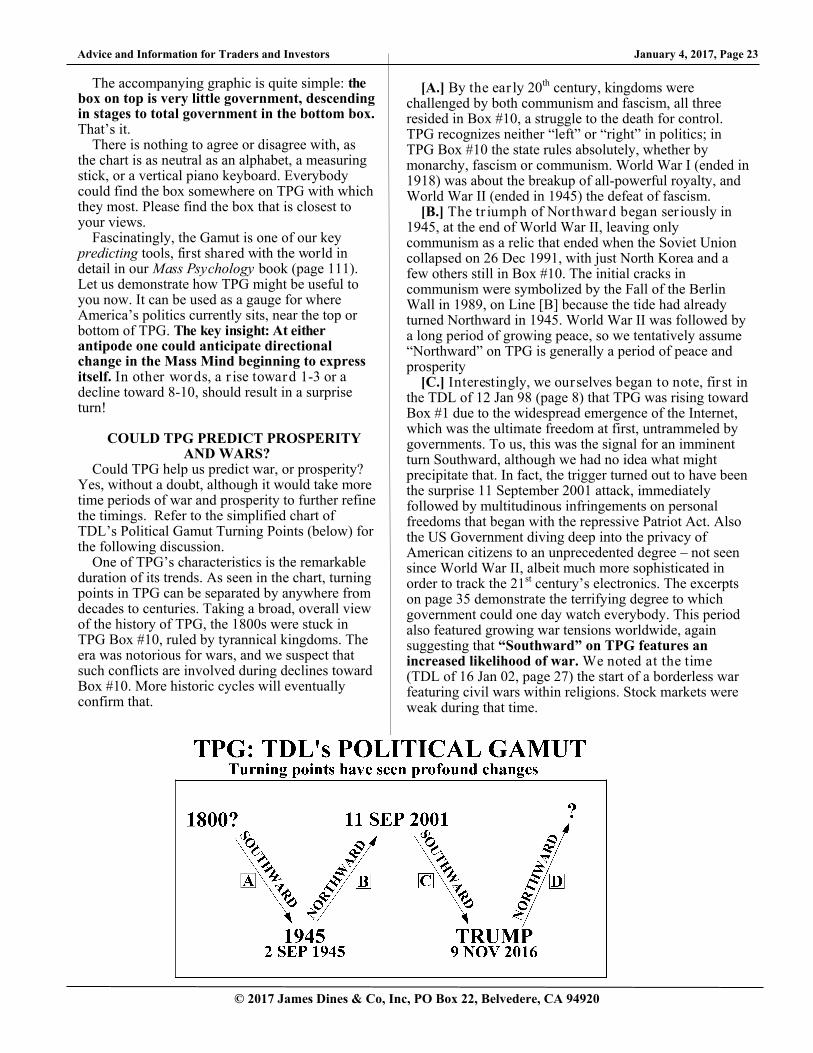
Yes, without a doubt, although it would take more time periods of war and prosperity to further refine the timings. Refer to the simplified chart of TDL’s Political Gamut Turning Points (below) for the following discussion.
One of TPG’s characteristics is the remarkable duration of its trends. As seen in the chart, turning points in TPG can be separated by anywhere from decades to centuries. Taking a broad, overall view of the history of TPG, the 1800s were stuck in TPG Box #10, ruled by tyrannical kingdoms. The era was notorious for wars, and we suspect that such conflicts are involved during declines toward Box #10. More historic cycles will eventually confirm that.
[A.] By the ear ly 20th century, kingdoms were challenged by both communism and fascism, all three resided in Box #10, a struggle to the death for control. TPG recognizes neither “left” or “right” in politics; in TPG Box #10 the state rules absolutely, whether by monarchy, fascism or communism. World War I (ended in 1918) was about the breakup of all-powerful royalty, and World War II (ended in 1945) the defeat of fascism.
[B.] The tr iumph of Nor thward began ser iously in 1945, at the end of World War II, leaving only communism as a relic that ended when the Soviet Union collapsed on 26 Dec 1991, with just North Korea and a few others still in Box #10. The initial cracks in communism were symbolized by the Fall of the Berlin Wall in 1989, on Line [B] because the tide had already turned Northward in 1945. World War II was followed by a long period of growing peace, so we tentatively assume “Northward” on TPG is generally a period of peace and prosperity
[C.] Interestingly, we ourselves began to note, fir st in the TDL of 12 Jan 98 (page 8) that TPG was rising toward Box #1 due to the widespread emergence of the Internet, which was the ultimate freedom at first, untrammeled by governments. To us, this was the signal for an imminent turn Southward, although we had no idea what might precipitate that. In fact, the trigger turned out to have been the surprise 11 September 2001 attack, immediately followed by multitudinous infringements on personal freedoms that began with the repressive Patriot Act. Also the US Government diving deep into the privacy of American citizens to an unprecedented degree – not seen since World War II, albeit much more sophisticated in order to track the 21st century’s electronics. The excerpts on page 35 demonstrate the terrifying degree to which government could one day watch everybody. This period also featured growing war tensions worldwide, again suggesting that “Southward” on TPG features an increased likelihood of war. We noted at the time (TDL of 16 Jan 02, page 27) the start of a borderless war featuring civil wars within religions. Stock markets were weak during that time.
January 4, 2017, Page 24 Advice and Information for Traders and Investors
© 2017 James Dines & Co, Inc, PO Box 22, Belvedere, CA 94920
[D.] We repeatedly looked for the onset of a reversal to Northward because society was way heavily Southward, where reversals tend to occur.* Understanding Mass Psychology correctly, we took note of a remarkably popular socialist presidential candidate, Bernie Sanders, in TPG Box #8. TPG indicated to us that change was very near. As we study more turns on TPG, we hope one day to understand it well enough to also anticipate the actual reversal triggers.
Still, we pondered, would the world continue to shift further Southward toward war under Trump - and even stronger leaders emerging in other countries? It might seem that way to many, but if our TPG theory is correct this time we are somehow headed for peace and prosperity, as improbable as it might seem, what with nations worldwide in an arms race that usually precedes wars.
Personally, we believe a new rising trend [D] began with the election of President Donald Trump. Despite his reputation as a strong leader, TPG suggests in a strictly neutral TDL that he would somehow end up as flexible, free-market pro-capitalist, which could shock many. The turn on TPG is why his election caught the world largely off guard. While we don’t know how Northward his other policies get, and how long [D] will last, we hope we will all be able to predict the next reversal as TPG rises toward the top of the chart on page 22.
NEW DISCOVERY!
Something we have recently discerned: Mass Psychology can also corral other nations worldwide in a new trend because all national Masses are from the same source. Being human! We had long suspected that TPG itself would be amenable to international corroboration, by DIWPAT.**
We noticed how so many strong and populist (mass rejection of ruling elites, as noted) governments are emerging in the world these days, although others are still heading Southward - TPG’s prediction is that they will likewise rise Northward soon, following America, believe the unbelievable or not! If that prediction works, it would reaffirm not only that TPG works, but it might be the first tool ever discovered to actually map Mass Psychology!
Finally, is there a way to forecast stock market movements using TPG? We have long been very intrigued by this Long-Wave Theory, and one result of our research so far is that TPG could be used as a guide to predict the amount of control the rulers would exert over the various parts of their country, including the economy. Depending on the breadth of such, we could ascertain whether
companies might benefit from such policies as subsidies, tax breaks, and export controls affecting their profitability and competitiveness in domestic and international markets. Historically, Northward means governments interfere less with the operations of companies. We tentatively interpret that as grounds for stock market optimism in the coming period!
Trump is a builder by profession and, as noted, promises massive new construction in America, already possibly confirmed by uptrends in industrial metals. Dare we therefore hope that a huge new upleg in the stock market lies somewhere ahead, a ray of optimism? All will be revealed by the whispers of time. Net, net. TDLrs are advised to keep an open mind and remain hopeful*** for a period of peace and prosperity.
* 9 Jan 14 (page 17), 27 Jun 14 (pages 5, 8 & 13), 29 Aug 14 (page 8), 4 Jan 16 (page 31), 5 Feb 16 (page 6) and 4 Mar 16 (page 9). ** (Dinesism #10, The Dines Wolfpack Theory). When a few stocks of an economically related group move in a certain direction, the rest of the group will tend to follow that direction as “Confirmation.” *** TDL’s serious students of “High States” would recognize
this as DIHOPE rather than DIFOPE.
A. TERRORISM WILL HAUNT RUSSIA Summary: TDL Predicts “Moscow will bleed”
resulting from its past aggression against Chechnya, on Crimean Tatars, and now Islamists fighting Syria’s Assad.
After Russia’s failed incursion in Afghanistan, Russia reignited its conflict with Muslim fundamentalists in Chechnya. In its invasion of Crimea, Russia sent Crimean Tatars, a Turkic ethnic tribe, back into exile. In 2015 Russia joined Assad and the Shiite Iranians against Syrian rebels and Islamists (mostly Sunnis), embroiling itself in a new religious war, with deadly consequences – as predicted earlier.
Here are TDL's Predictions: 1) (The Dines Letter, 7 Jul 00, Page 10): An
Islamic uprising throughout Russia’s southern tier could threaten a centrifugalistic disintegration of Russia – losing a wide swath of territory to Iran or Turkey. Islamic fundamentalists have already added Russia to their list of enemies, along with the US, India, and Israel, so the outlines of the coming battles begin to emerge.
NOSTRADINESUS
To you, Baldrick, the Renaissance was just something that happened to other people, wasn’t it? Richard Curtis, Blackadder II (TV Ser ies)
Advice and Information for Traders and Investors January 4, 2017, Page 25
© 2017 James Dines & Co, Inc, PO Box 22, Belvedere, CA 94920
2) (The Dines Letter, 28 Mar 14, Page 3): The Tatars returned to Crimea after the Soviet Union imploded. It dawns on us that the media is not focusing on revenge-seeking Muslim states all across Russia’s southern border, from Turkey all the way to Tajikistan.
3) (The Dines Letter, 9 Oct 15, Page 8): Russia
is a nation whose national pastime is chess, and Putin has apparently decided to shift the attack to the south. His imperialism frustrated at Russia’s west by NATO, he moved his knight on the chessboard skipping over Turkey and plopped it into the seething cauldron of Syria. Putin could not care less if his current bombing in Syria drives the Sunnis out in favor of the Shias. But Putin’s plot has at least one strategic weakness. Jihadis worldwide have had bad blood with Russia since it invaded Afghanistan in 1979 – a disaster that created bin Laden himself. We have long-predicted the Muslim southern border of Russia, its "soft underbelly" (as Churchill described the invasion of Italy during World War II), is in danger of rising up, especially Dagestan in the Caucusus. Putin should grasp that his actions might trigger a jihadi uprising along the Stans.
4) (The Dines Letter, 6 Nov 15, Page 8): Of
great importance is the emergence of America as backers of the Sunnis, and Russia of the Shias, the two main externals in Islam’s civil war. Thus, Islam’s war has the added complexity of a proxy war between America and Russia. We suspect that the Russo-Shia alliance will eventually outrage Russia’s own Sunni Muslim population, igniting terrorism. Last month al Qaeda in Syria called on its followers for revenge by attacking Russia for having rescued Assad. The leader of the Al-Nusra Front even called for terror attacks to be launched from Russia’s North Caucasus. Moscow will bleed. This will spread the inferno metastasizing toward southern Russia, and it will go on from there.
5) (Interim Warning Bulletin, 10 Dec 15): An
angry Turkey was also upset that Russians had bombed its allied Turkmen battling Assad instead of ISIS.
6) (The Dines Letter, 4 Jan 16, Page 12): Russia
wants to dismember Syria, maintaining Assad as a puppet. Putin’s bombings have focused on Assad’s enemies instead of ISIS. As clever as Putin’s thrust into Syria might appear, we believe it incorporates a fatal flaw in that most of the Muslims in Russia are Sunnis, and he is blatantly taking sides with the Shiites in Iran, a blunder comparable with America having sided with Sunnis in the previous century.
This creates a greater risk of terrorism emerging from Putin’s North Caucasus region. Worse, Putin truly fears all the thousands of jihadis that have gone to fight and train with ISIS, who will soon return to wreak havoc in Russia.
7) (The Dines Letter, 2 Sep 16, Page 7): Putin’s new
axis includes both Shiites and Sunnis under the same umbrella. If we have been right that World War III would be dominated by a civil war within Islam, between Shiites and Sunnis – not even considering the fringe terrorist groups – the Axis should begin to suffer from an internal explosion based on the conflicts within that group possibly detonating a regional war. Terrorism will soon visit Russia.
Early Results 1) (Washington Post, 19 Dec 16): A Turkish police
officer who angrily denounced the bloodshed in Syria killed the Russian ambassador to Turkey in Ankara on Monday, shooting the diplomat in front of a room full of horrified spectators at an art gallery in an assassination captured on video and quickly shared around the world. As the ambassador, Andrei Karlov, lay on the floor, the assailant, 22-year-old Mevlut Mert Altintas, still waving his gun, screamed, “Don’t forget Aleppo! Don’t forget Syria!” The shooting was among the most brazen retaliatory attacks yet on Russia since Moscow entered the war in Syria on the side of President Bashar al-Assad, and unleashed a bombardment on Aleppo that has drawn international condemnation for what observers on the ground have called indiscriminate attacks on civilians. Some in Moscow suggested that the West was to blame for its support of moderate rebel factions in Syria.
B. TDL PREDICTS
“THE COMING PENSION FUND CRISIS” Summary: As the Federal Reserve stepped up its
quantitative easing and interest rate suppression, TDL declared “The Coming Pension Fund Crisis” in 10 Jan 2011 and has consistently warned of its worsening implications.
TDL Predictions 1) (The Dines Letter, Annual Forecast Issue, 10 Jan 11,
Page 24): America’s pension funds could be the next crisis. One Alabama city ran out of money in its pension fund in 2009 and stopped sending checks to its retired workers; it has tried to file for bankruptcy but the state won’t allow it, even though some residents are without electricity and running water. Maybe some of the money America is spending overseas should help Americans first,

January 4, 2017, Page 26 Advice and Information for Traders and Investors
© 2017 James Dines & Co, Inc, PO Box 22, Belvedere, CA 94920
as charity begins at home. Other states are in trouble, for example Michigan, Illinois and Pennsylvania, and what will happen when their payments to retirees stop? More borrowing from the Federal government? The Government bond market is another nightmare, and we have repeatedly steered TDLrs away from it. It is important to pay off and redeem debts with variable interest rates first; actually we prefer you get out of all debts. One of the unfortunate predictions in this TDL is "The Coming Wave of Bankruptcies in Muni Bonds." Illinois’ spending is double its income. The bottom line is that American states are bankrupt.
2) (The Dines Letter, 11 Nov 11, Page 4):
Investors are desperate for income precisely because of governments holding interest rates artificially lower so that they themselves could borrow cheaply and cheat income seekers of normal interest payments. By having distorted the free marketplace, it’s not just individuals who are having trouble earning money on their bank accounts or bonds, but insurance companies and banks that manage pension funds and other actuarial institutions that make assumptions based on long-term average interest rates who are making almost no money on their capital. TDL has been bitterly against what is being done because it is not free-enterprise capitalism, which will nevertheless be blamed for the consequences. That will not emerge into the public debate until pension funds become increasingly unable to pay benefits and wretched recipients finally demand to know, "What happened?"
3) (The Dines Letter, 19 Oct 12, Page 8): We
focus on the pension funds starved by the low interest rates on their capital, engineered by the Fed, and the average 8% they need to properly fund what they pay out to pensioners: not in the mass media yet, we predict that you will soon be hearing about "The Coming Pension Fund Crisis," as those on pensions witness diminishing payments. Even those without a pension and living on income from their own capital might now have to use that capital to live on, rather than the interest. And what if they last longer than their capital?
Results 1) (CNBC, 7 Oct 16): People, mostly union and
retired city workers, protest in front of the U.S. Courthouse where Detroit's bankruptcy eligibility trial began in Detroit, Michigan. Weak investment performance and insufficient contributions will cause total unfunded liabilities for U.S. state public pensions to balloon by 40 percent to $1.75 trillion through fiscal 2017, Moody's Investors Service said
in a report. The report comes amid increasing concern over America's ability to pay promised retirement benefits to public employees without draining state budgets. It has been a tough year for the funds, which earned a median 0.52 percent on investments in fiscal 2016 versus their average assumed return rate of 7.5 percent, Moody's said.
2) (The Dallas Morning News, 13 Dec 16): For
years, DROP (Deferred Retirement Option Plan) guaranteed at least 8 percent interest on the money. That hurt the entire (Dallas Police and Fire Pension) fund when the investment returns couldn’t keep up. The problem was made worse when the pension’s current administration revealed that their predecessors had significantly overvalued risky real estate investments.
Advice and Information for Traders and Investors January 4, 2017, Page 27
© 2017 James Dines & Co, Inc, PO Box 22, Belvedere, CA 94920
markets is by considering the phenomenal rise of the 2002 bull market (94%) and the subsequent plunge of 54% from October 2007. To put the numbers in perspective, the average bull market rise from 1960 to 2002 has been lower, at 74%, and their subsequent bear market declines even smaller, at 26%.
The missed bull market cycles could probably be likened to more pressure accumulating along fault lines with the passage of time before one large earthquake, rather than multiple smaller tremors, decreasing the same amount of pressure.
Staying with the start of the supposed lost cycle in 2010, this Seasonality suggests another bull market should have already started in 2014 and that we are now three years into it. Continuing with the cycle, the next bull market will be sometime in 2018, which implies that there will have to be a bear market first. Again there should be no surprise if the magnitude of the next decline surpasses the previous ones as we edge into the uncharted territory of a much longer bull market.
There might be as many definitions of bull and bear markets as there are Security Analysts, not only in terms of the magnitude of rises and declines, but also their durations. TDL bases the definition on the average of 41 to 56 month cycles appearing between market Bottoms. Items 1 to 6 trace the chronology of this cycle theory. 1) Adding that range to the significant Oct 1987 low suggested that the subsequent critical bear-market low should have occurred somewhere between Mar 1991 and Jun 1992; the actual Bottom however came five months early, on 11 Oct 1990. 2) Adding 41 and 56 months to the 11 Oct 1990 bottom indicated that the next Major Bottom should have been reached between Mar 1994 and Jun 1995, which included the 4 Apr 1994 low neatly; our IWB "Buy" signal of 5 Apr 1994, within only one day of that low was especially lucky. 3) The next Bottom was then projected for Sep 1997 at the earliest and Dec 1998 at the latest; as it turned out, the DJI bottomed on 1 Sep 1998. Four trading days later (on 8 Sep 1998) we very fortunately flashed a "Buy" signal at 7,868 by IWB. 4) Since the bull market began in Sep 1998, the next bear market Bottom was projected to occur between Feb 2002 at the earliest and May 2003 at the latest. Yet again this Seasonality worked as the market sank to its lowest point at 7,197 on 10 Oct 2002, exactly at the midpoint of the expected period. 5) While the next indicated Bottom was due to occur between Mar 2006 and Jun 2007, the Dow just kept rising until 11 Oct 07, before tumbling 54.4% by 6 Mar 2009. The cycle lasted 77 months, almost two additional years, perhaps underscoring the uniquely bearish forces at work in the last bear market, altering the usually fairly accurate cycle. In the midst of the real-estate driven bull market, we daringly predicted a bear market in 2007 even as the Dow had risen 16.3% in 2006 – luckily before the infamous crash in 2008. 6) Basing the next cycle on the 6 Mar 2009 Bottom, the next important bear market low should have occurred between
A. Which clues do cycle theor ies provide? If the bad news is that markets often do poorly early in a new decade, then the good news is that they provide reliably profitable buying opportunities. In our review of the fourteen decades' figures back to the 1870s, the Dow's low point of each decade has tended to be reached early: true for 1903, 1921, 1932, 1942, 1950, 1962, 1982, 1990 and 2010 so far. Occasionally there are endings in "4" (1884 and 1974). The only four exceptions occurred when the decade low was reached in 1877, 1896, 1915 and 2009.
In the previous decade the Dow's low was at 6,469.95 on 6 Mar 2009. This made our 2 Mar 2009 "Buy" signal flashed in our 27 Feb 2009 IWB an outrageously lucky guess, just four days from the Bottom of the first decade of the millennium. It was historically the only one occurring at the absolute end rather than the beginning of a decade, and we knew at the time we were bucking our own statistics. The young know the rules, the experienced know the exceptions.
The low for the current decade so far stands at 9,614 on 2 Jul 2010; the Dow has subsequently advanced 108%, making our 21 May 2010 "Buy" signal (by IWB) fortunate as well.
B. A bull market usually starts every fourth year, in a "quadrennial cycle." The count started in 1958 and adds 4 years for every cycle thereafter, as in: 1957 (one year early), 1962, 1966, 1970, 1974, 1978, 1982, 1987 (which should have started in 1986, but was one year late), 1990, (1994 was skipped entirely), 1998, and 2001 (which was one year early, but was redeemed by the bull market in 2002). The cycle predicted three more bull markets after 2002 (2006, 2010 and 2014) but only one emerged, starting on 6 Mar 2009. The Mar 09 bull market is still in progress, having already risen 209% as of the 20 Dec 16 high, and has prevailed despite a 19% Correction from the 2 May 11 high to the 4 Oct 11 low, a 16% correction from the 19 May 15 high to the 24 Aug 15 low, and a 14% correction from the 3 Nov 15 high to the 20 Jan 16 low. One way of making sense of the skipped bull
FOR SERIOUS MARKET STUDENTS:
TDL'S SEASONALITIES
Memory – that strange deceiver! Who can trust her? How believe her – While she hoards with equal care The poor and trivial, rich and rare; Yet flings away, as wantonly, Grave fact and loveliest fantasy? Walter de la Mare, Memory
January 4, 2017, Page 28 Advice and Information for Traders and Investors
© 2017 James Dines & Co, Inc, PO Box 22, Belvedere, CA 94920
Aug 2012 and Nov 2013. As we go to press, we consider the three most significant lows in this current bull market as mentioned previously. The first one was on 4 Oct 11, declined 19% from the 2 May 11 high, 10 months earlier than this cycle had indicated. The second one was on 24 Aug 15, down 16% from the 19 May 15 high, this time exactly 21 months after this cycle's expected bottom. The third and the most recent one was on 20 Jan 16, down 14% from the 3 Nov 15 high. Unless a steeper decline occurs next year, we may have to call the 4 Oct 11 bottom the most significant one.
At the moment, it is widely accepted that the March 2009 bull market is still very much alive with the DJI making new all-time highs, having risen 29% from its 20 Jan 16 low. The S&P500, the NASDAQ Composite, and even the Dow Jones Transportation Index have likewise made new all-time highs, effectively confirming a decisive extension of this current bull market which has already surpassed the Oct 1990 bull market as the longest in history at 7 years and 10 months (as of Jan 2017).
To recap, the quadrennial bull market cycle anticipated a bull market to have started in 2014; our market-bottom theory also suggests the next important bear market bottom is now very overdue, or iginally expected between Aug 2012 and Nov 2013, more than 3 years ago. Anyhow, this current bull market, having lasted exactly 7.8 years to date, now ranks as the longest bull market in history and might well alter our Long-Wave cycle theories.
C. While a whopping seven out of twelve recessions emerged in the first year of a presidential term, a mere three occurred during the fourth years of a presidency. A recession began a year late in 1990, the second year of a presidential term, instead of 1989. While there was technically no recession in 1993, when another one had been due, there was considerable anecdotal evidence that the economy had weakened – indeed, sufficiently so that it precipitated a political shift in 1994's Congressional elections. The Seasonality did not work in 1997 when the economy continued to grow, but it did work correctly when a recession arrived on schedule in the first quarter of 2001 (George W Bush's first year) and ended in November 2001. TDL had repeatedly predicted in 2005 that a recession would "begin in 2007." One finally appeared in its last month! The National Bureau of Economic Research indeed concluded that a recession had started in Dec 2007 (a two year delay for that cycle) and officially ended in June 2009. Two recessions were due to begin during the first year of each of President Obama's terms (in 2009 and 2013) but did not materialize. Remarkably, the US economy registered 27 quarters of growth starting in the 3rd quarter of 2009 thru the 3rd quarter of 2016. There were however 2 losing quarters – the first quarters of 2011 and 2014 – but since Apr 2014 there have been 10 consecutive quarters of rising GDP to date.
A recession is widely defined simply as a period when the Gross Domestic Product (GDP) falls for at least 2 consecutive quarters. The Obama administration has therefore dodged the recession bullet for the past 8 years and the economic outlook for 2017 remains favorable based on the prevailing consensus. Moreover, the Federal Reserve Bank of Atlanta raised its 4th quarter growth from 2.4% to 2.9% as of 01 Dec 16. Consensus on the forecasted annual growth for 2017 has narrowed to a tiny range; a) 2.0% by the Conference Board, b) 2.2% by the IMF, and c) 2.3% by The Economist magazine, to d) a high of 2.5% by UBS Finance. If the economy rose, (on paper, based on GDP growth rates) during Obama's presidency, official numbers still pending , the bias toward recessions occurring during Republican administrations will continue to grow and will put President Donald Trump’s first year to the test. Nine of the twelve post-war economic recessions started during Republican administrations, including the last one, in 2007.
It has been TDL's position that a deeper phase of "The Second Great Depression" began in 2008, now widely called "The Great Recession" by the media. We believe the so-called recovery since June 2009 has been a false blip due to the huge expansion of the money supply muddying the numbers, perhaps explaining why the past seven years still felt like a recession to many Americans, especially the forgotten working class that powered Donald Trump’s upset victory.
D. The Presidential Election/Stock Market Cycle. A market pattern linked to the business cycle has emerged in conjunction with the four-year presidential term, as observed for the past 46 administrations, from President Jackson in 1833 to President Barack Obama. Even some non-professionals are aware of the Seasonality for new presidents. Theoretically, their first two years are still formative, hence have the least impact on the economy. As the president gains footing, the economic benefits come to fruition, making the third and fourth years progressively better. To close the circle, the good fourth years lead to excesses that negatively impact the subsequent first year of the next cycle. That's the accepted theory.
In fact, within the Four-Year Presidential Cycle, the Dow's gains in the final two years have overwhelmingly outperformed the first two years. Confirming this in the 46 administrations since 1833, the annual percentage gains in the Dow, broken down by each of the four years of the cycle, show the 3rd (pre-election year) and 4th year (election year) gains of 467.3% and 275.2% respectively, as against 112.6% and 194.5% for the first (post-election year) and second years (mid-term year). Gains in years three and four are
Advice and Information for Traders and Investors January 4, 2017, Page 29
© 2017 James Dines & Co, Inc, PO Box 22, Belvedere, CA 94920
2.4 times higher than in years one and two. A parallel study, this time based on the S&P
500, covering 80 years and 20 presidential cycles, even more consistently confirmed the market's relative weakness in the first two years and the bullishness of the third and fourth years. Out of the 80 years in our study, there were only 28 years when the S&P 500 declined and, remarkably, 18 of the 28 decliners (64%) occurred in the first and second years of the cycle.
1) The mid-term year, the cycle's second-weakest, sports an average Dow gain of 4.2%, up 61% of the time. Historically, second-year (mid-term year) weakness coincided with risky events, such as the Cuban Missile Crisis of 1962, tight money in 1966, the Cambodian War in 1970, and Watergate plus Nixon's resignation in 1974, to mention a few. Nine of the 16 bear markets hit bottom in mid-term years. While the prevalence of market bottoms in mid-term years makes them the second-weakest performing years of the cycle, their significance as a starting point of bull markets is that they provide a proverbial buying opportunity for investors and makes the following pre-election years more bullish.
2) As mentioned, pre-election years such as 2015 are the presidential election cycle's most profitable years, averaging a 10.2% gain by the Dow, up 74% of the time for the past 46 cycles, since 1835. The numbers improved significantly after 1939 as the Dow did not have a single losing year until 2015; the S&P 500 had two. Starting in 1943, the average gains are 17.8% for the S&P 500 and 15% for the Dow. This purportedly reflects economic gains usually delivered as the party in power tries to boost growth to better its chance of winning in the subsequent year's elections.
3) The presidential election year is the second-best performing year of the cycle, averaging annual growth of 6% and 4.5% for the DJI and the S&P 500 respectively. Since 1836, election years rose 67% of the time for the DJI and 70% of the time for the S&P500 since 1940. Historically however, the 8th year of double presidential terms such as 2016 were somewhat bearish, although current market conditions to the contrary do not seem to indicate this bias.
4) Now in 2017 our focus must necessarily be on the seasonal prospects in the post-election year. We already know that market growth is historically weakest in post-election years, averaging annual 2.5% gains in the Dow’s 46 presidential cycles, and 6.3% for the S&P 500’s 20 cycles. Post-election years are points of transition that are naturally more critical when a new president takes charge, especially if the party in
power is ousted, raising the level of policy and structural changes to the hilt. It often translates into disruptions and uncertainties in the economy. Technically, new administrations coming off the tail end of economic crises or bear markets rather than beginnings are likely to show better growth numbers as markets rebound. Conversely, administrations starting off while wars or crises are developing or exploding are likely to experience subsequent economic setbacks in their first year of office. Anyhow, records show new Democratic administrations unseating the Republican incumbent: Presidents Wilson, Roosevelt, Kennedy, Carter, Clinton, and Obama on average experienced a rise of 15.8% in the Dow during post-election years. On the other hand, new Republican administrations regaining control of the White House: Presidents Harding, Eisenhower, Nixon, Reagan, and GW Bush show an average decline of 4.5%. Facing these Republican cycle declines, President Donald Trump must continue to break more norms and records to alter this clearly contrasting pattern, made more formidable on the back of the already-longest bull market in history.
E. Edmund Tabell was one of your editor 's mentors, to whom we give credit for having pioneered a Seasonality that shows breaking the previous December's low in the first quarter is usually a bear ish event for the whole year. The odds have worked 36 of the past 53 times (around 2 out of 3). In 2009, 2010, 2014 and 2016 markets rallied despite the December low having been broken early, probably due to the powerful rebound from the '08 Crash. Tabell also calculated how long the previous year-end rally lasted into the current year, and he discovered that the longer such rallies lasted, the more bullish it was for the entire year – while the earlier broken, the more bearish. Continuing Tabell's Seasonality that ended in 1962, TDL’s study of the subsequent period to 2016 revealed that in the 25 years when the Dow's December low was not broken by mid-March, all but one year (1981) ended on the upside, for a 96% accuracy record; however in the 30 years when it was broken, the Dow was down 15 times, a dicey 50% of the time. For 2017, if the 1 Dec 16 low of 19,138.79 is not broken by 15 Mar 17, there is a 96% chance that 2017 would be an up year.
F. The first five trading days of the S&P 500 have impressive predictive value for the entire year: Since 1950, 35 of the 42 years starting with positive 5-day periods ended higher, for an 83% accuracy record. This level of predictability improves during post-election years from 1950-2016, where records show an amazing 100% correlation in the last 12 years when the first five trading days were up. When the first five trading days were down in five cases, three of those years ended down as well., not as useful.
G. As discussed in the last TDL (page 13), many investors these days are aware that January usually predicts the year. For the record, the "January barometer," discovered by our old friend Yale Hirsch, has been correct 50 out of 67 years for the S&P 500 (75% of the time), and
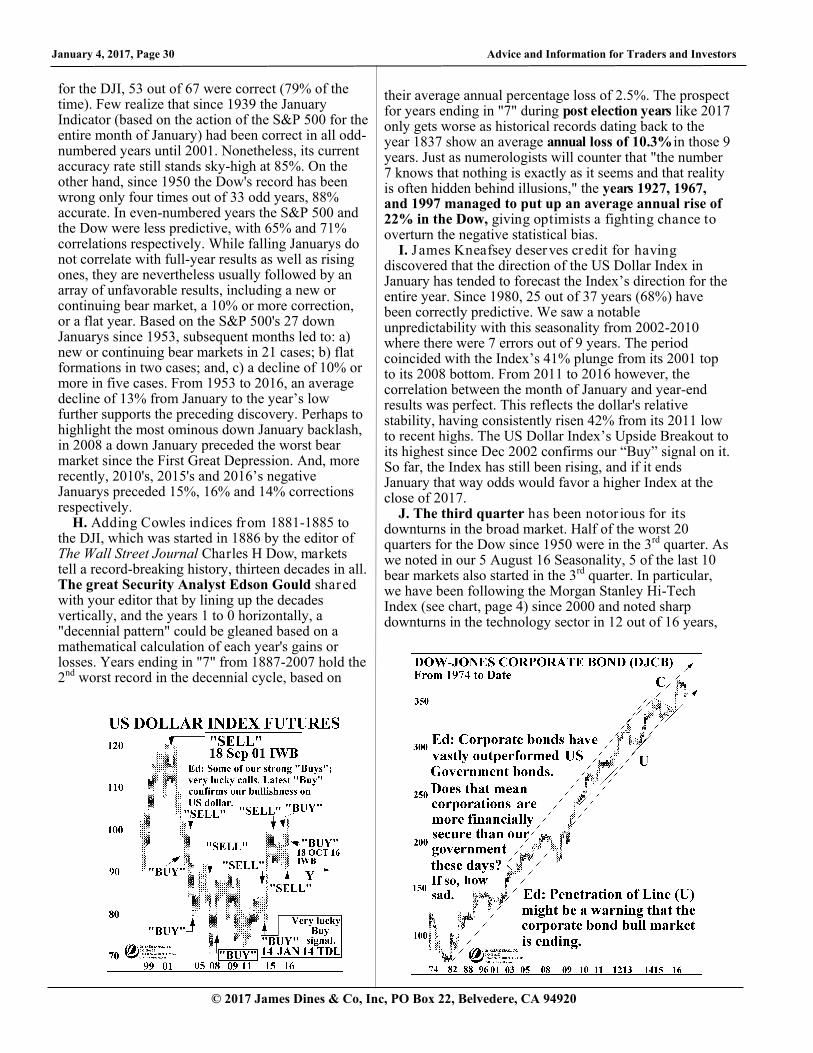
January 4, 2017, Page 30 Advice and Information for Traders and Investors
© 2017 James Dines & Co, Inc, PO Box 22, Belvedere, CA 94920
for the DJI, 53 out of 67 were correct (79% of the time). Few realize that since 1939 the January Indicator (based on the action of the S&P 500 for the entire month of January) had been correct in all odd-numbered years until 2001. Nonetheless, its current accuracy rate still stands sky-high at 85%. On the other hand, since 1950 the Dow's record has been wrong only four times out of 33 odd years, 88% accurate. In even-numbered years the S&P 500 and the Dow were less predictive, with 65% and 71% correlations respectively. While falling Januarys do not correlate with full-year results as well as rising ones, they are nevertheless usually followed by an array of unfavorable results, including a new or continuing bear market, a 10% or more correction, or a flat year. Based on the S&P 500's 27 down Januarys since 1953, subsequent months led to: a) new or continuing bear markets in 21 cases; b) flat formations in two cases; and, c) a decline of 10% or more in five cases. From 1953 to 2016, an average decline of 13% from January to the year’s low further supports the preceding discovery. Perhaps to highlight the most ominous down January backlash, in 2008 a down January preceded the worst bear market since the First Great Depression. And, more recently, 2010's, 2015's and 2016’s negative Januarys preceded 15%, 16% and 14% corrections respectively.
H. Adding Cowles indices from 1881-1885 to the DJI, which was started in 1886 by the editor of The Wall Street Journal Charles H Dow, markets tell a record-breaking history, thirteen decades in all. The great Security Analyst Edson Gould shared with your editor that by lining up the decades vertically, and the years 1 to 0 horizontally, a "decennial pattern" could be gleaned based on a mathematical calculation of each year's gains or losses. Years ending in "7" from 1887-2007 hold the 2nd worst record in the decennial cycle, based on
their average annual percentage loss of 2.5%. The prospect for years ending in "7" during post election years like 2017 only gets worse as historical records dating back to the year 1837 show an average annual loss of 10.3% in those 9 years. Just as numerologists will counter that "the number 7 knows that nothing is exactly as it seems and that reality is often hidden behind illusions," the years 1927, 1967, and 1997 managed to put up an average annual rise of 22% in the Dow, giving optimists a fighting chance to overturn the negative statistical bias.
I. James Kneafsey deserves credit for having discovered that the direction of the US Dollar Index in January has tended to forecast the Index’s direction for the entire year. Since 1980, 25 out of 37 years (68%) have been correctly predictive. We saw a notable unpredictability with this seasonality from 2002-2010 where there were 7 errors out of 9 years. The period coincided with the Index’s 41% plunge from its 2001 top to its 2008 bottom. From 2011 to 2016 however, the correlation between the month of January and year-end results was perfect. This reflects the dollar's relative stability, having consistently risen 42% from its 2011 low to recent highs. The US Dollar Index’s Upside Breakout to its highest since Dec 2002 confirms our “Buy” signal on it. So far, the Index has still been rising, and if it ends January that way odds would favor a higher Index at the close of 2017.
J. The third quarter has been notor ious for its downturns in the broad market. Half of the worst 20 quarters for the Dow since 1950 were in the 3rd quarter. As we noted in our 5 August 16 Seasonality, 5 of the last 10 bear markets also started in the 3rd quarter. In particular, we have been following the Morgan Stanley Hi-Tech Index (see chart, page 4) since 2000 and noted sharp downturns in the technology sector in 12 out of 16 years,

Advice and Information for Traders and Investors January 4, 2017, Page 31
© 2017 James Dines & Co, Inc, PO Box 22, Belvedere, CA 94920
75% of the time, during the months of July, August and September. Corroborating this statistic is the fact that the tech-heavy Nasdaq has its third-quarter months of Sept, Aug and July ranked as its worst performing months, whereas the Dow and the S&P 500 have the month of June instead of July in its three worst months. Percentages indicate caution toward Hi-Techs in July, August and September 2017.
K. Historically, 14 out of 35 bull market tops (40%) by the DJI on record since 24 Sep 1900 have been reached in the November 3 to February 9 time frame. The last market top within that 3-month period occurred when the Internet bubble burst on 14 Jan 2000, and subsequent tops on 19 Mar 2002 and 9 Oct 2007 came just outside that window. As of today the current bull market has risen as high as 19,987.63 on 20 Dec 16, up 209% from its 6 Mar 09 bottom. Hence if this Seasonality works, another Top might be lurking by Feb 2017.
L. For an offbeat indicator, if a team from the original National Football League wins the Super Bowl, first played in 1967, the markets are expected to rise. If the winner is a former American Football League team, markets tend to fall that year. This predictor is as random as Groundhog Day predicting a coming winter's severity. Nonetheless, for both the DJI and the S&P 500, the Super Bowl theory improbably has been right 70% of the time, 35 out of the 50 years! While 70% sounds significant, this Indicator has become less fashionable as it failed in about half of the last 12 years. Last year's victory by the Denver Broncos incorrectly foretold a down year for the Dow. As of today, bullish investors need a win from the Dallas Cowboys or the Pittsburgh
Steelers, rather than from a "non-original" such as the New England Patriots or the Kansas City Chiefs.
M. Finally, in the distant future, when this planet's Southern Hemisphere is no longer dominated economically by the Northern Hemisphere, we would be interested as to whether the cycles we follow are correspondingly different because of antipodal patterns. But that is another story. For another day.
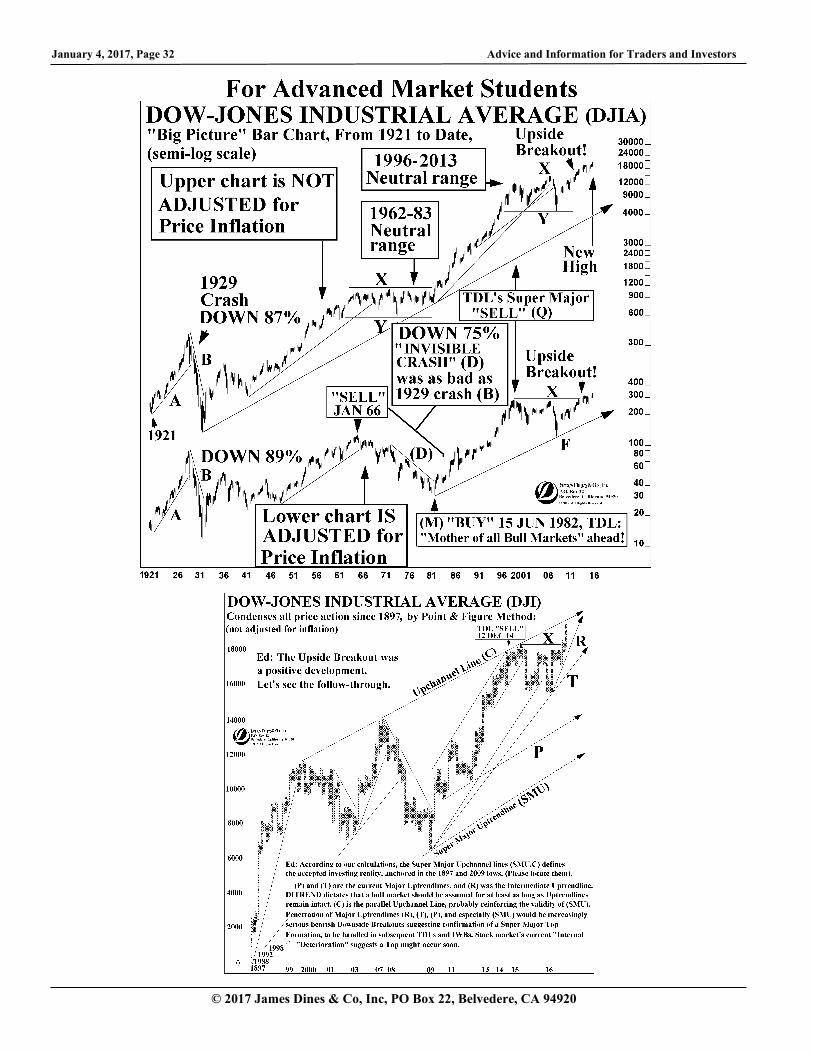
January 4, 2017, Page 32 Advice and Information for Traders and Investors
© 2017 James Dines & Co, Inc, PO Box 22, Belvedere, CA 94920
Advice and Information for Traders and Investors January 4, 2017, Page 33
© 2017 James Dines & Co, Inc, PO Box 22, Belvedere, CA 94920
SELECTED AND CONDENSED INFORMATIONAL EXCERPTS FOR BUSY TDLRS: Latest on Health 1. When the DNA sequence of the human genome was revealed in 2000, many people expected it to start a revolution. That complex illnesses often have contributions from large numbers of genes is now recognized. This recognition, plus better computing and sequencing power, mean researchers are indeed beginning to pick the relationships between genes and disease apart. Genomics is already having an impact on the treatment of cancers. AstraZeneca would form a collaboration to sequence 500,000 samples taken during clinical trials it has conducted over the years. The British-Swedish drug firm says it plans to see 2m genomes so studies over the next decade. Human Longevity (HLI) in San Diego has compiled a list of the common variants in the human genome. The firm needed 10,000 genomes to pick these out. Larger numbers than this will therefore be required to notice rare and ultra-rare variants that may or may not be associated with diseases. 10m genomes will need to be sequenced. Genomics England, part of Britain’s Department of Health, intends to sequence 100,000 whole genomes from consenting patients. The Economist (England) 2. Telomere Diagnostics, of Menlo Park, Calif., is offering mail-order testing to measure the length of people’s telomeres, the protective caps of DNA on the ends of chromosomes that have been likened to the plastic tips that prevent shoelaces from fraying. Telomeres gradually shorten as people age and eventually may disappear, leaving cells vulnerable to disease and death. The service also provides advice for improving diet, fitness, sleep and stress levels, which some small studies suggest may help telomeres regain length. There’s a difference between knowing how old you are, and how well you are aging. Still, some top telomere scientists say such information amounts to little more than high-tech palm reading, in part because telomere length varies so widely in the general population that it isn’t clear what length is problematic. A meta-analysis of 24 studies found that those in the bottom third of telomere length had a 50% greater risk of cardiovascular disease than those in the top third. The review was published in BMJ in 2014. Studies suggest shorter telomeres are associated with lack of exercise, poor sleep and a diet high in refined carbohydrates, among other factors. Critics say the few controlled trials that show people can lengthen their telomeres are very small and that the large observational studies that make up the bulk of the scientific literature on telomeres don’t demonstrate cause and effect. Much of what is known about telomeres and disease comes from studying people who have inherited extremely short telomeres and are vulnerable to several specific conditions, including pulmonary fibrosis, immune deficiency, loss of bone marrow and certain cancers. The testing companies argue that making healthy lifestyle changes can help telomeres regain length. Titanovo Inc, in Raleigh, NC, uses cheek swabs for its $150 test. The Wall Street Journal, 25 Oct 16
3. The maximum lifespan for most people may be around 115, because of the innate limits of the human body, says the Albert Einstein College of Medicine in New York. The record for the oldest living person climbed to around 115 in the 1990s, after which it has broadly plateaued. Although Jeanne Calment, who has the longest confirmed human lifespan on record, reached 122 before she died in 1997, her record has gone unbroken for nearly two decades. The Max Planck Institute for Demographic Research in Rostock, Germany, says many predictions about limits to lifespan have been proven wrong, as records have been repeatedly broken. At the start of the 20th century, average lifespan in the West was in the mid-40s, and has risen to about 80 today. Newcastle University, UK, disagrees with the idea of a limit to human lifespan. “The process is driven by the build-up of faults and damage in the cells and organs of the body, which is malleable.” New Scientist, 8 Oct 16 Current Market Analysis 1. Bargains pale compared with what a dollar and chance can buy at grocery stores these days. In North Bergen, NJ, you can pick up a dozen eggs at Walmart for $1.14. A mile away at Aldi, the Germany-based discounter, shoppers can actually get 12 eggs for 99¢. A year ago, they’d have paid three times as much, on average. “The severity of what we’re seeing is completely unprecedented,” says Scott Mushkin, an analyst at Wolfe Research who’s studied grocery prices for more than a decade. “We’ve never seen deflation this sharp. At first, falling prices helped grocers. Slumps in global commodities markets pushed down the cost for many meats and packaged foods, initially boosting grocer’s profits. But deflation has since turned ugly for the industry, with some retailers pushing steep discounts to lure more customers into their aisles. In recent years, Kroger, the largest grocery chain in the US, cut prices to compete with Walmart and managed to increase its market share and sales. But deflation has been hard on the company. Its stock has lost more than a quarter of its value this year as sales growth has slowed because of price cuts. Chief Executive Officer Rodney McMullen has expressed frustration that many customers don’t even notice the falling prices. Bloomberg Businessweek, 3 Oct 16 Ed: “Deflations”? Who knew? 2. IMF warns record debt of $152 trillion poses threat to global economy. Borrowing spurred by ultra-low interest rates. The figure, more than two times the size of global economy, highlights the apparent paradox between ultra-low interest rates imposed by many central banks in a bid to encourage borrowing and boost sluggish economies, and the dangers that arise from excessive debt levels. Rapid increases in private debt often end up in financial crises. Financial recessions are longer and deeper than normal recessions. While two-thirds of the debt is held by the private sector, government borrowing has also ballooned since the global financial crisis. Central banks have cut interest rates to all-time lows and engaged in mass bond buying in response to the global financial crisis. Though most economists think their actions have helped, there is also a broad consensus that the economy will remain below par unless governments do more. Front page, Financial T imes (London), 6 Oct 16 Ed: “Governments do more”? How about doing the unthinkable, and doing less?
January 4, 2017, Page 34 Advice and Information for Traders and Investors
© 2017 James Dines & Co, Inc, PO Box 22, Belvedere, CA 94920
3. A Trans-Atlantic revolt against central bankers. The International Monetary Fund last week sharply lowered its growth forecasts for the United States and other advanced economies. The IMF is forecasting dismal 1.1% growth for the United Kingdom in 2017, which is half the 2.2% it predicted in April before Britons voted in June to leave the European Union. No one would disagree that disappointing economic results since the 2008 financial meltdown have spawned political agitation. People want change. The Federal Reserve’s ultra-low interest rates, intended to stimulate economic growth, have flooded wealthy investors and corporate borrowers with cheap money, while savers with ordinary bank accounts have been obliged to accept next-to-nothing returns. The Wall Street Journal, 12 Oct 16 4. Worst bond rout since 1990. Treasuries lead sell-off. Bond yields of most developed economies climbed steeply in a sell-off led by Treasuries. Stronger expansion and rising inflation, accompanied by a jump in government borrowing to finance tax cuts and infrastructure spending, have the potential to push US bond yields up even further next year, analysts warn. The Financial Times (London), 2 Dec 16 Latest On Gold 1. Abin, an unemployed school teacher from the town of Thodupuzha in the southern Indian state of Kerala, was in a bind. He needed money to cover some emergency expenses, but since he was out of work, he couldn’t easily get a loan from a bank. So in August he took a 14-gram gold bangle and used it as collateral for a six-month loan of 27,500 rupees ($402) from Muthoot Finance, one of the leading providers of gold-based loans in India. Bloomberg Businessweek, 30 Nov 16 2. Venezuela is taking nearly half the country’s bank notes out of circulation beginning Wednesday, threatening ruin for Venezuelans already suffering from dire cash shortages, hyperinflation and an economic meltdown. The country’s largest bill, worth 100 bolivars, or just 3 US cents on the black market, is to become illegal, in a move designed to combat contraband along Venezuela’s borders, the government said. Buying a kilogram of tomatoes already requires a stack of at least 32 100-bolivar bills in Venezuela. Now it will take at least twice that many. Venezuelans have just two days to deposit into banks the more than six billion targeted bills currently in circulation. Anyone wanting to exchange after that will have 10 days to submit them at the central bank after being questioned by the secret police. The Wall Street Journal, 13 Dec 16 3. When Marco Polo went to China he marveled that the Chinese were creating money out of paper. But what the 13th-century Venetian traveler could not know was how perilous a paper currency would prove for the country that invented it. At intervals in their history, Chinese rulers have succumbed to the temptation to pay off spiraling debts simply by rolling the money printing presses. Inflationary scourges ravaged dynasty after dynasty, with both the Mongols and Mao Zedong’s
Communists seizing power in a country eviscerated by depreciated paper. Beijing has again sent its printing presses into overdrive, creating what is almost certainly the biggest pool of domestic liquidity in history to help stimulate its economy and finance a crushing debt burden. The danger is that if the renminbi loses value internally or gushes out of China, a wave of unpaid debts could precipitate a crisis. Between 2007 and 2015 China created 63 percent, or $16.1tn, of the growth in the world’s supply of money. China now has more money coursing through the arteries of its economy than the eurozone and Japan combined – and almost as much as the US and the eurozone combined. China’s crunch point will come when there is a disruption in the supply of money needed to pay total debts that amount to about 250 percent of China’s gross domestic product, the highest level among any large emerging market. The potential for something to go wrong is considerable among a “chaotic hodge-podge of banks and non-banks” that are fueling China’s credit boom. These concerns explain Beijing’s plans to restrict outbound foreign investment. Gold purchases are also being curbed. Such problems have driven down China’s stockpile of foreign exchange reserves from almost $4tn in early 2014 to $3.12tn in October. So engorged with easy money have they become that Chinese banks are on average four times larger today than they were just eight years ago. 800 years ago Ye Shi, a Song dynasty adviser, warned that issuing “kongqian” – or “empty money” that is not backed by assets – would stoke inflation and reduce people’s income. His emperor did not listen, triggering economic chaos that enfeebled China before the Mongol invasion. James Kynge, Financial Times (London), 3 Dec 16 Ed: And China’s 1940’s hyperinflation led to Mao Tse Tung’s communist takeover. Latest on Uranium 1. It’s about time for the United States to get serious about clean energy. It also means supporting safely operating nuclear power plants that produce carbon-free electricity. Already, 60% of our carbon-free electricity comes from the 99 nuclear reactors that dot the nation’s map. But over the next decade, at least eight of these reactors are scheduled to shut down. That will push up carbon emissions from the American electricity sector by nearly 3%. In roughly two decades, the United States could lose about half its reactors. That’s because, by 2038, 50 reactors will be at least 60 years old, and will face having to close. Without them, or enough new reactors to replace them, it will be much harder to reduce carbon emissions that contribute to climate change. Every time new fossil energy replaces nuclear, we’re locking ourselves in to a more carbon-heavy energy mix for years to come. We should invest more in research to develop advanced nuclear reactors, including small modular reactors and accident-tolerant fuels. Advanced reactor designs may substantially reduce the threat of a meltdown. Many new, modular designs are much smaller than their predecessors, meaning they can be built in factories at lower cost and plugged into the grid as needed. If we want to clean the air and reduce carbon emissions to deal with climate change, we need a stronger, not weaker, nuclear energy sector. Congress, federal agencies and the Nuclear Regulatory Commission must work with utilities to preserve our existing reactors in the safest possible way, and to develop the next generation of reactors that will provide cheaper, reliable, carbon-free electricity. Lamar Alexander & Sheldon Whitehouse, New York Times, 22 Dec 16
Advice and Information for Traders and Investors January 4, 2017, Page 35
© 2017 James Dines & Co, Inc, PO Box 22, Belvedere, CA 94920
As we rush to publish this complex issue, we think we’ve noticed something extraordinary. Congressman Mick Mulvaney has been selected by Trump as his budget chief. Mulvaney is not well-known by the media, but he has been an active investor in gold and its mining stocks! He has also accused the Fed of debasing the value of the US dollar, and has praised Bitcoin as an alternative currency.
We were stunned by the news, missed by the entire financial news media, except Bloomberg – good for them!
The Mulvaney pick sets us to think outside the box. What does it say about Trump himself? Might he be a closet Goldbug? We have not seen a whisper of this in the media before.
Why does TDL so often detect new opportunities before nearly all others? It’s not clear to us, but Louis Pasteur said, “Chance favors the prepared mind.”
Mulvaney would be a sign Trump might actually try to fix the dollar, meaning higher gold and silver prices! We’ll handle it in upcoming TDLs!
We noted on page 7, that our 8 Dec 2016 IWB, concluded: “While a gold upturn does not show up in our Indicators, we Sense a rally coming to gold and silver soon, so we recommend resumption of buying golds and silvers as they might be somewhere near an Upturn.”
While there wasn’t much action in the golds and silvers in the subsequent two weeks, there was a possible rally in just the last few trading sessions.
Gold bullion also jumped around $40 dollars after having been stuck in a narrow range for the last two weeks. These gains come at time when Seasonalities point to bullishness for gold and silver shares by DIRGS (Dines Rule of Gold Seasonality). Combining this with Bottoms around this time last year that led to spectacular rises in shares and bullions, these blips might be another precursor to the large gains that we Sensed earlier this month. As discussed in this Forecast Issue, policies hinted at so far by the incoming president Trump might provide further impetus for precious metals buying.
PRESSTIME GOLD FLASH!!
Latest on Pot 1. Marijuana was legalized in the US’s most populous state. One sector is watching the spread of legalization with a degree of trepidation: the $200bn US alcohol industry. Though alcohol and weed might seem eminently compatible to some, a number of brewers fear cannabis as a competitive threat. Brown-Forman, the Kentucky-based distiller of Jack Daniel’s whiskey, lists “the potential legalization of marijuana use on a more widespread basis within the United States or elsewhere” as a risk factor in its accounts. In the US, 14 percent of adults admit to cannabis use – well below the 70 percent who drink alcohol and 25 percent who smoke cigarettes. Cowen, a research group, points out in a recent report that cannabis has been gaining share among adult men at the expense of alcohol over the past decade. Constellation Brands, which sells tequila, vodka and beer brands such as Ballast Point, says marijuana could be used to flavor alcohol. The spread of marijuana legalization has certainly given drinks companies food for thought. Think-tank Volteface, which in a joint report with the Adam Smith Institute urged the British government to legalize cannabis, says, that given a choice, some drinkers might be inclined to cut their alcohol consumption. A survey in London showed 45 percent of cannabis users believe they drink less alcohol as a result of smoking cannabis. That rises to 55 percent among women. The Financial Times (London), 26 Nov 16 Ed: We predicted in our TDL of 7 Oct 16 (page 2), that alcohol and tobacco would feel threatened by pot, and buy out our companies – at higher prices. Latest on 1984 1. A core feature of Amazon’s new voice-controlled smart speaker is a “wake word” that, when spoken, cues it to take voice commands. The only way to interact with the Echo is to talk to it. It’s always listening for its wake word, which users can change to “Amazon” or “Echo” if they want. Amazon’s critics pointed to it as evidence of Amazon’s Orwellian tendencies. Then something weird happened: People decided they loved it. The Echo, which seemed like a superfluous toy at first, now looks like a way for Amazon to become the default choice for voice-controlled devices. Echo comes out of Lab126, which was created in 2004 to build the Kindle e-reader. The lab’s name refers to the alphabet, with 1 representing the letter A and 26 representing Z. The Kindle was Project A. Project B was Amazon’s smartphone. Little is known about Project C, but a review of Amazon patent applications suggests a device that would display augmented-reality images that people could interact with. The Echo – Project D – was an offshoot of Project C. Bloomberg Businessweek Ed: Latest on “The Coming Police States” – when the smart speaker is on all the time – at police headquarters. 2. A report by the American Civil Liberties Union showing that police from Oakland to Baltimore had used a surveillance program to track activities and communities of color by accessing their Facebook, Twitter and Instagram data en mass confirmed for many activists what they already suspected. According to the ACLU report, nearly 500 law enforcement agencies – including the Oakland Police Department – gained access to user data from eight social media sources through Geofeedia, a Chicago tech firm that gathers real-time, location-based information gleaned from public social media accounts. Twitter, Facebook and Instagram (which is owned by Facebook) have severed their relationship with Geofeedia since the report was released. Such data can allow agencies to track
protests as they happen and identify individuals involved. As technology evolves, so, too, does governments’ ability to monitor individuals, groups and entire cities. San Francisco Chronicle, 16 Oct 16 3. MASS surveillance legislation, labeled by critics as the most pervasive and invasive in history, has been passed in the UK. The Investigatory Powers Bill allows intelligence and security services, police and other public bodies to intercept, acquire and retain the bulk communications data of citizens, such as internet activity. The government says it needs such data to fight terrorism and crime. The law also grants access to bulk personal data sets held by individuals, communities, groups and public services, among others, and it permits equipment interference – or hacking. We need to be very careful about building all-powerful mass surveillance tools because you never know who is going to get the keys. New Scientist, 26 Nov 16
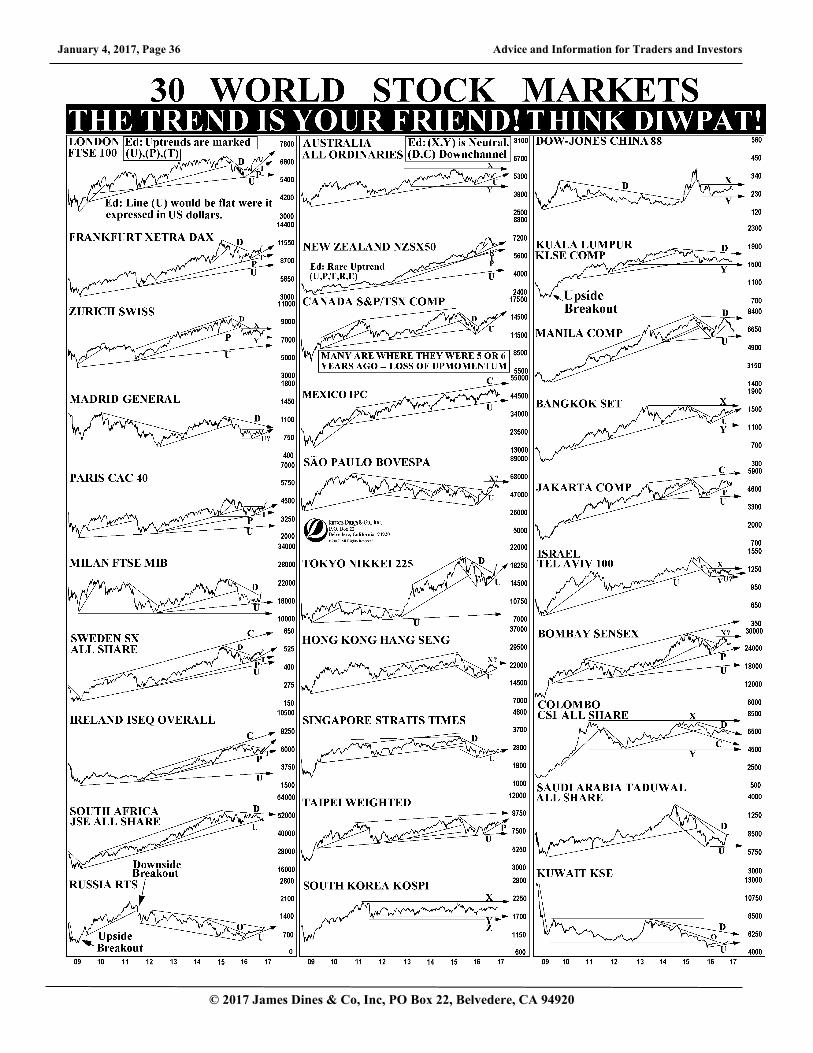
© 2017 James Dines & Co, Inc, PO Box 22, Belvedere, CA 94920
January 4, 2017, Page 36 Advice and Information for Traders and Investors

Newly Recommended (Never buy on margin or speculate with money that you cannot afford to lose. Invest in the Supervised List appropriate to
your circumstances, and then make your final decisions with your trusted advisors. The “Sell” decision is entirely yours, although we will try to suggest selling somewhere near a Top area. Try to buy on dips. We wish everybody good luck!)
List #4: McEwen Mining (MUX) (MUX.TO) List #6: Bear Creek Mining (BCEKF)(BCM.V) recommended in IWB of 12 Dec 16 List #7: Kush Bottles (KSHB) Try to buy below 3.30 No Initial stops on any of the above.
1. DJI: The Upside Breakout on the day after Trump’s election was a “game-changer.” As noted in the body of this issue, we have doubts about the rally because of Overbought levels, and remain on our “Sell” until we see more; “Buy stop” 21,000. Intermediate-Term still bearish with “Buy stop” at 21,000.
2. DJT: Short-Term “Buy stop” unexpectedly triggered on 10 Nov 2016 on rally to 8,500 with stop at 8,000. Intermediate-Term “Buy stop” triggered at 9,250 on 7 Dec 2016; stop 8,000. We already have misgivings about our current “Buy.”
3. DJU: Still on our Short-Term "Sell" flashed by IWB that was a hole-in-one, within 1 day of its all-time high on 29 Jan 2015. After having declined 18% from 657 to 540, alone among all the other leading averages, it subsequently had a decisive Upside Breakout to 724. We remain bearish on the utility sector because the Fed’s higher interest rates would mean capital losses larger than income received. We are still not comfortable recommending buying at these heights; no stop. Intermediate-Term “Sell”; no stop.
4. Bonds: We flashed a Major “Sell” signal on the US Government 6.125% T-Bond Nov 2027 on 29 Dec 2008 by IWB and its price is well below our “Sell,” eight years later, which we interpret as a Confirmatory Major Top Formation that will end in a crash. Also implying much higher interest rates somewhere ahead. The CSI Government T-Bond Perpetual Contract broke down and is bearish. “Junk” bonds’ Technical Rally should end not far above current levels. Too risky for us to recommend buying. The Dow-Jones Corporate Bond Average unclear, but we suspect will come down alongside US Government bonds – “Sell.” The US Dollar Index Futures are still manipulated by the government; “Buy” flashed by 18 Oct 2016 IWB still stands. Bitcoins in screaming Uptrend; stop 700.
5. NASDAQ Composite: New “Buy” triggered at 5,400 on 29 Nov 2016; stop 4,900. Intermediate-Term “Neutral,” automatically upgraded to “Buy” on the rally to 5,450 on 9 Dec 2016, with subsequent stop at 4,900.
6. S&P 500: Short-Term “Sell” was flashed at 2,080 by IWB on 19 Aug 2015. It is now within only 9% from our “Sell” over one year ago. Not yet a robust bull market, but the Trump effect is still new. Upgrade to “Buy” on an unlikely rally to 2,400. Intermediate-Term “Sell,” same as Short-Term. We won’t be rushed by a willy-nilly optimistic crowd.
7. Gold Bullion (London): We advise that some golds and silvers are held in all long-term portfolios. 2016 saw an impressive rally in gold and silver stocks, stronger than the prices of gold and silver bullions, albeit both are bullish. Then, our IWB on 22 Aug 2016 advised Short-Term caution toward gold and silver shares by downgrading them from “Buy” to “Hold.” Our 18 Oct 16 IWB downgraded gold and silver bullion from “Buy” to “Hold.” We have since been waiting patiently for the Major Uptrend to resume. Mass opinion is very negative, which is good for gold. In our 8 Dec 16 IWB we took a daring chance and switched to “Buy” on gold and silver stocks and bullions, knowing we might be a bit early. No stop for bullions. The Intermediate-Term “Buy” signal was flashed at $919 on 15 Dec 2008; stop $920. Long-Term Super Major “Buy” was flashed at $288 on 25 Sep 2001; no stop yet and still projecting Long-Term targets at $3,000 to $5,000 levels that we expected at $35 gold. Silver will rise above $300/oz Longer-Term; very long targets will see silver prices above gold’s, believe the unbelievable, or not.
8. Silver Bullion: Same as gold.
TDL’S TRIGGER BOX (Hourly Prices for DJI) for Serious Market Students
This is not intended to be advice for speculation in commodities futures. Updated by IWBs. All Super Major signals have been bearish since 2000, see DJI adjusted for inflation on page 32 of the 2017 Annual Forecast Issue.
Latest Stops DJI DJT DJU NASDAQ S&P 500
Short-Term: Sell 8,000 Sell 4,900 Sell
Intermediate-Term: Sell 8,000 Sell 4,900 Sell
January 4, 2017, Page A Advice and Information for Traders and Investors
© 2017 James Dines & Co, Inc, PO Box 22, Belvedere, CA 94920
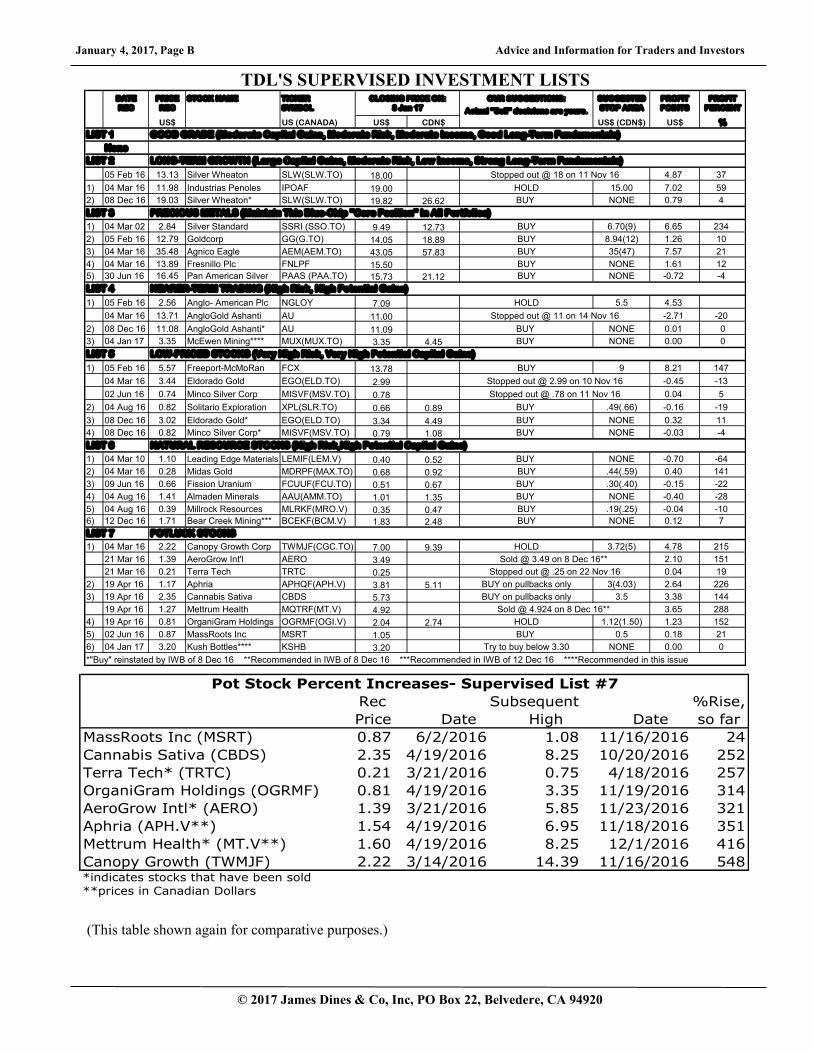
January 4, 2017, Page B Advice and Information for Traders and Investors
© 2017 James Dines & Co, Inc, PO Box 22, Belvedere, CA 94920
Rec Subsequent %Rise,
Price Date High Date so far
MassRoots Inc (MSRT) 0.87 6/2/2016 1.08 11/16/2016 24
Cannabis Sativa (CBDS) 2.35 4/19/2016 8.25 10/20/2016 252
Terra Tech* (TRTC) 0.21 3/21/2016 0.75 4/18/2016 257
OrganiGram Holdings (OGRMF) 0.81 4/19/2016 3.35 11/19/2016 314
AeroGrow Intl* (AERO) 1.39 3/21/2016 5.85 11/23/2016 321
Aphria (APH.V**) 1.54 4/19/2016 6.95 11/18/2016 351
Mettrum Health* (MT.V**) 1.60 4/19/2016 8.25 12/1/2016 416
Canopy Growth (TWMJF) 2.22 3/14/2016 14.39 11/16/2016 548*indicates stocks that have been sold
**prices in Canadian Dollars
Pot Stock Percent Increases- Supervised List #7
(This table shown again for comparative purposes.)
DATE PRICE STOCK NAME TICKER OUR SUGGESTIONS: SUGGESTED PROFIT PROFIT
REC REC SYMBOL Actual "Sell" decisions are yours. STOP AREA POINTS PERCENT
US$ US (CANADA) US$ CDN$ US$ (CDN$) US$ %
None
05 Feb 16 13.13 Silver Wheaton SLW(SLW.TO) 18.00 4.87 37
1) 04 Mar 16 11.98 Industrias Penoles IPOAF 19.00 HOLD 15.00 7.02 59
2) 08 Dec 16 19.03 Silver Wheaton* SLW(SLW.TO) 19.82 26.62 BUY NONE 0.79 4
1) 04 Mar 02 2.84 Silver Standard SSRI (SSO.TO) 9.49 12.73 BUY 6.70(9) 6.65 234
2) 05 Feb 16 12.79 Goldcorp GG(G.TO) 14.05 18.89 BUY 8.94(12) 1.26 10
3) 04 Mar 16 35.48 Agnico Eagle AEM(AEM.TO) 43.05 57.83 BUY 35(47) 7.57 21
4) 04 Mar 16 13.89 Fresnillo Plc FNLPF 15.50 BUY NONE 1.61 12
5) 30 Jun 16 16.45 Pan American Silver PAAS (PAA.TO) 15.73 21.12 BUY NONE -0.72 -4
1) 05 Feb 16 2.56 Anglo- American Plc NGLOY 7.09 HOLD 5.5 4.53
04 Mar 16 13.71 AngloGold Ashanti AU 11.00 -2.71 -20
2) 08 Dec 16 11.08 AngloGold Ashanti* AU 11.09 BUY NONE 0.01 0
3) 04 Jan 17 3.35 McEwen Mining**** MUX(MUX.TO) 3.35 4.45 BUY NONE 0.00 0
1) 05 Feb 16 5.57 Freeport-McMoRan FCX 13.78 BUY 9 8.21 147
04 Mar 16 3.44 Eldorado Gold EGO(ELD.TO) 2.99 -0.45 -13
02 Jun 16 0.74 Minco Silver Corp MISVF(MSV.TO) 0.78 0.04 5
2) 04 Aug 16 0.82 Solitario Exploration XPL(SLR.TO) 0.66 0.89 BUY .49(.66) -0.16 -19
3) 08 Dec 16 3.02 Eldorado Gold* EGO(ELD.TO) 3.34 4.49 BUY NONE 0.32 11
4) 08 Dec 16 0.82 Minco Silver Corp* MISVF(MSV.TO) 0.79 1.08 BUY NONE -0.03 -4
1) 04 Mar 10 1.10 Leading Edge Materials LEMIF(LEM.V) 0.40 0.52 BUY NONE -0.70 -64
2) 04 Mar 16 0.28 Midas Gold MDRPF(MAX.TO) 0.68 0.92 BUY .44(.59) 0.40 141
3) 09 Jun 16 0.66 Fission Uranium FCUUF(FCU.TO) 0.51 0.67 BUY .30(.40) -0.15 -22
4) 04 Aug 16 1.41 Almaden Minerals AAU(AMM.TO) 1.01 1.35 BUY NONE -0.40 -28
5) 04 Aug 16 0.39 Millrock Resources MLRKF(MRO.V) 0.35 0.47 BUY .19(.25) -0.04 -10
6) 12 Dec 16 1.71 Bear Creek Mining*** BCEKF(BCM.V) 1.83 2.48 BUY NONE 0.12 7
1) 04 Mar 16 2.22 Canopy Growth Corp TWMJF(CGC.TO) 7.00 9.39 HOLD 3.72(5) 4.78 215
21 Mar 16 1.39 AeroGrow Int'l AERO 3.49 2.10 151
21 Mar 16 0.21 Terra Tech TRTC 0.25 0.04 19
2) 19 Apr 16 1.17 Aphria APHQF(APH.V) 3.81 5.11 BUY on pullbacks only 3(4.03) 2.64 226
3) 19 Apr 16 2.35 Cannabis Sativa CBDS 5.73 BUY on pullbacks only 3.5 3.38 144
19 Apr 16 1.27 Mettrum Health MQTRF(MT.V) 4.92 3.65 288
4) 19 Apr 16 0.81 OrganiGram Holdings OGRMF(OGI.V) 2.04 2.74 HOLD 1.12(1.50) 1.23 152
5) 02 Jun 16 0.87 MassRoots Inc MSRT 1.05 BUY 0.5 0.18 21
6) 04 Jan 17 3.20 Kush Bottles**** KSHB 3.20 Try to buy below 3.30 NONE 0.00 0
*"Buy" reinstated by IWB of 8 Dec 16 **Recommended in IWB of 8 Dec 16 ***Recommended in IWB of 12 Dec 16 ****Recommended in this issue
LIST 6 NATURAL RESOURCE STOCKS (High Risk,High Potential Capital Gains)
POTLUCK STOCKS
Stopped out @ .25 on 22 Nov 16
Sold @ 3.49 on 8 Dec 16**
Sold @ 4.924 on 8 Dec 16**
LIST 7
LIST 3
NEARER-TERM TRADING (High Risk, High Potential Gains)
LOW-PRICED STOCKS (Very High Risk, Very High Potential Capital Gains) LIST 5
Stopped out @ 11 on 14 Nov 16
Stopped out @ 18 on 11 Nov 16
LIST 4
Stopped out @ .78 on 11 Nov 16
Stopped out @ 2.99 on 10 Nov 16
TDL'S SUPERVISED INVESTMENT LISTSCLOSING PRICE ON:
LIST 1 GOOD GRADE (Moderate Capital Gains, Moderate Risk, Moderate Income, Good Long-Term Fundamentals)
3 Jan 17
LIST 2 LONG-TERM GROWTH (Large Capital Gains, Moderate Risk, Low Income, Strong Long-Term Fundamentals)
PRECIOUS METALS (Maintain This Blue-Chip "Core Position" In All Portfolios)