Embed Size (px)
Citation preview

2017 Annual
HEDIS/ CAHPS Report Comparative Analysis of Audited Results from TennCare MCOs
August 2017

2017 HEDIS/CAHPS REPORT
page 2 TN Division of Health Care Finance and Administration │ TennCare 17.EQRO.06.017
Table of Contents List of Tables .............................................................. 4 List of Figures ............................................................ 6 Acknowledgements, Acronyms and Initialisms ........ 10 Executive Summary .................................................. 13 Background .............................................................. 14
HEDIS Measures—Domains of Care ....................... 14 Effectiveness of Care Measures ............................. 14 Prevention and Screening ......................................... 15 Respiratory Conditions ............................................. 17 Cardiovascular Conditions ........................................ 18 Diabetes ................................................................ 18 Musculoskeletal Conditions ....................................... 19 Behavioral Health .................................................... 19 Medication Management ........................................... 21 Overuse/Appropriateness ......................................... 21 Measures Collected Through CAHPS Health Plan Survey 22 Access/Availability of Care Measures .................... 22 Utilization and Risk-Adjusted Utilization .................. 24 Experience of Care ................................................ 25 CAHPS Health Plan Survey 5.0H Adult Version (CPA) and 5.0H Child Version (CPC) ......................................... 25 Children With Chronic Conditions (CCC) ..................... 26 Health Plan Descriptive Information Measures ..... 27 Measures Collected Using Electronic Clinical Data
Systems (ECDS) ................................................. 27
Medicaid Results ...................................................... 28 Statewide Performance ......................................... 28 Individual Plan Performance—HEDIS Measures .... 37 Individual Plan Performance—CAHPS .................... 47
Medicaid HEDIS Trending—Statewide Weighted Rates ..................................................................... 51 Effectiveness of Care Measures .................................. 52
Prevention and Screening .................................. 52 Respiratory Conditions ...................................... 62 Cardiovascular Conditions .................................. 67 Diabetes .......................................................... 69 Musculoskeletal Conditions ................................. 71 Behavioral Health ............................................. 72 Medication Management .................................... 76 Overuse/Appropriateness ................................... 77
Access/Availability of Care Measures .......................... 79 Utilization Measures ................................................. 84
CHIP HEDIS/CAHPS Results ..................................... 85 APPENDIX A | Utilization Measure Medicaid Results and
Benchmarks ........................................................ A-1 Utilization Additional Measure Descriptions ........ A-1 Utilization Measures: Medicaid Plan-Specific
Rates/National Benchmarks............................. A-3 APPENDIX B | HEDIS 2016 National Medicaid Means
and Percentiles ................................................... B-1 APPENDIX C | MCO Medicaid Population in Member
Months ................................................................ C-1 APPENDIX D | Measure Reporting Options ................ D-1

2017 HEDIS/CAHPS REPORT Table of Contents
page 3 TN Division of Health Care Finance and Administration │ TennCare 17.EQRO.06.017
APPENDIX E | Additional CHIP Measures, Frequencies, and Population by Member Months ..................... E-1 Additional Utilization Measures: CHIP Plan-Specific
Rates ................................................................ E-1 Utilization Measures: CHIP—Antibiotic Utilization:
Total (ABX) ...................................................... E-5 Health Plan Descriptive Information ................. E-10 HPA Population in CHIP Member Months ........... E-10
2017 HEDIS/CAHPS REPORT
page 4 TN Division of Health Care Finance and Administration │ TennCare 17.EQRO.06.017
List of Tables Table CIS. Combination Vaccinations for Childhood Immunization Status (CIS) ................................................................. 16
Table 1a. HEDIS 2017 State to National Medicaid Rates: Effectiveness of Care Measures .................................................... 29
Table 1b. HEDIS 2017 State to National Medicaid Rates: Measures Where Lower Rates Indicate Better Performance ................. 34
Table 2. HEDIS 2017 State to National Medicaid Rates: Access/Availability of Care Measures .............................................. 35
Table 3. HEDIS 2017 State to National Medicaid Rates: Utilization Measures ..................................................................... 36
Table 4. HEDIS 2017 Rating Color and Measure Designations ......................................................................................... 37
Table 5a. HEDIS 2017 Plan-Specific Medicaid Rates: Effectiveness of Care Measures ......................................................... 38
Table 5b. HEDIS 2017 Plan-Specific Medicaid Rates: Effectiveness of Care Measures Where Lower Rates Indicate Better Performance ...................................................................................................................................................... 45
Table 6. HEDIS 2017 Plan-Specific Medicaid Rates: Access/Availability of Care Measures .................................................... 45
Table 7. HEDIS 2017 Plan-Specific Medicaid Rates: Utilization Measures .......................................................................... 47
Table 8. 2017 CAHPS Rating Color and Measure Designations ......................................................................................... 47
Table 9. 2017 CAHPS 5.0H Adult Medicaid Survey Results .............................................................................................. 48
Table 10. 2017 CAHPS 5.0H Child Medicaid Survey Results (General Population) ............................................................... 49
Table 11. 2017 CAHPS 5.0H Child Medicaid Survey Results (Children with Chronic Conditions) ............................................ 50
Table 12. HEDIS 2017 CHIP Rates .............................................................................................................................. 85
Table 13. HEDIS 2017 CHIP Rates Where Lower Rates Indicate Better Performance ........................................................... 88
Table 14. 2017 CAHPS 5.0H Child CHIP Survey Results (General Population) .................................................................... 89
Table 15. 2017 CAHPS 5.0H Child CHIP Survey Results (Children with Chronic Conditions) ................................................. 89
Table A. HEDIS 2017 Medicaid Plan-Specific Rates with HEDIS 2016 National Benchmarks: Utilization Measures .................. A-3
Table B. HEDIS 2016 National Medicaid Means and Percentiles ..................................................................................... B-1
Table C1. HEDIS 2017 MCO Medicaid Population Reported in Member Months by Age and Sex—AG .................................... C-1
Table C2. HEDIS 2017 MCO Medicaid Population Reported in Member Months by Age and Sex—BC and TCS ....................... C-2
Table C3. HEDIS 2017 MCO Medicaid Population Reported in Member Months by Age and Sex—UHC .................................. C-4
Table D. 2017 Measure reporting options: Administrative/Hybrid .................................................................................. D-1

2017 HEDIS/CAHPS REPORT List of Tables
page 5 TN Division of Health Care Finance and Administration │ TennCare 17.EQRO.06.017
Table E1. HEDIS 2017 Utilization Measures: CHIP—FPC and W15 .................................................................................. E-1
Table E2. HEDIS 2017 Utilization Measures: CHIP—Frequency of Selected Procedures (FSP) ............................................. E-1
Table E3. HEDIS 2017 Utilization Measures: CHIP—Ambulatory Care: Total (AMB) .......................................................... E-2
Table E4a. HEDIS 2017 Utilization Measures: CHIP—Inpatient Utilization General Hospital/Acute Care: Total (IPU) .............. E-2
Table E4b. HEDIS 2017 Utilization Measures: CHIP—Inpatient Utilization General Hospital/Acute Care: Total (IPU) ................. E-3
Table E5. HEDIS 2017 Utilization Measures: CHIP—Total IAD and Total MPT Rates .......................................................... E-3
Table E6. HEDIS 2017 Utilization Measures: CHIP—Antibiotic Utilization ......................................................................... E-5
Table E7. HEDIS 2017 Utilization Measures: CHIP—Antibiotics of Concern Utilization........................................................ E-7
Table E8. HEDIS 2017 Utilization Measures: CHIP—All Other Antibiotics Utilization .......................................................... E-8
Table E8. HEDIS 2017 Utilization Measures: CHIP—Standardize Healthcare-Associated Infection Ratio (HAI) ....................... E-9
Table E9. Board Certification (BCR) ......................................................................................................................... E-10
Table E10. HPA CHIP Population in Member Months ................................................................................................... E-10

2017 HEDIS/CAHPS REPORT
page 6 TN Division of Health Care Finance and Administration │ TennCare 17.EQRO.06.017
List of Figures Fig. 1. Adult BMI Assessment (ABA) .................. 52
Fig. 2. Weight Assessment and Counseling for Nutrition and Physical Activity for Children/Adolescents (WCC)— BMI Percentile: 3–11 years ........................... 52
Fig. 3. WCC—BMI Percentile: 12–17 years .......... 52
Fig. 4. WCC—BMI Percentile: Total .................... 52
Fig. 5. WCC—Counseling for Nutrition: 3–11 years ................................................... 53
Fig. 6. WCC—Counseling for Nutrition: 12–17 years ................................................... 53
Fig. 7. WCC—Counseling for Nutrition: Total ....... 53
Fig. 8. WCC—Counseling for Physical Activity: 3–11 years ................................................... 53
Fig. 9. WCC—Counseling for Physical Activity: 12–17 years .............................................. 54
Fig. 10. WCC—Counseling for Physical Activity: Total ................................................... 54
Fig. 11. Childhood Immunization Status (CIS): DTap ................................................... 54
Fig. 12. CIS: IPV .............................................. 54
Fig. 13. CIS: MMR............................................. 55
Fig. 14. CIS: HiB .............................................. 55
Fig. 15. CIS: HepB ............................................ 55
Fig. 16. CIS: VZV ............................................. 55
Fig. 17. CIS: PCV .............................................. 56
Fig. 18. CIS: HepA ............................................ 56
Fig. 19. CIS: RV ............................................... 56
Fig. 20. CIS: Flu ............................................... 56
Fig. 21. CIS: Combination 2 ............................... 57
Fig. 22. CIS: Combination 3 ............................... 57
Fig. 23. CIS: Combination 4 ............................... 57
Fig. 24. CIS: Combination 5 ............................... 57
Fig. 25. CIS: Combination 6 ............................... 58
Fig. 26. CIS: Combination 7 ............................... 58
Fig. 27. CIS: Combination 8 ............................... 58
Fig. 28. CIS: Combination 9 ............................... 58
Fig. 29. CIS: Combination 10 ............................. 59
Fig. 30. Immunizations for Adolescents (IMA): Meningococcal ...................................... 59
Fig. 31. IMA: Tdap/Td ....................................... 59
Fig. 32. HPV: Adolescents .................................. 59
Fig. 33. IMA: Combination 1 ............................... 60
Fig. 34. Lead Screening in Children (LSC) ............ 60
Fig. 35. Breast Cancer Screening (BCS) ............... 60
Fig. 36. Cervical Cancer Screening (CCS) ............. 60
Fig. 37. Chlamydia Screening in Women (CHL): 16–20 years .............................................. 61

2017 HEDIS/CAHPS REPORT List of Figures
page 7 TN Division of Health Care Finance and Administration │ TennCare 17.EQRO.06.017
Fig. 38. CHL: 21–24 years ................................. 61
Fig. 39. CHL: Total ............................................ 61
Fig. 40. Appropriate Testing for Children With Pharyngitis (CWP) ................................. 62
Fig. 41. Use of Spirometry Testing in the Assessment and Diagnosis of COPD (SPR) .................. 62
Fig. 42. Pharmacotherapy Management of COPD Exacerbation (PCE): Systemic Corticosteroid ....................................... 62
Fig. 43. PCE: Bronchodilator ............................... 62
Fig. 44. Medication Management for People With Asthma (MMA)—Medication Compliance 50%: 5–11 years .................................. 63
Fig. 45. MMA—Medication Compliance 50%: 12–18 years ................................................... 63
Fig. 46. MMA—Medication Compliance 50%: 19-50 years ................................................... 63
Fig. 47. MMA—Medication Compliance 50%: 51–64 years ................................................... 63
Fig. 48. MMA—Medication Compliance 50%: Total . 64
Fig. 49. MMA—Medication Compliance 75%: 5–11 years ................................................... 64
Fig. 50. MMA—Medication Compliance 75%: 12–18 years ................................................... 64
Fig. 51. MMA—Medication Compliance 75%: 19–50 years ................................................... 64
Fig. 52. MMA—Medication Compliance 75%: 51–64 years ................................................... 65
Fig. 53. MMA—Medication Compliance 75%: Total . 65
Fig. 54. Asthma Medical Ratio (AMR): 5–11 years . 65
Fig. 55. AMR: 12–18 years ................................. 65
Fig. 56. AMR: 19–50 years ................................. 66
Fig. 57. AMR: 51–64 years ................................. 66
Fig. 58. AMR: Total ........................................... 66
Fig. 59. Controlling High Blood Pressure (CBP) ...... 67
Fig. 60. Persistence of Beta-Blocker Treatment After a Heart Attack (PBH) ............................. 67
Fig. 61. SPC—Received Statin Therapy: Males 21-75 years ................................................... 67
Fig. 62. SPC—Received Statin Therapy: Females 40 -75 years .............................................. 67
Fig. 63. SPC—Received Statin Therapy: Total ....... 68
Fig. 64. SPC—Statin Adherence 80%: Males 21-75 years ................................................... 68
Fig. 65. SPC—Statin Adherence 80%: Females 40 -75 years .............................................. 68
Fig. 66. SPC—Statin Adherence 80%: Total .......... 68
Fig. 67. Comprehensive Diabetes Care (CDC): HbA1c Testing ................................................ 69
Fig. 68. CDC: HbA1c Control (<7.0%) ................. 69
Fig. 69. CDC: HbA1c Control (<8.0%) ................. 69
Fig. 70. CDC: Retinal Eye Exam Performed ........... 69
Fig. 71. CDC: Medical Attention for Nephropathy ... 70

2017 HEDIS/CAHPS REPORT List of Figures
page 8 TN Division of Health Care Finance and Administration │ TennCare 17.EQRO.06.017
Fig. 72. CDC: Blood Pressure Control (<140/90 mm Hg) ..................................................... 70
Fig. 73. CDC: HbA1c Poor Control (>9.0%)* ........ 70
Fig. 74. SPD—Received Statin Therapy: 40-75 years ................................................... 70
Fig. 75. SPD—Statin Adherence 80%: 40-75 years 71
Fig. 76. Disease-Modifying Anti-Rheumatic Drug Therapy for Rheumatoid Arthritis (ART) .... 71
Fig. 77. Antidepressant Medication Management (AMM): Effective Acute Phase Treatment .. 72
Fig. 78. AMM: Effective Continuation Phase Treatment ............................................ 72
Fig. 79. Follow-Up Care for Children Prescribed ADHD Medication (ADD): Initiation Phase .......... 72
Fig. 80. ADD: Continuation and Maintenance Phase 72
Fig. 81. Follow-Up After Hospitalization for Mental Illness (FUH): 7-Day Follow-Up ............... 73
Fig. 82. FUH: 30-Day Follow-Up .......................... 73
Fig. 83. Diabetes Screening for People With Schizophrenia or Bipolar Disorder Who Are Using Antipsychotic Medication (SSD) ........ 73
Fig. 84. Diabetes Monitoring for People With Diabetes and Schizophrenia (SMD) ....................... 73
Fig. 85. Cardiovascular Monitoring for People With Cardiovascular Disease and Schizophrenia (SMC) .................................................. 74
Fig. 86. Adherence to Antipsychotic Medications for Individuals With Schizophrenia (SAA) ....... 74
Fig. 87. Metabolic Monitoring for Children and Adolescents on Antipsychotics (APM): 1-5 Years ................................................... 74
Fig. 88. APM: 6-11 Years ................................... 74
Fig. 89. APM: 12-17 Years ................................. 75
Fig. 90. APM: Total ........................................... 75
Fig. 91. Annual Monitoring for Patients on Persistent Medications (MPM): ACE Inhibitors or ARBs ................................................... 76
Fig. 92. MPM: Digoxin ....................................... 76
Fig. 93. MPM: Diuretics ...................................... 76
Fig. 94. MPM: Total ........................................... 76
Fig. 95. Non-Recommended Cervical Cancer Screening in Adolescent Females (NCS)* .. 77
Fig. 96. Appropriate Treatment for Children With Upper Respiratory Infection (URI) ............ 77
Fig. 97. Avoidance of Antibiotic Treatment in Adults With Acute Bronchitis (AAB) ................... 77
Fig. 98. Use of Imaging Studies for Low Back Pain (LBP) ................................................... 77
Fig. 99. Use of Multiple Concurrent Antipsychotics in Children and Adolescents (APC): 1-5 Years* ................................................. 78
Fig. 100. APC: 6-11 Years* .................................. 78
Fig. 101. APC: 12-17 Years* ................................ 78
Fig. 102. APC: Total* .......................................... 78

2017 HEDIS/CAHPS REPORT List of Figures
page 9 TN Division of Health Care Finance and Administration │ TennCare 17.EQRO.06.017
Fig. 103. Adults’ Access to Preventive/Ambulatory Health Services (AAP): 20–44 years ......... 79
Fig. 104. AAP: 45–64 years ................................. 79
Fig. 105. Children and Adolescents’ Access to Primary Care Practitioners (CAP): 12–24 months ... 79
Fig. 106. CAP: 25 months–6 years ........................ 79
Fig. 107. CAP: 7–11 years ................................... 80
Fig. 108. CAP: 12–19 years ................................. 80
Fig. 109. Initiation and Engagement of Alcohol and Other Drug (AOD) Dependence Treatment (IET)—Initiation of AOD Treatment: 13–17 years ................................................... 80
Fig. 110. IET—Initiation of AOD Treatment: ≥18 years ................................................... 80
Fig. 111. IET—Initiation of AOD Treatment: Total .... 81
Fig. 112. IET—Engagement of AOD Treatment: 13–17 years ................................................... 81
Fig. 113. IET—Engagement of AOD Treatment: ≥18 years ................................................... 81
Fig. 114. IET—Engagement of AOD Treatment: Total ................................................... 81
Fig. 115. Prenatal and Postpartum Care (PPC): Timeliness of Prenatal Care .................... 82
Fig. 116. PPC: Postpartum Care ............................ 82
Fig. 117. Use of First-Line Psychosocial Care for Children and Adolescents on Antipsychotics (APP): 1-5 Years ................................... 82
Fig. 118. APP: 6-11 Years .................................... 82
Fig. 119. APP: 12-17 Years .................................. 83
Fig. 120. APP: Total ............................................ 83
Fig. 121. Frequency of Ongoing Prenatal Care (FPC): ≥ 81% ................................................ 84
Fig. 122. Well-Child Visits in the First 15 Months of Life (W15): 6 or More Visits .................... 84
Fig. 123. Well-Child Visits in the Third, Fourth, Fifth and Sixth Years of Life (W34) ................. 84
Fig. 124. Adolescent Well-Care Visits (AWC) ........... 84

2017 HEDIS/CAHPS REPORT
page 10 TN Division of Health Care Finance and Administration │ TennCare 17.EQRO.06.017
Acknowledgements, Acronyms and Initialisms1,2 AAB ........................... Avoidance of Antibiotic Treatment in
Adults With Acute Bronchitis
AAP ..................................... Adults’ Access to Preventive/ Ambulatory Health Services
ABA .............................................. Adult BMI Assessment
ABX ................................................. Antibiotic Utilization
ACE ................................. Angiotensin Converting Enzyme
ADD ....................................... Follow-Up Care for Children Prescribed ADHD Medication
ADHD .................... Attention-Deficit/Hyperactivity Disorder
AHRQ .............. Agency for Healthcare Research and Quality
AG ......... Amerigroup Community Care, Inc., as Amerigroup
AGE/AGM/AGW .......................... AG in the Tennessee East, Middle and West Grand Regions
AMB ...................................................... Ambulatory Care
AMI........................................ Acute Myocardial Infarction
AMM ..................... Antidepressant Medication Management
AMR ........................................... Asthma Medication Ratio
AOD ............................................... Alcohol or Other Drug
APC .................... Use of Multiple Concurrent Antipsychotics in Children and Adolescents
1 The source for data contained in this publication is Quality Compass® 2016 and is used with the permission of the National Committee for Quality Assurance (NCQA).Quality Compass 2016 includes certain CAHPS data. Any data display, analysis, interpretation, or conclusion based on these data is solely that of the authors, and NCQA specifically disclaims responsibility for any such display, analysis, interpretation, or conclusion. Quality Compass is a registered trademark of NCQA. CAHPS® is a registered trademark of the Agency for Healthcare Research and Quality (AHRQ). 2 Other company and product names may be trademarks of the respective companies with which they are associated. The mention of such companies and product names is with due recognition and without intent to misappropriate such names or marks.
APM ................................ Metabolic Monitoring for Children and Adolescents on Antipsychotics
APP ......................... Use of First-Line Psychosocial Care for Children and Adolescents on Antipsychotics
ARB ..................................... Angiotensin Receptor Blocker
ART .............................. Disease-Modifying Anti-Rheumatic Drug Therapy for Rheumatoid Arthritis
AWC ....................................... Adolescent Well-Care Visits
BC ................................... Volunteer State Health Plan, Inc, as BlueCare Tennessee
BCE/BCM/BCW .......................... BC in the Tennessee East, Middle and West Grand Regions
BCS ........................................... Breast Cancer Screening
BlueCare®; BlueCare TennesseeSM ........ registered or service marks of The BlueCross BlueShield Association
BlueCross BlueShield of Tennessee; BlueCare ........ licensees of The BlueCross BlueShield Association
BMI ...................................................... Body Mass Index
BP ........................................................... Blood Pressure
BR ............................................................... Biased Rate
CAHPS® .................. refers to the Consumer Assessment of Healthcare Providers and Systems

2017 HEDIS/CAHPS REPORT Acknowledgements, Acronyms and Initialisms
page 11 TN Division of Health Care Finance and Administration │ TennCare 17.EQRO.06.017
CAP ............................ Children and Adolescents’ Access to Primary Care Practitioners
CBP ................................. Controlling High Blood Pressure
CCC ................................ Children With Chronic Conditions
CCS ......................................... Cervical Cancer Screening
CDC ................................... Comprehensive Diabetes Care
CHL ................................. Chlamydia Screening in Women
CIS ...................................Childhood Immunization Status
CPA .............. CAHPS Health Plan Survey 5.0H Adult Version
CPC .............. CAHPS Health Plan Survey 5.0H Child Version
COPD ..................... Chronic Obstructive Pulmonary Disease
CVD ............................................. Cardiovascular Disease
CWP ......... Appropriate Testing for Children With Pharyngitis
CY ............................................................ Calendar Year
DMARD .................. Disease-Modifying Anti-Rheumatic Drug
DTaP ........................................... Diphtheria, Tetanus and Acellular Pertussis Vaccination
ECDS ............................... Electronic Clinical Data Systems
ED .............................................. Emergency Department
ENP ........................................ Enrollment by Product Line
Flu .................................................................. Influenza
FPC ............................ Frequency of Ongoing Prenatal Care
FSP ................................. Frequency of Selected Procedure
FUH .......... Follow-Up After Hospitalization for Mental Illness
FUM ................... Follow-Up After ED Visit for Mental Illness
FUA ...................... Follow-Up After ED Visit for Alcohol and Other Drug Dependence
FVA ..................... Flu vaccinations for adults ages 18 to 64
HbA1c .................................... Hemoglobin A1c, also called Glycosylated Hemoglobin, Glycohemoglobin
HEDIS® ....... refers to the Healthcare Effectiveness Data and Information Set and is a registered trademark of NCQA
HCFA ............................................. Tennessee Division of Health Care Finance and Administration
HepA ............................................ Hepatitis A Vaccination
HepB ............................................ Hepatitis B Vaccination
HiB .............. H (Haemophilus) Influenza Type B Vaccination
HPV ................................... Human Papillomavirus Vaccine
HTN ........................................................... Hypertension
IAD .......... Identification of Alcohol and Other Drug Services
IET ...................................... Initiation and Engagement of AOD Dependence Treatment
IMA ................................... Immunizations for Adolescents
IP; IPU ............................................................Inpatient; IP Utilization – General Hospital/Acute Care
IPV ....................................................... Polio Vaccination
LBP .................... Use of Imaging Studies for Low Back Pain
LDL-C ......................... Low-Density Lipoprotein Cholesterol
LSC ........................................ Lead Screening in Children
MCO ...................................... Managed Care Organization
MMA .......... Medication Management for People With Asthma
MMR .................... Measles, Mumps and Rubella Vaccination
MPM ................................... Annual Monitoring for Patients on Persistent Medications
MPT ............................................ Mental Health Utilization

2017 HEDIS/CAHPS REPORT Acknowledgements, Acronyms and Initialisms
page 12 TN Division of Health Care Finance and Administration │ TennCare 17.EQRO.06.017
MSC ......................... Medical Assistance With Smoking and Tobacco Use Cessation
MY ..................................................... Measurement Year
NA ........................................................... Not Applicable
NB ................................................................ No Benefit
NCQA ................. National Committee for Quality Assurance
NCQA HEDIS Compliance Audit™ .......... trademark of NCQA
NCS ............................Non-Recommended Cervical Cancer Screening in Adolescent Females
NR ............................................................. Not Reported
NQ ............................................................. Not Required
OB-GYN .................................... Obstetrician-Gynecologist
PBH ........................ Persistence of Beta-Blocker Treatment After a Heart Attack
PCE ..... Pharmacotherapy Management of COPD Exacerbation
PCP ........................................... Primary Care Practitioner
PCV .......................... Pneumococcal Conjugate Vaccination
PMPY ............................................... Per Member Per Year
PPC .................................... Prenatal and Postpartum Care
Qsource® ...................................... a registered trademark
Quality Compass® ............. a registered trademark of NCQA, the comprehensive national database of health plans’ HEDIS and CAHPS results
R .................................................................. Reportable
RA .................................................. Rheumatoid Arthritis
RV ................................................. Rotavirus Vaccination
SAA ...................... Adherence to Antipsychotic Medications for Individuals With Schizophrenia
SMC .......................... Cardiovascular Monitoring for People With Cardiovascular Disease and Schizophrenia
SMD .................................. Diabetes Monitoring for People With Diabetes and Schizophrenia
SPC .......................... Statin Therapy for Patients With CVD
SPD .................... Statin Therapy for Patients With Diabetes
SPR ................................. Use of Spirometry Testing in the Assessment and Diagnosis of COPD
SSD .................................... Diabetes Screening for People With Schizophrenia or Bipolar Disorder
Who Are Using Antipsychotic Medications
Strep ........................................................ Streptococcus
TennCare ................. HCFA Medicaid program in Tennessee
Td; Tdap ................... Tetanus, Diphtheria Toxoids Vaccine; Td and Acellular Pertussis Vaccine
TCS ....................... Volunteer State Health Plan, Inc. d.b.a. TennCareSelect statewide
UHC ..................................... UnitedHealthcare Plan of the River Valley, Inc. d.b.a. UnitedHealthcare
UHCE/UHCM/UHCW ................. UHC in the Tennessee East, Middle and West Grand Regions
UN ............................................................... Un-Audited
URI ............. Upper Respiratory Infection, and the measure: Appropriate Treatment for Children With URI
VZV ..................... Chicken Pox/Varicella Zoster Vaccination
W15 .............. Well-Child Visits in the First 15 Months of Life
W34 ................. Well-Child Visits in the Third, Fourth, Fifth, and Sixth Years of Life
WCC .......... Weight Assessment and Counseling for Nutrition and Physical Activity for Children/Adolescents

2017 HEDIS/CAHPS REPORT
page 13 TN Division of Health Care Finance and Administration │ TennCare 17.EQRO.06.017
Executive Summary Medicaid managed care organizations (MCOs) are required to report a full Healthcare Effectiveness Data and Information Set (HEDIS) as a part of the accreditation mandates in Tennessee. The HEDIS requirement is an integral part of the accreditation process of the National Committee for Quality Assurance (NCQA). In 2006, Tennessee became the first state in the nation requiring all MCOs to become accredited by NCQA, an independent, not-for-profit organization that assesses and scores MCO performance on important dimensions of care and service in a broad range of health issues.
More than 90% of health plans in America use the HEDIS tool because its standardized measures of MCO performance allow comparisons to national averages and benchmarks as well as between a state’s MCOs, and over time. The Consumer Assessment of Healthcare Providers and Systems (CAHPS) set of standardized surveys is included in HEDIS to measure members’ satisfaction with their care. This 2017 HEDIS/CAHPS Report summarizes the results for the MCOs contracting with TennCare, the Medicaid program of the Tennessee Division of Health Care Finance and Administration (HCFA).
For an overview of the performance of TennCare’s MCOs, a calculated weighted average of the scores of all those reporting is provided alongside national averages in the Statewide
Performance section. MCO-specific measures are presented in the Individual Plan Performance section for cross-comparison with color-coding for national and state benchmark comparison where available/applicable. Weighted average performances of Tennessee’s MCOs since 2006 on certain measures are presented in the HEDIS Trending section. The HEDIS and CAHPS results for CoverKids, Tennessee’s Children’s Health Insurance Plan (CHIP) are reported separately in CHIP HEDIS/CAHPS Results.
Appendix A contains a comprehensive table of plan-specific results for HEDIS 2017 Utilization Measures and HEDIS 2016 national benchmarks. The table in Appendix B contains the HEDIS 2016 National Medicaid Means and Percentiles for reference to these benchmarks, and the table in Appendix C reveals populations reported by MCOs in member months by age and sex for HEDIS 2017. Appendix D presents the reporting options for each measure, whether administrative, hybrid or both. Appendix E offers additional utilization measures, frequencies and population by member months for the CHIP.

2017 HEDIS/CAHPS REPORT
page 14 TN Division of Health Care Finance and Administration │ TennCare 17.EQRO.06.017
Background HEDIS Measures—Domains of Care HEDIS is an important tool designed to ensure the public has the information needed to reliably compare the performance of managed healthcare plans. Standardized methodologies incorporating statistically valid samples of members ensure the integrity of measure reporting and help purchasers make more reliable, relevant comparisons between health plans. HEDIS measures are subject to a NCQA HEDIS Compliance Audit that must be conducted by an NCQA-certified HEDIS Compliance Auditor under the auspices of an NCQA-licensed organization. This ensures the integrity of the HEDIS collection and calculation process at each MCO through an overall information systems capabilities assessment, followed by an evaluation of the ability to comply with HEDIS specifications.
The HEDIS rates presented in this report refer to data collected during the review period of the previous calendar year (CY), from January 1 to December 31. For HEDIS 2017 results, CY2016 was the review period. Similarly, comparative data presented in this report from the HEDIS 2016 Medicaid Means and Percentiles reflect data procured during CY2015.
HEDIS 2017 assesses care across body systems, access to and satisfaction with healthcare services and specific utilization
through a total of 91 measures (Commercial, Medicare and Medicaid) across seven domains of care:
♦ Effectiveness of Care ♦ Access/Availability of Care ♦ Utilization and Risk Adjusted Utilization ♦ Relative Resource Use ♦ Experience of Care (CAHPS Survey Results) ♦ Health Plan Descriptive Information ♦ Measures Collected Using Electronic Clinical Data
Systems (ECDS)
The following brief descriptions of selected HEDIS measures were extracted from NCQA’s HEDIS 2017 Volume 2: Technical Specifications, which includes additional information related to each measure. The measures presented in this report reflect data submitted from the following domains of care: Effectiveness of Care, Access/Availability of Care, Utilization, and Experience of Care. Per NCQA, Relative Resource Use measures were not collected for HEDIS 2017.
Effectiveness of Care Measures The measures in the Effectiveness of Care domain assess the quality of clinical care delivered within an MCO. Measures in this domain address how well the MCO delivers widely accepted preventive services and recommended screening for common diseases. The domain also includes some measures for
2017 HEDIS/CAHPS REPORT Background
page 15 TN Division of Health Care Finance and Administration │ TennCare 17.EQRO.06.017
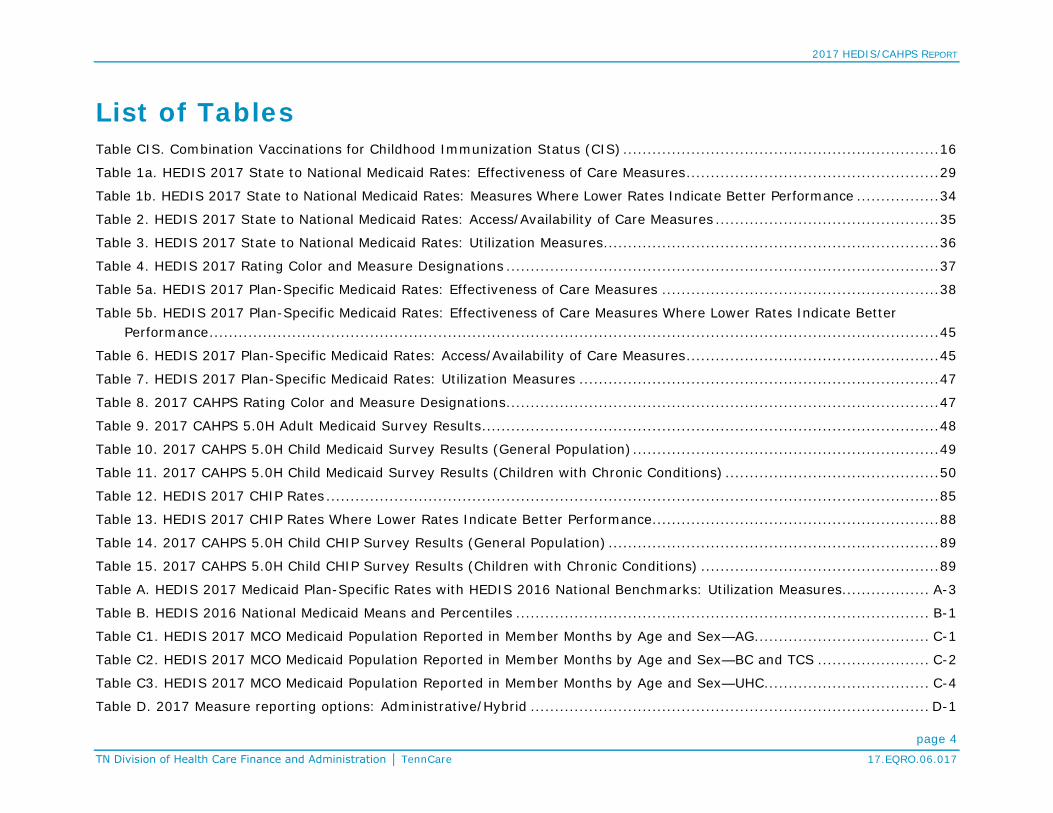
overuse and patient safety and addresses four major aspects of clinical care:
1. How well the MCO delivers preventive services and keeps members healthy
2. Whether members are offered the most up-to-date treatments for acute episodes of illness and get better
3. How well the MCO delivers care and assistance with coping to members with chronic diseases
4. Whether members can get appropriate tests
Starting with HEDIS 2008 reporting, Effectiveness of Care measures were grouped into more specific clinical categories, which have slightly changed:
♦ Prevention and Screening ♦ Respiratory Conditions ♦ Cardiovascular Conditions ♦ Diabetes ♦ Musculoskeletal Conditions ♦ Behavioral Health ♦ Medication Management ♦ Overuse/Appropriateness ♦ Measures collected by the CAHPS Health Plan Survey
Only certain measures from these categories are presented in this report, which does not include the additional category in this domain specific to Medicare. For some measures, eligible members cannot have more than one gap in continuous enrollment of up to 45 days during the measurement year (MY).
Prevention and Screening Immunization measures follow guidelines for immunizations from the Centers for Disease Control and Prevention and the Advisory Committee on Immunization Practices. HEDIS implements changes (e.g., new recommendations) after three years, to account for the measures’ look-back period and to allow the industry time to adapt to new guidelines.
Adult BMI Assessment (ABA) ABA measures the percentage of members 18 to 74 years of age who had an outpatient visit and whose body mass index (BMI) was documented during the MY or the year prior to the MY.
Weight Assessment and Counseling for Nutrition and Physical Activity for Children/ Adolescents (WCC) WCC measures the percentage of members 3 to 17 years of age who had an outpatient visit with a primary care practitioner (PCP) or obstetrician-gynecologist (OB-GYN) and who had evidence of BMI percentile documentation, counseling for nutrition and counseling for physical activity during the MY. Note: Because BMI norms for youth vary with age and gender, this measure evaluates whether BMI percentile is assessed not an absolute BMI value.
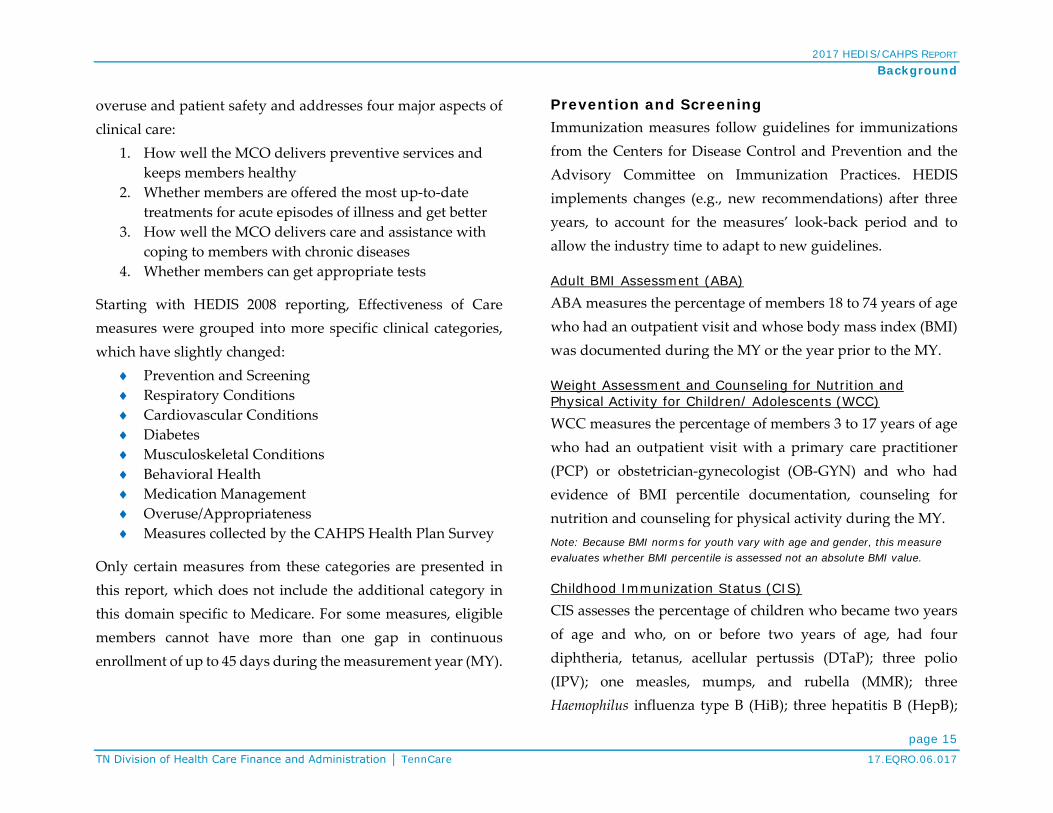
Childhood Immunization Status (CIS) CIS assesses the percentage of children who became two years of age and who, on or before two years of age, had four diphtheria, tetanus, acellular pertussis (DTaP); three polio (IPV); one measles, mumps, and rubella (MMR); three Haemophilus influenza type B (HiB); three hepatitis B (HepB);
2017 HEDIS/CAHPS REPORT Background
page 16 TN Division of Health Care Finance and Administration │ TennCare 17.EQRO.06.017
one chicken pox/varicella zoster (VZV); four pneumococcal conjugate (PCV); one hepatitis A (HepA); two or three rotavirus (RV); and two influenza (Flu) vaccines. The measure calculates a rate for each vaccine and nine separate combination rates numbered 2 to 10 as shown in Table CIS.
Table CIS. Combination Vaccinations for Childhood Immunization Status (CIS) # DTaP IPV MMR HiB HepB VZV PCV HepA RV Flu 2 3 4 5 6
7 8
9
10
Immunizations for Adolescents (IMA) IMA measures the percentage of adolescents 13 years of age who had one dose of meningococcal vaccine and one dose of tetanus, diphtheria toxoids and acellular pertussis vaccine (Tdap), and three doses of the human papillomavirus vaccine (HPV) by the 13th birthday, calculating the rate for each vaccine and two combinations: meningococcal and Tdap/Td; and meningococcal, Tdap/Td and HPV.
IMA criteria was revised for HEDIS 2017 to remove polysaccharide vaccines. The HPV measure for female adolescents was retired for HEDIS 2017 and
incorporated into IMA. Revised to indicate that prior year rates may not be used to reduce the sample for IMA hybrid methodology.
Lead Screening in Children (LSC) LSC assesses the percentage of children two years of age who had one or more capillary or venous lead blood tests for lead poisoning on or before the second birthday.
Breast Cancer Screening (BCS) BCS measures the percentage of female members 50 to 74 years of age who had a mammogram to screen for breast cancer between October 1 two years prior to the MY, and through December 31 of the MY.
Note: This measure does not include biopsies, breast ultrasounds, MRIs or diagnostic screenings because they are not appropriate methods for primary breast cancer screening. HEDIS 2016 added new value sets to identify bilateral mastectomy.
Cervical Cancer Screening (CCS) CCS measures the percentage of women 21 to 64 years of age who were appropriately screened for cervical cancer using either of the following criteria: ♦ Women age 21–64 who had cervical cytology performed
every three years ♦ Women age 30–64 who had cervical cytology/HPV
co-testing performed every five years
Note: For HEDIS 2017, medical record requirements clarified that reflex testing would not meet criteria for hybrid specification.

2017 HEDIS/CAHPS REPORT Background
page 17 TN Division of Health Care Finance and Administration │ TennCare 17.EQRO.06.017
Chlamydia Screening in Women (CHL) CHL assesses the percentage of women 16 to 24 years of age who were identified as sexually active and who had at least one test for chlamydia during the MY. This measure calculates a total rate as well as two age stratifications:
♦ Women age 16–20 ♦ Women age 21–24
Respiratory Conditions
Appropriate Testing for Children With Pharyngitis (CWP) CWP measures the percentage of children 3 to 18 years of age who were diagnosed with pharyngitis, dispensed an antibiotic prescription on or during the three days after the episode date, and received a group A streptococcus (strep) test for the episode. A higher rate represents better performance (i.e., appropriate testing).
Use of Spirometry Testing in the Assessment and Diagnosis of COPD (SPR) SPR reports the percentage of members 40 years of age and older with a new diagnosis or newly active chronic obstructive pulmonary disease (COPD) who received appropriate spirometry testing to confirm the diagnosis.
Pharmacotherapy Management of COPD Exacerbation (PCE) PCE assesses the percentage of COPD exacerbation for members 40 years of age and older who had an acute inpatient (IP) discharge or emergency department (ED) visit on or
between January 1 and November 30 of the MY and who were dispensed appropriate medications. Two rates are reported: ♦ Dispensed a systemic corticosteroid (or there was evidence
of an active prescription) within 14 days of the event ♦ Dispensed a bronchodilator (or there was evidence of an
active prescription) within 30 days of the event
Note: The eligible population for this measure is based on acute IP discharges and ED visits, not on members. The denominator may include multiple events for the same individual. For HEDIS 2017, the exclusion was deleted for Episode Dates when there was a readmission or an ED visit within 14 days.
Medication Management for People With Asthma (MMA) MMA records the percentage of members 5 to 64 years of age during the MY who were identified as having persistent asthma and were dispensed appropriate medications that they remained on during the treatment period.
Two rates are reported for the percentage of members who remained on an asthma controller medication:
♦ For at least 50% of their treatment period ♦ For at least 75% of their treatment period
For MMA, a total rate and four age stratifications are reported: ♦ 5–11 years ♦ 19–50 years ♦ 12–18 years ♦ 51–64 years
Asthma Medication Ratio (AMR) AMR assesses the percentage of members 5 to 64 years of age who were identified as having persistent asthma and had a ratio

2017 HEDIS/CAHPS REPORT Background
page 18 TN Division of Health Care Finance and Administration │ TennCare 17.EQRO.06.017
of controller medications to total asthma medications of 0.50 or greater during the MY. This measure calculates a total rate as well as four age stratifications:
♦ 5–11 years ♦ 19–50 years ♦ 12–18 years ♦ 51–64 years
Cardiovascular Conditions
Controlling High Blood Pressure (CBP) CBP reports the percentage of members 18 to 85 years of age who had a diagnosis of hypertension (HTN) and whose blood pressure (BP) was adequately controlled during the MY, a single rate based on a sum of the following criteria groups by age: ♦ Members 18–59 years whose BP was <140/90 mm Hg ♦ Members 60–85 years with a diagnosis of diabetes whose
BP was <140/90 mm Hg ♦ Members 60–85 years without a diagnosis of diabetes
whose BP was <150/90 mm Hg
Persistence of Beta-Blocker Treatment After a Heart Attack (PBH) PBH measures the percentage of members 18 years of age and older during the measurement year who were hospitalized and discharged from July 1 of the year prior to the measurement year to June 30 of the measurement year with a diagnosis of acute myocardial infarction (AMI) and who received persistent beta-blocker treatment for six months after discharge.
Statin Therapy for Patients With Cardiovascular Disease (SPC) SPC reports the percentage of members identified as having clinical atherosclerotic cardiovascular disease (CVD) and who met the following criteria: ♦ Received Statin Therapy—Members who were dispensed
at least one high or moderate-intensity statin medication during the MY
♦ Statin Adherence 80%—Members who remained on a high or moderate-intensity statin medication for at least 80% of the treatment period
For SPC, a total rate and two stratifications of gender and age (as of December 31 of the MY) are reported:
♦ Males 21–75 years ♦ Females 40–75 years
Diabetes
Comprehensive Diabetes Care (CDC) The CDC composite of seven rates measures an MCO’s performance on clinical management in aspects of diabetic care through the percentage of a single sample of diabetic members (type 1 and type 2) 18 to 75 years of age who met the criteria by having the following during the MY:
♦ Hemoglobin A1c (HbA1c) blood test ♦ Poorly controlled diabetes (HbA1c >9.0%)
Note: a lower rate indicates better performance (i.e., low rates of poor control indicate better care)
♦ Controlled diabetes (most recent HbA1c <8.0%)
2017 HEDIS/CAHPS REPORT Background
page 19 TN Division of Health Care Finance and Administration │ TennCare 17.EQRO.06.017
♦ Controlled diabetes (most recent HbA1c <7.0%) for a selected population
♦ Eye exam (retinal) ♦ Medical attention for nephropathy ♦ Controlled blood pressure (<140/90 mm Hg)
Note: HEDIS 2017 added glycohemoglobin, glycated hemoglobin and glycosylated hemoglobin as acceptable HbA1c tests.
Statin Therapy for Patients With Diabetes (SPD) SPD reports the percentage of members 40 to 75 years of age who do not have atherosclerotic CVD and met the following criteria reported as two rates: ♦ Received Statin Therapy—Members who were dispensed at
least one statin medication of any intensity during the MY ♦ Statin Adherence 80%—Members who remained on a
statin medication of any intensity for at least 80% of the treatment period
Musculoskeletal Conditions
Disease-Modifying Anti-Rheumatic Drug Therapy for Rheumatoid Arthritis (ART) ART assesses whether members who were diagnosed with rheumatoid arthritis (RA) were prescribed a disease-modifying anti-rheumatic drug (DMARD) to attenuate the damaging progression, reduce inflammation and improve functional status. The rate is the percentage of members diagnosed with RA, and not HIV or pregnancy, who were dispensed at least one ambulatory prescription for a DMARD during the MY.
Behavioral Health
Antidepressant Medication Management (AMM) AMM measures the percentage of members 18 years of age and older who were treated with antidepressant medication, had a diagnosis of major depression and who remained on an antidepressant medication treatment. Two rates are reported: ♦ Effective Acute Phase Treatment—The percentage who
remained on medication for a at least 84 days (12 weeks) ♦ Effective Continuation Phase Treatment—The percentage who
remained on medication for at least 180 days (6 months)
Follow-Up Care for Children Prescribed ADHD Medication (ADD) ADD assesses the percentage of children newly prescribed attention-deficit/hyperactivity disorder (ADHD) medication who had at least three follow-up care visits within a 10-month period, one of these visits must have been within 30 days of the earliest ambulatory prescription dispensed for ADHD medication, at which time the member must have been 6 to 12 years of age. Two rates are reported: ♦ Initiation Phase—The percentage who had one follow-up
visit with a practitioner with prescribing authority during the 30-day Initiation Phase
♦ Continuation and Maintenance Phase—The percentage who remained on the medication for at least 210 days and who, in addition to the Initiation Phase follow-up, had at

2017 HEDIS/CAHPS REPORT Background
page 20 TN Division of Health Care Finance and Administration │ TennCare 17.EQRO.06.017
least two follow-up visits with a practitioner within 270 days (nine months) of the end of the Initiation Phase
Follow-Up After Hospitalization for Mental Illness (FUH) FUH examines continuity of care for mental illness through the percentage of discharges for members six years of age and older who were hospitalized for selected mental illness diagnoses and who had a follow-up visit with a mental health practitioner. Two rates are reported as the percentage of discharges for which the member received follow-up within the following:
♦ 7 days of discharge ♦ 30 days of discharge
Follow-Up After Emergency Department Visit for Mental Illness (FUM) FUM is the percentage of members 6 years of age and older with a principal diagnosis of mental illness, who had a follow-up visit for mental illness. Two rates are reported as the percentage of ED visits for which the member received follow-up within the following:
♦ 7 days of discharge ♦ 30 days of discharge
Follow-Up After Emergency Department Visit for Alcohol and Other Drug Dependence (FUA) FUA is the percentage of members 6 years of age and older with a principal diagnosis of mental illness, who had a follow-up visit for mental illness. Two rates are reported as the percentage of ED visits for which the member received follow-up within the following:
♦ 7 days of discharge ♦ 30 days of discharge
For FUA, a total rate and two age stratifications are reported: ♦ 13–17 years ♦ 18 years and older
Diabetes Screening for People With Schizophrenia or Bipolar Disorder Who Are Using Antipsychotic Medications (SSD) SSD measures the percentage of members 18 to 64 years of age with schizophrenia or bipolar disorder who were dispensed an antipsychotic medication and had a diabetes screening test during the MY.
Diabetes Monitoring for People With Diabetes and Schizophrenia (SMD) SMD is the percentage of members 18 to 64 years of age with schizophrenia and diabetes who had both a low-density lipoprotein cholesterol (LDL-C) test and an HbA1c test during the MY.
Cardiovascular Monitoring for People With Cardiovascular Disease and Schizophrenia (SMC) SMC reports the percentage of members 18 to 64 years of age with schizophrenia and CVD who had an LDL-C test during the MY.
Adherence to Antipsychotic Medications for Individuals With Schizophrenia (SAA) SAA assesses the percentage of members with schizophrenia who were 19 to 64 years of age during the MY who were dispensed and remained on an antipsychotic medication for at least 80% of their treatment period.
2017 HEDIS/CAHPS REPORT Background
page 21 TN Division of Health Care Finance and Administration │ TennCare 17.EQRO.06.017
Metabolic Monitoring for Children and Adolescents on Antipsychotics (APM) APM measures the percentage of children and adolescents 1 to 17 years of age who had two or more antipsychotic prescriptions and had metabolic testing. It calculates a total rate as well as three age stratifications:
♦ 1–5 years ♦ 12–17 years ♦ 6–11 years
Medication Management
Annual Monitoring for Patients on Persistent Medications (MPM) MPM reports the percentage of members 18 years of age and older who received at least 180 treatment days of ambulatory medication therapy for a select therapeutic agent during the MY and at least one therapeutic monitoring event for the therapeutic agent in the MY. Three rates are reported separately and as a sum total rate: ♦ Annual monitoring for members on angiotensin
converting enzyme (ACE) inhibitors or angiotensin receptor blocker (ARB)
♦ Annual monitoring for members on digoxin ♦ Annual monitoring for members on diuretics
Overuse/Appropriateness
Non-Recommended Cervical Cancer Screening in Adolescent Females (NCS) NCS records the percentage of adolescent females 16 to 20 years of age who were screened unnecessarily for cervical cancer.
Note: A lower rate indicates better performance.
Appropriate Treatment for Children With Upper Respiratory Infection (URI) This measures the percentage of children 3 months to 18 years of age who were given a diagnosis of upper respiratory infection (URI) and were not dispensed an antibiotic prescription. This measure is reported as an inverted rate [1 - (numerator/eligible population)], with a higher rate indicating appropriate treatment of children with URI (i.e., the proportion for whom antibiotics were not prescribed).
Avoidance of Antibiotic Treatment in Adults With Acute Bronchitis (AAB) AAB reports the percentage of adults 18 to 64 years of age with a diagnosis of acute bronchitis who were not dispensed an antibiotic prescription. This measure is reported as an inverted rate [1 - (numerator/eligible population)], with a higher rate indicating appropriate treatment of adults with acute bronchitis (i.e., the proportion for whom antibiotics were not prescribed).

2017 HEDIS/CAHPS REPORT Background
page 22 TN Division of Health Care Finance and Administration │ TennCare 17.EQRO.06.017
Use of Imaging Studies for Low Back Pain (LBP) LBP assesses the percentage of members with a primary diagnosis of low back pain who did not have an imaging study (plain X-ray, MRI, CT scan) within 28 days of the diagnosis. This measure is reported as an inverted rate [1 - (numerator/eligible population)], with a higher rate indicating an appropriate treatment of low back pain (i.e., the proportion for whom imaging studies did not occur).
Use of Multiple Concurrent Antipsychotics in Children and Adolescents (APC) APC measures the percentage of children and adolescents 1 to 17 years of age who were on two or more concurrent antipsychotic medications. This measure calculates a total rate as well as three age stratifications:
♦ 1–5 years ♦ 12–17 years ♦ 6–11 years
Note: For this measure, a lower rate indicates better performance (i.e., low rates of concurrent antipsychotics indicate better care).
Measures Collected Through CAHPS Health Plan Survey
Flu vaccinations for adults ages 18 to 64 (FVA) FVA reports the percentage of members 18 to 64 years of age who received a flu vaccination between July 1 of the MY and the date when the CAHPS Health Plan Survey 5.0H Adult Version (CPA) was completed.
Medical Assistance With Smoking and Tobacco Use Cessation (MSC) This measure is collected using the survey methodology to arrive at a rolling average that represents the percentage of members 18 years of age and older who were current smokers or tobacco users seen during the MY.
MSC assesses the following facets of providing medical assistance with smoking and tobacco use cessation: ♦ Advising Smokers and Tobacco Users to Quit—Those who
received advice to quit ♦ Discussing Cessation Medications—Those for whom
cessation medications were recommended or discussed ♦ Discussing Cessation Strategies—Those for whom cessation
methods or strategies were provided or discussed
Percentage of Current Smokers is not a HEDIS performance measure, but provides additional information to support analysis of other MSC data. The MCOs started reporting this data in 2015 in CAHPS results; subsequently, the rates have been added to this report.
Access/Availability of Care Measures The measures in the Access/Availability of Care domain evaluate how members access important and basic services of their MCO. Included are measures of overall access, how many

2017 HEDIS/CAHPS REPORT Background
page 23 TN Division of Health Care Finance and Administration │ TennCare 17.EQRO.06.017
members are actually using basic MCO services, and the use and availability of specific services.
Adults’ Access to Preventive/Ambulatory Health Services (AAP) This measures the percentage of members 20 years and older who had an ambulatory or preventive care visit during the MY to assess whether adult members have access to/receive such services. MCOs report a total rate and three age stratifications:
♦ 20–44 years ♦ 45–64 years
♦ ≥ 65 years
Note: Rates for adults 65 years of age and older are not included in this report as those services would be provided by Medicare. Because the total rate would include this age group, it has been excluded from this report as well.
Children and Adolescents’ Access to Primary Care Practitioners (CAP) CAP assesses general access to care for children and adolescents through the percentage of members 12 months to 6 years of age who had a visit with a PCP (e.g., pediatrician, family physician) during the MY, and members 7 to 19 years of age who had a visit with a PCP during the MY or the year prior. MCOs report four separate percentages:
♦ 12–24 months ♦ 25 months – 6 years
♦ 7–11 years ♦ 12–19 years
Initiation and Engagement of Alcohol and Other Drug Dependence Treatment (IET) IET assesses adolescent and adult members 13 years of age and older who demonstrated a new episode of alcohol or other drug (AOD) dependence and received the following:
♦ Initiation of AOD Treatment—Initial treatment through an inpatient AOD admission, outpatient visit, intensive outpatient encounter or patient hospitalization within 14 days of diagnosis
♦ Engagement of AOD Treatment—Two or more services with an AOD diagnosis within 30 days of the initiation visit in addition to initiating treatment
MCOs report a total rate and two age stratifications for each: ♦ 13–17 years ♦ ≥ 18 years
Prenatal and Postpartum Care (PPC) PPC measures the percentage of live birth deliveries between November 6 of the year prior to the MY and November 5 of the MY. For these women, the composite assesses the percentage of deliveries where members received the following PPC facets: ♦ Timeliness of Prenatal Care—Received a prenatal care visit
as a member of the MCO in the first trimester or within 42 days of MCO enrollment
♦ Postpartum Care—Had a postpartum visit on or between 21 and 56 days after delivery
Use of First-Line Psychosocial Care for Children and Adolescents on Antipsychotics (APP) APP measures the percentage of children and adolescents 1 to 17 years of age who had a new prescription for an antipsychotic medication and had documentation of psychosocial care as
2017 HEDIS/CAHPS REPORT Background
page 24 TN Division of Health Care Finance and Administration │ TennCare 17.EQRO.06.017
first-line treatment. MCOs report a total rate and three age stratifications:
♦ 1–5 years ♦ 6–11 years
♦ 12–17 years
Utilization and Risk-Adjusted Utilization This domain name was adjusted for HEDIS 2017, but still consists of utilization measures designed to capture the frequency of certain services provided for MCOs’ internal evaluation only; NCQA does not view higher or lower service counts as indicating better or worse performance. Risk-Adjusted Utilization measures are for commercial or Medicare lines, and so are not included in this report. Two kinds of measures are included in Utilization: ♦ Measures that express rates of service in per 1,000
member years/months (defined/reported in Appendix A) ♦ Measures as percentages of members receiving specified
services (similar to Effectiveness of Care Domain, defined in this section with data in the Results tables)
The two Medicaid categories (Disabled and Low-Income) for Utilization Measures are reported separately and as a total rate. However, the total rate includes the category of Medicaid and Medicare dual eligibles, and those members are part of dual-eligible special needs plans (D-SNPs) reported separately to HCFA via Qsource’s Annual HEDIS D-SNPs Report.
Frequency of Ongoing Prenatal Care (FPC) FPC is the percentage of members who delivered a child between November 6 of the year prior to the MY and November 5 of the MY, and received the expected number of prenatal care visits. This measure uses the same denominator, structure and calculation guidelines as PPC. Rates are reported by the percentage of expected visits:
♦ < 21% ♦ 21– 40% ♦ 41– 60%
♦ 61– 80% ♦ ≥ 81%
Well-Child Visits in the First 15 Months of Life (W15) W15 assesses the percentage of members who turned 15 months old during the MY and who had the following number of well-child visits with a PCP during their first 15 months of life: zero, one, two, three, four, five, or six or more. This measure uses the same structure and calculation guidelines as those in the Effectiveness of Care domain.
Well-Child Visits in the Third, Fourth, Fifth and Sixth Years of Life (W34) W34 reports the percentage of members who were 3 to 6 years of age who had one or more well-child visits with a PCP during the MY. This measure uses the same structure and calculation guidelines as those in the Effectiveness of Care domain.
Adolescent Well-Care Visits (AWC) AWC assesses the percentage of enrolled members 12 to 21 years of age who had at least one comprehensive well-care visit

2017 HEDIS/CAHPS REPORT Background
page 25 TN Division of Health Care Finance and Administration │ TennCare 17.EQRO.06.017
with a PCP or an OB-GYN practitioner during the MY. This measure uses the same structure and calculation guidelines as those in the Effectiveness of Care domain.
Experience of Care For a plan’s results in this domain to be considered reliable, the Medicaid MCO must follow one of the standard CAHPS protocols or an enhanced protocol approved by NCQA. Details regarding this calculation methodology and the questions used in each composite are included in HEDIS 2016, Volume 3: Specifications for Survey Measures.
CAHPS Health Plan Survey 5.0H Adult Version (CPA) and 5.0H Child Version (CPC) The CPA and CPC are tools for measuring consumer healthcare satisfaction with the quality of care and customer service provided by their MCOs.
These survey tools include five composites asked of members (CPA) or parents of child members (CPC):
♦ Getting Needed Care ♦ Getting Care Quickly ♦ How Well Doctors Communicate ♦ Customer Service ♦ Shared Decision Making
Each composite category represents an overall aspect of plan quality, how well the MCO meets members’ expectations.
There are four global rating questions that use a 0–10 scale to assess overall experience:
♦ Rating of All Health Care ♦ Rating of Personal Doctor ♦ Rating of Specialist Seen Most Often ♦ Rating of Health Plan
For these scaled responses, a 0 represents the ‘worst possible’ and 10 represents the ‘best possible’ healthcare received in the last six months. Summary rates represent the percentage of members who responded with a 9 or 10. Additional Health Promotion and Education as well as Coordination of Care questions use the same calculations.
For any given CPA and CPC question used in a composite, the percentage of respondents answering in a certain way is calculated for each MCO. Summary rates represent the percentage of members who responded in the most positive way, as defined by NCQA. The following descriptions provide a brief explanation of the five composite categories.
Getting Needed Care The Getting Needed Care Composite measures the ease with which members were able to access care, tests, or treatments needed in the last 6 months. The summary rate represents the percentage of members who responded ‘Always’ or ‘Usually’ to specified questions.

2017 HEDIS/CAHPS REPORT Background
page 26 TN Division of Health Care Finance and Administration │ TennCare 17.EQRO.06.017
Getting Care Quickly The Getting Care Quickly Composite measures the ease with which members were able to access care quickly, including getting appointments as soon as needed, in the last 6 months. The summary rate represents the percentage of members who responded ‘Always’ or ‘Usually’ to specified questions.
How Well Doctors Communicate The How Well Doctors Communicate Composite evaluates provider-patient communications for the last 6 months by asking members how often their personal doctor listens carefully, explains things in a way to easily understand, shows respect for what they have to say and spends enough time with them. The summary rate represents the percentage of members who responded ‘Always’ or ‘Usually’ to specified questions.
Customer Service The Customer Service Composite measures how often members were able to get information and help from an MCO and how well they were treated by the MCO’s customer service in the last 6 months. The summary rate represents the percentage of members who responded ‘Always’ or ‘Usually’ to specified questions.
Shared Decision Making The Shared Decision Making Composite measures how often doctors offered choices regarding healthcare, mentioned the good and bad things associated with each treatment option, the
extent to which doctors requested input regarding healthcare preferences, and how often doctors involved members in the decision-making process, according to their preference. The summary rate represents the percentage of members who responded ‘Yes’ to specified questions. Means and variances are not calculated for this composite.
Children With Chronic Conditions (CCC) The CAHPS Consortium decided in 2002 to integrate a new set of items in the 3.0H version of the CAHPS Health Plan Survey child questionnaires (now 5.0H) to better address the needs of children with chronic conditions, commonly referred to as children with special healthcare needs. CCC is designed for children with a chronic physical, developmental, behavioral or emotional condition and who also require health and related services of a type or amount beyond that generally required by children. Three composites summarize parents’ satisfaction with basic components of care essential for successful treatment, management and support of children with chronic conditions: ♦ Access to Specialized Services ♦ Family Centered Care: Personal Doctor Who Knows Child ♦ Coordination of Care for CCC
Summary rates are reported for each composite and are reported individually for two concepts: ♦ Access to Prescription Medicines ♦ Family Centered Care: Getting Needed Information
2017 HEDIS/CAHPS REPORT Background
page 27 TN Division of Health Care Finance and Administration │ TennCare 17.EQRO.06.017
Health Plan Descriptive Information Measures These measures help describe an MCO’s structure, staffing and enrollment—factors that contribute to its ability to provide effective healthcare to Medicaid members.
Enrollment by Product Line (ENP) ENP reports the total number of members enrolled in the product line, stratified by age and gender (for the MCOs, reported as ENPA: Total Medicaid). These results are included in Appendix D as population in member months by MCO and Tennessee Grand Region served.
Measures Collected Using Electronic Clinical Data Systems (ECDS) This domain requires automated and accessible data by the healthcare team at the point of care, data shared between clinicians and health plans to promote quality improvement across the care continuum. To qualify for HEDIS ECDS reporting, the data must use standard layouts, meet the measure specification requirements and the information must be accessible by the care team responsible for the member’s healthcare needs.
This domain is not required to be reported by the MCOs, hence, not included in this report.

2017 HEDIS/CAHPS REPORT
page 28 TN Division of Health Care Finance and Administration │ TennCare 17.EQRO.06.017
Medicaid Results Statewide Performance In conjunction with NCQA accreditation, TennCare MCOs are required to submit a full set of audited HEDIS measures to NCQA and TennCare each year. For HEDIS 2017, this included the statewide MCO Volunteer State Health Plan, Inc., doing business as TennCareSelect (TCS), and three statewide MCOs doing business in each respective Grand Region (East, Middle and West): Amerigroup Community Care, Inc., as Amerigroup (AG—AGE, AGM and AGW); Volunteer State Health Plan, Inc., as BlueCare Tennessee (BC—BCE, BCM and BCW); and UnitedHealthcare Plan of the River Valley, Inc., as UnitedHealthcare (UHC—UHCE, UHCM and UHCW).
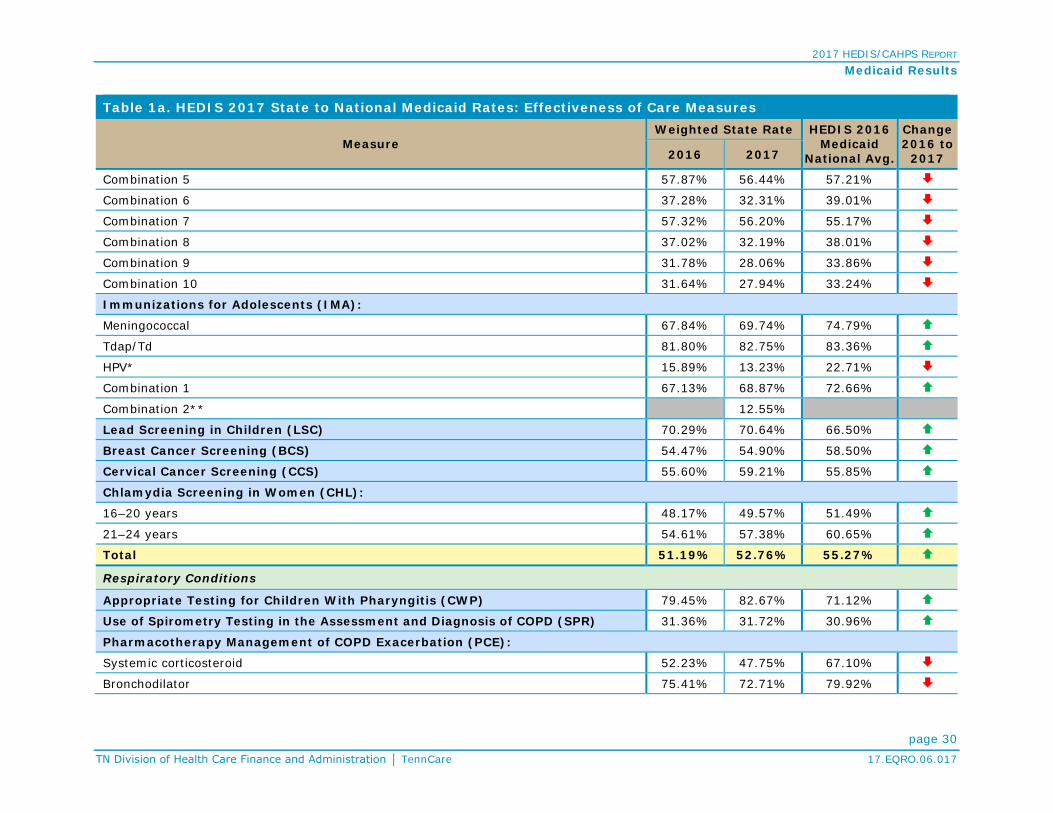
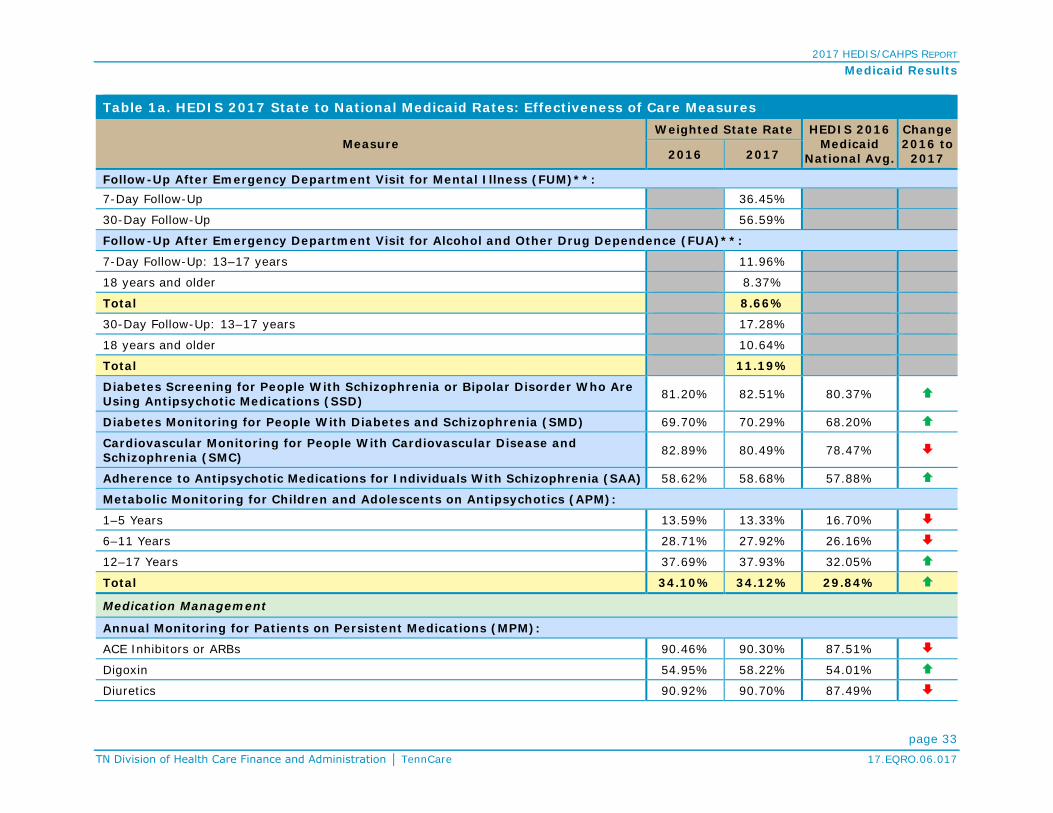
Tables 1 (a and b), 2 and 3 summarize the weighted average TennCare score for each of the selected HEDIS 2016 and HEDIS 2017 measures as well as the HEDIS 2016 Medicaid National Average. The Medicaid National Average represents the sum of the reported rates divided by the total number of health plans
reporting the rate. Weighted state rates are determined by applying the size of the eligible population within each plan to their overall results. Using this methodology, plan-specific findings contribute to the TennCare statewide estimate, proportionate to eligible population size.
Where possible in Tables 1 (a and b), 2 and 3, the statewide changes for each measure reported during both HEDIS 2016 and HEDIS 2017 are presented. The column titled ‘Change 2016 to 2017’ indicates whether there was an improvement () or a decline () in statewide performance for the measure from HEDIS 2016 to HEDIS 2017. Cells are shaded gray for those measures that were not calculated or for which data were not reported. Each year some measures’ technical specifications change. Based on whether the changes are significant or minor, the measures may need to be trended with caution or may not be able to be trended. At the time this report was finalized, NCQA did not determine the ability for 2017 measures to be trended.

2017 HEDIS/CAHPS REPORT Medicaid Results
page 29 TN Division of Health Care Finance and Administration │ TennCare 17.EQRO.06.017
Table 1a. HEDIS 2017 State to National Medicaid Rates: Effectiveness of Care Measures
Measure Weighted State Rate HEDIS 2016
Medicaid National Avg.
Change 2016 to
2017 2016 2017
Prevention and Screening
Adult BMI Assessment (ABA) 82.46% 86.96% 80.77%
Weight Assessment and Counseling for Nutrition and Physical Activity for Children/Adolescents (WCC):
BMI Percentile: 3–11 years 71.33% 75.08% 64.83%
12–17 years 65.74% 71.33% 63.19%
Total 69.55% 73.88% 64.37%
Counseling for Nutrition: 3–11 years 62.76% 66.25% 61.62%
12–17 years 54.98% 61.33% 57.30%
Total 60.29% 64.66% 60.22%
Counseling for Physical Activity: 3–11 years 53.08% 55.64% 52.40%
12–17 years 54.47% 59.45% 55.24%
Total 53.59% 56.89% 53.44%
Childhood Immunization Status (CIS):
DTaP/DT 76.91% 73.60% 76.33%
IPV 91.23% 89.47% 87.70%
MMR 88.46% 86.49% 89.21%
HiB 88.77% 86.28% 87.62%
HepB 92.14% 90.60% 87.70%
VZV 88.52% 86.55% 88.79%
PCV 79.20% 75.52% 76.53%
HepA 87.18% 85.67% 83.70%
RV 69.62% 68.68% 67.94%
Influenza 42.86% 37.56% 45.74%
Combination 2 74.27% 70.82% 72.46%
Combination 3 71.08% 68.02% 68.99%
Combination 4 70.27% 67.66% 65.91%
2017 HEDIS/CAHPS REPORT Medicaid Results
page 30 TN Division of Health Care Finance and Administration │ TennCare 17.EQRO.06.017
Table 1a. HEDIS 2017 State to National Medicaid Rates: Effectiveness of Care Measures
Measure Weighted State Rate HEDIS 2016
Medicaid National Avg.
Change 2016 to
2017 2016 2017
Combination 5 57.87% 56.44% 57.21%
Combination 6 37.28% 32.31% 39.01%
Combination 7 57.32% 56.20% 55.17%
Combination 8 37.02% 32.19% 38.01%
Combination 9 31.78% 28.06% 33.86%
Combination 10 31.64% 27.94% 33.24%
Immunizations for Adolescents (IMA):
Meningococcal 67.84% 69.74% 74.79%
Tdap/Td 81.80% 82.75% 83.36%
HPV* 15.89% 13.23% 22.71%
Combination 1 67.13% 68.87% 72.66%
Combination 2** 12.55%
Lead Screening in Children (LSC) 70.29% 70.64% 66.50%
Breast Cancer Screening (BCS) 54.47% 54.90% 58.50%
Cervical Cancer Screening (CCS) 55.60% 59.21% 55.85%
Chlamydia Screening in Women (CHL):
16–20 years 48.17% 49.57% 51.49%
21–24 years 54.61% 57.38% 60.65%
Total 51.19% 52.76% 55.27%
Respiratory Conditions
Appropriate Testing for Children With Pharyngitis (CWP) 79.45% 82.67% 71.12%
Use of Spirometry Testing in the Assessment and Diagnosis of COPD (SPR) 31.36% 31.72% 30.96%
Pharmacotherapy Management of COPD Exacerbation (PCE):
Systemic corticosteroid 52.23% 47.75% 67.10%
Bronchodilator 75.41% 72.71% 79.92%

2017 HEDIS/CAHPS REPORT Medicaid Results
page 31 TN Division of Health Care Finance and Administration │ TennCare 17.EQRO.06.017
Table 1a. HEDIS 2017 State to National Medicaid Rates: Effectiveness of Care Measures
Measure Weighted State Rate HEDIS 2016
Medicaid National Avg.
Change 2016 to
2017 2016 2017
Medication Management for People With Asthma (MMA): Medication Compliance 50%***: 5–11 years 54.71% 50.03%
12–18 years 51.61% 51.10% 19–50 years 60.00% 54.39% 51–64 years 66.13% 65.73%
Total 55.05% 51.60%
Medication Compliance 75%: 5–11 years 26.87% 24.38% 28.33%
12–18 years 26.63% 25.20% 26.33% 19–50 years 38.38% 30.06% 37.72% 51–64 years 42.90% 46.15% 50.01%
Total 29.35% 26.28% 32.67%
Asthma Medical Ratio (AMR): 5–11 years 77.09% 80.13% 70.15% 12–18 years 64.97% 71.17% 59.13% 19–50 years 48.93% 44.53% 48.90% 51–64 years 45.36% 45.32% 51.72%
Total 66.25% 67.93% 59.67%
Cardiovascular Conditions
Controlling High Blood Pressure (CBP) 55.10% 55.63% 54.74%
Persistence of Beta-Blocker Treatment After a Heart Attack (PBH) 75.75% 79.19% 80.43%
Statin Therapy for Patients with Cardiovascular disease (SPC)†: Received Statin Therapy: Males 21–75 years 66.61% 70.66%
Females 40–75 years 66.05% 66.32%
Total 66.34% 68.50%
Statin Adherence 80%: Males 21-75 years 56.17% 57.13%
Females 40–75 years 50.77% 53.09%
Total 53.56% 55.19%

2017 HEDIS/CAHPS REPORT Medicaid Results
page 32 TN Division of Health Care Finance and Administration │ TennCare 17.EQRO.06.017
Table 1a. HEDIS 2017 State to National Medicaid Rates: Effectiveness of Care Measures
Measure Weighted State Rate HEDIS 2016
Medicaid National Avg.
Change 2016 to
2017 2016 2017
Diabetes
Comprehensive Diabetes Care (CDC):
HbA1c Testing 82.59% 82.51% 85.94%
HbA1c Control (<7.0%) 34.64% 37.43% 32.36%
HbA1c Control (<8.0%) 47.62% 49.07% 45.54%
Retinal Eye Exam Performed 42.87% 44.87% 52.68%
Medical Attention for Nephropathy 90.89% 89.06% 90.01%
Blood Pressure Control (<140/90 mm Hg) 58.22% 58.35% 59.04%
Statin Therapy for Patients with Diabetes (SPD)†
Received Statin Therapy: 40–75 years 53.06% 54.06%
Statin Adherence 80%: 40–75 years 48.03% 50.57%
Musculoskeletal Conditions
Disease-Modifying Anti-Rheumatic Drug Therapy for Rheumatoid Arthritis (ART) 62.66% 63.65% 71.69%
Behavioral Health
Antidepressant Medication Management (AMM):
Effective Acute Phase Treatment 47.75% 46.52% 54.45%
Effective Continuation Phase Treatment 32.19% 30.56% 39.44%
Follow-Up Care for Children Prescribed ADHD Medication (ADD):
Initiation Phase 49.26% 44.95% 42.20%
Continuation and Maintenance Phase 63.14% 59.45% 50.93%
Follow-Up After Hospitalization for Mental Illness (FUH):
7-Day Follow-Up 55.95% 58.82% 43.71%
30-Day Follow-Up 70.63% 71.29% 61.29%
2017 HEDIS/CAHPS REPORT Medicaid Results
page 33 TN Division of Health Care Finance and Administration │ TennCare 17.EQRO.06.017
Table 1a. HEDIS 2017 State to National Medicaid Rates: Effectiveness of Care Measures
Measure Weighted State Rate HEDIS 2016
Medicaid National Avg.
Change 2016 to
2017 2016 2017
Follow-Up After Emergency Department Visit for Mental Illness (FUM)**: 7-Day Follow-Up 36.45%
30-Day Follow-Up 56.59%
Follow-Up After Emergency Department Visit for Alcohol and Other Drug Dependence (FUA)**:
7-Day Follow-Up: 13–17 years 11.96%
18 years and older 8.37%
Total 8.66%
30-Day Follow-Up: 13–17 years 17.28%
18 years and older 10.64%
Total 11.19%
Diabetes Screening for People With Schizophrenia or Bipolar Disorder Who Are Using Antipsychotic Medications (SSD) 81.20% 82.51% 80.37%
Diabetes Monitoring for People With Diabetes and Schizophrenia (SMD) 69.70% 70.29% 68.20%
Cardiovascular Monitoring for People With Cardiovascular Disease and Schizophrenia (SMC) 82.89% 80.49% 78.47%
Adherence to Antipsychotic Medications for Individuals With Schizophrenia (SAA) 58.62% 58.68% 57.88%
Metabolic Monitoring for Children and Adolescents on Antipsychotics (APM):
1–5 Years 13.59% 13.33% 16.70%
6–11 Years 28.71% 27.92% 26.16%
12–17 Years 37.69% 37.93% 32.05%
Total 34.10% 34.12% 29.84%
Medication Management
Annual Monitoring for Patients on Persistent Medications (MPM):
ACE Inhibitors or ARBs 90.46% 90.30% 87.51%
Digoxin 54.95% 58.22% 54.01%
Diuretics 90.92% 90.70% 87.49%
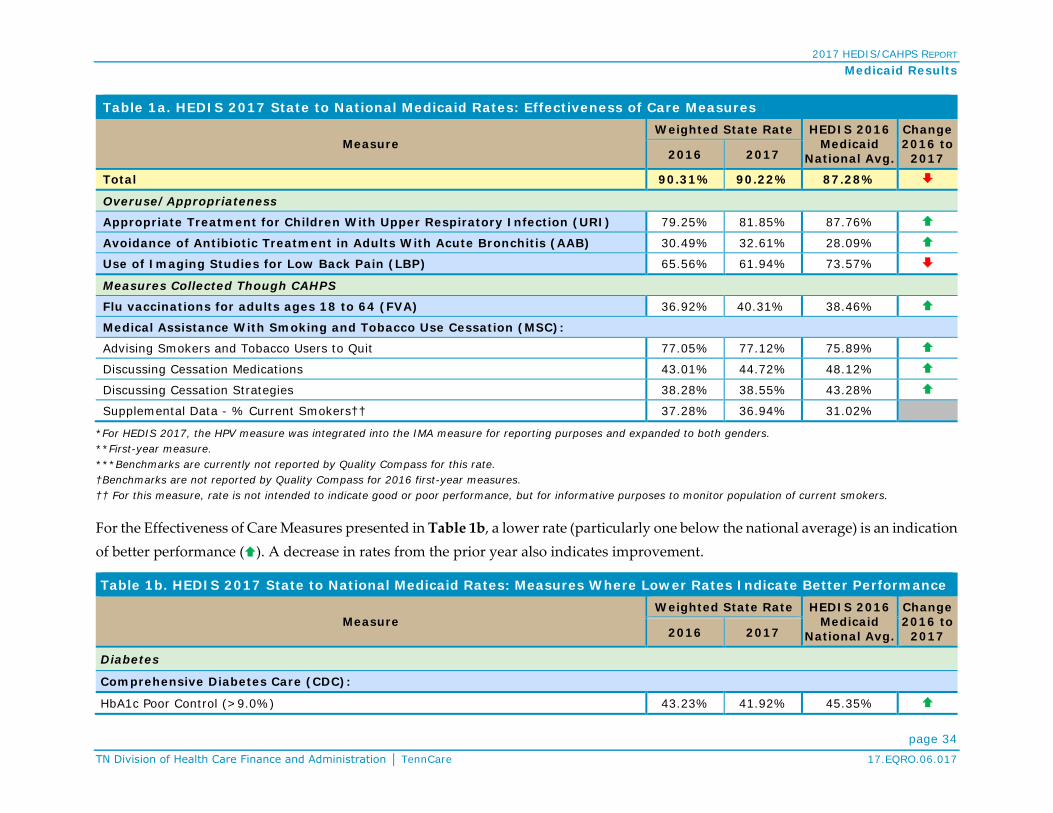
2017 HEDIS/CAHPS REPORT Medicaid Results
page 34 TN Division of Health Care Finance and Administration │ TennCare 17.EQRO.06.017
Table 1a. HEDIS 2017 State to National Medicaid Rates: Effectiveness of Care Measures
Measure Weighted State Rate HEDIS 2016
Medicaid National Avg.
Change 2016 to
2017 2016 2017
Total 90.31% 90.22% 87.28%
Overuse/Appropriateness
Appropriate Treatment for Children With Upper Respiratory Infection (URI) 79.25% 81.85% 87.76%
Avoidance of Antibiotic Treatment in Adults With Acute Bronchitis (AAB) 30.49% 32.61% 28.09%
Use of Imaging Studies for Low Back Pain (LBP) 65.56% 61.94% 73.57%
Measures Collected Though CAHPS
Flu vaccinations for adults ages 18 to 64 (FVA) 36.92% 40.31% 38.46%
Medical Assistance With Smoking and Tobacco Use Cessation (MSC):
Advising Smokers and Tobacco Users to Quit 77.05% 77.12% 75.89%
Discussing Cessation Medications 43.01% 44.72% 48.12%
Discussing Cessation Strategies 38.28% 38.55% 43.28%
Supplemental Data - % Current Smokers†† 37.28% 36.94% 31.02%
*For HEDIS 2017, the HPV measure was integrated into the IMA measure for reporting purposes and expanded to both genders. **First-year measure. ***Benchmarks are currently not reported by Quality Compass for this rate. †Benchmarks are not reported by Quality Compass for 2016 first-year measures. †† For this measure, rate is not intended to indicate good or poor performance, but for informative purposes to monitor population of current smokers.
For the Effectiveness of Care Measures presented in Table 1b, a lower rate (particularly one below the national average) is an indication of better performance (). A decrease in rates from the prior year also indicates improvement.
Table 1b. HEDIS 2017 State to National Medicaid Rates: Measures Where Lower Rates Indicate Better Performance
Measure Weighted State Rate HEDIS 2016
Medicaid National Avg.
Change 2016 to
2017 2016 2017
Diabetes
Comprehensive Diabetes Care (CDC):
HbA1c Poor Control (>9.0%) 43.23% 41.92% 45.35%

2017 HEDIS/CAHPS REPORT Medicaid Results
page 35 TN Division of Health Care Finance and Administration │ TennCare 17.EQRO.06.017
Table 1b. HEDIS 2017 State to National Medicaid Rates: Measures Where Lower Rates Indicate Better Performance
Measure Weighted State Rate HEDIS 2016
Medicaid National Avg.
Change 2016 to
2017 2016 2017
Overuse/Appropriateness
Non-Recommended Cervical Cancer Screening in Adolescent Females (NCS) 5.25% 3.83% 2.71%
Use of Multiple Concurrent Antipsychotics in Children and Adolescents (APC):
1–5 Years 1.49% 2.94% 0.66%
6–11 Years 1.71% 1.77% 1.82%
12–17 Years 3.41% 3.22% 3.00%
Total 2.78% 2.72% 2.49%
Table 2 summarizes results for the Access/Availability Domain of Care.
Table 2. HEDIS 2017 State to National Medicaid Rates: Access/Availability of Care Measures
Measure Weighted State Rate HEDIS 2016
Medicaid National Avg.
Change 2016 to
2017 2016 2017
Adults’ Access to Preventive/Ambulatory Health Services (AAP): 20–44 years 73.00% 74.37% 77.27%
45–64 years 84.97% 85.11% 85.52%
Children and Adolescents’ Access to Primary Care Practitioners (CAP): 12–24 months 91.77% 93.70% 94.69%
25 months–6 years 85.15% 84.48% 87.24%
7–11 years 91.15% 89.55% 90.23%
12–19 years 87.78% 86.19% 88.60%
Initiation and Engagement of Alcohol and Other Drug (AOD) Dependence Treatment (IET):
Initiation of AOD Treatment: 13–17 years 49.11% 48.29% 42.25%
≥18 years 33.36% 35.62% 37.94%
Total 34.22% 36.30% 38.23%
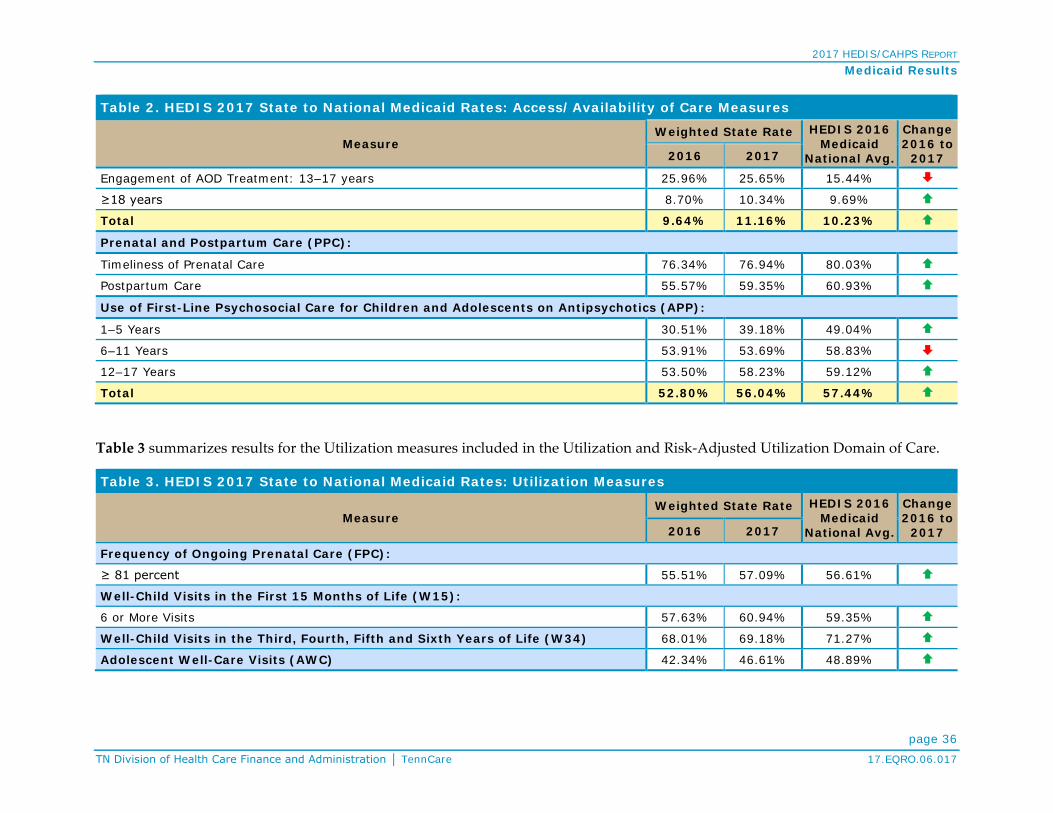
2017 HEDIS/CAHPS REPORT Medicaid Results
page 36 TN Division of Health Care Finance and Administration │ TennCare 17.EQRO.06.017
Table 2. HEDIS 2017 State to National Medicaid Rates: Access/Availability of Care Measures
Measure Weighted State Rate HEDIS 2016
Medicaid National Avg.
Change 2016 to
2017 2016 2017
Engagement of AOD Treatment: 13–17 years 25.96% 25.65% 15.44%
≥18 years 8.70% 10.34% 9.69%
Total 9.64% 11.16% 10.23%
Prenatal and Postpartum Care (PPC):
Timeliness of Prenatal Care 76.34% 76.94% 80.03%
Postpartum Care 55.57% 59.35% 60.93%
Use of First-Line Psychosocial Care for Children and Adolescents on Antipsychotics (APP):
1–5 Years 30.51% 39.18% 49.04%
6–11 Years 53.91% 53.69% 58.83%
12–17 Years 53.50% 58.23% 59.12%
Total 52.80% 56.04% 57.44%
Table 3 summarizes results for the Utilization measures included in the Utilization and Risk-Adjusted Utilization Domain of Care.
Table 3. HEDIS 2017 State to National Medicaid Rates: Utilization Measures
Measure Weighted State Rate HEDIS 2016
Medicaid National Avg.
Change 2016 to
2017 2016 2017
Frequency of Ongoing Prenatal Care (FPC):
≥ 81 percent 55.51% 57.09% 56.61%
Well-Child Visits in the First 15 Months of Life (W15):
6 or More Visits 57.63% 60.94% 59.35%
Well-Child Visits in the Third, Fourth, Fifth and Sixth Years of Life (W34) 68.01% 69.18% 71.27%
Adolescent Well-Care Visits (AWC) 42.34% 46.61% 48.89%

2017 HEDIS/CAHPS REPORT Medicaid Results
page 37 TN Division of Health Care Finance and Administration │ TennCare 17.EQRO.06.017
Individual Plan Performance—HEDIS Measures This section is intended to provide an overview of individual plan performance using appropriate and available comparison data. The results highlight those areas where each MCO is performing in relation to the HEDIS 2016 National Medicaid Means and Percentiles for select MCO-reported HEDIS measures. Qsource uses these data to determine overall TennCare plan performance in a distribution of statistical values that represent the lowest to highest percentiles achieved. For example, the 50th percentile represents the point at which half of the reported rates are below and half of the reported rates are above that value.
Tables 5 (a and b), 6 and 7 display the plan-specific performance rates for each measure selected from the Effectiveness of Care, Access/Availability of Care, and Utilization and Risk-Adjusted Utilization domains. Table 4 details the potential color-coding and measure designations used in Tables 5a through 7 to indicate the rating of the MCO percentile achieved, and provides additional related comments. While Medical Assistance With Smoking and Tobacco Use Cessation is an Effectiveness of Care measure, results are reported through the CPA as noted in Tables 1a and 5a.
Table 4. HEDIS 2017 Rating Color and Measure Designations Color Designation Percentile MCO Achieved Additional Comments
Greater than 75th No additional comments
25th to 75th No additional comments
Less than 25th No additional comments
No Rating Available Benchmarking data not available
Measure Designation Definition R Reportable, a reportable rate was submitted for the measure.
NA Not Applicable, there was a small denominator, i.e., the MCO followed the specifications, but the denominator was too small (<30) to report a valid rate, hence results are not presented.
NB No Benefit, the MCO did not offer the health benefit required by the measure (e.g., mental health, chemical dependency).
NR Not Reported, the MCO chose not to report the measure.
NQ Not Required, the MCO was not required to report the measure.
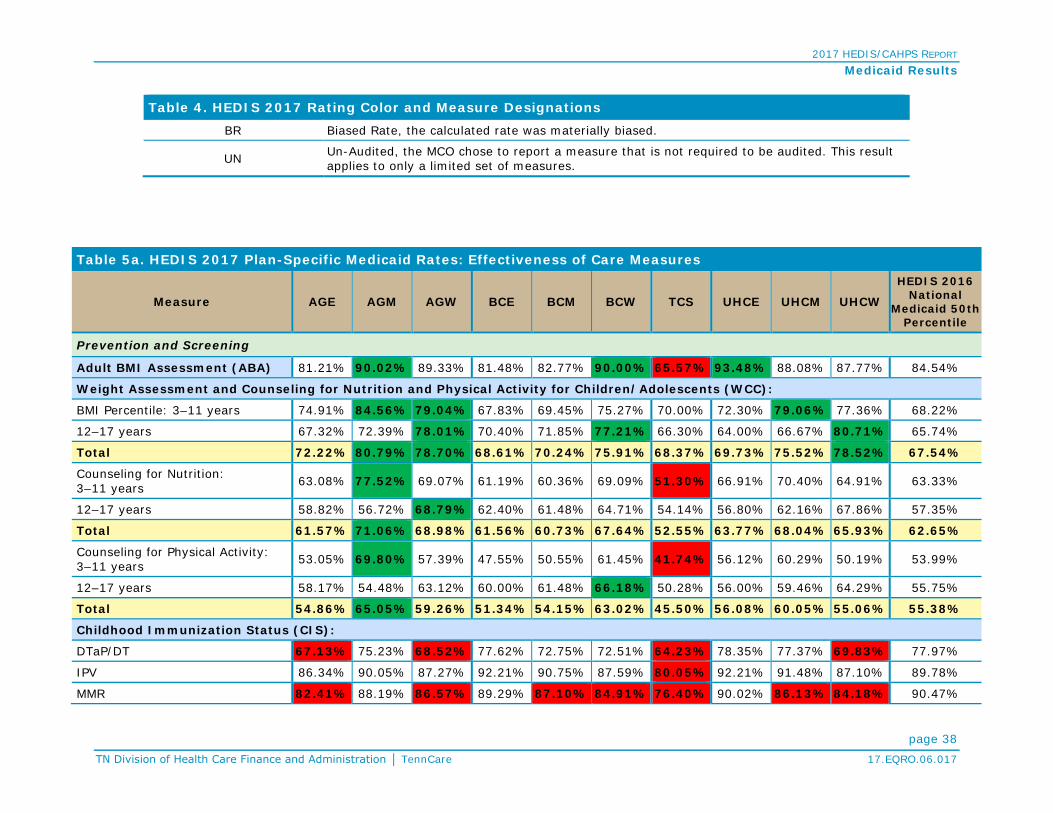
2017 HEDIS/CAHPS REPORT Medicaid Results
page 38 TN Division of Health Care Finance and Administration │ TennCare 17.EQRO.06.017
Table 4. HEDIS 2017 Rating Color and Measure Designations BR Biased Rate, the calculated rate was materially biased.
UN Un-Audited, the MCO chose to report a measure that is not required to be audited. This result applies to only a limited set of measures.
Table 5a. HEDIS 2017 Plan-Specific Medicaid Rates: Effectiveness of Care Measures
Measure AGE AGM AGW BCE BCM BCW TCS UHCE UHCM UHCW
HEDIS 2016 National
Medicaid 50th Percentile
Prevention and Screening
Adult BMI Assessment (ABA) 81.21% 90.02% 89.33% 81.48% 82.77% 90.00% 65.57% 93.48% 88.08% 87.77% 84.54%
Weight Assessment and Counseling for Nutrition and Physical Activity for Children/Adolescents (WCC):
BMI Percentile: 3–11 years 74.91% 84.56% 79.04% 67.83% 69.45% 75.27% 70.00% 72.30% 79.06% 77.36% 68.22%
12–17 years 67.32% 72.39% 78.01% 70.40% 71.85% 77.21% 66.30% 64.00% 66.67% 80.71% 65.74%
Total 72.22% 80.79% 78.70% 68.61% 70.24% 75.91% 68.37% 69.73% 75.52% 78.52% 67.54%
Counseling for Nutrition: 3–11 years 63.08% 77.52% 69.07% 61.19% 60.36% 69.09% 51.30% 66.91% 70.40% 64.91% 63.33%
12–17 years 58.82% 56.72% 68.79% 62.40% 61.48% 64.71% 54.14% 56.80% 62.16% 67.86% 57.35%
Total 61.57% 71.06% 68.98% 61.56% 60.73% 67.64% 52.55% 63.77% 68.04% 65.93% 62.65%
Counseling for Physical Activity: 3–11 years 53.05% 69.80% 57.39% 47.55% 50.55% 61.45% 41.74% 56.12% 60.29% 50.19% 53.99%
12–17 years 58.17% 54.48% 63.12% 60.00% 61.48% 66.18% 50.28% 56.00% 59.46% 64.29% 55.75%
Total 54.86% 65.05% 59.26% 51.34% 54.15% 63.02% 45.50% 56.08% 60.05% 55.06% 55.38%
Childhood Immunization Status (CIS):
DTaP/DT 67.13% 75.23% 68.52% 77.62% 72.75% 72.51% 64.23% 78.35% 77.37% 69.83% 77.97%
IPV 86.34% 90.05% 87.27% 92.21% 90.75% 87.59% 80.05% 92.21% 91.48% 87.10% 89.78%
MMR 82.41% 88.19% 86.57% 89.29% 87.10% 84.91% 76.40% 90.02% 86.13% 84.18% 90.47%

2017 HEDIS/CAHPS REPORT Medicaid Results
page 39 TN Division of Health Care Finance and Administration │ TennCare 17.EQRO.06.017
Table 5a. HEDIS 2017 Plan-Specific Medicaid Rates: Effectiveness of Care Measures
Measure AGE AGM AGW BCE BCM BCW TCS UHCE UHCM UHCW
HEDIS 2016 National
Medicaid 50th Percentile
HiB 81.25% 87.27% 83.56% 89.78% 86.13% 86.37% 76.16% 89.29% 87.35% 84.43% 89.37%
HepB 88.43% 90.51% 90.51% 94.16% 89.78% 88.81% 80.05% 93.92% 91.48% 89.05% 90.05%
VZV 81.48% 88.89% 85.65% 88.81% 88.56% 84.43% 75.18% 90.02% 88.56% 82.24% 89.97%
PCV 68.75% 78.01% 68.06% 79.56% 75.91% 72.26% 68.37% 79.56% 81.75% 70.56% 78.59%
HepA 80.56% 87.96% 86.34% 88.08% 87.35% 83.45% 75.18% 89.54% 85.89% 82.00% 84.91%
RV 55.56% 74.77% 58.56% 72.02% 68.13% 68.86% 45.74% 72.99% 76.89% 65.45% 69.34%
Flu 31.25% 49.54% 21.76% 44.04% 43.31% 25.30% 41.85% 38.93% 45.99% 23.11% 45.99%
Combination 2 63.66% 73.15% 65.51% 76.16% 70.80% 69.34% 60.34% 75.18% 73.72% 66.18% 75.18%
Combination 3 59.49% 71.30% 61.81% 74.21% 68.13% 65.45% 57.91% 71.78% 71.78% 63.02% 71.06%
Combination 4 58.56% 71.06% 61.81% 73.48% 67.64% 65.45% 57.66% 71.29% 71.53% 62.77% 67.96%
Combination 5 41.20% 62.27% 47.69% 60.34% 55.47% 57.42% 35.04% 59.12% 65.69% 52.55% 58.98%
Combination 6 26.39% 43.52% 17.59% 38.69% 35.52% 19.95% 33.82% 34.79% 41.12% 19.95% 39.14%
Combination 7 40.97% 62.04% 47.69% 60.10% 54.99% 57.42% 35.04% 58.64% 65.45% 52.31% 56.85%
Combination 8 26.39% 43.29% 17.59% 38.44% 35.28% 19.95% 33.82% 34.55% 41.12% 19.95% 38.20%
Combination 9 21.30% 39.35% 14.81% 32.85% 31.39% 18.25% 21.17% 29.93% 37.47% 16.79% 33.10%
Combination 10 21.30% 39.12% 14.81% 32.60% 31.14% 18.25% 21.17% 29.68% 37.47% 16.79% 32.64%
Immunization for Adolescents (IMA):
Meningococcal 71.30% 70.83% 68.52% 71.53% 71.29% 71.05% 67.40% 65.45% 69.83% 68.13% 77.21%
Tdap/Td 83.10% 83.80% 81.25% 85.40% 84.67% 85.16% 77.62% 78.83% 83.70% 80.78% 86.14%
HPV* 12.73% 13.89% 10.19% 17.76% 13.38% 10.46% 11.19% 12.90% 16.30% 11.44% 22.30%
Combination 1 70.37% 69.91% 67.82% 71.05% 69.83% 70.80% 66.91% 64.72% 68.13% 67.40% 74.52%
Combination 2** 12.27% 13.19% 10.19% 16.55% 12.65% 10.46% 9.98% 11.92% 15.33% 10.95%
Lead Screening in Children (LSC) 62.27% 73.15% 65.51% 75.67% 69.34% 66.18% 62.77% 77.62% 75.91% 65.21% 71.05%
Breast Cancer Screening (BCS) 34.89% 48.58% 43.68% 60.65% 56.93% 60.18% 60.18% 57.73% 51.59% 49.93% 58.08%
Cervical Cancer Screening (CCS) 35.58% 58.60% 49.07% 67.23% 59.61% 67.65% 28.47% 60.93% 67.78% 61.56% 55.94%
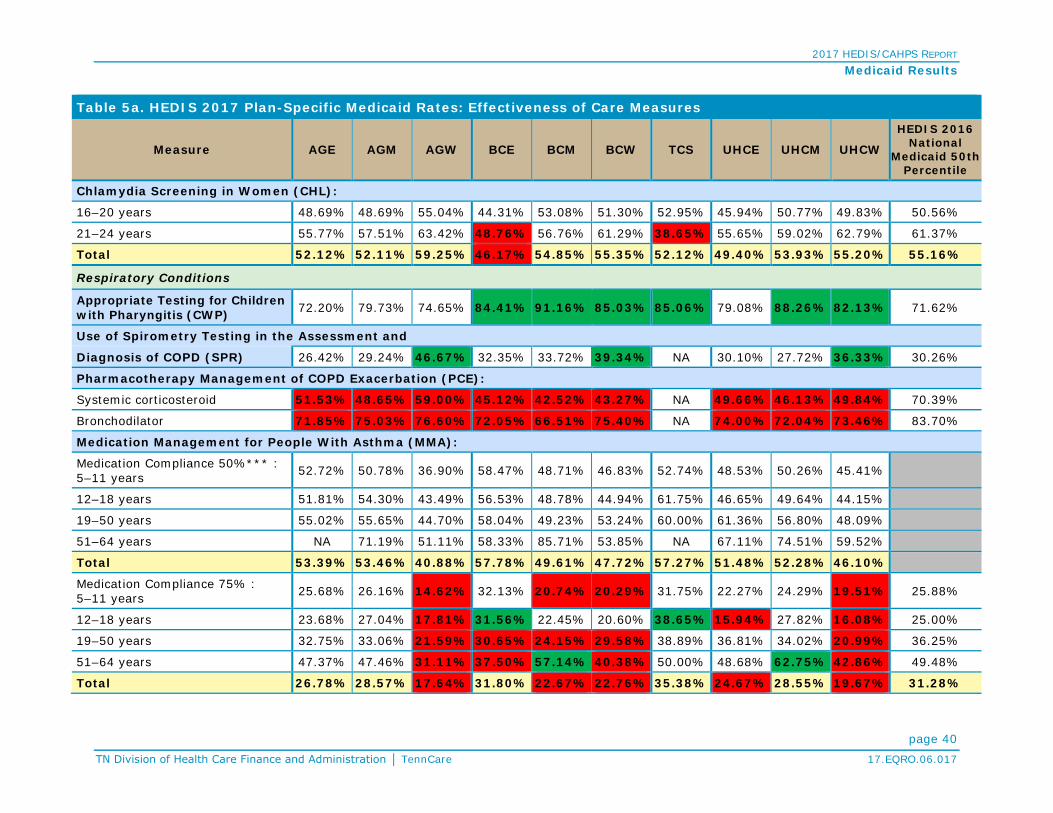
2017 HEDIS/CAHPS REPORT Medicaid Results
page 40 TN Division of Health Care Finance and Administration │ TennCare 17.EQRO.06.017
Table 5a. HEDIS 2017 Plan-Specific Medicaid Rates: Effectiveness of Care Measures
Measure AGE AGM AGW BCE BCM BCW TCS UHCE UHCM UHCW
HEDIS 2016 National
Medicaid 50th Percentile
Chlamydia Screening in Women (CHL):
16–20 years 48.69% 48.69% 55.04% 44.31% 53.08% 51.30% 52.95% 45.94% 50.77% 49.83% 50.56%
21–24 years 55.77% 57.51% 63.42% 48.76% 56.76% 61.29% 38.65% 55.65% 59.02% 62.79% 61.37%
Total 52.12% 52.11% 59.25% 46.17% 54.85% 55.35% 52.12% 49.40% 53.93% 55.20% 55.16%
Respiratory Conditions
Appropriate Testing for Children with Pharyngitis (CWP) 72.20% 79.73% 74.65% 84.41% 91.16% 85.03% 85.06% 79.08% 88.26% 82.13% 71.62%
Use of Spirometry Testing in the Assessment and
Diagnosis of COPD (SPR) 26.42% 29.24% 46.67% 32.35% 33.72% 39.34% NA 30.10% 27.72% 36.33% 30.26%
Pharmacotherapy Management of COPD Exacerbation (PCE):
Systemic corticosteroid 51.53% 48.65% 59.00% 45.12% 42.52% 43.27% NA 49.66% 46.13% 49.84% 70.39%
Bronchodilator 71.85% 75.03% 76.60% 72.05% 66.51% 75.40% NA 74.00% 72.04% 73.46% 83.70%
Medication Management for People With Asthma (MMA):
Medication Compliance 50%*** : 5–11 years 52.72% 50.78% 36.90% 58.47% 48.71% 46.83% 52.74% 48.53% 50.26% 45.41%
12–18 years 51.81% 54.30% 43.49% 56.53% 48.78% 44.94% 61.75% 46.65% 49.64% 44.15%
19–50 years 55.02% 55.65% 44.70% 58.04% 49.23% 53.24% 60.00% 61.36% 56.80% 48.09%
51–64 years NA 71.19% 51.11% 58.33% 85.71% 53.85% NA 67.11% 74.51% 59.52%
Total 53.39% 53.46% 40.88% 57.78% 49.61% 47.72% 57.27% 51.48% 52.28% 46.10%
Medication Compliance 75% : 5–11 years 25.68% 26.16% 14.62% 32.13% 20.74% 20.29% 31.75% 22.27% 24.29% 19.51% 25.88%
12–18 years 23.68% 27.04% 17.81% 31.56% 22.45% 20.60% 38.65% 15.94% 27.82% 16.08% 25.00%
19–50 years 32.75% 33.06% 21.59% 30.65% 24.15% 29.58% 38.89% 36.81% 34.02% 20.99% 36.25%
51–64 years 47.37% 47.46% 31.11% 37.50% 57.14% 40.38% 50.00% 48.68% 62.75% 42.86% 49.48%
Total 26.78% 28.57% 17.64% 31.80% 22.67% 22.76% 35.38% 24.67% 28.55% 19.67% 31.28%
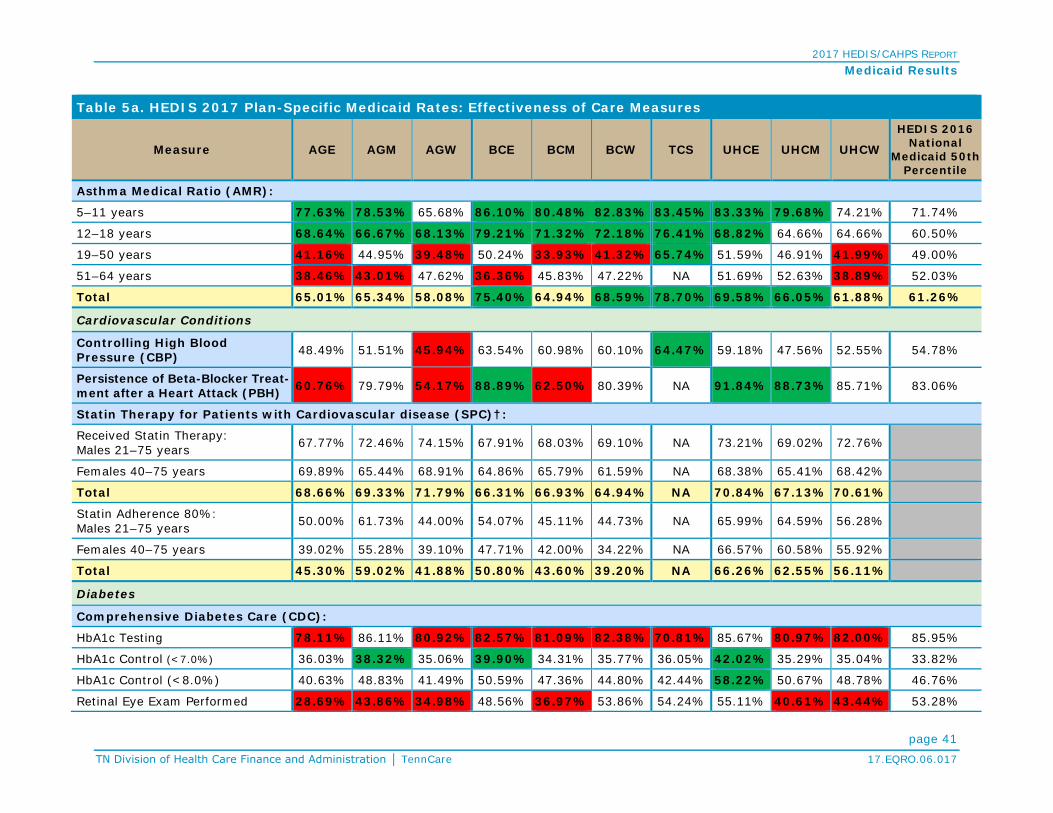
2017 HEDIS/CAHPS REPORT Medicaid Results
page 41 TN Division of Health Care Finance and Administration │ TennCare 17.EQRO.06.017
Table 5a. HEDIS 2017 Plan-Specific Medicaid Rates: Effectiveness of Care Measures
Measure AGE AGM AGW BCE BCM BCW TCS UHCE UHCM UHCW
HEDIS 2016 National
Medicaid 50th Percentile
Asthma Medical Ratio (AMR):
5–11 years 77.63% 78.53% 65.68% 86.10% 80.48% 82.83% 83.45% 83.33% 79.68% 74.21% 71.74%
12–18 years 68.64% 66.67% 68.13% 79.21% 71.32% 72.18% 76.41% 68.82% 64.66% 64.66% 60.50%
19–50 years 41.16% 44.95% 39.48% 50.24% 33.93% 41.32% 65.74% 51.59% 46.91% 41.99% 49.00%
51–64 years 38.46% 43.01% 47.62% 36.36% 45.83% 47.22% NA 51.69% 52.63% 38.89% 52.03%
Total 65.01% 65.34% 58.08% 75.40% 64.94% 68.59% 78.70% 69.58% 66.05% 61.88% 61.26%
Cardiovascular Conditions
Controlling High Blood Pressure (CBP) 48.49% 51.51% 45.94% 63.54% 60.98% 60.10% 64.47% 59.18% 47.56% 52.55% 54.78%
Persistence of Beta-Blocker Treat- ment after a Heart Attack (PBH) 60.76% 79.79% 54.17% 88.89% 62.50% 80.39% NA 91.84% 88.73% 85.71% 83.06%
Statin Therapy for Patients with Cardiovascular disease (SPC)†:
Received Statin Therapy: Males 21–75 years 67.77% 72.46% 74.15% 67.91% 68.03% 69.10% NA 73.21% 69.02% 72.76%
Females 40–75 years 69.89% 65.44% 68.91% 64.86% 65.79% 61.59% NA 68.38% 65.41% 68.42%
Total 68.66% 69.33% 71.79% 66.31% 66.93% 64.94% NA 70.84% 67.13% 70.61%
Statin Adherence 80%: Males 21–75 years 50.00% 61.73% 44.00% 54.07% 45.11% 44.73% NA 65.99% 64.59% 56.28%
Females 40–75 years 39.02% 55.28% 39.10% 47.71% 42.00% 34.22% NA 66.57% 60.58% 55.92%
Total 45.30% 59.02% 41.88% 50.80% 43.60% 39.20% NA 66.26% 62.55% 56.11%
Diabetes
Comprehensive Diabetes Care (CDC):
HbA1c Testing 78.11% 86.11% 80.92% 82.57% 81.09% 82.38% 70.81% 85.67% 80.97% 82.00% 85.95%
HbA1c Control (<7.0%) 36.03% 38.32% 35.06% 39.90% 34.31% 35.77% 36.05% 42.02% 35.29% 35.04% 33.82%
HbA1c Control (<8.0%) 40.63% 48.83% 41.49% 50.59% 47.36% 44.80% 42.44% 58.22% 50.67% 48.78% 46.76%
Retinal Eye Exam Performed 28.69% 43.86% 34.98% 48.56% 36.97% 53.86% 54.24% 55.11% 40.61% 43.44% 53.28%

2017 HEDIS/CAHPS REPORT Medicaid Results
page 42 TN Division of Health Care Finance and Administration │ TennCare 17.EQRO.06.017
Table 5a. HEDIS 2017 Plan-Specific Medicaid Rates: Effectiveness of Care Measures
Measure AGE AGM AGW BCE BCM BCW TCS UHCE UHCM UHCW
HEDIS 2016 National
Medicaid 50th Percentile
Medical Attention for Nephropathy 89.55% 88.16% 90.94% 90.02% 88.93% 87.92% 73.29% 90.00% 87.52% 90.00% 90.51%
BP Control (<140/90 mm Hg) 54.39% 59.80% 50.08% 66.16% 59.45% 55.03% 62.73% 60.89% 57.45% 52.78% 59.73% Statin Therapy for Patients with Diabetes (SPD)†: Received Statin Therapy: 40–75 yrs 52.95% 54.89% 56.63% 53.35% 50.84% 53.80% 48.00% 56.31% 52.10% 54.71%
Statin Adherence 80%: 40–75 yrs. 45.31% 56.41% 38.99% 44.51% 41.29% 36.39% 83.33% 59.77% 60.34% 55.21%
Musculoskeletal Conditions
Disease-Modifying Anti-Rheumatic Drug Therapy for Rheumatoid Arthritis (ART) 65.41% 63.99% 57.42% 70.00% 53.21% 63.76% NA 69.58% 58.17% 55.87% 72.22%
Behavioral Health
Antidepressant Medication Management (AMM): Effective Acute Phase Treatment 52.15% 50.28% 44.99% 45.53% 42.74% 38.00% 38.58% 51.47% 47.48% 44.56% 53.38%
Effective Continuation Phase Treatment 36.80% 36.13% 29.55% 28.00% 27.23% 21.98% 19.69% 34.59% 31.83% 28.72% 38.06%
Follow-Up Care for Children Prescribed ADHD Medication (ADD): Initiation Phase 45.41% 48.51% 34.28% 47.25% 41.70% 38.79% 40.69% 55.09% 54.63% 41.34% 42.19%
Continuation and Maintenance Phase 60.81% 60.85% 48.84% 60.63% 57.87% 57.20% 50.00% 71.43% 64.48% 62.50% 52.47% Follow-Up After Hospitalization for Mental Illness (FUH): 7-Day Follow-Up 55.19% 50.48% 57.55% 65.01% 46.51% 66.58% 62.48% 64.02% 55.38% 65.48% 44.05%
30-Day Follow-Up 69.26% 68.58% 64.81% 76.80% 59.31% 77.26% 74.28% 77.26% 69.88% 75.19% 63.94% Follow-Up After Emergency Department Visit for Mental Illness (FUM)**: 7-Day Follow-Up 25.09% 36.86% 19.18% 38.89% 33.02% 32.74% 48.24% BR BR BR
30-Day Follow-Up 40.94% 49.38% 38.36% 61.73% 51.14% 58.11% 69.84% BR BR BR Follow-Up After Emergency Department Visit for Alcohol and Other Drug Dependence (FUA)**: 7-Day Follow-Up: 13–17 years NA 2.22% NA 6.12% 17.07% NA 21.19% BR BR BR
18 years and older 2.83% 3.08% 5.90% 10.15% 11.81% 16.51% 9.86% BR BR BR
Total 2.71% 3.01% 5.74% 9.90% 12.07% 15.82% 16.93% BR BR BR

2017 HEDIS/CAHPS REPORT Medicaid Results
page 43 TN Division of Health Care Finance and Administration │ TennCare 17.EQRO.06.017
Table 5a. HEDIS 2017 Plan-Specific Medicaid Rates: Effectiveness of Care Measures
Measure AGE AGM AGW BCE BCM BCW TCS UHCE UHCM UHCW
HEDIS 2016 National
Medicaid 50th Percentile
30-Day Follow-Up: 13–17 years NA 6.67% NA 14.29% 21.95% NA 27.12% BR BR BR
18 years and older 4.16% 4.82% 6.94% 13.13% 14.82% 19.31% 11.27% BR BR BR
Total 4.15% 4.96% 6.76% 13.20% 15.17% 18.51% 21.16% BR BR BR
Diabetes Screening for People With Schizophrenia or Bipolar Disorder Who Are Using
Antipsychotic Medication (SSD) 82.44% 82.71% 78.20% 83.12% 80.79% 81.01% 82.39% 86.04% 86.51% 78.99% 80.72%
Diabetes Monitoring for People With Diabetes
and Schizophrenia (SMD) 62.22% 78.45% 62.43% 70.85% 72.41% 64.48% 71.43% 75.00% 71.15% 69.59% 68.93%
Cardiovascular Monitoring for People With
Schizophrenia (SMC) NA NA NA 78.33% NA 82.46% NA 81.67% 75.41% 80.39% 80.00%
Adherence to Antipsychotic Medications for Individuals
With Schizophrenia (SAA) 52.30% 62.85% 44.85% 66.08% 49.07% 56.08% 72.24% 59.33% 71.01% 56.67% 59.79%
Metabolic Monitoring for Children and Adolescents on Antipsychotics (APM):
1–5 Years NA NA NA 14.29% NA NA 11.11% NA NA NA 15.33%
6–11 Years 31.16% 31.46% 16.67% 33.56% 27.31% 17.22% 29.65% 27.53% 27.05% 21.26% 25.19% 12–17 Years 30.67% 35.20% 27.41% 36.11% 37.04% 29.38% 44.28% 38.81% 31.03% 22.61% 32.33% Total 30.65% 33.73% 22.83% 34.49% 32.91% 24.37% 39.60% 34.19% 29.00% 22.00% 29.63% Medication Management
Annual Monitoring for Patients on Persistent Medications (MPM):
ACE Inhibitors or ARBs 90.25% 89.21% 90.11% 89.49% 85.65% 89.51% 84.71% 93.06% 90.60% 92.72% 87.43%
Digoxin 60.61% 44.19% 55.10% 52.00% 43.90% 65.43% NA 59.12% 64.52% 67.26% 53.94%
Diuretics 90.42% 89.93% 89.28% 90.85% 86.63% 88.72% 88.89% 93.88% 91.85% 92.32% 87.52%
Total 90.13% 89.10% 89.43% 89.86% 85.87% 88.89% 86.00% 93.09% 90.88% 92.24% 87.23%
Overuse/Appropriateness
Appropriate Treatment for Children with Upper
Respiratory Infection (URI) 76.90% 87.18% 79.35% 79.16% 85.88% 74.06% 79.60% 77.22% 87.68% 81.53% 89.39%
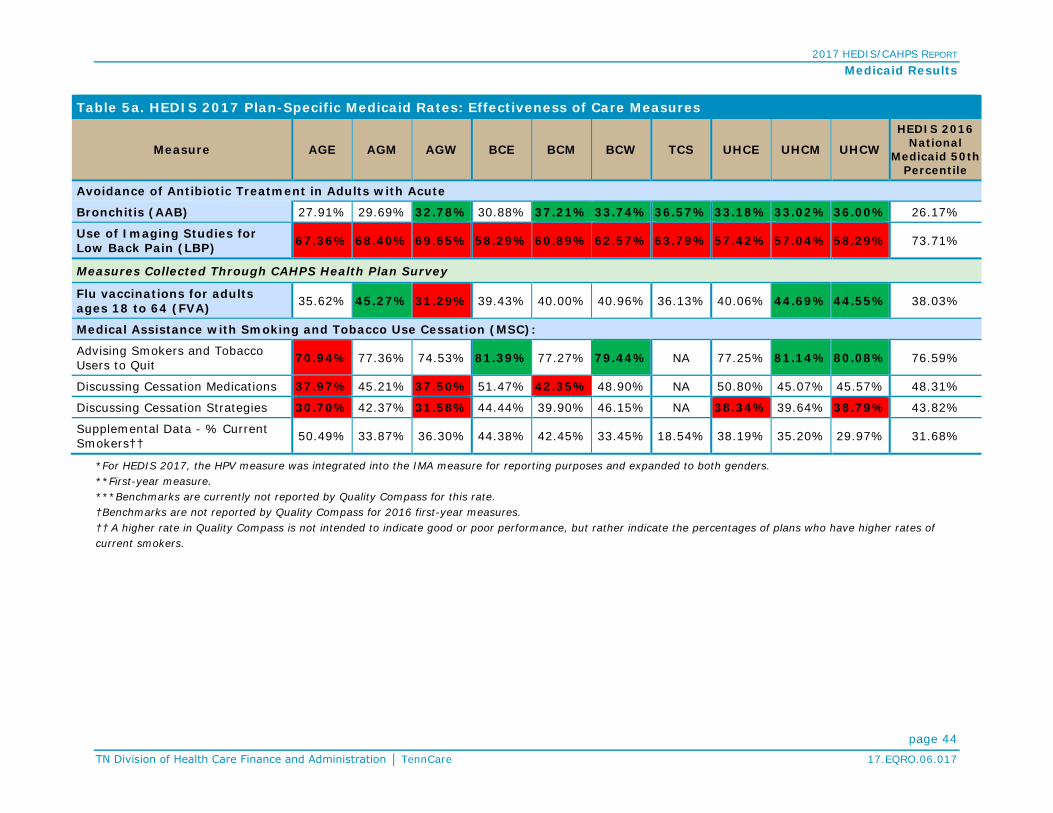
2017 HEDIS/CAHPS REPORT Medicaid Results
page 44 TN Division of Health Care Finance and Administration │ TennCare 17.EQRO.06.017
Table 5a. HEDIS 2017 Plan-Specific Medicaid Rates: Effectiveness of Care Measures
Measure AGE AGM AGW BCE BCM BCW TCS UHCE UHCM UHCW
HEDIS 2016 National
Medicaid 50th Percentile
Avoidance of Antibiotic Treatment in Adults with Acute
Bronchitis (AAB) 27.91% 29.69% 32.78% 30.88% 37.21% 33.74% 36.57% 33.18% 33.02% 36.00% 26.17%
Use of Imaging Studies for Low Back Pain (LBP) 67.36% 68.40% 69.65% 58.29% 60.89% 62.57% 63.79% 57.42% 57.04% 58.29% 73.71%
Measures Collected Through CAHPS Health Plan Survey
Flu vaccinations for adults ages 18 to 64 (FVA) 35.62% 45.27% 31.29% 39.43% 40.00% 40.96% 36.13% 40.06% 44.69% 44.55% 38.03%
Medical Assistance with Smoking and Tobacco Use Cessation (MSC):
Advising Smokers and Tobacco Users to Quit 70.94% 77.36% 74.53% 81.39% 77.27% 79.44% NA 77.25% 81.14% 80.08% 76.59%
Discussing Cessation Medications 37.97% 45.21% 37.50% 51.47% 42.35% 48.90% NA 50.80% 45.07% 45.57% 48.31%
Discussing Cessation Strategies 30.70% 42.37% 31.58% 44.44% 39.90% 46.15% NA 38.34% 39.64% 38.79% 43.82%
Supplemental Data - % Current Smokers†† 50.49% 33.87% 36.30% 44.38% 42.45% 33.45% 18.54% 38.19% 35.20% 29.97% 31.68%
*For HEDIS 2017, the HPV measure was integrated into the IMA measure for reporting purposes and expanded to both genders. **First-year measure. ***Benchmarks are currently not reported by Quality Compass for this rate. †Benchmarks are not reported by Quality Compass for 2016 first-year measures. †† A higher rate in Quality Compass is not intended to indicate good or poor performance, but rather indicate the percentages of plans who have higher rates of current smokers.

2017 HEDIS/CAHPS REPORT Medicaid Results
page 45 TN Division of Health Care Finance and Administration │ TennCare 17.EQRO.06.017
For the Effectiveness of Care Measures presented in Table 5b, a lower rate (particularly one below the national 50th percentile) is an indication of better performance. For example, a rate in the 10th percentile is better than a rate in the 90th percentile.
Table 5b. HEDIS 2017 Plan-Specific Medicaid Rates: Effectiveness of Care Measures Where Lower Rates Indicate Better Performance
Measure AGE AGM AGW BCE BCM BCW TCS UHCE UHCM UHCW
HEDIS 2016 National
Medicaid 50th Percentile
Diabetes
Comprehensive Diabetes Care (CDC):
HbA1c Poor Control (>9.0%) 49.09% 40.79% 50.56% 39.42% 44.63% 47.15% 53.21% 32.67% 40.85% 42.33% 43.80%
Overuse/Appropriateness
Non-Recommended Cervical Cancer Screening in
Adolescent Females (NCS) 2.75% 2.20% 4.25% 3.91% 3.99% 4.47% 3.36% 4.57% 3.89% 4.54% 2.42%
Use of Multiple Concurrent Antipsychotics in Children and Adolescents (APC):
1–5 Years NA NA NA NA NA NA 2.56% NA NA NA 0.00%
6–11 Years 0.97% 1.76% 0.00% 2.02% 1.18% 1.35% 2.54% 1.60% 0.63% 0.88% 1.56%
12–17 Years 2.27% 2.34% 2.31% 3.66% 2.57% 3.17% 3.71% 2.47% 2.45% 3.01% 2.53%
Total 1.82% 2.09% 1.33% 3.15% 2.02% 2.41% 3.36% 2.08% 1.76% 2.13% 1.99%
Table 6. HEDIS 2017 Plan-Specific Medicaid Rates: Access/Availability of Care Measures
Measure AGE AGM AGW BCE BCM BCW TCS UHCE UHCM UHCW
HEDIS 2016 National
Medicaid 50th Percentile
Adults’ Access to Preventive/Ambulatory Health Services (AAP): 20–44 years 67.03% 75.26% 70.77% 79.23% 75.60% 77.92% 42.79% 75.58% 77.90% 73.56% 79.48%
45–64 years 78.63% 84.59% 81.03% 89.23% 85.85% 87.26% 44.57% 86.98% 87.21% 83.45% 86.83%

2017 HEDIS/CAHPS REPORT Medicaid Results
page 46 TN Division of Health Care Finance and Administration │ TennCare 17.EQRO.06.017
Table 6. HEDIS 2017 Plan-Specific Medicaid Rates: Access/Availability of Care Measures
Measure AGE AGM AGW BCE BCM BCW TCS UHCE UHCM UHCW
HEDIS 2016 National
Medicaid 50th Percentile
Children and Adolescents’ Access to Primary Care Practitioners (CAP):
12–24 months 92.17% 95.60% 87.45% 96.63% 96.15% 92.03% 86.53% 95.33% 96.33% 89.62% 95.74%
25 months–6 years 81.10% 85.68% 81.93% 88.50% 86.93% 83.89% 78.70% 83.82% 86.79% 80.67% 87.69%
7–11 years 84.34% 88.92% 88.26% 92.14% 91.58% 90.01% 91.39% 88.22% 91.44% 87.66% 91.00%
12–19 years 80.78% 85.35% 83.37% 89.49% 88.37% 86.48% 87.69% 85.42% 88.72% 83.20% 89.37%
Initiation and Engagement of Alcohol and Other Drug (AOD) Dependence Treatment (IET): Initiation of AOD Treatment: 13-17 years 50.00% 43.11% 52.76% 43.32% 44.09% 54.55% 48.47% 47.03% 52.02% 51.45% 42.75%
≥ 18 years 35.21% 35.11% 41.81% 28.86% 33.50% 28.70% 41.73% 38.08% 41.73% 42.97% 37.78%
Total 35.70% 35.56% 42.27% 29.39% 33.86% 30.11% 44.88% 38.40% 42.28% 43.39% 38.07% Engagement of AOD Treatment: 13–17 years 28.77% 25.78% 18.90% 27.94% 24.19% 16.58% 27.61% 26.73% 30.65% 21.01% 13.53%
≥ 18 years 10.39% 12.66% 12.05% 6.78% 10.46% 8.48% 13.67% 9.35% 13.71% 11.59% 9.29%
Total 10.99% 13.39% 12.34% 7.55% 10.92% 8.93% 20.19% 9.98% 14.61% 12.05% 9.63% Prenatal and Postpartum Care (PPC):
Timeliness of Prenatal Care 76.69% 80.93% 65.20% 88.51% 74.94% 74.21% 72.19% 79.75% 74.45% 68.13% 82.25%
Postpartum Care 53.61% 62.56% 51.28% 69.54% 53.53% 64.23% 51.69% 61.01% 59.61% 48.18% 60.98%
Use of First-Line Psychosocial Care for Children and Adolescents on Antipsychotics (APP):
1–5 Years NA NA NA NA NA NA NA NA NA NA 45.45%
6–11 Years 55.41% 70.31% 50.00% 48.37% 57.73% 53.04% 52.90% 48.89% 66.23% 47.12% 61.54%
12–17 Years 54.76% 64.12% 59.81% 56.60% 71.43% 63.80% 53.95% 60.14% 56.67% 53.17% 61.20%
Total 54.37% 65.67% 54.77% 51.71% 65.31% 58.66% 53.81% 55.69% 59.66% 49.58% 60.43%

2017 HEDIS/CAHPS REPORT Medicaid Results
page 47 TN Division of Health Care Finance and Administration │ TennCare 17.EQRO.06.017
Table 7 results are for utilization measures that are included in the Utilization and Risk-Adjusted Utilization Domain of Care.
Table 7. HEDIS 2017 Plan-Specific Medicaid Rates: Utilization Measures
Measure AGE AGM AGW BCE BCM BCW TCS UHCE UHCM UHCW
HEDIS 2016 National
Medicaid 50th Percentile
Frequency of Ongoing Prenatal Care (FPC):
≥ 81 percent 59.67% 57.21% 44.78% 81.03% 48.18% 52.07% 48.31% 68.86% 48.42% 37.96% 59.26%
Well-Child Visits in the First 15 Months of Life (W15):
6 or More Visits 59.95% 73.38% 40.05% 70.40% 63.50% 55.72% 41.36% 66.84% 62.09% 45.50% 59.57%
Well-Child Visits in the Third, Fourth, Fifth and Sixth Years of Life (W34) 62.50% 76.85% 69.21% 68.33% 70.06% 65.10% 62.84% 68.16% 74.71% 65.77% 71.42%
Adolescent Well-Care Visits (AWC) 50.00% 55.79% 53.01% 42.82% 46.47% 41.85% 45.74% 41.85% 48.66% 41.36% 48.41%
Individual Plan Performance—CAHPS Table 8 details the color-coding and the rating scale, as well as any additional comments, used in Tables 9 through 13 to indicate the rating achieved. Tables 9 through 13 display the plan-specific performance rates for the CAHPS survey results. CAHPS measure results with an ‘NA’ indicate that there were
fewer than 100 valid responses and, hence, results are not presented. For all CAHPS survey results, performance is measured against the calculated statewide average. The 2016 National Medicaid CAHPS Benchmarking data were obtained from Quality Compass.
Table 8. 2017 CAHPS Rating Color and Measure Designations Color Designation Rating Scale Additional Comments
Greater than one standard deviation
above the statewide average No additional comments
Within one standard deviation above or below the statewide average No additional comments
Greater than one standard deviation below the statewide average No additional comments
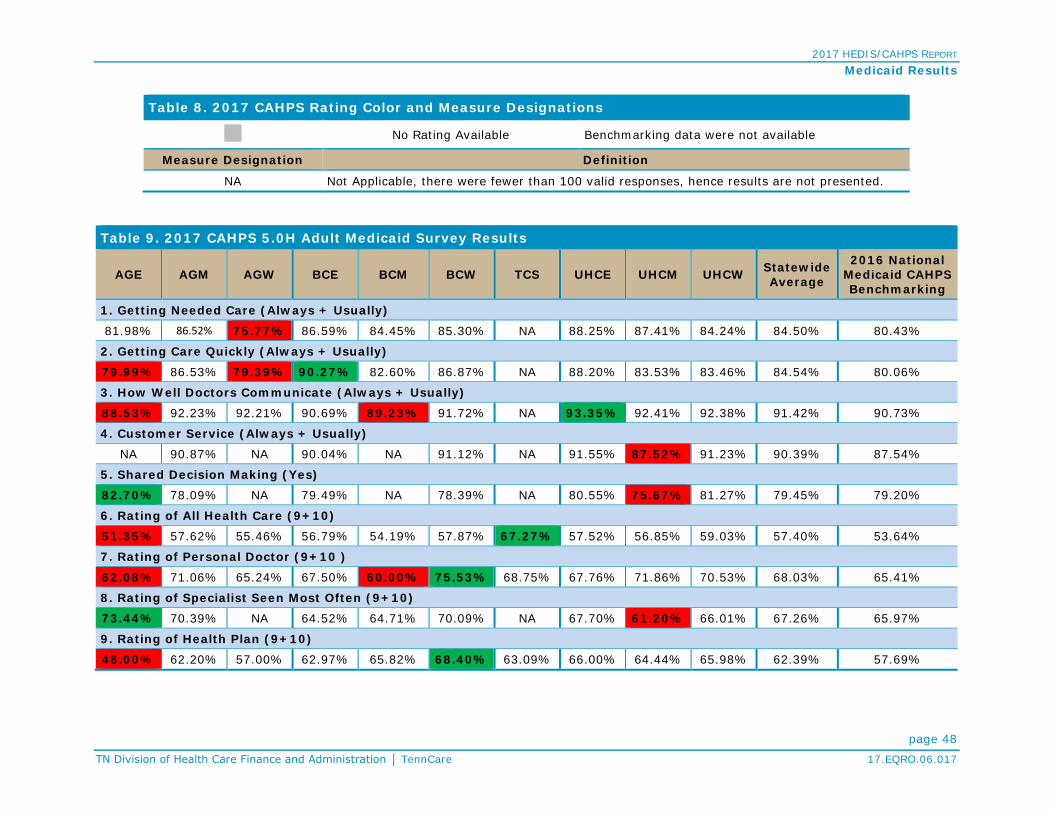
2017 HEDIS/CAHPS REPORT Medicaid Results
page 48 TN Division of Health Care Finance and Administration │ TennCare 17.EQRO.06.017
Table 8. 2017 CAHPS Rating Color and Measure Designations
No Rating Available Benchmarking data were not available
Measure Designation Definition
NA Not Applicable, there were fewer than 100 valid responses, hence results are not presented.
Table 9. 2017 CAHPS 5.0H Adult Medicaid Survey Results
AGE AGM AGW BCE BCM BCW TCS UHCE UHCM UHCW Statewide Average
2016 National Medicaid CAHPS Benchmarking
1. Getting Needed Care (Always + Usually)
81.98% 86.52% 75.77% 86.59% 84.45% 85.30% NA 88.25% 87.41% 84.24% 84.50% 80.43%
2. Getting Care Quickly (Always + Usually)
79.99% 86.53% 79.39% 90.27% 82.60% 86.87% NA 88.20% 83.53% 83.46% 84.54% 80.06%
3. How Well Doctors Communicate (Always + Usually) 88.53% 92.23% 92.21% 90.69% 89.23% 91.72% NA 93.35% 92.41% 92.38% 91.42% 90.73%
4. Customer Service (Always + Usually) NA 90.87% NA 90.04% NA 91.12% NA 91.55% 87.52% 91.23% 90.39% 87.54%
5. Shared Decision Making (Yes) 82.70% 78.09% NA 79.49% NA 78.39% NA 80.55% 75.67% 81.27% 79.45% 79.20%
6. Rating of All Health Care (9+10) 51.35% 57.62% 55.46% 56.79% 54.19% 57.87% 67.27% 57.52% 56.85% 59.03% 57.40% 53.64%
7. Rating of Personal Doctor (9+10 )
62.08% 71.06% 65.24% 67.50% 60.00% 75.53% 68.75% 67.76% 71.86% 70.53% 68.03% 65.41%
8. Rating of Specialist Seen Most Often (9+10) 73.44% 70.39% NA 64.52% 64.71% 70.09% NA 67.70% 61.20% 66.01% 67.26% 65.97%
9. Rating of Health Plan (9+10) 48.00% 62.20% 57.00% 62.97% 65.82% 68.40% 63.09% 66.00% 64.44% 65.98% 62.39% 57.69%

2017 HEDIS/CAHPS REPORT Medicaid Results
page 49 TN Division of Health Care Finance and Administration │ TennCare 17.EQRO.06.017
Table 10. 2017 CAHPS 5.0H Child Medicaid Survey Results (General Population)
AGE AGM AGW BCE BCM BCW TCS UHCE UHCM UHCW Statewide Average
2016 National Medicaid CAHPS Benchmarking
1. Getting Needed Care (Always + Usually)
89.51% 88.50% 80.23% 91.48% 87.81% 87.67% 91.87% 89.95% 90.36% 82.73% 88.01% 83.66%
2. Getting Care Quickly (Always + Usually)
92.61% 91.10% 89.40% 95.27% 93.59% 93.10% 93.69% 91.73% 92.85% 89.01% 92.24% 88.54%
3. How Well Doctors Communicate (Always + Usually)
93.29% 93.01% 89.74% 96.44% 93.93% 95.47% 94.51% 95.01% 95.62% 94.49% 94.15% 93.17%
4. Customer Service (Always + Usually)
89.23% 87.60% 85.90% 93.38% 88.22% 89.41% 93.95% 91.94% 87.16% 90.78% 89.76% 87.98%
5.Shared Decision Making (Yes)
79.23% 80.79% 78.44% 81.85% NA 80.72% 82.73% 79.31% 79.07% NA 80.27% 78.41%
6. Rating of All Health Care (9+10)
73.57% 72.32% 70.73% 77.28% 76.36% 76.49% 73.51% 73.21% 72.50% 71.20% 73.72% 67.67%
7. Rating of Personal Doctor (9+10)
76.79% 72.84% 75.49% 79.22% 79.69% 78.19% 76.53% 75.39% 79.69% 76.95% 77.08% 74.78%
8. Rating of Specialist Seen Most Often (9+10)
NA NA NA 78.95% NA NA 79.38% NA NA NA 79.17% 71.10%
9. Rating of Health Plan (9+10)
68.42% 74.38% 67.63% 80.95% 75.93% 78.90% 76.33% 77.29% 75.12% 76.99% 75.19% 69.00%

2017 HEDIS/CAHPS REPORT Medicaid Results
page 50 TN Division of Health Care Finance and Administration │ TennCare 17.EQRO.06.017
Table 11. 2017 CAHPS 5.0H Child Medicaid Survey Results (Children with Chronic Conditions)
AGE AGM AGW BCE BCM BCW TCS UHCE UHCM UHCW Statewide Average
2016 National Medicaid CAHPS Benchmarking
1. Getting Needed Care (Always + Usually) 86.55% 86.87% 84.19% 92.31% 90.94% 87.88% 91.56% 91.49% 92.30% 86.59% 89.07% 86.14%
2. Getting Care Quickly (Always + Usually) 94.80% 90.14% 92.04% 96.56% 95.25% 94.79% 93.66% 94.81% 95.74% 93.99% 94.18% 91.82%
3. How Well Doctors Communicate (Always + Usually) 94.13% 93.05% 93.35% 96.33% 94.78% 96.43% 95.24% 95.70% 95.47% 95.77% 95.03% 93.92%
4. Customer Service (Always + Usually) 93.75% NA NA 95.59% NA 90.87% 90.82% 93.10% 92.23% NA 92.73% 89.43%
5.Shared Decision Making (Yes) 86.28% 83.39% 85.79% 88.63% 82.69% 82.39% 84.48% 85.99% 79.33% 83.76% 84.27% 84.95%
6. Rating of All Health Care (9+10) 61.98% 72.87% 64.95% 75.21% 72.98% 74.40% 70.48% 71.82% 72.45% 69.71% 70.69% 65.98% 7. Rating of Personal Doctor (9+10) 73.26% 77.94% 72.12% 78.92% 75.48% 80.20% 75.68% 80.10% 77.74% 78.71% 77.02% 74.67% 8.Rating of Specialist Seen Most Often (9+10) 70.00% 72.41% NA 78.49% 78.90% 78.63% 75.00% 79.01% 73.43% 68.42% 74.92% 70.81% 9. Rating of Health Plan (9+10) 60.19% 74.36% 59.50% 81.72% 72.04% 77.40% 74.70% 76.20% 73.53% 73.43% 72.31% 65.80% 10. Access to Specialized Services (Always + Usually)
NA NA NA NA NA NA 82.46% NA NA NA 82.46% 77.06% 11. Family-Centered Care: Personal Doctor or Nurse Who Knows Child (Yes) 90.99% 91.25% 90.36% 91.57% 91.31% 91.19% 91.14% 91.64% 90.91% 92.39% 91.28% 90.55%
12. Coordination of Care for Children With Chronic Conditions (Yes) NA NA NA 78.60% NA NA 81.05% 78.29% 82.00% NA 79.99% 77.11%
13. Family-Centered Care: Getting Needed Information (Always + Usually) 91.67% 90.87% 90.23% 95.49% 93.93% 91.92% 92.75% 89.37% 92.15% 93.78% 92.22% 90.91%
14. Access to Prescription Medicines (Always + Usually) 90.49% 93.92% 92.00% 94.33% 92.03% 93.26% 91.87% 93.65% 94.16% 92.83% 92.85% 90.68%

2017 HEDIS/CAHPS REPORT
page 51 TN Division of Health Care Finance and Administration │ TennCare 17.EQRO.06.017
Medicaid HEDIS Trending—Statewide Weighted Rates Each year of HEDIS reporting, Qsource has calculated the Medicaid statewide weighted averages for each measure by applying the size of the eligible population for each measure within a health plan to its reported rate. Using this methodology, plan-specific findings can be estimated from an overall TennCare statewide level, with each reporting health plan contributing to the statewide estimate proportionate to its eligible population size.
Trending for first-time measures—those reported for the first time in this year’s HEDIS/CAHPS report—is not possible and, therefore, not presented in this section. Remaining measures are plotted to reflect the statewide performance of TennCare
MCOs since reporting began in 2006, except where measures were not reported for a particular year as stated in footnotes.
In 2008 new health plans were implemented in the Middle Grand Region that were not required to be NCQA accredited until December 2009. Similarly, new health plans were implemented in 2009 in the West Grand Region that were not required to be accredited until December 2010. The data would not have been reported by these MCOs for 2008 or 2009, respectively; hence, no 2008 or 2009 statewide weighted rates are presented. Beginning in January 2015, there were 400,000 TennCare enrollees transitioning to new MCOs. These factors should be considered while trending data.

2017 HEDIS/CAHPS REPORT Medicaid HEDIS Trending
page 52 TN Division of Health Care Finance and Administration │ TennCare 17.EQRO.06.017
Effectiveness of Care Measures: Prevention and Screening Fig. 1. Adult BMI Assessment (ABA) Fig. 2. Weight Assessment and Counseling for Nutrition and
Physical Activity for Children/Adolescents (WCC)— BMI Percentile: 3–11 years
Fig. 3. WCC—BMI Percentile: 12–17 years Fig. 4. WCC—BMI Percentile: Total
26.93%18.95%
59.17%
70.95%78.50%
82.84% 82.46%86.96%
0%10%20%30%40%50%60%70%80%90%
100%
2010 2011 2012 2013 2014 2015 2016 2017
Sta
tew
ide
Wei
gh
ted
Rat
es
HEDIS Report Year
Footnote: Data reporting began in 2009 (2008 and 2009 data are not reported in these graphs). Measure specifications were revised in 2012 and for HEDIS 2016 the BMI and BMI percentile numerator age criteria was revised from 21 to 20 years; trending should be considered with caution.
18.39%9.00%
39.57%49.42%
56.08%65.98%
71.33% 75.08%
0%10%20%30%40%50%60%70%80%90%
100%
2010 2011 2012 2013 2014 2015 2016 2017
Sta
tew
ide
Wei
gh
ted
Rat
es
HEDIS Report Year
Footnote: Data reporting began in 2009 (2008 and 2009 data are not reported in these graphs). In 2012 measure specifications changed; trending between 2012 and prior years should be considered with caution.
19.03%10.99%
43.38%49.74%
58.27%67.14% 65.74%
71.33%
0%10%20%30%40%50%60%70%80%90%
100%
2010 2011 2012 2013 2014 2015 2016 2017
Sta
tew
ide
Wei
gh
ted
Rat
es
HEDIS Report Year
Footnote: Data reporting began in 2009 (2008 and 2009 data are not reported in these graphs). In 2012 measure specifications changed; trending between 2012 and prior years should be considered with caution.
18.64%9.65%
40.91%49.52%
56.80%66.30% 69.55%
73.88%
0%10%20%30%40%50%60%70%80%90%
100%
2010 2011 2012 2013 2014 2015 2016 2017
Sta
tew
ide
Wei
gh
ted
Rat
es
HEDIS Report Year
Footnote: Data reporting began in 2009 (2008 and 2009 data are not reported in these graphs). In 2012 measure specifications changed; trending between 2012 and prior years should be considered with caution.

2017 HEDIS/CAHPS REPORT Medicaid HEDIS Trending—Effectiveness of Care Measures: Prevention and Screening
page 53 TN Division of Health Care Finance and Administration │ TennCare 17.EQRO.06.017
Fig. 5. WCC—Counseling for Nutrition: 3–11 years Fig. 6. WCC—Counseling for Nutrition: 12–17 years
Fig. 7. WCC—Counseling for Nutrition: Total Fig. 8. WCC—Counseling for Physical Activity: 3–11 years
45.21%
24.22%
58.43%59.90%63.76%64.42%62.76%66.25%
0%10%20%30%40%50%60%70%80%90%
100%
2010 2011 2012 2013 2014 2015 2016 2017
Sta
tew
ide
Wei
gh
ted
Rat
es
HEDIS Report Year
Footnote: Data reporting began in 2009 (2008 and 2009 data are not reported in these graphs). In 2012 measure specifications changed; trending between 2012 and prior years should be considered with caution.
39.52%
20.79%
51.03%55.01% 54.24%
56.91%54.98%
61.33%
0%10%20%30%40%50%60%70%80%90%
100%
2010 2011 2012 2013 2014 2015 2016 2017
Sta
tew
ide
Wei
gh
ted
Rat
es
HEDIS Report Year
Footnote: Data reporting began in 2009 (2008 and 2009 data are not reported in these graphs). In 2012 measure specifications changed; trending between 2012 and prior years should be considered with caution.
43.43%
23.15%
56.30% 58.28% 60.62% 62.03% 60.29%64.66%
0%10%20%30%40%50%60%70%80%90%
100%
2010 2011 2012 2013 2014 2015 2016 2017
Sta
tew
ide
Wei
gh
ted
Rat
es
HEDIS Report Year
Footnote: Data reporting began in 2009 (2008 and 2009 data are not reported in these graphs). In 2012 measure specifications changed; trending between 2012 and prior years should be considered with caution.
29.96%18.75%
39.13%45.54%
52.77%55.64%53.08%55.64%
0%10%20%30%40%50%60%70%80%90%
100%
2010 2011 2012 2013 2014 2015 2016 2017
Sta
tew
ide
Wei
gh
ted
Rat
es
HEDIS Report Year
Footnote: Data reporting began in 2009 (2008 and 2009 data are not reported in these graphs). In 2016, changes were made to numerator criteria; trending with prior years should be considered with caution.

2017 HEDIS/CAHPS REPORT Medicaid HEDIS Trending—Effectiveness of Care Measures: Prevention and Screening
page 54 TN Division of Health Care Finance and Administration │ TennCare 17.EQRO.06.017
Fig. 9. WCC—Counseling for Physical Activity: 12–17 years Fig. 10. WCC—Counseling for Physical Activity: Total
Fig. 11. Childhood Immunization Status (CIS): DTap Fig. 12. CIS: IPV
32.98%
18.13%
40.29%48.02%
52.67%56.09%54.47%59.45%
0%10%20%30%40%50%60%70%80%90%
100%
2010 2011 2012 2013 2014 2015 2016 2017
Sta
tew
ide
Wei
gh
ted
Rat
es
HEDIS Report Year
Footnote: Data reporting began in 2009 (2008 and 2009 data are not reported in these graphs). In 2016, changes were made to numerator criteria; trending with prior years should be considered with caution.
30.94%
18.58%
39.63%46.36%
52.70% 55.77% 53.59% 56.89%
0%10%20%30%40%50%60%70%80%90%
100%
2010 2011 2012 2013 2014 2015 2016 2017
Sta
tew
ide
Wei
gh
ted
Rat
es
HEDIS Report Year
Footnote: Data reporting began in 2009 (2008 and 2009 data are not reported in these graphs). In 2016, changes were made to numerator criteria; trending with prior years should be considered with caution.
79.20% 79.14%83.73%80.70%79.52%
80.17%79.00%78.23%76.91%73.60%
0%10%20%30%40%50%60%70%80%90%
100%
2006 2007 2010 2011 2012 2013 2014 2015 2016 2017
Sta
tew
ide
Wei
gh
ted
Rat
es
HEDIS Report Year
Footnote: In 2015, due to notable changes in the measure specification, trending between prior years’ should be considered with caution.
89.20%90.28%93.55%94.84%93.94%93.86%93.07%92.36%91.23%89.47%
0%10%20%30%40%50%60%70%80%90%
100%
2006 2007 2010 2011 2012 2013 2014 2015 2016 2017
Sta
tew
ide
Wei
gh
ted
Rat
es
HEDIS Report Year
Footnote: In 2015, due to notable changes in the measure specification, trending between prior years’ should be considered with caution.
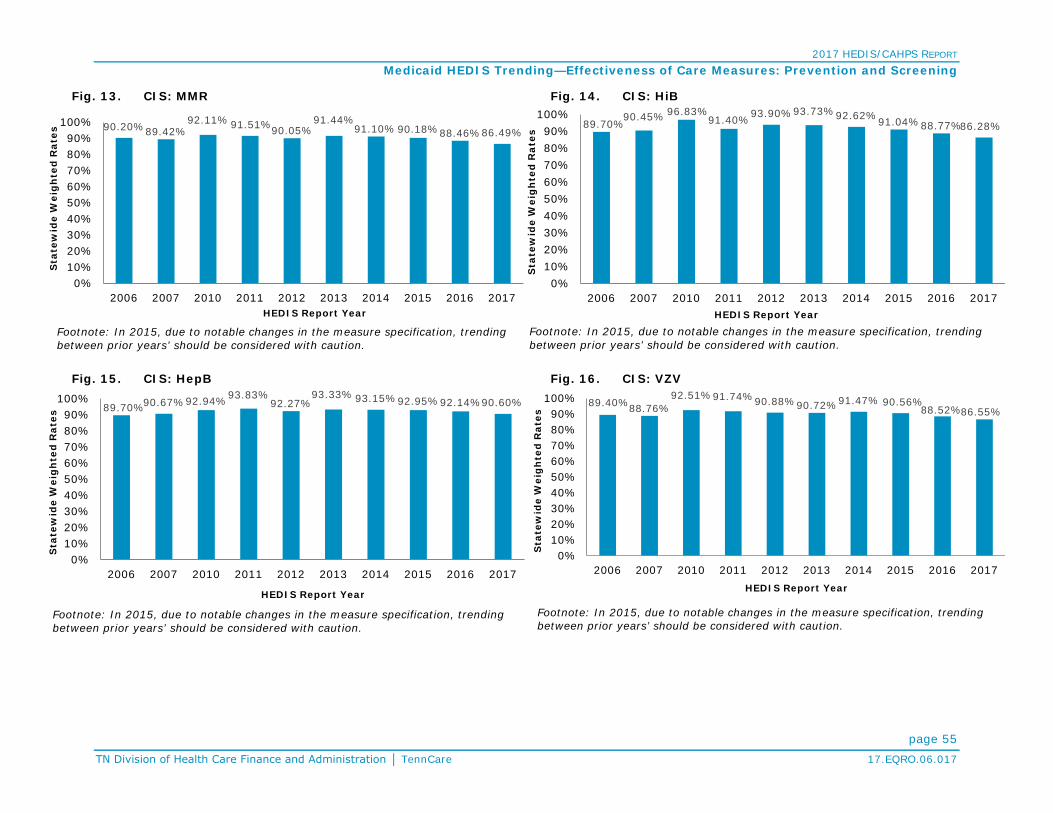
2017 HEDIS/CAHPS REPORT Medicaid HEDIS Trending—Effectiveness of Care Measures: Prevention and Screening
page 55 TN Division of Health Care Finance and Administration │ TennCare 17.EQRO.06.017
Fig. 13. CIS: MMR Fig. 14. CIS: HiB
Fig. 15. CIS: HepB Fig. 16. CIS: VZV
90.20%89.42%92.11% 91.51%90.05%
91.44%91.10% 90.18%88.46%86.49%
0%10%20%30%40%50%60%70%80%90%
100%
2006 2007 2010 2011 2012 2013 2014 2015 2016 2017
Sta
tew
ide
Wei
gh
ted
Rat
es
HEDIS Report Year
Footnote: In 2015, due to notable changes in the measure specification, trending between prior years’ should be considered with caution.
89.70%90.45% 96.83%
91.40%93.90%93.73%92.62%91.04%88.77%86.28%
0%10%20%30%40%50%60%70%80%90%
100%
2006 2007 2010 2011 2012 2013 2014 2015 2016 2017
Sta
tew
ide
Wei
gh
ted
Rat
es
HEDIS Report Year
Footnote: In 2015, due to notable changes in the measure specification, trending between prior years’ should be considered with caution.
89.70%90.67%92.94%93.83%92.27%
93.33% 93.15%92.95%92.14%90.60%
0%10%20%30%40%50%60%70%80%90%
100%
2006 2007 2010 2011 2012 2013 2014 2015 2016 2017
Sta
tew
ide
Wei
gh
ted
Rat
es
HEDIS Report Year
Footnote: In 2015, due to notable changes in the measure specification, trending between prior years’ should be considered with caution.
89.40%88.76%92.51%91.74%90.88%90.72%91.47% 90.56%
88.52%86.55%
0%10%20%30%40%50%60%70%80%90%
100%
2006 2007 2010 2011 2012 2013 2014 2015 2016 2017
Sta
tew
ide
Wei
gh
ted
Rat
es
HEDIS Report Year
Footnote: In 2015, due to notable changes in the measure specification, trending between prior years’ should be considered with caution.
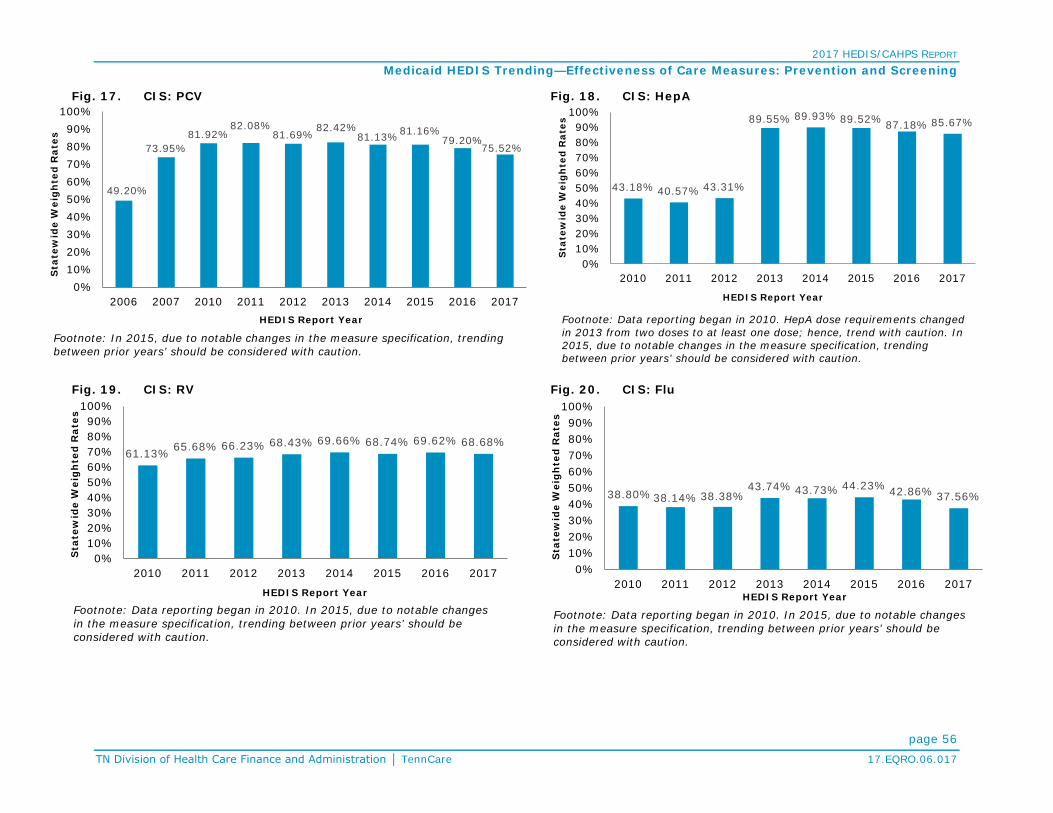
2017 HEDIS/CAHPS REPORT Medicaid HEDIS Trending—Effectiveness of Care Measures: Prevention and Screening
page 56 TN Division of Health Care Finance and Administration │ TennCare 17.EQRO.06.017
Fig. 17. CIS: PCV Fig. 18. CIS: HepA
Fig. 19. CIS: RV Fig. 20. CIS: Flu
49.20%
73.95%81.92%
82.08%81.69%
82.42%81.13%81.16%
79.20%75.52%
0%10%20%30%40%50%60%70%80%90%
100%
2006 2007 2010 2011 2012 2013 2014 2015 2016 2017
Sta
tew
ide
Wei
gh
ted
Rat
es
HEDIS Report Year
Footnote: In 2015, due to notable changes in the measure specification, trending between prior years’ should be considered with caution.
43.18% 40.57% 43.31%
89.55% 89.93% 89.52% 87.18% 85.67%
0%10%20%30%40%50%60%70%80%90%
100%
2010 2011 2012 2013 2014 2015 2016 2017
Sta
tew
ide
Wei
gh
ted
Rat
es
HEDIS Report Year
Footnote: Data reporting began in 2010. HepA dose requirements changed in 2013 from two doses to at least one dose; hence, trend with caution. In 2015, due to notable changes in the measure specification, trending between prior years’ should be considered with caution.
61.13% 65.68% 66.23% 68.43% 69.66% 68.74% 69.62% 68.68%
0%10%20%30%40%50%60%70%80%90%
100%
2010 2011 2012 2013 2014 2015 2016 2017
Sta
tew
ide
Wei
gh
ted
Rat
es
HEDIS Report Year
Footnote: Data reporting began in 2010. In 2015, due to notable changes in the measure specification, trending between prior years’ should be considered with caution.
38.80%38.14% 38.38%43.74% 43.73% 44.23% 42.86% 37.56%
0%10%20%30%40%50%60%70%80%90%
100%
2010 2011 2012 2013 2014 2015 2016 2017
Sta
tew
ide
Wei
gh
ted
Rat
es
HEDIS Report Year
Footnote: Data reporting began in 2010. In 2015, due to notable changes in the measure specification, trending between prior years’ should be considered with caution.

2017 HEDIS/CAHPS REPORT Medicaid HEDIS Trending—Effectiveness of Care Measures: Prevention and Screening
page 57 TN Division of Health Care Finance and Administration │ TennCare 17.EQRO.06.017
Fig. 21. CIS: Combination 2 Fig. 22. CIS: Combination 3
Fig. 23. CIS: Combination 4 Fig. 24. CIS: Combination 5
73.40%74.08%
78.17%74.21%
75.37%76.28%
75.24% 74.24%74.27%70.82%
0%10%20%30%40%50%60%70%80%90%
100%
2006 2007 2010 2011 2012 2013 2014 2015 2016 2017
Sta
tew
ide
Wei
gh
ted
Rat
es
HEDIS Report Year
Footnote: In 2015, due to notable changes in the measure specification, trending between prior years’ should be considered with caution.
44.30%
65.62%72.71%
70.28%72.01%73.02%
72.12%72.13%
71.08%68.02%
0%10%20%30%40%50%60%70%80%90%
100%
2006 2007 2010 2011 2012 2013 2014 2015 2016 2017
Sta
tew
ide
Wei
gh
ted
Rat
es
HEDIS Report Year
Footnote: In 2015, due to notable changes in the measure specification, trending between prior years’ should be considered with caution.
38.55% 36.24% 40.13%
71.63% 71.18% 71.28% 70.27%67.66%
0%10%20%30%40%50%60%70%80%90%
100%
2010 2011 2012 2013 2014 2015 2016 2017
Sta
tew
ide
Wei
gh
ted
Rat
es
HEDIS Report Year
Footnote: Data reporting began in 2010. HepA dose requirements changed in 2013 from two doses to at least one dose; hence, trend with caution. In 2015, due to notable changes in the measure specification, trending between prior years’ should be considered with caution.
50.67% 52.58% 54.64% 56.98% 57.66% 57.31% 57.87% 56.44%
0%10%20%30%40%50%60%70%80%90%
100%
2010 2011 2012 2013 2014 2015 2016 2017S
tate
wid
e W
eig
hte
d R
ates
HEDIS Report Year
Footnote: Data reporting began in 2010. In 2015, due to notable changes in the measure specification, trending between prior years’ should be considered with caution.

2017 HEDIS/CAHPS REPORT Medicaid HEDIS Trending—Effectiveness of Care Measures: Prevention and Screening
page 58 TN Division of Health Care Finance and Administration │ TennCare 17.EQRO.06.017
Fig. 25. CIS: Combination 6 Fig. 26. CIS: Combination 7
Fig. 27. CIS: Combination 8 Fig. 28. CIS: Combination 9
33.22% 32.11% 32.90%37.88% 38.24% 38.15% 37.28%
32.31%
0%10%20%30%40%50%60%70%80%90%
100%
2010 2011 2012 2013 2014 2015 2016 2017
Sta
tew
ide
Wei
gh
ted
Rat
es
HEDIS Report Year
Footnote: Data reporting began in 2010. In 2015, due to notable changes in the measure specification, trending between prior years’ should be considered with caution.
28.18% 28.34% 31.79%
56.13% 56.88% 56.69% 57.32% 56.20%
0%10%20%30%40%50%60%70%80%90%
100%
2010 2011 2012 2013 2014 2015 2016 2017
Sta
tew
ide
Wei
gh
ted
Rat
es
HEDIS Report Year
Footnote: Data reporting began in 2010. HepA dose requirements changed in 2013 from two doses to at least one dose; hence, trend with caution.In 2015, due to notable changes in the measure specification, trending between prior years’ should be considered with caution.
19.66% 18.45% 20.83%
37.24% 38.07% 37.92% 37.02%32.19%
0%10%20%30%40%50%60%70%80%90%
100%
2010 2011 2012 2013 2014 2015 2016 2017
Sta
tew
ide
Wei
gh
ted
Rat
es
HEDIS Report Year
Footnote: Data reporting began in 2010. HepA dose requirements changed in 2013 from two doses to at least one dose; hence, trend with caution. In 2015, due to notable changes in the measure specification, trending between prior years’ should be considered with caution.
25.14% 26.63% 26.98%31.99% 33.02% 32.56% 31.78% 28.06%
0%10%20%30%40%50%60%70%80%90%
100%
2010 2011 2012 2013 2014 2015 2016 2017
Sta
tew
ide
Wei
gh
ted
Rat
es
HEDIS Report Year
Footnote: Data reporting began in 2010. In 2015, due to notable changes in the measure specification, trending between prior years’ should be considered with caution.

2017 HEDIS/CAHPS REPORT Medicaid HEDIS Trending—Effectiveness of Care Measures: Prevention and Screening
page 59 TN Division of Health Care Finance and Administration │ TennCare 17.EQRO.06.017
Fig. 29. CIS: Combination 10 Fig. 30. Immunizations for Adolescents (IMA): Meningococcal
Fig. 31. IMA: Tdap/Td Fig. 32. HPV: Adolescents
15.29% 15.57% 17.54%
31.53% 32.89% 32.37% 31.64% 27.94%
0%10%20%30%40%50%60%70%80%90%
100%
2010 2011 2012 2013 2014 2015 2016 2017
Sta
tew
ide
Wei
gh
ted
Rat
es
HEDIS Report Year
Footnote: Data reporting began in 2010. HepA dose requirements changed in 2013 from two doses to at least one dose; hence, trend with caution. In 2015, due to notable changes in the measure specification, trending between prior years’ should be considered with caution.
39.91%47.58%
60.34%65.69% 66.27% 67.74% 67.84% 69.74%
0%10%20%30%40%50%60%70%80%90%
100%
2010 2011 2012 2013 2014 2015 2016 2017
Sta
tew
ide
Wei
gh
ted
Rat
es
HEDIS Report Year
Footnote: Data reporting began in 2010.
44.52%53.48%
76.12%83.31% 83.57% 84.27%
81.80% 82.75%
0%10%20%30%40%50%60%70%80%90%
100%
2010 2011 2012 2013 2014 2015 2016 2017
Sta
tew
ide
Wei
gh
ted
Rat
es
HEDIS Report Year
Footnote: Data reporting began in 2010.
15.07% 16.78% 17.47% 17.43% 15.89% 13.23%
0%10%20%30%40%50%60%70%80%90%
100%
2012 2013 2014 2015 2016 2017
Sta
tew
ide
Wei
gh
ted
Rat
es
HEDIS Report Year
Footnote: Data reporting began in 2012. In 2015, due to notable changes in the measure specification, trending between prior years’ should be considered with caution. Measure extended to males and females as of HEDIS 2017, was female only in prior years.

2017 HEDIS/CAHPS REPORT Medicaid HEDIS Trending—Effectiveness of Care Measures: Prevention and Screening
page 60 TN Division of Health Care Finance and Administration │ TennCare 17.EQRO.06.017
Fig. 33. IMA: Combination 1 Fig. 34. Lead Screening in Children (LSC)
Fig. 35. Breast Cancer Screening (BCS) Fig. 36. Cervical Cancer Screening (CCS)
35.02%43.16%
58.66%64.40%
65.48% 66.75% 67.13% 68.87%
0%10%20%30%40%50%60%70%80%90%
100%
2010 2011 2012 2013 2014 2015 2016 2017
Sta
tew
ide
Wei
gh
ted
Rat
es
HEDIS Report Year
Footnote: Data reporting began in 2010.
65.72%70.87% 71.65% 72.18% 73.44% 73.70% 70.29% 70.64%
0%10%20%30%40%50%60%70%80%90%
100%
2010 2011 2012 2013 2014 2015 2016 2017
Sta
tew
ide
Wei
gh
ted
Rat
es
HEDIS Report Year
Footnote: Data reporting began in 2008 (2008 and 2009 data are not reported in these graphs). Measure specifications changed in 2011; trending between 2011 and prior years should be considered with caution.
52.47% 54.08% 54.47% 54.90%
0%10%20%30%40%50%60%70%80%90%
100%
2014 2015 2016 2017
Sta
tew
ide
Wei
gh
ted
Rat
es
HEDIS Report Year
Footnote: Due to significant changes to the measure specification in 2014, results for this measure cannot be trended with previous years' results.
66.25% 64.83%55.60% 59.21%
0%10%20%30%40%50%60%70%80%90%
100%
2014 2015 2016 2017
Sta
tew
ide
Wei
gh
ted
Rat
es
HEDIS Report Year
Footnote: Due to significant changes to the measure specification in 2014 CCS was identifies as having first-year status, results for this measure cannot be trended with previous years' results.

2017 HEDIS/CAHPS REPORT Medicaid HEDIS Trending—Effectiveness of Care Measures: Prevention and Screening
page 61 TN Division of Health Care Finance and Administration │ TennCare 17.EQRO.06.017
Fig. 37. Chlamydia Screening in Women (CHL): 16–20 years Fig. 38. CHL: 21–24 years
Fig. 39. CHL: Total
48.90%50.00%53.77%53.93%
54.48%53.62%51.54%48.88%48.17%49.57%
0%10%20%30%40%50%60%70%80%90%
100%
2006 2007 2010 2011 2012 2013 2014 2015 2016 2017
Sta
tew
ide
Wei
gh
ted
Rat
es
HEDIS Report Year
60.86% 62.10% 62.52% 62.58% 62.56%55.93% 54.61% 57.38%
0%10%20%30%40%50%60%70%80%90%
100%
2010 2011 2012 2013 2014 2015 2016 2017
Sta
tew
ide
Wei
gh
ted
Rat
es
HEDIS Report Year
Footnote: Age stratification changed in 2009 (2008 and 2009 data are not reported in these graphs); as such, no comparative data are available from previous years.
56.59% 57.19% 57.75% 57.39% 56.03% 52.03% 51.19% 52.76%
0%10%20%30%40%50%60%70%80%90%
100%
2010 2011 2012 2013 2014 2015 2016 2017
Sta
tew
ide
Wei
gh
ted
Rat
es
HEDIS Report Year
Footnote: Age stratification changed in 2009 (2008 and 2009 data are not reported in these graphs); as such, no comparative data are available from previous years.

2017 HEDIS/CAHPS REPORT Medicaid HEDIS Trending
page 62 TN Division of Health Care Finance and Administration │ TennCare 17.EQRO.06.017
Effectiveness of Care Measures—Respiratory Conditions Fig. 40. Appropriate Testing for Children With Pharyngitis (CWP) Fig. 41. Use of Spirometry Testing in the Assessment and
Diagnosis of COPD (SPR)
Fig. 42. Pharmacotherapy Management of COPD Exacerbation
(PCE): Systemic Corticosteroid Fig. 43. PCE: Bronchodilator
64.50%66.71%70.13%72.05%75.27%76.03%77.75%
79.06%79.45%82.67%
0%10%20%30%40%50%60%70%80%90%
100%
2006 2007 2010 2011 2012 2013 2014 2015 2016 2017Sta
tew
ide
Wei
gh
ted
Rat
es
HEDIS Report Year
Footnote: For HEDIS 2016, the description and ages were changed from “2–18 years of age” to “3–18 years of age”; trending with prior years should be done with caution.
28.56%27.52%26.17%30.68%
35.36%34.40%34.34%33.68%31.36%31.72%
0%10%20%30%40%50%60%70%80%90%
100%
2006 2007 2010 2011 2012 2013 2014 2015 2016 2017
Sta
tew
ide
Wei
gh
ted
Rat
es
HEDIS Report Year
Footnote: Measure specifications changed in 2011; trending between 2011 and prior years should be considered with caution.
38.59%42.54% 45.55% 47.81% 50.91% 51.32% 52.23%
47.75%
0%10%20%30%40%50%60%70%80%90%
100%
2010 2011 2012 2013 2014 2015 2016 2017
Sta
tew
ide
Wei
gh
ted
Rat
es
HEDIS Report Year
Footnote: Data reporting began in 2008 (2008 and 2009 data are not reported in these graphs). For HEDIS 2017, the exclusion was deleted for Episode Dates when there was a readmission or an ED visit within 14 days.
65.78%73.17% 72.13% 73.48% 76.34% 76.43% 75.41% 72.71%
0%10%20%30%40%50%60%70%80%90%
100%
2010 2011 2012 2013 2014 2015 2016 2017
Sta
tew
ide
Wei
gh
ted
Rat
es
HEDIS Report Year
Footnote: Data reporting began in 2008 (2008 and 2009 data are not reported in these graphs). For HEDIS 2017, the exclusion was deleted for Episode Dates when there was a readmission or an ED visit within 14 days.

2017 HEDIS/CAHPS REPORT Medicaid HEDIS Trending—Effectiveness of Care Measures: Respiratory Conditions
page 63 TN Division of Health Care Finance and Administration │ TennCare 17.EQRO.06.017
Fig. 44. Medication Management for People With Asthma (MMA)—Medication Compliance 50%: 5–11 years
Fig. 45. MMA—Medication Compliance 50%: 12–18 years
Fig. 46. MMA—Medication Compliance 50%: 19-50 years Fig. 47. MMA—Medication Compliance 50%: 51–64 years
54.78% 54.30% 53.87% 50.05% 54.71% 50.03%
0%10%20%30%40%50%60%70%80%90%
100%
2012 2013 2014 2015 2016 2017
Sta
tew
ide
Wei
gh
ted
Rat
es
HEDIS Report Year
Footnote: Data reporting began in 2012.
49.54% 51.55% 51.45% 46.80%51.61% 51.10%
0%10%20%30%40%50%60%70%80%90%
100%
2012 2013 2014 2015 2016 2017
Sta
tew
ide
Wei
gh
ted
Rat
es
HEDIS Report Year
Footnote: Data reporting began in 2012.
45.06% 48.18% 52.81% 49.68%60.00%
54.39%
0%10%20%30%40%50%60%70%80%90%
100%
2012 2013 2014 2015 2016 2017
Sta
tew
ide
Wei
gh
ted
Rat
es
HEDIS Report Year
Footnote: Data reporting began in 2012.
62.50% 59.02% 59.49%67.38% 66.13% 65.73%
0%10%20%30%40%50%60%70%80%90%
100%
2012 2013 2014 2015 2016 2017
Sta
tew
ide
Wei
gh
ted
Rat
es
HEDIS Report Year
Footnote: Data reporting began in 2012.

2017 HEDIS/CAHPS REPORT Medicaid HEDIS Trending—Effectiveness of Care Measures: Respiratory Conditions
page 64 TN Division of Health Care Finance and Administration │ TennCare 17.EQRO.06.017
Fig. 48. MMA—Medication Compliance 50%: Total Fig. 49. MMA—Medication Compliance 75%: 5–11 years
Fig. 50. MMA—Medication Compliance 75%: 12–18 years Fig. 51. MMA—Medication Compliance 75%: 19–50 years
52.22% 52.85% 53.06% 49.31%55.05% 51.60%
0%10%20%30%40%50%60%70%80%90%
100%
2012 2013 2014 2015 2016 2017
Sta
tew
ide
Wei
gh
ted
Rat
es
HEDIS Report Year
Footnote: Data reporting began in 2012.
29.90%23.64% 26.87% 24.38%
0%10%20%30%40%50%60%70%80%90%
100%
2014 2015 2016 2017
Sta
tew
ide
Wei
gh
ted
Rat
es
HEDIS Report Year
Footnote: Due to significant changes to the measure specification in 2014, results for this measure cannot be trended with previous years' results.
27.06% 23.57% 26.63% 25.20%
0%10%20%30%40%50%60%70%80%90%
100%
2014 2015 2016 2017
Sta
tew
ide
Wei
gh
ted
Rat
es
HEDIS Report Year
Footnote: Due to significant changes to the measure specification in 2014, results for this measure cannot be trended with previous years' results.
31.39% 28.01%38.38%
30.06%
0%10%20%30%40%50%60%70%80%90%
100%
2014 2015 2016 2017
Sta
tew
ide
Wei
gh
ted
Rat
es
HEDIS Report Year
Footnote: Due to significant changes to the measure specification in 2014, results for this measure cannot be trended with previous years' results.

2017 HEDIS/CAHPS REPORT Medicaid HEDIS Trending—Effectiveness of Care Measures: Respiratory Conditions
page 65 TN Division of Health Care Finance and Administration │ TennCare 17.EQRO.06.017
Fig. 52. MMA—Medication Compliance 75%: 51–64 years Fig. 53. MMA—Medication Compliance 75%: Total
Fig. 54. Asthma Medical Ratio (AMR): 5–11 years Fig. 55. AMR: 12–18 years
35.86%41.94% 42.90% 46.15%
0%10%20%30%40%50%60%70%80%90%
100%
2014 2015 2016 2017
Sta
tew
ide
Wei
gh
ted
Rat
es
HEDIS Report Year
Footnote: Due to significant changes to the measure specification in 2014, results for this measure cannot be trended with previous years' results.
29.29% 24.61%29.35% 26.28%
0%10%20%30%40%50%60%70%80%90%
100%
2014 2015 2016 2017
Sta
tew
ide
Wei
gh
ted
Rat
es
HEDIS Report Year
Footnote: Due to significant changes to the measure specification in 2014, results for this measure cannot be trended with previous years' results.
74.99%82.62%
75.38% 77.09% 80.13%
0%10%20%30%40%50%60%70%80%90%
100%
2013 2014 2015 2016 2017
Sta
tew
ide
Wei
gh
ted
Rat
es
HEDIS Report Year
Footnote: Data reporting began in 2013. In 2015, an error was identified in the National Drug Code (NDC) list dosing requirement for one of the NDCs used when reporting the AMR measure. Trending between prior years’ should be considered with caution.
64.33%70.68%
62.32% 64.97%71.17%
0%10%20%30%40%50%60%70%80%90%
100%
2013 2014 2015 2016 2017
Sta
tew
ide
Wei
gh
ted
Rat
es
HEDIS Report Year
Footnote: Data reporting began in 2013. In 2015, an error was identified in the National Drug Code (NDC) list dosing requirement for one of the NDCs used when reporting the AMR measure. Trending between prior years’ should be considered with caution.
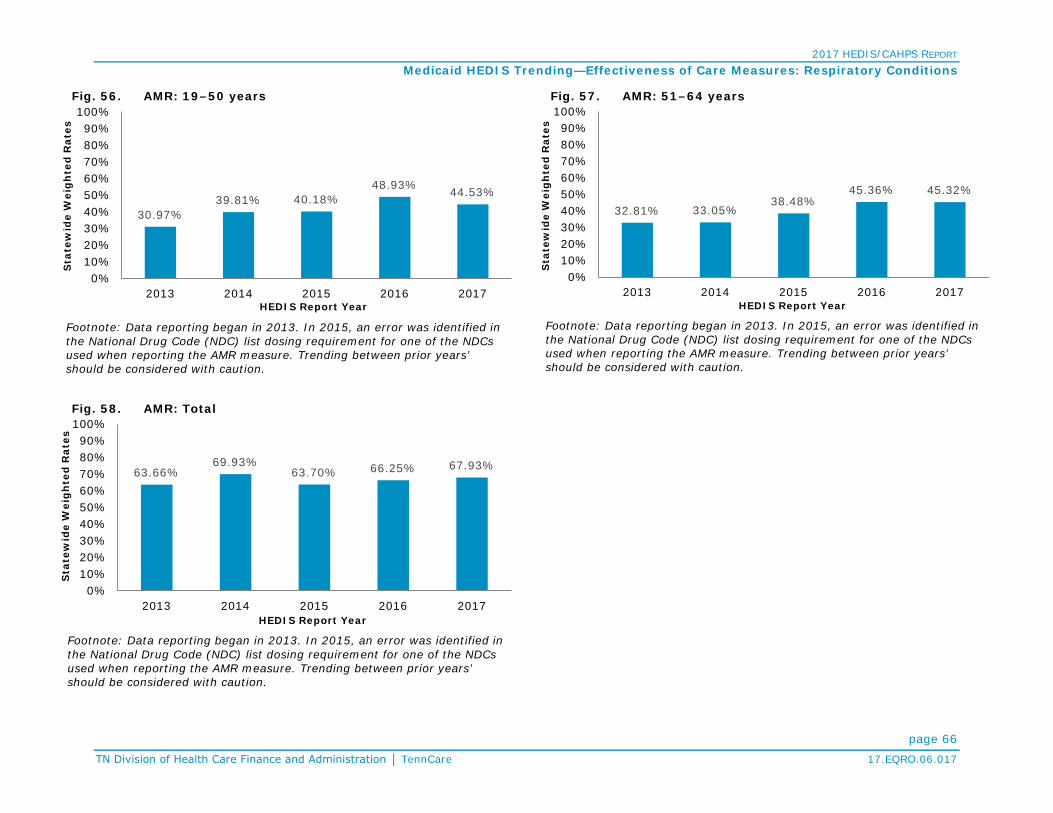
2017 HEDIS/CAHPS REPORT Medicaid HEDIS Trending—Effectiveness of Care Measures: Respiratory Conditions
page 66 TN Division of Health Care Finance and Administration │ TennCare 17.EQRO.06.017
Fig. 56. AMR: 19–50 years Fig. 57. AMR: 51–64 years
Fig. 58. AMR: Total
30.97%39.81% 40.18%
48.93% 44.53%
0%10%20%30%40%50%60%70%80%90%
100%
2013 2014 2015 2016 2017
Sta
tew
ide
Wei
gh
ted
Rat
es
HEDIS Report Year
Footnote: Data reporting began in 2013. In 2015, an error was identified in the National Drug Code (NDC) list dosing requirement for one of the NDCs used when reporting the AMR measure. Trending between prior years’ should be considered with caution.
32.81% 33.05%38.48%
45.36% 45.32%
0%10%20%30%40%50%60%70%80%90%
100%
2013 2014 2015 2016 2017
Sta
tew
ide
Wei
gh
ted
Rat
es
HEDIS Report Year
Footnote: Data reporting began in 2013. In 2015, an error was identified in the National Drug Code (NDC) list dosing requirement for one of the NDCs used when reporting the AMR measure. Trending between prior years’ should be considered with caution.
63.66%69.93%
63.70% 66.25% 67.93%
0%10%20%30%40%50%60%70%80%90%
100%
2013 2014 2015 2016 2017
Sta
tew
ide
Wei
gh
ted
Rat
es
HEDIS Report Year
Footnote: Data reporting began in 2013. In 2015, an error was identified in the National Drug Code (NDC) list dosing requirement for one of the NDCs used when reporting the AMR measure. Trending between prior years’ should be considered with caution.

2017 HEDIS/CAHPS REPORT Medicaid HEDIS Trending
page 67 TN Division of Health Care Finance and Administration │ TennCare 17.EQRO.06.017
Effectiveness of Care Measures—Cardiovascular Conditions Fig. 59. Controlling High Blood Pressure (CBP) Fig. 60. Persistence of Beta-Blocker Treatment After a Heart
Attack (PBH)
Fig. 61. SPC—Received Statin Therapy: Males 21-75 years Fig. 62. SPC—Received Statin Therapy: Females 40 -75 years
56.50%49.43%
53.67%52.96%55.99%55.82%56.98%
54.99%55.10%55.63%
0%10%20%30%40%50%60%70%80%90%
100%
2006 2007 2010 2011 2012 2013 2014 2015 2016 2017
Sta
tew
ide
Wei
gh
ted
Rat
es
HEDIS Report Year
Footnote: In 2015, due to notable changes to the measure specification, results should be considered with caution.
70.50%60.36%
66.67%72.01%75.06%74.54%
83.10%79.32% 75.75%
79.19%
0%10%20%30%40%50%60%70%80%90%
100%
2006 2007 2010 2011 2012 2013 2014 2015 2016 2017
Sta
tew
ide
Wei
gh
ted
Rat
es
HEDIS Report Year
66.61% 70.66%
0%10%20%30%40%50%60%70%80%90%
100%
2016 2017
Sta
tew
ide
Wei
gh
ted
Rat
es
HEDIS Report Year
Footnote: Data reporting began in 2015.
66.05% 66.32%
0%10%20%30%40%50%60%70%80%90%
100%
2016 2017
Sta
tew
ide
Wei
gh
ted
Rat
es
HEDIS Report Year
Footnote: Data reporting began in 2015.

2017 HEDIS/CAHPS REPORT Medicaid HEDIS Trending—Effectiveness of Care Measures: Cardiovascular Conditions
page 68 TN Division of Health Care Finance and Administration │ TennCare 17.EQRO.06.017
Fig. 63. SPC—Received Statin Therapy: Total Fig. 64. SPC—Statin Adherence 80%: Males 21-75 years
Fig. 65. SPC—Statin Adherence 80%: Females 40 -75 years Fig. 66. SPC—Statin Adherence 80%: Total
66.34% 68.50%
0%10%20%30%40%50%60%70%80%90%
100%
2016 2017
Sta
tew
ide
Wei
gh
ted
Rat
es
HEDIS Report Year
Footnote: Data reporting began in 2015.
56.17% 57.13%
0%10%20%30%40%50%60%70%80%90%
100%
2016 2017
Sta
tew
ide
Wei
gh
ted
Rat
es
HEDIS Report Year
Footnote: Data reporting began in 2015.
50.77% 53.09%
0%10%20%30%40%50%60%70%80%90%
100%
2016 2017
Sta
tew
ide
Wei
gh
ted
Rat
es
HEDIS Report Year
Footnote: Data reporting began in 2015.
53.56% 55.19%
0%10%20%30%40%50%60%70%80%90%
100%
2016 2017
Sta
tew
ide
Wei
gh
ted
Rat
es
HEDIS Report Year
Footnote: Data reporting began in 2015.

2017 HEDIS/CAHPS REPORT Medicaid HEDIS Trending
page 69 TN Division of Health Care Finance and Administration │ TennCare 17.EQRO.06.017
Effectiveness of Care Measures—Diabetes Fig. 67. Comprehensive Diabetes Care (CDC): HbA1c Testing Fig. 68. CDC: HbA1c Control (<7.0%)
Fig. 69. CDC: HbA1c Control (<8.0%) Fig. 70. CDC: Retinal Eye Exam Performed
70.70%67.64%
77.93% 78.87%80.55%80.32%79.76%81.88%82.59%82.51%
0%10%20%30%40%50%60%70%80%90%
100%
2006 2007 2010 2011 2012 2013 2014 2015 2016 2017
Sta
tew
ide
Wei
gh
ted
Rat
es
HEDIS Report Year
Footnote: Trending between 2016 and prior years should be considered with caution due to conversion to ICD-10 codes. Also trending between 2015 and prior years’ should be considered with caution due to revision to General Guideline 41 and ED visit requirement.
21.22%
37.02% 34.64% 37.34% 38.54% 38.43% 37.05% 34.64% 37.43%
0%10%20%30%40%50%60%70%80%90%
100%
2007 2010 2011 2012 2013 2014 2015 2016 2017
Sta
tew
ide
Wei
gh
ted
Rat
es
HEDIS Report Year
Footnote: Trending between 2016 and prior years should be considered with caution due to conversion to ICD-10 codes. Also trending between 2015 and prior years’ should be considered with caution due to revision to General Guideline 41 and ED visit requirement.
46.05% 44.54% 48.08% 48.58% 49.22% 49.06% 47.62% 49.07%
0%10%20%30%40%50%60%70%80%90%
100%
2010 2011 2012 2013 2014 2015 2016 2017
Sta
tew
ide
Wei
gh
ted
Rat
es
HEDIS Report Year
Footnote: Trending between 2016 and prior years should be considered with caution due to conversion to ICD-10 codes. Also trending between 2015 and prior years’ should be considered with caution due to revision to General Guideline 41 and ED visit requirement.
33.00%33.15%35.12%37.02%37.64%37.66%38.69%41.45%42.87%44.87%
0%10%20%30%40%50%60%70%80%90%
100%
2006 2007 2010 2011 2012 2013 2014 2015 2016 2017
Sta
tew
ide
Wei
gh
ted
Rat
es
HEDIS Report Year
Footnote: Trending between 2016 and prior years should be considered with caution due to conversion to ICD-10 codes. Also trending between 2015 and prior years’ should be considered with caution due to revision to General Guideline 41 and ED visit requirement.

2017 HEDIS/CAHPS REPORT Medicaid HEDIS Trending—Effectiveness of Care Measures: Diabetes
page 70 TN Division of Health Care Finance and Administration │ TennCare 17.EQRO.06.017
Fig. 71. CDC: Medical Attention for Nephropathy Fig. 72. CDC: Blood Pressure Control (<140/90 mm Hg)
Fig. 73. CDC: HbA1c Poor Control (>9.0%)* Fig. 74. SPD—Received Statin Therapy: 40-75 years
32.40%
65.05%73.91%73.19%75.02%76.22%76.19%78.18%
90.89%89.06%
0%10%20%30%40%50%60%70%80%90%
100%
2006 2007 2010 2011 2012 2013 2014 2015 2016 2017
Sta
tew
ide
Wei
gh
ted
Rat
es
HEDIS Report Year
Footnote: Trending between 2016 and prior years should be considered with caution due to conversion to ICD-10 codes. Also trending between 2015 and prior years’ should be considered with caution due to revision to General Guideline 41 and ED visit requirement.
45.11%56.63% 55.03% 59.72% 59.03% 60.25% 59.91% 58.22% 58.35%
0%10%20%30%40%50%60%70%80%90%
100%
2007 2010 2011 2012 2013 2014 2015 2016 2017
Sta
tew
ide
Wei
gh
ted
Rat
es
HEDIS Report Year
Footnote: Trending between 2016 and prior years should be considered with caution due to conversion to ICD-10 codes. Also trending between 2015 and prior years’ should be considered with caution due to revision to General Guideline 41 and ED visit requirement.
58.90%62.57%
45.61%47.85%44.78%43.22%42.22%41.80%43.23%41.92%
0%10%20%30%40%50%60%70%80%90%
100%
2006 2007 2010 2011 2012 2013 2014 2015 2016 2017
Sta
tew
ide
Wei
gh
ted
Rat
es
HEDIS Report Year
*Lower rates for this measure indicate better performance. Footnote: Trending between 2016 and prior years should be considered with caution due to conversion to ICD-10 codes. Also trending between 2015 and prior years’ should be considered with caution due to revision to General Guideline 41 and ED visit requirement.
53.06% 54.06%
0%10%20%30%40%50%60%70%80%90%
100%
2016 2017
Sta
tew
ide
Wei
gh
ted
Rat
es
HEDIS Report Year
Footnote: Data reporting began in 2015.
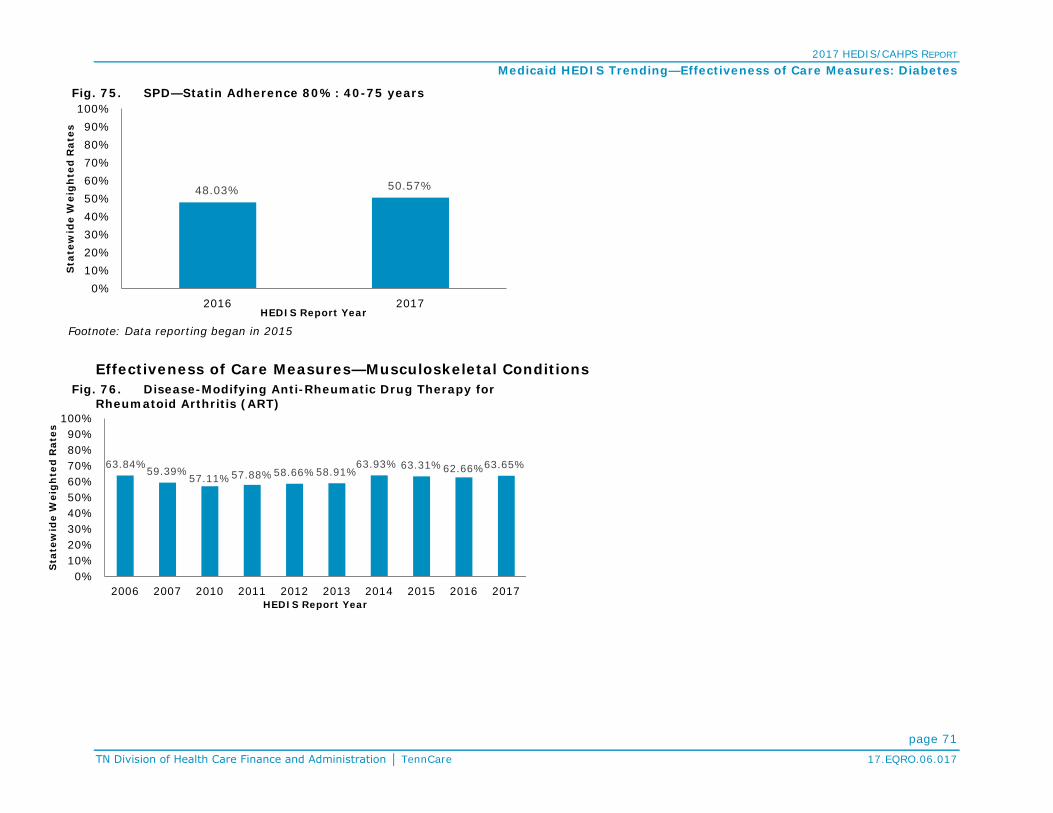
2017 HEDIS/CAHPS REPORT Medicaid HEDIS Trending—Effectiveness of Care Measures: Diabetes
page 71 TN Division of Health Care Finance and Administration │ TennCare 17.EQRO.06.017
Fig. 75. SPD—Statin Adherence 80%: 40-75 years
Effectiveness of Care Measures—Musculoskeletal Conditions Fig. 76. Disease-Modifying Anti-Rheumatic Drug Therapy for
Rheumatoid Arthritis (ART)
48.03% 50.57%
0%10%20%30%40%50%60%70%80%90%
100%
2016 2017
Sta
tew
ide
Wei
gh
ted
Rat
es
HEDIS Report Year
Footnote: Data reporting began in 2015
63.84%59.39%57.11%57.88%58.66%58.91%
63.93% 63.31%62.66%63.65%
0%10%20%30%40%50%60%70%80%90%
100%
2006 2007 2010 2011 2012 2013 2014 2015 2016 2017
Sta
tew
ide
Wei
gh
ted
Rat
es
HEDIS Report Year

2017 HEDIS/CAHPS REPORT Medicaid HEDIS Trending
page 72 TN Division of Health Care Finance and Administration │ TennCare 17.EQRO.06.017
Effectiveness of Care Measures—Behavioral Health Fig. 77. Antidepressant Medication Management (AMM):
Effective Acute Phase Treatment Fig. 78. AMM: Effective Continuation Phase Treatment
Fig. 79. Follow-Up Care for Children Prescribed ADHD
Medication (ADD): Initiation Phase Fig. 80. ADD: Continuation and Maintenance Phase
46.48% 48.62% 47.75% 46.52%
0%10%20%30%40%50%60%70%80%90%
100%
2014 2015 2016 2017
Sta
tew
ide
Wei
gh
ted
Rat
es
HEDIS Report Year
Footnote: Due to significant changes to the measure specification in 2014, results for this measure cannot be trended with previous years' results.
30.31% 31.39% 32.19% 30.56%
0%10%20%30%40%50%60%70%80%90%
100%
2014 2015 2016 2017
Sta
tew
ide
Wei
gh
ted
Rat
es
HEDIS Report Year
Footnote: Due to significant changes to the measure specification in 2014, results for this measure cannot be trended with previous years' results.
34.29%39.11% 38.28%
46.02% 45.82% 47.78% 49.26% 44.95%
0%10%20%30%40%50%60%70%80%90%
100%
2010 2011 2012 2013 2014 2015 2016 2017
Sta
tew
ide
Wei
gh
ted
Rat
es
HEDIS Report Year
Footnote: Behavioral Health was carved out prior to HEDIS 2009; as such, no comparative data are available from previous years.
44.15% 47.00% 47.21%57.54% 54.98%
59.69% 63.14% 59.45%
0%10%20%30%40%50%60%70%80%90%
100%
2010 2011 2012 2013 2014 2015 2016 2017
Sta
tew
ide
Wei
gh
ted
Rat
es
HEDIS Report Year
Footnote: Behavioral Health was carved out prior to HEDIS 2009; as such, no comparative data are available from previous years.

2017 HEDIS/CAHPS REPORT Medicaid HEDIS Trending—Effectiveness of Care Measures: Behavioral Health
page 73 TN Division of Health Care Finance and Administration │ TennCare 17.EQRO.06.017
Fig. 81. Follow-Up After Hospitalization for Mental Illness (FUH): 7-Day Follow-Up
Fig. 82. FUH: 30-Day Follow-Up
Fig. 83. Diabetes Screening for People With Schizophrenia or
Bipolar Disorder Who Are Using Antipsychotic Medication (SSD) Fig. 84. Diabetes Monitoring for People With Diabetes and
Schizophrenia (SMD)
37.93% 41.52% 45.73% 48.03%54.70%
61.94%55.95% 58.82%
0%10%20%30%40%50%60%70%80%90%
100%
2010 2011 2012 2013 2014 2015 2016 2017
Sta
tew
ide
Wei
gh
ted
Rat
es
HEDIS Report Year
Footnote: Behavioral Health was carved out prior to HEDIS 2009; as such, no comparative data are available from previous years.
61.24% 64.79% 66.83% 68.80% 71.85% 75.91%70.63% 71.29%
0%10%20%30%40%50%60%70%80%90%
100%
2010 2011 2012 2013 2014 2015 2016 2017
Sta
tew
ide
Wei
gh
ted
Rat
es
HEDIS Report Year
Footnote: Behavioral Health was carved out prior to HEDIS 2009; as such, no comparative data are available from previous years.
80.40% 79.85% 81.65% 81.20% 82.51%
0%10%20%30%40%50%60%70%80%90%
100%
2013 2014 2015 2016 2017
Sta
tew
ide
Wei
gh
ted
Rat
es
HEDIS Report Year
Footnote: Data reporting began in 2013.
67.69% 67.65% 71.20% 69.70% 70.29%
0%10%20%30%40%50%60%70%80%90%
100%
2013 2014 2015 2016 2017
Sta
tew
ide
Wei
gh
ted
Rat
es
HEDIS Report Year
Footnote: Data reporting began in 2013. In 2015, due to notable changes in the measure specification, trending between 2015 and prior years’ should be considered with caution.

2017 HEDIS/CAHPS REPORT Medicaid HEDIS Trending—Effectiveness of Care Measures: Behavioral Health
page 74 TN Division of Health Care Finance and Administration │ TennCare 17.EQRO.06.017
Fig. 85. Cardiovascular Monitoring for People With Cardiovascular Disease and Schizophrenia (SMC)
Fig. 86. Adherence to Antipsychotic Medications for Individuals With Schizophrenia (SAA)
Fig. 87. Metabolic Monitoring for Children and Adolescents on
Antipsychotics (APM): 1-5 Years Fig. 88. APM: 6-11 Years
80.00% 78.69%86.08% 82.89% 80.49%
0%10%20%30%40%50%60%70%80%90%
100%
2013 2014 2015 2016 2017
Sta
tew
ide
Wei
gh
ted
Rat
es
HEDIS Report Year
Footnote: Data reporting began in 2013.
61.91% 62.93% 59.70% 58.62% 58.68%
0%10%20%30%40%50%60%70%80%90%
100%
2013 2014 2015 2016 2017
Sta
tew
ide
Wei
gh
ted
Rat
es
HEDIS Report Year
Footnote: Data reporting began in 2013. In 2016, changes were made to the timeframe when identifying the Index Prescription State Date (IPSD). Trending between 2016 and prior years should be considered with caution.
19.55%13.59% 13.33%
0%10%20%30%40%50%60%70%80%90%
100%
2015 2016 2017
Sta
tew
ide
Wei
gh
ted
Rat
es
HEDIS Report Year
31.67% 28.71% 27.92%
0%10%20%30%40%50%60%70%80%90%
100%
2015 2016 2017
Sta
tew
ide
Wei
gh
ted
Rat
es
HEDIS Report Year
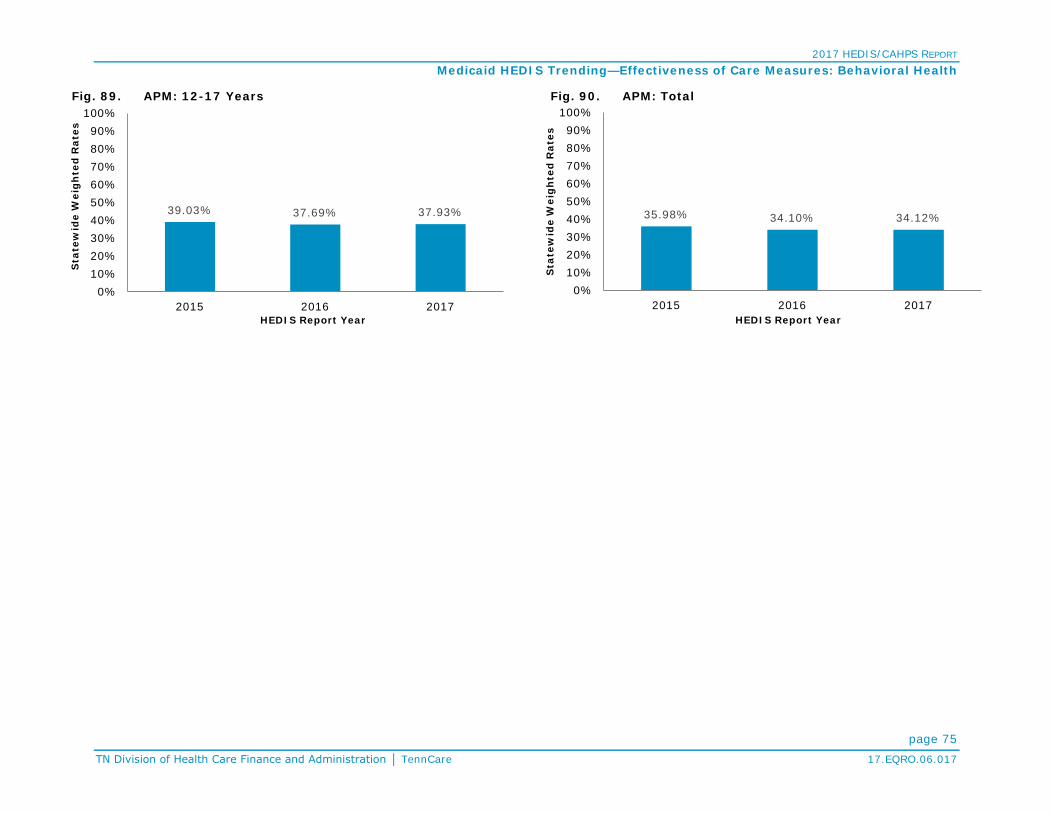
2017 HEDIS/CAHPS REPORT Medicaid HEDIS Trending—Effectiveness of Care Measures: Behavioral Health
page 75 TN Division of Health Care Finance and Administration │ TennCare 17.EQRO.06.017
Fig. 89. APM: 12-17 Years Fig. 90. APM: Total
39.03% 37.69% 37.93%
0%10%20%30%40%50%60%70%80%90%
100%
2015 2016 2017
Sta
tew
ide
Wei
gh
ted
Rat
es
HEDIS Report Year
35.98% 34.10% 34.12%
0%10%20%30%40%50%60%70%80%90%
100%
2015 2016 2017
Sta
tew
ide
Wei
gh
ted
Rat
es
HEDIS Report Year

2017 HEDIS/CAHPS REPORT Medicaid HEDIS Trending
page 76 TN Division of Health Care Finance and Administration │ TennCare 17.EQRO.06.017
Effectiveness of Care Measures—Medication Management Fig. 91. Annual Monitoring for Patients on Persistent
Medications (MPM): ACE Inhibitors or ARBs Fig. 92. MPM: Digoxin
Fig. 93. MPM: Diuretics Fig. 94. MPM: Total
90.61% 90.46% 90.30%
0%10%20%30%40%50%60%70%80%90%
100%
2015 2016 2017
Sta
tew
ide
Wei
gh
ted
Rat
es
HEDIS Report Year
Footnote: In 2015, due to significant changes to the measure specification, results for this measure cannot be trended to previous year's results.
57.14% 54.95% 58.22%
0%10%20%30%40%50%60%70%80%90%
100%
2015 2016 2017
Sta
tew
ide
Wei
gh
ted
Rat
es
HEDIS Report Year
Footnote: In 2015, due to significant changes to the measure specification, results for this measure cannot be trended to previous year's results.
90.88% 90.92% 90.70%
0%10%20%30%40%50%60%70%80%90%
100%
2015 2016 2017
Sta
tew
ide
Wei
gh
ted
Rat
es
HEDIS Report Year
Footnote: In 2015, due to significant changes to the measure specification, results for this measure cannot be trended to previous year's results.
90.33% 90.31% 90.22%
0%10%20%30%40%50%60%70%80%90%
100%
2015 2016 2017
Sta
tew
ide
Wei
gh
ted
Rat
e
HEDIS Report Year
Footnote: The anticonvulsants rate was retired in 2015 and is no longer part of the total rate. In 2015, due to significant changes to the measure specification, results for this measure cannot be trended to previous year's results.

2017 HEDIS/CAHPS REPORT Medicaid HEDIS Trending
page 77 TN Division of Health Care Finance and Administration │ TennCare 17.EQRO.06.017
Effectiveness of Care Measures—Overuse/Appropriateness Fig. 95. Non-Recommended Cervical Cancer Screening in
Adolescent Females (NCS)* Fig. 96. Appropriate Treatment for Children With Upper
Respiratory Infection (URI)
Fig. 97. Avoidance of Antibiotic Treatment in Adults With Acute Bronchitis (AAB)
Fig. 98. Use of Imaging Studies for Low Back Pain (LBP)
11.91% 8.75% 5.25% 3.83%0%
10%20%30%40%50%60%70%80%90%
100%
2014 2015 2016 2017
Sta
tew
ide
Wei
gh
ted
Rat
es
HEDIS Report Year
*Lower rates for this measure indicate better performance.Footnote: Data reporting began in 2014. In 2016, denied claims are no longer included when identifying the numerator of the measure. Trending between 2016 and prior years should be considered with caution.
72.40%
82.05%74.94% 74.95%74.21%74.84%75.05%77.02%79.25%81.85%
0%10%20%30%40%50%60%70%80%90%
100%
2006 2007 2010 2011 2012 2013 2014 2015 2016 2017
Sta
tew
ide
Wei
gh
ted
Rat
es
HEDIS Report Year
33.46%
21.51% 21.92% 24.39% 24.58% 27.89% 30.49% 32.61%
0%10%20%30%40%50%60%70%80%90%
100%
2010 2011 2012 2013 2014 2015 2016 2017
Sta
tew
ide
Wei
gh
ted
Rat
es
HEDIS Report Year
Footnote: The measure rate was inverted in 2008 (2008 and 2009 data are not reported in these graphs); as such, no comparative data are available from previous years.
75.26%73.85%
68.19%67.88%68.03%66.91%67.71%67.71%65.56%61.94%
0%10%20%30%40%50%60%70%80%90%
100%
2006 2007 2010 2011 2012 2013 2014 2015 2016 2017
Sta
tew
ide
Wei
gh
ted
Rat
es
HEDIS Report Year
Footnote: Because United American Healthcare Corporation did not report this measure in 2007, it was excluded from the statewide weighted average calculation for thatreport year. In 2016, the conversion to ICD-10 codes affected how low back pain, recent trauma and intravenous drug abuse are identified in the event/diagnosis. Trending between 2016 and prior years should be considered with caution.

2017 HEDIS/CAHPS REPORT Medicaid HEDIS Trending—Effectiveness of Care Measures: Overuse/Appropriateness
page 78 TN Division of Health Care Finance and Administration │ TennCare 17.EQRO.06.017
Fig. 99. Use of Multiple Concurrent Antipsychotics in Children and Adolescents (APC): 1-5 Years*
Fig. 100. APC: 6-11 Years*
Fig. 101. APC: 12-17 Years* Fig. 102. APC: Total*
1.44% 1.49% 2.94%0%
10%20%30%40%50%60%70%80%90%
100%
2015 2016 2017
Sta
tew
ide
Wei
gh
ted
Rat
es
HEDIS Report Year
*Lower rates for this measure indicate better performance.Footnote: Data reporting began in 2014.
1.29% 1.71% 1.77%0%
10%20%30%40%50%60%70%80%90%
100%
2015 2016 2017
Sta
tew
ide
Wei
gh
ted
Rat
es
HEDIS Report Year
*Lower rates for this measure indicate better performance.Footnote: Data reporting began in 2014.
1.25% 3.41% 3.22%0%
10%20%30%40%50%60%70%80%90%
100%
2015 2016 2017
Sta
tew
ide
Wei
gh
ted
Rat
es
HEDIS Report Year
*Lower rates for this measure indicate better performance.Footnote: Data reporting began in 2014.
1.27% 2.78% 2.72%0%
10%20%30%40%50%60%70%80%90%
100%
2015 2016 2017
Sta
tew
ide
Wei
gh
ted
Rat
es
HEDIS Report Year
*Lower rates for this measure indicate better performance.Footnote: Data reporting began in 2014.

2017 HEDIS/CAHPS REPORT Medicaid HEDIS Trending
page 79 TN Division of Health Care Finance and Administration │ TennCare 17.EQRO.06.017
Access/Availability of Care Measures Fig. 103. Adults’ Access to Preventive/Ambulatory Health
Services (AAP): 20–44 years Fig. 104. AAP: 45–64 years
Fig. 105. Children and Adolescents’ Access to Primary Care
Practitioners (CAP): 12–24 months Fig. 106. CAP: 25 months–6 years
72.10%70.29%79.50%80.28%80.62%80.66%82.21%
77.03%73.00%74.37%
0%10%20%30%40%50%60%70%80%90%
100%
2006 2007 2010 2011 2012 2013 2014 2015 2016 2017
Sta
tew
ide
Wei
gh
ted
Rat
es
HEDIS Report Year
75.40%73.42%79.89%
85.69%86.34%87.27%89.28%87.95%84.97%85.11%
0%10%20%30%40%50%60%70%80%90%
100%
2006 2007 2010 2011 2012 2013 2014 2015 2016 2017
Sta
tew
ide
Wei
gh
ted
Rat
es
HEDIS Report Year
93.60%93.90%97.10%97.07%97.14%96.94%97.27%
94.22%91.77%93.70%
0%10%20%30%40%50%60%70%80%90%
100%
2006 2007 2010 2011 2012 2013 2014 2015 2016 2017
Sta
tew
ide
Wei
gh
ted
Rat
es
HEDIS Report Year
83.40%84.19%89.85%89.91%90.37%90.51%90.26%88.06%85.15%84.48%
0%10%20%30%40%50%60%70%80%90%
100%
2006 2007 2010 2011 2012 2013 2014 2015 2016 2017
Sta
tew
ide
Wei
gh
ted
Rat
es
HEDIS Report Year

2017 HEDIS/CAHPS REPORT Medicaid HEDIS Trending—Access/Availability of Care Measures
page 80 TN Division of Health Care Finance and Administration │ TennCare 17.EQRO.06.017
Fig. 107. CAP: 7–11 years Fig. 108. CAP: 12–19 years
Fig. 109. Initiation and Engagement of Alcohol and Other Drug
(AOD) Dependence Treatment (IET)—Initiation of AOD Treatment: 13–17 years
Fig. 110. IET—Initiation of AOD Treatment: ≥18 years
85.10% 87.06%91.43%92.80% 93.14%93.47%93.96%93.55%91.15%89.55%
0%10%20%30%40%50%60%70%80%90%
100%
2006 2007 2010 2011 2012 2013 2014 2015 2016 2017
Sta
tew
ide
Wei
gh
ted
Rat
es
HEDIS Report Year
80.90%81.77%87.22%88.63%90.18%90.38%90.91%89.96%87.78%86.19%
0%10%20%30%40%50%60%70%80%90%
100%
2006 2007 2010 2011 2012 2013 2014 2015 2016 2017
Sta
tew
ide
Wei
gh
ted
Rat
es
HEDIS Report Year
59.32% 63.61%53.33% 48.57% 51.05% 48.96% 49.11% 48.29%
0%10%20%30%40%50%60%70%80%90%
100%
2010 2011 2012 2013 2014 2015 2016 2017
Sta
tew
ide
Wei
gh
ted
Rat
es
HEDIS Report Year
Footnote: Behavioral Health was carved out prior to HEDIS 2009; as such, no comparative data are available from previous years.
45.36%53.71%
42.54%36.78% 35.69% 37.22% 33.36% 35.62%
0%10%20%30%40%50%60%70%80%90%
100%
2010 2011 2012 2013 2014 2015 2016 2017
Sta
tew
ide
Wei
gh
ted
Rat
es
HEDIS Report Year
Footnote: Behavioral Health was carved out prior to HEDIS 2009; as such, no comparative data are available from previous years.

2017 HEDIS/CAHPS REPORT Medicaid HEDIS Trending—Access/Availability of Care Measures
page 81 TN Division of Health Care Finance and Administration │ TennCare 17.EQRO.06.017
Fig. 111. IET—Initiation of AOD Treatment: Total Fig. 112. IET—Engagement of AOD Treatment: 13–17 years
Fig. 113. IET—Engagement of AOD Treatment: ≥18 years Fig. 114. IET—Engagement of AOD Treatment: Total
46.48%54.45%
43.38%37.62% 36.65% 37.90% 34.22% 36.30%
0%10%20%30%40%50%60%70%80%90%
100%
2010 2011 2012 2013 2014 2015 2016 2017
Sta
tew
ide
Wei
gh
ted
Rat
es
HEDIS Report Year
Footnote: Behavioral Health was carved out prior to HEDIS 2009; as such, no comparative data are available from previous years.
34.73% 37.37%31.07% 27.90% 29.92% 26.42% 25.96% 25.65%
0%10%20%30%40%50%60%70%80%90%
100%
2010 2011 2012 2013 2014 2015 2016 2017
Sta
tew
ide
Wei
gh
ted
Rat
es
HEDIS Report Year
Footnote: Behavioral Health was carved out prior to HEDIS 2009; as such, no comparative data are available from previous years.
14.36% 14.93% 12.34% 9.82% 9.62% 9.83% 8.70% 10.34%
0%10%20%30%40%50%60%70%80%90%
100%
2010 2011 2012 2013 2014 2015 2016 2017
Sta
tew
ide
Wei
gh
ted
Rat
es
HEDIS Report Year
Footnote: Behavioral Health was carved out prior to HEDIS 2009; as such, no comparative data are available from previous years.
15.99% 16.61% 13.80% 11.10% 10.88% 10.78% 9.64% 11.16%
0%10%20%30%40%50%60%70%80%90%
100%
2010 2011 2012 2013 2014 2015 2016 2017
Sta
tew
ide
Wei
gh
ted
Rat
es
HEDIS Report Year
Footnote: Behavioral Health was carved out prior to HEDIS 2009; as such, no comparative data are available from previous years.
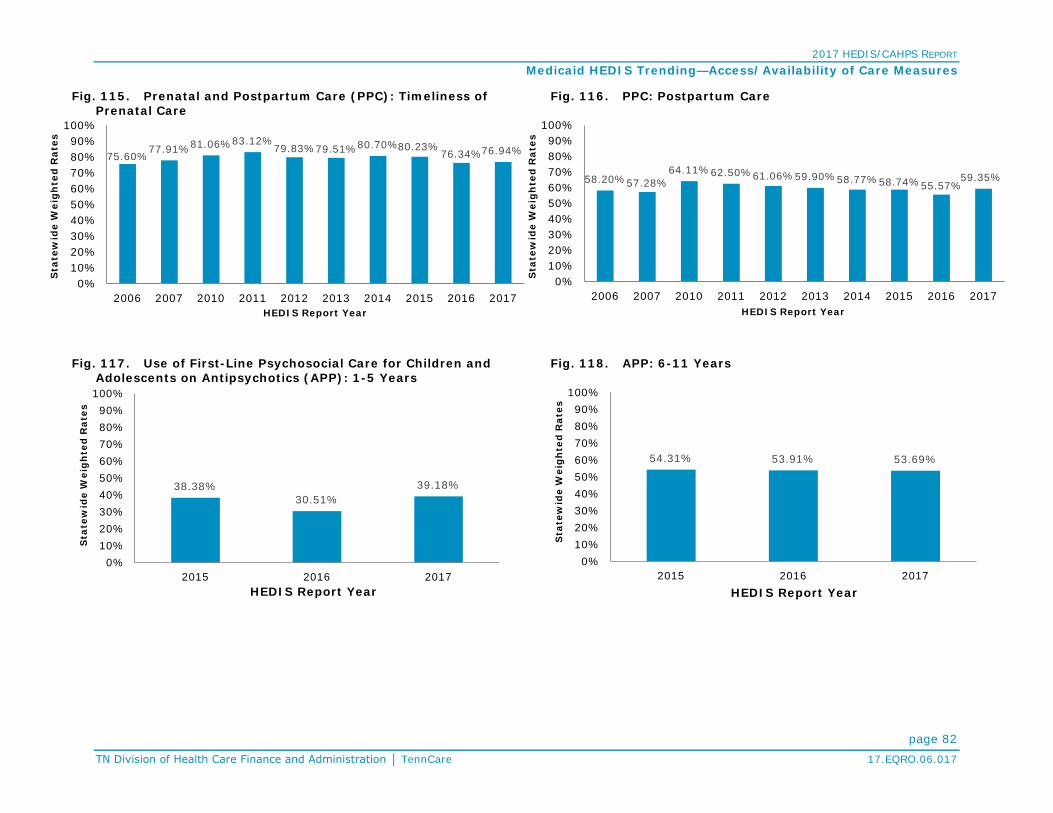
2017 HEDIS/CAHPS REPORT Medicaid HEDIS Trending—Access/Availability of Care Measures
page 82 TN Division of Health Care Finance and Administration │ TennCare 17.EQRO.06.017
Fig. 115. Prenatal and Postpartum Care (PPC): Timeliness of Prenatal Care
Fig. 116. PPC: Postpartum Care
Fig. 117. Use of First-Line Psychosocial Care for Children and Adolescents on Antipsychotics (APP): 1-5 Years
Fig. 118. APP: 6-11 Years
75.60%77.91%81.06%83.12%
79.83%79.51%80.70%80.23%76.34%76.94%
0%10%20%30%40%50%60%70%80%90%
100%
2006 2007 2010 2011 2012 2013 2014 2015 2016 2017
Sta
tew
ide
Wei
gh
ted
Rat
es
HEDIS Report Year
58.20%57.28%64.11%62.50%61.06%59.90%58.77%58.74%55.57%
59.35%
0%10%20%30%40%50%60%70%80%90%
100%
2006 2007 2010 2011 2012 2013 2014 2015 2016 2017
Sta
tew
ide
Wei
gh
ted
Rat
es
HEDIS Report Year
38.38%30.51%
39.18%
0%10%20%30%40%50%60%70%80%90%
100%
2015 2016 2017
Sta
tew
ide
Wei
gh
ted
Rat
es
HEDIS Report Year
54.31% 53.91% 53.69%
0%10%20%30%40%50%60%70%80%90%
100%
2015 2016 2017
Sta
tew
ide
Wei
gh
ted
Rat
es
HEDIS Report Year
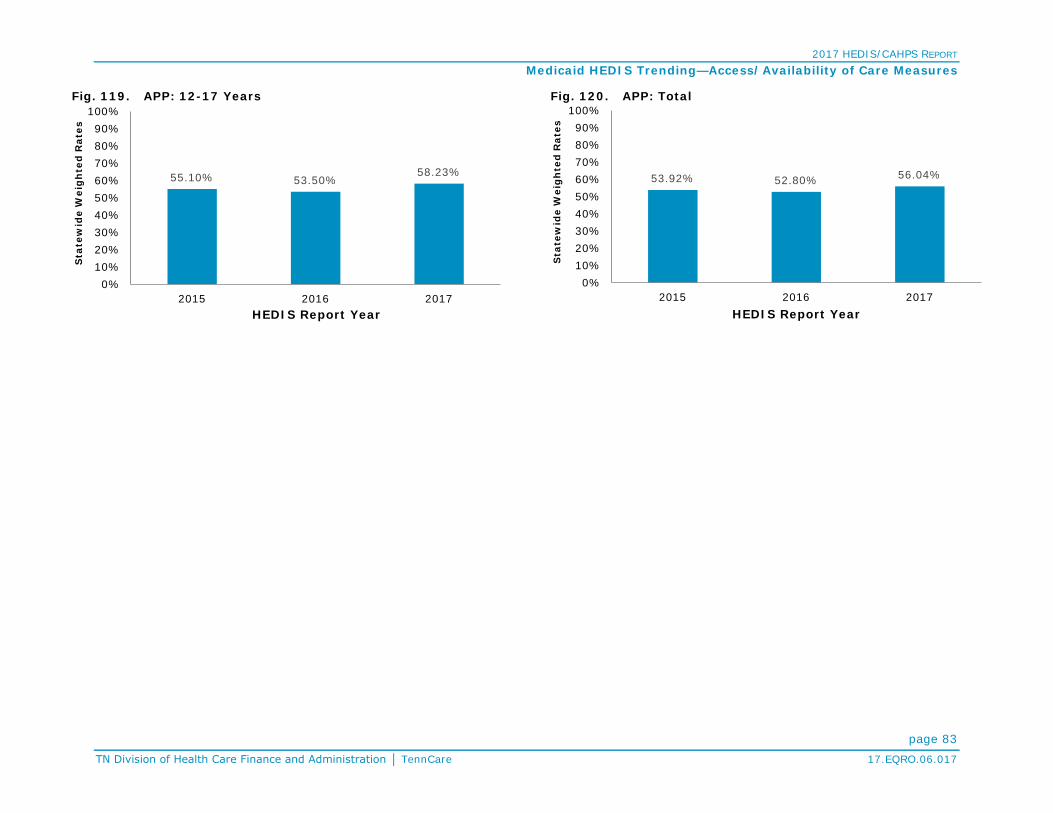
2017 HEDIS/CAHPS REPORT Medicaid HEDIS Trending—Access/Availability of Care Measures
page 83 TN Division of Health Care Finance and Administration │ TennCare 17.EQRO.06.017
Fig. 119. APP: 12-17 Years Fig. 120. APP: Total
55.10% 53.50%58.23%
0%10%20%30%40%50%60%70%80%90%
100%
2015 2016 2017
Sta
tew
ide
Wei
gh
ted
Rat
es
HEDIS Report Year
53.92% 52.80% 56.04%
0%10%20%30%40%50%60%70%80%90%
100%
2015 2016 2017
Sta
tew
ide
Wei
gh
ted
Rat
es
HEDIS Report Year

2017 HEDIS/CAHPS REPORT Medicaid HEDIS Trending
page 84 TN Division of Health Care Finance and Administration │ TennCare 17.EQRO.06.017
Utilization Measures Fig. 121. Frequency of Ongoing Prenatal Care (FPC): ≥ 81% Fig. 122. Well-Child Visits in the First 15 Months of Life (W15):
6 or More Visits
Fig. 123. Well-Child Visits in the Third, Fourth, Fifth and Sixth Years of Life (W34)
Fig. 124. Adolescent Well-Care Visits (AWC)
49.80%40.16%
51.82%61.07%58.29%61.60%63.08%
58.30%55.51%57.09%
0%10%20%30%40%50%60%70%80%90%
100%
2006 2007 2010 2011 2012 2013 2014 2015 2016 2017
Sta
tew
ide
Wei
gh
ted
Rat
es
HEDIS Report Year
34.80%35.76%
59.72%55.75%62.36%62.32%65.41%
60.69%57.63%60.94%
0%10%20%30%40%50%60%70%80%90%
100%
2006 2007 2010 2011 2012 2013 2014 2015 2016 2017
Sta
tew
ide
Wei
gh
ted
Rat
es
HEDIS Report Year
Footnote: In 2015, due to notable changes in the measure specification, trending between prior years’ should be considered with caution.
57.50%58.56%70.23% 71.80%72.69%71.68%70.80%69.70%68.01%69.18%
0%10%20%30%40%50%60%70%80%90%
100%
2006 2007 2010 2011 2012 2013 2014 2015 2016 2017
Sta
tew
ide
Wei
gh
ted
Rat
es
HEDIS Report Year
33.50%35.05%41.14%46.19%45.95%44.53%
50.27%47.18%
42.34%46.61%
0%10%20%30%40%50%60%70%80%90%
100%
2006 2007 2010 2011 2012 2013 2014 2015 2016 2017
Sta
tew
ide
Wei
gh
ted
Rat
es
HEDIS Report Year

2017 HEDIS/CAHPS REPORT
page 85 TN Division of Health Care Finance and Administration │ TennCare 17.EQRO.06.017
CHIP HEDIS/CAHPS Results At HCFA’s request, HEDIS measure and CAHPS results for CoverKids, Tennessee’s CHIP, were added to this annual HEDIS/CAHPS report in 2017. HEDIS definitions for measures apply to all lines of business. For CoverKids, BlueCare (CKBC) is the only health plan administrator (HPA) and the only plan reporting HEDIS/CAHPS measures, so no comparative statewide data are available.
Table 12. HEDIS 2017 CHIP Rates Measure Rate
Effectiveness of Care Measures
Prevention and Screening
Adult BMI Assessment (ABA) NA
Weight Assessment and Counseling for Nutrition and Physical Activity for Children/Adolescents (WCC):
BMI Percentile 63.26%
Counseling for Nutrition 50.36%
Counseling for Physical Activity 47.93%
Childhood Immunization Status (CIS):
DTaP 81.51%
IPV 88.32%
MMR 88.08%
HiB 88.56%
Hepatitis B 84.67%
VZV 89.78%
Pneumococcal Conjugate 82.73%
Hepatitis A 86.62%
Rotavirus 75.91%
Influenza 54.26%
Combination #2 75.67%
Combination #3 74.21%
Combination #4 73.24%
Combination #5 65.45%
Table 12. HEDIS 2017 CHIP Rates Measure Rate
Combination #6 49.15%
Combination #7 64.72%
Combination #8 48.66%
Combination #9 45.01%
Combination #10 44.53%
Immunizations for Adolescents (IMA):
Meningococcal 66.18%
Tdap 82.24%
HPV 10.95%
Combination #1 65.94%
Combination #2 9.73%
Lead Screening in Children (LSC) 64.48%
Breast Cancer Screening (BCS) NA
Cervical Cancer Screening (CCS) 75.32%
Chlamydia Screening in Women (CHL):
16-20 Years 30.80%
21-24 Years 80.56%
Total 31.46%
Respiratory Conditions
Appropriate Testing for Children with Pharyngitis (CWP) 88.68%
Use of Spirometry Testing in the Assessment and Diagnosis of COPD (SPR) NA
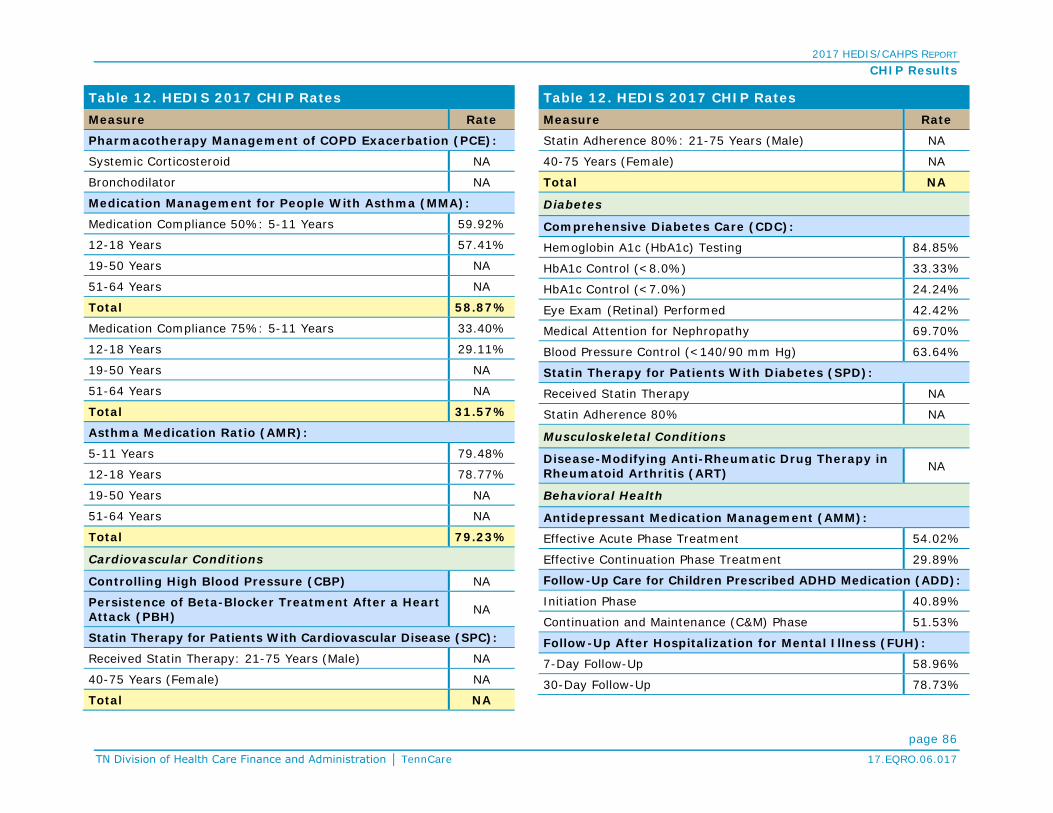
2017 HEDIS/CAHPS REPORT CHIP Results
page 86 TN Division of Health Care Finance and Administration │ TennCare 17.EQRO.06.017
Table 12. HEDIS 2017 CHIP Rates Measure Rate
Pharmacotherapy Management of COPD Exacerbation (PCE):
Systemic Corticosteroid NA
Bronchodilator NA
Medication Management for People With Asthma (MMA):
Medication Compliance 50%: 5-11 Years 59.92%
12-18 Years 57.41%
19-50 Years NA
51-64 Years NA
Total 58.87%
Medication Compliance 75%: 5-11 Years 33.40%
12-18 Years 29.11%
19-50 Years NA
51-64 Years NA
Total 31.57%
Asthma Medication Ratio (AMR):
5-11 Years 79.48%
12-18 Years 78.77%
19-50 Years NA
51-64 Years NA
Total 79.23%
Cardiovascular Conditions
Controlling High Blood Pressure (CBP) NA
Persistence of Beta-Blocker Treatment After a Heart Attack (PBH) NA
Statin Therapy for Patients With Cardiovascular Disease (SPC):
Received Statin Therapy: 21-75 Years (Male) NA
40-75 Years (Female) NA
Total NA
Table 12. HEDIS 2017 CHIP Rates Measure Rate
Statin Adherence 80%: 21-75 Years (Male) NA
40-75 Years (Female) NA
Total NA
Diabetes
Comprehensive Diabetes Care (CDC):
Hemoglobin A1c (HbA1c) Testing 84.85%
HbA1c Control (<8.0%) 33.33%
HbA1c Control (<7.0%) 24.24%
Eye Exam (Retinal) Performed 42.42%
Medical Attention for Nephropathy 69.70%
Blood Pressure Control (<140/90 mm Hg) 63.64%
Statin Therapy for Patients With Diabetes (SPD):
Received Statin Therapy NA
Statin Adherence 80% NA
Musculoskeletal Conditions
Disease-Modifying Anti-Rheumatic Drug Therapy in Rheumatoid Arthritis (ART) NA
Behavioral Health
Antidepressant Medication Management (AMM):
Effective Acute Phase Treatment 54.02%
Effective Continuation Phase Treatment 29.89%
Follow-Up Care for Children Prescribed ADHD Medication (ADD):
Initiation Phase 40.89%
Continuation and Maintenance (C&M) Phase 51.53%
Follow-Up After Hospitalization for Mental Illness (FUH):
7-Day Follow-Up 58.96%
30-Day Follow-Up 78.73%

2017 HEDIS/CAHPS REPORT CHIP Results
page 87 TN Division of Health Care Finance and Administration │ TennCare 17.EQRO.06.017
Table 12. HEDIS 2017 CHIP Rates Measure Rate
Follow-Up After Emergency Department Visit for Mental Illness (FUM):
7-Day Follow-Up 35.88%
30-Day Follow-Up 61.07%
Follow-Up After Emergency Department Visit for Alcohol and Other Drug Dependence (FUA):
7-Day Follow-Up: 13-17 Years 11.43%
18+ Years NA
Total 11.11%
30-Day Follow-Up: 13-17 Years 17.14%
18+ Years NA
Total 15.56%
Diabetes Screening for People With Schizophrenia or Bipolar Disorder Who Are Using Antipsychotic Medication (SSD)
62.50%
Diabetes Monitoring for People With Diabetes and Schizophrenia (SMD) NA
Cardiovascular Monitoring for People With Cardiovascular Disease and Schizophrenia (SMC) NA
Adherence to Antipsychotic Medications for Individuals With Schizophrenia (SAA) NA
Metabolic Monitoring for Children and Adolescents on Antipsychotics (APM):
1-5 Years NA
6-11 Years 29.41%
12-17 Years 31.16%
Total 30.74%
Medication Management
Annual Monitoring for Patients on Persistent Medications (MPM):
ACE Inhibitors or ARBs NA
Table 12. HEDIS 2017 CHIP Rates Measure Rate
Digoxin NA
Diuretics NA
Total NA
Overuse/Appropriateness
Appropriate Treatment for Children With URI (URI) 79.75%
Avoidance of Antibiotic Treatment in Adults with Acute Bronchitis (AAB) NA
Use of Imaging Studies for Low Back Pain (LBP) 60.32%
Access/Availability of Care Adults' Access to Preventive/Ambulatory Health Services (AAP):
20-44 Years 77.44%
45-64 Years NA
65+ Years NA
Total 77.04%
Children and Adolescents' Access to Primary Care Practitioners (CAP):
12-24 Months 94.89%
25 Months - 6 Years 85.97%
7-11 Years 89.56%
12-19 Years 85.75%
Initiation and Engagement of AOD Dependence Treatment (IET):
Initiation of AOD Treatment: 13-17 Years 43.95%
18+ Years 50.00%
Total 46.27%
Engagement of AOD Treatment: 13-17 Years 22.93%
18+ Years 19.39%
Total 21.57%

2017 HEDIS/CAHPS REPORT CHIP Results
page 88 TN Division of Health Care Finance and Administration │ TennCare 17.EQRO.06.017
Table 12. HEDIS 2017 CHIP Rates Measure Rate
Prenatal and Postpartum Care (PPC):
Timeliness of Prenatal Care 69.27%
Postpartum Care 64.88%
Use of First-Line Psychosocial Care for Children and Adolescents on Antipsychotics (APP)
1-5 Years NA
6-11 Years NA
12-17 Years 57.50%
Total 55.14%
Utilization
Frequency of Ongoing Prenatal Care (FPC):
81+ Percent 59.76%
Well-Child Visits in the First 15 Months of Life (W15):
6+ Visits 75.22%
Well-Child Visits in the Third, Fourth, Fifth and Sixth Years of Life (w34) 66.58%
Adolescent Well-Care Visits (AWC) 38.93%
Table 13. HEDIS 2017 CHIP Rates Where Lower Rates Indicate Better Performance Measure Rate
Effectiveness of Care Measures
Diabetes
Comprehensive Diabetes Care (CDC):
HbA1c Poor Control (>9.0%) 60.61%
Overuse/Appropriateness
Non-Recommended Cervical Cancer Screening in Adolescent 1.43%
Use of Multiple Concurrent Antipsychotics in Children and Adolescents (APC):
1-5 Years NA
6-11 Years 1.64%
12-17 Years 0.00%
Total 0.44%

2017 HEDIS/CAHPS REPORT
page 89 TN Division of Health Care Finance and Administration │ TennCare 17.EQRO.06.017
Table 14 and Table 15 show the CAHPS results for the CoverKids HPA. CAHPS definitions for measures apply to all lines of business.
Table 14. 2017 CAHPS 5.0H Child CHIP Survey Results (General Population) Question CKBC
1. Getting Needed Care (Always + Usually) 93.05% 2. Getting Care Quickly (Always + Usually) 95.96% 3. How Well Doctors Communicate (Always + Usually) 95.98% 4. Customer Service (Always + Usually) 94.95% 5.Shared Decision Making (Yes) 81.97% 6. Rating of All Health Care (9+10) 75.75% 7. Rating of Personal Doctor (9+10) 78.89% 8. Rating of Specialist Seen Most Often (9+10) NA 9. Rating of Health Plan (9+10) 80.77%
Table 15. 2017 CAHPS 5.0H Child CHIP Survey Results (Children with Chronic Conditions) Question CKBC
1. Getting Needed Care (Always + Usually) 91.05% 2. Getting Care Quickly (Always + Usually) 96.67% 3. How Well Doctors Communicate (Always + Usually) 96.83% 4. Customer Service (Always + Usually) 94.36% 5.Shared Decision Making (Yes) 83.05% 6. Rating of All Health Care (9+10) 72.49% 7. Rating of Personal Doctor (9+10) 77.30% 8.Rating of Specialist Seen Most Often (9+10) 68.42% 9. Rating of Health Plan (9+10) 77.33% 10. Coordination of Care (Always + Usually) 81.82% 11. Access to Specialized Services (Always + Usually) NA 12. Family-Centered Care: Personal Doctor Who Knows Child (Yes) 93.00% 13. Coordination of Care for Children With Chronic Conditions (Yes) 75.78% 14. Family-Centered Care: Getting Needed Information (Always + Usually) 95.27% 15. Access to Prescription Medicines (Always + Usually) 97.38%

2017 HEDIS/CAHPS REPORT
page A-1 TN Division of Health Care Finance and Administration │ TennCare 17.EQRO.06.017
APPENDIX A | Utilization Measure Medicaid Results and Benchmarks Utilization Additional Measure Descriptions Frequency of Selected Procedure (FSP) FSP summarizes the utilization of frequently performed procedures that often show wide regional variation and have generated concern regarding potentially inappropriate utilization.
Ambulatory Care (AMB) AMB summarizes utilization of ambulatory care in the following categories: ♦ Outpatient Visits ♦ ED Visits
Inpatient Utilization – General Hospital/Acute Care (IPU) IPU summarizes utilization of acute IP care and services in the following categories:
♦ Total IP ♦ Surgery ♦ Medicine ♦ Maternity
Identification of Alcohol and Other Drug Services (IAD) IAD summarizes the number and percentage of members with an AOD claim who received the following chemical dependency services during the measurement year:
♦ Any services ♦ Outpatient or ED ♦ IP ♦ Intensive outpatient or partial
hospitalization
Mental Health Utilization (MPT) MPT summarizes the number and percentage of members receiving the following mental health services during the measurement year:
♦ Any services ♦ Outpatient or ED ♦ IP ♦ Intensive outpatient or partial
hospitalization
Antibiotic Utilization (ABX) ABX summarizes the following data on outpatient utilization of antibiotic prescriptions during the MY, stratified by age and gender: ♦ Total number of and average (Avg.) number of antibiotic
prescription per member per year (PMPY) ♦ Total and avg. days supplied for all antibiotic
prescriptions

2017 HEDIS/CAHPS REPORT APPENDIX A | Utilization Measure Medicaid Results and Benchmarks
page A-2 TN Division of Health Care Finance and Administration │ TennCare 17.EQRO.06.017
♦ Total number of prescriptions and avg. number of prescriptions PMPY for antibiotic of concern
♦ Percentage of antibiotic of concern for all antibiotic prescriptions
♦ Avg. number of antibiotics PMPY reported by drug class: For selected ‘antibiotics of concern’ For all other antibiotics
Standardized Healthcare-Associated Infection Ratio (HAI) HAI reports the percentages of total discharges summarizes the hospital-reported standard infection ratios (SIR) for four different healthcare-associated infections (HAIs), adjusted for the proportion of members discharged from each MCO’s contracted acute care hospital. The measure reports the percentage of total discharges from hospitals with a high,
moderate, low or unavailable SIR, next to a total plan-weighted SIR for each of the following infections during the MY, stratified by age and gender: ♦ Total number of and avg. number of antibiotic PMPY ♦ Total and avg. days supplied for all antibiotic
prescriptions ♦ Total number of prescriptions and avg. number of
prescriptions PMPY for antibiotic of concern ♦ Percentage of antibiotic of concern for all antibiotic
prescriptions ♦ Avg. number of antibiotics PMPY reported by drug class:
For selected ‘antibiotics of concern’ For all other antibiotics

2017 HEDIS/CAHPS REPORT APPENDIX A | Utilization Measure Medicaid Results and Benchmarks
page A-3 TN Division of Health Care Finance and Administration │ TennCare 17.EQRO.06.017
Utilization Measures: Medicaid Plan-Specific Rates/National Benchmarks In Table A, cells are shaded gray for those measures that were not calculated or for which data were not reported.
Table A. HEDIS 2017 Medicaid Plan-Specific Rates with HEDIS 2016 National Benchmarks: Utilization Measures Measure by Age Sex AGE AGM AGW BCE BCM BCW TCS UHCE UHCM UHCW
2016 National Medicaid Means and Percentiles Mean P10 P25 P50 P75 P90
Frequency of Ongoing Prenatal Care (FPC): <21% NA 8.39% 7.21% 11.83% 3.74% 11.19% 12.17% 9.55% 7.85% 13.14% 13.63% 11.96% 2.87% 4.87% 8.22% 14.69% 23.60% 21–40% NA 7.46% 6.74% 14.39% 2.59% 13.14% 10.46% 10.96% 5.32% 9.73% 10.71% 7.26% 2.33% 3.95% 5.82% 9.02% 13.93% 41–60% NA 8.39% 8.84% 11.83% 4.60% 12.41% 9.98% 13.48% 4.81% 13.14% 14.60% 8.59% 4.65% 6.03% 7.92% 10.46% 12.99% 61–80% NA 16.08% 20.00% 17.17% 8.05% 15.09% 15.33% 17.70% 13.16% 15.57% 23.11% 15.23% 10.48% 12.58% 14.95% 17.95% 20.45% ≥81% NA 59.67% 57.21% 44.78% 81.03% 48.18% 52.07% 48.31% 68.86% 48.42% 37.96% 56.61% 32.79% 45.72% 59.26% 69.54% 75.77% Well-Child Visits in the First 15 Months of Life (W15): 0 Visits NA 2.31% 2.31% 5.32% 1.44% 0.49% 2.92% 11.92% 3.16% 2.74% 4.14% 2.62% 0.44% 0.93% 1.71% 3.24% 5.77% 1 Visits NA 3.24% 1.85% 4.86% 1.15% 2.19% 5.11% 4.14% 1.58% 2.24% 5.35% 2.30% 0.70% 1.26% 1.95% 2.92% 4.12% 2 Visits NA 4.86% 2.78% 7.18% 1.15% 4.14% 5.60% 3.65% 3.16% 2.74% 6.08% 3.45% 1.23% 2.06% 3.19% 4.62% 5.84% 3 Visits NA 6.48% 3.70% 12.96% 4.02% 4.38% 6.57% 7.79% 3.95% 3.49% 10.46% 5.54% 2.66% 3.72% 5.42% 6.98% 8.57% 4 Visits NA 9.26% 6.71% 12.73% 6.32% 10.22% 9.98% 13.38% 9.74% 7.23% 11.19% 9.64% 6.01% 7.54% 9.16% 11.30% 13.40% 5 Visits NA 13.89% 9.26% 16.90% 15.52% 15.09% 14.11% 17.76% 11.58% 19.45% 17.27% 17.11% 12.02% 14.29% 16.49% 19.23% 23.72% 6 or More Visits NA 59.95% 73.38% 40.05% 70.40% 63.50% 55.72% 41.36% 66.84% 62.09% 45.50% 59.35% 45.38% 53.49% 59.57% 67.76% 73.88%
Frequency of Selected Procedures (FSP) Bariatric weight loss surgery: Procedures /1,000 Member Years 0–19
M 0.00 0.00 0.00 0.00 0.00 0.00 0.00 0.00 0.00 0.00 0.00 0.00 0.00 0.00 0.00 0.00
20–44 0.00 0.00 0.00 0.00 0.00 0.00 0.00 0.01 0.00 0.00 0.01 0.00 0.00 0.01 0.02 0.03 45–64 0.00 0.04 0.00 0.01 0.02 0.00 0.00 0.01 0.03 0.00 0.01 0.00 0.00 0.01 0.02 0.04 0–19
F 0.00 0.00 0.00 0.00 0.00 0.00 0.00 0.00 0.00 0.00 0.00 0.00 0.00 0.00 0.00 0.00
20–44 0.01 0.02 0.01 0.04 0.02 0.00 0.00 0.04 0.03 0.02 0.06 0.00 0.01 0.05 0.09 0.13 45–64 0.01 0.04 0.03 0.03 0.06 0.01 0.00 0.05 0.05 0.01 0.08 0.00 0.01 0.05 0.10 0.16 Tonsillectomy: Procedures /1,000 Member Years 0–9
M&F 0.95 0.80 0.49 1.19 0.78 0.58 0.96 1.22 0.81 0.56 0.62 0.24 0.45 0.62 0.80 0.95
10–19 0.47 0.32 0.29 0.51 0.37 0.28 0.31 0.51 0.40 0.27 0.28 0.07 0.19 0.27 0.36 0.45 Hysterectomy—Abdominal (A) and Vaginal (V): Procedures /1,000 Member Years A 15–44
F 0.08 0.12 0.08 0.11 0.14 0.15 0.01 0.10 0.14 0.14 0.13 0.05 0.09 0.13 0.17 0.21
A 45–64 0.20 0.18 0.31 0.11 0.22 0.31 0.00 0.12 0.15 0.37 0.31 0.11 0.20 0.27 0.34 0.48

2017 HEDIS/CAHPS REPORT APPENDIX A | Utilization Measure Medicaid Results and Benchmarks
page A-4 TN Division of Health Care Finance and Administration │ TennCare 17.EQRO.06.017
Table A. HEDIS 2017 Medicaid Plan-Specific Rates with HEDIS 2016 National Benchmarks: Utilization Measures Measure by Age Sex AGE AGM AGW BCE BCM BCW TCS UHCE UHCM UHCW
2016 National Medicaid Means and Percentiles Mean P10 P25 P50 P75 P90
V 15–44 F
0.21 0.19 0.07 0.25 0.20 0.08 0.04 0.28 0.17 0.07 0.14 0.03 0.06 0.12 0.20 0.30 V 45–64 0.26 0.20 0.10 0.31 0.23 0.09 0.00 0.19 0.23 0.08 0.22 0.05 0.12 0.19 0.27 0.42 Cholecystectomy—Open (O) and Closed (C)/Laparoscopic: Procedures /1,000 Member Years O 30–64 M 0.02 0.02 0.07 0.03 0.00 0.04 0.03 0.05 0.00 0.05 0.03 0.00 0.01 0.02 0.04 0.05 O 15–44
F 0.00 0.01 0.02 0.00 0.01 0.01 0.01 0.02 0.01 0.01 0.01 0.00 0.00 0.01 0.01 0.02
O 45–64 0.06 0.01 0.08 0.01 0.03 0.08 0.00 0.02 0.02 0.05 0.03 0.00 0.00 0.03 0.05 0.07 C 30–64 M 0.41 0.38 0.28 0.50 0.48 0.33 0.10 0.50 0.42 0.29 0.29 0.12 0.19 0.28 0.37 0.51 C 15–44
F 0.82 0.71 0.48 0.80 0.74 0.55 0.35 0.86 0.78 0.46 0.67 0.36 0.49 0.63 0.80 1.02
C 45–64 0.71 0.69 0.47 0.73 0.60 0.39 0.12 0.94 0.75 0.49 0.65 0.33 0.45 0.62 0.82 1.00 Back Surgery: Procedures /1,000 Member Years
20–44 M 0.24 0.26 0.17 0.36 0.22 0.21 0.01 0.24 0.23 0.23 0.27 0.04 0.12 0.24 0.34 0.49 F 0.12 0.21 0.11 0.26 0.18 0.13 0.01 0.26 0.27 0.10 0.22 0.04 0.10 0.16 0.24 0.30
45–64 M 0.47 0.76 0.63 0.71 0.70 0.35 0.00 0.82 0.82 0.27 0.62 0.19 0.38 0.57 0.80 0.94 F 0.32 0.85 0.24 0.75 0.87 0.29 0.12 0.92 0.95 0.59 0.53 0.08 0.31 0.49 0.67 0.85
Mastectomy: Procedures /1,000 Member Years 15–44
F 0.01 0.02 0.01 0.05 0.04 0.02 0.01 0.05 0.02 0.01 0.03 0.00 0.01 0.02 0.03 0.05
45–64 0.11 0.24 0.06 0.38 0.18 0.30 0.00 0.35 0.33 0.14 0.19 0.00 0.10 0.14 0.21 0.38 Lumpectomy: Procedures /1,000 Member Years 15–44
F 0.11 0.08 0.13 0.09 0.10 0.14 0.06 0.10 0.11 0.08 0.11 0.04 0.09 0.12 0.14 0.16
45–64 0.18 0.30 0.33 0.53 0.26 0.55 0.00 0.32 0.39 0.39 0.38 0.17 0.27 0.38 0.44 0.54 Ambulatory Care: Total (AMB)
Outpatient Visits: Visits/1,000 Member Months <1 NA 765.43 743.34 579.83 848.64 759.45 682.04 889.58 764.61 745.96 610.34 1–9 NA 249.72 285.18 215.93 341.65 285.37 275.46 348.28 291.35 310.56 257.02 10–19 NA 197.71 219.21 175.52 278.44 227.33 224.25 243.89 247.52 242.38 205.54 20–44 NA 230.70 306.83 242.25 342.65 311.39 332.39 96.57 329.34 346.19 301.98 45–64 NA 464.24 624.28 453.55 681.36 626.52 631.68 175.29 674.42 716.85 587.29 65–74 NA 412.09 660.38 378.81 85.50 121.37 159.80 296.30 738.47 680.08 591.74 75–84 NA 308.67 596.08 399.71 25.00 166.23 62.24 583.33 557.38 365.19 379.63 ≥85 NA 266.67 504.95 359.79 21.98 139.72 71.43 260.05 179.54 139.23 Total NA 267.77 327.48 249.53 382.57 325.11 325.38 259.20 366.15 363.78 305.87 357.17 258.19 303.40 350.23 389.30 450.33

2017 HEDIS/CAHPS REPORT APPENDIX A | Utilization Measure Medicaid Results and Benchmarks
page A-5 TN Division of Health Care Finance and Administration │ TennCare 17.EQRO.06.017
Table A. HEDIS 2017 Medicaid Plan-Specific Rates with HEDIS 2016 National Benchmarks: Utilization Measures Measure by Age Sex AGE AGM AGW BCE BCM BCW TCS UHCE UHCM UHCW
2016 National Medicaid Means and Percentiles Mean P10 P25 P50 P75 P90
ED Visits: Visits/1,000 Member Months <1 NA 114.37 82.06 117.41 109.35 94.16 118.77 97.82 116.92 84.28 117.68 1–9 NA 63.72 41.67 43.06 61.71 49.18 56.13 50.15 57.41 44.43 51.52 10–19 NA 55.81 40.25 37.59 60.21 42.86 42.96 50.06 54.13 45.26 39.87 20–44 NA 118.91 89.35 103.49 110.00 112.18 92.97 33.51 110.65 103.42 94.75 45–64 NA 96.22 83.19 89.04 97.97 96.34 86.12 20.92 103.57 105.19 93.16 65–74 NA 40.61 52.29 56.17 9.21 13.46 16.83 40.74 77.28 70.80 72.79 75–84 NA 33.41 57.46 58.57 2.81 11.04 1.57 0.00 58.96 46.51 38.05 ≥85 NA 23.19 34.94 35.27 3.30 4.62 1.88 28.13 25.11 29.72 Total NA 84.74 60.55 67.97 81.23 72.51 68.35 47.13 79.09 68.73 66.81 64.38 42.89 53.23 62.75 73.29 87.57
Inpatient Utilization―General Hospital/Acute Care: Total (IPU)
Total Inpatient
Discharges: Discharges/1,000 Member Months <1 NA 11.52 7.61 7.11 8.53 7.02 6.98 27.67 9.21 6.67 6.19 1–9 NA 0.97 0.85 0.81 0.98 0.80 0.93 6.12 0.75 0.93 0.67 10–19 NA 1.89 1.64 1.69 2.39 1.83 2.16 3.74 1.75 2.04 1.67 20–44 NA 10.38 10.02 10.90 12.90 11.51 11.78 3.91 8.89 10.88 8.88 45–64 NA 20.16 16.77 19.19 16.77 18.70 15.75 5.34 16.60 15.47 12.36 65–74 NA 19.38 21.00 18.24 2.48 1.42 5.71 25.93 21.48 19.29 16.20 75–84 NA 23.87 26.53 25.62 0.51 7.14 3.14 0.00 19.38 14.07 9.51 ≥85 NA 17.39 23.88 28.22 1.10 2.31 9.40 10.61 6.46 4.85 Total NA 6.65 5.64 6.21 6.89 6.12 6.01 4.95 6.27 5.94 4.83 8.59 5.14 5.83 6.81 8.51 13.78
Days: Days/1,000 Member Months <1 NA 112.89 59.90 55.89 53.57 36.01 48.00 255.99 106.61 52.92 80.43 1–9 NA 3.48 3.57 3.26 2.89 2.47 3.25 34.18 2.64 3.01 2.71 10–19 NA 6.90 5.61 6.38 7.05 5.61 7.10 19.38 6.18 7.03 6.83 20–44 NA 40.35 34.81 39.26 42.59 37.01 39.01 18.11 32.99 39.65 37.23 45–64 NA 111.51 94.19 119.50 86.64 93.50 88.19 34.68 93.43 84.16 81.66 65–74 NA 122.75 120.31 91.01 12.97 4.49 37.21 140.74 123.85 111.65 126.76 75–84 NA 134.45 174.41 187.41 1.53 46.10 30.86 0.00 115.41 82.27 63.97 ≥85 NA 104.35 157.83 153.44 2.20 18.48 69.55 53.73 31.05 32.41 Total NA 31.25 24.97 28.28 26.87 22.95 24.20 28.00 30.76 25.97 26.06 38.86 18.26 22.47 27.92 35.47 70.10

2017 HEDIS/CAHPS REPORT APPENDIX A | Utilization Measure Medicaid Results and Benchmarks
page A-6 TN Division of Health Care Finance and Administration │ TennCare 17.EQRO.06.017
Table A. HEDIS 2017 Medicaid Plan-Specific Rates with HEDIS 2016 National Benchmarks: Utilization Measures Measure by Age Sex AGE AGM AGW BCE BCM BCW TCS UHCE UHCM UHCW
2016 National Medicaid Means and Percentiles Mean P10 P25 P50 P75 P90
Average Length of Stay: Average # of Days <1 NA 9.80 7.87 7.86 6.28 5.13 6.88 9.25 11.57 7.93 13.00 1–9 NA 3.59 4.21 4.03 2.95 3.07 3.50 5.59 3.53 3.25 4.05 10–19 NA 3.66 3.42 3.78 2.94 3.07 3.29 5.18 3.54 3.45 4.09 20–44 NA 3.89 3.47 3.60 3.30 3.22 3.31 4.63 3.71 3.65 4.19 45–64 NA 5.53 5.62 6.23 5.17 5.00 5.60 6.49 5.63 5.44 6.60 65–74 NA 6.33 5.73 4.99 5.23 3.17 6.51 5.43 5.77 5.79 7.83 75–84 NA 5.63 6.57 7.31 3.00 6.45 9.83 5.96 5.85 6.72 ≥85 NA 6.00 6.61 5.44 2.00 8.00 7.40 5.07 4.81 6.69 Unknown NA Total NA 4.70 4.42 4.55 3.90 3.75 4.03 5.65 4.91 4.37 5.40 4.18 3.29 3.67 4.10 4.55 5.28
Medicine
Discharges: Discharges/1,000 Member Months <1 NA 9.95 6.29 5.54 7.66 6.11 5.79 22.07 8.12 5.78 4.95 1–9 NA 0.75 0.58 0.56 0.83 0.62 0.75 4.72 0.59 0.73 0.49 10-19 NA 0.61 0.53 0.41 0.67 0.56 0.54 2.50 0.53 0.73 0.46 20–44 NA 2.99 2.34 2.61 3.11 3.03 3.02 2.05 2.63 2.72 2.10 45–64 NA 13.29 11.51 12.41 12.12 13.80 11.51 4.29 11.44 10.62 8.17 65–74 NA 14.77 14.88 14.04 1.84 1.18 4.63 18.52 15.27 13.41 10.70 75–84 NA 19.09 23.15 21.96 0.51 6.49 2.62 0.00 14.64 10.74 6.59 ≥85 NA 14.49 22.13 26.46 1.10 1.15 7.52 8.46 5.31 3.12 Total NA 3.05 2.47 2.48 2.97 2.68 2.53 3.48 3.29 2.67 2.04 4.45 1.66 2.27 3.05 4.26 8.62
Days: Days/1,000 Member Months <1 NA 91.59 36.08 26.37 46.56 25.77 26.08 148.95 91.51 43.50 38.22 1–9 NA 2.09 1.49 1.72 2.21 1.65 2.29 20.70 1.86 2.35 1.82 10–19 NA 2.11 1.69 1.32 2.27 1.79 2.05 12.88 2.13 2.52 2.06 20–44 NA 11.07 8.80 9.82 13.33 11.96 12.62 9.45 11.63 11.27 11.33 45–64 NA 55.91 52.04 51.77 57.54 62.23 56.65 21.20 59.11 53.73 48.22 65–74 NA 70.60 79.72 58.73 8.89 3.54 27.79 103.70 77.93 69.89 69.54 75–84 NA 97.85 126.75 153.73 1.53 40.91 27.72 0.00 72.41 57.32 38.88 ≥85 NA 85.51 146.19 137.57 2.20 4.62 58.27 42.51 26.05 17.34 Total NA 13.52 10.64 9.93 13.37 10.95 11.13 17.12 17.20 12.72 11.66 18.47 5.19 8.35 12.05 16.86 37.45

2017 HEDIS/CAHPS REPORT APPENDIX A | Utilization Measure Medicaid Results and Benchmarks
page A-7 TN Division of Health Care Finance and Administration │ TennCare 17.EQRO.06.017
Table A. HEDIS 2017 Medicaid Plan-Specific Rates with HEDIS 2016 National Benchmarks: Utilization Measures Measure by Age Sex AGE AGM AGW BCE BCM BCW TCS UHCE UHCM UHCW
2016 National Medicaid Means and Percentiles Mean P10 P25 P50 P75 P90
Average Length of Stay: Average # of Days <1 NA 9.20 5.74 4.76 6.08 4.22 4.50 6.75 11.27 7.52 7.72 1–9 NA 2.78 2.58 3.07 2.67 2.64 3.05 4.39 3.15 3.24 3.70 10–19 NA 3.44 3.20 3.24 3.37 3.17 3.82 5.16 3.99 3.46 4.53 20–44 NA 3.70 3.75 3.77 4.29 3.95 4.18 4.62 4.42 4.15 5.38 45–64 NA 4.21 4.52 4.17 4.75 4.51 4.92 4.94 5.17 5.06 5.90 65–74 NA 4.78 5.36 4.18 4.83 3.00 6.00 5.60 5.10 5.21 6.50 75–84 NA 5.13 5.47 7.00 3.00 6.30 10.60 4.95 5.34 5.90 ≥85 NA 5.90 6.61 5.20 2.00 4.00 7.75 5.03 4.90 5.55 Unknown NA Total NA 4.43 4.30 4.00 4.50 4.09 4.41 4.91 5.22 4.76 5.70 3.94 3.32 3.57 3.89 4.26 4.62
Surgery
Discharges: Discharges/1,000 Member Months <1 NA 1.56 1.33 1.57 0.86 0.83 1.17 5.60 1.05 0.86 1.24 1–9 NA 0.22 0.27 0.25 0.15 0.18 0.18 1.40 0.16 0.20 0.18 10–19 NA 0.32 0.30 0.30 0.29 0.28 0.30 0.72 0.29 0.25 0.23 20–44 NA 1.90 1.35 1.45 1.34 1.14 1.19 0.50 1.44 1.16 1.16 45–64 NA 6.85 5.19 6.72 4.64 4.87 4.21 1.05 5.15 4.81 4.16 65–74 NA 4.61 6.12 4.19 0.64 0.24 1.08 7.41 6.21 5.88 5.50 75–84 NA 4.77 3.38 3.66 0.00 0.65 0.52 0.00 4.74 3.33 2.92 ≥85 NA 2.90 1.75 1.76 0.00 1.15 1.88 2.15 1.15 1.72 Total NA 1.52 1.13 1.28 1.05 0.92 0.91 0.99 1.42 1.04 1.00 1.86 0.77 1.08 1.43 1.90 3.02
Days: Days/1,000 Member Months <1 NA 21.30 23.82 29.52 6.87 10.11 21.88 107.04 14.95 9.36 42.20 1–9 NA 1.38 2.08 1.54 0.66 0.82 0.96 13.47 0.78 0.66 0.89 10–19 NA 2.12 1.64 2.37 1.10 1.13 1.53 5.06 1.42 1.13 1.58 20–44 NA 14.92 8.86 11.35 7.59 6.00 7.19 4.74 7.55 6.00 7.94 45–64 NA 55.51 41.99 67.23 29.06 31.18 31.48 13.49 34.27 30.33 33.33 65–74 NA 52.15 40.59 32.28 4.08 0.94 9.42 37.04 45.92 41.75 57.22 75–84 NA 36.60 47.66 33.67 0.00 5.19 3.14 0.00 43.00 24.95 25.09 ≥85 NA 18.84 11.65 15.87 0.00 13.86 11.28 11.22 5.00 15.07 Total NA 12.24 8.78 11.84 6.13 5.43 6.50 9.51 9.11 6.14 8.68 14.21 4.72 6.65 9.30 13.07 25.02
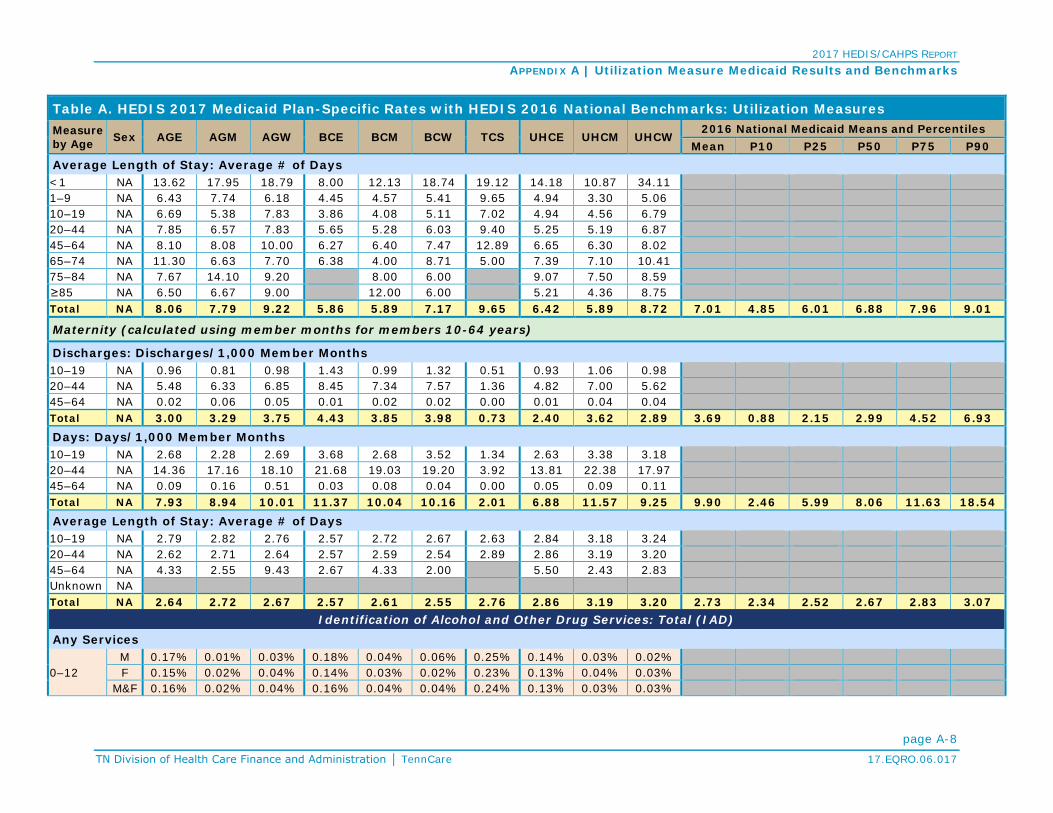
2017 HEDIS/CAHPS REPORT APPENDIX A | Utilization Measure Medicaid Results and Benchmarks
page A-8 TN Division of Health Care Finance and Administration │ TennCare 17.EQRO.06.017
Table A. HEDIS 2017 Medicaid Plan-Specific Rates with HEDIS 2016 National Benchmarks: Utilization Measures Measure by Age Sex AGE AGM AGW BCE BCM BCW TCS UHCE UHCM UHCW
2016 National Medicaid Means and Percentiles Mean P10 P25 P50 P75 P90
Average Length of Stay: Average # of Days <1 NA 13.62 17.95 18.79 8.00 12.13 18.74 19.12 14.18 10.87 34.11 1–9 NA 6.43 7.74 6.18 4.45 4.57 5.41 9.65 4.94 3.30 5.06 10–19 NA 6.69 5.38 7.83 3.86 4.08 5.11 7.02 4.94 4.56 6.79 20–44 NA 7.85 6.57 7.83 5.65 5.28 6.03 9.40 5.25 5.19 6.87 45–64 NA 8.10 8.08 10.00 6.27 6.40 7.47 12.89 6.65 6.30 8.02 65–74 NA 11.30 6.63 7.70 6.38 4.00 8.71 5.00 7.39 7.10 10.41 75–84 NA 7.67 14.10 9.20 8.00 6.00 9.07 7.50 8.59 ≥85 NA 6.50 6.67 9.00 12.00 6.00 5.21 4.36 8.75 Total NA 8.06 7.79 9.22 5.86 5.89 7.17 9.65 6.42 5.89 8.72 7.01 4.85 6.01 6.88 7.96 9.01
Maternity (calculated using member months for members 10-64 years)
Discharges: Discharges/1,000 Member Months 10–19 NA 0.96 0.81 0.98 1.43 0.99 1.32 0.51 0.93 1.06 0.98 20–44 NA 5.48 6.33 6.85 8.45 7.34 7.57 1.36 4.82 7.00 5.62 45–64 NA 0.02 0.06 0.05 0.01 0.02 0.02 0.00 0.01 0.04 0.04 Total NA 3.00 3.29 3.75 4.43 3.85 3.98 0.73 2.40 3.62 2.89 3.69 0.88 2.15 2.99 4.52 6.93
Days: Days/1,000 Member Months 10–19 NA 2.68 2.28 2.69 3.68 2.68 3.52 1.34 2.63 3.38 3.18 20–44 NA 14.36 17.16 18.10 21.68 19.03 19.20 3.92 13.81 22.38 17.97 45–64 NA 0.09 0.16 0.51 0.03 0.08 0.04 0.00 0.05 0.09 0.11 Total NA 7.93 8.94 10.01 11.37 10.04 10.16 2.01 6.88 11.57 9.25 9.90 2.46 5.99 8.06 11.63 18.54
Average Length of Stay: Average # of Days 10–19 NA 2.79 2.82 2.76 2.57 2.72 2.67 2.63 2.84 3.18 3.24 20–44 NA 2.62 2.71 2.64 2.57 2.59 2.54 2.89 2.86 3.19 3.20 45–64 NA 4.33 2.55 9.43 2.67 4.33 2.00 5.50 2.43 2.83 Unknown NA Total NA 2.64 2.72 2.67 2.57 2.61 2.55 2.76 2.86 3.19 3.20 2.73 2.34 2.52 2.67 2.83 3.07
Identification of Alcohol and Other Drug Services: Total (IAD) Any Services
0–12 M 0.17% 0.01% 0.03% 0.18% 0.04% 0.06% 0.25% 0.14% 0.03% 0.02% F 0.15% 0.02% 0.04% 0.14% 0.03% 0.02% 0.23% 0.13% 0.04% 0.03%
M&F 0.16% 0.02% 0.04% 0.16% 0.04% 0.04% 0.24% 0.13% 0.03% 0.03%
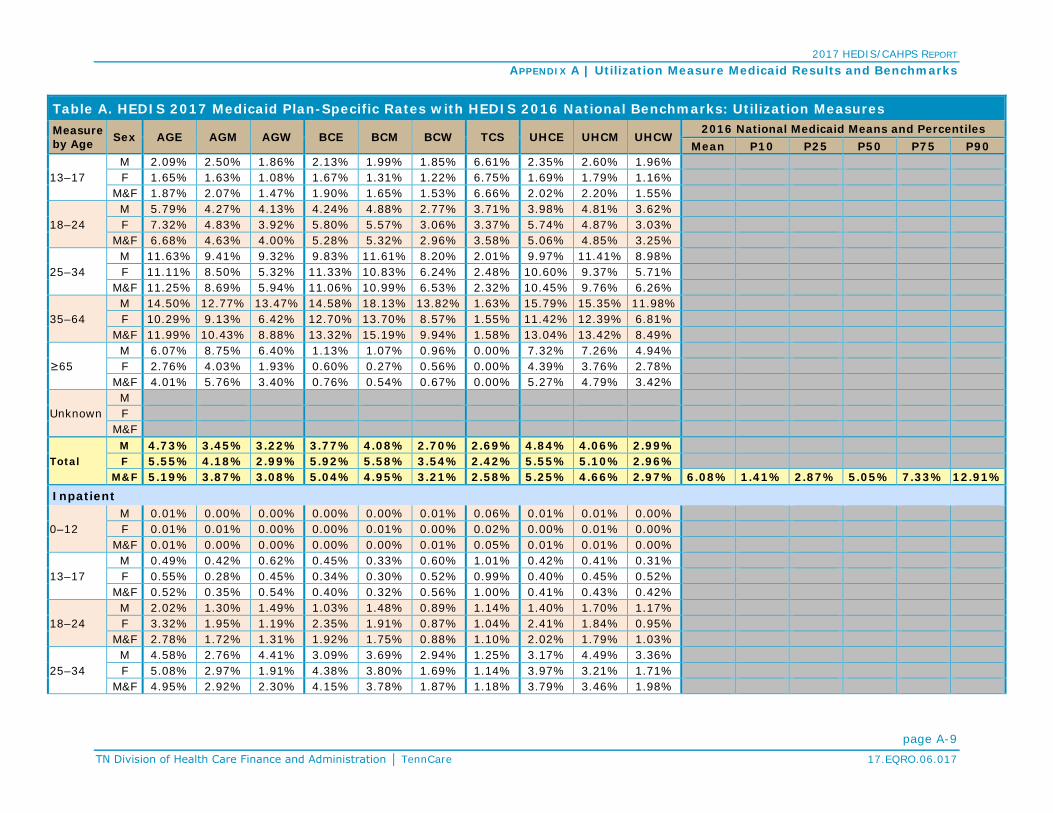
2017 HEDIS/CAHPS REPORT APPENDIX A | Utilization Measure Medicaid Results and Benchmarks
page A-9 TN Division of Health Care Finance and Administration │ TennCare 17.EQRO.06.017
Table A. HEDIS 2017 Medicaid Plan-Specific Rates with HEDIS 2016 National Benchmarks: Utilization Measures Measure by Age Sex AGE AGM AGW BCE BCM BCW TCS UHCE UHCM UHCW
2016 National Medicaid Means and Percentiles Mean P10 P25 P50 P75 P90
13–17 M 2.09% 2.50% 1.86% 2.13% 1.99% 1.85% 6.61% 2.35% 2.60% 1.96% F 1.65% 1.63% 1.08% 1.67% 1.31% 1.22% 6.75% 1.69% 1.79% 1.16%
M&F 1.87% 2.07% 1.47% 1.90% 1.65% 1.53% 6.66% 2.02% 2.20% 1.55%
18–24 M 5.79% 4.27% 4.13% 4.24% 4.88% 2.77% 3.71% 3.98% 4.81% 3.62% F 7.32% 4.83% 3.92% 5.80% 5.57% 3.06% 3.37% 5.74% 4.87% 3.03%
M&F 6.68% 4.63% 4.00% 5.28% 5.32% 2.96% 3.58% 5.06% 4.85% 3.25%
25–34 M 11.63% 9.41% 9.32% 9.83% 11.61% 8.20% 2.01% 9.97% 11.41% 8.98% F 11.11% 8.50% 5.32% 11.33% 10.83% 6.24% 2.48% 10.60% 9.37% 5.71%
M&F 11.25% 8.69% 5.94% 11.06% 10.99% 6.53% 2.32% 10.45% 9.76% 6.26%
35–64 M 14.50% 12.77% 13.47% 14.58% 18.13% 13.82% 1.63% 15.79% 15.35% 11.98% F 10.29% 9.13% 6.42% 12.70% 13.70% 8.57% 1.55% 11.42% 12.39% 6.81%
M&F 11.99% 10.43% 8.88% 13.32% 15.19% 9.94% 1.58% 13.04% 13.42% 8.49%
≥65 M 6.07% 8.75% 6.40% 1.13% 1.07% 0.96% 0.00% 7.32% 7.26% 4.94% F 2.76% 4.03% 1.93% 0.60% 0.27% 0.56% 0.00% 4.39% 3.76% 2.78%
M&F 4.01% 5.76% 3.40% 0.76% 0.54% 0.67% 0.00% 5.27% 4.79% 3.42%
Unknown M F
M&F
Total M 4.73% 3.45% 3.22% 3.77% 4.08% 2.70% 2.69% 4.84% 4.06% 2.99% F 5.55% 4.18% 2.99% 5.92% 5.58% 3.54% 2.42% 5.55% 5.10% 2.96%
M&F 5.19% 3.87% 3.08% 5.04% 4.95% 3.21% 2.58% 5.25% 4.66% 2.97% 6.08% 1.41% 2.87% 5.05% 7.33% 12.91%
Inpatient
0–12 M 0.01% 0.00% 0.00% 0.00% 0.00% 0.01% 0.06% 0.01% 0.01% 0.00% F 0.01% 0.01% 0.00% 0.00% 0.01% 0.00% 0.02% 0.00% 0.01% 0.00%
M&F 0.01% 0.00% 0.00% 0.00% 0.00% 0.01% 0.05% 0.01% 0.01% 0.00%
13–17 M 0.49% 0.42% 0.62% 0.45% 0.33% 0.60% 1.01% 0.42% 0.41% 0.31% F 0.55% 0.28% 0.45% 0.34% 0.30% 0.52% 0.99% 0.40% 0.45% 0.52%
M&F 0.52% 0.35% 0.54% 0.40% 0.32% 0.56% 1.00% 0.41% 0.43% 0.42%
18–24 M 2.02% 1.30% 1.49% 1.03% 1.48% 0.89% 1.14% 1.40% 1.70% 1.17% F 3.32% 1.95% 1.19% 2.35% 1.91% 0.87% 1.04% 2.41% 1.84% 0.95%
M&F 2.78% 1.72% 1.31% 1.92% 1.75% 0.88% 1.10% 2.02% 1.79% 1.03%
25–34 M 4.58% 2.76% 4.41% 3.09% 3.69% 2.94% 1.25% 3.17% 4.49% 3.36% F 5.08% 2.97% 1.91% 4.38% 3.80% 1.69% 1.14% 3.97% 3.21% 1.71%
M&F 4.95% 2.92% 2.30% 4.15% 3.78% 1.87% 1.18% 3.79% 3.46% 1.98%

2017 HEDIS/CAHPS REPORT APPENDIX A | Utilization Measure Medicaid Results and Benchmarks
page A-10 TN Division of Health Care Finance and Administration │ TennCare 17.EQRO.06.017
Table A. HEDIS 2017 Medicaid Plan-Specific Rates with HEDIS 2016 National Benchmarks: Utilization Measures Measure by Age Sex AGE AGM AGW BCE BCM BCW TCS UHCE UHCM UHCW
2016 National Medicaid Means and Percentiles Mean P10 P25 P50 P75 P90
35–64 M 5.52% 4.32% 5.64% 3.92% 6.10% 4.01% 0.95% 4.82% 4.69% 4.08% F 3.21% 2.59% 2.00% 2.73% 3.26% 1.82% 0.84% 2.83% 2.91% 1.62%
M&F 4.14% 3.21% 3.27% 3.12% 4.21% 2.39% 0.89% 3.57% 3.53% 2.42%
≥65 M 3.04% 2.73% 1.48% 0.68% 0.53% 0.00% 0.00% 2.54% 2.36% 1.91% F 0.61% 0.71% 0.48% 0.10% 0.00% 0.19% 0.00% 0.83% 0.77% 0.33%
M&F 1.53% 1.45% 0.81% 0.28% 0.18% 0.13% 0.00% 1.35% 1.24% 0.80%
Unknown M F
M&F
Total M 1.73% 1.06% 1.32% 0.99% 1.29% 0.82% 0.60% 1.45% 1.26% 0.97% F 2.18% 1.33% 0.99% 1.75% 1.64% 0.87% 0.56% 1.65% 1.45% 0.80%
M&F 1.98% 1.21% 1.12% 1.44% 1.49% 0.85% 0.58% 1.57% 1.37% 0.87% 1.81% 0.37% 0.79% 1.25% 2.05% 3.82%
Intensive Outpatient/Partial Hospitalization
0–12 M 0.00% 0.00% 0.00% 0.00% 0.00% 0.00% 0.03% 0.00% 0.00% 0.00% F 0.00% 0.00% 0.00% 0.00% 0.00% 0.00% 0.01% 0.00% 0.00% 0.00%
M&F 0.00% 0.00% 0.00% 0.00% 0.00% 0.00% 0.02% 0.00% 0.00% 0.00%
13–17 M 0.69% 0.68% 0.30% 0.86% 0.69% 0.51% 2.24% 0.79% 0.92% 0.40% F 0.15% 0.39% 0.06% 0.46% 0.33% 0.14% 2.78% 0.28% 0.39% 0.21%
M&F 0.42% 0.54% 0.18% 0.66% 0.51% 0.32% 2.44% 0.54% 0.66% 0.30%
18–24 M 0.60% 0.68% 0.38% 0.75% 1.47% 0.58% 0.81% 0.56% 0.83% 0.43% F 1.09% 0.84% 0.56% 1.12% 1.67% 0.50% 0.52% 0.88% 0.63% 0.42%
M&F 0.89% 0.78% 0.49% 1.00% 1.60% 0.52% 0.70% 0.75% 0.70% 0.43%
25–34 M 1.42% 0.98% 1.09% 1.81% 2.96% 1.05% 0.42% 1.03% 2.00% 1.24% F 2.05% 1.33% 0.86% 2.58% 2.98% 1.21% 0.28% 1.78% 1.61% 0.92%
M&F 1.88% 1.26% 0.89% 2.44% 2.97% 1.18% 0.33% 1.60% 1.69% 0.97%
35–64 M 0.74% 0.93% 1.04% 1.34% 2.89% 1.28% 0.17% 0.64% 1.00% 0.76% F 0.83% 0.69% 0.52% 1.39% 2.04% 0.71% 0.23% 0.71% 0.80% 0.47%
M&F 0.79% 0.78% 0.70% 1.37% 2.33% 0.86% 0.20% 0.68% 0.87% 0.56%
≥65 M 0.00% 0.00% 0.00% 0.00% 0.00% 0.00% 0.00% 0.10% 0.25% 0.26% F 0.00% 0.00% 0.00% 0.00% 0.00% 0.00% 0.00% 0.00% 0.00% 0.00%
M&F 0.00% 0.00% 0.00% 0.00% 0.00% 0.00% 0.00% 0.03% 0.07% 0.08%
Unknown M F
M&F

2017 HEDIS/CAHPS REPORT APPENDIX A | Utilization Measure Medicaid Results and Benchmarks
page A-11 TN Division of Health Care Finance and Administration │ TennCare 17.EQRO.06.017
Table A. HEDIS 2017 Medicaid Plan-Specific Rates with HEDIS 2016 National Benchmarks: Utilization Measures Measure by Age Sex AGE AGM AGW BCE BCM BCW TCS UHCE UHCM UHCW
2016 National Medicaid Means and Percentiles Mean P10 P25 P50 P75 P90
Total M 0.43% 0.37% 0.30% 0.52% 0.85% 0.35% 0.77% 0.36% 0.49% 0.28% F 0.74% 0.52% 0.37% 0.97% 1.22% 0.44% 0.71% 0.56% 0.55% 0.32%
M&F 0.60% 0.45% 0.34% 0.79% 1.06% 0.41% 0.75% 0.48% 0.53% 0.30% 0.25% 0.00% 0.02% 0.11% 0.31% 0.68%
Outpatient/ED*
0–12 M 0.16% 0.01% 0.03% 0.18% 0.04% 0.05% 0.20% 0.13% 0.02% 0.02% F 0.13% 0.01% 0.04% 0.14% 0.03% 0.02% 0.22% 0.12% 0.03% 0.03%
M&F 0.14% 0.01% 0.04% 0.16% 0.03% 0.04% 0.21% 0.13% 0.03% 0.03%
13–17 M 1.59% 2.01% 1.42% 1.80% 1.60% 1.50% 5.65% 1.97% 2.23% 1.74% F 1.38% 1.38% 0.90% 1.52% 1.08% 0.94% 6.10% 1.53% 1.46% 1.04%
M&F 1.48% 1.69% 1.16% 1.66% 1.35% 1.21% 5.82% 1.75% 1.85% 1.38%
18–24 M 4.63% 3.35% 3.40% 3.53% 3.89% 2.31% 3.49% 3.18% 3.61% 3.07% F 5.39% 3.74% 3.19% 4.19% 4.47% 2.54% 2.76% 4.43% 4.03% 2.47%
M&F 5.08% 3.60% 3.27% 3.97% 4.25% 2.46% 3.20% 3.95% 3.88% 2.68%
25–34 M 9.58% 7.95% 7.41% 8.17% 9.52% 6.81% 2.32% 8.51% 9.22% 7.43% F 8.70% 7.04% 4.26% 9.29% 9.14% 5.31% 2.12% 8.84% 7.96% 4.87%
M&F 8.93% 7.22% 4.75% 9.09% 9.22% 5.53% 2.17% 8.76% 8.21% 5.30%
35–64 M 11.50% 10.70% 10.74% 12.89% 15.23% 11.88% 1.42% 13.68% 13.31% 10.34% F 8.66% 7.98% 5.53% 11.41% 12.19% 7.70% 0.94% 10.21% 11.19% 6.10%
M&F 9.81% 8.96% 7.35% 11.89% 13.21% 8.79% 1.11% 11.50% 11.93% 7.48%
≥65 M 3.54% 7.11% 5.42% 0.45% 0.53% 0.96% 0.00% 5.71% 6.42% 3.73% F 2.46% 3.48% 1.69% 0.70% 0.27% 0.56% 0.00% 4.07% 3.41% 2.52%
M&F 2.87% 4.81% 2.91% 0.62% 0.36% 0.67% 0.00% 4.57% 4.30% 2.88%
Unknown M F
M&F
Total M 3.79% 2.86% 2.58% 3.28% 3.38% 2.29% 2.37% 4.14% 3.43% 2.56% F 4.43% 3.52% 2.48% 5.03% 4.79% 3.08% 2.11% 4.81% 4.46% 2.59%
M&F 4.15% 3.24% 2.52% 4.32% 4.20% 2.77% 2.26% 4.52% 4.03% 2.57% 5.44% 1.18% 2.45% 4.40% 6.79% 11.11% Mental Health Utilization: Total (MPT)
Any Services
0–12 M 9.55% 7.64% 4.11% 9.81% 8.05% 4.86% 26.37% 9.03% 7.99% 4.30% F 6.04% 4.90% 2.38% 6.18% 4.90% 3.10% 18.52% 5.16% 4.85% 2.55%
M&F 7.84% 6.29% 3.25% 8.02% 6.49% 3.99% 23.12% 7.13% 6.44% 3.44%

2017 HEDIS/CAHPS REPORT APPENDIX A | Utilization Measure Medicaid Results and Benchmarks
page A-12 TN Division of Health Care Finance and Administration │ TennCare 17.EQRO.06.017
Table A. HEDIS 2017 Medicaid Plan-Specific Rates with HEDIS 2016 National Benchmarks: Utilization Measures Measure by Age Sex AGE AGM AGW BCE BCM BCW TCS UHCE UHCM UHCW
2016 National Medicaid Means and Percentiles Mean P10 P25 P50 P75 P90
13–17 M 13.58% 12.60% 7.11% 15.39% 11.25% 8.52% 37.72% 12.75% 12.27% 7.17% F 14.10% 14.67% 6.93% 16.68% 12.68% 8.74% 36.93% 14.63% 13.54% 6.87%
M&F 13.84% 13.63% 7.02% 16.03% 11.96% 8.63% 37.43% 13.70% 12.90% 7.01%
18–64 M 9.95% 11.97% 6.72% 11.13% 8.36% 8.43% 11.60% 12.97% 11.77% 9.62% F 11.92% 14.64% 5.74% 14.43% 10.99% 8.58% 7.75% 15.78% 13.87% 8.84%
M&F 11.21% 13.81% 6.03% 13.48% 10.19% 8.54% 9.81% 14.83% 13.22% 9.07%
≥65 M 9.11% 6.70% 3.45% 0.91% 2.13% 3.83% 16.22% 6.23% 7.94% 6.32% F 10.74% 9.25% 5.78% 2.20% 1.91% 3.74% 0.00% 9.85% 9.67% 5.89%
M&F 10.13% 8.31% 5.02% 1.80% 1.99% 3.77% 7.84% 8.76% 9.16% 6.02%
Unknown M F
M&F
Total M 10.25% 9.71% 5.36% 11.01% 8.58% 6.45% 25.16% 10.91% 9.77% 6.36% F 10.08% 10.88% 4.63% 11.64% 8.81% 6.61% 18.70% 11.87% 10.37% 6.26%
M&F 10.15% 10.39% 4.93% 11.38% 8.71% 6.55% 22.45% 11.46% 10.12% 6.30% 12.84% 4.82% 7.21% 10.94% 15.74% 21.73%
Inpatient
0–12 M 0.12% 0.08% 0.14% 0.10% 0.07% 0.11% 0.85% 0.07% 0.07% 0.10% F 0.09% 0.06% 0.09% 0.05% 0.05% 0.08% 0.47% 0.09% 0.05% 0.08%
M&F 0.11% 0.07% 0.12% 0.08% 0.06% 0.10% 0.69% 0.08% 0.06% 0.09%
13–17 M 0.88% 0.74% 0.92% 0.88% 0.63% 1.06% 3.13% 0.73% 0.70% 0.83% F 1.61% 1.16% 1.37% 1.30% 1.05% 1.52% 4.53% 1.24% 1.40% 1.15%
M&F 1.24% 0.95% 1.14% 1.08% 0.84% 1.30% 3.64% 0.99% 1.05% 0.99%
18–64 M 2.15% 1.85% 2.60% 1.44% 1.91% 1.70% 1.75% 2.04% 2.07% 2.51% F 1.65% 1.43% 1.28% 1.37% 1.49% 1.12% 1.35% 1.59% 1.67% 1.39%
M&F 1.83% 1.56% 1.67% 1.39% 1.62% 1.27% 1.56% 1.74% 1.79% 1.73%
≥65 M 5.57% 1.50% 0.00% 0.45% 2.13% 1.44% 0.00% 2.34% 3.55% 3.47% F 7.98% 1.82% 2.41% 0.80% 1.37% 1.50% 0.00% 3.62% 3.83% 2.56%
M&F 7.07% 1.70% 1.62% 0.69% 1.63% 1.48% 0.00% 3.23% 3.75% 2.83%
Unknown M F
M&F
Total M 1.04% 0.74% 1.05% 0.64% 0.73% 0.71% 1.68% 0.94% 0.83% 1.00% F 1.13% 0.89% 0.86% 0.89% 0.90% 0.80% 1.61% 1.16% 1.11% 0.94%
M&F 1.09% 0.83% 0.94% 0.79% 0.83% 0.76% 1.65% 1.07% 0.99% 0.96% 1.37% 0.39% 0.56% 0.88% 1.24% 2.82%
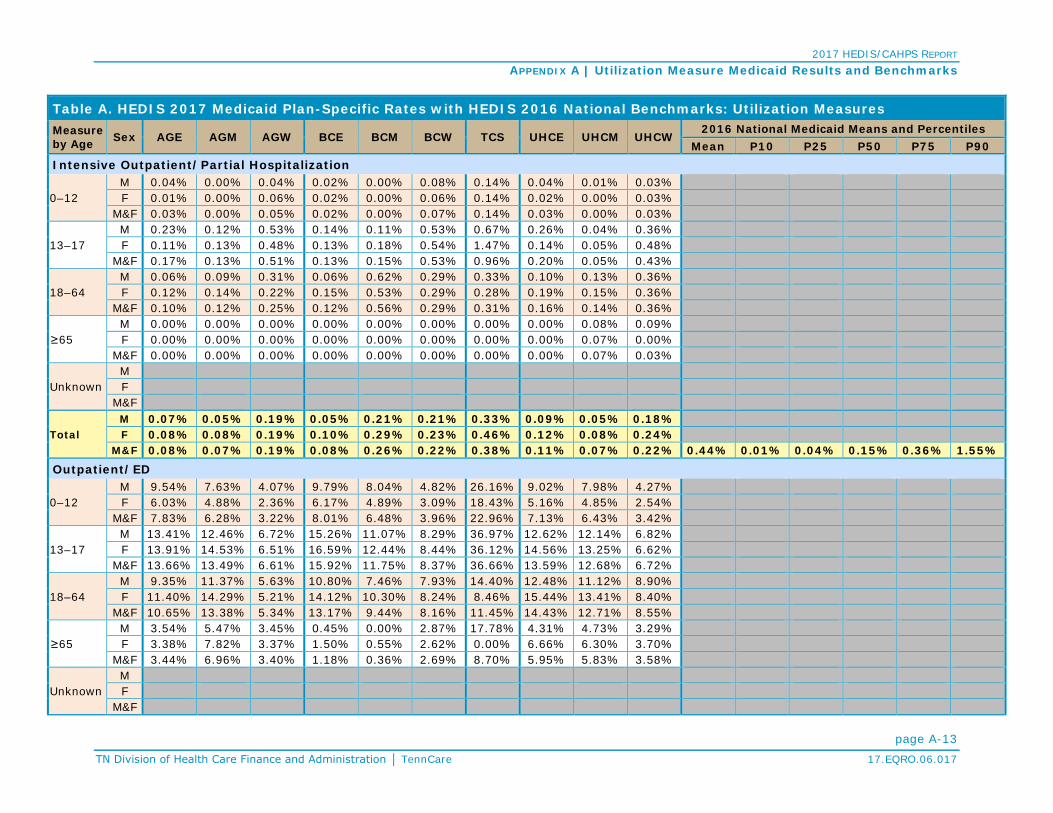
2017 HEDIS/CAHPS REPORT APPENDIX A | Utilization Measure Medicaid Results and Benchmarks
page A-13 TN Division of Health Care Finance and Administration │ TennCare 17.EQRO.06.017
Table A. HEDIS 2017 Medicaid Plan-Specific Rates with HEDIS 2016 National Benchmarks: Utilization Measures Measure by Age Sex AGE AGM AGW BCE BCM BCW TCS UHCE UHCM UHCW
2016 National Medicaid Means and Percentiles Mean P10 P25 P50 P75 P90
Intensive Outpatient/Partial Hospitalization
0–12 M 0.04% 0.00% 0.04% 0.02% 0.00% 0.08% 0.14% 0.04% 0.01% 0.03% F 0.01% 0.00% 0.06% 0.02% 0.00% 0.06% 0.14% 0.02% 0.00% 0.03%
M&F 0.03% 0.00% 0.05% 0.02% 0.00% 0.07% 0.14% 0.03% 0.00% 0.03%
13–17 M 0.23% 0.12% 0.53% 0.14% 0.11% 0.53% 0.67% 0.26% 0.04% 0.36% F 0.11% 0.13% 0.48% 0.13% 0.18% 0.54% 1.47% 0.14% 0.05% 0.48%
M&F 0.17% 0.13% 0.51% 0.13% 0.15% 0.53% 0.96% 0.20% 0.05% 0.43%
18–64 M 0.06% 0.09% 0.31% 0.06% 0.62% 0.29% 0.33% 0.10% 0.13% 0.36% F 0.12% 0.14% 0.22% 0.15% 0.53% 0.29% 0.28% 0.19% 0.15% 0.36%
M&F 0.10% 0.12% 0.25% 0.12% 0.56% 0.29% 0.31% 0.16% 0.14% 0.36%
≥65 M 0.00% 0.00% 0.00% 0.00% 0.00% 0.00% 0.00% 0.00% 0.08% 0.09% F 0.00% 0.00% 0.00% 0.00% 0.00% 0.00% 0.00% 0.00% 0.07% 0.00%
M&F 0.00% 0.00% 0.00% 0.00% 0.00% 0.00% 0.00% 0.00% 0.07% 0.03%
Unknown M F
M&F
Total M 0.07% 0.05% 0.19% 0.05% 0.21% 0.21% 0.33% 0.09% 0.05% 0.18% F 0.08% 0.08% 0.19% 0.10% 0.29% 0.23% 0.46% 0.12% 0.08% 0.24%
M&F 0.08% 0.07% 0.19% 0.08% 0.26% 0.22% 0.38% 0.11% 0.07% 0.22% 0.44% 0.01% 0.04% 0.15% 0.36% 1.55%
Outpatient/ED
0–12 M 9.54% 7.63% 4.07% 9.79% 8.04% 4.82% 26.16% 9.02% 7.98% 4.27% F 6.03% 4.88% 2.36% 6.17% 4.89% 3.09% 18.43% 5.16% 4.85% 2.54%
M&F 7.83% 6.28% 3.22% 8.01% 6.48% 3.96% 22.96% 7.13% 6.43% 3.42%
13–17 M 13.41% 12.46% 6.72% 15.26% 11.07% 8.29% 36.97% 12.62% 12.14% 6.82% F 13.91% 14.53% 6.51% 16.59% 12.44% 8.44% 36.12% 14.56% 13.25% 6.62%
M&F 13.66% 13.49% 6.61% 15.92% 11.75% 8.37% 36.66% 13.59% 12.68% 6.72%
18–64 M 9.35% 11.37% 5.63% 10.80% 7.46% 7.93% 14.40% 12.48% 11.12% 8.90% F 11.40% 14.29% 5.21% 14.12% 10.30% 8.24% 8.46% 15.44% 13.41% 8.40%
M&F 10.65% 13.38% 5.34% 13.17% 9.44% 8.16% 11.45% 14.43% 12.71% 8.55%
≥65 M 3.54% 5.47% 3.45% 0.45% 0.00% 2.87% 17.78% 4.31% 4.73% 3.29% F 3.38% 7.82% 3.37% 1.50% 0.55% 2.62% 0.00% 6.66% 6.30% 3.70%
M&F 3.44% 6.96% 3.40% 1.18% 0.36% 2.69% 8.70% 5.95% 5.83% 3.58%
Unknown M F
M&F

2017 HEDIS/CAHPS REPORT APPENDIX A | Utilization Measure Medicaid Results and Benchmarks
page A-14 TN Division of Health Care Finance and Administration │ TennCare 17.EQRO.06.017
Table A. HEDIS 2017 Medicaid Plan-Specific Rates with HEDIS 2016 National Benchmarks: Utilization Measures Measure by Age Sex AGE AGM AGW BCE BCM BCW TCS UHCE UHCM UHCW
2016 National Medicaid Means and Percentiles Mean P10 P25 P50 P75 P90
Total M 9.97% 9.48% 4.94% 10.87% 8.26% 6.25% 26.45% 10.65% 9.49% 6.02% F 9.73% 10.66% 4.29% 11.46% 8.42% 6.39% 19.21% 11.52% 10.00% 5.93%
M&F 9.84% 10.16% 4.55% 11.22% 8.35% 6.33% 23.38% 11.15% 9.79% 5.96% 12.11% 4.44% 6.76% 10.69% 14.61% 20.87%
Antibiotic Utilization: Total (ABX)
Antibiotic Utilization
Average Scripts PMPY for Antibiotics
0–9 M 1.10 1.00 0.73 1.46 1.05 1.02 1.30 1.12 1.12 0.86 F 1.15 1.04 0.76 1.51 1.10 1.08 1.38 1.17 1.16 0.87
M&F 1.13 1.02 0.75 1.48 1.07 1.05 1.33 1.15 1.14 0.86
10–17 M 0.68 0.60 0.46 0.87 0.58 0.59 0.73 0.68 0.62 0.52 F 0.89 0.84 0.63 1.16 0.75 0.81 1.07 0.94 0.87 0.67
M&F 0.78 0.72 0.54 1.01 0.66 0.70 0.85 0.81 0.74 0.59
18–34 M 0.64 0.62 0.57 0.69 0.55 0.59 0.47 0.62 0.63 0.55 F 1.48 1.44 1.54 1.56 1.48 1.57 0.85 1.34 1.40 1.36
M&F 1.20 1.21 1.28 1.34 1.22 1.32 0.64 1.12 1.19 1.14
35–49 M 0.82 0.88 0.91 0.96 0.82 0.93 0.29 0.87 0.91 0.86 F 1.43 1.49 1.48 1.60 1.46 1.62 0.33 1.44 1.49 1.42
M&F 1.21 1.31 1.32 1.41 1.28 1.48 0.31 1.25 1.31 1.28
50–64 M 0.96 1.16 0.90 1.05 1.00 0.97 0.44 1.10 1.13 0.96 F 1.40 1.79 1.36 1.59 1.46 1.52 0.74 1.71 1.72 1.52
M&F 1.19 1.50 1.16 1.39 1.26 1.31 0.57 1.44 1.47 1.26
65–74 M 1.63 1.82 1.08 0.15 0.53 0.40 0.87 1.52 1.07 1.10 F 2.28 2.59 1.75 0.30 0.38 0.39 0.49 2.05 1.67 1.46
M&F 2.00 2.28 1.51 0.26 0.44 0.39 0.67 1.85 1.46 1.32
75–84 M 2.02 1.74 1.63 0.01 0.60 0.00 0.00 1.20 0.88 0.54 F 1.94 2.34 1.66 0.09 0.39 0.11 0.00 1.54 0.96 0.75
M&F 1.97 2.16 1.65 0.07 0.45 0.09 0.00 1.45 0.93 0.70
≥85 M 1.68 1.42 1.02 0.60 1.11 1.12 0.77 0.44 0.47 F 1.22 2.49 1.02 0.38 0.21 0.24 0.70 0.48 0.36
M&F 1.29 2.28 1.02 0.42 0.40 0.38 0.71 0.47 0.38
Unknown M F
M&F
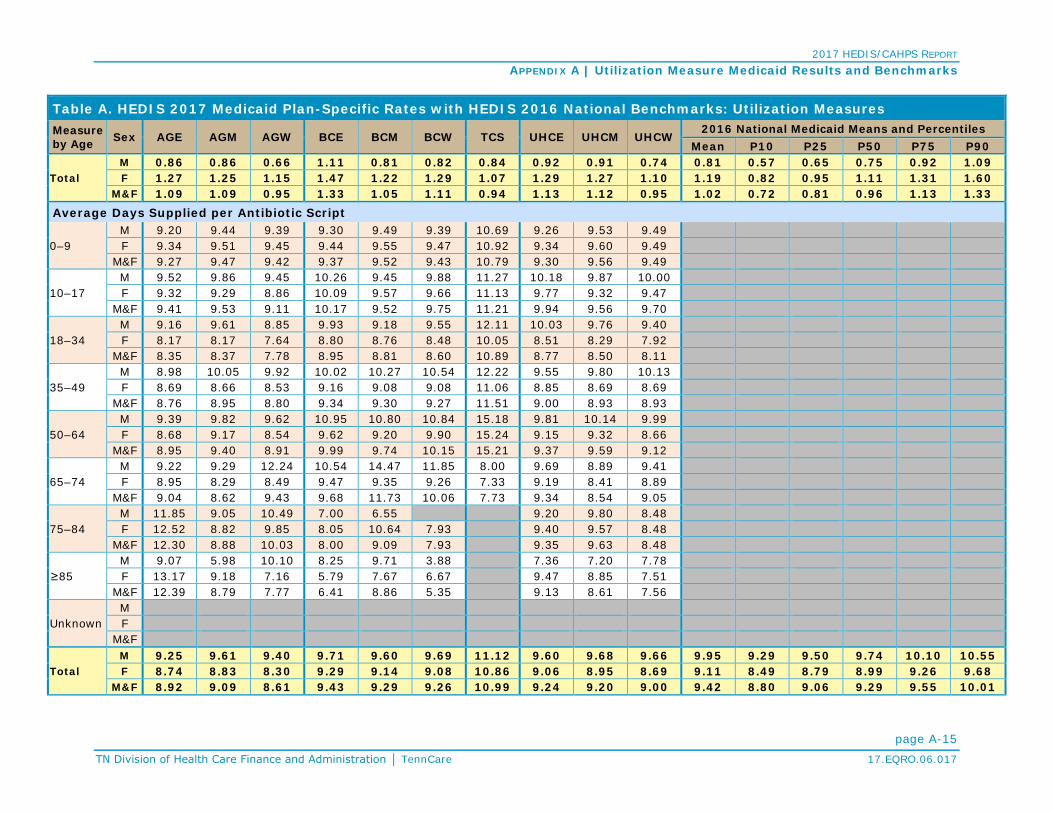
2017 HEDIS/CAHPS REPORT APPENDIX A | Utilization Measure Medicaid Results and Benchmarks
page A-15 TN Division of Health Care Finance and Administration │ TennCare 17.EQRO.06.017
Table A. HEDIS 2017 Medicaid Plan-Specific Rates with HEDIS 2016 National Benchmarks: Utilization Measures Measure by Age Sex AGE AGM AGW BCE BCM BCW TCS UHCE UHCM UHCW
2016 National Medicaid Means and Percentiles Mean P10 P25 P50 P75 P90
Total M 0.86 0.86 0.66 1.11 0.81 0.82 0.84 0.92 0.91 0.74 0.81 0.57 0.65 0.75 0.92 1.09 F 1.27 1.25 1.15 1.47 1.22 1.29 1.07 1.29 1.27 1.10 1.19 0.82 0.95 1.11 1.31 1.60
M&F 1.09 1.09 0.95 1.33 1.05 1.11 0.94 1.13 1.12 0.95 1.02 0.72 0.81 0.96 1.13 1.33
Average Days Supplied per Antibiotic Script
0–9 M 9.20 9.44 9.39 9.30 9.49 9.39 10.69 9.26 9.53 9.49 F 9.34 9.51 9.45 9.44 9.55 9.47 10.92 9.34 9.60 9.49
M&F 9.27 9.47 9.42 9.37 9.52 9.43 10.79 9.30 9.56 9.49
10–17 M 9.52 9.86 9.45 10.26 9.45 9.88 11.27 10.18 9.87 10.00 F 9.32 9.29 8.86 10.09 9.57 9.66 11.13 9.77 9.32 9.47
M&F 9.41 9.53 9.11 10.17 9.52 9.75 11.21 9.94 9.56 9.70
18–34 M 9.16 9.61 8.85 9.93 9.18 9.55 12.11 10.03 9.76 9.40 F 8.17 8.17 7.64 8.80 8.76 8.48 10.05 8.51 8.29 7.92
M&F 8.35 8.37 7.78 8.95 8.81 8.60 10.89 8.77 8.50 8.11
35–49 M 8.98 10.05 9.92 10.02 10.27 10.54 12.22 9.55 9.80 10.13 F 8.69 8.66 8.53 9.16 9.08 9.08 11.06 8.85 8.69 8.69
M&F 8.76 8.95 8.80 9.34 9.30 9.27 11.51 9.00 8.93 8.93
50–64 M 9.39 9.82 9.62 10.95 10.80 10.84 15.18 9.81 10.14 9.99 F 8.68 9.17 8.54 9.62 9.20 9.90 15.24 9.15 9.32 8.66
M&F 8.95 9.40 8.91 9.99 9.74 10.15 15.21 9.37 9.59 9.12
65–74 M 9.22 9.29 12.24 10.54 14.47 11.85 8.00 9.69 8.89 9.41 F 8.95 8.29 8.49 9.47 9.35 9.26 7.33 9.19 8.41 8.89
M&F 9.04 8.62 9.43 9.68 11.73 10.06 7.73 9.34 8.54 9.05
75–84 M 11.85 9.05 10.49 7.00 6.55 9.20 9.80 8.48 F 12.52 8.82 9.85 8.05 10.64 7.93 9.40 9.57 8.48
M&F 12.30 8.88 10.03 8.00 9.09 7.93 9.35 9.63 8.48
≥85 M 9.07 5.98 10.10 8.25 9.71 3.88 7.36 7.20 7.78 F 13.17 9.18 7.16 5.79 7.67 6.67 9.47 8.85 7.51
M&F 12.39 8.79 7.77 6.41 8.86 5.35 9.13 8.61 7.56
Unknown M F
M&F
Total M 9.25 9.61 9.40 9.71 9.60 9.69 11.12 9.60 9.68 9.66 9.95 9.29 9.50 9.74 10.10 10.55 F 8.74 8.83 8.30 9.29 9.14 9.08 10.86 9.06 8.95 8.69 9.11 8.49 8.79 8.99 9.26 9.68
M&F 8.92 9.09 8.61 9.43 9.29 9.26 10.99 9.24 9.20 9.00 9.42 8.80 9.06 9.29 9.55 10.01

2017 HEDIS/CAHPS REPORT APPENDIX A | Utilization Measure Medicaid Results and Benchmarks
page A-16 TN Division of Health Care Finance and Administration │ TennCare 17.EQRO.06.017
Table A. HEDIS 2017 Medicaid Plan-Specific Rates with HEDIS 2016 National Benchmarks: Utilization Measures Measure by Age Sex AGE AGM AGW BCE BCM BCW TCS UHCE UHCM UHCW
2016 National Medicaid Means and Percentiles Mean P10 P25 P50 P75 P90
Average Scripts PMPY for Antibiotics of Concern
0–9 M 0.53 0.44 0.31 0.74 0.45 0.50 0.63 0.55 0.49 0.38 F 0.52 0.44 0.31 0.71 0.45 0.49 0.61 0.55 0.50 0.36
M&F 0.53 0.44 0.31 0.73 0.45 0.49 0.62 0.55 0.49 0.37
10–17 M 0.33 0.27 0.22 0.42 0.26 0.28 0.31 0.34 0.28 0.25 F 0.40 0.36 0.27 0.53 0.32 0.37 0.43 0.45 0.38 0.29
M&F 0.36 0.32 0.25 0.47 0.29 0.32 0.36 0.40 0.33 0.27
18–34 M 0.32 0.30 0.28 0.32 0.26 0.27 0.20 0.30 0.30 0.27 F 0.64 0.60 0.61 0.66 0.59 0.61 0.33 0.60 0.60 0.56
M&F 0.53 0.52 0.52 0.57 0.50 0.52 0.25 0.51 0.52 0.48
35–49 M 0.42 0.44 0.46 0.50 0.40 0.47 0.11 0.46 0.47 0.44 F 0.73 0.72 0.69 0.82 0.70 0.74 0.11 0.75 0.73 0.68
M&F 0.62 0.63 0.63 0.72 0.62 0.69 0.11 0.66 0.65 0.62
50–64 M 0.54 0.59 0.46 0.53 0.48 0.48 0.15 0.59 0.58 0.47 F 0.78 0.95 0.70 0.84 0.76 0.77 0.23 0.95 0.95 0.80
M&F 0.66 0.79 0.59 0.73 0.64 0.66 0.18 0.79 0.80 0.65
65–74 M 0.98 1.01 0.44 0.08 0.21 0.22 0.48 0.89 0.62 0.62 F 1.34 1.35 0.93 0.15 0.21 0.22 0.16 1.14 0.95 0.76
M&F 1.19 1.21 0.76 0.13 0.21 0.22 0.31 1.05 0.83 0.71
75–84 M 1.31 1.01 0.74 0.00 0.35 0.00 0.00 0.66 0.53 0.31 F 0.87 1.46 0.75 0.03 0.24 0.07 0.00 0.82 0.52 0.41
M&F 1.01 1.33 0.75 0.02 0.27 0.05 0.00 0.78 0.52 0.39
≥85 M 1.08 0.85 0.61 0.38 0.39 0.70 0.48 0.28 0.35 F 0.55 1.41 0.51 0.19 0.14 0.11 0.36 0.26 0.19
M&F 0.63 1.30 0.53 0.22 0.19 0.20 0.38 0.26 0.21
Unknown M F
M&F
Total M 0.43 0.40 0.30 0.55 0.37 0.40 0.38 0.46 0.42 0.34 0.35 0.21 0.27 0.32 0.40 0.53 F 0.59 0.56 0.48 0.69 0.52 0.56 0.44 0.63 0.58 0.49 0.50 0.32 0.38 0.46 0.57 0.74
M&F 0.52 0.49 0.41 0.63 0.46 0.49 0.41 0.56 0.51 0.43 0.43 0.27 0.33 0.40 0.49 0.63
Percentage of Antibiotics of Concern of All Antibiotic Scripts
0–9 M 48.42% 44.05% 41.84% 50.31% 43.13% 48.47% 48.77% 49.29% 43.93% 43.88% F 45.18% 41.85% 40.43% 47.43% 41.44% 45.33% 44.02% 47.24% 42.62% 41.90%
M&F 46.81% 42.95% 41.13% 48.87% 42.28% 46.88% 46.65% 48.26% 43.27% 42.90%

2017 HEDIS/CAHPS REPORT APPENDIX A | Utilization Measure Medicaid Results and Benchmarks
page A-17 TN Division of Health Care Finance and Administration │ TennCare 17.EQRO.06.017
Table A. HEDIS 2017 Medicaid Plan-Specific Rates with HEDIS 2016 National Benchmarks: Utilization Measures Measure by Age Sex AGE AGM AGW BCE BCM BCW TCS UHCE UHCM UHCW
2016 National Medicaid Means and Percentiles Mean P10 P25 P50 P75 P90
10–17 M 48.98% 45.69% 48.15% 48.05% 45.58% 47.43% 42.95% 50.12% 45.79% 47.65% F 44.41% 43.27% 43.68% 45.99% 42.44% 45.09% 40.38% 48.14% 44.14% 43.69%
M&F 46.41% 44.28% 45.55% 46.88% 43.82% 46.05% 41.76% 48.98% 44.84% 45.39%
18–34 M 49.01% 48.21% 49.21% 46.32% 47.22% 45.25% 41.51% 49.19% 48.22% 49.08% F 43.23% 41.71% 39.43% 42.22% 39.85% 38.54% 38.44% 44.76% 42.76% 41.47%
M&F 44.28% 42.64% 40.58% 42.75% 40.78% 39.30% 39.70% 45.51% 43.54% 42.46%
35–49 M 51.12% 49.18% 50.39% 51.55% 48.95% 50.36% 39.50% 53.28% 51.81% 51.69% F 51.26% 48.30% 46.77% 51.19% 48.17% 45.82% 34.99% 52.11% 49.35% 47.76%
M&F 51.23% 48.48% 47.49% 51.26% 48.32% 46.42% 36.74% 52.37% 49.89% 48.43%
50–64 M 56.04% 50.63% 50.66% 50.51% 48.13% 49.29% 33.75% 53.52% 51.85% 48.64% F 55.68% 53.48% 51.61% 53.14% 52.48% 50.47% 31.56% 55.33% 55.11% 53.03%
M&F 55.82% 52.47% 51.28% 52.39% 51.02% 50.15% 32.53% 54.72% 54.06% 51.51%
65–74 M 60.24% 55.45% 40.46% 50.00% 40.28% 54.55% 55.56% 58.65% 58.39% 55.86% F 58.76% 51.99% 53.09% 50.93% 55.42% 56.46% 33.33% 55.93% 56.78% 52.14%
M&F 59.28% 53.12% 49.93% 50.75% 48.39% 55.87% 46.67% 56.75% 57.19% 53.30%
75–84 M 64.71% 58.30% 45.28% 0.00% 59.09% 54.53% 60.78% 56.96% F 44.93% 62.61% 45.19% 31.82% 61.11% 57.14% 53.37% 54.40% 54.94%
M&F 51.46% 61.56% 45.21% 30.43% 60.34% 57.14% 53.63% 56.14% 55.35%
≥85 M 64.29% 60.00% 60.00% 62.50% 35.29% 62.50% 62.30% 63.64% 74.51% F 45.00% 56.64% 50.00% 50.00% 66.67% 44.44% 51.69% 53.87% 51.67%
M&F 48.65% 57.06% 52.08% 53.13% 48.28% 52.94% 53.37% 55.29% 55.67%
Unknown M F
M&F
Total M 49.61% 46.13% 45.74% 49.62% 44.90% 48.12% 45.65% 50.71% 46.36% 46.60% 43.03% 36.76% 39.39% 42.43% 46.66% 50.13% F 46.08% 44.44% 42.06% 46.66% 42.76% 43.33% 41.42% 49.05% 45.50% 44.45% 41.58% 35.72% 38.53% 40.98% 44.79% 48.29%
M&F 47.31% 45.00% 43.11% 47.67% 43.45% 44.74% 43.62% 49.62% 45.79% 45.14% 42.10% 36.01% 38.83% 41.73% 45.40% 48.90%
Antibiotics of Concern Utilization
Average Scripts PMPY for Quinolones
0–9 M 0.00 0.00 0.00 0.00 0.00 0.00 0.01 0.00 0.00 0.00 F 0.00 0.00 0.00 0.00 0.00 0.00 0.01 0.00 0.00 0.00
M&F 0.00 0.00 0.00 0.00 0.00 0.00 0.01 0.00 0.00 0.00
10–17 M 0.00 0.01 0.00 0.01 0.00 0.01 0.01 0.01 0.01 0.00 F 0.01 0.02 0.01 0.02 0.01 0.02 0.03 0.02 0.02 0.01
M&F 0.01 0.01 0.01 0.01 0.01 0.01 0.02 0.01 0.01 0.01

2017 HEDIS/CAHPS REPORT APPENDIX A | Utilization Measure Medicaid Results and Benchmarks
page A-18 TN Division of Health Care Finance and Administration │ TennCare 17.EQRO.06.017
Table A. HEDIS 2017 Medicaid Plan-Specific Rates with HEDIS 2016 National Benchmarks: Utilization Measures Measure by Age Sex AGE AGM AGW BCE BCM BCW TCS UHCE UHCM UHCW
2016 National Medicaid Means and Percentiles Mean P10 P25 P50 P75 P90
18–34 M 0.04 0.04 0.04 0.04 0.04 0.04 0.03 0.04 0.05 0.04 F 0.11 0.11 0.11 0.12 0.12 0.12 0.07 0.11 0.11 0.10
M&F 0.09 0.09 0.09 0.10 0.09 0.10 0.05 0.09 0.09 0.08
35–49 M 0.09 0.10 0.12 0.11 0.11 0.11 0.04 0.10 0.11 0.10 F 0.17 0.17 0.16 0.20 0.17 0.19 0.03 0.18 0.17 0.16
M&F 0.14 0.14 0.15 0.17 0.15 0.17 0.03 0.15 0.15 0.15
50–64 M 0.16 0.19 0.14 0.16 0.16 0.15 0.05 0.18 0.18 0.15 F 0.24 0.28 0.22 0.27 0.27 0.25 0.13 0.29 0.28 0.26
M&F 0.20 0.24 0.18 0.22 0.22 0.21 0.08 0.24 0.24 0.21
65–74 M 0.36 0.40 0.09 0.03 0.08 0.10 0.19 0.31 0.20 0.22 F 0.49 0.51 0.37 0.07 0.11 0.08 0.00 0.43 0.35 0.27
M&F 0.43 0.47 0.28 0.05 0.10 0.09 0.09 0.38 0.30 0.25
75–84 M 0.66 0.54 0.34 0.00 0.08 0.00 0.00 0.24 0.18 0.12 F 0.35 0.69 0.42 0.01 0.12 0.04 0.00 0.34 0.23 0.19
M&F 0.45 0.64 0.40 0.01 0.11 0.03 0.00 0.31 0.21 0.17
≥85 M 0.96 0.50 0.31 0.30 0.07 0.14 0.21 0.11 0.19 F 0.24 0.84 0.21 0.06 0.09 0.05 0.15 0.11 0.09
M&F 0.35 0.77 0.23 0.11 0.08 0.07 0.16 0.11 0.11
Unknown M F
M&F
Total M 0.03 0.03 0.03 0.03 0.03 0.02 0.02 0.04 0.03 0.03 0.04 0.01 0.02 0.03 0.04 0.09 F 0.08 0.08 0.07 0.09 0.08 0.09 0.03 0.10 0.08 0.08 0.09 0.04 0.06 0.08 0.10 0.15
M&F 0.06 0.06 0.06 0.07 0.06 0.06 0.02 0.08 0.06 0.06 0.07 0.03 0.04 0.06 0.08 0.13
Average Scripts PMPY for Cephalosporins 2nd–4th Generation
0–9 M 0.19 0.19 0.10 0.29 0.20 0.18 0.24 0.20 0.21 0.12 F 0.20 0.20 0.11 0.30 0.21 0.18 0.24 0.22 0.23 0.13
M&F 0.19 0.19 0.10 0.29 0.20 0.18 0.24 0.21 0.22 0.12
10–17 M 0.06 0.06 0.04 0.09 0.06 0.05 0.06 0.06 0.06 0.04 F 0.08 0.09 0.05 0.12 0.08 0.07 0.10 0.10 0.08 0.05
M&F 0.07 0.07 0.04 0.11 0.07 0.06 0.08 0.08 0.07 0.04
18–34 M 0.02 0.02 0.02 0.03 0.02 0.02 0.02 0.03 0.02 0.02 F 0.05 0.05 0.03 0.06 0.05 0.04 0.03 0.05 0.05 0.03
M&F 0.04 0.05 0.03 0.05 0.04 0.04 0.02 0.05 0.05 0.03
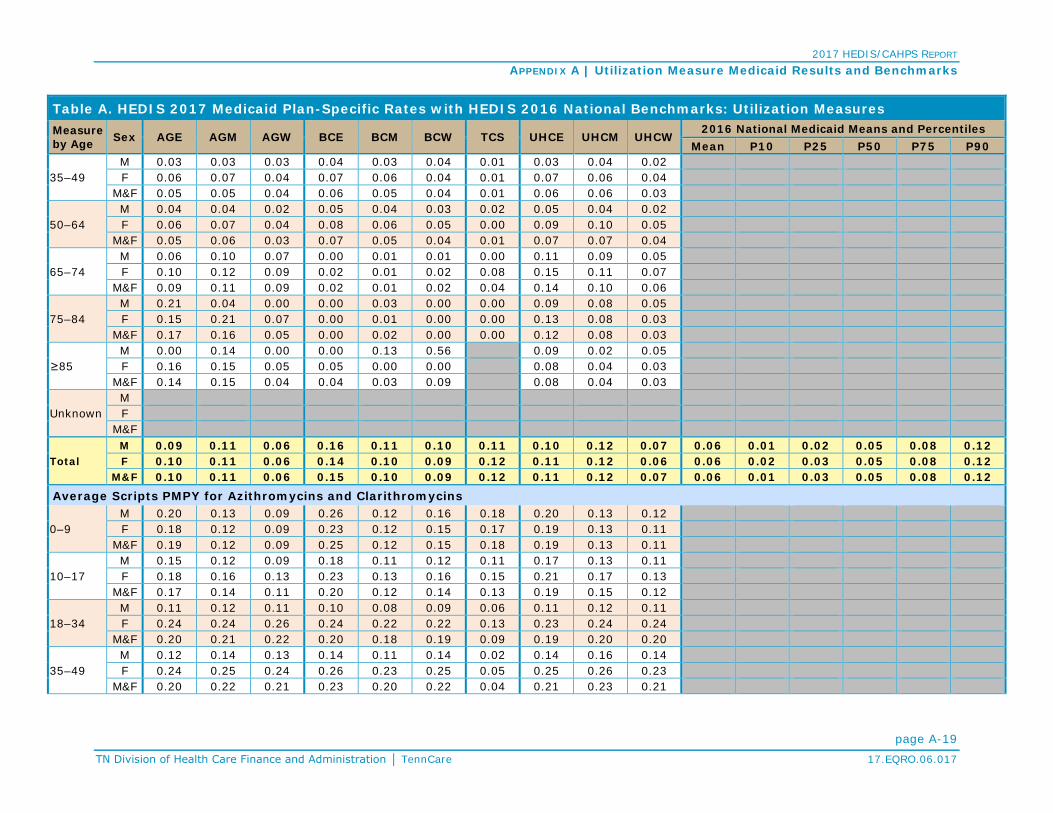
2017 HEDIS/CAHPS REPORT APPENDIX A | Utilization Measure Medicaid Results and Benchmarks
page A-19 TN Division of Health Care Finance and Administration │ TennCare 17.EQRO.06.017
Table A. HEDIS 2017 Medicaid Plan-Specific Rates with HEDIS 2016 National Benchmarks: Utilization Measures Measure by Age Sex AGE AGM AGW BCE BCM BCW TCS UHCE UHCM UHCW
2016 National Medicaid Means and Percentiles Mean P10 P25 P50 P75 P90
35–49 M 0.03 0.03 0.03 0.04 0.03 0.04 0.01 0.03 0.04 0.02 F 0.06 0.07 0.04 0.07 0.06 0.04 0.01 0.07 0.06 0.04
M&F 0.05 0.05 0.04 0.06 0.05 0.04 0.01 0.06 0.06 0.03
50–64 M 0.04 0.04 0.02 0.05 0.04 0.03 0.02 0.05 0.04 0.02 F 0.06 0.07 0.04 0.08 0.06 0.05 0.00 0.09 0.10 0.05
M&F 0.05 0.06 0.03 0.07 0.05 0.04 0.01 0.07 0.07 0.04
65–74 M 0.06 0.10 0.07 0.00 0.01 0.01 0.00 0.11 0.09 0.05 F 0.10 0.12 0.09 0.02 0.01 0.02 0.08 0.15 0.11 0.07
M&F 0.09 0.11 0.09 0.02 0.01 0.02 0.04 0.14 0.10 0.06
75–84 M 0.21 0.04 0.00 0.00 0.03 0.00 0.00 0.09 0.08 0.05 F 0.15 0.21 0.07 0.00 0.01 0.00 0.00 0.13 0.08 0.03
M&F 0.17 0.16 0.05 0.00 0.02 0.00 0.00 0.12 0.08 0.03
≥85 M 0.00 0.14 0.00 0.00 0.13 0.56 0.09 0.02 0.05 F 0.16 0.15 0.05 0.05 0.00 0.00 0.08 0.04 0.03
M&F 0.14 0.15 0.04 0.04 0.03 0.09 0.08 0.04 0.03
Unknown M F
M&F
Total M 0.09 0.11 0.06 0.16 0.11 0.10 0.11 0.10 0.12 0.07 0.06 0.01 0.02 0.05 0.08 0.12 F 0.10 0.11 0.06 0.14 0.10 0.09 0.12 0.11 0.12 0.06 0.06 0.02 0.03 0.05 0.08 0.12
M&F 0.10 0.11 0.06 0.15 0.10 0.09 0.12 0.11 0.12 0.07 0.06 0.01 0.03 0.05 0.08 0.12
Average Scripts PMPY for Azithromycins and Clarithromycins
0–9 M 0.20 0.13 0.09 0.26 0.12 0.16 0.18 0.20 0.13 0.12 F 0.18 0.12 0.09 0.23 0.12 0.15 0.17 0.19 0.13 0.11
M&F 0.19 0.12 0.09 0.25 0.12 0.15 0.18 0.19 0.13 0.11
10–17 M 0.15 0.12 0.09 0.18 0.11 0.12 0.11 0.17 0.13 0.11 F 0.18 0.16 0.13 0.23 0.13 0.16 0.15 0.21 0.17 0.13
M&F 0.17 0.14 0.11 0.20 0.12 0.14 0.13 0.19 0.15 0.12
18–34 M 0.11 0.12 0.11 0.10 0.08 0.09 0.06 0.11 0.12 0.11 F 0.24 0.24 0.26 0.24 0.22 0.22 0.13 0.23 0.24 0.24
M&F 0.20 0.21 0.22 0.20 0.18 0.19 0.09 0.19 0.20 0.20
35–49 M 0.12 0.14 0.13 0.14 0.11 0.14 0.02 0.14 0.16 0.14 F 0.24 0.25 0.24 0.26 0.23 0.25 0.05 0.25 0.26 0.23
M&F 0.20 0.22 0.21 0.23 0.20 0.22 0.04 0.21 0.23 0.21

2017 HEDIS/CAHPS REPORT APPENDIX A | Utilization Measure Medicaid Results and Benchmarks
page A-20 TN Division of Health Care Finance and Administration │ TennCare 17.EQRO.06.017
Table A. HEDIS 2017 Medicaid Plan-Specific Rates with HEDIS 2016 National Benchmarks: Utilization Measures Measure by Age Sex AGE AGM AGW BCE BCM BCW TCS UHCE UHCM UHCW
2016 National Medicaid Means and Percentiles Mean P10 P25 P50 P75 P90
50–64 M 0.14 0.17 0.13 0.13 0.13 0.12 0.03 0.17 0.19 0.13 F 0.25 0.31 0.23 0.25 0.22 0.22 0.05 0.30 0.31 0.26
M&F 0.20 0.25 0.18 0.20 0.18 0.18 0.04 0.24 0.26 0.20
65–74 M 0.24 0.24 0.10 0.02 0.02 0.06 0.10 0.25 0.15 0.15 F 0.52 0.41 0.29 0.04 0.04 0.05 0.00 0.31 0.28 0.22
M&F 0.40 0.34 0.22 0.03 0.03 0.05 0.04 0.29 0.24 0.20
75–84 M 0.21 0.25 0.15 0.00 0.16 0.00 0.00 0.16 0.15 0.06 F 0.17 0.34 0.18 0.01 0.08 0.02 0.00 0.18 0.13 0.10
M&F 0.18 0.31 0.18 0.01 0.10 0.02 0.00 0.17 0.14 0.09
≥85 M 0.00 0.14 0.00 0.08 0.07 0.00 0.11 0.09 0.06 F 0.04 0.26 0.11 0.02 0.00 0.03 0.05 0.06 0.02
M&F 0.03 0.24 0.08 0.03 0.01 0.02 0.06 0.06 0.03
Unknown M F
M&F
Total M 0.16 0.13 0.10 0.19 0.11 0.13 0.12 0.17 0.13 0.12 0.14 0.08 0.11 0.13 0.15 0.19 F 0.21 0.20 0.18 0.24 0.17 0.19 0.15 0.22 0.20 0.18 0.20 0.12 0.15 0.18 0.22 0.27
M&F 0.19 0.17 0.15 0.22 0.15 0.17 0.13 0.20 0.17 0.15 0.17 0.11 0.13 0.16 0.19 0.23
Average Scripts PMPY for Amoxicillin/Clavulanates
0–9 M 0.13 0.10 0.08 0.17 0.11 0.13 0.16 0.14 0.13 0.11 F 0.12 0.10 0.08 0.16 0.11 0.13 0.15 0.13 0.12 0.10
M&F 0.13 0.10 0.08 0.17 0.11 0.13 0.16 0.14 0.13 0.10
10–17 M 0.09 0.07 0.06 0.11 0.07 0.07 0.08 0.09 0.07 0.06 F 0.09 0.08 0.06 0.12 0.07 0.08 0.10 0.10 0.09 0.06
M&F 0.09 0.07 0.06 0.12 0.07 0.08 0.09 0.10 0.08 0.06
18–34 M 0.08 0.07 0.06 0.08 0.07 0.07 0.05 0.07 0.07 0.06 F 0.12 0.12 0.11 0.14 0.12 0.13 0.06 0.12 0.12 0.12
M&F 0.11 0.11 0.10 0.13 0.10 0.11 0.05 0.11 0.11 0.10
35–49 M 0.10 0.10 0.11 0.12 0.09 0.11 0.04 0.11 0.10 0.11 F 0.15 0.15 0.15 0.17 0.14 0.16 0.02 0.15 0.15 0.15
M&F 0.13 0.13 0.14 0.15 0.13 0.15 0.03 0.14 0.13 0.14
50–64 M 0.10 0.11 0.09 0.12 0.09 0.11 0.04 0.11 0.11 0.10 F 0.15 0.18 0.15 0.16 0.14 0.16 0.04 0.17 0.17 0.15
M&F 0.13 0.15 0.12 0.14 0.12 0.14 0.04 0.14 0.15 0.13
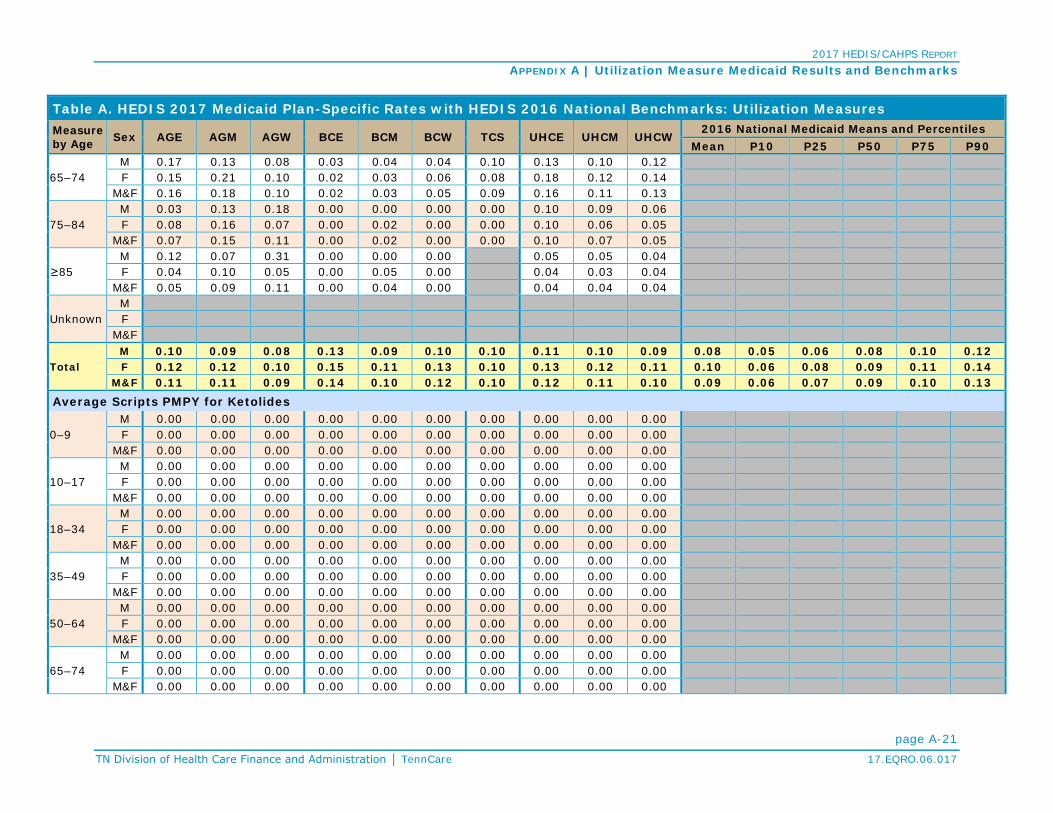
2017 HEDIS/CAHPS REPORT APPENDIX A | Utilization Measure Medicaid Results and Benchmarks
page A-21 TN Division of Health Care Finance and Administration │ TennCare 17.EQRO.06.017
Table A. HEDIS 2017 Medicaid Plan-Specific Rates with HEDIS 2016 National Benchmarks: Utilization Measures Measure by Age Sex AGE AGM AGW BCE BCM BCW TCS UHCE UHCM UHCW
2016 National Medicaid Means and Percentiles Mean P10 P25 P50 P75 P90
65–74 M 0.17 0.13 0.08 0.03 0.04 0.04 0.10 0.13 0.10 0.12 F 0.15 0.21 0.10 0.02 0.03 0.06 0.08 0.18 0.12 0.14
M&F 0.16 0.18 0.10 0.02 0.03 0.05 0.09 0.16 0.11 0.13
75–84 M 0.03 0.13 0.18 0.00 0.00 0.00 0.00 0.10 0.09 0.06 F 0.08 0.16 0.07 0.00 0.02 0.00 0.00 0.10 0.06 0.05
M&F 0.07 0.15 0.11 0.00 0.02 0.00 0.00 0.10 0.07 0.05
≥85 M 0.12 0.07 0.31 0.00 0.00 0.00 0.05 0.05 0.04 F 0.04 0.10 0.05 0.00 0.05 0.00 0.04 0.03 0.04
M&F 0.05 0.09 0.11 0.00 0.04 0.00 0.04 0.04 0.04
Unknown M F
M&F
Total M 0.10 0.09 0.08 0.13 0.09 0.10 0.10 0.11 0.10 0.09 0.08 0.05 0.06 0.08 0.10 0.12 F 0.12 0.12 0.10 0.15 0.11 0.13 0.10 0.13 0.12 0.11 0.10 0.06 0.08 0.09 0.11 0.14
M&F 0.11 0.11 0.09 0.14 0.10 0.12 0.10 0.12 0.11 0.10 0.09 0.06 0.07 0.09 0.10 0.13
Average Scripts PMPY for Ketolides
0–9 M 0.00 0.00 0.00 0.00 0.00 0.00 0.00 0.00 0.00 0.00 F 0.00 0.00 0.00 0.00 0.00 0.00 0.00 0.00 0.00 0.00
M&F 0.00 0.00 0.00 0.00 0.00 0.00 0.00 0.00 0.00 0.00
10–17 M 0.00 0.00 0.00 0.00 0.00 0.00 0.00 0.00 0.00 0.00 F 0.00 0.00 0.00 0.00 0.00 0.00 0.00 0.00 0.00 0.00
M&F 0.00 0.00 0.00 0.00 0.00 0.00 0.00 0.00 0.00 0.00
18–34 M 0.00 0.00 0.00 0.00 0.00 0.00 0.00 0.00 0.00 0.00 F 0.00 0.00 0.00 0.00 0.00 0.00 0.00 0.00 0.00 0.00
M&F 0.00 0.00 0.00 0.00 0.00 0.00 0.00 0.00 0.00 0.00
35–49 M 0.00 0.00 0.00 0.00 0.00 0.00 0.00 0.00 0.00 0.00 F 0.00 0.00 0.00 0.00 0.00 0.00 0.00 0.00 0.00 0.00
M&F 0.00 0.00 0.00 0.00 0.00 0.00 0.00 0.00 0.00 0.00
50–64 M 0.00 0.00 0.00 0.00 0.00 0.00 0.00 0.00 0.00 0.00 F 0.00 0.00 0.00 0.00 0.00 0.00 0.00 0.00 0.00 0.00
M&F 0.00 0.00 0.00 0.00 0.00 0.00 0.00 0.00 0.00 0.00
65–74 M 0.00 0.00 0.00 0.00 0.00 0.00 0.00 0.00 0.00 0.00 F 0.00 0.00 0.00 0.00 0.00 0.00 0.00 0.00 0.00 0.00
M&F 0.00 0.00 0.00 0.00 0.00 0.00 0.00 0.00 0.00 0.00
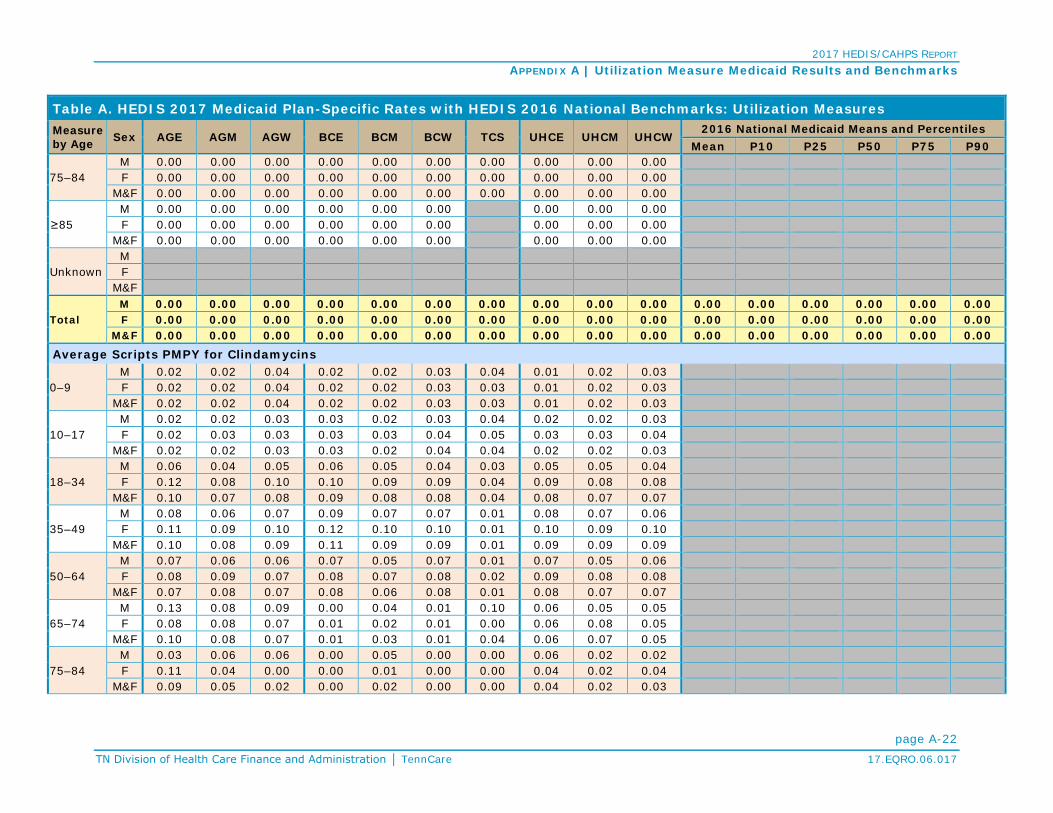
2017 HEDIS/CAHPS REPORT APPENDIX A | Utilization Measure Medicaid Results and Benchmarks
page A-22 TN Division of Health Care Finance and Administration │ TennCare 17.EQRO.06.017
Table A. HEDIS 2017 Medicaid Plan-Specific Rates with HEDIS 2016 National Benchmarks: Utilization Measures Measure by Age Sex AGE AGM AGW BCE BCM BCW TCS UHCE UHCM UHCW
2016 National Medicaid Means and Percentiles Mean P10 P25 P50 P75 P90
75–84 M 0.00 0.00 0.00 0.00 0.00 0.00 0.00 0.00 0.00 0.00 F 0.00 0.00 0.00 0.00 0.00 0.00 0.00 0.00 0.00 0.00
M&F 0.00 0.00 0.00 0.00 0.00 0.00 0.00 0.00 0.00 0.00
≥85 M 0.00 0.00 0.00 0.00 0.00 0.00 0.00 0.00 0.00 F 0.00 0.00 0.00 0.00 0.00 0.00 0.00 0.00 0.00
M&F 0.00 0.00 0.00 0.00 0.00 0.00 0.00 0.00 0.00
Unknown M F
M&F
Total M 0.00 0.00 0.00 0.00 0.00 0.00 0.00 0.00 0.00 0.00 0.00 0.00 0.00 0.00 0.00 0.00 F 0.00 0.00 0.00 0.00 0.00 0.00 0.00 0.00 0.00 0.00 0.00 0.00 0.00 0.00 0.00 0.00
M&F 0.00 0.00 0.00 0.00 0.00 0.00 0.00 0.00 0.00 0.00 0.00 0.00 0.00 0.00 0.00 0.00
Average Scripts PMPY for Clindamycins
0–9 M 0.02 0.02 0.04 0.02 0.02 0.03 0.04 0.01 0.02 0.03 F 0.02 0.02 0.04 0.02 0.02 0.03 0.03 0.01 0.02 0.03
M&F 0.02 0.02 0.04 0.02 0.02 0.03 0.03 0.01 0.02 0.03
10–17 M 0.02 0.02 0.03 0.03 0.02 0.03 0.04 0.02 0.02 0.03 F 0.02 0.03 0.03 0.03 0.03 0.04 0.05 0.03 0.03 0.04
M&F 0.02 0.02 0.03 0.03 0.02 0.04 0.04 0.02 0.02 0.03
18–34 M 0.06 0.04 0.05 0.06 0.05 0.04 0.03 0.05 0.05 0.04 F 0.12 0.08 0.10 0.10 0.09 0.09 0.04 0.09 0.08 0.08
M&F 0.10 0.07 0.08 0.09 0.08 0.08 0.04 0.08 0.07 0.07
35–49 M 0.08 0.06 0.07 0.09 0.07 0.07 0.01 0.08 0.07 0.06 F 0.11 0.09 0.10 0.12 0.10 0.10 0.01 0.10 0.09 0.10
M&F 0.10 0.08 0.09 0.11 0.09 0.09 0.01 0.09 0.09 0.09
50–64 M 0.07 0.06 0.06 0.07 0.05 0.07 0.01 0.07 0.05 0.06 F 0.08 0.09 0.07 0.08 0.07 0.08 0.02 0.09 0.08 0.08
M&F 0.07 0.08 0.07 0.08 0.06 0.08 0.01 0.08 0.07 0.07
65–74 M 0.13 0.08 0.09 0.00 0.04 0.01 0.10 0.06 0.05 0.05 F 0.08 0.08 0.07 0.01 0.02 0.01 0.00 0.06 0.08 0.05
M&F 0.10 0.08 0.07 0.01 0.03 0.01 0.04 0.06 0.07 0.05
75–84 M 0.03 0.06 0.06 0.00 0.05 0.00 0.00 0.06 0.02 0.02 F 0.11 0.04 0.00 0.00 0.01 0.00 0.00 0.04 0.02 0.04
M&F 0.09 0.05 0.02 0.00 0.02 0.00 0.00 0.04 0.02 0.03

2017 HEDIS/CAHPS REPORT APPENDIX A | Utilization Measure Medicaid Results and Benchmarks
page A-23 TN Division of Health Care Finance and Administration │ TennCare 17.EQRO.06.017
Table A. HEDIS 2017 Medicaid Plan-Specific Rates with HEDIS 2016 National Benchmarks: Utilization Measures Measure by Age Sex AGE AGM AGW BCE BCM BCW TCS UHCE UHCM UHCW
2016 National Medicaid Means and Percentiles Mean P10 P25 P50 P75 P90
≥85 M 0.00 0.00 0.00 0.00 0.13 0.00 0.02 0.02 0.00 F 0.00 0.03 0.08 0.00 0.00 0.03 0.02 0.01 0.01
M&F 0.00 0.03 0.06 0.00 0.03 0.02 0.02 0.02 0.01
Unknown M F
M&F
Total M 0.04 0.03 0.04 0.04 0.03 0.04 0.04 0.04 0.03 0.04 0.03 0.02 0.02 0.03 0.04 0.05 F 0.07 0.05 0.07 0.07 0.06 0.07 0.04 0.06 0.05 0.06 0.05 0.03 0.04 0.05 0.06 0.07
M&F 0.06 0.04 0.06 0.05 0.05 0.05 0.04 0.05 0.04 0.05 0.04 0.02 0.03 0.04 0.05 0.06
Average Scripts PMPY for Misc. Antibiotics of Concern
0–9 M 0.00 0.00 0.00 0.00 0.00 0.00 0.00 0.00 0.00 0.00 F 0.00 0.00 0.00 0.00 0.00 0.00 0.00 0.00 0.00 0.00
M&F 0.00 0.00 0.00 0.00 0.00 0.00 0.00 0.00 0.00 0.00
10–17 M 0.00 0.00 0.00 0.00 0.00 0.00 0.00 0.00 0.00 0.00 F 0.00 0.00 0.00 0.00 0.00 0.00 0.00 0.00 0.00 0.00
M&F 0.00 0.00 0.00 0.00 0.00 0.00 0.00 0.00 0.00 0.00
18–34 M 0.00 0.00 0.00 0.00 0.00 0.00 0.00 0.00 0.00 0.00 F 0.00 0.00 0.00 0.00 0.00 0.00 0.00 0.00 0.00 0.00
M&F 0.00 0.00 0.00 0.00 0.00 0.00 0.00 0.00 0.00 0.00
35–49 M 0.01 0.00 0.00 0.00 0.00 0.00 0.00 0.00 0.00 0.01 F 0.00 0.00 0.00 0.00 0.00 0.00 0.00 0.00 0.00 0.00
M&F 0.00 0.00 0.00 0.00 0.00 0.00 0.00 0.00 0.00 0.00
50–64 M 0.02 0.02 0.01 0.00 0.01 0.00 0.00 0.01 0.01 0.01 F 0.01 0.02 0.00 0.01 0.00 0.00 0.00 0.00 0.01 0.01
M&F 0.01 0.02 0.00 0.01 0.01 0.00 0.00 0.01 0.01 0.01
65–74 M 0.01 0.05 0.00 0.00 0.02 0.00 0.00 0.03 0.04 0.02 F 0.00 0.00 0.00 0.00 0.00 0.01 0.00 0.01 0.00 0.01
M&F 0.01 0.02 0.00 0.00 0.01 0.00 0.00 0.02 0.02 0.01
75–84 M 0.18 0.00 0.00 0.00 0.03 0.00 0.00 0.01 0.01 0.01 F 0.00 0.02 0.00 0.00 0.00 0.00 0.00 0.03 0.00 0.00
M&F 0.06 0.02 0.00 0.00 0.01 0.00 0.00 0.02 0.00 0.00
≥85 M 0.00 0.00 0.00 0.00 0.00 0.00 0.00 0.00 0.00 F 0.06 0.03 0.00 0.06 0.00 0.00 0.02 0.00 0.00
M&F 0.05 0.03 0.00 0.05 0.00 0.00 0.01 0.00 0.00
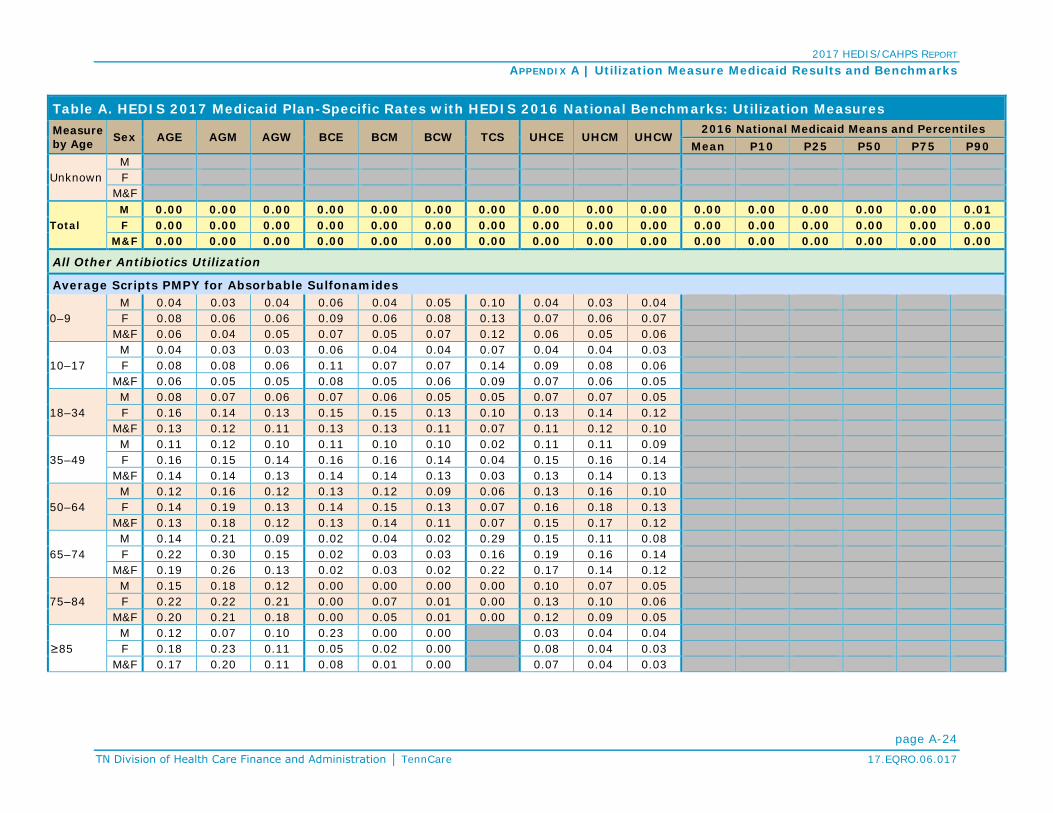
2017 HEDIS/CAHPS REPORT APPENDIX A | Utilization Measure Medicaid Results and Benchmarks
page A-24 TN Division of Health Care Finance and Administration │ TennCare 17.EQRO.06.017
Table A. HEDIS 2017 Medicaid Plan-Specific Rates with HEDIS 2016 National Benchmarks: Utilization Measures Measure by Age Sex AGE AGM AGW BCE BCM BCW TCS UHCE UHCM UHCW
2016 National Medicaid Means and Percentiles Mean P10 P25 P50 P75 P90
Unknown M F
M&F
Total M 0.00 0.00 0.00 0.00 0.00 0.00 0.00 0.00 0.00 0.00 0.00 0.00 0.00 0.00 0.00 0.01 F 0.00 0.00 0.00 0.00 0.00 0.00 0.00 0.00 0.00 0.00 0.00 0.00 0.00 0.00 0.00 0.00
M&F 0.00 0.00 0.00 0.00 0.00 0.00 0.00 0.00 0.00 0.00 0.00 0.00 0.00 0.00 0.00 0.00
All Other Antibiotics Utilization
Average Scripts PMPY for Absorbable Sulfonamides
0–9 M 0.04 0.03 0.04 0.06 0.04 0.05 0.10 0.04 0.03 0.04 F 0.08 0.06 0.06 0.09 0.06 0.08 0.13 0.07 0.06 0.07
M&F 0.06 0.04 0.05 0.07 0.05 0.07 0.12 0.06 0.05 0.06
10–17 M 0.04 0.03 0.03 0.06 0.04 0.04 0.07 0.04 0.04 0.03 F 0.08 0.08 0.06 0.11 0.07 0.07 0.14 0.09 0.08 0.06
M&F 0.06 0.05 0.05 0.08 0.05 0.06 0.09 0.07 0.06 0.05
18–34 M 0.08 0.07 0.06 0.07 0.06 0.05 0.05 0.07 0.07 0.05 F 0.16 0.14 0.13 0.15 0.15 0.13 0.10 0.13 0.14 0.12
M&F 0.13 0.12 0.11 0.13 0.13 0.11 0.07 0.11 0.12 0.10
35–49 M 0.11 0.12 0.10 0.11 0.10 0.10 0.02 0.11 0.11 0.09 F 0.16 0.15 0.14 0.16 0.16 0.14 0.04 0.15 0.16 0.14
M&F 0.14 0.14 0.13 0.14 0.14 0.13 0.03 0.13 0.14 0.13
50–64 M 0.12 0.16 0.12 0.13 0.12 0.09 0.06 0.13 0.16 0.10 F 0.14 0.19 0.13 0.14 0.15 0.13 0.07 0.16 0.18 0.13
M&F 0.13 0.18 0.12 0.13 0.14 0.11 0.07 0.15 0.17 0.12
65–74 M 0.14 0.21 0.09 0.02 0.04 0.02 0.29 0.15 0.11 0.08 F 0.22 0.30 0.15 0.02 0.03 0.03 0.16 0.19 0.16 0.14
M&F 0.19 0.26 0.13 0.02 0.03 0.02 0.22 0.17 0.14 0.12
75–84 M 0.15 0.18 0.12 0.00 0.00 0.00 0.00 0.10 0.07 0.05 F 0.22 0.22 0.21 0.00 0.07 0.01 0.00 0.13 0.10 0.06
M&F 0.20 0.21 0.18 0.00 0.05 0.01 0.00 0.12 0.09 0.05
≥85 M 0.12 0.07 0.10 0.23 0.00 0.00 0.03 0.04 0.04 F 0.18 0.23 0.11 0.05 0.02 0.00 0.08 0.04 0.03
M&F 0.17 0.20 0.11 0.08 0.01 0.00 0.07 0.04 0.03

2017 HEDIS/CAHPS REPORT APPENDIX A | Utilization Measure Medicaid Results and Benchmarks
page A-25 TN Division of Health Care Finance and Administration │ TennCare 17.EQRO.06.017
Table A. HEDIS 2017 Medicaid Plan-Specific Rates with HEDIS 2016 National Benchmarks: Utilization Measures Measure by Age Sex AGE AGM AGW BCE BCM BCW TCS UHCE UHCM UHCW
2016 National Medicaid Means and Percentiles Mean P10 P25 P50 P75 P90
Unknown M F
M&F
Total M 0.06 0.06 0.05 0.07 0.05 0.05 0.07 0.06 0.06 0.05 0.07 0.03 0.04 0.05 0.06 0.09 F 0.12 0.11 0.10 0.13 0.11 0.11 0.12 0.12 0.11 0.10 0.11 0.06 0.07 0.09 0.12 0.15
M&F 0.10 0.09 0.08 0.10 0.09 0.09 0.09 0.09 0.09 0.08 0.09 0.05 0.06 0.07 0.09 0.12
Average Scripts PMPY for Aminoglycosides
0–9 M 0.00 0.00 0.00 0.00 0.00 0.00 0.01 0.00 0.00 0.00 F 0.00 0.00 0.00 0.00 0.00 0.00 0.01 0.00 0.00 0.00
M&F 0.00 0.00 0.00 0.00 0.00 0.00 0.01 0.00 0.00 0.00
10–17 M 0.00 0.00 0.00 0.00 0.00 0.00 0.00 0.00 0.00 0.00 F 0.00 0.00 0.00 0.00 0.00 0.00 0.01 0.00 0.00 0.00
M&F 0.00 0.00 0.00 0.00 0.00 0.00 0.01 0.00 0.00 0.00
18–34 M 0.00 0.00 0.00 0.00 0.00 0.00 0.00 0.00 0.00 0.00 F 0.00 0.00 0.00 0.00 0.00 0.00 0.00 0.00 0.00 0.00
M&F 0.00 0.00 0.00 0.00 0.00 0.00 0.00 0.00 0.00 0.00
35–49 M 0.00 0.00 0.00 0.00 0.00 0.00 0.00 0.00 0.00 0.00 F 0.00 0.00 0.00 0.00 0.00 0.00 0.00 0.00 0.00 0.00
M&F 0.00 0.00 0.00 0.00 0.00 0.00 0.00 0.00 0.00 0.00
50–64 M 0.00 0.00 0.00 0.00 0.00 0.00 0.00 0.02 0.00 0.00 F 0.00 0.00 0.00 0.00 0.00 0.00 0.00 0.00 0.00 0.00
M&F 0.00 0.00 0.00 0.00 0.00 0.00 0.00 0.01 0.00 0.00
65–74 M 0.00 0.00 0.00 0.00 0.00 0.00 0.00 0.01 0.00 0.00 F 0.04 0.01 0.02 0.00 0.00 0.00 0.00 0.00 0.00 0.01
M&F 0.02 0.01 0.01 0.00 0.00 0.00 0.00 0.00 0.00 0.00
75–84 M 0.00 0.00 0.00 0.00 0.00 0.00 0.00 0.01 0.00 0.01 F 0.00 0.01 0.00 0.00 0.00 0.00 0.00 0.00 0.00 0.00
M&F 0.00 0.00 0.00 0.00 0.00 0.00 0.00 0.00 0.00 0.00
≥85 M 0.00 0.00 0.00 0.00 0.00 0.00 0.00 0.00 0.00 F 0.00 0.03 0.00 0.00 0.00 0.00 0.00 0.01 0.00
M&F 0.00 0.02 0.00 0.00 0.00 0.00 0.00 0.01 0.00
Unknown M F
M&F

2017 HEDIS/CAHPS REPORT APPENDIX A | Utilization Measure Medicaid Results and Benchmarks
page A-26 TN Division of Health Care Finance and Administration │ TennCare 17.EQRO.06.017
Table A. HEDIS 2017 Medicaid Plan-Specific Rates with HEDIS 2016 National Benchmarks: Utilization Measures Measure by Age Sex AGE AGM AGW BCE BCM BCW TCS UHCE UHCM UHCW
2016 National Medicaid Means and Percentiles Mean P10 P25 P50 P75 P90
Total M 0.00 0.00 0.00 0.00 0.00 0.00 0.00 0.00 0.00 0.00 0.00 0.00 0.00 0.00 0.00 0.00 F 0.00 0.00 0.00 0.00 0.00 0.00 0.01 0.00 0.00 0.00 0.00 0.00 0.00 0.00 0.00 0.00
M&F 0.00 0.00 0.00 0.00 0.00 0.00 0.00 0.00 0.00 0.00 0.00 0.00 0.00 0.00 0.00 0.00
Average Scripts PMPY for 1st Generation Cephalosporins
0–9 M 0.04 0.06 0.03 0.06 0.06 0.05 0.06 0.05 0.07 0.04 F 0.06 0.07 0.04 0.07 0.08 0.06 0.07 0.06 0.07 0.04
M&F 0.05 0.07 0.04 0.06 0.07 0.05 0.06 0.05 0.07 0.04
10–17 M 0.05 0.06 0.04 0.06 0.06 0.05 0.06 0.05 0.06 0.04 F 0.06 0.07 0.04 0.08 0.07 0.06 0.07 0.06 0.07 0.05
M&F 0.06 0.06 0.04 0.07 0.06 0.05 0.06 0.05 0.07 0.04
18–34 M 0.05 0.06 0.05 0.06 0.06 0.05 0.04 0.05 0.06 0.05 F 0.11 0.12 0.10 0.12 0.12 0.11 0.06 0.10 0.11 0.09
M&F 0.09 0.10 0.08 0.10 0.10 0.10 0.05 0.08 0.10 0.08
35–49 M 0.07 0.09 0.07 0.08 0.08 0.07 0.02 0.07 0.08 0.08 F 0.09 0.12 0.09 0.11 0.12 0.10 0.02 0.10 0.11 0.09
M&F 0.09 0.11 0.09 0.10 0.11 0.10 0.02 0.09 0.11 0.09
50–64 M 0.09 0.12 0.09 0.08 0.09 0.09 0.04 0.10 0.11 0.10 F 0.10 0.15 0.10 0.12 0.12 0.12 0.04 0.13 0.13 0.13
M&F 0.09 0.14 0.09 0.10 0.11 0.10 0.04 0.12 0.12 0.11
65–74 M 0.17 0.21 0.10 0.01 0.05 0.02 0.10 0.11 0.09 0.10 F 0.08 0.32 0.10 0.02 0.03 0.08 0.00 0.17 0.15 0.14
M&F 0.12 0.28 0.10 0.01 0.04 0.06 0.04 0.15 0.13 0.13
75–84 M 0.18 0.21 0.28 0.00 0.00 0.00 0.00 0.08 0.11 0.09 F 0.21 0.21 0.20 0.04 0.00 0.01 0.00 0.11 0.09 0.06
M&F 0.20 0.21 0.22 0.03 0.00 0.01 0.00 0.10 0.09 0.07
≥85 M 0.00 0.21 0.00 0.00 0.72 0.42 0.09 0.03 0.03 F 0.14 0.24 0.00 0.08 0.00 0.03 0.08 0.05 0.06
M&F 0.12 0.24 0.00 0.07 0.15 0.09 0.09 0.05 0.06
Unknown M F
M&F
Total M 0.05 0.07 0.04 0.06 0.06 0.05 0.05 0.06 0.07 0.05 0.06 0.04 0.04 0.06 0.07 0.09 F 0.08 0.10 0.07 0.10 0.10 0.08 0.06 0.09 0.09 0.07 0.09 0.05 0.06 0.08 0.10 0.13
M&F 0.07 0.09 0.06 0.08 0.08 0.07 0.06 0.07 0.08 0.06 0.07 0.04 0.05 0.07 0.08 0.11

2017 HEDIS/CAHPS REPORT APPENDIX A | Utilization Measure Medicaid Results and Benchmarks
page A-27 TN Division of Health Care Finance and Administration │ TennCare 17.EQRO.06.017
Table A. HEDIS 2017 Medicaid Plan-Specific Rates with HEDIS 2016 National Benchmarks: Utilization Measures Measure by Age Sex AGE AGM AGW BCE BCM BCW TCS UHCE UHCM UHCW
2016 National Medicaid Means and Percentiles Mean P10 P25 P50 P75 P90
Average Scripts PMPY for Lincosamides
0–9 M 0.00 0.00 0.00 0.00 0.00 0.00 0.00 0.00 0.00 0.00 F 0.00 0.00 0.00 0.00 0.00 0.00 0.00 0.00 0.00 0.00
M&F 0.00 0.00 0.00 0.00 0.00 0.00 0.00 0.00 0.00 0.00
10–17 M 0.00 0.00 0.00 0.00 0.00 0.00 0.00 0.00 0.00 0.00 F 0.00 0.00 0.00 0.00 0.00 0.00 0.00 0.00 0.00 0.00
M&F 0.00 0.00 0.00 0.00 0.00 0.00 0.00 0.00 0.00 0.00
18–34 M 0.00 0.00 0.00 0.00 0.00 0.00 0.00 0.00 0.00 0.00 F 0.00 0.00 0.00 0.00 0.00 0.00 0.00 0.00 0.00 0.00
M&F 0.00 0.00 0.00 0.00 0.00 0.00 0.00 0.00 0.00 0.00
35–49 M 0.00 0.00 0.00 0.00 0.00 0.00 0.00 0.00 0.00 0.00 F 0.00 0.00 0.00 0.00 0.00 0.00 0.00 0.00 0.00 0.00
M&F 0.00 0.00 0.00 0.00 0.00 0.00 0.00 0.00 0.00 0.00
50–64 M 0.00 0.00 0.00 0.00 0.00 0.00 0.00 0.00 0.00 0.00 F 0.00 0.00 0.00 0.00 0.00 0.00 0.00 0.00 0.00 0.00
M&F 0.00 0.00 0.00 0.00 0.00 0.00 0.00 0.00 0.00 0.00
65–74 M 0.00 0.00 0.00 0.00 0.00 0.00 0.00 0.00 0.00 0.00 F 0.00 0.00 0.00 0.00 0.00 0.00 0.00 0.00 0.00 0.00
M&F 0.00 0.00 0.00 0.00 0.00 0.00 0.00 0.00 0.00 0.00
75–84 M 0.00 0.00 0.00 0.00 0.00 0.00 0.00 0.00 0.00 0.00 F 0.00 0.00 0.00 0.00 0.00 0.00 0.00 0.00 0.00 0.00
M&F 0.00 0.00 0.00 0.00 0.00 0.00 0.00 0.00 0.00 0.00
≥85 M 0.00 0.00 0.00 0.00 0.00 0.00 0.00 0.00 0.00 F 0.00 0.00 0.00 0.00 0.00 0.00 0.00 0.00 0.00
M&F 0.00 0.00 0.00 0.00 0.00 0.00 0.00 0.00 0.00
Unknown M F
M&F
Total M 0.00 0.00 0.00 0.00 0.00 0.00 0.00 0.00 0.00 0.00 0.00 0.00 0.00 0.00 0.00 0.00 F 0.00 0.00 0.00 0.00 0.00 0.00 0.00 0.00 0.00 0.00 0.00 0.00 0.00 0.00 0.00 0.00
M&F 0.00 0.00 0.00 0.00 0.00 0.00 0.00 0.00 0.00 0.00 0.00 0.00 0.00 0.00 0.00 0.00
Average Scripts PMPY for Macrolides (not azith. or clarith.)
0–9 M 0.00 0.00 0.00 0.00 0.00 0.00 0.02 0.00 0.00 0.00 F 0.00 0.00 0.00 0.00 0.00 0.00 0.03 0.00 0.00 0.00
M&F 0.00 0.00 0.00 0.00 0.00 0.00 0.02 0.00 0.00 0.00

2017 HEDIS/CAHPS REPORT APPENDIX A | Utilization Measure Medicaid Results and Benchmarks
page A-28 TN Division of Health Care Finance and Administration │ TennCare 17.EQRO.06.017
Table A. HEDIS 2017 Medicaid Plan-Specific Rates with HEDIS 2016 National Benchmarks: Utilization Measures Measure by Age Sex AGE AGM AGW BCE BCM BCW TCS UHCE UHCM UHCW
2016 National Medicaid Means and Percentiles Mean P10 P25 P50 P75 P90
10–17 M 0.00 0.00 0.00 0.00 0.00 0.00 0.00 0.00 0.00 0.00 F 0.00 0.00 0.00 0.00 0.00 0.00 0.00 0.00 0.00 0.00
M&F 0.00 0.00 0.00 0.00 0.00 0.00 0.00 0.00 0.00 0.00
18–34 M 0.00 0.00 0.00 0.00 0.00 0.00 0.00 0.00 0.00 0.00 F 0.00 0.00 0.00 0.00 0.00 0.00 0.00 0.00 0.00 0.00
M&F 0.00 0.00 0.00 0.00 0.00 0.00 0.00 0.00 0.00 0.00
35–49 M 0.00 0.00 0.00 0.00 0.00 0.00 0.00 0.00 0.00 0.00 F 0.00 0.00 0.00 0.00 0.00 0.00 0.00 0.00 0.00 0.00
M&F 0.00 0.00 0.00 0.00 0.00 0.00 0.00 0.00 0.00 0.00
50–64 M 0.00 0.00 0.00 0.00 0.00 0.00 0.00 0.00 0.00 0.00 F 0.00 0.00 0.00 0.00 0.00 0.00 0.00 0.00 0.00 0.00
M&F 0.00 0.00 0.00 0.00 0.00 0.00 0.00 0.00 0.00 0.00
65–74 M 0.00 0.01 0.00 0.00 0.00 0.00 0.00 0.00 0.00 0.00 F 0.00 0.01 0.00 0.00 0.00 0.00 0.00 0.01 0.00 0.00
M&F 0.00 0.01 0.00 0.00 0.00 0.00 0.00 0.00 0.00 0.00
75–84 M 0.00 0.00 0.00 0.00 0.00 0.00 0.00 0.08 0.00 0.00 F 0.00 0.01 0.00 0.00 0.00 0.00 0.00 0.00 0.00 0.00
M&F 0.00 0.00 0.00 0.00 0.00 0.00 0.00 0.02 0.00 0.00
≥85 M 0.00 0.00 0.00 0.00 0.00 0.00 0.00 0.00 0.00 F 0.00 0.02 0.00 0.00 0.00 0.00 0.00 0.00 0.00
M&F 0.00 0.01 0.00 0.00 0.00 0.00 0.00 0.00 0.00
Unknown M F
M&F
Total M 0.00 0.00 0.00 0.00 0.00 0.00 0.01 0.00 0.00 0.00 0.00 0.00 0.00 0.00 0.00 0.00 F 0.00 0.00 0.00 0.00 0.00 0.00 0.01 0.00 0.00 0.00 0.00 0.00 0.00 0.00 0.00 0.01
M&F 0.00 0.00 0.00 0.00 0.00 0.00 0.01 0.00 0.00 0.00 0.00 0.00 0.00 0.00 0.00 0.00
Average Scripts PMPY for Penicillins
0–9 M 0.48 0.47 0.35 0.60 0.49 0.43 0.47 0.47 0.52 0.40 F 0.49 0.47 0.35 0.62 0.50 0.44 0.51 0.48 0.52 0.39
M&F 0.48 0.47 0.35 0.61 0.50 0.43 0.49 0.47 0.52 0.40
10–17 M 0.21 0.19 0.14 0.26 0.19 0.17 0.21 0.19 0.20 0.15 F 0.27 0.24 0.18 0.31 0.23 0.21 0.27 0.24 0.25 0.18
M&F 0.24 0.21 0.16 0.28 0.21 0.19 0.23 0.21 0.22 0.16

2017 HEDIS/CAHPS REPORT APPENDIX A | Utilization Measure Medicaid Results and Benchmarks
page A-29 TN Division of Health Care Finance and Administration │ TennCare 17.EQRO.06.017
Table A. HEDIS 2017 Medicaid Plan-Specific Rates with HEDIS 2016 National Benchmarks: Utilization Measures Measure by Age Sex AGE AGM AGW BCE BCM BCW TCS UHCE UHCM UHCW
2016 National Medicaid Means and Percentiles Mean P10 P25 P50 P75 P90
18–34 M 0.14 0.12 0.11 0.15 0.12 0.13 0.10 0.12 0.12 0.10 F 0.24 0.22 0.22 0.27 0.24 0.26 0.14 0.21 0.22 0.20
M&F 0.20 0.20 0.19 0.24 0.21 0.23 0.12 0.18 0.19 0.17
35–49 M 0.13 0.13 0.16 0.17 0.16 0.17 0.09 0.14 0.15 0.14 F 0.19 0.20 0.20 0.23 0.21 0.26 0.09 0.18 0.20 0.20
M&F 0.17 0.18 0.19 0.22 0.20 0.24 0.09 0.17 0.18 0.18
50–64 M 0.10 0.15 0.13 0.18 0.19 0.19 0.07 0.13 0.14 0.16 F 0.15 0.21 0.18 0.22 0.20 0.23 0.16 0.17 0.16 0.21
M&F 0.13 0.18 0.16 0.21 0.19 0.21 0.11 0.15 0.15 0.19
65–74 M 0.18 0.23 0.31 0.04 0.13 0.10 0.00 0.14 0.13 0.16 F 0.28 0.29 0.26 0.04 0.05 0.03 0.08 0.18 0.14 0.18
M&F 0.24 0.27 0.28 0.04 0.08 0.05 0.04 0.16 0.13 0.17
75–84 M 0.12 0.08 0.09 0.00 0.00 0.00 0.00 0.12 0.03 0.03 F 0.08 0.18 0.16 0.01 0.04 0.01 0.00 0.12 0.08 0.08
M&F 0.10 0.15 0.14 0.01 0.03 0.01 0.00 0.12 0.07 0.07
≥85 M 0.12 0.21 0.10 0.00 0.00 0.00 0.06 0.02 0.01 F 0.04 0.09 0.19 0.06 0.05 0.05 0.05 0.03 0.02
M&F 0.05 0.11 0.17 0.05 0.04 0.05 0.05 0.03 0.02
Unknown M F
M&F
Total M 0.27 0.29 0.23 0.38 0.30 0.28 0.27 0.27 0.32 0.25 0.28 0.17 0.22 0.26 0.33 0.39 F 0.30 0.30 0.25 0.37 0.31 0.30 0.31 0.27 0.31 0.25 0.30 0.20 0.25 0.29 0.35 0.41
M&F 0.29 0.30 0.24 0.37 0.30 0.29 0.28 0.27 0.31 0.25 0.29 0.19 0.24 0.28 0.34 0.40
Average Scripts PMPY for Tetracyclines
0–9 M 0.00 0.00 0.00 0.00 0.00 0.00 0.00 0.00 0.00 0.00 F 0.00 0.00 0.00 0.00 0.00 0.00 0.00 0.00 0.00 0.00
M&F 0.00 0.00 0.00 0.00 0.00 0.00 0.00 0.00 0.00 0.00
10–17 M 0.03 0.04 0.03 0.06 0.02 0.04 0.06 0.05 0.04 0.04 F 0.04 0.04 0.03 0.07 0.03 0.05 0.05 0.05 0.04 0.04
M&F 0.04 0.04 0.03 0.06 0.03 0.05 0.06 0.05 0.04 0.04
18–34 M 0.04 0.05 0.04 0.06 0.04 0.06 0.07 0.06 0.05 0.05 F 0.07 0.06 0.07 0.08 0.06 0.08 0.05 0.07 0.07 0.07
M&F 0.06 0.06 0.06 0.07 0.05 0.08 0.06 0.07 0.06 0.06

2017 HEDIS/CAHPS REPORT APPENDIX A | Utilization Measure Medicaid Results and Benchmarks
page A-30 TN Division of Health Care Finance and Administration │ TennCare 17.EQRO.06.017
Table A. HEDIS 2017 Medicaid Plan-Specific Rates with HEDIS 2016 National Benchmarks: Utilization Measures Measure by Age Sex AGE AGM AGW BCE BCM BCW TCS UHCE UHCM UHCW
2016 National Medicaid Means and Percentiles Mean P10 P25 P50 P75 P90
35–49 M 0.06 0.06 0.07 0.07 0.05 0.08 0.04 0.06 0.06 0.07 F 0.09 0.09 0.09 0.10 0.08 0.11 0.01 0.10 0.09 0.09
M&F 0.08 0.08 0.08 0.09 0.07 0.10 0.02 0.09 0.08 0.08
50–64 M 0.07 0.09 0.07 0.09 0.07 0.09 0.09 0.10 0.10 0.09 F 0.10 0.12 0.09 0.13 0.10 0.11 0.09 0.15 0.13 0.10
M&F 0.08 0.10 0.08 0.11 0.09 0.10 0.09 0.13 0.11 0.10
65–74 M 0.13 0.11 0.09 0.01 0.01 0.02 0.00 0.14 0.06 0.10 F 0.15 0.17 0.16 0.02 0.02 0.01 0.08 0.18 0.13 0.09
M&F 0.14 0.15 0.13 0.02 0.02 0.01 0.04 0.17 0.11 0.09
75–84 M 0.18 0.18 0.40 0.01 0.00 0.00 0.00 0.13 0.06 0.03 F 0.25 0.10 0.07 0.01 0.01 0.00 0.00 0.15 0.06 0.05
M&F 0.23 0.12 0.17 0.01 0.01 0.00 0.00 0.15 0.06 0.04
≥85 M 0.36 0.07 0.20 0.00 0.00 0.00 0.07 0.04 0.03 F 0.10 0.18 0.21 0.00 0.00 0.00 0.05 0.02 0.02
M&F 0.14 0.16 0.21 0.00 0.00 0.00 0.05 0.02 0.02
Unknown M F
M&F
Total M 0.03 0.03 0.02 0.04 0.02 0.03 0.04 0.04 0.03 0.03 0.04 0.02 0.03 0.03 0.04 0.06 F 0.05 0.05 0.05 0.06 0.04 0.06 0.03 0.07 0.05 0.05 0.06 0.03 0.04 0.05 0.07 0.08
M&F 0.04 0.04 0.04 0.05 0.03 0.05 0.04 0.06 0.04 0.04 0.05 0.02 0.03 0.04 0.06 0.07
Average Scripts PMPY for Misc. Antibiotics
0–9 M 0.00 0.00 0.00 0.00 0.00 0.00 0.01 0.00 0.00 0.00 F 0.01 0.01 0.00 0.01 0.01 0.00 0.02 0.01 0.01 0.00
M&F 0.00 0.00 0.00 0.00 0.00 0.00 0.01 0.00 0.00 0.00
10–17 M 0.01 0.00 0.00 0.01 0.00 0.00 0.01 0.01 0.00 0.00 F 0.04 0.05 0.04 0.06 0.04 0.06 0.09 0.05 0.04 0.04
M&F 0.02 0.03 0.02 0.03 0.02 0.03 0.04 0.03 0.02 0.02
18–34 M 0.01 0.01 0.02 0.02 0.02 0.02 0.01 0.01 0.01 0.02 F 0.27 0.29 0.41 0.28 0.31 0.38 0.17 0.22 0.27 0.32
M&F 0.19 0.21 0.31 0.22 0.23 0.29 0.08 0.16 0.20 0.24
35–49 M 0.03 0.04 0.04 0.03 0.03 0.03 0.01 0.02 0.03 0.03 F 0.16 0.21 0.27 0.17 0.19 0.27 0.05 0.15 0.20 0.22
M&F 0.11 0.16 0.20 0.13 0.14 0.22 0.03 0.11 0.15 0.17
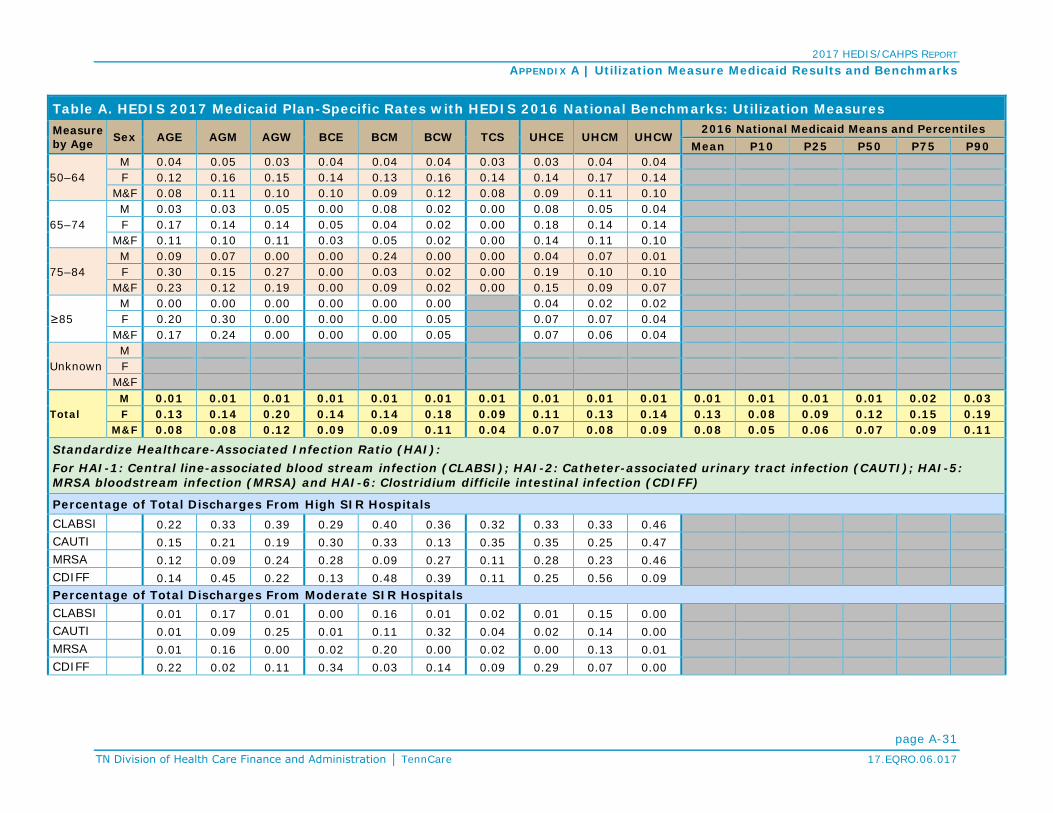
2017 HEDIS/CAHPS REPORT APPENDIX A | Utilization Measure Medicaid Results and Benchmarks
page A-31 TN Division of Health Care Finance and Administration │ TennCare 17.EQRO.06.017
Table A. HEDIS 2017 Medicaid Plan-Specific Rates with HEDIS 2016 National Benchmarks: Utilization Measures Measure by Age Sex AGE AGM AGW BCE BCM BCW TCS UHCE UHCM UHCW
2016 National Medicaid Means and Percentiles Mean P10 P25 P50 P75 P90
50–64 M 0.04 0.05 0.03 0.04 0.04 0.04 0.03 0.03 0.04 0.04 F 0.12 0.16 0.15 0.14 0.13 0.16 0.14 0.14 0.17 0.14
M&F 0.08 0.11 0.10 0.10 0.09 0.12 0.08 0.09 0.11 0.10
65–74 M 0.03 0.03 0.05 0.00 0.08 0.02 0.00 0.08 0.05 0.04 F 0.17 0.14 0.14 0.05 0.04 0.02 0.00 0.18 0.14 0.14
M&F 0.11 0.10 0.11 0.03 0.05 0.02 0.00 0.14 0.11 0.10
75–84 M 0.09 0.07 0.00 0.00 0.24 0.00 0.00 0.04 0.07 0.01 F 0.30 0.15 0.27 0.00 0.03 0.02 0.00 0.19 0.10 0.10
M&F 0.23 0.12 0.19 0.00 0.09 0.02 0.00 0.15 0.09 0.07
≥85 M 0.00 0.00 0.00 0.00 0.00 0.00 0.04 0.02 0.02 F 0.20 0.30 0.00 0.00 0.00 0.05 0.07 0.07 0.04
M&F 0.17 0.24 0.00 0.00 0.00 0.05 0.07 0.06 0.04
Unknown M F
M&F
Total M 0.01 0.01 0.01 0.01 0.01 0.01 0.01 0.01 0.01 0.01 0.01 0.01 0.01 0.01 0.02 0.03 F 0.13 0.14 0.20 0.14 0.14 0.18 0.09 0.11 0.13 0.14 0.13 0.08 0.09 0.12 0.15 0.19
M&F 0.08 0.08 0.12 0.09 0.09 0.11 0.04 0.07 0.08 0.09 0.08 0.05 0.06 0.07 0.09 0.11
Standardize Healthcare-Associated Infection Ratio (HAI): For HAI-1: Central line-associated blood stream infection (CLABSI); HAI-2: Catheter-associated urinary tract infection (CAUTI); HAI-5: MRSA bloodstream infection (MRSA) and HAI-6: Clostridium difficile intestinal infection (CDIFF)
Percentage of Total Discharges From High SIR Hospitals CLABSI 0.22 0.33 0.39 0.29 0.40 0.36 0.32 0.33 0.33 0.46 CAUTI 0.15 0.21 0.19 0.30 0.33 0.13 0.35 0.35 0.25 0.47
MRSA 0.12 0.09 0.24 0.28 0.09 0.27 0.11 0.28 0.23 0.46
CDIFF 0.14 0.45 0.22 0.13 0.48 0.39 0.11 0.25 0.56 0.09
Percentage of Total Discharges From Moderate SIR Hospitals CLABSI 0.01 0.17 0.01 0.00 0.16 0.01 0.02 0.01 0.15 0.00
CAUTI 0.01 0.09 0.25 0.01 0.11 0.32 0.04 0.02 0.14 0.00
MRSA 0.01 0.16 0.00 0.02 0.20 0.00 0.02 0.00 0.13 0.01
CDIFF 0.22 0.02 0.11 0.34 0.03 0.14 0.09 0.29 0.07 0.00
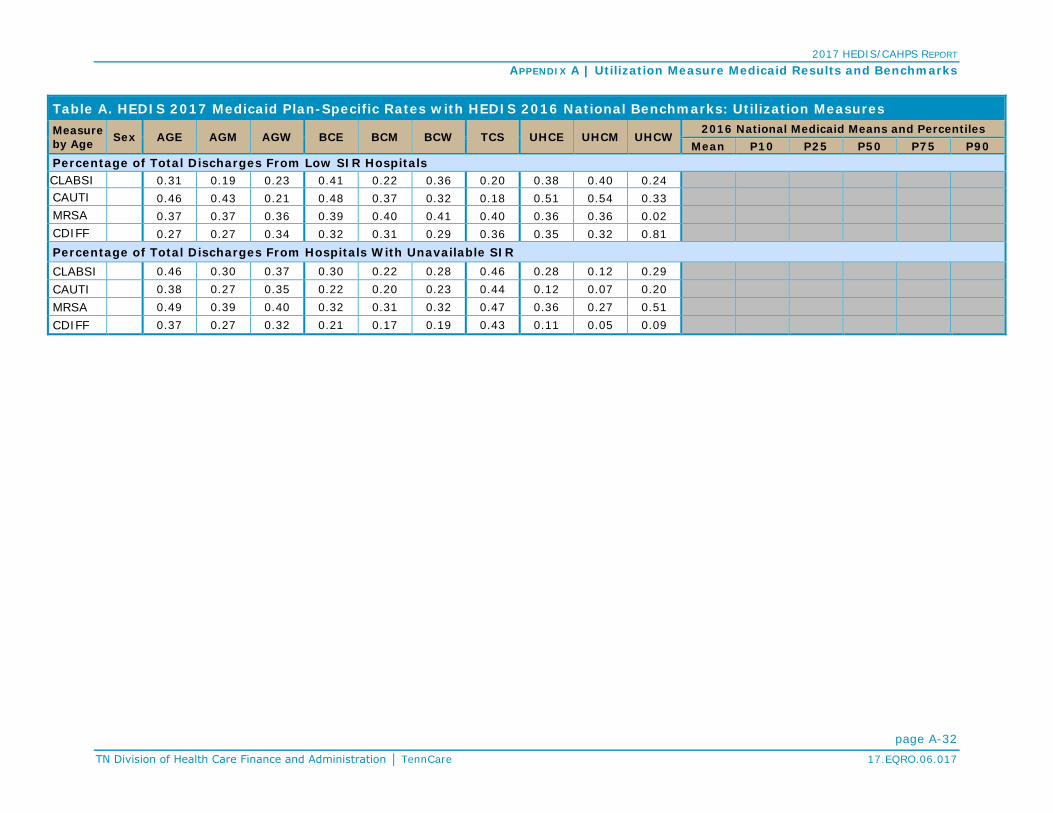
2017 HEDIS/CAHPS REPORT APPENDIX A | Utilization Measure Medicaid Results and Benchmarks
page A-32 TN Division of Health Care Finance and Administration │ TennCare 17.EQRO.06.017
Table A. HEDIS 2017 Medicaid Plan-Specific Rates with HEDIS 2016 National Benchmarks: Utilization Measures Measure by Age Sex AGE AGM AGW BCE BCM BCW TCS UHCE UHCM UHCW
2016 National Medicaid Means and Percentiles Mean P10 P25 P50 P75 P90
Percentage of Total Discharges From Low SIR Hospitals CLABSI 0.31 0.19 0.23 0.41 0.22 0.36 0.20 0.38 0.40 0.24 CAUTI 0.46 0.43 0.21 0.48 0.37 0.32 0.18 0.51 0.54 0.33
MRSA 0.37 0.37 0.36 0.39 0.40 0.41 0.40 0.36 0.36 0.02
CDIFF 0.27 0.27 0.34 0.32 0.31 0.29 0.36 0.35 0.32 0.81
Percentage of Total Discharges From Hospitals With Unavailable SIR CLABSI 0.46 0.30 0.37 0.30 0.22 0.28 0.46 0.28 0.12 0.29 CAUTI 0.38 0.27 0.35 0.22 0.20 0.23 0.44 0.12 0.07 0.20 MRSA 0.49 0.39 0.40 0.32 0.31 0.32 0.47 0.36 0.27 0.51 CDIFF 0.37 0.27 0.32 0.21 0.17 0.19 0.43 0.11 0.05 0.09

2017 HEDIS/CAHPS REPORT
page B-1 TN Division of Health Care Finance and Administration │ TennCare 17.EQRO.06.017
APPENDIX B | HEDIS 2016 National Medicaid Means and Percentiles Table B. HEDIS 2016 National Medicaid Means and Percentiles
Measure Mean Percentile
10th 25th 50th 75th 90th HEDIS Effectiveness of Care Measures
Prevention and Screening
Adult BMI Assessment (ABA) 80.77% 69.47% 77.13% 84.54% 89.35% 92.54%
Weight Assessment and Counseling for Nutrition and Physical Activity for Children/Adolescents (WCC):
BMI Percentile: 3–11 years 64.83% 41.32% 55.03% 68.22% 78.38% 86.30%
12–17 years 63.19% 39.16% 51.63% 65.74% 76.76% 85.16%
Total 64.37% 40.14% 54.50% 67.54% 77.78% 86.37%
Counseling for Nutrition: 3–11 years 61.62% 43.53% 53.03% 63.33% 73.36% 80.22%
12–17 years 57.30% 40.15% 47.83% 57.35% 68.39% 78.69%
Total 60.22% 42.92% 51.84% 62.65% 70.88% 79.52%
Counseling for Physical Activity: 3–11 years 52.40% 35.59% 43.61% 53.99% 62.19% 71.30%
12–17 years 55.24% 37.04% 46.51% 55.75% 65.36% 74.62%
Total 53.44% 35.90% 45.09% 55.38% 63.47% 71.58%
Childhood Immunization Status (CIS):
DTaP/DT 76.33% 66.89% 72.51% 77.97% 82.24% 85.15%
IPV 87.70% 81.02% 86.09% 89.78% 92.46% 93.79%
MMR 89.21% 83.76% 87.86% 90.47% 92.70% 94.25%
HiB 87.62% 81.01% 85.95% 89.37% 91.97% 93.67%
HepB 87.70% 79.16% 85.64% 90.05% 93.19% 94.81%
VZV 88.79% 83.56% 87.27% 89.97% 92.49% 93.95%
PCV 76.53% 66.24% 72.75% 78.59% 82.64% 85.40%
HepA 83.70% 74.51% 79.69% 84.91% 88.89% 91.85%
RV 67.94% 54.50% 63.46% 69.34% 74.25% 79.12%
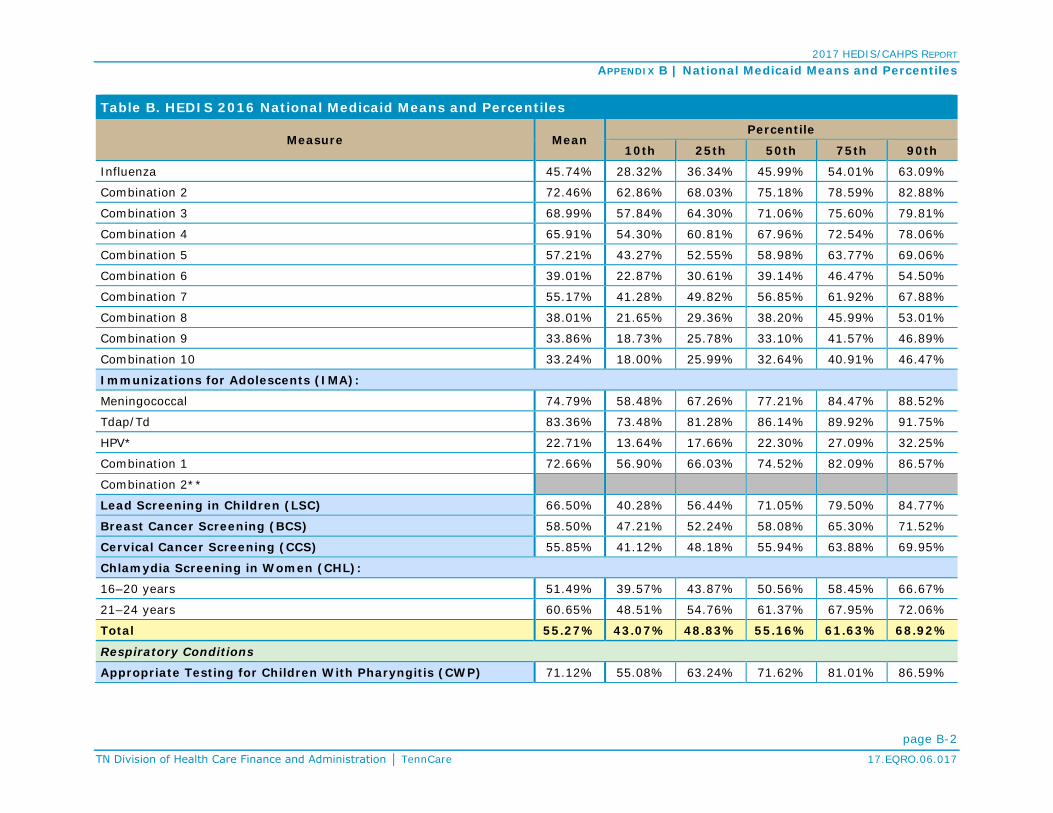
2017 HEDIS/CAHPS REPORT APPENDIX B | National Medicaid Means and Percentiles
page B-2 TN Division of Health Care Finance and Administration │ TennCare 17.EQRO.06.017
Table B. HEDIS 2016 National Medicaid Means and Percentiles
Measure Mean Percentile
10th 25th 50th 75th 90th
Influenza 45.74% 28.32% 36.34% 45.99% 54.01% 63.09%
Combination 2 72.46% 62.86% 68.03% 75.18% 78.59% 82.88%
Combination 3 68.99% 57.84% 64.30% 71.06% 75.60% 79.81%
Combination 4 65.91% 54.30% 60.81% 67.96% 72.54% 78.06%
Combination 5 57.21% 43.27% 52.55% 58.98% 63.77% 69.06%
Combination 6 39.01% 22.87% 30.61% 39.14% 46.47% 54.50%
Combination 7 55.17% 41.28% 49.82% 56.85% 61.92% 67.88%
Combination 8 38.01% 21.65% 29.36% 38.20% 45.99% 53.01%
Combination 9 33.86% 18.73% 25.78% 33.10% 41.57% 46.89%
Combination 10 33.24% 18.00% 25.99% 32.64% 40.91% 46.47%
Immunizations for Adolescents (IMA):
Meningococcal 74.79% 58.48% 67.26% 77.21% 84.47% 88.52%
Tdap/Td 83.36% 73.48% 81.28% 86.14% 89.92% 91.75%
HPV* 22.71% 13.64% 17.66% 22.30% 27.09% 32.25%
Combination 1 72.66% 56.90% 66.03% 74.52% 82.09% 86.57%
Combination 2**
Lead Screening in Children (LSC) 66.50% 40.28% 56.44% 71.05% 79.50% 84.77%
Breast Cancer Screening (BCS) 58.50% 47.21% 52.24% 58.08% 65.30% 71.52%
Cervical Cancer Screening (CCS) 55.85% 41.12% 48.18% 55.94% 63.88% 69.95%
Chlamydia Screening in Women (CHL):
16–20 years 51.49% 39.57% 43.87% 50.56% 58.45% 66.67%
21–24 years 60.65% 48.51% 54.76% 61.37% 67.95% 72.06%
Total 55.27% 43.07% 48.83% 55.16% 61.63% 68.92%
Respiratory Conditions
Appropriate Testing for Children With Pharyngitis (CWP) 71.12% 55.08% 63.24% 71.62% 81.01% 86.59%
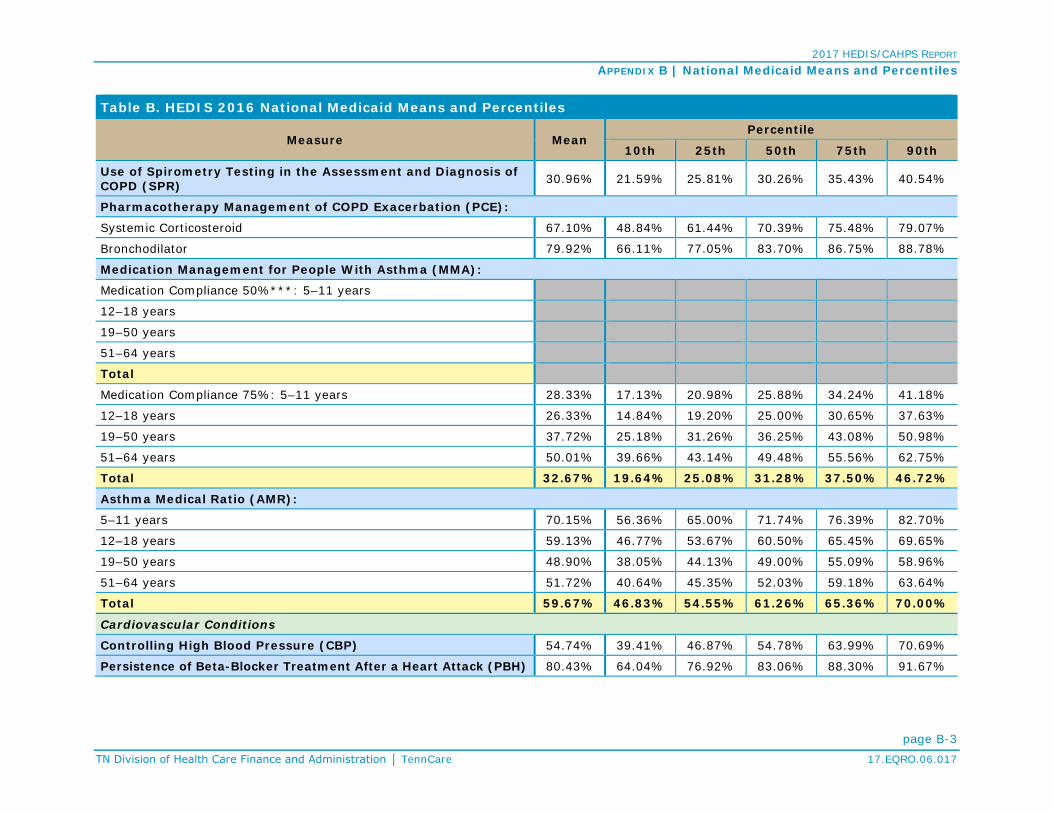
2017 HEDIS/CAHPS REPORT APPENDIX B | National Medicaid Means and Percentiles
page B-3 TN Division of Health Care Finance and Administration │ TennCare 17.EQRO.06.017
Table B. HEDIS 2016 National Medicaid Means and Percentiles
Measure Mean Percentile
10th 25th 50th 75th 90th
Use of Spirometry Testing in the Assessment and Diagnosis of COPD (SPR) 30.96% 21.59% 25.81% 30.26% 35.43% 40.54%
Pharmacotherapy Management of COPD Exacerbation (PCE):
Systemic Corticosteroid 67.10% 48.84% 61.44% 70.39% 75.48% 79.07%
Bronchodilator 79.92% 66.11% 77.05% 83.70% 86.75% 88.78%
Medication Management for People With Asthma (MMA):
Medication Compliance 50%***: 5–11 years
12–18 years
19–50 years
51–64 years
Total
Medication Compliance 75%: 5–11 years 28.33% 17.13% 20.98% 25.88% 34.24% 41.18%
12–18 years 26.33% 14.84% 19.20% 25.00% 30.65% 37.63%
19–50 years 37.72% 25.18% 31.26% 36.25% 43.08% 50.98%
51–64 years 50.01% 39.66% 43.14% 49.48% 55.56% 62.75%
Total 32.67% 19.64% 25.08% 31.28% 37.50% 46.72%
Asthma Medical Ratio (AMR):
5–11 years 70.15% 56.36% 65.00% 71.74% 76.39% 82.70%
12–18 years 59.13% 46.77% 53.67% 60.50% 65.45% 69.65%
19–50 years 48.90% 38.05% 44.13% 49.00% 55.09% 58.96%
51–64 years 51.72% 40.64% 45.35% 52.03% 59.18% 63.64%
Total 59.67% 46.83% 54.55% 61.26% 65.36% 70.00%
Cardiovascular Conditions
Controlling High Blood Pressure (CBP) 54.74% 39.41% 46.87% 54.78% 63.99% 70.69%
Persistence of Beta-Blocker Treatment After a Heart Attack (PBH) 80.43% 64.04% 76.92% 83.06% 88.30% 91.67%

2017 HEDIS/CAHPS REPORT APPENDIX B | National Medicaid Means and Percentiles
page B-4 TN Division of Health Care Finance and Administration │ TennCare 17.EQRO.06.017
Table B. HEDIS 2016 National Medicaid Means and Percentiles
Measure Mean Percentile
10th 25th 50th 75th 90th
Statin Therapy for Patients with Cardiovascular disease (SPC)†: Received Statin Therapy: Males 21-75 years Received Statin Therapy: Females 40 -75 years Received Statin Therapy: Total Statin Adherence 80%: Males 21-75 years Statin Adherence 80%: Females 40 -75 years Statin Adherence 80%: Total Diabetes Comprehensive Diabetes Care (CDC): HbA1c Testing 85.94% 79.56% 82.98% 85.95% 89.42% 92.88%
HbA1c Control (<7.0%) 32.36% 23.52% 29.27% 33.82% 38.31% 40.43%
HbA1c Control (<8.0%) 45.54% 31.16% 39.80% 46.76% 52.55% 58.39%
Retinal Eye Exam Performed 52.68% 35.64% 44.53% 53.28% 61.50% 68.11%
Medical Attention for Nephropathy 90.01% 85.94% 88.32% 90.51% 91.97% 93.56%
Blood Pressure Control (<140/90 mm Hg) 59.04% 43.75% 52.26% 59.73% 68.61% 75.73% Statin Therapy for Patients with Diabetes (SPD)†: Received Statin Therapy: 40 -75 years Statin Adherence 80%: 40 -75 years Musculoskeletal Conditions Disease-Modifying Anti-Rheumatic Drug Therapy for Rheumatoid Arthritis (ART) 71.69% 57.36% 65.67% 72.22% 79.20% 85.71%
Behavioral Health Antidepressant Medication Management (AMM): Effective Acute Phase Treatment 54.45% 44.00% 48.32% 53.38% 59.52% 67.57%
Effective Continuation Phase Treatment 39.44% 28.11% 32.77% 38.06% 43.39% 54.30% Follow-Up Care for Children Prescribed ADHD Medication (ADD): Initiation Phase 42.20% 28.77% 34.16% 42.19% 49.55% 55.48%
Continuation and Maintenance Phase 50.93% 33.96% 40.91% 52.47% 62.50% 67.23%
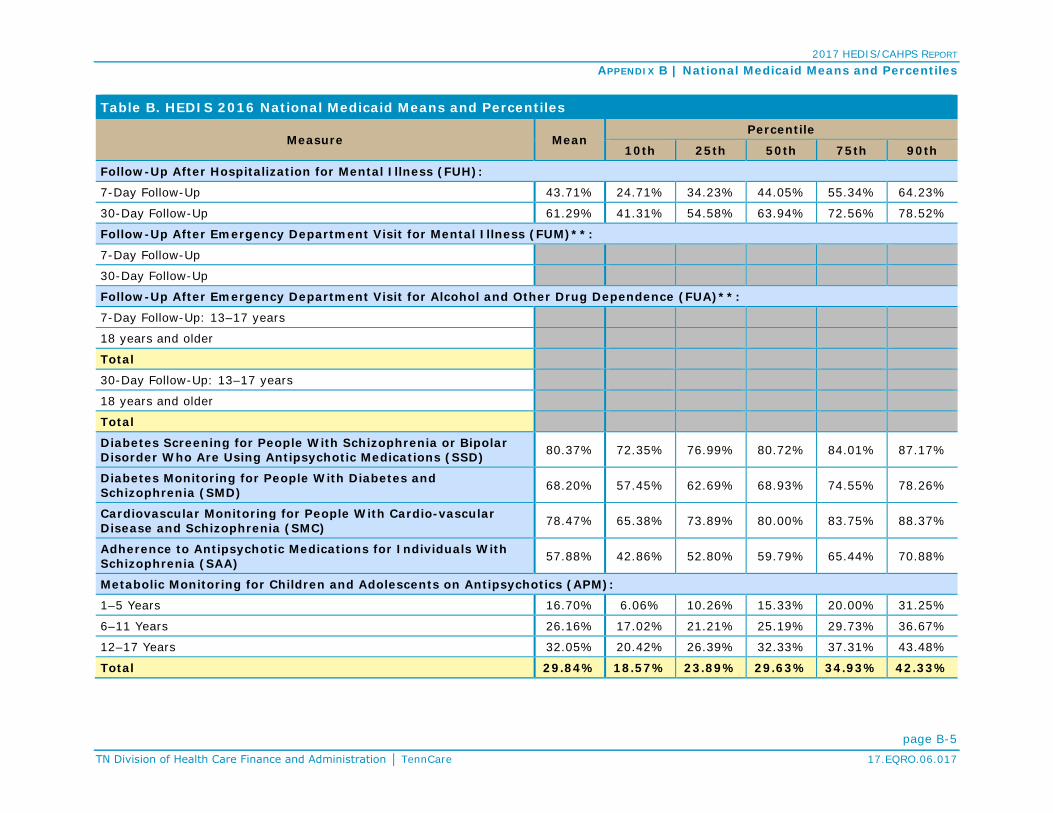
2017 HEDIS/CAHPS REPORT APPENDIX B | National Medicaid Means and Percentiles
page B-5 TN Division of Health Care Finance and Administration │ TennCare 17.EQRO.06.017
Table B. HEDIS 2016 National Medicaid Means and Percentiles
Measure Mean Percentile
10th 25th 50th 75th 90th
Follow-Up After Hospitalization for Mental Illness (FUH):
7-Day Follow-Up 43.71% 24.71% 34.23% 44.05% 55.34% 64.23%
30-Day Follow-Up 61.29% 41.31% 54.58% 63.94% 72.56% 78.52%
Follow-Up After Emergency Department Visit for Mental Illness (FUM)**:
7-Day Follow-Up
30-Day Follow-Up
Follow-Up After Emergency Department Visit for Alcohol and Other Drug Dependence (FUA)**:
7-Day Follow-Up: 13–17 years
18 years and older
Total
30-Day Follow-Up: 13–17 years
18 years and older
Total
Diabetes Screening for People With Schizophrenia or Bipolar Disorder Who Are Using Antipsychotic Medications (SSD) 80.37% 72.35% 76.99% 80.72% 84.01% 87.17%
Diabetes Monitoring for People With Diabetes and Schizophrenia (SMD) 68.20% 57.45% 62.69% 68.93% 74.55% 78.26%
Cardiovascular Monitoring for People With Cardio-vascular Disease and Schizophrenia (SMC) 78.47% 65.38% 73.89% 80.00% 83.75% 88.37%
Adherence to Antipsychotic Medications for Individuals With Schizophrenia (SAA) 57.88% 42.86% 52.80% 59.79% 65.44% 70.88%
Metabolic Monitoring for Children and Adolescents on Antipsychotics (APM):
1–5 Years 16.70% 6.06% 10.26% 15.33% 20.00% 31.25%
6–11 Years 26.16% 17.02% 21.21% 25.19% 29.73% 36.67%
12–17 Years 32.05% 20.42% 26.39% 32.33% 37.31% 43.48%
Total 29.84% 18.57% 23.89% 29.63% 34.93% 42.33%

2017 HEDIS/CAHPS REPORT APPENDIX B | National Medicaid Means and Percentiles
page B-6 TN Division of Health Care Finance and Administration │ TennCare 17.EQRO.06.017
Table B. HEDIS 2016 National Medicaid Means and Percentiles
Measure Mean Percentile
10th 25th 50th 75th 90th
Medication Management
Annual Monitoring for Patients on Persistent Medications (MPM):
ACE Inhibitors or ARBs 87.51% 83.31% 85.63% 87.43% 89.92% 92.13%
Digoxin 54.01% 46.15% 49.57% 53.94% 58.55% 61.98%
Diuretics 87.49% 83.33% 85.18% 87.52% 90.00% 92.28%
Total 87.28% 83.16% 85.19% 87.23% 89.56% 91.84%
Overuse/Appropriateness
Appropriate Treatment for Children With Upper Respiratory Infection (URI) 87.76% 76.23% 84.92% 89.39% 93.38% 96.08%
Avoidance of Antibiotic Treatment in Adults With Acute Bronchitis (AAB) 28.09% 19.38% 22.12% 26.17% 32.51% 38.91%
Use of Imaging Studies for Low Back Pain (LBP) 73.57% 66.04% 69.88% 73.71% 77.09% 81.42%
Measures Collected Though CAHPS
Flu vaccinations for adults ages 18 to 64 (FVA) 38.46% 28.70% 33.79% 38.03% 43.54% 48.01%
Medical Assistance With Smoking Cessation (MSC):
Advising Smokers and Tobacco Users to Quit 75.89% 67.83% 73.14% 76.59% 79.36% 81.85%
Discussing Cessation Medications 48.12% 36.67% 43.01% 48.31% 53.85% 58.39%
Discussing Cessation Strategies 43.28% 34.00% 38.86% 43.82% 47.83% 51.75%
Supplemental Data - % Current Smokers 31.02% 17.50% 22.97% 31.68% 39.01% 43.79% HEDIS Effectiveness of Care Measures Where Lower Rates Indicated Better Performance
Diabetes
Comprehensive Diabetes Care (CDC):
HbA1c Poor Control (>9.0%) 45.35% 61.31% 52.31% 43.80% 36.87% 29.23%
Overuse/Appropriateness
Non-Recommended Cervical Cancer Screening in Adolescent Females (NCS) 2.71% 5.35% 3.77% 2.42% 1.42% 0.85%

2017 HEDIS/CAHPS REPORT APPENDIX B | National Medicaid Means and Percentiles
page B-7 TN Division of Health Care Finance and Administration │ TennCare 17.EQRO.06.017
Table B. HEDIS 2016 National Medicaid Means and Percentiles
Measure Mean Percentile
10th 25th 50th 75th 90th
Use of Multiple Concurrent Antipsychotics in Children and Adolescents (APC):
1-5 Years 0.66% 2.86% 1.96% 0.00% 0.00% 0.00%
6-11 Years 1.82% 3.75% 2.74% 1.56% 0.63% 0.00%
12-17 Years 3.00% 6.29% 3.97% 2.53% 1.41% 0.00%
Total 2.49% 5.30% 3.14% 1.99% 1.17% 0.00% HEDIS Access/Availability of Care Measures
Adults’ Access to Preventive/Ambulatory Health Services (AAP):
20–44 years 77.27% 63.73% 73.35% 79.48% 83.42% 86.04%
45–64 years 85.52% 76.95% 82.49% 86.83% 89.78% 91.57%
Children and Adolescents’ Access to Primary Care Practitioners (CAP):
12–24 months 94.69% 89.89% 93.14% 95.74% 97.28% 97.85%
25 months–6 years 87.24% 81.16% 84.83% 87.69% 90.98% 93.34%
7-11 years 90.23% 84.16% 87.91% 91.00% 93.25% 96.10%
12–19 years 88.60% 83.13% 85.84% 89.37% 92.67% 94.69%
Initiation and Engagement of Alcohol and Other Drug (AOD) Dependence Treatment (IET):
Initiation of AOD Treatment: 13–17 years 42.25% 27.49% 35.94% 42.75% 50.00% 52.99%
≥18 years 37.94% 30.00% 34.17% 37.78% 42.67% 46.16%
Total 38.23% 30.21% 34.37% 38.07% 42.82% 46.56%
Engagement of AOD Treatment: 13–17 years 15.44% 7.43% 9.18% 13.53% 21.46% 26.70%
≥18 years 9.69% 4.16% 6.33% 9.29% 12.32% 16.65%
Total 10.23% 4.42% 6.92% 9.63% 13.20% 16.93%
Prenatal and Postpartum Care (PPC):
Timeliness of Prenatal Care 80.03% 66.91% 74.21% 82.25% 87.56% 91.00%
Postpartum Care 60.93% 48.94% 55.47% 60.98% 67.53% 73.61%

2017 HEDIS/CAHPS REPORT APPENDIX B | National Medicaid Means and Percentiles
page B-8 TN Division of Health Care Finance and Administration │ TennCare 17.EQRO.06.017
Table B. HEDIS 2016 National Medicaid Means and Percentiles
Measure Mean Percentile
10th 25th 50th 75th 90th Use of First-Line Psychosocial Care for Children and Adolescents on Antipsychotics (APP): 1-5 Years 49.04% 33.33% 40.48% 45.45% 62.99% 66.67%
6-11 Years 58.83% 36.03% 47.96% 61.54% 68.35% 77.78%
12-17 Years 59.12% 39.84% 50.57% 61.20% 68.25% 76.47%
Total 57.44% 36.73% 48.83% 60.43% 68.57% 74.34% HEDIS Utilization and Relative Resource Use Measures
Utilization Frequency of Ongoing Prenatal Care (FPC): <21% 11.96% 2.87% 4.87% 8.22% 14.69% 23.60%
21–40% 7.26% 2.33% 3.95% 5.82% 9.02% 13.93%
41–60% 8.59% 4.65% 6.03% 7.92% 10.46% 12.99%
61–80% 15.23% 10.48% 12.58% 14.95% 17.95% 20.45%
≥81% 56.61% 32.79% 45.72% 59.26% 69.54% 75.77% Well-Child Visits in the First 15 Months of Life (W15): 0 Visits 2.62% 0.44% 0.93% 1.71% 3.24% 5.77%
1 Visits 2.30% 0.70% 1.26% 1.95% 2.92% 4.12%
2 Visits 3.45% 1.23% 2.06% 3.19% 4.62% 5.84%
3 Visits 5.54% 2.66% 3.72% 5.42% 6.98% 8.57%
4 Visits 9.64% 6.01% 7.54% 9.16% 11.30% 13.40%
5 Visits 17.11% 12.02% 14.29% 16.49% 19.23% 23.72%
6 or More Visits 59.35% 45.38% 53.49% 59.57% 67.76% 73.88%
Well-Child Visits in the Third, Fourth, Fifth and Sixth Years of Life (W34) 71.27% 60.64% 64.72% 71.42% 77.57% 82.97%
Adolescent Well-Care Visits (AWC) 48.89% 32.26% 40.88% 48.41% 57.66% 66.04%
*For HEDIS 2017, the HPV measure was integrated into the IMA measure for reporting purposes and expanded to both genders. **First-year measure. ***Benchmarks are currently not reported by Quality Compass for this rate. †Benchmarks are not reported by Quality Compass for 2016 first-year measures.

2017 HEDIS/CAHPS REPORT
page C-1 TN Division of Health Care Finance and Administration │ TennCare 17.EQRO.06.017
APPENDIX C | MCO Medicaid Population in Member Months Table C1. HEDIS 2017 MCO Medicaid Population Reported in Member Months by Age and Sex—AG
Age Group AGE AGM AGW
Male Female Total Male Female Total Male Female Total
<1 24,463 22,860 47,323 37,943 36,655 74,598 27,484 25,991 53,475 1–4 93,348 87,156 180,504 152,175 145,968 298,143 104,614 100,080 204,694
5–9 118,823 114,341 233,164 168,907 164,673 333,580 125,679 126,475 252,154 10–14 122,898 117,959 240,857 119,236 118,151 237,387 105,541 106,015 211,556 15–17 43,325 43,277 86,602 75,338 74,823 150,161 41,396 41,985 83,381
18–19 33,513 31,438 64,951 36,986 42,086 79,072 30,829 31,683 62,512
0–19 Subtotal
436,370 417,031 853,401 590,585 582,356 1,172,941 435,543 432,229 867,772
65.33% 49.24% 56.33% 72.15% 52.27% 60.69% 71.95% 49.21% 58.48%
20–24 48,624 84,095 132,719 38,676 90,149 128,825 48,242 89,064 137,306 25–29 30,795 98,381 129,176 21,882 94,398 116,280 18,406 124,726 143,132 30–34 31,163 69,978 101,141 27,617 96,900 124,517 18,059 73,645 91,704
35–39 27,994 52,285 80,279 29,735 82,943 112,678 17,276 42,446 59,722 40–44 21,836 39,031 60,867 25,495 53,550 79,045 12,674 32,340 45,014
20–44 Subtotal
160,412 343,770 504,182 143,405 417,940 561,345 114,657 362,221 476,878
24.02% 40.59% 33.28% 17.52% 37.51% 29.04% 18.94% 41.24% 32.14%
45–49 18,559 29,250 47,809 21,114 33,595 54,709 10,718 26,393 37,111 50–54 19,027 23,929 42,956 20,276 26,347 46,623 12,950 21,789 34,739
55–59 19,065 18,385 37,450 19,647 22,073 41,720 16,746 19,106 35,852 60–64 12,086 10,653 22,739 14,334 16,064 30,398 12,239 11,630 23,869
45–64 Subtotal
68,737 82,217 150,954 75,371 98,079 173,450 52,653 78,918 131,571
10.29% 9.71% 9.96% 9.21% 8.80% 8.97% 8.70% 8.98% 8.87%

2017 HEDIS/CAHPS REPORT APPENDIX C | MCO Population in Member Months
page C-2 TN Division of Health Care Finance and Administration │ TennCare 17.EQRO.06.017
Table C1. HEDIS 2017 MCO Medicaid Population Reported in Member Months by Age and Sex—AG
Age Group AGE AGM AGW
Male Female Total Male Female Total Male Female Total
65–69 1,419 1,760 3,179 4,400 6,157 10,557 1,472 2,482 3,954
70–74 467 721 1,188 2,551 3,839 6,390 492 1,098 1,590 75–79 309 472 781 1,315 2,485 3,800 250 677 927 80–84 117 405 522 561 1,739 2,300 159 327 486
85–89 67 326 393 277 1,025 1,302 57 211 268 ≥90 48 317 365 91 515 606 82 261 343
≥65 Subtotal
2,427 4,001 6,428 9,195 15,760 24,955 2,512 5,056 7,568
0.36% 0.47% 0.42% 1.12% 1.41% 1.29% 0.41% 0.58% 0.51%
Total 667,946 847,019 1,514,965 818,556 1,114,135 1,932,691 605,365 878,424 1,483,789
Table C2. HEDIS 2017 MCO Medicaid Population Reported in Member Months by Age and Sex—BC and TCS
Age Group
BCE BCM BCW TCS
Male Female Total Male Female Total Male Female Total Male Female Total
<1 48,796 46,671 95,467 37,198 36,001 73,199 33,660 32,283 65,943 5,918 6,264 12,182
1–4 162,214 154,231 316,445 126,684 123,425 250,109 122,279 117,821 240,100 53,959 46,447 100,406
5–9 172,045 167,643 339,688 155,050 151,919 306,969 133,918 131,853 265,771 91,313 61,373 152,686
10–14 139,184 136,041 275,225 152,345 151,570 303,915 111,825 115,481 227,306 102,929 60,111 163,040
15–17 79,990 79,066 159,056 52,305 50,791 103,096 64,708 68,320 133,028 73,993 43,346 117,339
18–19 43,506 52,694 96,200 35,648 40,655 76,303 35,001 41,756 76,757 49,666 26,544 76,210
0–19 Subtotal
645,735 636,346 1,282,081 559,230 554,361 1,113,591 501,391 507,514 1,008,905 377,778 244,085 621,863
72.70% 49.20% 58.77% 72.83% 51.57% 60.43% 77.08% 51.00% 61.31% 83.03% 74.39% 79.41%

2017 HEDIS/CAHPS REPORT APPENDIX C | MCO Population in Member Months
page C-3 TN Division of Health Care Finance and Administration │ TennCare 17.EQRO.06.017
Table C2. HEDIS 2017 MCO Medicaid Population Reported in Member Months by Age and Sex—BC and TCS
Age Group
BCE BCM BCW TCS
Male Female Total Male Female Total Male Female Total Male Female Total
20–24 41,502 118,561 160,063 50,182 106,280 156,462 37,866 89,125 126,991 41,282 28,732 70,014
25–29 19,629 117,713 137,342 25,294 118,819 144,113 12,104 77,428 89,532 7,039 15,515 22,554
30–34 28,870 107,716 136,586 27,032 85,857 112,889 16,459 88,808 105,267 7,326 14,027 21,353
35–39 31,933 90,945 122,878 24,962 65,065 90,027 16,409 80,822 97,231 6,691 10,852 17,543
40–44 29,801 63,107 92,908 17,980 44,977 62,957 14,112 49,332 63,444 4,949 6,349 11,298
20–44 Subtotal
151,735 498,042 649,777 145,450 420,998 566,448 96,950 385,515 482,465 67,287 75,475 142,762
17.08% 38.50% 29.78% 18.94% 39.16% 30.74% 14.91% 38.74% 29.32% 14.79% 23.00% 18.23%
45–49 25,270 46,369 71,639 16,399 35,086 51,485 12,479 31,793 44,272 3,207 3,545 6,752
50–54 23,216 41,145 64,361 16,603 26,998 43,601 12,883 25,334 38,217 2,891 2,377 5,268
55–59 21,503 33,417 54,920 16,754 20,585 37,339 13,455 21,784 35,239 2,403 1,419 3,822
60–64 15,377 25,936 41,313 11,069 12,401 23,470 10,722 16,647 27,369 1,270 1,076 2,346
45–64 Subtotal
85,366 146,867 232,233 60,825 95,070 155,895 49,539 95,558 145,097 9,771 8,417 18,188
9.61% 11.35% 10.64% 7.92% 8.84% 8.46% 7.62% 9.60% 8.82% 2.15% 2.57% 2.32%
65–69 2,516 5,386 7,902 1,136 1,888 3,024 1,472 2,868 4,340 109 87 196
70–74 1,592 3,120 4,712 520 752 1,272 552 1655 2,207 32 59 91
75–79 781 1,683 2,464 309 581 890 278 802 1,080 24 12 36
80–84 320 1,198 1,518 159 586 745 174 693 867 0 0 0
85–89 114 536 650 102 419 521 84 304 388 0 0 0
≥90 58 286 344 102 346 448 2 161 163 0 0 0
≥65 Subtotal
5,381 12,209 17,590 2,328 4,572 6,900 2,562 6,483 9,045 165 158 323
0.61% 0.94% 0.81% 0.30% 0.43% 0.37% 0.39% 0.65% 0.55% 0.04% 0.05% 0.04%
Total 888,217 1,293,464 2,181,681 767,833 1,075,001 1,842,834 650,442 995,070 1,645,512 455,001 328,135 783,136

2017 HEDIS/CAHPS REPORT APPENDIX C | MCO Population in Member Months
page C-4 TN Division of Health Care Finance and Administration │ TennCare 17.EQRO.06.017
Table C3. HEDIS 2017 MCO Medicaid Population Reported in Member Months by Age and Sex—UHC
Age Group UHCE UHCM UHCW
Male Female Total Male Female Total Male Female Total <1 24,549 22,878 47,427 37,273 35,880 73,153 26,290 25,434 51,724 1–4 121,480 116,400 237,880 148,550 144,341 292,891 115,750 111,303 227,053 5–9 146,083 141,688 287,771 161,500 158,038 319,538 134,452 131,987 266,439 10–14 114,191 110,672 224,863 117,453 114,847 232,300 98,567 98,804 197,371 15–17 70,709 71,962 142,671 72,832 70,665 143,497 58,891 62,010 120,901 18–19 36,885 40,580 77,465 36,773 42,157 78,930 31,422 36,293 67,715 0–19 Subtotal
513,897 504,180 1,018,077 574,381 565,928 1,140,309 465,372 465,831 931,203 65.79% 47.55% 55.29% 72.23% 51.09% 59.92% 72.87% 50.82% 59.87%
20–24 37,801 77,258 115,059 34,397 84,622 119,019 35,464 82,374 117,838 25–29 21,789 75,040 96,829 19,189 90,763 109,952 14,507 68,534 83,041 30–34 23,601 77,040 100,641 25,195 93,877 119,072 12,608 65,855 78,463 35–39 29,327 78,660 107,987 29,394 80,108 109,502 16,911 68,399 85,310 40–44 28,994 58,575 87,569 25,114 52,344 77,458 16,240 45,757 61,997 20–44 Subtotal
141,512 366,573 508,085 133,289 401,714 535,003 95,730 330,919 426,649 18.12% 34.57% 27.59% 16.76% 36.26% 28.11% 14.99% 36.10% 27.43%
45–49 27,143 41,210 68,353 21,794 34,640 56,434 14,816 28,277 43,093 50–54 26,122 36,241 62,363 20,112 28,200 48,312 16,783 22,934 39,717 55–59 27,480 32,068 59,548 17,587 24,596 42,183 17,504 20,548 38,052 60–64 21,857 26,742 48,599 13,867 18,536 32,403 14,608 15,367 29,975 45–64 Subtotal
102,602 136,261 238,863 73,360 105,972 179,332 63,711 87,126 150,837 13.14% 12.85% 12.97% 9.22% 9.57% 9.42% 9.98% 9.50% 9.70%
65–69 9,206 15,489 24,695 4,575 8,896 13,471 5,588 8,392 13,980 70–74 6,058 10,772 16,830 3,935 6,903 10,838 3,415 6,619 10,034 75–79 3,836 8,562 12,398 2,418 5,439 7,857 2,178 5,078 7,256 80–84 2,110 7,423 9,533 1,773 4,798 6,571 1,354 4,740 6,094 85–89 1,187 5,727 6,914 984 4,114 5,098 831 4,204 5,035 ≥90 713 5,382 6,095 528 3,971 4,499 484 3,768 4,252 ≥65 Subtotal
23,110 53,355 76,465 14,213 34,121 48,334 13,850 32,801 46,651 2.96% 5.03% 4.15% 1.79% 3.08% 2.54% 2.17% 3.58% 3.00%
Total 781,121 1,060,369 1,841,490 795,243 1,107,735 1,902,978 638,663 916,677 1,555,340

2017 HEDIS/CAHPS REPORT
page D-1 TN Division of Health Care Finance and Administration │ TennCare 17.EQRO.06.017
APPENDIX D | Measure Reporting Options The reporting options are presented for each measure: administrative and/or hybrid. Currently, when the hybrid option is available, TennCare MCOs are required to use the hybrid method.
Table D. 2017 Measure reporting options: Administrative/Hybrid Measure Administrative Hybrid
HEDIS Effectiveness of Care
Prevention and Screening
Adult BMI Assessment (ABA)
Weight Assessment and Counseling for Nutrition and Physical Activity for Children/Adolescents (WCC)
Childhood Immunization Status (CIS)
Immunizations for Adolescents (IMA)
Human Papillomavirus Vaccine for Female Adolescents (HPV)
Lead Screening in Children (LSC)
Breast Cancer Screening (BCS)
Cervical Cancer Screening (CCS)
Chlamydia Screening in Women (CHL)
Respiratory Conditions
Appropriate Testing for Children With Pharyngitis (CWP)
Use of Spirometry Testing in the Assessment and Diagnosis of COPD (SPR)
Pharmacotherapy Management of COPD Exacerbation (PCE)
Medication Management for People With Asthma (MMA)
Asthma Medical Ratio (AMR)
Cardiovascular Conditions
Controlling High Blood Pressure (CBP)
Persistence of Beta-Blocker Treatment After a Heart Attack (PBH)
Statin Therapy for Patients with Cardiovascular Disease (SPC)
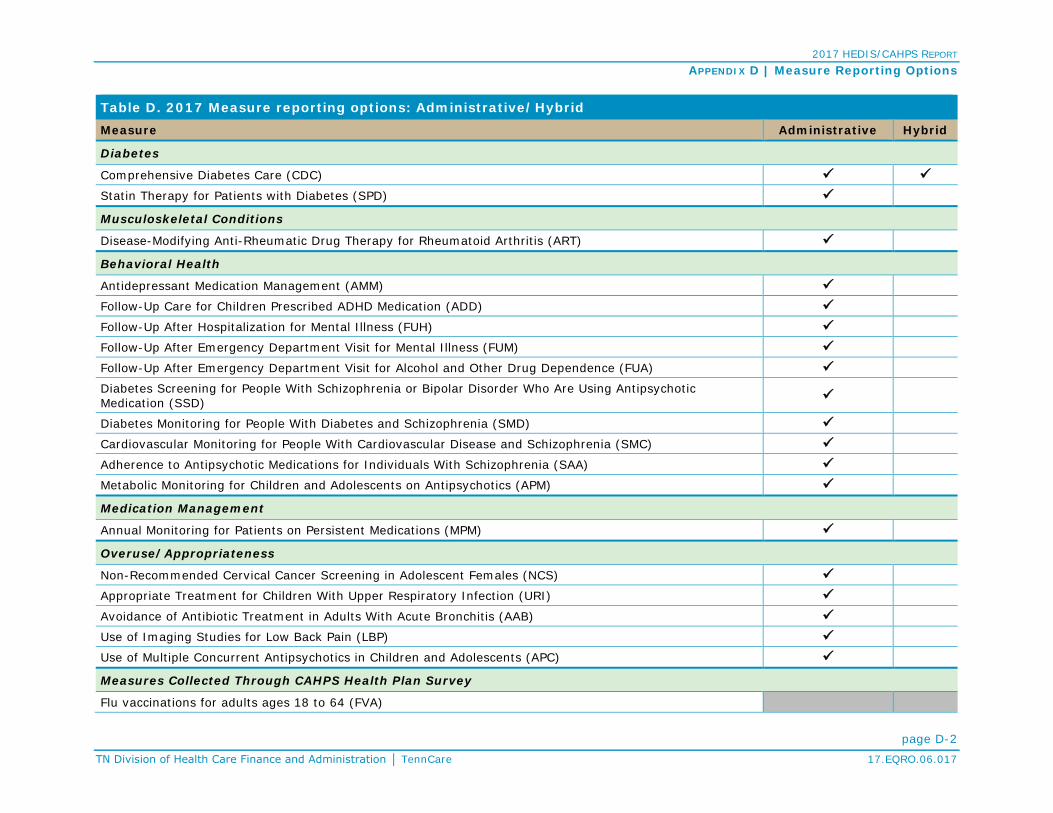
2017 HEDIS/CAHPS REPORT APPENDIX D | Measure Reporting Options
page D-2 TN Division of Health Care Finance and Administration │ TennCare 17.EQRO.06.017
Table D. 2017 Measure reporting options: Administrative/Hybrid Measure Administrative Hybrid
Diabetes
Comprehensive Diabetes Care (CDC)
Statin Therapy for Patients with Diabetes (SPD)
Musculoskeletal Conditions
Disease-Modifying Anti-Rheumatic Drug Therapy for Rheumatoid Arthritis (ART)
Behavioral Health
Antidepressant Medication Management (AMM)
Follow-Up Care for Children Prescribed ADHD Medication (ADD)
Follow-Up After Hospitalization for Mental Illness (FUH)
Follow-Up After Emergency Department Visit for Mental Illness (FUM)
Follow-Up After Emergency Department Visit for Alcohol and Other Drug Dependence (FUA)
Diabetes Screening for People With Schizophrenia or Bipolar Disorder Who Are Using Antipsychotic Medication (SSD)
Diabetes Monitoring for People With Diabetes and Schizophrenia (SMD)
Cardiovascular Monitoring for People With Cardiovascular Disease and Schizophrenia (SMC)
Adherence to Antipsychotic Medications for Individuals With Schizophrenia (SAA)
Metabolic Monitoring for Children and Adolescents on Antipsychotics (APM)
Medication Management
Annual Monitoring for Patients on Persistent Medications (MPM)
Overuse/Appropriateness
Non-Recommended Cervical Cancer Screening in Adolescent Females (NCS)
Appropriate Treatment for Children With Upper Respiratory Infection (URI)
Avoidance of Antibiotic Treatment in Adults With Acute Bronchitis (AAB)
Use of Imaging Studies for Low Back Pain (LBP)
Use of Multiple Concurrent Antipsychotics in Children and Adolescents (APC)
Measures Collected Through CAHPS Health Plan Survey
Flu vaccinations for adults ages 18 to 64 (FVA)
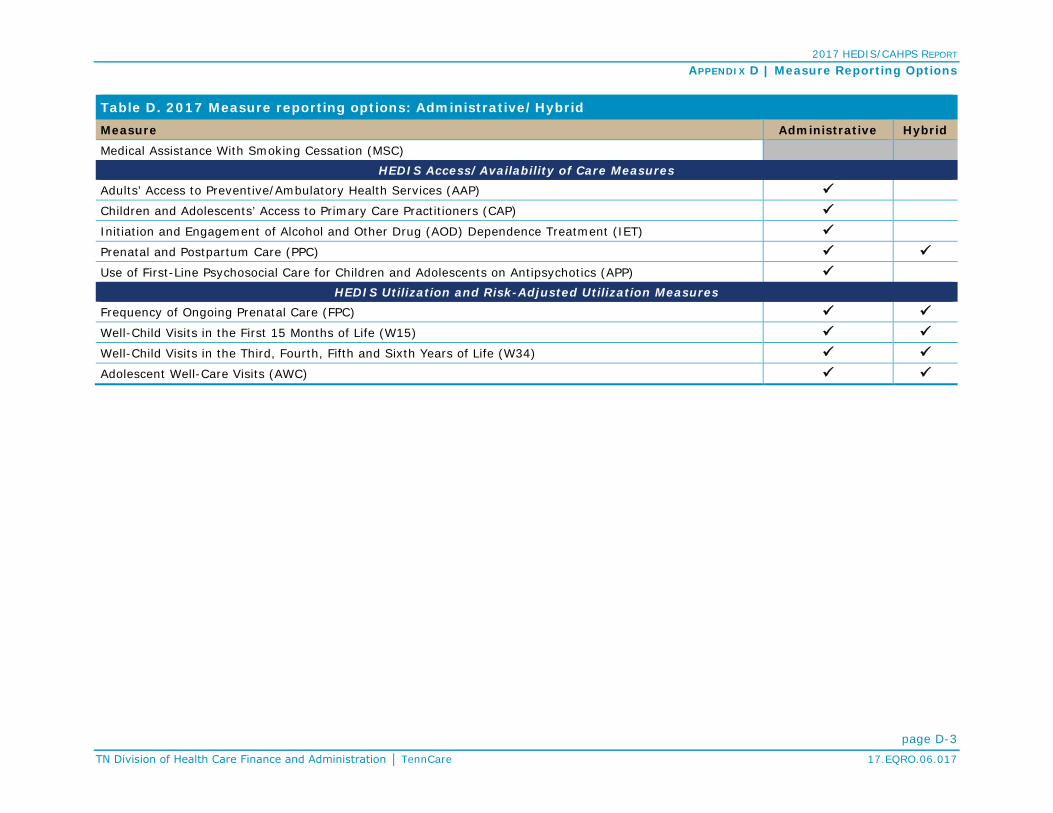
2017 HEDIS/CAHPS REPORT APPENDIX D | Measure Reporting Options
page D-3 TN Division of Health Care Finance and Administration │ TennCare 17.EQRO.06.017
Table D. 2017 Measure reporting options: Administrative/Hybrid Measure Administrative Hybrid Medical Assistance With Smoking Cessation (MSC)
HEDIS Access/Availability of Care Measures Adults’ Access to Preventive/Ambulatory Health Services (AAP)
Children and Adolescents’ Access to Primary Care Practitioners (CAP)
Initiation and Engagement of Alcohol and Other Drug (AOD) Dependence Treatment (IET)
Prenatal and Postpartum Care (PPC)
Use of First-Line Psychosocial Care for Children and Adolescents on Antipsychotics (APP) HEDIS Utilization and Risk-Adjusted Utilization Measures
Frequency of Ongoing Prenatal Care (FPC)
Well-Child Visits in the First 15 Months of Life (W15)
Well-Child Visits in the Third, Fourth, Fifth and Sixth Years of Life (W34)
Adolescent Well-Care Visits (AWC)
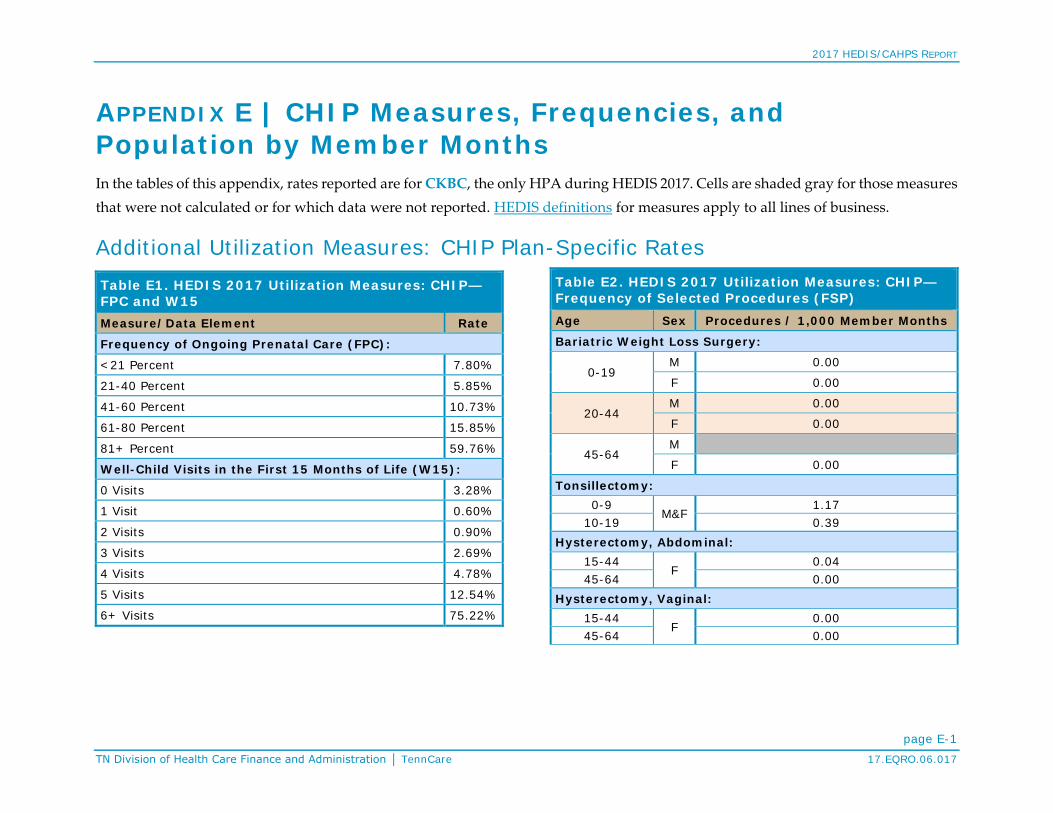
2017 HEDIS/CAHPS REPORT
page E-1 TN Division of Health Care Finance and Administration │ TennCare 17.EQRO.06.017
APPENDIX E | CHIP Measures, Frequencies, and Population by Member Months In the tables of this appendix, rates reported are for CKBC, the only HPA during HEDIS 2017. Cells are shaded gray for those measures that were not calculated or for which data were not reported. HEDIS definitions for measures apply to all lines of business.
Additional Utilization Measures: CHIP Plan-Specific Rates
Table E1. HEDIS 2017 Utilization Measures: CHIP—FPC and W15 Measure/Data Element Rate
Frequency of Ongoing Prenatal Care (FPC):
<21 Percent 7.80%
21-40 Percent 5.85%
41-60 Percent 10.73%
61-80 Percent 15.85%
81+ Percent 59.76%
Well-Child Visits in the First 15 Months of Life (W15):
0 Visits 3.28%
1 Visit 0.60%
2 Visits 0.90%
3 Visits 2.69%
4 Visits 4.78%
5 Visits 12.54%
6+ Visits 75.22%
Table E2. HEDIS 2017 Utilization Measures: CHIP— Frequency of Selected Procedures (FSP) Age Sex Procedures / 1,000 Member Months
Bariatric Weight Loss Surgery:
0-19 M 0.00
F 0.00
20-44 M 0.00
F 0.00
45-64 M
F 0.00
Tonsillectomy: 0-9
M&F 1.17
10-19 0.39 Hysterectomy, Abdominal:
15-44 F
0.04 45-64 0.00
Hysterectomy, Vaginal: 15-44
F 0.00
45-64 0.00

2017 HEDIS/CAHPS REPORT APPENDIX E | CHIP Measures, Frequencies and Population
page E-2 TN Division of Health Care Finance and Administration │ TennCare 17.EQRO.06.017
Table E2. HEDIS 2017 Utilization Measures: CHIP— Frequency of Selected Procedures (FSP) Age Sex Procedures / 1,000 Member Months
Cholecystectomy, Open: 30-64 M 15-44
F 0.01
45-64 0.00 Cholecystectomy (laparoscopic):
30-64 M
15-44 F
0.39
45-64 0.00
Back Surgery:
20-44 M 0.00
F 0.02
45-64 M
F 0.00
Mastectomy: 15-44
F 0.00
45-64 0.00
Lumpectomy: 15-44
F 0.05
45-64 0.00
Table E3. HEDIS 2017 Utilization Measures: CHIP— Ambulatory Care: Total (AMB)
Age Visits/ 1,000 Member Months Outpatient Visits ED Visits
<1 722.93 41.15
1-9 268.42 24.28
10-19 228.20 25.60
20-44 298.43 53.15
45-64 281.69 14.08
65-74
75-84
85+ 62.50 62.50
Unknown
Total 250.88 26.88
Table E4a. HEDIS 2017 Utilization Measures: CHIP—Inpatient Utilization General Hospital/Acute Care: Total (IPU)
Age Per 1,000 Members Months Average
Length of Stay Discharges Days Maternity
10-19 0.82 2.08 2.56
20-44 95.26 225.83 2.37
45-64 56.34 119.72 2.13
Unknown
Total 9.29 22.16 2.38

2017 HEDIS/CAHPS REPORT APPENDIX E | CHIP Measures, Frequencies and Population
page E-3 TN Division of Health Care Finance and Administration │ TennCare 17.EQRO.06.017
Table E4b. HEDIS 2017 Utilization Measures: CHIP—Inpatient Utilization General Hospital/Acute Care: Total (IPU)
Age
Per 1,000 Members Months
Average Length of
Stay
Per 1,000 Members Months
Average Length of
Stay
Per 1,000 Member Months
Average Length of
Stay Discharges Days Discharges Days Discharges Days Total Inpatient Surgery Medicine
<1 5.67 40.90 7.22 0.86 26.49 30.71 4.80 14.41 3.00 1-9 0.73 2.21 3.02 0.16 0.64 3.94 0.57 1.56 2.75 10-19 1.54 4.57 2.96 0.22 0.83 3.78 0.51 1.62 3.19 20-44 95.87 227.62 2.37 0.43 1.18 2.76 0.18 0.61 3.33 45-64 56.34 119.72 2.13 0.00 0.00 0.00 0.00 65-74 75-84 85+ 0.00 0.00 0.00 0.00 0.00 0.00 Unknown Total 6.76 17.00 2.52 0.22 1.03 4.72 0.55 1.66 3.02
Table E5. HEDIS 2017 Utilization Measures: CHIP—Total IAD and Total MPT Rates
Age Sex Any Services Inpatient Intensive Outpatient/ Partial Hospitalization Outpatient/ED
Identification of Alcohol and Other Drug Services: Total (IAD)
0-12
M 0.05% 0.00% 0.01% 0.05%
F 0.01% 0.00% 0.00% 0.01%
Total 0.03% 0.00% 0.00% 0.03%
13-17
M 1.26% 0.25% 0.45% 1.06%
F 1.00% 0.34% 0.35% 0.70%
Total 1.13% 0.30% 0.40% 0.88%
18-24
M 2.38% 0.57% 0.62% 1.94%
F 1.81% 0.68% 0.34% 1.29%
Total 2.05% 0.63% 0.45% 1.56%
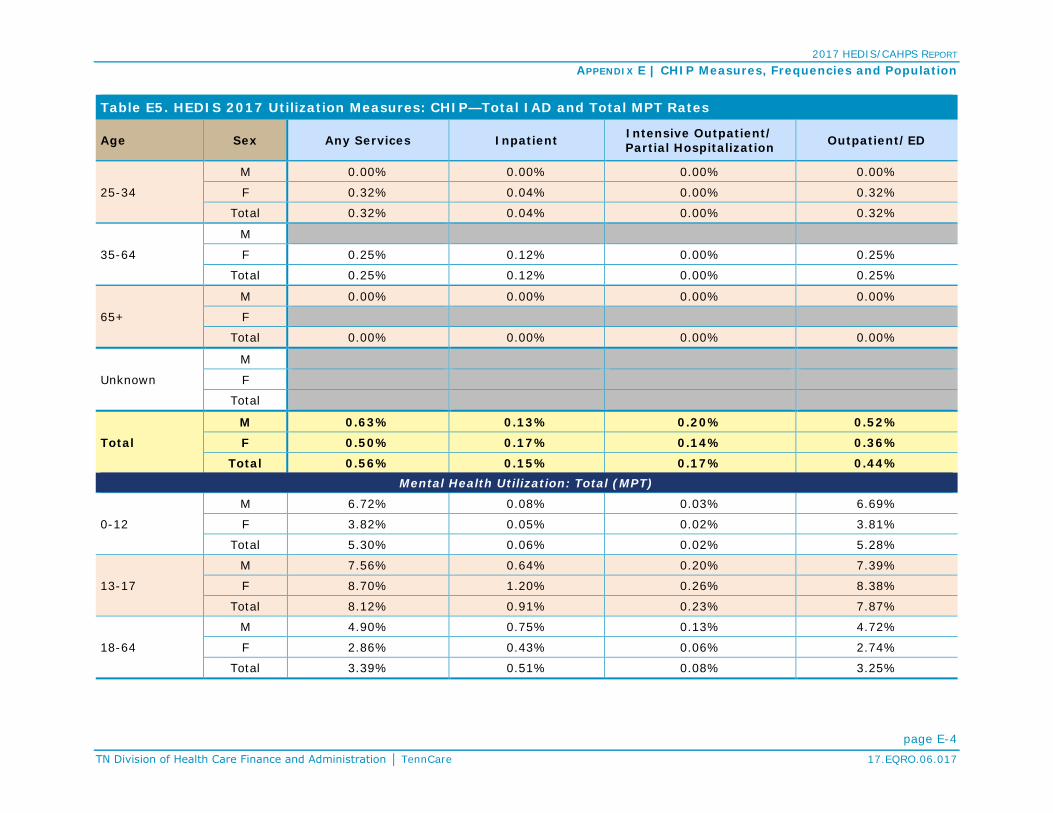
2017 HEDIS/CAHPS REPORT APPENDIX E | CHIP Measures, Frequencies and Population
page E-4 TN Division of Health Care Finance and Administration │ TennCare 17.EQRO.06.017
Table E5. HEDIS 2017 Utilization Measures: CHIP—Total IAD and Total MPT Rates
Age Sex Any Services Inpatient Intensive Outpatient/ Partial Hospitalization Outpatient/ED
25-34
M 0.00% 0.00% 0.00% 0.00%
F 0.32% 0.04% 0.00% 0.32%
Total 0.32% 0.04% 0.00% 0.32%
35-64
M
F 0.25% 0.12% 0.00% 0.25%
Total 0.25% 0.12% 0.00% 0.25%
65+
M 0.00% 0.00% 0.00% 0.00%
F
Total 0.00% 0.00% 0.00% 0.00%
Unknown
M
F
Total
Total M 0.63% 0.13% 0.20% 0.52% F 0.50% 0.17% 0.14% 0.36%
Total 0.56% 0.15% 0.17% 0.44% Mental Health Utilization: Total (MPT)
0-12
M 6.72% 0.08% 0.03% 6.69%
F 3.82% 0.05% 0.02% 3.81%
Total 5.30% 0.06% 0.02% 5.28%
13-17
M 7.56% 0.64% 0.20% 7.39%
F 8.70% 1.20% 0.26% 8.38%
Total 8.12% 0.91% 0.23% 7.87%
18-64
M 4.90% 0.75% 0.13% 4.72%
F 2.86% 0.43% 0.06% 2.74%
Total 3.39% 0.51% 0.08% 3.25%

2017 HEDIS/CAHPS REPORT APPENDIX E | CHIP Measures, Frequencies and Population
page E-5 TN Division of Health Care Finance and Administration │ TennCare 17.EQRO.06.017
Table E5. HEDIS 2017 Utilization Measures: CHIP—Total IAD and Total MPT Rates
Age Sex Any Services Inpatient Intensive Outpatient/ Partial Hospitalization Outpatient/ED
65+
M 0.00% 0.00% 0.00% 0.00%
F
Total 0.00% 0.00% 0.00% 0.00%
Unknown
M
F
Total
Total M 6.89% 0.32% 0.09% 6.80% F 5.15% 0.47% 0.10% 5.03%
Total 5.99% 0.40% 0.10% 5.88%
Utilization Measures: CHIP—Antibiotic Utilization: Total (ABX) Table E6. HEDIS 2017 Utilization Measures: CHIP—Antibiotic Utilization
Age Sex Average Scripts PMPY for Antibiotics
Average Days Supplied per
Antibiotic Script
Average Scripts PMPY for Antibiotics of Concern
Percentage of Antibiotics of Concern of All Antibiotic Scripts
0-9 M 1.02 9.29 0.49 48.45% F 1.11 9.54 0.52 46.40%
Total 1.06 9.42 0.50 47.41%
10-17 M 0.64 10.59 0.31 48.18% F 0.84 10.56 0.38 45.94%
Total 0.74 10.58 0.35 46.94%
18-34
M 0.53 11.72 0.25 46.26%
F 0.88 9.42 0.29 33.01%
Total 0.78 9.86 0.28 35.58%
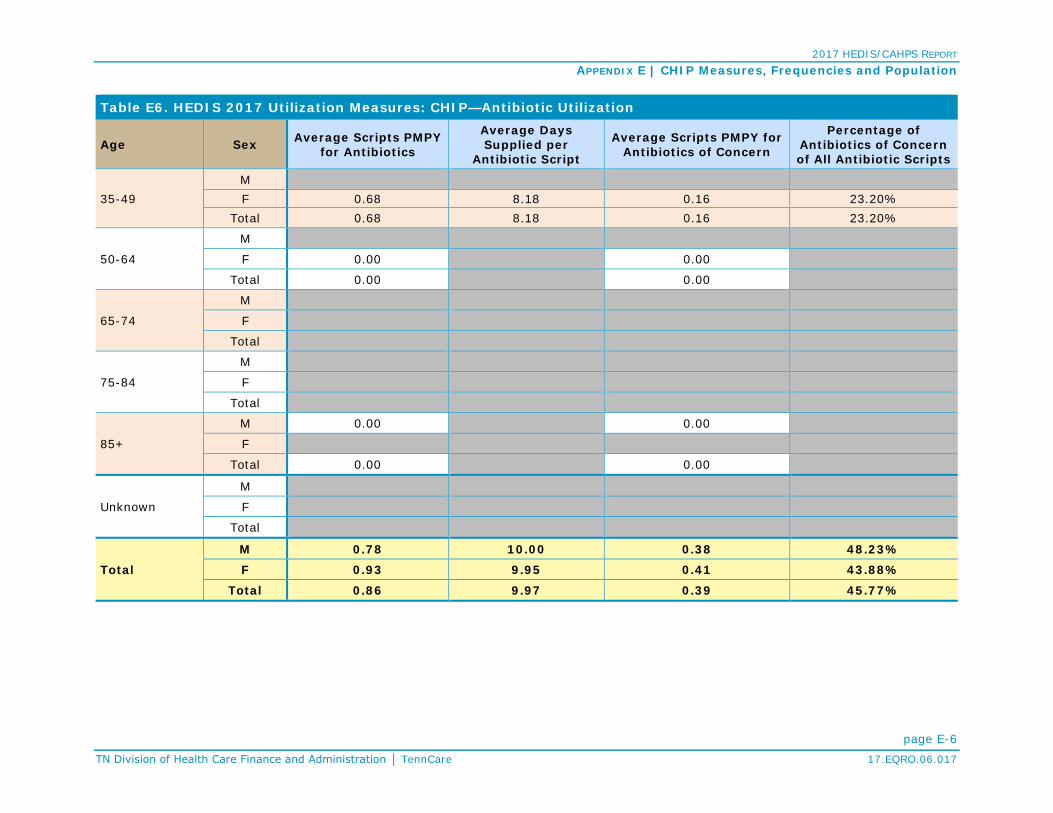
2017 HEDIS/CAHPS REPORT APPENDIX E | CHIP Measures, Frequencies and Population
page E-6 TN Division of Health Care Finance and Administration │ TennCare 17.EQRO.06.017
Table E6. HEDIS 2017 Utilization Measures: CHIP—Antibiotic Utilization
Age Sex Average Scripts PMPY for Antibiotics
Average Days Supplied per
Antibiotic Script
Average Scripts PMPY for Antibiotics of Concern
Percentage of Antibiotics of Concern of All Antibiotic Scripts
35-49 M F 0.68 8.18 0.16 23.20%
Total 0.68 8.18 0.16 23.20%
50-64
M
F 0.00 0.00
Total 0.00 0.00
65-74
M
F
Total
75-84
M
F
Total
85+
M 0.00 0.00
F
Total 0.00 0.00
Unknown
M
F
Total
Total M 0.78 10.00 0.38 48.23% F 0.93 9.95 0.41 43.88%
Total 0.86 9.97 0.39 45.77%

2017 HEDIS/CAHPS REPORT APPENDIX E | CHIP Measures, Frequencies and Population
page E-7 TN Division of Health Care Finance and Administration │ TennCare 17.EQRO.06.017
Table E7. HEDIS 2017 Utilization Measures: CHIP—Antibiotics of Concern Utilization
Age Sex Average Scripts PMPY for
Quinolones Cephalosporins 2nd-4th Generation
Azithromycins and Clarithromycins
Amoxicillin/ Clavulanates Ketolides Clindamycins Misc. Antibiotics
of Concern
0-9 M 0.00 0.18 0.18 0.12 0.00 0.02 0.00 F 0.00 0.21 0.17 0.12 0.00 0.02 0.00
Total 0.00 0.19 0.17 0.12 0.00 0.02 0.00
10-17 M 0.01 0.07 0.13 0.08 0.00 0.02 0.00 F 0.01 0.09 0.17 0.09 0.00 0.03 0.00
Total 0.01 0.08 0.15 0.09 0.00 0.02 0.00
18-34 M 0.03 0.03 0.09 0.07 0.00 0.03 0.00 F 0.03 0.04 0.12 0.06 0.00 0.03 0.00
Total 0.03 0.04 0.11 0.06 0.00 0.03 0.00
35-49 M F 0.02 0.02 0.04 0.06 0.00 0.02 0.00
Total 0.02 0.02 0.04 0.06 0.00 0.02 0.00
50-64 M F 0.00 0.00 0.00 0.00 0.00 0.00 0.00
Total 0.00 0.00 0.00 0.00 0.00 0.00 0.00
65-74 M F
Total
75-84 M F
Total
85+ M 0.00 0.00 0.00 0.00 0.00 0.00 0.00 F
Total 0.00 0.00 0.00 0.00 0.00 0.00 0.00
Unknown
M
F
Total

2017 HEDIS/CAHPS REPORT APPENDIX E | CHIP Measures, Frequencies and Population
page E-8 TN Division of Health Care Finance and Administration │ TennCare 17.EQRO.06.017
Table E7. HEDIS 2017 Utilization Measures: CHIP—Antibiotics of Concern Utilization
Age Sex Average Scripts PMPY for
Quinolones Cephalosporins 2nd-4th Generation
Azithromycins and Clarithromycins
Amoxicillin/ Clavulanates Ketolides Clindamycins Misc. Antibiotics
of Concern
Total
M 0.01 0.10 0.15 0.10 0.00 0.02 0.00
F 0.01 0.12 0.16 0.09 0.00 0.02 0.00
Total 0.01 0.11 0.15 0.10 0.00 0.02 0.00
Table E8. HEDIS 2017 Utilization Measures: CHIP—All Other Antibiotics Utilization
Age Sex Average Scripts PMPY for
Absorbable Sulfonamides
Amino- glycosides
1st Generation Cephalosporins
Linco-samides
Macrolides (not azith. or clarith.) Penicillins Tetra-
cyclines Misc.
Antibiotics
0-9
M 0.03 0.00 0.06 0.00 0.00 0.43 0.00 0.00
F 0.07 0.00 0.07 0.00 0.00 0.45 0.00 0.00
Total 0.05 0.00 0.07 0.00 0.00 0.44 0.00 0.00
10-17
M 0.04 0.00 0.05 0.00 0.00 0.18 0.06 0.00
F 0.07 0.00 0.06 0.00 0.00 0.23 0.06 0.03
Total 0.05 0.00 0.05 0.00 0.00 0.21 0.06 0.02
18-34
M 0.04 0.00 0.04 0.00 0.00 0.12 0.08 0.01
F 0.06 0.00 0.08 0.00 0.00 0.14 0.05 0.25
Total 0.06 0.00 0.07 0.00 0.00 0.13 0.06 0.18
35-49
M
F 0.03 0.00 0.07 0.00 0.00 0.09 0.02 0.31
Total 0.03 0.00 0.07 0.00 0.00 0.09 0.02 0.31
50-64
M
F 0.00 0.00 0.00 0.00 0.00 0.00 0.00 0.00
Total 0.00 0.00 0.00 0.00 0.00 0.00 0.00 0.00

2017 HEDIS/CAHPS REPORT APPENDIX E | CHIP Measures, Frequencies and Population
page E-9 TN Division of Health Care Finance and Administration │ TennCare 17.EQRO.06.017
Table E8. HEDIS 2017 Utilization Measures: CHIP—All Other Antibiotics Utilization
Age Sex Average Scripts PMPY for
Absorbable Sulfonamides
Amino- glycosides
1st Generation Cephalosporins
Linco-samides
Macrolides (not azith. or clarith.) Penicillins Tetra-
cyclines Misc.
Antibiotics
65-74
M
F
Total
75-84
M
F
Total
85+
M 0.00 0.00 0.00 0.00 0.00 0.00 0.00 0.00
F
Total 0.00 0.00 0.00 0.00 0.00 0.00 0.00 0.00
Unknown
M
F
Total
Total
M 0.03 0.00 0.05 0.00 0.00 0.27 0.04 0.00
F 0.07 0.00 0.07 0.00 0.00 0.29 0.04 0.06
Total 0.05 0.00 0.06 0.00 0.00 0.28 0.04 0.03
Table E8. HEDIS 2017 Utilization Measures: CHIP—Standardize Healthcare-Associated Infection Ratio (HAI)
Classification Percentage of Total Discharges From Hospitals With SIR High Moderate Low Unavailable
HAI-1: Central line-associated blood stream infection (CLABSI) 0.55% 0.02% 0.30% 0.13%
HAI-2: Catheter-associated urinary tract infection (CAUTI) 0.30% 0.13% 0.48% 0.10%
HAI-5: MRSA bloodstream infection (MRSA) 0.21% 0.14% 0.42% 0.23%
HAI-6: Clostridium difficile intestinal infection (CDIFF) 0.44% 0.18% 0.29% 0.10%

2017 HEDIS/CAHPS REPORT APPENDIX E | CHIP Measures, Frequencies and Population
page E-10 TN Division of Health Care Finance and Administration │ TennCare 17.EQRO.06.017
Health Plan Descriptive Information Table E9. Board Certification (BCR) Type of Physician Board Certification Percent Family Medicine 72.02%
Internal Medicine 69.82%
Pediatricians 80.99%
OB/GYN Physicians 75.41%
Geriatricians 71.43%
Other Physician Specialists 73.90%
HPA Population in CHIP Member Months Table E10. HPA CHIP Population in Member Months
Age Member Months
Male Female Total <1 4304 3813 8,117
1-4 39825 37303 77,128
5-9 110499 106459 216,958
10-14 140569 134539 275,108
15-17 85425 82504 167,929
18-19 27202 29072 56,274 0-19 Subtotal 407,824 393,690 801,514 0-19 Subtotal: Percent 99.99% 88.87% 94.20% 20-24 2 9944 9,946 25-29 2 15605 15,607 30-34 0 14106 14,106 35-39 0 7558 7,558 40-44 0 1931 1,931 20-44 Subtotal 4 49,144 49,148 20-44 Subtotal: Percent 0.00% 11.09% 5.78%

2017 HEDIS/CAHPS REPORT APPENDIX E | CHIP Measures, Frequencies and Population
page E-11 TN Division of Health Care Finance and Administration │ TennCare 17.EQRO.06.017
Table E10. HPA CHIP Population in Member Months
Age Member Months
Male Female Total 45-49 0 129 129
50-54 0 13 13
55-59 0 0 0
60-64 0 0 0 45-64 Subtotal 0 142 142 45-64 Subtotal: Percent 0.00% 0.03% 0.02% 65-69 0 0 0
70-74 0 0 0
75-79 0 0 0
80-84 0 0 0
85-89 0 0 0
>=90 48 0 48 >=65 Subtotal 48 0 48 >=65 Subtotal: Percent 0.01% 0.00% 0.01% Total 407,876 442,976 850,852