Embed Size (px)
Citation preview

Economic Regulation Authority
2017 Annual Performance Report – Energy Distributors
2017 Annual Performance Report
Energy Distributors
January 2018
Economic Regulation Authority
2017 Annual Performance Report – Energy Distributors
Economic Regulation Authority
4th Floor Albert Facey House 469 Wellington Street, Perth
Mail to: Perth BC, PO Box 8469 PERTH WA 6849
T: 08 6557 7900
F: 08 6557 7999
W: www.erawa.com.au
National Relay Service TTY: 13 36 77 (to assist people with hearing and voice impairment) We can deliver this report in an alternative format for those with a vision impairment. © 2018 Economic Regulation Authority. All rights reserved. This material may be reproduced in whole or in part provided the source is acknowledged.
Economic Regulation Authority
2017 Annual Performance Report – Energy Distributors i
Contents
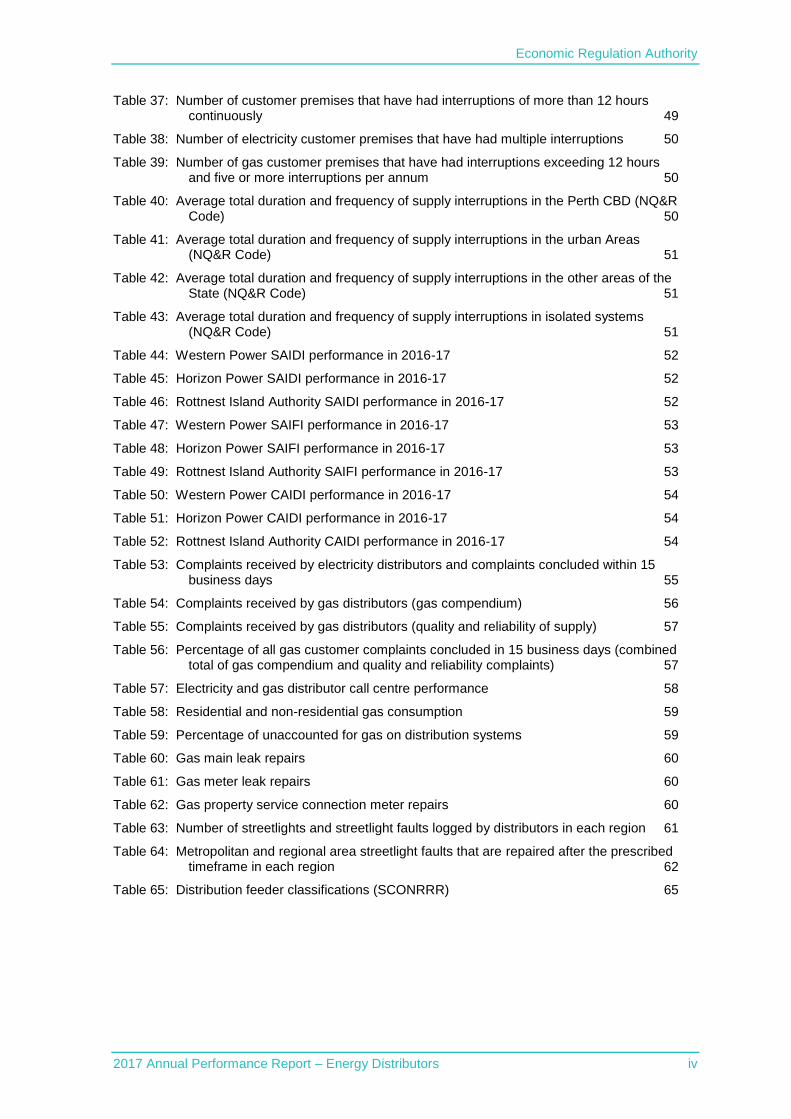
Contents i
Tables iii
Figures v
Executive summary 1
Growth in new connections has slowed down 1
More electricity reconnections 1
Household gas consumption at a six-year high 1
About this Report 3
Energy distribution market overview 5
Energy distributors 5
Customer connections 7
Connections on electricity distribution systems 7
Connections on gas distribution systems 9
Reconnections on electricity and gas distribution systems 10
Electricity distribution system reliability 12
NQ&R code specific reliability measures 12
Shared NQ&R code and SCONRRR framework reliability measures 12
System reliability standards 13
Distribution network reliability – NQ&R code 14
Extended interruptions 14
Multiple interruptions 14
System reliability 15
Distribution system reliability – SCONRRR framework 18
System Average Interruption Duration Index (SAIDI) 18
Gas distribution system reliability 22
Multiple interruptions on gas distribution systems 22
Extended interruptions 22
Gas consumption and unaccounted for gas 23
Gas consumption 23
Unaccounted for gas 23
Gas leaks 25
Streetlight repairs 27
Complaints 31
Electricity complaints 31
SCONRRR framework complaints 32
Electricity code complaints 34
Electricity complaint resolution 34
Gas complaints 35
Call centre performance 37
Electricity distributor call centre performance 37
Economic Regulation Authority
2017 Annual Performance Report – Energy Distributors ii
Gas distributor call centre performance 40
Service standard payments 42
Electricity distributor service standard payments 42
Appendix 1 - Electricity distribution system asset information 45
Appendix 2 - Gas distribution system construction information 46
Appendix 3 - Additional electricity and gas performance data 47
Appendix 4 - Additional information about distribution system reliability measures 63
NQ&R code reliability measures 63
SCONRRR definitions of overall and normalised interruptions 63
SCONRRR distribution feeder classifications 65
Economic Regulation Authority
2017 Annual Performance Report – Energy Distributors iii
Tables
Table 1: Number of licensed electricity and gas distributors 5
Table 2: Electricity connections by distributor 7
Table 3: New connections on electricity distribution systems 8
Table 4: Gas connections by distributor 9
Table 5: New connections on gas distribution systems 9
Table 6: Reconnections on electricity and gas distribution systems 10
Table 7: Reconnections not provided on time 11
Table 8: Overall and normalised SAIDI by electricity distributor 18
Table 9: Comparison of normalised SAIDI for each electricity distributor 19
Table 10: Overall and normalised SAIFI for each electricity distributor 19
Table 11: Comparison of normalised SAIFI for each electricity distributor 20
Table 12: Overall and normalised CAIDI for each electricity distributor 20
Table 13: Comparison of normalised CAIDI for each electricity distributor 21
Table 14: Comparison of gas consumption by distributor (GJ) 23
Table 15: Unaccounted for gas (GJ) 24
Table 16: Gas main leak repairs 25
Table 17: Gas property service connection leak repairs 25
Table 18: Gas meter leak repairs 26
Table 19: Number of streetlights in metropolitan and regional areas 27
Table 20: Number of streetlight faults logged in metropolitan and regional areas 28
Table 21: Technical quality of service complaints received in 2016-17 by category 32
Table 22: Technical quality of service complaints received since 2011-12 33
Table 23: Likely cause of technical quality of service complaints in 2016-17 33
Table 24: Complaints received by electricity distributors (electricity code) 34
Table 25: Complaints received by gas distributors 36
Table 26: Categorisation of complaints received by gas distributors in 2016-17 36
Table 27: Volume of calls to electricity distributor call centres 38
Table 28: Volume of calls to gas distributor call centres 40
Table 29: Service standard payments made by electricity distributors 42
Table 30: Electricity distribution system assets as at 30 June 2017 45
Table 31: Gas distribution network construction information for 2016-17 46
Table 32: Total small use customer connections on electricity and gas distribution systems 47
Table 33: Establishment of new customer connections on electricity and gas distribution systems 47
Table 34: Number of customer connections not established on electricity and gas distribution systems within the prescribed timeframes 48
Table 35: Customer reconnections on electricity and gas distribution systems 48
Table 36: Number of customer reconnections not established on electricity and gas distribution systems within the prescribed timeframes 49
Economic Regulation Authority
2017 Annual Performance Report – Energy Distributors iv
Table 37: Number of customer premises that have had interruptions of more than 12 hours continuously 49
Table 38: Number of electricity customer premises that have had multiple interruptions 50
Table 39: Number of gas customer premises that have had interruptions exceeding 12 hours and five or more interruptions per annum 50
Table 40: Average total duration and frequency of supply interruptions in the Perth CBD (NQ&R Code) 50
Table 41: Average total duration and frequency of supply interruptions in the urban Areas (NQ&R Code) 51
Table 42: Average total duration and frequency of supply interruptions in the other areas of the State (NQ&R Code) 51
Table 43: Average total duration and frequency of supply interruptions in isolated systems (NQ&R Code) 51
Table 44: Western Power SAIDI performance in 2016-17 52
Table 45: Horizon Power SAIDI performance in 2016-17 52
Table 46: Rottnest Island Authority SAIDI performance in 2016-17 52
Table 47: Western Power SAIFI performance in 2016-17 53
Table 48: Horizon Power SAIFI performance in 2016-17 53
Table 49: Rottnest Island Authority SAIFI performance in 2016-17 53
Table 50: Western Power CAIDI performance in 2016-17 54
Table 51: Horizon Power CAIDI performance in 2016-17 54
Table 52: Rottnest Island Authority CAIDI performance in 2016-17 54
Table 53: Complaints received by electricity distributors and complaints concluded within 15 business days 55
Table 54: Complaints received by gas distributors (gas compendium) 56
Table 55: Complaints received by gas distributors (quality and reliability of supply) 57
Table 56: Percentage of all gas customer complaints concluded in 15 business days (combined total of gas compendium and quality and reliability complaints) 57
Table 57: Electricity and gas distributor call centre performance 58
Table 58: Residential and non-residential gas consumption 59
Table 59: Percentage of unaccounted for gas on distribution systems 59
Table 60: Gas main leak repairs 60
Table 61: Gas meter leak repairs 60
Table 62: Gas property service connection meter repairs 60
Table 63: Number of streetlights and streetlight faults logged by distributors in each region 61
Table 64: Metropolitan and regional area streetlight faults that are repaired after the prescribed timeframe in each region 62
Table 65: Distribution feeder classifications (SCONRRR) 65

Economic Regulation Authority
2017 Annual Performance Report – Energy Distributors v
Figures
Figure 1: Total number of small use electricity and gas customer connections 7
Figure 2: Percentage of late connections on the Western Power distribution system 8
Figure 3: Horizon Power and Western Power extended interruptions 14
Figure 4: Multiple supply interruptions on electricity distribution systems 15
Figure 5: Average total length of interruptions on Perth CBD and urban areas (minutes) 16
Figure 6: Average frequency of interruptions in Perth CBD and urban areas (interruptions per year) 16
Figure 7: Average total length of interruptions on electricity distribution systems in rural areas 17
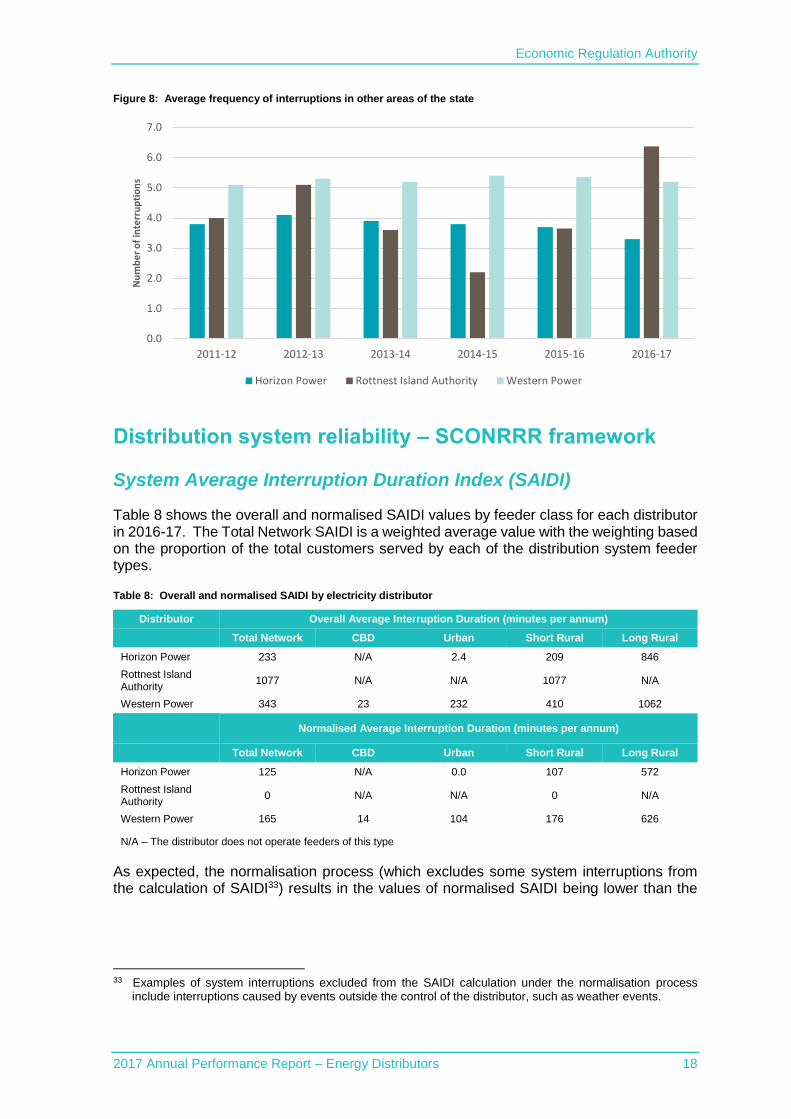
Figure 8: Average frequency of interruptions in other areas of the state 18
Figure 9: Percentage of faulty streetlights by distributor and location 28
Figure 10: Percentage of faulty metropolitan streetlights repaired after 5 business days 29
Figure 11: Percentage of faulty regional streetlights repaired after 9 days 29
Figure 12: Electricity distributor complaints resolved within 15 business days (electricity code and NQ&R code) 35
Figure 13: Percentage of electricity distributor calls answered within 30 seconds 39
Figure 14: Average duration before a call was answered by electricity distributors 39
Figure 15: Percentage of calls that were unanswered by electricity distributors 39
Figure 16: Percentage of gas distributor calls answered within 30 seconds 41
Figure 17: Average duration before a call was answered by gas distributors 41
Figure 18: Percentage of calls that were unanswered by gas distributors 41
Economic Regulation Authority
2017 Annual Performance Report – Energy Distributors 1
Executive summary
The ERA has reported data on electricity distributor performance since 2007, and on gas distributor performance since 2008.
Growth in new connections has slowed down
There were 25,579 new electricity connections in 2016-17, compared to 33,449 new connections in 2015-16. Western Power added 25,029 new connections (down from 32,589 in 2015-16) and Horizon Power added 549 new connections (down from 860 in 2015-16).
There were 16,871 new gas connections in 2016-17, compared to 24,652 connections in 2015-16. ATCO Gas Australia (ATCO) added 16,814 new connections (down from 24,600 in 2015-16).1
Although there were fewer new connections on electricity and gas distribution systems, the total number of connections increased. Total electricity connections increased from 1.158 million in 2015-16 to 1.178 million in 2016-17, and total gas connections increased from 738,080 to 751,728 over the same period.
The growth in new connections on distribution systems is closely linked to conditions in the property development market. Lower growth in new connections in 2016-17 correlates with a general slowdown in property development activity, particularly in Perth, due to an oversupply in the market.
More electricity reconnections
The number of reconnections on electricity distribution systems increased from 16,729 in 2015-16 to 32,471 in 2016-17. Reconnections on Western Power’s distribution systems increased from 15,202 to 22,313 and on Horizon Power’s systems from 1,527 to 10,158.
The increase in reconnections on Horizon Power’s network was mostly due to replacing existing meters with new smart meters under its Advanced Metering Infrastructure program. There was also an increase in reconnections following customer disconnections for failure to pay a bill. Prior to the installation of smart meters it was often not cost effective for Horizon Power to disconnect or reconnect a property manually. These properties can now be disconnected and reconnected remotely by the smart meter.
The increase in reconnections on the Western Power distribution systems is due to an increase in requests from retailers. Some of the increase can be explained by an increase in customer reconnections following disconnection for failure to pay a bill.2
Household gas consumption at a six-year high
Household gas consumption was at a six year high in 2016-17. Total residential consumption increased from 10.061 million gigajoules in 2015-16 to 11.049 million gigajoules in 2016-17.
1 The other new connections were on small gas distribution networks operated by Esperance Power Station and
Wesfarmers Kleenheat Gas. 2 This is discussed in the ERA’s 2017 Annual Performance Report – Energy Retailers, which is available at:
https://www.erawa.com.au/electricity/electricity-licensing/performance-reports.
Economic Regulation Authority
2017 Annual Performance Report – Energy Distributors 2
The majority of the increase was due to increased consumption by households connected to the ATCO distribution systems, which increased from 10.050 million gigajoules to 11.036 million gigjoules.
Consumption on the small gas distribution systems operated by Kleenheat increased by 16.1 per cent, up from 7,348 gigajoules in 2015-16 to 8,531 gigajoules in 2016-17.
The unusually large increase in gas consumption was likely due to the combined effect of new customer connections on the distribution systems and cold weather in the autumn and winter of 2017.
Economic Regulation Authority
2017 Annual Performance Report – Energy Distributors 3
About this Report
The ERA is the independent economic regulator in Western Australia responsible for administering the licensing schemes for energy distributors.3
The ERA reports on energy distributors’ performance under its obligation to monitor and report to the Minister for Energy on the operation of the licensing schemes.4 This is the seventh annual report on distributor performance.5
Performance reporting enhances transparency and accountability, and promotes integrity in the market. It also provides incentives for distributors to improve performance and helps to identify emerging issues requiring further investigation.
Performance reporting obligations only apply to small use customers, as defined under the relevant electricity and gas licensing legislation. “Small use customers” are residential and business customers whose annual consumption is less than 160 megawatt hours of electricity, or one terajoule of gas.
The report is structured as follows:
Energy distribution market overview: this section looks at the overall number of electricity and gas distributors, how many of those distributors supply small use customers, the number of connections on each distribution system and the timeliness of customer reconnections.6
Reliability: supply interruptions on electricity and gas distribution systems. Electricity distribution system reliability is reported against the measures in the NQ&R Code7 and the SCONRRR framework.8
Gas consumption and unaccounted for gas: this gas supplied to residential and business customers, and the difference in the amount of the gas entering gas distribution systems and the amount that is metered at supply points.
Gas leaks: gas main leaks, customer connection leaks and meter leaks on gas distribution systems.
Streetlight repairs: the number of streetlights in metropolitan and regional areas, what proportion of those lights were repaired, and how many repairs were completed within the prescribed timeframe.
Complaints: customer satisfaction with their distributor measured by the number of complaints and the effectiveness of retailers’ complaint handling procedures. It also provides a breakdown of the technical quality of service complaints and their cause(s).
Call centre performance: ease of customers’ contact with their distributor by telephone using three industry standard responsiveness measures.
3 The licensing scheme for electricity distributors is in Part 2 of the Electricity Industry Act 2004 (Electricity Act)
and the licensing scheme for gas distributors is in Part 2A of the Energy Coordination Act 1994 (Gas Act).
4 Section 38 of the Electricity Act and section 11AA of the Gas Act. 5 Prior to 2010-11, the ERA published separate reports on electricity distributors and gas distributors. 6 Reconnection after supply has been disconnected at the request of the retailer for non-payment of a bill. 7 Electricity Industry (Network Quality and Reliability of Supply) Code 2005. 8 The framework is described in the National Regulatory Reporting for Electricity Distribution and Retailing
Businesses, Utility Regulators Forum, March 2002. The document was published by the Steering Committee on National Regulatory Reporting Requirements (SCONRRR).
Economic Regulation Authority
2017 Annual Performance Report – Energy Distributors 4
Service standard payments: the number of payments made by electricity distributors for wrongful disconnection, failure to give 72 hours’ notice of a planned supply interruption, supply interruptions that exceed 12 hours and failing to provide a timely response to complaints.
Economic Regulation Authority
2017 Annual Performance Report – Energy Distributors 5
Energy distribution market overview
This section looks at:
the total number of electricity and gas distributors;9
the number of distributors supplying small use electricity and gas customers;
the number of small use electricity and gas customer connections; and
the timeliness of electricity and gas reconnections.
Energy distributors
Table 1 shows the number of licensed electricity and gas distributors.
Table 1: Number of licensed electricity and gas distributors
2011-12 2012-13 2013-14 2014-15 2015-16 2016-17
Electricity
Licensed distributors 6 6 7 7 7 7
Distributing to small use customers
3 3 3 3 3 3
Gas
Licensed distributors 3 3 3 3 3 3
Electricity distribution licensees that supply small use customers are:
Regional Power Corporation (Horizon Power)
Rottnest Island Authority
Electricity Networks Corporation (Western Power)
Holders of gas distribution licences are: 10
ATCO Gas Australia (ATCO)
Wesfarmers Kleenheat Gas Pty Ltd (Kleenheat)
Esperance Power Station
The number of licensed electricity and gas distributors has been stable since the ERA assumed responsibility for the licensing of electricity and gas distribution in 2005.
The majority of the licensed electricity distributors that are currently active in the market were first granted a licence in 2006.11 By the end of 2006, there were eight distribution
9 This includes electricity distributors that supply large use customers only (customers whose annual
consumption is more than 160 megawatt hours). 10 The licensing scheme in Part 2A of the Gas Act only covers distribution systems that supply small use
customers. 11 The Electricity Act commenced in 2005. Electricity distributors that were active when the Electricity Act
commenced had to obtain a licence from the ERA by 30 June 2006.
Economic Regulation Authority
2017 Annual Performance Report – Energy Distributors 6
licences in force. In 2010, two of the eight distributors surrendered their licence. The ERA also issued one new licence in 2013.12
The number of electricity distributors licensed to supply small use customers has remained unchanged since the licensing scheme commenced in 2006.
The ERA took over responsibility for licensing gas distributors from the (former) Office of Energy13 in 2005. At that time, there were three licensed gas distributors that are all still licensed today.
12 This licence authorised the distributor to supply large use customers only. 13 Office of Energy responsibilities are now undertaken by the Department of Treasury, Public Utilities Office.
Economic Regulation Authority
2017 Annual Performance Report – Energy Distributors 7
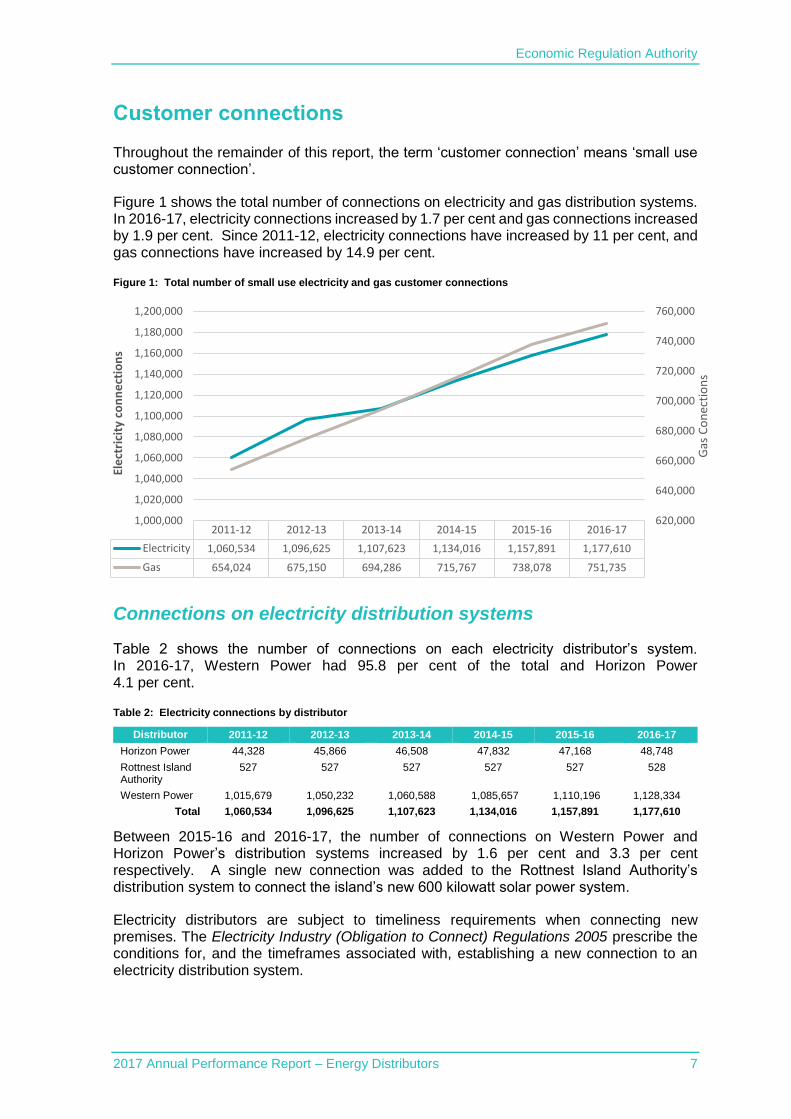
Customer connections
Throughout the remainder of this report, the term ‘customer connection’ means ‘small use customer connection’.
Figure 1 shows the total number of connections on electricity and gas distribution systems. In 2016-17, electricity connections increased by 1.7 per cent and gas connections increased by 1.9 per cent. Since 2011-12, electricity connections have increased by 11 per cent, and gas connections have increased by 14.9 per cent.
Figure 1: Total number of small use electricity and gas customer connections
Connections on electricity distribution systems
Table 2 shows the number of connections on each electricity distributor’s system. In 2016-17, Western Power had 95.8 per cent of the total and Horizon Power 4.1 per cent.
Table 2: Electricity connections by distributor
Distributor 2011-12 2012-13 2013-14 2014-15 2015-16 2016-17
Horizon Power 44,328 45,866 46,508 47,832 47,168 48,748
Rottnest Island Authority
527 527 527 527 527 528
Western Power 1,015,679 1,050,232 1,060,588 1,085,657 1,110,196 1,128,334
Total 1,060,534 1,096,625 1,107,623 1,134,016 1,157,891 1,177,610
Between 2015-16 and 2016-17, the number of connections on Western Power and Horizon Power’s distribution systems increased by 1.6 per cent and 3.3 per cent respectively. A single new connection was added to the Rottnest Island Authority’s distribution system to connect the island’s new 600 kilowatt solar power system.
Electricity distributors are subject to timeliness requirements when connecting new premises. The Electricity Industry (Obligation to Connect) Regulations 2005 prescribe the conditions for, and the timeframes associated with, establishing a new connection to an electricity distribution system.
2011-12 2012-13 2013-14 2014-15 2015-16 2016-17
Electricity 1,060,534 1,096,625 1,107,623 1,134,016 1,157,891 1,177,610
Gas 654,024 675,150 694,286 715,767 738,078 751,735
620,000
640,000
660,000
680,000
700,000
720,000
740,000
760,000
1,000,000
1,020,000
1,040,000
1,060,000
1,080,000
1,100,000
1,120,000
1,140,000
1,160,000
1,180,000
1,200,000
Gas
Co
nec
tio
ns
Ele
ctri
city
co
nn
ect
ion
s
Economic Regulation Authority
2017 Annual Performance Report – Energy Distributors 8
Table 3 compares the number of new connections on electricity distribution systems and the proportion of those connections not established on time (late connections) over the past two years.
The total number of new connections in 2016-17 was 23.5 per cent lower than in 2015-16. Both Western Power and Horizon Power reported a fall in the number of new connections, by 23.2 per cent and 36.2 per cent respectively.
Horizon Power reduced its proportion of late connections (from total new connections) to zero in 2016-17, while Western Power maintained similar performance to last year.
Table 3: New connections on electricity distribution systems
2015-16 2016-17
Distributor Number of
new connections
Connections not on time
% of connections not on time
Number of new
connections
Connections not on time
% of connections not on time
Horizon Power 860 2 0.2 549 0 0
Rottnest Island Authority
0 - - 1 0 0
Western Power 32,589 141 0.4 25,029 91 0.4
Total 33,449 143 0.4 25,579 91 0.4
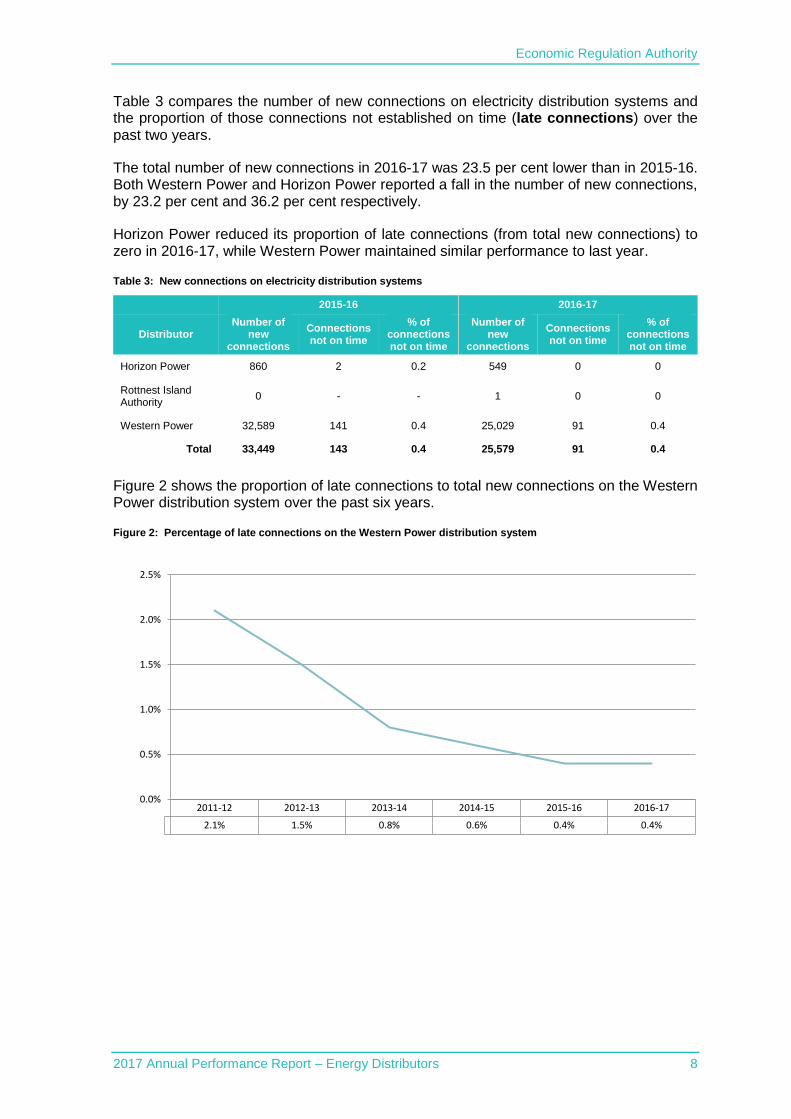
Figure 2 shows the proportion of late connections to total new connections on the Western Power distribution system over the past six years.
Figure 2: Percentage of late connections on the Western Power distribution system
2011-12 2012-13 2013-14 2014-15 2015-16 2016-17
2.1% 1.5% 0.8% 0.6% 0.4% 0.4%
0.0%
0.5%
1.0%
1.5%
2.0%
2.5%
Economic Regulation Authority
2017 Annual Performance Report – Energy Distributors 9
Connections on gas distribution systems
Table 4 shows the number of connections on each gas distributor’s system. In 2016-17 ATCO had 99.8 per cent of the total.
Between 2015-16 and 2016-17, total connections on gas distribution systems increased by 1.8 per cent. The number of connections on ATCO’s system and Esperance Power Station’s system increased by 1.8 per cent and 1.9 per cent respectively. The total connections on Kleenheat’s systems increased by five per cent.
Table 4: Gas connections by distributor
Distributor 2011-12 2012-13 2013-14 2014-15 2015-16 2016-17
ATCO 652,808 673,878 692,988 714,488 736,746 750,339
Esperance Power Station
313 332 342 357 376 383
Kleenheat 903 940 956 922 95814 1,006
State Total 654,024 675,150 694,286 715,767 738,080 751,728
Table 5 shows the number of new gas connections that were provided after the date agreed with the customer (late connection). With one late connection, Kleenheat was the only distributor to report late connections in 2016-17. All of ATCO’s 16,814 new connections were delivered on time, which represents a substantial improvement on 2015-16, when 287 of the 24,600 new connections were not made on time.15
Table 5: New connections on gas distribution systems
2015-16 2016-17
Distributor Number of
new connections
Connections not on time
% of connections not on time
Number of new
connections
Connections not on time
% of connections not on time
ATCO 24,600 287 1.2 16,814 0 0.0
Esperance Power Station
18 0 0.0 9 0 0.0
Kleenheat 34 0 0.0 48 1 2.1
Total 24,652 287 1.2 16,871 1 0.0
14 This was erroneously reported as 956 by Kleenheat in 2015-16. 15 In the ERA’s 2016 Annual Performance Report - Energy Distributors, it was reported that ATCO’s unusually
high number of late connections in 2015-16 was because its new contractor had short term resourcing issues, which were subsequently resolved.
Economic Regulation Authority
2017 Annual Performance Report – Energy Distributors 10
Reconnections on electricity and gas distribution systems
Since 2012-13, electricity and gas distributors have been required to report on their performance in reconnecting supply to a customer premises in accordance with the prescribed timeframes.
The prescribed timeframes for electricity distributors are in clause 8.2 of the electricity code and the timeframes for gas distributors are in clause 8.2 of the Compendium of Gas Customer Licence Obligations (gas compendium).
Table 6 shows the number of reconnections on electricity and gas distribution systems.
The number of reconnections on electricity systems increased by 94.1 per cent in 2016-17. Horizon Power and Western Power both reported increases in reconnections, by 565.2 per cent and 46.8 per cent respectively.
The number of reconnections is driven by retailer requests to the distributor to carry out this service; therefore, distributors do not always know the cause of the reconnection. Horizon Power is different, because it is also the retailer for customers on its distribution systems it knows the reasons for reconnections. The increase in reconnections on Horizon Power’s network was mostly due to replacing existing meters with new smart meters under its Advanced Metering Infrastructure (AMI) program. There was also an increase in reconnections following customer disconnections for failure to pay a bill. Prior to the installation of smart meters it was often not cost effective for Horizon Power to disconnect or reconnect a property manually. These properties can now be disconnected and reconnected remotely by the smart meter.
ATCO performed almost all of the reconnections on gas distribution systems in 2016-17. Compared to 2015-16, the number of reconnections on ATCO’s system was 3.1 per cent higher in 2016-17.
Table 6: Reconnections on electricity and gas distribution systems
Reconnections on electricity systems Reconnections on gas systems
Distributor 2013-14 2014-15 2015-16 2016-17 2013-14 2014-15 2015-16 2016-
17
Horizon Power
3,502 3,889 1,527 10,158 ATCO 2,820 7,112 10,875 11,212
Rottnest Island Authority
0 0 0 0 Esperance Power Station
25 30 5 0
Western Power
15,520 16,740 15,202 22,313 Kleenheat 2 10 8 6
Total 19,022 20,629 16,729 32,471 Total 2,847 7,152 10,888 11,218
Table 7 shows the number and percentage of reconnections on electricity and gas distribution systems that were not provided on time (late reconnections).
In 2016-17, there was only one late reconnection on a gas distribution system, which was on ATCO’s system. Western Power was the only electricity distributor to provide late reconnections in 2016-17. The proportion of late reconnections in 2016-17 is similar to 2015-16.
Economic Regulation Authority
2017 Annual Performance Report – Energy Distributors 11
Table 7: Reconnections not provided on time
2015-16 Reconnections 2016-17 Reconnections
Distributor Number
Number not on time
%
not on time
Number
Number not on time
%
not on time
Electricity
Horizon Power
1,527 0 0.0 10,158 0 0.0
Rottnest Island Authority
0 0 0.0 0 0 0.0
Western Power
15,202 145 1.0 22,313 222 1.0
Gas
ATCO 10,875 0 0.0 11,212 1 0.0
Esperance Power Station
5 0 0.0 0 0 0.0
Kleenheat 8 0 0.0 6 0 0.0

Economic Regulation Authority
2017 Annual Performance Report – Energy Distributors 12
Electricity distribution system reliability
Electricity distributors are required to report on reliability under two regulatory frameworks:
NQ&R Code; and
SCONRRR framework.16
NQ&R code specific reliability measures
The NQ&R Code requires distributors to report on the length and frequency of supply interruptions:
the number of customer premises that have had interruptions that exceed 12 hours continuously (extended interruption); and
The number of customer premises that have had more than:
Nine interruptions per annum in the Perth CBD17 and urban areas; or
16 interruptions per annum in all other areas of the State.
Shared NQ&R code and SCONRRR framework reliability measures
The SCONRRR framework and NQ&R Code both measure distribution system reliability through three main performance indicators:18 19
System Average Interruption Duration Index (SAIDI) – measures the total duration of supply interruptions for the average customer on the network.
System Average Interruption Frequency Index (SAIFI) – measures how often the average customer had a supply interruption.
Customer Average Interruption Duration Index (CAIDI) – measures the total duration of supply interruption for only those customers who have had an interruption during the reporting period.
The standard calculation of SAIDI, SAIFI and CAIDI only includes sustained supply interruptions, which are more than one minute in duration. Unusually, the NQ&R Code requires distributors to include both planned and unplanned interruptions regardless of what caused an interruption and its duration. This differs from other reliability measurement frameworks that are commonly used, such as the SCONRRR framework.20
16 The framework is described in the National Regulatory Reporting for Electricity Distribution and Retailing
Businesses, Utility Regulators Forum, March 2002. The document was published by the Steering Committee on National Regulatory Reporting Requirements (SCONRRR).
17 Central Business District, which is the area supplied by the Milligan Street Zone Substation and the Hay Street Zone Substation, both operated by Western Power.
18 The definition of the three measures is in Standard IEEE 1366-2003 - Guide for Electric Power Distribution Reliability Indices, Institute for Electrical and Electronic Engineers.
19 The NQ&R Code does not use the terms SAIDI, SAIFI and CAIDI. See Appendix 4 for more information. 20 Most reliability reporting frameworks in common use require distributors to report on unplanned interruptions
that are caused by factors considered to be within their control. This means that unplanned interruptions
Economic Regulation Authority
2017 Annual Performance Report – Energy Distributors 13
The SCONRRR framework requires distributors to report on the type of interruption and the type of feeder that interruption occurred on:
The type of the interruption has four classifications – Overall, Planned Interruptions, Unplanned Interruptions and Normalised Unplanned Interruptions.21
There are four types of feeder – CBD, Urban, Short Rural and Long Rural.22
System reliability standards
Section 13(2) of the NQ&R Code includes standards for the average total length of interruptions23 in the three defined areas of the State:24
Perth CBD – 30 minutes;
urban areas other than the Perth CBD (urban areas) – 160 minutes;25 and
any other area of the State (rural areas) – 290 minutes.
The standard for each area takes into account the level of interconnection and available capacity factored into the design of the distribution systems.
The SCONRRR framework does not include any reliability standards. It is left to the relevant state/territory regulator to set the standards for the distributors they regulate.
In Western Australia, Western Power is the only distributor subject to reliability performance standards (under its access arrangement service standard benchmarks).26 The other distributors covered by this report are not subject to distribution system reliability standards. However, publishing the reliability data for these distributors provides useful information about the performance of their distribution systems over time and provides an opportunity to benchmark performance against other distributors.27
caused by severe weather events, third party actions, generation outages and transmission network outages are excluded.
21 Appendix 4 has more information about the definitions of interruption categories. 22 The definition of each feeder type is in Table 65, Appendix 4. 23 This is the equivalent to the SAIDI for the group of feeders supplying customers in each geographical area. 24 See Appendix 4 for more information about how the standard is calculated. 25 These areas are defined in section 3 of the NQ&R Code and include: the Perth metropolitan region, Albany,
Bunbury, Geraldton, Kalgoorlie and Mandurah. 26 The access arrangement requires Western Power to meet the service levels defined in the service standard
benchmarks, which include benchmarks for distribution system reliability. More information is available on the ERA website: https://www.erawa.com.au/electricity/electricity-access/western-power-network.
27 The reliability of distributors in the National Electricity Market is calculated using a framework that is very similar to the SCONRRR framework. See Appendix 4 for more information.
Economic Regulation Authority
2017 Annual Performance Report – Energy Distributors 14
Distribution network reliability – NQ&R code
Extended interruptions
Figure 3 shows the percentage of customer premises on the Horizon Power and Western Power distribution systems that have had an extended interruption.28
Figure 3: Horizon Power and Western Power extended interruptions29
Because of unpredictable environmental factors like severe storms or bush fires, the number of customers affected by extended interruptions varies each year.
Over the past six years, the proportion of customer premises on Western Power’s distribution system that have had an extended interruption was between 3.4 per cent and 17.7 per cent.30 Excluding 2011-12, the average percentage of affected customer premises each year is 3.7 per cent.
The number of extended interruptions on the Horizon Power system was slightly lower than Western Power in 2016-17. The peak in 2014-15 was caused by tropical cyclones Olwyn and Quang.
The Rottnest Island Authority reported that there were no extended interruptions to customer premises during 2016-17.
Multiple interruptions
Figure 4 shows the number of customer premises that had more than the prescribed number of interruptions (excess interruptions) in the Perth CBD and urban areas (both exclusively
28 The Rottnest Island Authority is excluded from Figure 3, because the number of extended interruptions on
their system over the past six years is small compared to Horizon Power and Western Power. The data for the Rottnest Island Authority can be found in Appendix 3, Table 37.
29 Due to an error, the 2016 Distributor’s Report reported Western Power’s performance as slightly lower between 2011-12 and 2015-16 than it actually was. Figure 3 contains the correct data for those years.
30 The peak in 2012 was caused by major storms that interrupted supply to a large number of customers across the south west and south of the State.
2011-12 2012-13 2013-14 2014-15 2015-16 2016-17
Horizon Power 4.2% 1.3% 8.1% 13.3% 1.4% 3.4%
Western Power 17.7% 3.7% 4.1% 3.4% 3.6% 3.9%
0.0%
2.0%
4.0%
6.0%
8.0%
10.0%
12.0%
14.0%
16.0%
18.0%
20.0%
Per
cen
tage
of
cust
om
ers
inte
rru
pte
d
Economic Regulation Authority
2017 Annual Performance Report – Energy Distributors 15
supplied by Western Power) and in rural areas (where all three distributors have distribution systems31).
Figure 4: Multiple supply interruptions on electricity distribution systems
Because the same factors that influence the number of extended interruptions also influence the number of excess interruptions, the number of customer premises experiencing excess interruptions each year is variable.
In 2016-17, premises that had excess interruptions in Horizon Power’s areas decreased by 62.3 per cent (from 268 to 101 premises).
Customer premises affected by excess interruptions in the combined Perth CBD and urban areas were 103.1 per cent higher in 2016-17 than in 2015-16, and those in Western Power’s rural areas were 4.4 per cent higher. Western Power attributed the increase in excess interruptions to unplanned outages caused by weather and a large volume of planned work to replace overhead conductors in Perth and Bunbury.
System reliability
System reliability in the Perth CBD and urban areas
Western Power is the only distributor that supplies customers in the Perth CBD and urban areas.
Figure 5 shows the average total length of interruptions per connection (SAIDI) in these areas, and compares them with the applicable standards in section 13 the NQ&R Code.
31 The Rottnest Island Authority has been excluded from Figure 4 because it has not reported any excess
interruptions to customer premises over the past six years.
0
2,000
4,000
6,000
8,000
10,000
12,000
14,000
0
1,000
2,000
3,000
4,000
5,000
6,000
2011-12 2012-13 2013-14 2014-15 2015-16 2016-17
CB
D &
Urb
an (
>9 I
nte
rru
pti
on
s)
Ru
ral (
>16
Inte
rru
pti
on
s)
Horizon Power Rural Western Power Rural Western Power Urban and CBD

Economic Regulation Authority
2017 Annual Performance Report – Energy Distributors 16
Figure 5: Average total length of interruptions on Perth CBD and urban areas (minutes)
The average total length of interruptions in both the Perth CBD and urban systems exceeded their respective NQ&R standards32 – in the Perth CBD by seven minutes (or 23 per cent) and in the urban areas by 84 minutes (or 52.5 per cent).
In 2016-17, the average total length of interruptions in the Perth CBD was 37 minutes, down from 40 minutes in 2015-16. The average total length of interruptions in urban areas continued its downward trend. In 2016-17, the average length of interruptions in urban areas was a six-year low of 244 minutes.
Figure 6 shows the average frequency of supply interruptions for customers in the Perth CBD and urban areas. In 2016-17, the frequency of supply interruptions in both areas were at six-year lows, at 0.2 interruptions per connection in the Perth CBD and 1.8 interruptions per connection in urban areas.
Figure 6: Average frequency of interruptions in Perth CBD and urban areas (interruptions per year)
32 The standards are 30 minutes for the Perth CBD and 160 minutes for urban areas.
25
27
29
31
33
35
37
39
41
100
150
200
250
300
350
400
450
2011-12 2012-13 2013-14 2014-15 2015-16 2016-17
Pe
rth
CB
D
Urb
an A
reas
Axis Title
Urban Areas Urban standard (160 mins) Perth CBD CBD standard (30 mins)
0.2
0.22
0.24
0.26
0.28
0.3
0.32
1.7
1.8
1.9
2
2.1
2.2
2.3
2.4
2.5
2.6
2.7
2011-12 2012-13 2013-14 2014-15 2015-16 2016-17
Pe
rth
CB
D
Urb
an A
reas
Urban Areas Perth CBD
Economic Regulation Authority
2017 Annual Performance Report – Energy Distributors 17
System Reliability in Other Areas of the State
Figure 7 shows the average total length of interruptions per connection (SAIDI) on distribution systems located in rural areas for each distributor.
Figure 7: Average total length of interruptions on electricity distribution systems in rural areas
Over the past six years, the Rottnest Island Authority was the only distributor to meet the NQ&R Code’s 290-minute standard for rural areas. However, in 2016-17, the average length of interruptions on its system was 386 minutes, up from 136 minutes in 2015-16. The Rottnest Island Authority attributed the increase to several incidents, including planned outages on its distribution system to connect a new solar power system and replace emergency generators, and unplanned outages caused by an underground cable failure.
The average length of interruptions on Horizon Power’s systems was 5.8 per cent lower than the previous year (338 minutes, down from 359 minutes in 2015-16). The average length of interruptions on Western Power’s system was slightly higher compared to last year, with an increase of 0.5 per cent (997 minutes, up from 992 minutes in 2015-16).
Figure 8 shows the average frequency of interruptions per connection on distribution systems located in rural areas for each distributor.
The performance of the Horizon Power and Western Power systems in 2016-17 was similar to that in 2015-16. The average frequency of interruptions on the Rottnest Island Authority system was 73 per cent higher (at 6.4 per connection) in 2016-17. The Rottnest Island Authority explained that the increased interruptions were due to the same reasons given for the increase in the average total length of interruptions.
0
200
400
600
800
1000
1200
2011-12 2012-13 2013-14 2014-15 2015-16 2016-17
Min
ute
s o
f In
terr
up
tio
n
Horizon Power Rottnest Island Authority Western Power Standard (290 mins)
Economic Regulation Authority
2017 Annual Performance Report – Energy Distributors 18
Figure 8: Average frequency of interruptions in other areas of the state
Distribution system reliability – SCONRRR framework
System Average Interruption Duration Index (SAIDI)
Table 8 shows the overall and normalised SAIDI values by feeder class for each distributor in 2016-17. The Total Network SAIDI is a weighted average value with the weighting based on the proportion of the total customers served by each of the distribution system feeder types.
Table 8: Overall and normalised SAIDI by electricity distributor
Distributor Overall Average Interruption Duration (minutes per annum)
Total Network CBD Urban Short Rural Long Rural
Horizon Power 233 N/A 2.4 209 846
Rottnest Island Authority
1077 N/A N/A 1077 N/A
Western Power 343 23 232 410 1062
Normalised Average Interruption Duration (minutes per annum)
Total Network CBD Urban Short Rural Long Rural
Horizon Power 125 N/A 0.0 107 572
Rottnest Island Authority
0 N/A N/A 0 N/A
Western Power 165 14 104 176 626
N/A – The distributor does not operate feeders of this type
As expected, the normalisation process (which excludes some system interruptions from the calculation of SAIDI33) results in the values of normalised SAIDI being lower than the
33 Examples of system interruptions excluded from the SAIDI calculation under the normalisation process
include interruptions caused by events outside the control of the distributor, such as weather events.
0.0
1.0
2.0
3.0
4.0
5.0
6.0
7.0
2011-12 2012-13 2013-14 2014-15 2015-16 2016-17
Nu
mb
er
of
inte
rru
pti
on
s
Horizon Power Rottnest Island Authority Western Power
Economic Regulation Authority
2017 Annual Performance Report – Energy Distributors 19
overall SAIDI. In the case of the Rottnest Island Authority distribution system, the normalisation process has excluded all of the interruptions.34
The value of SAIDI for each class of feeder is consistent with the level of redundancy in the network for that class, and the remoteness of the location. For example, long rural feeders tend not to have any redundancy, and are often in remote locations, which increases the time to repair faults.
Table 9 compares each distributor’s normalised SAIDI by feeder class in 2015-16 and 2016-17.
Table 9: Comparison of normalised SAIDI for each electricity distributor
2015-16 2016-17
Distributor Total
Network CBD Urban Short Rural
Long Rural
Total Network
CBD Urban Short Rural
Long Rural
Horizon Power
199 N/A 32 199 764 125 N/A 0 107 572
Rottnest Island Authority
0 N/A N/A 0 N/A 0 N/A N/A 0 N/A
Western Power
152 23 91 168 583 165 14 104 176 626
N/A – No feeders of this type are operated by the distributor
In 2016-17, the normalised SAIDI increased slightly for three of the four classes of feeder on the Western Power distribution system. This resulted in the Total Network SAIDI increasing by 8.6 per cent compared to 2015-16.
The normalised SAIDI for Horizon Power’s short rural and long rural feeders improved in 2016-17, down by 46.2 per cent and 25.1 per cent respectively from 2015-16. This resulted in a 37.2 per cent decrease in Total Network SAIDI.35
System Average Interruption Frequency Index (SAIFI)
Table 10 shows the overall and normalised SAIFI values by feeder class for each distributor in 2016-17. SAIFI measures how often the average customer has a supply interruption. The Total Network SAIFI is a weighted average value with the weighting based on the total customers served by each of the distribution system feeder types.
Table 10: Overall and normalised SAIFI for each electricity distributor
Overall Distribution network – System Average Interruption Frequency (per annum)
Distributor Total Network CBD Urban Short Rural Long Rural
Horizon Power 2.6 N/A 0.0 2.3 8.3
Rottnest Island Authority
15.9 N/A N/A 15.9 N/A
Western Power 2.3 0.1 1.7 2.8 5.6
Normalised Distribution network – System Average Interruption Frequency (per annum)
Total Network CBD Urban Short Rural Long Rural
Horizon Power 2.1 N/A 0.0 1.9 7.0
34 The interruptions were caused by generation outages and a single underground cable failure. The outage for
the cable failure was excluded because it exceeded the Major Event Day threshold (see Appendix 4 for the definition of Major Event Days).
35 Horizon Power attributed the higher SAIDI in 2015-16 to the Esperance bushfires that occurred in November 2015.

Economic Regulation Authority
2017 Annual Performance Report – Energy Distributors 20
Rottnest Island Authority
0.0 N/A N/A 0.0 N/A
Western Power 1.4 0.1 1.0 1.8 4.0
N/A – No feeders of this type are operated by the distributor
Interruptions that are excluded from the calculation of normalised SAIDI in Table 9 are also excluded from the calculation of normalised SAIFI in Table 10.
Table 11 shows each distributor’s normalised SAIFI by feeder class in 2015-16 and 2016-17.
Table 11: Comparison of normalised SAIFI for each electricity distributor
2015-16 2016-17
Distributor Total
Network CBD Urban
Short Rural
Long Rural
Total Network
CBD Urban Short Rural
Long Rural
Horizon Power
3.1 N/A 0.9 3.2 7.8 2.1 N/A 0.0 1.9 7.0
Rottnest Island Authority
0.0 N/A N/A 0.0 N/A 0.0 N/A N/A 0.00 N/A
Western Power
1.4 0.1 0.9 1.8 4.0 1.4 0.1 1.0 1.8 4.0
N/A – No feeders of this type are operated by the distributor
Comparing Table 11 with Table 9 shows that the change in the values of SAIFI between 2015-16 and 2016-17 mostly follows the same pattern as that for the SAIDI values. This result is to be expected. When an interruption is removed from the total interruptions by the SAIDI normalisation process, there is a corresponding reduction in the value of SAIFI.
Customer Average Interruption Duration Index (CAIDI)
Table 12 shows the overall and normalised CAIDI values by feeder class for each distributor in 2016-17.
The CAIDI values for each class of feeder measure the average length of interruptions for those customers who actually had an interruption during the year. Therefore, the CAIDI values are more representative of the actual experience of the customers that were interrupted than the SAIDI values.
Table 12: Overall and normalised CAIDI for each electricity distributor
Overall Distribution Network – Customer Average Interruption Duration (minutes per annum)
Distributor Total Network CBD Urban Short Rural Long Rural
Horizon Power 91 N/A 184 89 102
Rottnest Island Authority
68 N/A N/A 68 N/A
Western Power 151 167 137 149 191
Normalised Distribution Network – Customer Average Interruption Duration (minutes per
annum)
Total Network CBD Urban Short Rural Long Rural
Horizon Power 59 N/A 0 56 81
Rottnest Island Authority
0 N/A N/A 0 N/A
Western Power 115 123 102 100 159
N/A – No feeders of this type are operated by the distributor

Economic Regulation Authority
2017 Annual Performance Report – Energy Distributors 21
Table 13 shows each distributor’s normalised CAIDI by feeder class in 2015-16 and 2016-17.
Table 13: Comparison of normalised CAIDI for each electricity distributor
2015-16 2016-17
Distributor Total
Network CBD Urban
Short Rural
Long Rural
Total Network
CBD Urban Short Rural
Long Rural
Horizon Power
65 N/A 36 62 98 59 N/A 0 56 81
Rottnest Island Authority
0 N/A N/A 0 N/A 0 N/A N/A 0 N/A
Western Power
111 217 101 96 146 115 123 102 100 159
N/A – No feeders of this type are operated by the distributor
Comparing 2015-16 with 2016-17 shows that the normalised Total Network CAIDI on Horizon Power’s systems fell by 9.2 per cent and increased by 3.6 per cent on Western Power’s system.
Horizon Power reported decreases in CAIDI for all feeder classes. The decreases in CAIDI are consistent with the decreases in SAIDI.
On Western Power’s system, customers in the CBD had the largest decrease in average interruption duration, down by 43.3 per cent between 2015-16 and 2016-17. The largest increase in average interruption duration was for customers on long rural feeders, with an increase of 8.9 per cent compared to 2015-16.

Economic Regulation Authority
2017 Annual Performance Report – Energy Distributors 22
Gas distribution system reliability
The measurement of interruptions on gas distribution networks is not quite as straightforward as it is for electricity distribution networks.
While it is certain that the premises downstream of a supply interruption on electricity distribution systems will have lost supply, gas leaks or mains breaks on gas distribution systems do not always cause a loss of supply to all of the premises connected downstream.
Gas distribution systems are pressurised, so there may be sufficient pressure to maintain an adequate supply of gas for some time after the gas has started to escape from the system. This makes it difficult to accurately estimate the duration of a supply interruption to customer premises or, in some cases, whether the supply has been interrupted at all.
Gas distributors are required to report on the length and frequency of supply interruptions:
the number of customer premises that have had interruptions that exceed 12 hours continuously (extended interruptions); and
the number of customer premises that have had five or more interruptions.
Multiple interruptions on gas distribution systems
No distributor reported customer premises having five or more unplanned interruptions in 2016-17.
Customers experiencing five or more interruptions in a year is rare. Over the past six years, ATCO was the only distributor to report customers experiencing five or more interruptions in the year, with a single customer affected by an interruption in each of the three years prior to 2016-17.36
Extended interruptions
In 2016-17, 439 customer premises on ATCO’s system were interrupted for more than 12 hours continuously. The interruptions were caused by water ingress and broken service equipment. This is a decrease of 17.5 per cent compared to 2015-16.
Fourteen customer premises on Kleenheat’s systems were interrupted for more than 12 hours continuously, caused by commissioning works. This is the first year that Kleenheat has reported customers experiencing extended interruptions.37
36 A different customer was affected by multiple interruptions in each or the three years. 37 Refer to Table 39 in Appendix 3.
Economic Regulation Authority
2017 Annual Performance Report – Energy Distributors 23
Gas consumption and unaccounted for gas
Gas consumption
Gas distributors are required to record the amount of gas consumed by residential and business customers on their distribution systems.
Table 14 compares residential and business gas consumption in 2015-16 and 2016-17.
Total residential and business gas consumption increased in 2016-17, because of increased consumption on the ATCO systems. Esperance Power Station reported a slight increase in residential gas consumption and a 36.4 per cent decrease in business gas consumption. Esperance Power Station attributed the decrease in business gas consumption to dry weather conditions during the harvesting season resulting in grain dryers in Esperance processing less product than usual.
Kleenheat reported a 16.1 per cent increase in residential gas consumption in 2016-17. The increase was attributed by Kleenheat to new connections and cold weather increasing gas usage.
In 2016-17, Kleenheat reported zero business gas consumption by small use customers for the first time. Kleenheat explained that in previous years it reported business gas consumption in error, due to some residential accounts being set up in business names (residential homes owned by businesses, such as charities).
Table 14: Comparison of gas consumption by distributor (GJ)
Residential Business
Distributor 2015-16 2016-17 Change (%) 2015-16 2016-17 Change (%)
ATCO38 10,049,915 11,036,506 9.8 1,319,166 1,383,781 4.9
Esperance Power Station
4,014 4,017 0.0 32,342 20,570 -36.4
Kleenheat 7,348 8,531 16.1 218 0 -100.0
State Total 10,061,277 11,049,054 9.8 1,351,726 1,404,351 3.9
Residential and business gas consumption over the past six years is in Table 58 of Appendix 3.
Unaccounted for gas
Unaccounted for gas (UFG) is a measure of network efficiency for gas distribution systems. UFG represents the difference between gas metered at the input to the distribution system and the aggregated quantity of gas metered at customer connections.
The two most common contributors to UFG are leaks and metering differences at the start and end point of the system.
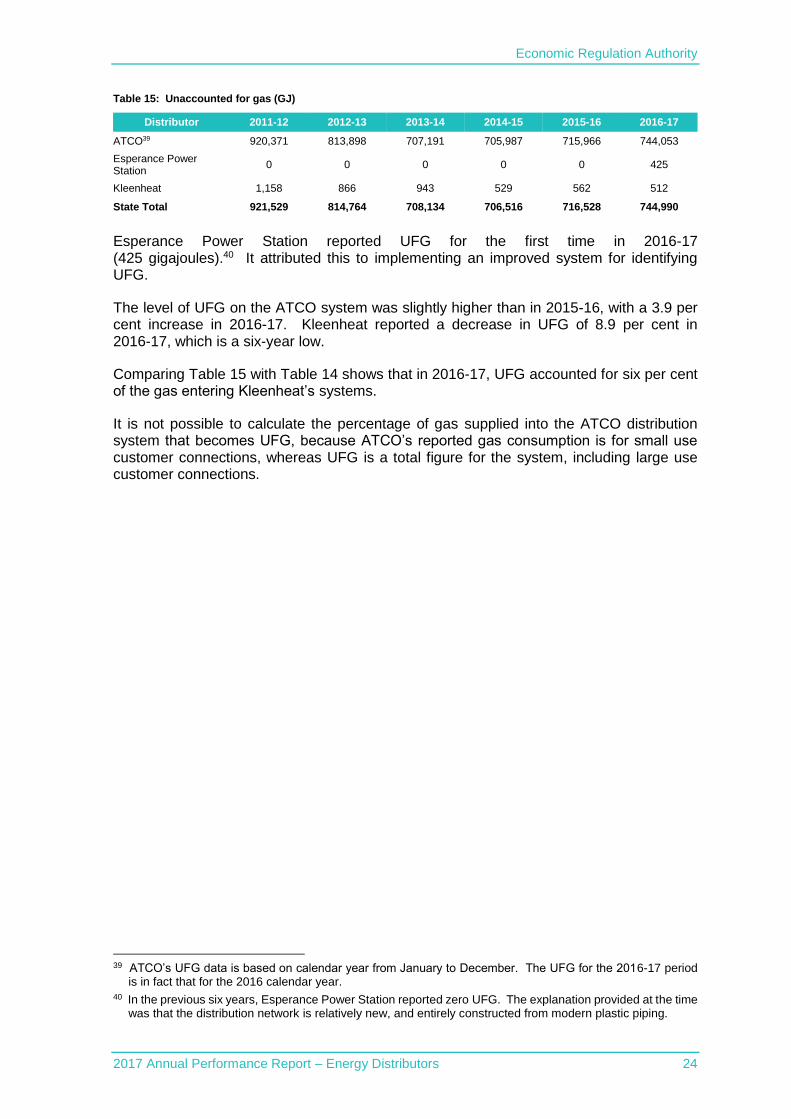
Table 15 shows the quantity of UFG for each distributor.
38 ATCO’s gas consumption data is based on calendar year from January to December. The consumption data
for the 2016-17 period is in fact that for the 2016 calendar year.
Economic Regulation Authority
2017 Annual Performance Report – Energy Distributors 24
Table 15: Unaccounted for gas (GJ)
Distributor 2011-12 2012-13 2013-14 2014-15 2015-16 2016-17
ATCO39 920,371 813,898 707,191 705,987 715,966 744,053
Esperance Power Station
0 0 0 0 0 425
Kleenheat 1,158 866 943 529 562 512
State Total 921,529 814,764 708,134 706,516 716,528 744,990
Esperance Power Station reported UFG for the first time in 2016-17 (425 gigajoules).40 It attributed this to implementing an improved system for identifying UFG.
The level of UFG on the ATCO system was slightly higher than in 2015-16, with a 3.9 per cent increase in 2016-17. Kleenheat reported a decrease in UFG of 8.9 per cent in 2016-17, which is a six-year low.
Comparing Table 15 with Table 14 shows that in 2016-17, UFG accounted for six per cent of the gas entering Kleenheat’s systems.
It is not possible to calculate the percentage of gas supplied into the ATCO distribution system that becomes UFG, because ATCO’s reported gas consumption is for small use customer connections, whereas UFG is a total figure for the system, including large use customer connections.
39 ATCO’s UFG data is based on calendar year from January to December. The UFG for the 2016-17 period
is in fact that for the 2016 calendar year. 40 In the previous six years, Esperance Power Station reported zero UFG. The explanation provided at the time
was that the distribution network is relatively new, and entirely constructed from modern plastic piping.
Economic Regulation Authority
2017 Annual Performance Report – Energy Distributors 25
Gas leaks
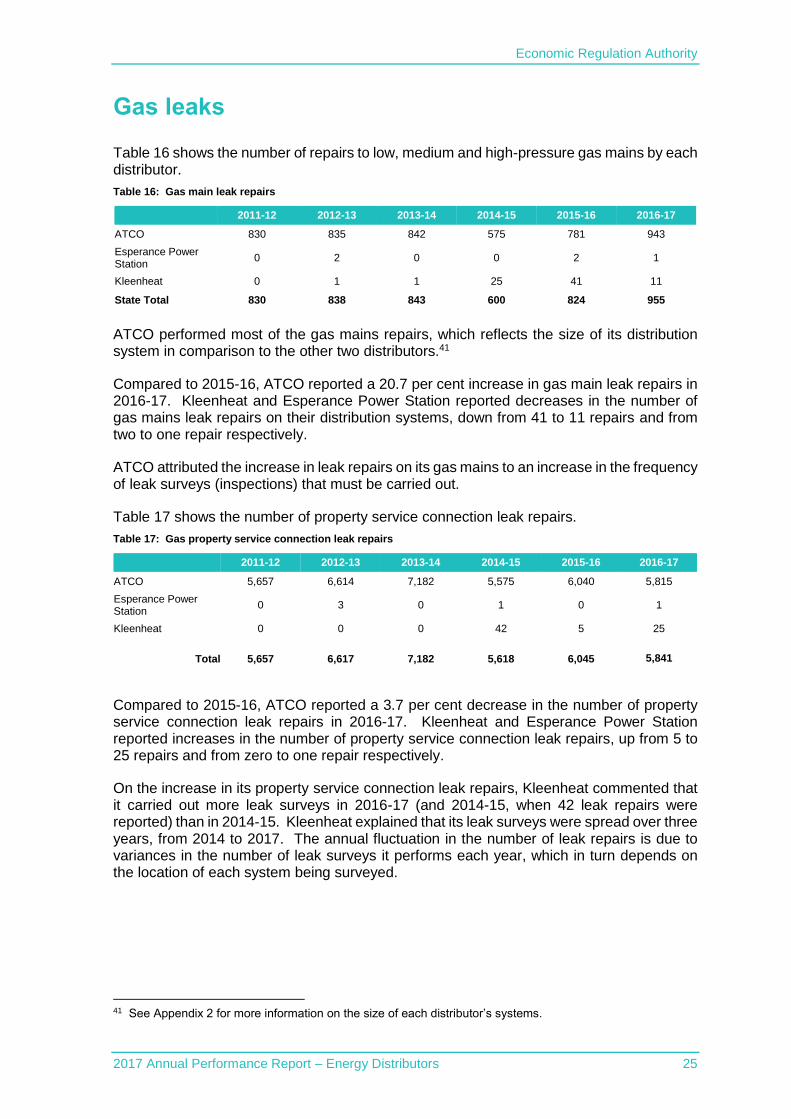
Table 16 shows the number of repairs to low, medium and high-pressure gas mains by each distributor.
Table 16: Gas main leak repairs
2011-12 2012-13 2013-14 2014-15 2015-16 2016-17
ATCO 830 835 842 575 781 943
Esperance Power Station
0 2 0 0 2 1
Kleenheat 0 1 1 25 41 11
State Total 830 838 843 600 824 955
ATCO performed most of the gas mains repairs, which reflects the size of its distribution system in comparison to the other two distributors.41
Compared to 2015-16, ATCO reported a 20.7 per cent increase in gas main leak repairs in 2016-17. Kleenheat and Esperance Power Station reported decreases in the number of gas mains leak repairs on their distribution systems, down from 41 to 11 repairs and from two to one repair respectively.
ATCO attributed the increase in leak repairs on its gas mains to an increase in the frequency of leak surveys (inspections) that must be carried out.
Table 17 shows the number of property service connection leak repairs.
Table 17: Gas property service connection leak repairs
2011-12 2012-13 2013-14 2014-15 2015-16 2016-17
ATCO 5,657 6,614 7,182 5,575 6,040 5,815
Esperance Power Station
0 3 0 1 0 1
Kleenheat 0 0 0 42 5 25
Total 5,657 6,617 7,182 5,618 6,045
5,841
Compared to 2015-16, ATCO reported a 3.7 per cent decrease in the number of property service connection leak repairs in 2016-17. Kleenheat and Esperance Power Station reported increases in the number of property service connection leak repairs, up from 5 to 25 repairs and from zero to one repair respectively.
On the increase in its property service connection leak repairs, Kleenheat commented that it carried out more leak surveys in 2016-17 (and 2014-15, when 42 leak repairs were reported) than in 2014-15. Kleenheat explained that its leak surveys were spread over three years, from 2014 to 2017. The annual fluctuation in the number of leak repairs is due to variances in the number of leak surveys it performs each year, which in turn depends on the location of each system being surveyed.
41 See Appendix 2 for more information on the size of each distributor’s systems.
Economic Regulation Authority
2017 Annual Performance Report – Energy Distributors 26
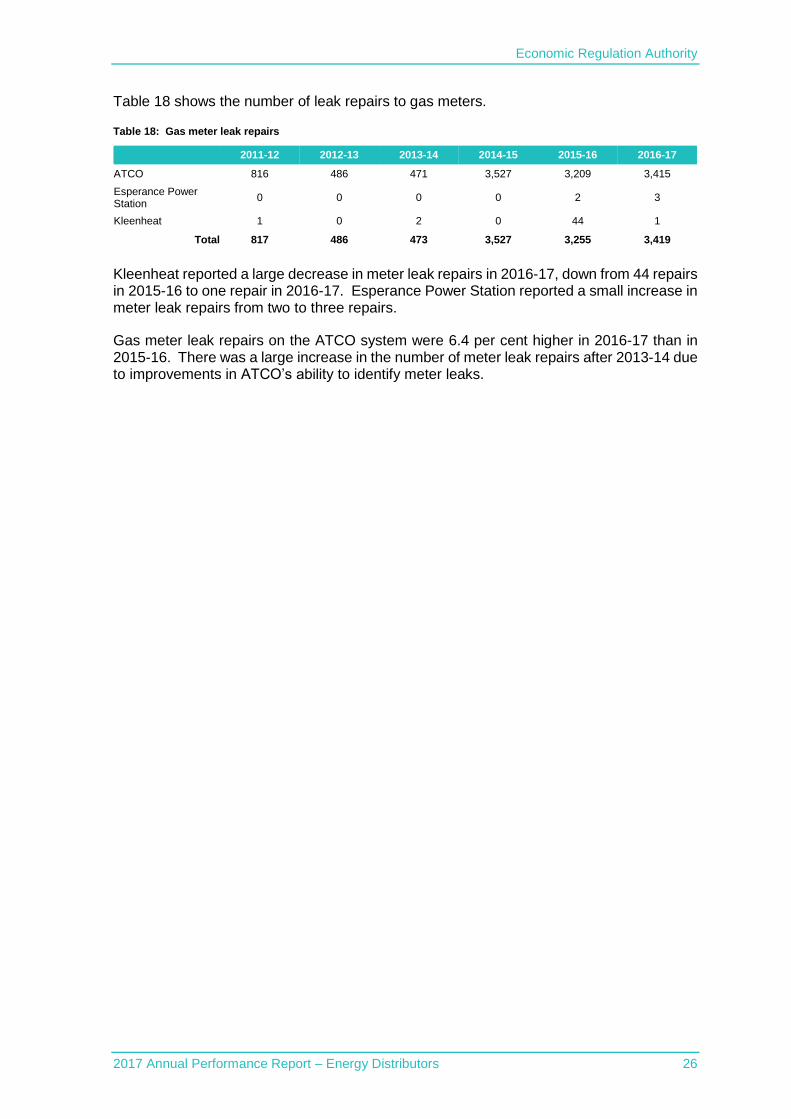
Table 18 shows the number of leak repairs to gas meters.
Table 18: Gas meter leak repairs
2011-12 2012-13 2013-14 2014-15 2015-16 2016-17
ATCO 816 486 471 3,527 3,209 3,415
Esperance Power Station
0 0 0 0 2 3
Kleenheat 1 0 2 0 44 1
Total 817 486 473 3,527 3,255 3,419
Kleenheat reported a large decrease in meter leak repairs in 2016-17, down from 44 repairs in 2015-16 to one repair in 2016-17. Esperance Power Station reported a small increase in meter leak repairs from two to three repairs.
Gas meter leak repairs on the ATCO system were 6.4 per cent higher in 2016-17 than in 2015-16. There was a large increase in the number of meter leak repairs after 2013-14 due to improvements in ATCO’s ability to identify meter leaks.
Economic Regulation Authority
2017 Annual Performance Report – Energy Distributors 27
Streetlight repairs
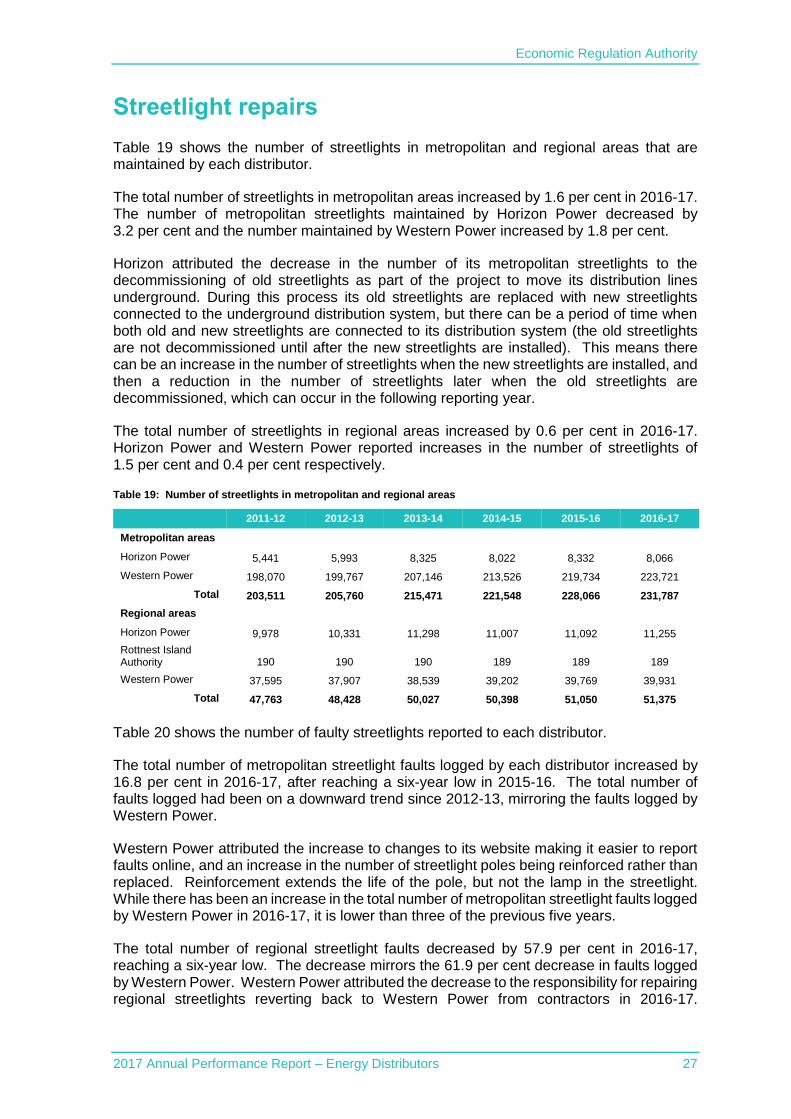
Table 19 shows the number of streetlights in metropolitan and regional areas that are maintained by each distributor.
The total number of streetlights in metropolitan areas increased by 1.6 per cent in 2016-17. The number of metropolitan streetlights maintained by Horizon Power decreased by 3.2 per cent and the number maintained by Western Power increased by 1.8 per cent.
Horizon attributed the decrease in the number of its metropolitan streetlights to the decommissioning of old streetlights as part of the project to move its distribution lines underground. During this process its old streetlights are replaced with new streetlights connected to the underground distribution system, but there can be a period of time when both old and new streetlights are connected to its distribution system (the old streetlights are not decommissioned until after the new streetlights are installed). This means there can be an increase in the number of streetlights when the new streetlights are installed, and then a reduction in the number of streetlights later when the old streetlights are decommissioned, which can occur in the following reporting year.
The total number of streetlights in regional areas increased by 0.6 per cent in 2016-17. Horizon Power and Western Power reported increases in the number of streetlights of 1.5 per cent and 0.4 per cent respectively.
Table 19: Number of streetlights in metropolitan and regional areas
2011-12 2012-13 2013-14 2014-15 2015-16 2016-17
Metropolitan areas
Horizon Power 5,441 5,993 8,325 8,022 8,332 8,066
Western Power 198,070 199,767 207,146 213,526 219,734 223,721
Total 203,511 205,760 215,471 221,548 228,066 231,787
Regional areas
Horizon Power 9,978 10,331 11,298 11,007 11,092 11,255
Rottnest Island Authority 190 190 190 189 189 189
Western Power 37,595 37,907 38,539 39,202 39,769 39,931
Total 47,763 48,428 50,027 50,398 51,050 51,375
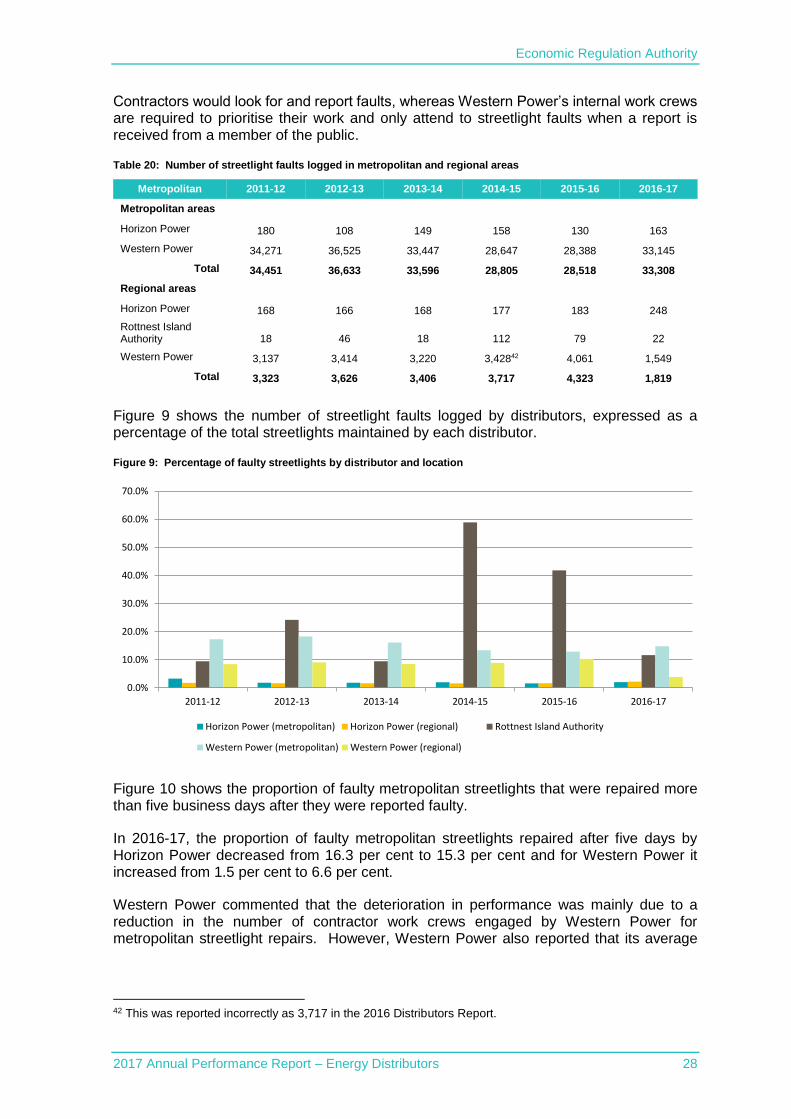
Table 20 shows the number of faulty streetlights reported to each distributor.
The total number of metropolitan streetlight faults logged by each distributor increased by 16.8 per cent in 2016-17, after reaching a six-year low in 2015-16. The total number of faults logged had been on a downward trend since 2012-13, mirroring the faults logged by Western Power.
Western Power attributed the increase to changes to its website making it easier to report faults online, and an increase in the number of streetlight poles being reinforced rather than replaced. Reinforcement extends the life of the pole, but not the lamp in the streetlight. While there has been an increase in the total number of metropolitan streetlight faults logged by Western Power in 2016-17, it is lower than three of the previous five years.
The total number of regional streetlight faults decreased by 57.9 per cent in 2016-17, reaching a six-year low. The decrease mirrors the 61.9 per cent decrease in faults logged by Western Power. Western Power attributed the decrease to the responsibility for repairing regional streetlights reverting back to Western Power from contractors in 2016-17.
Economic Regulation Authority
2017 Annual Performance Report – Energy Distributors 28
Contractors would look for and report faults, whereas Western Power’s internal work crews are required to prioritise their work and only attend to streetlight faults when a report is received from a member of the public.
Table 20: Number of streetlight faults logged in metropolitan and regional areas
Metropolitan 2011-12 2012-13 2013-14 2014-15 2015-16 2016-17
Metropolitan areas
Horizon Power 180 108 149 158 130 163
Western Power 34,271 36,525 33,447 28,647 28,388 33,145
Total 34,451 36,633 33,596 28,805 28,518 33,308
Regional areas
Horizon Power 168 166 168 177 183 248
Rottnest Island Authority 18 46 18 112 79 22
Western Power 3,137 3,414 3,220 3,42842 4,061 1,549
Total 3,323 3,626 3,406 3,717 4,323 1,819
Figure 9 shows the number of streetlight faults logged by distributors, expressed as a percentage of the total streetlights maintained by each distributor.
Figure 9: Percentage of faulty streetlights by distributor and location
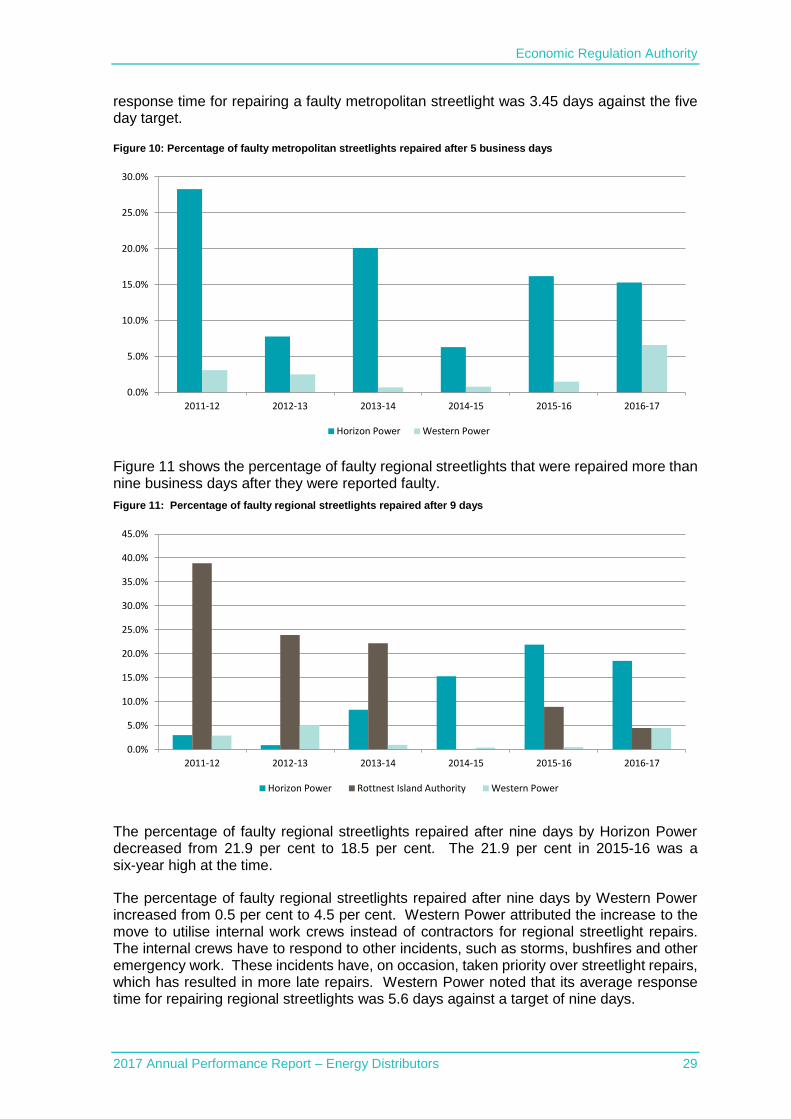
Figure 10 shows the proportion of faulty metropolitan streetlights that were repaired more than five business days after they were reported faulty.
In 2016-17, the proportion of faulty metropolitan streetlights repaired after five days by Horizon Power decreased from 16.3 per cent to 15.3 per cent and for Western Power it increased from 1.5 per cent to 6.6 per cent.
Western Power commented that the deterioration in performance was mainly due to a reduction in the number of contractor work crews engaged by Western Power for metropolitan streetlight repairs. However, Western Power also reported that its average
42 This was reported incorrectly as 3,717 in the 2016 Distributors Report.
0.0%
10.0%
20.0%
30.0%
40.0%
50.0%
60.0%
70.0%
2011-12 2012-13 2013-14 2014-15 2015-16 2016-17
Horizon Power (metropolitan) Horizon Power (regional) Rottnest Island Authority
Western Power (metropolitan) Western Power (regional)
Economic Regulation Authority
2017 Annual Performance Report – Energy Distributors 29
response time for repairing a faulty metropolitan streetlight was 3.45 days against the five day target.
Figure 10: Percentage of faulty metropolitan streetlights repaired after 5 business days
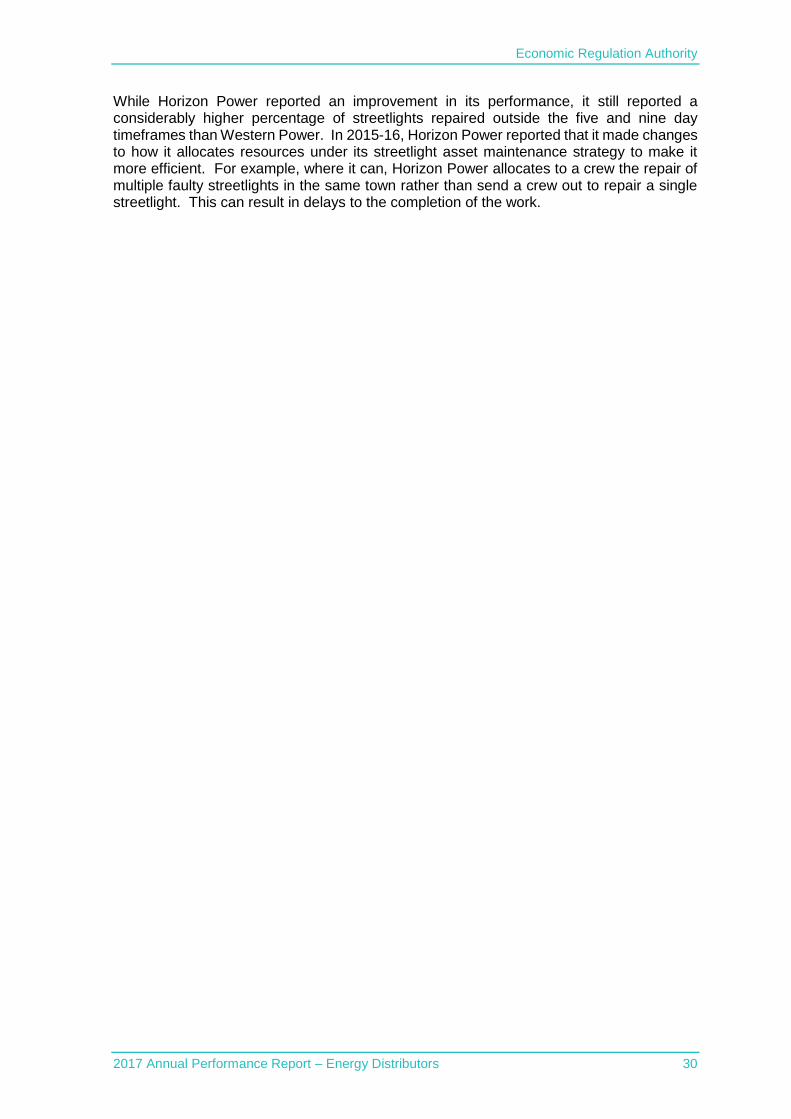
Figure 11 shows the percentage of faulty regional streetlights that were repaired more than nine business days after they were reported faulty.
Figure 11: Percentage of faulty regional streetlights repaired after 9 days
The percentage of faulty regional streetlights repaired after nine days by Horizon Power decreased from 21.9 per cent to 18.5 per cent. The 21.9 per cent in 2015-16 was a six-year high at the time.
The percentage of faulty regional streetlights repaired after nine days by Western Power increased from 0.5 per cent to 4.5 per cent. Western Power attributed the increase to the move to utilise internal work crews instead of contractors for regional streetlight repairs. The internal crews have to respond to other incidents, such as storms, bushfires and other emergency work. These incidents have, on occasion, taken priority over streetlight repairs, which has resulted in more late repairs. Western Power noted that its average response time for repairing regional streetlights was 5.6 days against a target of nine days.
0.0%
5.0%
10.0%
15.0%
20.0%
25.0%
30.0%
2011-12 2012-13 2013-14 2014-15 2015-16 2016-17
Horizon Power Western Power
0.0%
5.0%
10.0%
15.0%
20.0%
25.0%
30.0%
35.0%
40.0%
45.0%
2011-12 2012-13 2013-14 2014-15 2015-16 2016-17
Horizon Power Rottnest Island Authority Western Power
Economic Regulation Authority
2017 Annual Performance Report – Energy Distributors 30
While Horizon Power reported an improvement in its performance, it still reported a considerably higher percentage of streetlights repaired outside the five and nine day timeframes than Western Power. In 2015-16, Horizon Power reported that it made changes to how it allocates resources under its streetlight asset maintenance strategy to make it more efficient. For example, where it can, Horizon Power allocates to a crew the repair of multiple faulty streetlights in the same town rather than send a crew out to repair a single streetlight. This can result in delays to the completion of the work.
Economic Regulation Authority
2017 Annual Performance Report – Energy Distributors 31
Complaints
Both the electricity code and the gas compendium require distributors to have an internal process for handling complaints and resolving disputes that complies with Australian Standard AS ISO 10002 – 2014 (Guidelines for complaint management in organisations).
AS ISO 10002 – 2014 defines a complaint as:
An expression of dissatisfaction made to or about an organisation, related to its products, services, staff or the handling of a complaint, where a response or resolution is explicitly or implicitly expected or legally required.
When deciding whether a customer contact should be recorded as a complaint, distributors are encouraged to consider the ERA’s Customer Complaints Guidelines, which has information to help distinguish between queries, complaints and other customer communications.
A measure of the effectiveness of a distributor’s complaints handling process is how quickly a complaint is concluded.43 Distributors report on the percentage of complaints that are concluded within 15 business days.
Electricity complaints
The electricity code, NQ&R Code and the SCONRRR framework all include complaint recording and reporting obligations.
The electricity code requires distributors to report complaints information specified by the ERA.44 The ERA has specified two categories of complaints:
Administrative process or customer service complaints – includes meter reading issues, the timeliness of correspondence and other customer communications, issues with the complaints handling process, late responses to a complaint and general administrative matters.
Other complaints – includes poor service, privacy issues and health and safety issues.
The NQ&R Code focusses on the number of complaints received by a distributor that it has failed to comply with the NQ&R Code’s power quality and reliability standards.
The SCONRRR framework focuses on technical quality of supply (QoS) complaints, which are separated into eight categories:
Supply voltage (four categories) – low voltage, voltage swells, voltage dips and voltage spikes.
Waveform distortion.
TV or radio interference.
Noise from appliances.
Other.
43 A complaint is concluded when all of the relevant parts of the distributor’s complaints handling process have
been exercised in an attempt to resolve the complaint. 44 The specification of complaints reporting obligations is in the Electricity Distribution Licence Performance
Reporting Handbook and the Gas Distribution Licence Performance Reporting Handbook.

Economic Regulation Authority
2017 Annual Performance Report – Energy Distributors 32
Distributors are also required to report on the likely cause of the quality of supply complaints, which are separated into eight categories:
Network equipment faulty
Network interference by network service provider equipment
Network interference by another customer
Network limitation
Customer internal problem
No problem identified
Environmental
Other
SCONRRR framework complaints
Table 21 categorises the technical QoS complaints that have been received by Horizon Power and Western Power in 2016-17. QoS complaints received over the past six years is in Appendix 3, Table 53.45
In 2016-17, the majority of the complaints received by both distributors were categorised as “other” (technical matters which do not fall into the more specific complaint categories).
Table 21: Technical quality of service complaints received in 2016-17 by category
Horizon Power Western Power
Total number of technical QoS complaints 111 2,245
Complaint categories
Low supply voltage complaints 15 156
Voltage dip complaints 0 18
Voltage swell complaints 0 20
Voltage spike complaints 0 6
Waveform distortion complaints 0 0
TV or radio interference complaints 2 80
Noise from appliances complaints 0 0
Other complaints 94 1,965
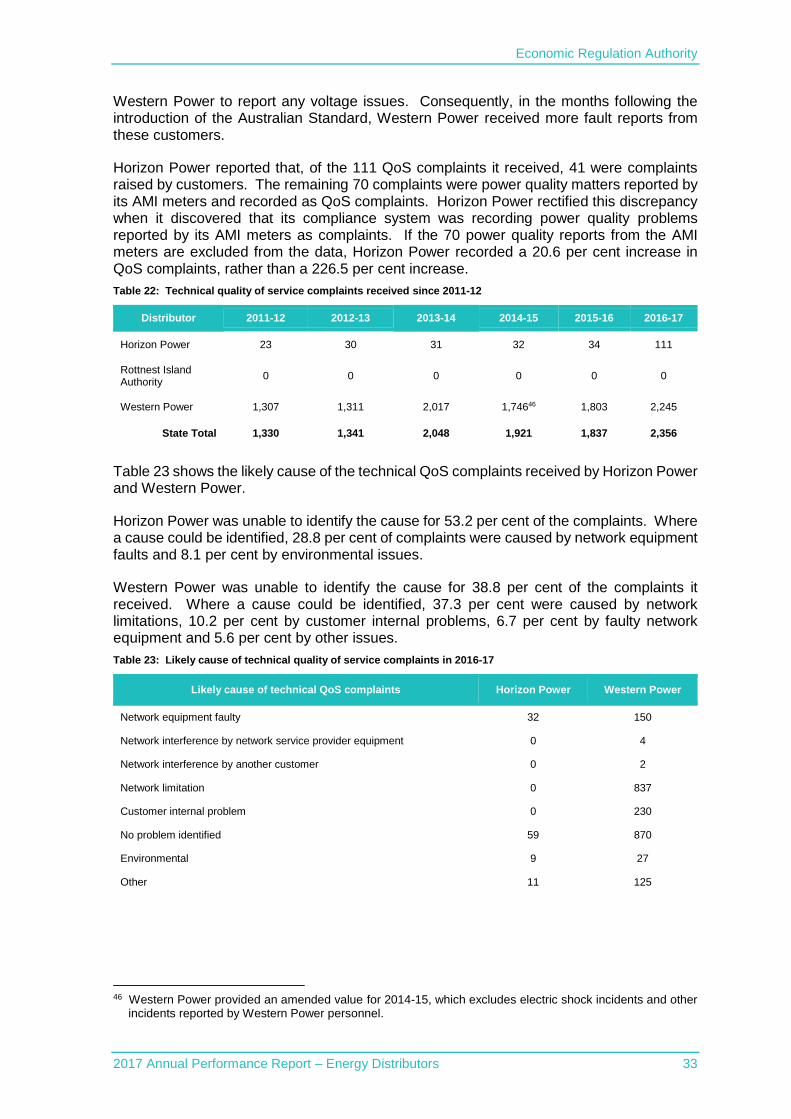
Table 22 shows the number of QoS complaints received by each distributor over the past six years.
Compared to 2015-16, Western Power and Horizon Power received 24.5 per cent and 226.5 per cent more QoS complaints respectively in 2016-17.
Western Power attributed the increase in complaints to high voltage faults reported by customers with inverters (for solar power systems). The increase in high voltage complaints (categorised under “other” in Table 21) was the result of Australian Standard AS/NZS 4777.2 being made mandatory on 9 October 2016 for new inverters connected to the low voltage network. Customers affected by the new Australian Standard were advised by
45 The Rottnest Island Authority has received only one QoS complaint in the past six years.
Economic Regulation Authority
2017 Annual Performance Report – Energy Distributors 33
Western Power to report any voltage issues. Consequently, in the months following the introduction of the Australian Standard, Western Power received more fault reports from these customers.
Horizon Power reported that, of the 111 QoS complaints it received, 41 were complaints raised by customers. The remaining 70 complaints were power quality matters reported by its AMI meters and recorded as QoS complaints. Horizon Power rectified this discrepancy when it discovered that its compliance system was recording power quality problems reported by its AMI meters as complaints. If the 70 power quality reports from the AMI meters are excluded from the data, Horizon Power recorded a 20.6 per cent increase in QoS complaints, rather than a 226.5 per cent increase.
Table 22: Technical quality of service complaints received since 2011-12
Distributor 2011-12 2012-13 2013-14 2014-15 2015-16 2016-17
Horizon Power 23 30 31 32 34 111
Rottnest Island Authority
0 0 0 0 0 0
Western Power 1,307 1,311 2,017 1,74646 1,803 2,245
State Total 1,330 1,341 2,048 1,921 1,837 2,356
Table 23 shows the likely cause of the technical QoS complaints received by Horizon Power and Western Power.
Horizon Power was unable to identify the cause for 53.2 per cent of the complaints. Where a cause could be identified, 28.8 per cent of complaints were caused by network equipment faults and 8.1 per cent by environmental issues.
Western Power was unable to identify the cause for 38.8 per cent of the complaints it received. Where a cause could be identified, 37.3 per cent were caused by network limitations, 10.2 per cent by customer internal problems, 6.7 per cent by faulty network equipment and 5.6 per cent by other issues.
Table 23: Likely cause of technical quality of service complaints in 2016-17
Likely cause of technical QoS complaints Horizon Power Western Power
Network equipment faulty 32 150
Network interference by network service provider equipment 0 4
Network interference by another customer 0 2
Network limitation 0 837
Customer internal problem 0 230
No problem identified 59 870
Environmental 9 27
Other 11 125
46 Western Power provided an amended value for 2014-15, which excludes electric shock incidents and other
incidents reported by Western Power personnel.
Economic Regulation Authority
2017 Annual Performance Report – Energy Distributors 34
Electricity code complaints
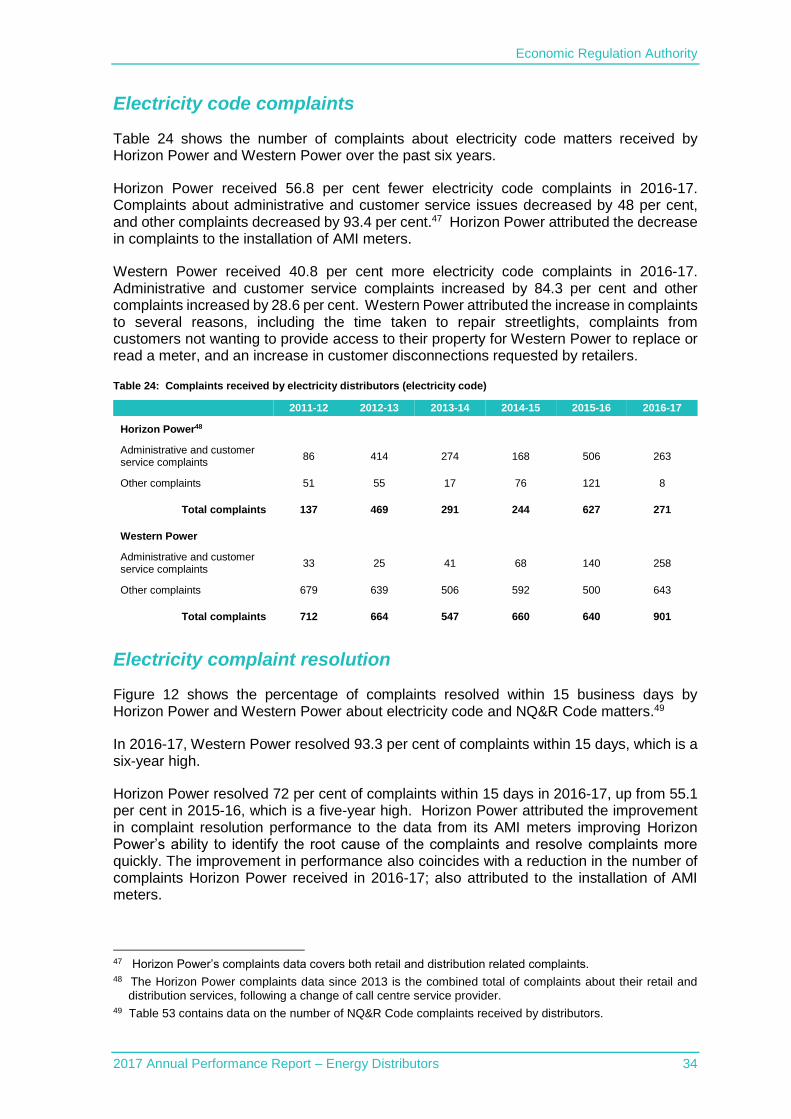
Table 24 shows the number of complaints about electricity code matters received by Horizon Power and Western Power over the past six years.
Horizon Power received 56.8 per cent fewer electricity code complaints in 2016-17. Complaints about administrative and customer service issues decreased by 48 per cent, and other complaints decreased by 93.4 per cent.47 Horizon Power attributed the decrease in complaints to the installation of AMI meters.
Western Power received 40.8 per cent more electricity code complaints in 2016-17. Administrative and customer service complaints increased by 84.3 per cent and other complaints increased by 28.6 per cent. Western Power attributed the increase in complaints to several reasons, including the time taken to repair streetlights, complaints from customers not wanting to provide access to their property for Western Power to replace or read a meter, and an increase in customer disconnections requested by retailers.
Table 24: Complaints received by electricity distributors (electricity code)
2011-12 2012-13 2013-14 2014-15 2015-16 2016-17
Horizon Power48
Administrative and customer service complaints
86 414 274 168 506 263
Other complaints 51 55 17 76 121 8
Total complaints 137 469 291 244 627 271
Western Power
Administrative and customer service complaints
33 25 41 68 140 258
Other complaints 679 639 506 592 500 643
Total complaints 712 664 547 660 640 901
Electricity complaint resolution
Figure 12 shows the percentage of complaints resolved within 15 business days by Horizon Power and Western Power about electricity code and NQ&R Code matters.49
In 2016-17, Western Power resolved 93.3 per cent of complaints within 15 days, which is a six-year high.
Horizon Power resolved 72 per cent of complaints within 15 days in 2016-17, up from 55.1 per cent in 2015-16, which is a five-year high. Horizon Power attributed the improvement in complaint resolution performance to the data from its AMI meters improving Horizon Power’s ability to identify the root cause of the complaints and resolve complaints more quickly. The improvement in performance also coincides with a reduction in the number of complaints Horizon Power received in 2016-17; also attributed to the installation of AMI meters.
47 Horizon Power’s complaints data covers both retail and distribution related complaints. 48 The Horizon Power complaints data since 2013 is the combined total of complaints about their retail and
distribution services, following a change of call centre service provider. 49 Table 53 contains data on the number of NQ&R Code complaints received by distributors.

Economic Regulation Authority
2017 Annual Performance Report – Energy Distributors 35
Figure 12: Electricity distributor complaints resolved within 15 business days (electricity code and NQ&R code)
Gas complaints
The complaint reporting obligations for gas distributors are in the Gas Distribution Licence Performance Reporting Handbook (gas handbook).
The gas handbook separates complaints into six categories:
Connection and augmentation - includes quality and timeliness of providing new service connections, or network augmentation works, and lack of capacity preventing a new connection to the system.
Reliability of supply – includes supply interruptions, both planned and unplanned.
Quality of supply – includes gas quality or supply pressure.
Network charges and costs – includes any fee or charge levied by the distributor for the service it provides.
Administrative processes or customer service - includes meter reading, timeliness of correspondence and other customer communications, the complaints handling process, timeliness of response to a complaint and any other process of a general administrative nature.
Other - includes poor service, privacy issues and health and safety issues.
Table 25 shows the total number of complaints received by gas distributors.
The number of complaints received by ATCO in 2016-17 increased by 0.6 per cent from 2015-16. In 2015-16, ATCO reported a 117.4 per cent increase in complaints from the previous year, following changes to its complaint definition and complaints handling procedure.50
50 2015-16 was the first full year that ATCO recorded complaints in accordance with its new complaint definition
and procedure to capture complaints that are resolved at first contact. ATCO implemented the system changes in January 2015, which meant the 2014-15 complaints data only covered a part year.
0.0
20.0
40.0
60.0
80.0
100.0
120.0
2011-12 2012-13 2013-14 2014-15 2015-16 2016-17
Pe
rce
nta
ge o
f C
om
pla
ints
Re
solv
ed
Horizon Power Western Power

Economic Regulation Authority
2017 Annual Performance Report – Energy Distributors 36
Table 25: Complaints received by gas distributors
Distributor 2011-12 2012-13 2013-14 2014-15 2015-16 2016-17
ATCO 36 25 25 236 513 516
Esperance Power Station
0 0 0 0 0 0
Kleenheat 2 0 0 3 1 4
State Total 38 25 25 239 514 520
Table 26 categorises the complaints received by ATCO and Kleenheat in 2016-17.
The majority of the complaints received by ATCO cover administrative and customer service (31.6 per cent) and other (51.2 per cent). The complaint category of “other” covers matters such as poor service, privacy issues, and health and safety issues.
Table 26: Categorisation of complaints received by gas distributors in 2016-17
Complaint Category ATCO Kleenheat
Complaint category
Connection and Augmentation 49 2
Reliability of Supply 26 2
Quality of Supply 4 0
Network Charges and Costs 10 0
Administrative Processes or Customer Service 163 0
Other 264 0
Total 516 4
Economic Regulation Authority
2017 Annual Performance Report – Energy Distributors 37
Call centre performance
A substantial amount of customers’ interaction with their distributor is by telephone. Consequently, a distributor’s responsiveness to telephone calls from customers is an important measure of customer service.
Larger distributors operate call centres, which employ operators to handle customer enquiries and complaints. These call centres may have sophisticated systems to monitor and report on primary responsiveness indicators, specifically:
Percentage of calls answered within 30 seconds.
Average duration before a call is answered, measured in seconds.
Percentage of unanswered calls.
Some call centres handle calls about other services provided by the distributor, or a related business, as well as distribution services. Therefore, it may not always be possible for distributors to separately report on their performance for distribution calls. In these circumstances the reported performance will be for all the calls handled by the call centre.
If the call centre uses Interactive Voice Response equipment51 to handle calls then the responsiveness measures only apply to those calls where the customer has selected an option to speak with an operator.
Smaller distributors offer a simpler telephone service, which is often based on the customer calling a switchboard which connects them to the appropriate contact person. This type of telephone service is not capable of producing responsiveness data.
Electricity distributor call centre performance
All three electricity distributors operate call centres. Horizon Power and the Rottnest Island Authority outsource their call centres to other service providers, while Western Power operates an in-house call centre.
The Rottnest Island Authority call centre handles calls for both retail and distribution without distinguishing between them, and also handles calls related to other areas of their business.
Table 27 shows the volume of calls received by each electricity distributor call centre. The total volume of calls received by distributor call centres was 3.8 per cent lower in 2016-17, and a six-year low.
Horizon Power was the only distributor to receive more calls in 2016-17. Call volume was up by 6.7 per cent compared to 2015-16. Horizon Power attributed the increase in call volume to the installation of its AMI meters, which enable it to remotely disconnect and reconnect a customer. This has increased the number of disconnections, as previously it was too expensive to visit some properties to manually disconnect them (for example, when a customer vacates a premises in a remote area). The increase in disconnections correlates with the increase in calls to the call centre.
51 Interactive Voice Response equipment allows a call centre telephone system to detect voice and keypad
tone signals and then respond with pre-recorded or dynamically generated audio to further direct callers to the service they require.
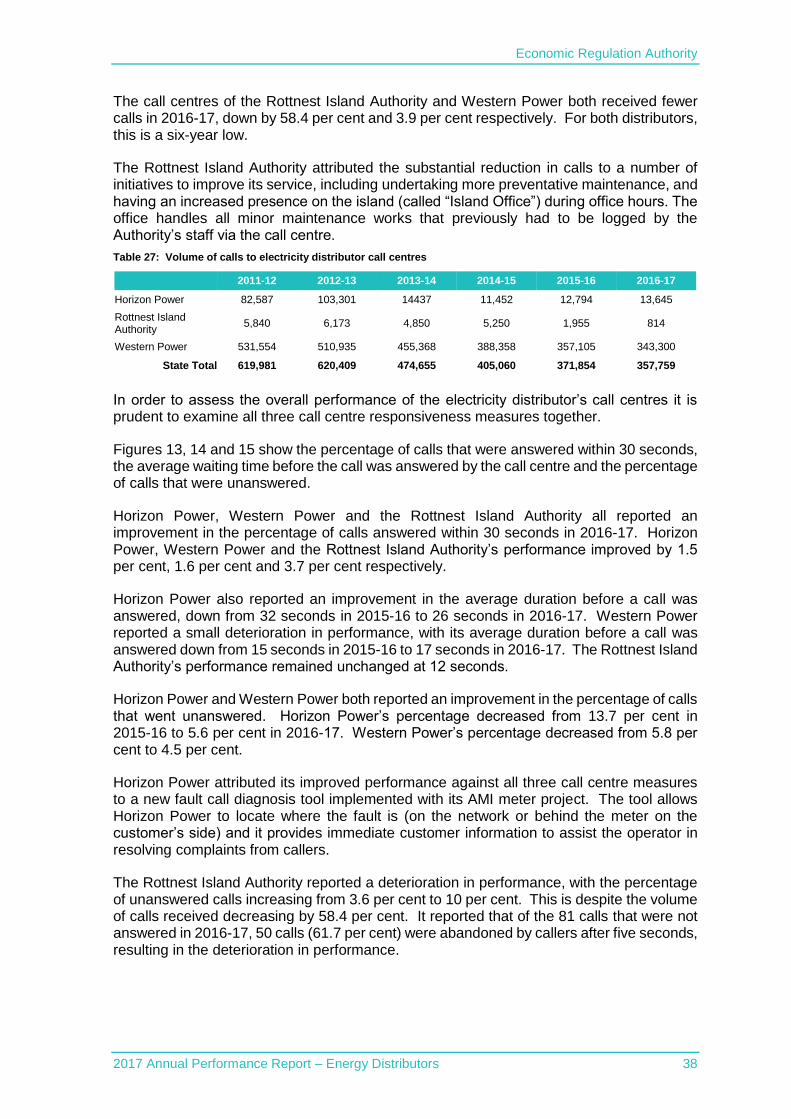
Economic Regulation Authority
2017 Annual Performance Report – Energy Distributors 38
The call centres of the Rottnest Island Authority and Western Power both received fewer calls in 2016-17, down by 58.4 per cent and 3.9 per cent respectively. For both distributors, this is a six-year low.
The Rottnest Island Authority attributed the substantial reduction in calls to a number of initiatives to improve its service, including undertaking more preventative maintenance, and having an increased presence on the island (called “Island Office”) during office hours. The office handles all minor maintenance works that previously had to be logged by the Authority’s staff via the call centre.
Table 27: Volume of calls to electricity distributor call centres
2011-12 2012-13 2013-14 2014-15 2015-16 2016-17
Horizon Power 82,587 103,301 14437 11,452 12,794 13,645
Rottnest Island Authority
5,840 6,173 4,850 5,250 1,955 814
Western Power 531,554 510,935 455,368 388,358 357,105 343,300
State Total 619,981 620,409 474,655 405,060 371,854 357,759
In order to assess the overall performance of the electricity distributor’s call centres it is prudent to examine all three call centre responsiveness measures together.
Figures 13, 14 and 15 show the percentage of calls that were answered within 30 seconds, the average waiting time before the call was answered by the call centre and the percentage of calls that were unanswered.
Horizon Power, Western Power and the Rottnest Island Authority all reported an improvement in the percentage of calls answered within 30 seconds in 2016-17. Horizon Power, Western Power and the Rottnest Island Authority’s performance improved by 1.5 per cent, 1.6 per cent and 3.7 per cent respectively.
Horizon Power also reported an improvement in the average duration before a call was answered, down from 32 seconds in 2015-16 to 26 seconds in 2016-17. Western Power reported a small deterioration in performance, with its average duration before a call was answered down from 15 seconds in 2015-16 to 17 seconds in 2016-17. The Rottnest Island Authority’s performance remained unchanged at 12 seconds.
Horizon Power and Western Power both reported an improvement in the percentage of calls that went unanswered. Horizon Power’s percentage decreased from 13.7 per cent in 2015-16 to 5.6 per cent in 2016-17. Western Power’s percentage decreased from 5.8 per cent to 4.5 per cent.
Horizon Power attributed its improved performance against all three call centre measures to a new fault call diagnosis tool implemented with its AMI meter project. The tool allows Horizon Power to locate where the fault is (on the network or behind the meter on the customer’s side) and it provides immediate customer information to assist the operator in resolving complaints from callers.
The Rottnest Island Authority reported a deterioration in performance, with the percentage of unanswered calls increasing from 3.6 per cent to 10 per cent. This is despite the volume of calls received decreasing by 58.4 per cent. It reported that of the 81 calls that were not answered in 2016-17, 50 calls (61.7 per cent) were abandoned by callers after five seconds, resulting in the deterioration in performance.
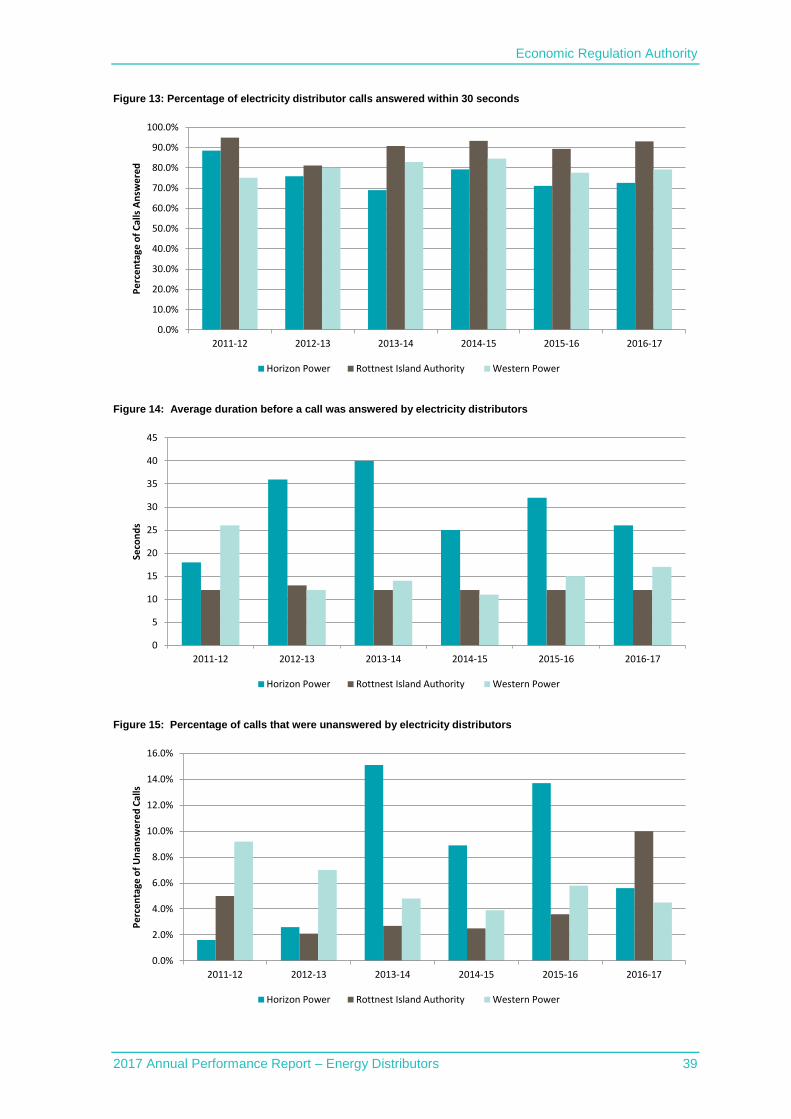
Economic Regulation Authority
2017 Annual Performance Report – Energy Distributors 39
Figure 13: Percentage of electricity distributor calls answered within 30 seconds
Figure 14: Average duration before a call was answered by electricity distributors
Figure 15: Percentage of calls that were unanswered by electricity distributors
0.0%
10.0%
20.0%
30.0%
40.0%
50.0%
60.0%
70.0%
80.0%
90.0%
100.0%
2011-12 2012-13 2013-14 2014-15 2015-16 2016-17
Pe
rce
nta
ge o
f C
alls
An
swe
red
Horizon Power Rottnest Island Authority Western Power
0
5
10
15
20
25
30
35
40
45
2011-12 2012-13 2013-14 2014-15 2015-16 2016-17
Seco
nd
s
Horizon Power Rottnest Island Authority Western Power
0.0%
2.0%
4.0%
6.0%
8.0%
10.0%
12.0%
14.0%
16.0%
2011-12 2012-13 2013-14 2014-15 2015-16 2016-17
Pe
rce
nta
ge o
f U
nan
swe
red
Cal
ls
Horizon Power Rottnest Island Authority Western Power

Economic Regulation Authority
2017 Annual Performance Report – Energy Distributors 40
Gas distributor call centre performance
ATCO and Kleenheat are the only gas distributors that operate call centres.
Caution is needed when interpreting the performance of the Kleenheat call centre, as it handles calls about its retail and distribution operations, as well as calls related to other areas of its business.
Table 28 shows the volume of calls received by the ATCO and Kleenheat call centres. The total volume of calls received by distributor call centres increased by 18.9 per cent in 2016-17. This is solely due to a 28.5 per cent increase in calls received by Kleenheat, which attributed the increase to customer growth in the residential natural gas market.52 ATCO reported a 6.3 per cent decrease in the number of calls received by its call centre.
Table 28: Volume of calls to gas distributor call centres
2011-12 2012-13 2013-14 2014-15 2015-16 2016-17
ATCO 65,098 66,933 77,388 84,106 84,685 79,316
Kleenheat 214,280 220,710 235,698 233,363 222,505 285,887
State Total 279,378 287,643 313,086 317,469 307,190 365,203
Figures 16, 17 and 18 show the percentage of calls that were answered by gas distributor call centres within 30 seconds, the average waiting time before the call was answered by the call centre and the percentage of calls that were unanswered.
The performance of both distributors’ call centres against all three measures in 2016-17 was broadly similar to previous years, with the exception of the measure for the average duration before a call was answered. For ATCO’s call centre, the average duration before a call was answered was down from 33 seconds to 21 seconds, a six-year low; and for Kleenheat’s call centre, it was up from 25 seconds to 32 seconds, a six-year high. Kleenheat attributed the increase to a rapid growth in its customer base resulting in more calls, while ATCO attributed its improved call centre performance to receiving fewer calls in 2016-17.
52 The majority of these calls relate to Kleenheat’s retail business.
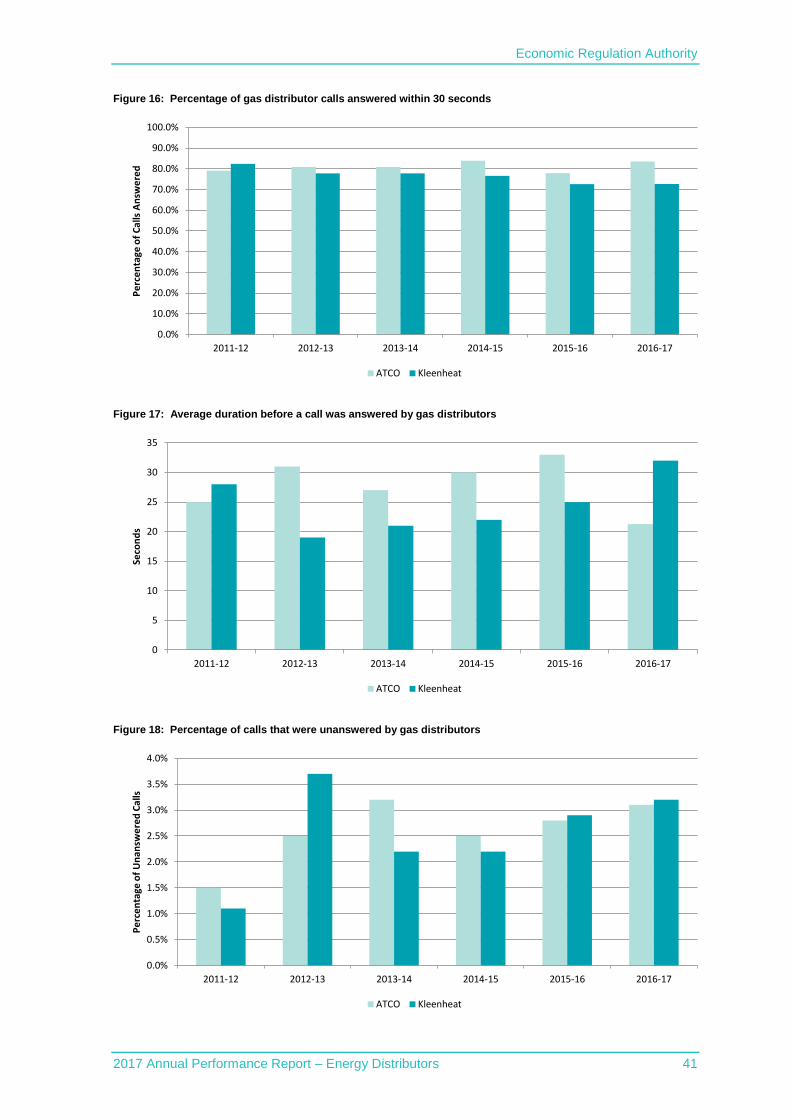
Economic Regulation Authority
2017 Annual Performance Report – Energy Distributors 41
Figure 16: Percentage of gas distributor calls answered within 30 seconds
Figure 17: Average duration before a call was answered by gas distributors
Figure 18: Percentage of calls that were unanswered by gas distributors
0.0%
10.0%
20.0%
30.0%
40.0%
50.0%
60.0%
70.0%
80.0%
90.0%
100.0%
2011-12 2012-13 2013-14 2014-15 2015-16 2016-17
Pe
rce
nta
ge o
f C
alls
An
swe
red
ATCO Kleenheat
0
5
10
15
20
25
30
35
2011-12 2012-13 2013-14 2014-15 2015-16 2016-17
Seco
nd
s
ATCO Kleenheat
0.0%
0.5%
1.0%
1.5%
2.0%
2.5%
3.0%
3.5%
4.0%
2011-12 2012-13 2013-14 2014-15 2015-16 2016-17
Pe
rce
nta
ge o
f U
nan
swe
red
Cal
ls
ATCO Kleenheat
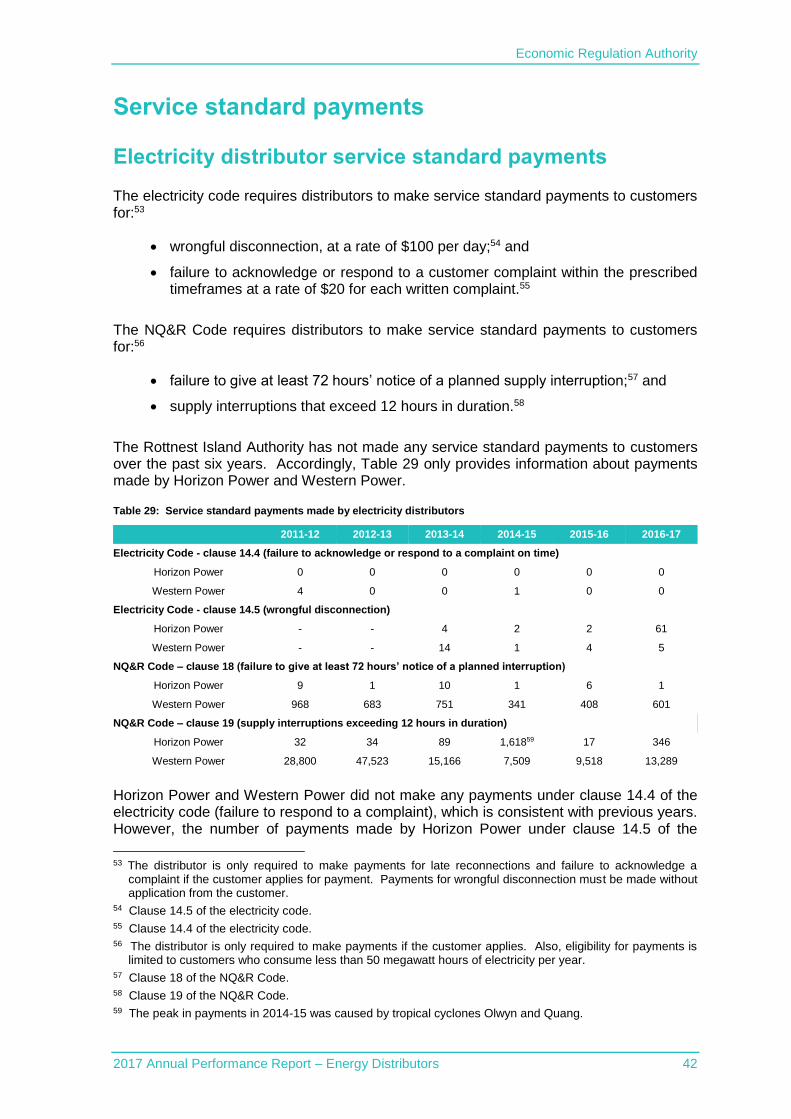
Economic Regulation Authority
2017 Annual Performance Report – Energy Distributors 42
Service standard payments
Electricity distributor service standard payments
The electricity code requires distributors to make service standard payments to customers for:53
wrongful disconnection, at a rate of $100 per day;54 and
failure to acknowledge or respond to a customer complaint within the prescribed timeframes at a rate of $20 for each written complaint.55
The NQ&R Code requires distributors to make service standard payments to customers for:56
failure to give at least 72 hours’ notice of a planned supply interruption;57 and
supply interruptions that exceed 12 hours in duration.58
The Rottnest Island Authority has not made any service standard payments to customers over the past six years. Accordingly, Table 29 only provides information about payments made by Horizon Power and Western Power.
Table 29: Service standard payments made by electricity distributors
2011-12 2012-13 2013-14 2014-15 2015-16 2016-17
Electricity Code - clause 14.4 (failure to acknowledge or respond to a complaint on time)
Horizon Power 0 0 0 0 0 0
Western Power 4 0 0 1 0 0
Electricity Code - clause 14.5 (wrongful disconnection)
Horizon Power - - 4 2 2 61
Western Power - - 14 1 4 5
NQ&R Code – clause 18 (failure to give at least 72 hours’ notice of a planned interruption)
Horizon Power 9 1 10 1 6 1
Western Power 968 683 751 341 408 601
NQ&R Code – clause 19 (supply interruptions exceeding 12 hours in duration)
Horizon Power 32 34 89 1,61859 17 346
Western Power 28,800 47,523 15,166 7,509 9,518 13,289
Horizon Power and Western Power did not make any payments under clause 14.4 of the electricity code (failure to respond to a complaint), which is consistent with previous years. However, the number of payments made by Horizon Power under clause 14.5 of the
53 The distributor is only required to make payments for late reconnections and failure to acknowledge a
complaint if the customer applies for payment. Payments for wrongful disconnection must be made without application from the customer.
54 Clause 14.5 of the electricity code. 55 Clause 14.4 of the electricity code. 56 The distributor is only required to make payments if the customer applies. Also, eligibility for payments is
limited to customers who consume less than 50 megawatt hours of electricity per year. 57 Clause 18 of the NQ&R Code. 58 Clause 19 of the NQ&R Code. 59 The peak in payments in 2014-15 was caused by tropical cyclones Olwyn and Quang.

Economic Regulation Authority
2017 Annual Performance Report – Energy Distributors 43
electricity code (wrongful disconnection) increased from two payments in 2015-16 to 61 payments in 2016-17. Horizon Power attributed the increase in payments to a system error that wrongfully disconnected 59 pre-payment meter customers.
The number of payments made by Horizon Power under section 19 of the NQ&R Code (interruptions greater than 12 hours) increased from 17 payments in 2015-16 to 346 payments in 2016-17. Horizon Power attributed the substantial increase in payments to three outages greater than 12 hours in Fitzroy Crossing (fire), Yungngora (flooding) and Karratha (blown ring main unit).
Western Power made more payments under sections 18 and 19 of the NQ&R Code in 2016-17 than in 2015-16. Payments under section 18 were 47.3 per cent higher in 2016-17, while payments under section 19 of the NQ&R Code were 39.6 per cent higher. Western Power explained that the increase in payments was:
[…] predominantly due to storm activity and pole top fires.60
Western Power also attributed the increase in payments to the improvements it made to its website to make it easier for customers to apply for payments.
60 Western Power, Annual Reliability and Power Quality Report (for the year ended 30 June 2017), section 8.2.

Economic Regulation Authority
2017 Annual Performance Report – Energy Distributors 44
Appendices
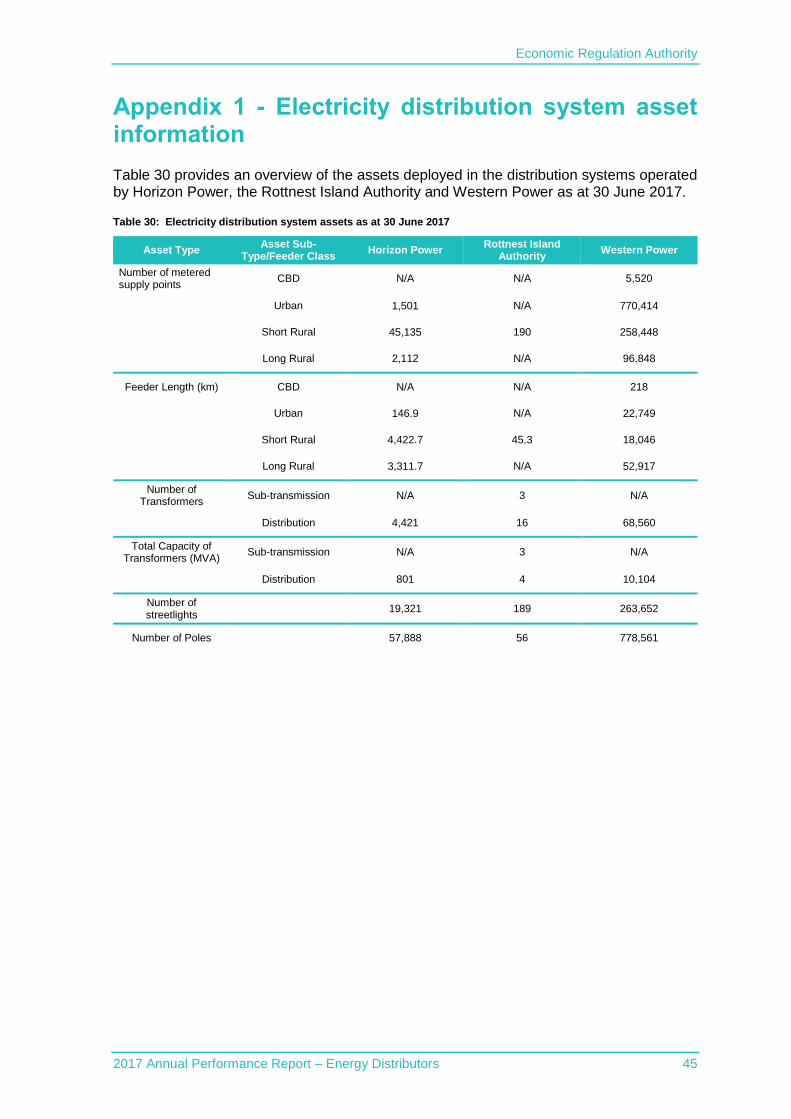
Economic Regulation Authority
2017 Annual Performance Report – Energy Distributors 45
Appendix 1 - Electricity distribution system asset information
Table 30 provides an overview of the assets deployed in the distribution systems operated by Horizon Power, the Rottnest Island Authority and Western Power as at 30 June 2017.
Table 30: Electricity distribution system assets as at 30 June 2017
Asset Type Asset Sub-
Type/Feeder Class Horizon Power
Rottnest Island Authority
Western Power
Number of metered supply points
CBD N/A N/A 5,520
Urban 1,501 N/A 770,414
Short Rural 45,135 190 258,448
Long Rural 2,112 N/A 96,848
Feeder Length (km) CBD N/A N/A 218
Urban 146.9 N/A 22,749
Short Rural 4,422.7 45.3 18,046
Long Rural 3,311.7 N/A 52,917
Number of Transformers
Sub-transmission N/A 3 N/A
Distribution 4,421 16 68,560
Total Capacity of Transformers (MVA)
Sub-transmission N/A 3 N/A
Distribution 801 4 10,104
Number of streetlights
19,321 189 263,652
Number of Poles 57,888 56 778,561
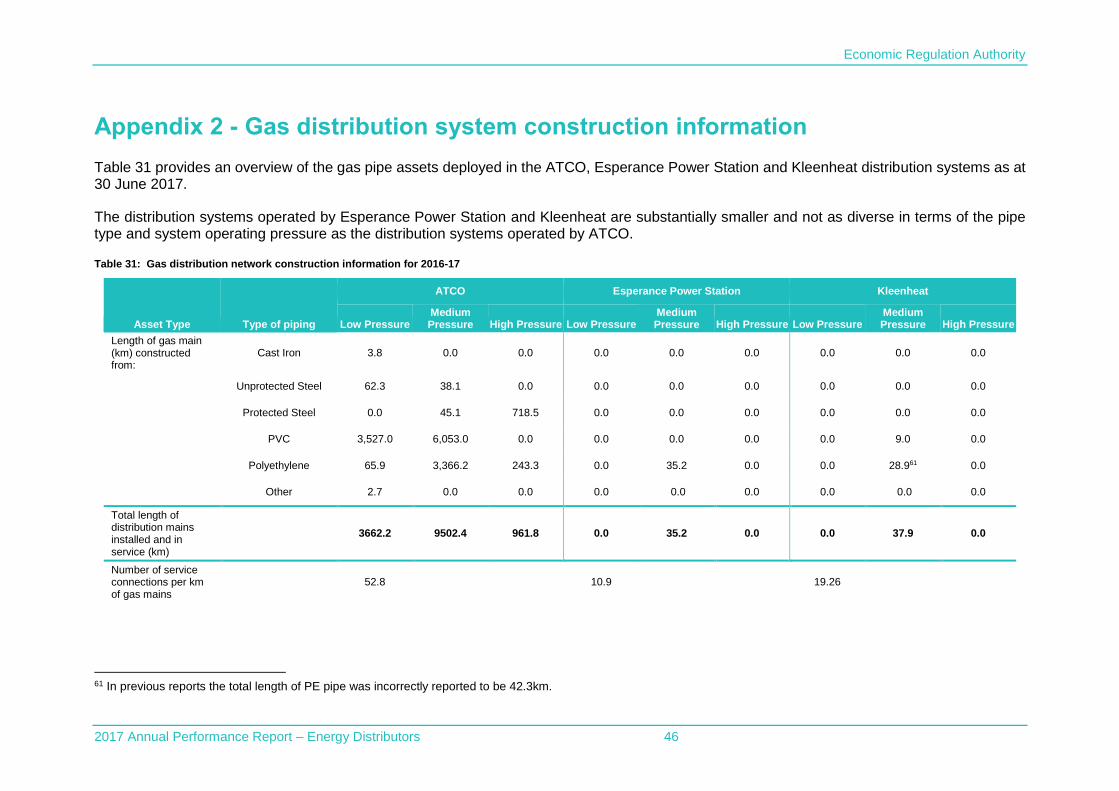
Economic Regulation Authority
2017 Annual Performance Report – Energy Distributors 46
Appendix 2 - Gas distribution system construction information
Table 31 provides an overview of the gas pipe assets deployed in the ATCO, Esperance Power Station and Kleenheat distribution systems as at 30 June 2017.
The distribution systems operated by Esperance Power Station and Kleenheat are substantially smaller and not as diverse in terms of the pipe type and system operating pressure as the distribution systems operated by ATCO.
Table 31: Gas distribution network construction information for 2016-17
Asset Type Type of piping
ATCO Esperance Power Station Kleenheat
Low Pressure Medium Pressure High Pressure Low Pressure
Medium Pressure High Pressure Low Pressure
Medium Pressure High Pressure
Length of gas main (km) constructed from:
Cast Iron 3.8 0.0 0.0 0.0 0.0 0.0 0.0 0.0 0.0
Unprotected Steel 62.3 38.1 0.0 0.0 0.0 0.0 0.0 0.0 0.0
Protected Steel 0.0 45.1 718.5 0.0 0.0 0.0 0.0 0.0 0.0
PVC 3,527.0 6,053.0 0.0 0.0 0.0 0.0 0.0 9.0 0.0
Polyethylene 65.9 3,366.2 243.3 0.0 35.2 0.0 0.0 28.961 0.0
Other 2.7 0.0 0.0 0.0 0.0 0.0 0.0 0.0 0.0
Total length of distribution mains installed and in service (km)
3662.2 9502.4 961.8 0.0 35.2 0.0 0.0 37.9 0.0
Number of service connections per km of gas mains
52.8 10.9 19.26
61 In previous reports the total length of PE pipe was incorrectly reported to be 42.3km.
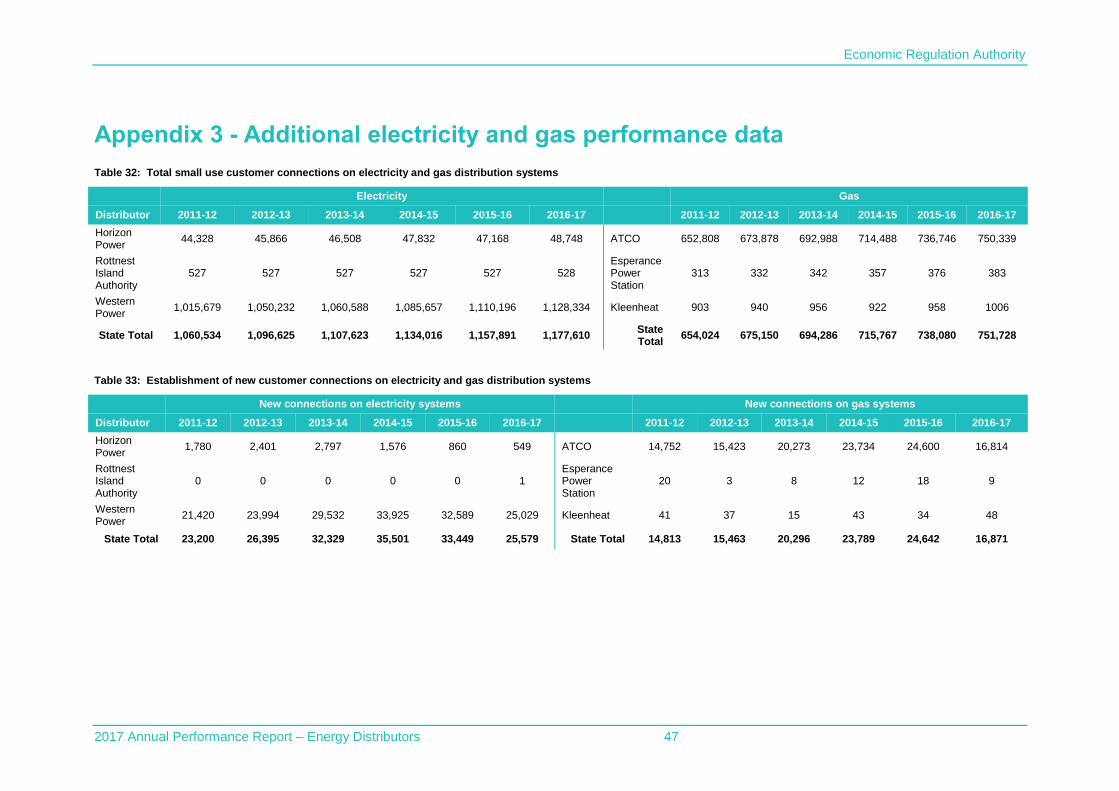
Economic Regulation Authority
2017 Annual Performance Report – Energy Distributors 47
Appendix 3 - Additional electricity and gas performance data
Table 32: Total small use customer connections on electricity and gas distribution systems
Electricity Gas
Distributor 2011-12 2012-13 2013-14 2014-15 2015-16 2016-17 2011-12 2012-13 2013-14 2014-15 2015-16 2016-17
Horizon Power
44,328 45,866 46,508 47,832 47,168 48,748 ATCO 652,808 673,878 692,988 714,488 736,746 750,339
Rottnest Island Authority
527 527 527 527 527 528 Esperance Power Station
313 332 342 357 376 383
Western Power
1,015,679 1,050,232 1,060,588 1,085,657 1,110,196 1,128,334 Kleenheat 903 940 956 922 958 1006
State Total 1,060,534 1,096,625 1,107,623 1,134,016 1,157,891 1,177,610 State Total
654,024 675,150 694,286 715,767 738,080 751,728
Table 33: Establishment of new customer connections on electricity and gas distribution systems
New connections on electricity systems New connections on gas systems
Distributor 2011-12 2012-13 2013-14 2014-15 2015-16 2016-17 2011-12 2012-13 2013-14 2014-15 2015-16 2016-17
Horizon Power
1,780 2,401 2,797 1,576 860 549 ATCO 14,752 15,423 20,273 23,734 24,600 16,814
Rottnest Island Authority
0 0 0 0 0 1 Esperance Power Station
20 3 8 12 18 9
Western Power
21,420 23,994 29,532 33,925 32,589 25,029 Kleenheat 41 37 15 43 34 48
State Total 23,200 26,395 32,329 35,501 33,449 25,579 State Total 14,813 15,463 20,296 23,789 24,642 16,871
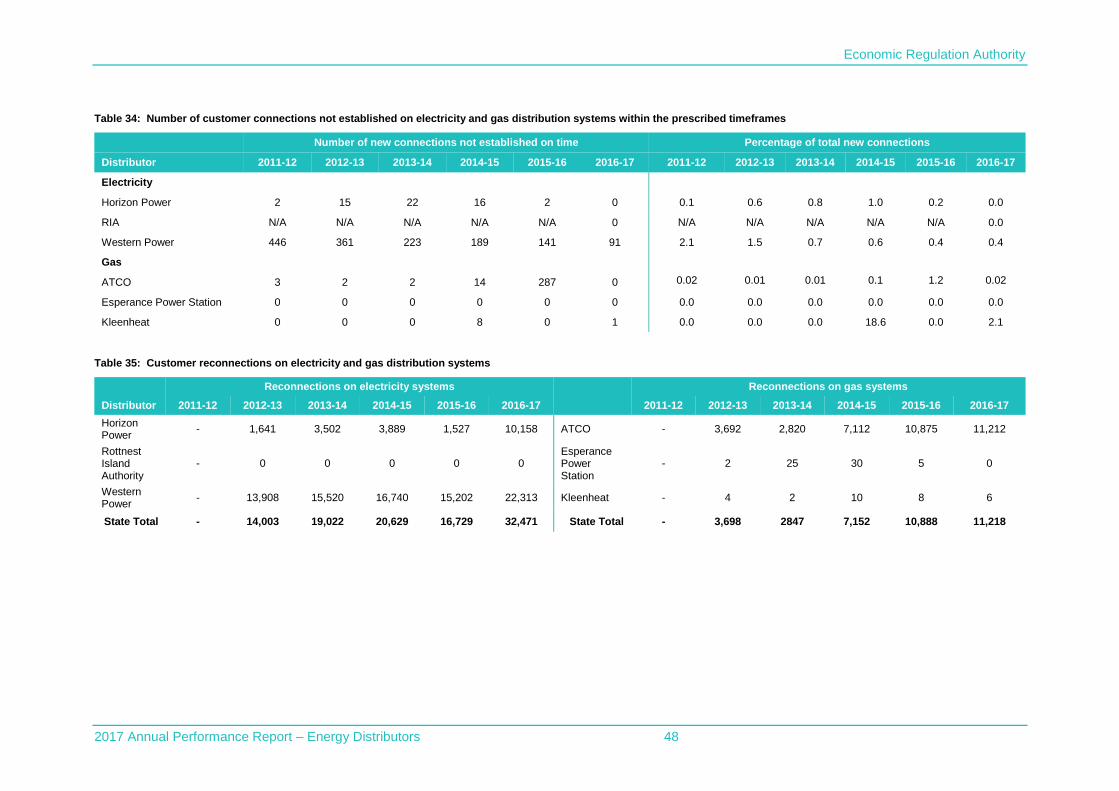
Economic Regulation Authority
2017 Annual Performance Report – Energy Distributors 48
Table 34: Number of customer connections not established on electricity and gas distribution systems within the prescribed timeframes
Number of new connections not established on time Percentage of total new connections
Distributor 2011-12 2012-13 2013-14 2014-15 2015-16 2016-17 2011-12 2012-13 2013-14 2014-15 2015-16 2016-17
Electricity
Horizon Power 2 15 22 16 2 0 0.1 0.6 0.8 1.0 0.2 0.0
RIA N/A N/A N/A N/A N/A 0 N/A N/A N/A N/A N/A 0.0
Western Power 446 361 223 189 141 91 2.1 1.5 0.7 0.6 0.4 0.4
Gas
ATCO 3 2 2 14 287 0 0.02 0.01 0.01 0.1 1.2 0.02
Esperance Power Station 0 0 0 0 0 0 0.0 0.0 0.0 0.0 0.0 0.0
Kleenheat 0 0 0 8 0 1 0.0 0.0 0.0 18.6 0.0 2.1
Table 35: Customer reconnections on electricity and gas distribution systems
Reconnections on electricity systems Reconnections on gas systems
Distributor 2011-12 2012-13 2013-14 2014-15 2015-16 2016-17 2011-12 2012-13 2013-14 2014-15 2015-16 2016-17
Horizon Power
- 1,641 3,502 3,889 1,527 10,158 ATCO - 3,692 2,820 7,112 10,875 11,212
Rottnest Island Authority
- 0 0 0 0 0 Esperance Power Station
- 2 25 30 5 0
Western Power
- 13,908 15,520 16,740 15,202 22,313 Kleenheat - 4 2 10 8 6
State Total - 14,003 19,022 20,629 16,729 32,471 State Total - 3,698 2847 7,152 10,888 11,218
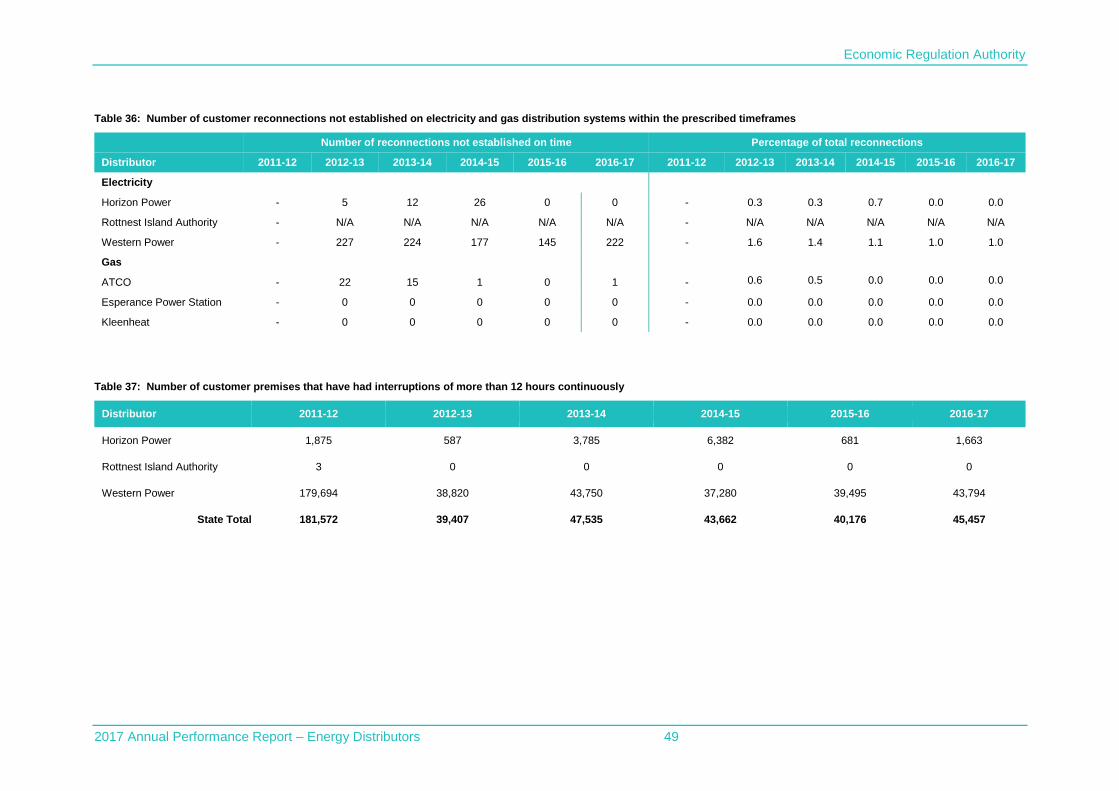
Economic Regulation Authority
2017 Annual Performance Report – Energy Distributors 49
Table 36: Number of customer reconnections not established on electricity and gas distribution systems within the prescribed timeframes
Number of reconnections not established on time Percentage of total reconnections
Distributor 2011-12 2012-13 2013-14 2014-15 2015-16 2016-17 2011-12 2012-13 2013-14 2014-15 2015-16 2016-17
Electricity
Horizon Power - 5 12 26 0 0 - 0.3 0.3 0.7 0.0 0.0
Rottnest Island Authority - N/A N/A N/A N/A N/A - N/A N/A N/A N/A N/A
Western Power - 227 224 177 145 222 - 1.6 1.4 1.1 1.0 1.0
Gas
ATCO - 22 15 1 0 1 - 0.6 0.5 0.0 0.0 0.0
Esperance Power Station - 0 0 0 0 0 - 0.0 0.0 0.0 0.0 0.0
Kleenheat - 0 0 0 0 0 - 0.0 0.0 0.0 0.0 0.0
Table 37: Number of customer premises that have had interruptions of more than 12 hours continuously
Distributor 2011-12 2012-13 2013-14 2014-15 2015-16 2016-17
Horizon Power 1,875 587 3,785 6,382 681 1,663
Rottnest Island Authority 3 0 0 0 0 0
Western Power 179,694 38,820 43,750 37,280 39,495 43,794
State Total 181,572 39,407 47,535 43,662 40,176 45,457
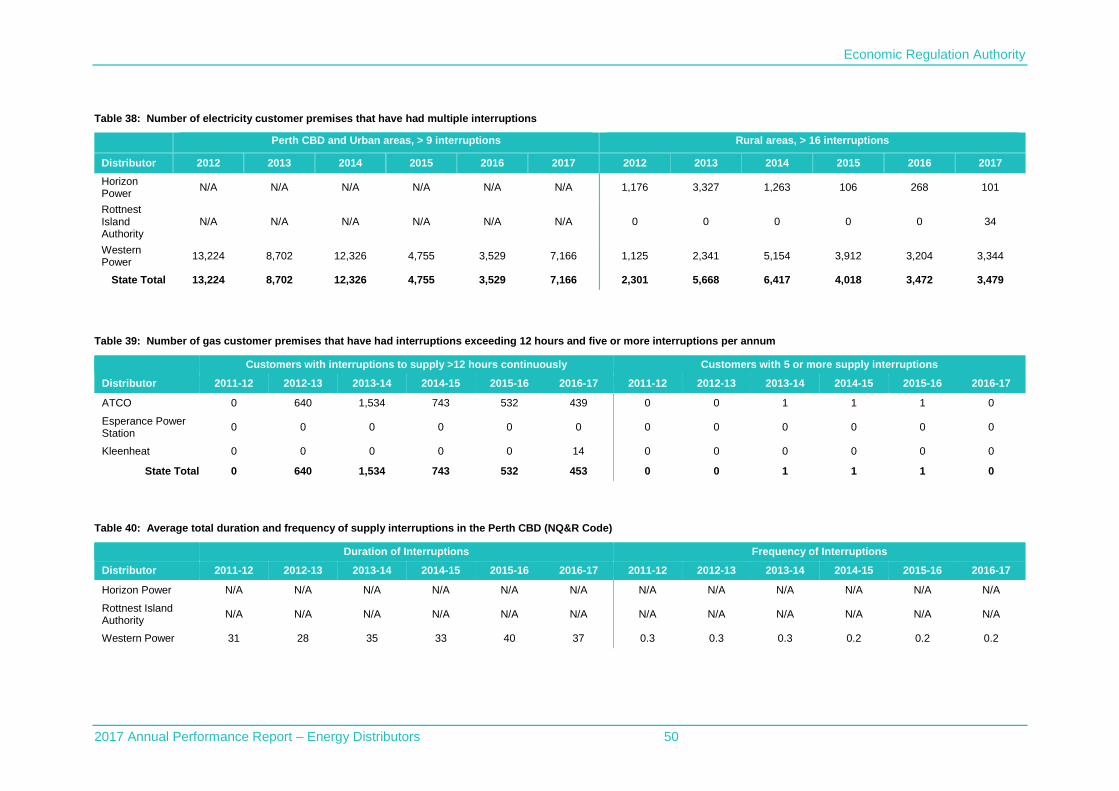
Economic Regulation Authority
2017 Annual Performance Report – Energy Distributors 50
Table 38: Number of electricity customer premises that have had multiple interruptions
Perth CBD and Urban areas, > 9 interruptions Rural areas, > 16 interruptions
Distributor 2012 2013 2014 2015 2016 2017 2012 2013 2014 2015 2016 2017
Horizon Power
N/A N/A N/A N/A N/A N/A 1,176 3,327 1,263 106 268 101
Rottnest Island Authority
N/A N/A N/A N/A N/A N/A 0 0 0 0 0 34
Western Power
13,224 8,702 12,326 4,755 3,529 7,166 1,125 2,341 5,154 3,912 3,204 3,344
State Total 13,224 8,702 12,326 4,755 3,529 7,166 2,301 5,668 6,417 4,018 3,472 3,479
Table 39: Number of gas customer premises that have had interruptions exceeding 12 hours and five or more interruptions per annum
Customers with interruptions to supply >12 hours continuously Customers with 5 or more supply interruptions
Distributor 2011-12 2012-13 2013-14 2014-15 2015-16 2016-17 2011-12 2012-13 2013-14 2014-15 2015-16 2016-17
ATCO 0 640 1,534 743 532 439 0 0 1 1 1 0
Esperance Power Station
0 0 0 0 0 0 0 0 0 0 0 0
Kleenheat 0 0 0 0 0 14 0 0 0 0 0 0
State Total 0 640 1,534 743 532 453 0 0 1 1 1 0
Table 40: Average total duration and frequency of supply interruptions in the Perth CBD (NQ&R Code)
Duration of Interruptions Frequency of Interruptions
Distributor 2011-12 2012-13 2013-14 2014-15 2015-16 2016-17 2011-12 2012-13 2013-14 2014-15 2015-16 2016-17
Horizon Power N/A N/A N/A N/A N/A N/A N/A N/A N/A N/A N/A N/A
Rottnest Island Authority
N/A N/A N/A N/A N/A N/A N/A N/A N/A N/A N/A N/A
Western Power 31 28 35 33 40 37 0.3 0.3 0.3 0.2 0.2 0.2

Economic Regulation Authority
2017 Annual Performance Report – Energy Distributors 51
Table 41: Average total duration and frequency of supply interruptions in the urban Areas (NQ&R Code)
Duration of Interruptions Frequency of Interruptions
Distributor 2011-12 2012-13 2013-14 2014-15 2015-16 2016-17 2011-12 2012-13 2013-14 2014-15 2015-16 2016-17
Horizon Power N/A N/A N/A N/A N/A N/A N/A N/A N/A N/A N/A N/A
Rottnest Island Authority
N/A N/A N/A N/A N/A N/A N/A N/A N/A N/A N/A N/A
Western Power 405 390 343 326 249 244 2.6 2.4 2.2 2.1 1.9 1.8
Table 42: Average total duration and frequency of supply interruptions in the other areas of the State (NQ&R Code)
Duration of Interruptions Frequency of Interruptions
Distributor 2011-12 2012-13 2013-14 2014-15 2015-16 2016-17 2011-12 2012-13 2013-14 2014-15 2015-16 2016-17
Horizon Power 302 318 330 373 359 338 3.8 4.1 3.9 3.8 3.7 3.3
Rottnest Island Authority
226 76 62 62 136 386 4 5.1 3.6 2.2 3.7 6.4
Western Power 947 979 1,020 1,030 992 997 5.1 5.3 5.2 5.4 5.4 5.2
Table 43: Average total duration and frequency of supply interruptions in isolated systems (NQ&R Code)
Duration of Interruptions Frequency of Interruptions
Distributor 2011-12 2012-13 2013-14 2014-15 2015-16 2016-17 2011-12 2012-13 2013-14 2014-15 2015-16 2016-17
Horizon Power N/A N/A N/A N/A N/A N/A N/A N/A N/A N/A N/A N/A
Rottnest Island Authority
N/A N/A N/A N/A N/A N/A N/A N/A N/A N/A N/A N/A
Western Power N/A 53762 505 N/A N/A N/A N/A 11.6 16.7 N/A N/A N/A
62 In 2012-13 and 2013-14, Western Power reported reliability performance data for customers in Ravensthorpe and Bremer Bay, which were islanded from Western Power’s
network during this period to allow for network upgrades to improve reliability of supply. These two areas were considered “isolated systems” for the purposes of the NQ&R Code.
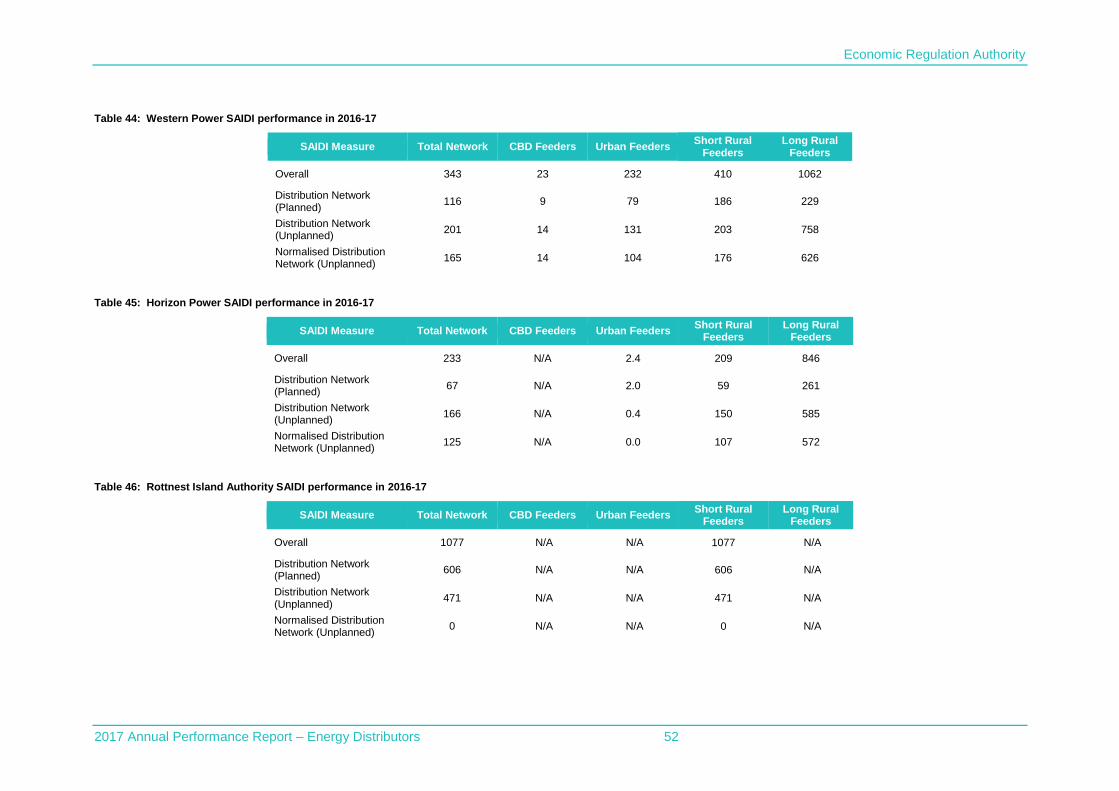
Economic Regulation Authority
2017 Annual Performance Report – Energy Distributors 52
Table 44: Western Power SAIDI performance in 2016-17
SAIDI Measure Total Network CBD Feeders Urban Feeders Short Rural
Feeders Long Rural
Feeders
Overall 343 23 232 410 1062
Distribution Network (Planned)
116 9 79 186 229
Distribution Network (Unplanned)
201 14 131 203 758
Normalised Distribution Network (Unplanned)
165 14 104 176 626
Table 45: Horizon Power SAIDI performance in 2016-17
SAIDI Measure Total Network CBD Feeders Urban Feeders Short Rural
Feeders Long Rural
Feeders
Overall 233 N/A 2.4 209 846
Distribution Network (Planned)
67 N/A 2.0 59 261
Distribution Network (Unplanned)
166 N/A 0.4 150 585
Normalised Distribution Network (Unplanned)
125 N/A 0.0 107 572
Table 46: Rottnest Island Authority SAIDI performance in 2016-17
SAIDI Measure Total Network CBD Feeders Urban Feeders Short Rural
Feeders Long Rural
Feeders
Overall 1077 N/A N/A 1077 N/A
Distribution Network (Planned)
606 N/A N/A 606 N/A
Distribution Network (Unplanned)
471 N/A N/A 471 N/A
Normalised Distribution Network (Unplanned)
0 N/A N/A 0 N/A
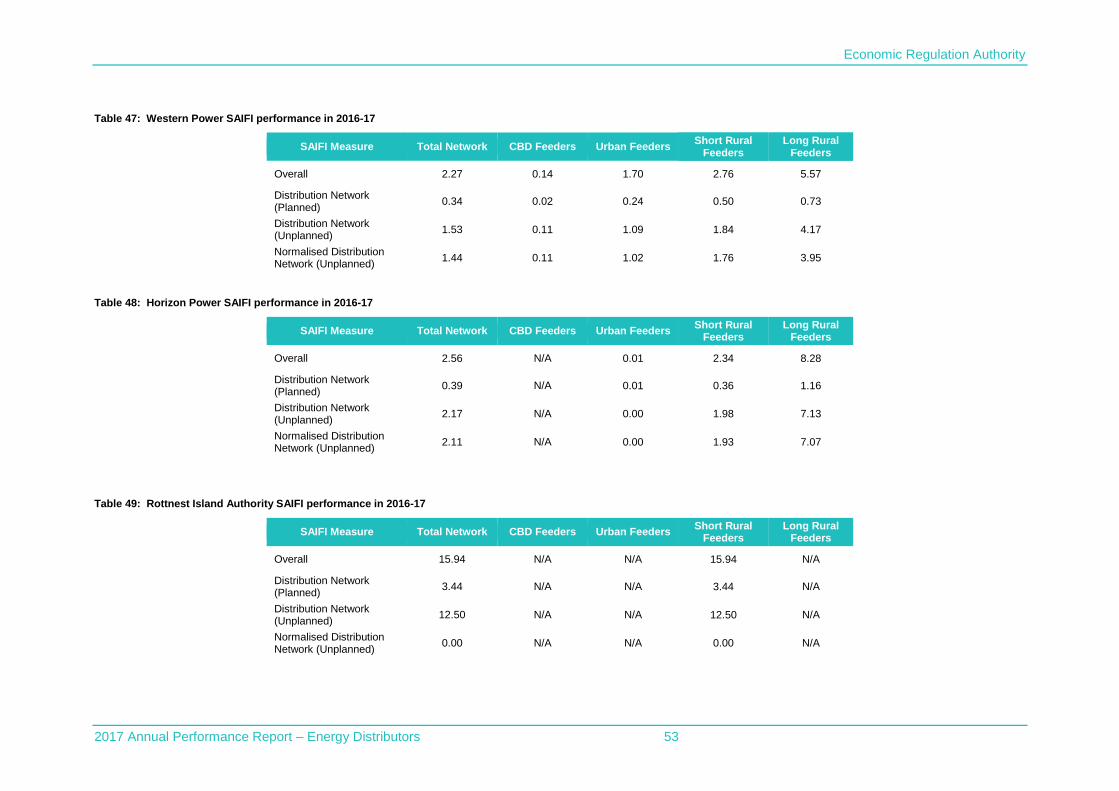
Economic Regulation Authority
2017 Annual Performance Report – Energy Distributors 53
Table 47: Western Power SAIFI performance in 2016-17
SAIFI Measure Total Network CBD Feeders Urban Feeders Short Rural
Feeders Long Rural
Feeders
Overall 2.27 0.14 1.70 2.76 5.57
Distribution Network (Planned)
0.34 0.02 0.24 0.50 0.73
Distribution Network (Unplanned)
1.53 0.11 1.09 1.84 4.17
Normalised Distribution Network (Unplanned)
1.44 0.11 1.02 1.76 3.95
Table 48: Horizon Power SAIFI performance in 2016-17
SAIFI Measure Total Network CBD Feeders Urban Feeders Short Rural
Feeders Long Rural
Feeders
Overall 2.56 N/A 0.01 2.34 8.28
Distribution Network (Planned)
0.39 N/A 0.01 0.36 1.16
Distribution Network (Unplanned)
2.17 N/A 0.00 1.98 7.13
Normalised Distribution Network (Unplanned)
2.11 N/A 0.00 1.93 7.07
Table 49: Rottnest Island Authority SAIFI performance in 2016-17
SAIFI Measure Total Network CBD Feeders Urban Feeders Short Rural
Feeders Long Rural
Feeders
Overall 15.94 N/A N/A 15.94 N/A
Distribution Network (Planned)
3.44 N/A N/A 3.44 N/A
Distribution Network (Unplanned)
12.50 N/A N/A 12.50 N/A
Normalised Distribution Network (Unplanned)
0.00 N/A N/A 0.00 N/A
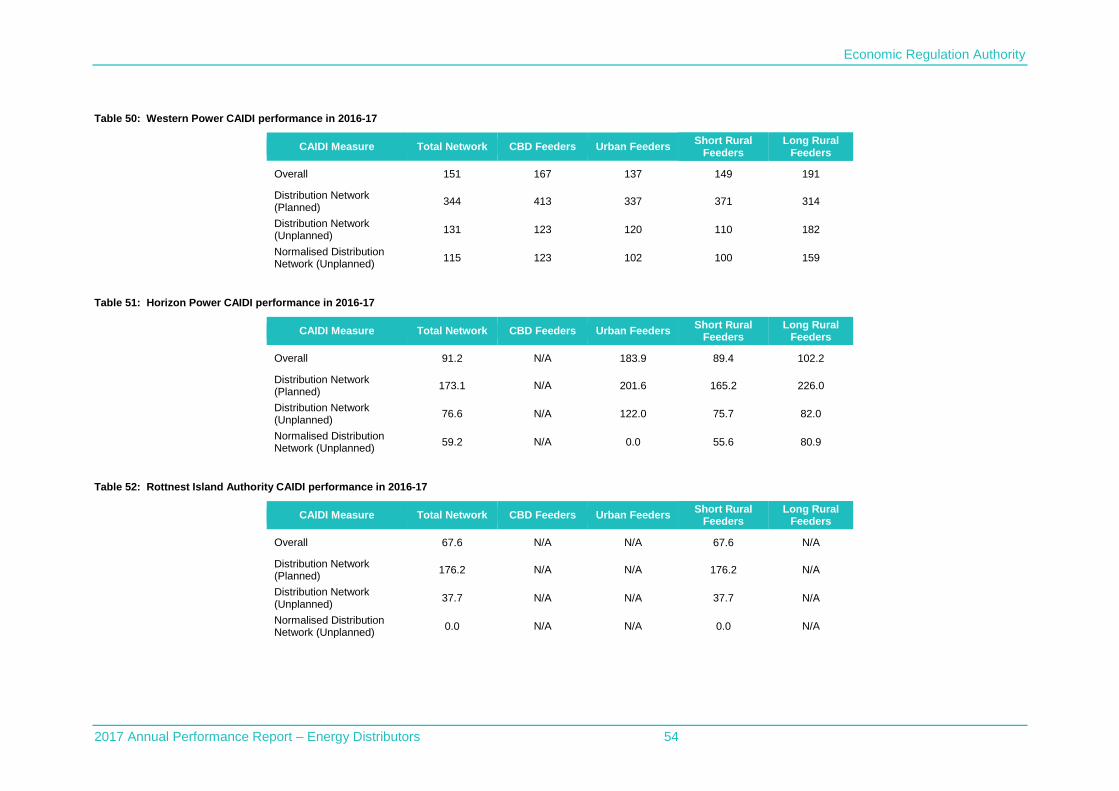
Economic Regulation Authority
2017 Annual Performance Report – Energy Distributors 54
Table 50: Western Power CAIDI performance in 2016-17
CAIDI Measure Total Network CBD Feeders Urban Feeders Short Rural
Feeders Long Rural
Feeders
Overall 151 167 137 149 191
Distribution Network (Planned)
344 413 337 371 314
Distribution Network (Unplanned)
131 123 120 110 182
Normalised Distribution Network (Unplanned)
115 123 102 100 159
Table 51: Horizon Power CAIDI performance in 2016-17
CAIDI Measure Total Network CBD Feeders Urban Feeders Short Rural
Feeders Long Rural
Feeders
Overall 91.2 N/A 183.9 89.4 102.2
Distribution Network (Planned)
173.1 N/A 201.6 165.2 226.0
Distribution Network (Unplanned)
76.6 N/A 122.0 75.7 82.0
Normalised Distribution Network (Unplanned)
59.2 N/A 0.0 55.6 80.9
Table 52: Rottnest Island Authority CAIDI performance in 2016-17
CAIDI Measure Total Network CBD Feeders Urban Feeders Short Rural
Feeders Long Rural
Feeders
Overall 67.6 N/A N/A 67.6 N/A
Distribution Network (Planned)
176.2 N/A N/A 176.2 N/A
Distribution Network (Unplanned)
37.7 N/A N/A 37.7 N/A
Normalised Distribution Network (Unplanned)
0.0 N/A N/A 0.0 N/A
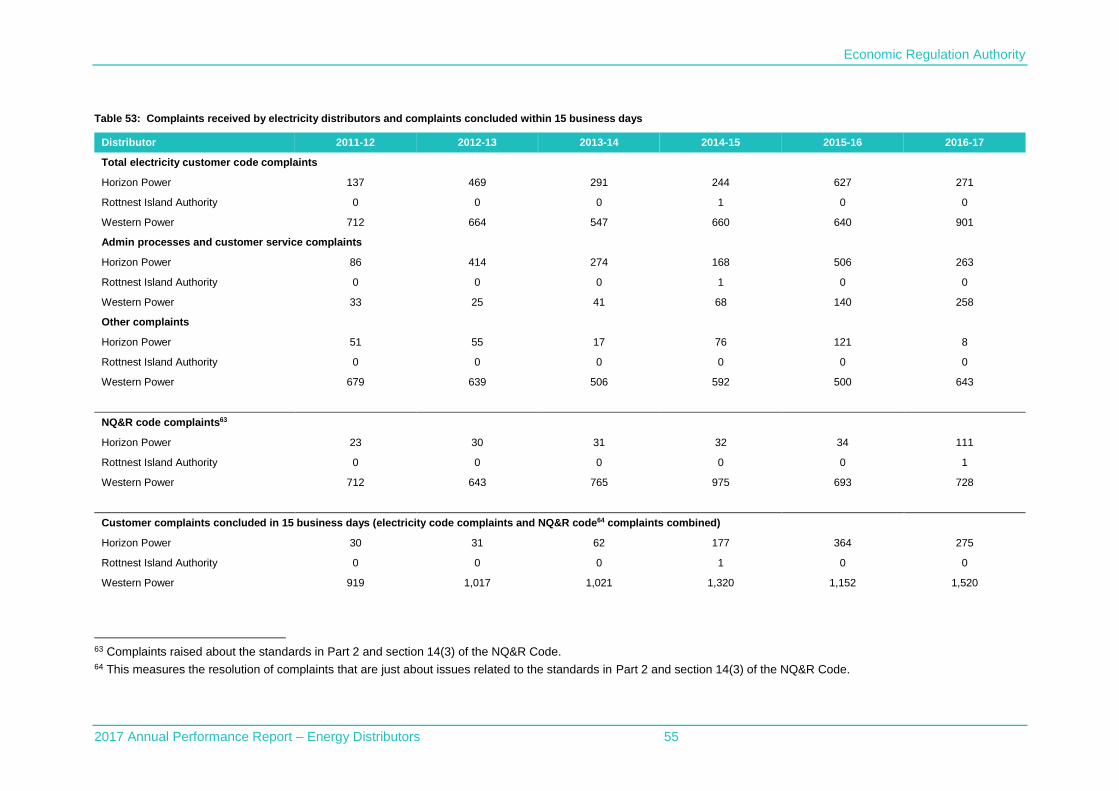
Economic Regulation Authority
2017 Annual Performance Report – Energy Distributors 55
Table 53: Complaints received by electricity distributors and complaints concluded within 15 business days
Distributor 2011-12 2012-13 2013-14 2014-15 2015-16 2016-17
Total electricity customer code complaints
Horizon Power 137 469 291 244 627 271
Rottnest Island Authority 0 0 0 1 0 0
Western Power 712 664 547 660 640 901
Admin processes and customer service complaints
Horizon Power 86 414 274 168 506 263
Rottnest Island Authority 0 0 0 1 0 0
Western Power 33 25 41 68 140 258
Other complaints
Horizon Power 51 55 17 76 121 8
Rottnest Island Authority 0 0 0 0 0 0
Western Power 679 639 506 592 500 643
NQ&R code complaints63
Horizon Power 23 30 31 32 34 111
Rottnest Island Authority 0 0 0 0 0 1
Western Power 712 643 765 975 693 728
Customer complaints concluded in 15 business days (electricity code complaints and NQ&R code64 complaints combined)
Horizon Power 30 31 62 177 364 275
Rottnest Island Authority 0 0 0 1 0 0
Western Power 919 1,017 1,021 1,320 1,152 1,520
63 Complaints raised about the standards in Part 2 and section 14(3) of the NQ&R Code. 64 This measures the resolution of complaints that are just about issues related to the standards in Part 2 and section 14(3) of the NQ&R Code.
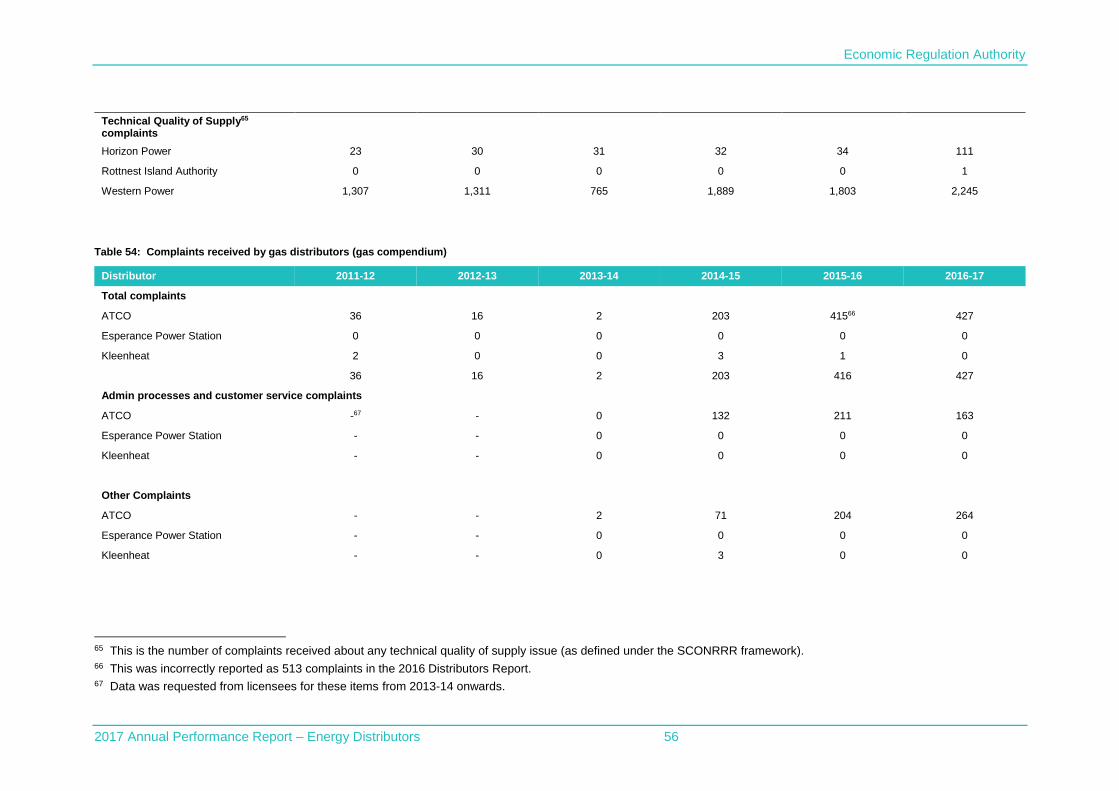
Economic Regulation Authority
2017 Annual Performance Report – Energy Distributors 56
Technical Quality of Supply65 complaints
Horizon Power 23 30 31 32 34 111
Rottnest Island Authority 0 0 0 0 0 1
Western Power 1,307 1,311 765 1,889 1,803 2,245
Table 54: Complaints received by gas distributors (gas compendium)
Distributor 2011-12 2012-13 2013-14 2014-15 2015-16 2016-17
Total complaints
ATCO 36 16 2 203 41566 427
Esperance Power Station 0 0 0 0 0 0
Kleenheat 2 0 0 3 1 0
36 16 2 203 416 427
Admin processes and customer service complaints
ATCO -67 - 0 132 211 163
Esperance Power Station - - 0 0 0 0
Kleenheat - - 0 0 0 0
Other Complaints
ATCO - - 2 71 204 264
Esperance Power Station - - 0 0 0 0
Kleenheat - - 0 3 0 0
65 This is the number of complaints received about any technical quality of supply issue (as defined under the SCONRRR framework). 66 This was incorrectly reported as 513 complaints in the 2016 Distributors Report. 67 Data was requested from licensees for these items from 2013-14 onwards.
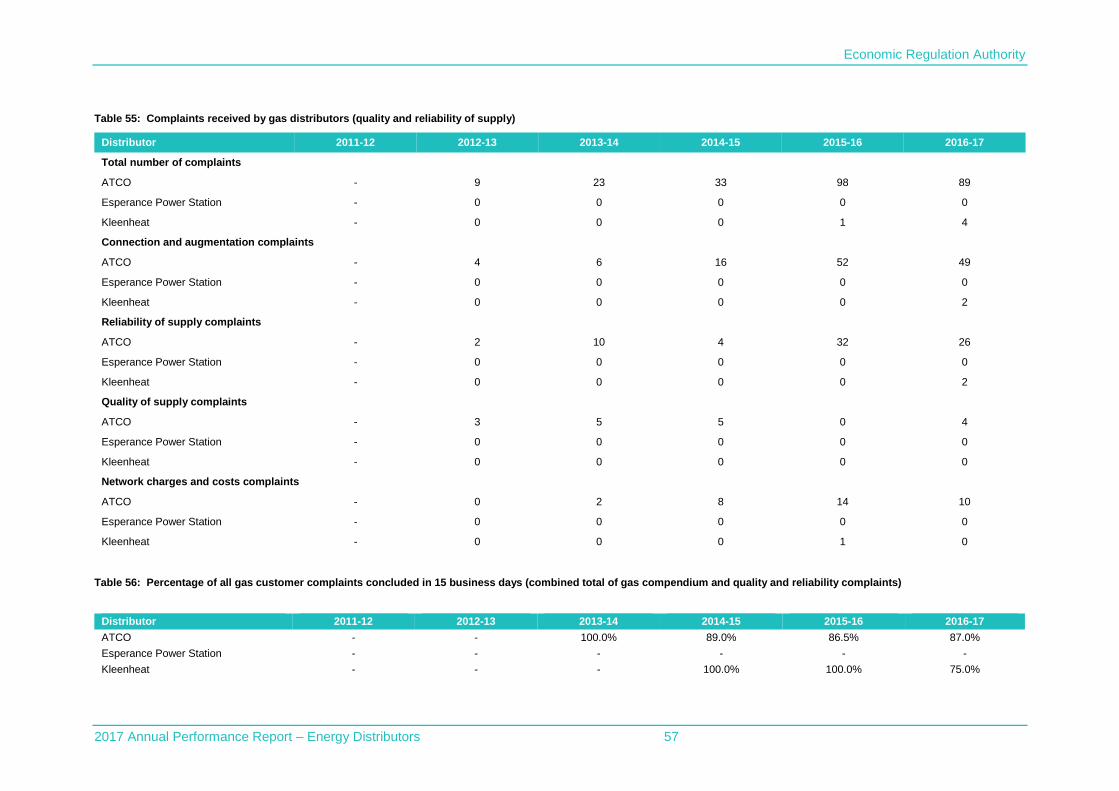
Economic Regulation Authority
2017 Annual Performance Report – Energy Distributors 57
Table 55: Complaints received by gas distributors (quality and reliability of supply)
Distributor 2011-12 2012-13 2013-14 2014-15 2015-16 2016-17
Total number of complaints
ATCO - 9 23 33 98 89
Esperance Power Station - 0 0 0 0 0
Kleenheat - 0 0 0 1 4
Connection and augmentation complaints
ATCO - 4 6 16 52 49
Esperance Power Station - 0 0 0 0 0
Kleenheat - 0 0 0 0 2
Reliability of supply complaints
ATCO - 2 10 4 32 26
Esperance Power Station - 0 0 0 0 0
Kleenheat - 0 0 0 0 2
Quality of supply complaints
ATCO - 3 5 5 0 4
Esperance Power Station - 0 0 0 0 0
Kleenheat - 0 0 0 0 0
Network charges and costs complaints
ATCO - 0 2 8 14 10
Esperance Power Station - 0 0 0 0 0
Kleenheat - 0 0 0 1 0
Table 56: Percentage of all gas customer complaints concluded in 15 business days (combined total of gas compendium and quality and reliability complaints)
Distributor 2011-12 2012-13 2013-14 2014-15 2015-16 2016-17
ATCO - - 100.0% 89.0% 86.5% 87.0%
Esperance Power Station - - - - - -
Kleenheat - - - 100.0% 100.0% 75.0%
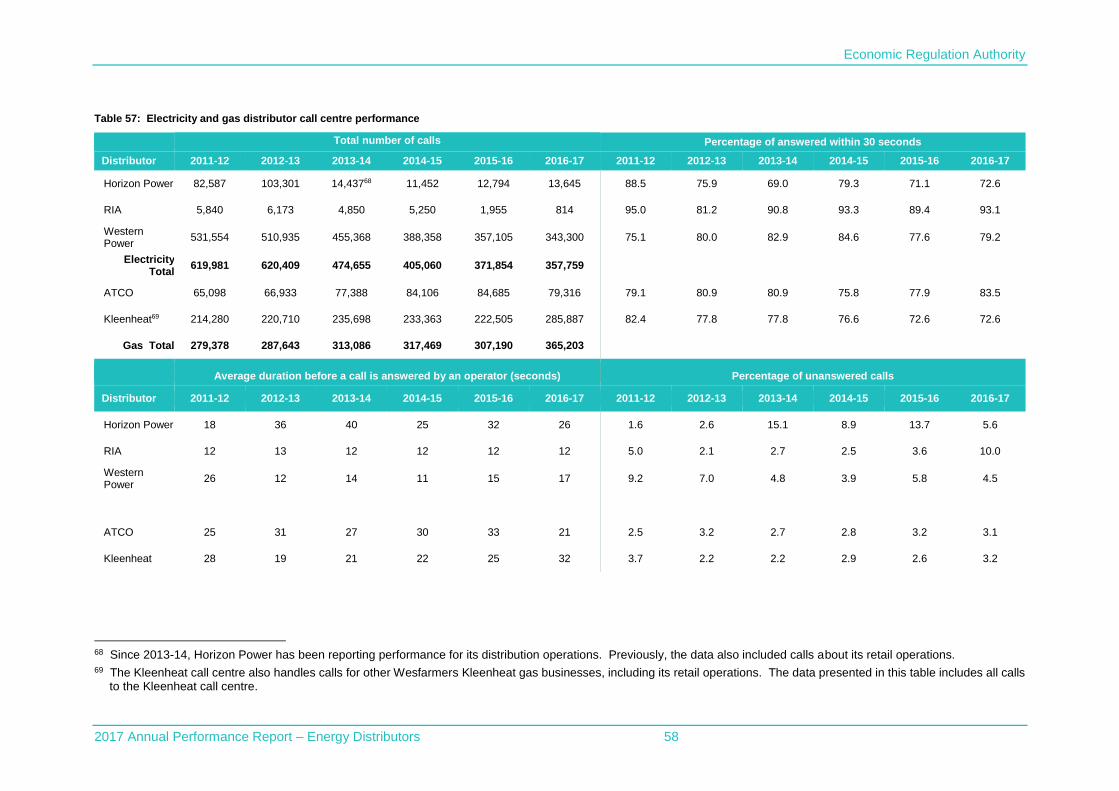
Economic Regulation Authority
2017 Annual Performance Report – Energy Distributors 58
Table 57: Electricity and gas distributor call centre performance
Total number of calls Percentage of answered within 30 seconds
Distributor 2011-12 2012-13 2013-14 2014-15 2015-16 2016-17 2011-12 2012-13 2013-14 2014-15 2015-16 2016-17
Horizon Power 82,587 103,301 14,43768 11,452 12,794 13,645 88.5 75.9 69.0 79.3 71.1 72.6
RIA 5,840 6,173 4,850 5,250 1,955 814 95.0 81.2 90.8 93.3 89.4 93.1
Western Power
531,554 510,935 455,368 388,358 357,105 343,300 75.1 80.0 82.9 84.6 77.6 79.2
Electricity Total
619,981 620,409 474,655 405,060 371,854 357,759
ATCO 65,098 66,933 77,388 84,106 84,685 79,316 79.1 80.9 80.9 75.8 77.9 83.5
Kleenheat69 214,280 220,710 235,698 233,363 222,505 285,887 82.4 77.8 77.8 76.6 72.6 72.6
Gas Total 279,378 287,643 313,086 317,469 307,190 365,203
Average duration before a call is answered by an operator (seconds) Percentage of unanswered calls
Distributor 2011-12 2012-13 2013-14 2014-15 2015-16 2016-17 2011-12 2012-13 2013-14 2014-15 2015-16 2016-17
Horizon Power 18 36 40 25 32 26 1.6 2.6 15.1 8.9 13.7 5.6
RIA 12 13 12 12 12 12 5.0 2.1 2.7 2.5 3.6 10.0
Western Power
26 12 14 11 15 17 9.2 7.0 4.8 3.9 5.8 4.5
ATCO 25 31 27 30 33 21 2.5 3.2 2.7 2.8 3.2 3.1
Kleenheat 28 19 21 22 25 32 3.7 2.2 2.2 2.9 2.6 3.2
68 Since 2013-14, Horizon Power has been reporting performance for its distribution operations. Previously, the data also included calls about its retail operations. 69 The Kleenheat call centre also handles calls for other Wesfarmers Kleenheat gas businesses, including its retail operations. The data presented in this table includes all calls
to the Kleenheat call centre.

Economic Regulation Authority
2017 Annual Performance Report – Energy Distributors 59
Table 58: Residential and non-residential gas consumption
Residential gas consumption (GJ) Non-residential gas consumption (GJ)
Distributor 2011-12 2012-13 2013-14 2014-15 2015-16 2016-17 2011-12 2012-13 2013-14 2014-15 2015-16 2016-17
ATCO70 9,528,366 10,017,511 10,087,162 9,816,762 10,049,915 11,036,506 1,177,507 1,241,075 1,263,629 1,286,095 1,319,166 1,383,781
Esperance Power Station
5,506 3,567 3,969 3,981 4,014 4,017 243 26,481 28,276 32,669 32,342 20,570
Kleenheat 3,536 6,293 6,769 7,489 7,348 8,531 4,666 227 194 225 218 071
State Total 9,537,408 10,027,371 10,193,727 9,828,232 10,061,277 11,049,054 1,182,416 1,267,783 1,292,099 1,318,989 1,351,726 1,404,351
Table 59: Percentage of unaccounted for gas on distribution systems
Unaccounted for Gas (GJ) Percentage unaccounted for gas
Distributor 2011-12 2012-13 2013-14 2014-15 2015-16 2016-17 2011-12 2012-13 2013-14 2014-15 2015-16 2016-17
ATCO72 920,371 813,898 707,191 705,987 715,966
744,053
- - - - - -
Esperance Power Station
0 0 0 0 0 425 0.0 0.0 0.0 0.0 0.0 1.7
Kleenheat 1,158 866 943 529 562 512 3.0 13.3 13.5 6.9 7.4 6.0
State Total 921,529 814,764 708,134 706,516 716,528 744,990
70 ATCO’s gas consumption data is based on calendar year from January to December. 71 In previous years, Kleenheat reported non-residential gas consumption in error, due to some residential accounts being set up in business names (residential homes owned
by businesses, such as charities). In 2016-17, it reported zero non-residential gas consumption by small use customers on its systems. 72 It is not possible to calculate UFG on the ATCO networks, because the UFG includes gas supplied to large use customers, while the gas consumption is restricted to small
use customers.
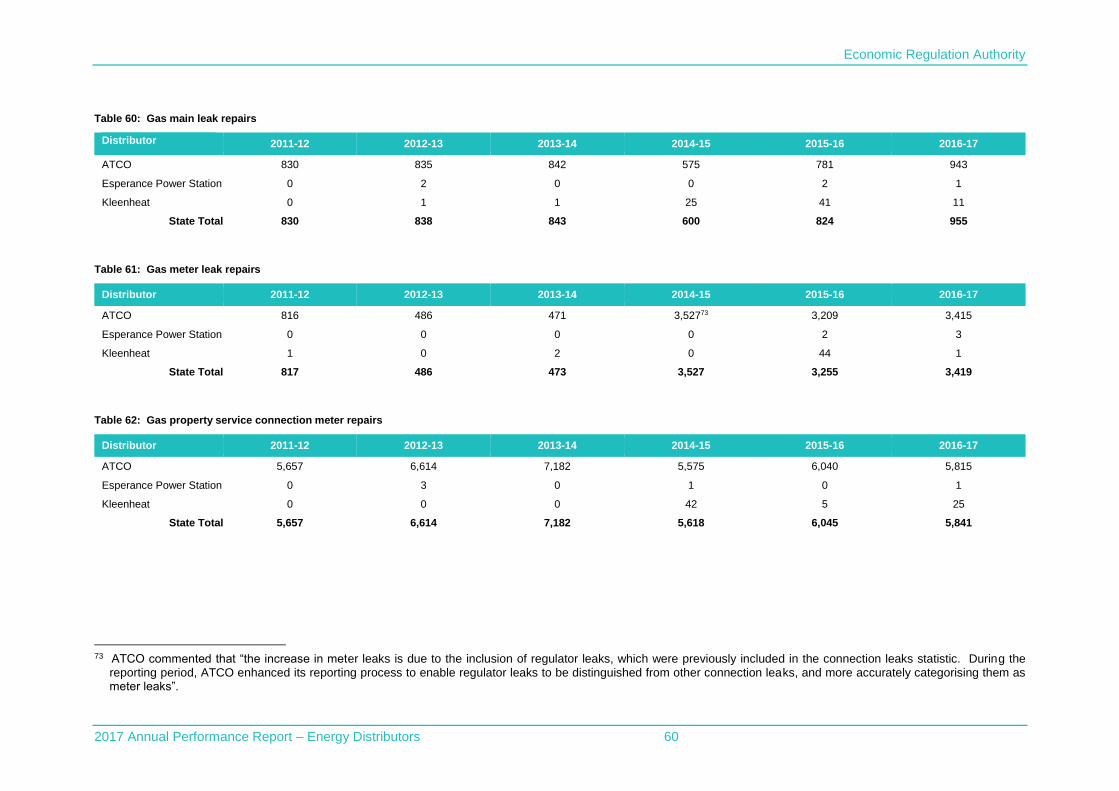
Economic Regulation Authority
2017 Annual Performance Report – Energy Distributors 60
Table 60: Gas main leak repairs
Distributor 2011-12 2012-13 2013-14 2014-15 2015-16 2016-17
ATCO 830 835 842 575 781 943
Esperance Power Station 0 2 0 0 2 1
Kleenheat 0 1 1 25 41 11
State Total 830 838 843 600 824 955
Table 61: Gas meter leak repairs
Distributor 2011-12 2012-13 2013-14 2014-15 2015-16 2016-17
ATCO 816 486 471 3,52773 3,209 3,415
Esperance Power Station 0 0 0 0 2 3
Kleenheat 1 0 2 0 44 1
State Total 817 486 473 3,527 3,255 3,419
Table 62: Gas property service connection meter repairs
Distributor 2011-12 2012-13 2013-14 2014-15 2015-16 2016-17
ATCO 5,657 6,614 7,182 5,575 6,040 5,815
Esperance Power Station 0 3 0 1 0 1
Kleenheat 0 0 0 42 5 25
State Total 5,657 6,614 7,182 5,618 6,045 5,841
73 ATCO commented that “the increase in meter leaks is due to the inclusion of regulator leaks, which were previously included in the connection leaks statistic. During the
reporting period, ATCO enhanced its reporting process to enable regulator leaks to be distinguished from other connection leaks, and more accurately categorising them as meter leaks”.
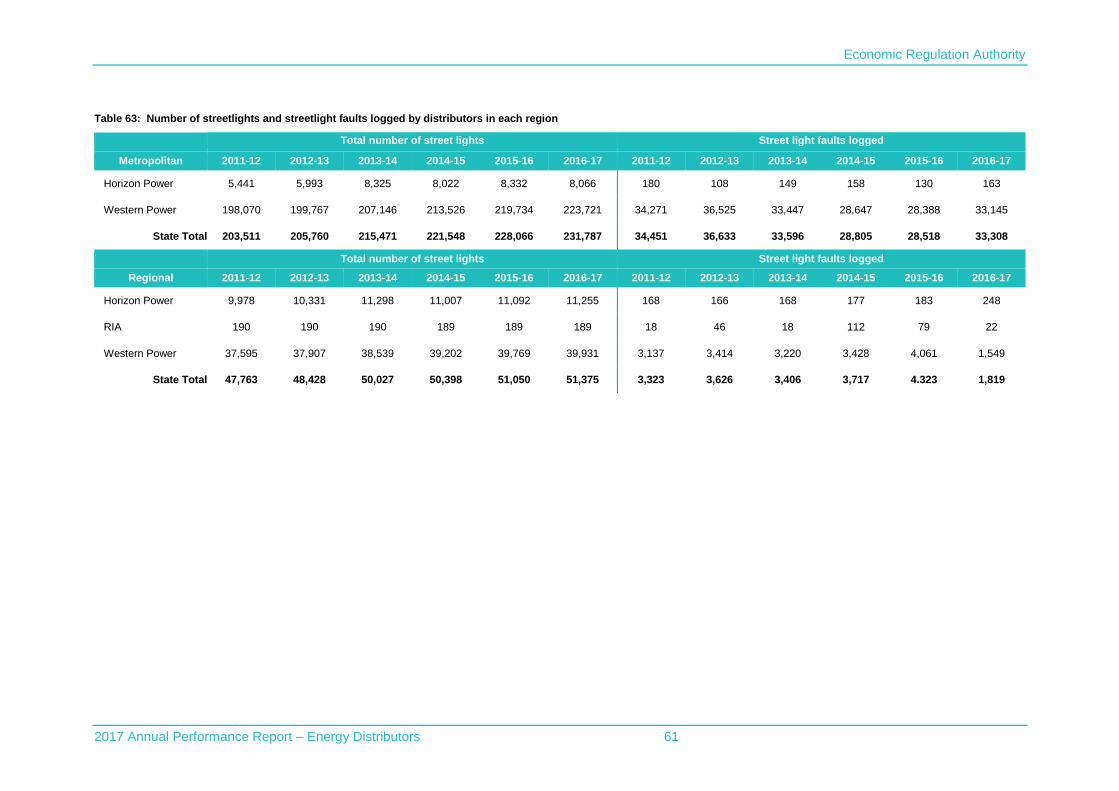
Economic Regulation Authority
2017 Annual Performance Report – Energy Distributors 61
Table 63: Number of streetlights and streetlight faults logged by distributors in each region
Total number of street lights Street light faults logged
Metropolitan 2011-12 2012-13 2013-14 2014-15 2015-16 2016-17 2011-12 2012-13 2013-14 2014-15 2015-16 2016-17
Horizon Power 5,441 5,993 8,325 8,022 8,332 8,066 180 108 149 158 130 163
Western Power 198,070 199,767 207,146 213,526 219,734 223,721 34,271 36,525 33,447 28,647 28,388 33,145
State Total 203,511 205,760 215,471 221,548 228,066 231,787 34,451 36,633 33,596 28,805 28,518 33,308
Total number of street lights Street light faults logged
Regional 2011-12 2012-13 2013-14 2014-15 2015-16 2016-17 2011-12 2012-13 2013-14 2014-15 2015-16 2016-17
Horizon Power 9,978 10,331 11,298 11,007 11,092 11,255 168 166 168 177 183 248
RIA 190 190 190 189 189 189 18 46 18 112 79 22
Western Power 37,595 37,907 38,539 39,202 39,769 39,931 3,137 3,414 3,220 3,428 4,061 1,549
State Total 47,763 48,428 50,027 50,398 51,050 51,375 3,323 3,626 3,406 3,717 4.323 1,819
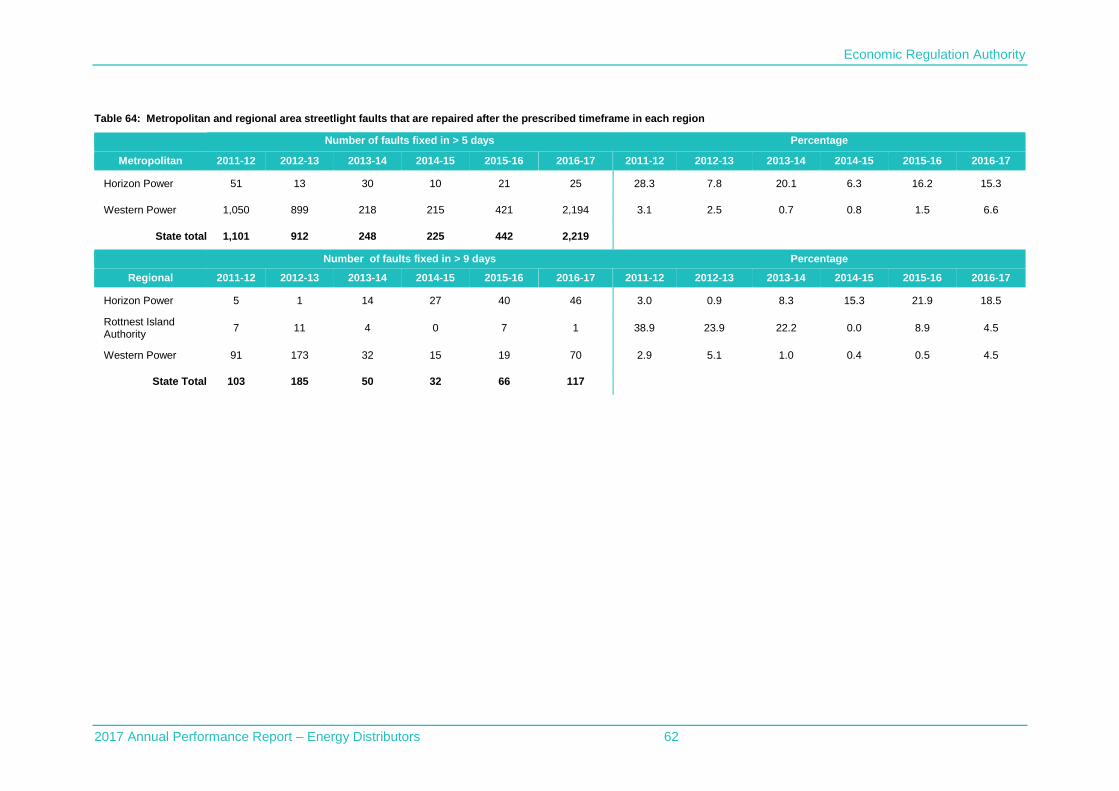
Economic Regulation Authority
2017 Annual Performance Report – Energy Distributors 62
Table 64: Metropolitan and regional area streetlight faults that are repaired after the prescribed timeframe in each region
Number of faults fixed in > 5 days Percentage
Metropolitan 2011-12 2012-13 2013-14 2014-15 2015-16 2016-17 2011-12 2012-13 2013-14 2014-15 2015-16 2016-17
Horizon Power 51 13 30 10 21 25 28.3 7.8 20.1 6.3 16.2 15.3
Western Power 1,050 899 218 215 421 2,194 3.1 2.5 0.7 0.8 1.5 6.6
State total 1,101 912 248 225 442 2,219
Number of faults fixed in > 9 days Percentage
Regional 2011-12 2012-13 2013-14 2014-15 2015-16 2016-17 2011-12 2012-13 2013-14 2014-15 2015-16 2016-17
Horizon Power 5 1 14 27 40 46 3.0 0.9 8.3 15.3 21.9 18.5
Rottnest Island Authority
7 11 4 0 7 1 38.9 23.9 22.2 0.0 8.9 4.5
Western Power 91 173 32 15 19 70 2.9 5.1 1.0 0.4 0.5 4.5
State Total 103 185 50 32 66 117
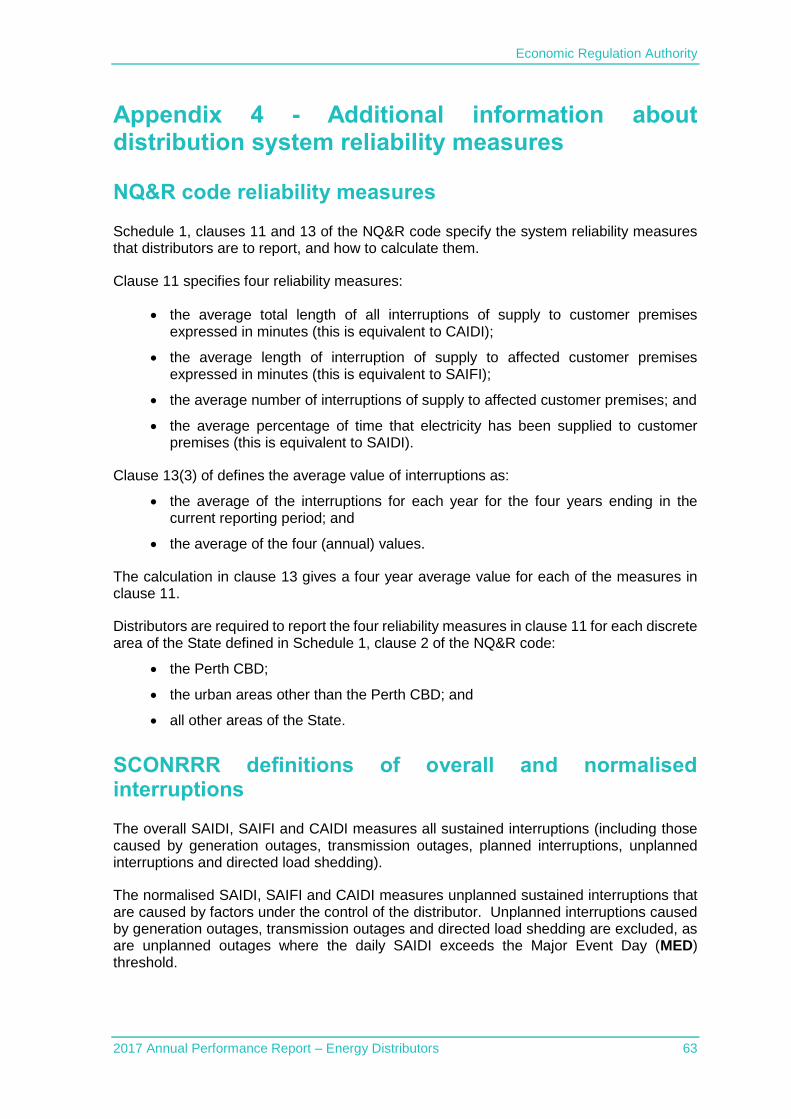
Economic Regulation Authority
2017 Annual Performance Report – Energy Distributors 63
Appendix 4 - Additional information about distribution system reliability measures
NQ&R code reliability measures
Schedule 1, clauses 11 and 13 of the NQ&R code specify the system reliability measures that distributors are to report, and how to calculate them.
Clause 11 specifies four reliability measures:
the average total length of all interruptions of supply to customer premises expressed in minutes (this is equivalent to CAIDI);
the average length of interruption of supply to affected customer premises expressed in minutes (this is equivalent to SAIFI);
the average number of interruptions of supply to affected customer premises; and
the average percentage of time that electricity has been supplied to customer premises (this is equivalent to SAIDI).
Clause 13(3) of defines the average value of interruptions as:
the average of the interruptions for each year for the four years ending in the current reporting period; and
the average of the four (annual) values.
The calculation in clause 13 gives a four year average value for each of the measures in clause 11.
Distributors are required to report the four reliability measures in clause 11 for each discrete area of the State defined in Schedule 1, clause 2 of the NQ&R code:
the Perth CBD;
the urban areas other than the Perth CBD; and
all other areas of the State.
SCONRRR definitions of overall and normalised interruptions
The overall SAIDI, SAIFI and CAIDI measures all sustained interruptions (including those caused by generation outages, transmission outages, planned interruptions, unplanned interruptions and directed load shedding).
The normalised SAIDI, SAIFI and CAIDI measures unplanned sustained interruptions that are caused by factors under the control of the distributor. Unplanned interruptions caused by generation outages, transmission outages and directed load shedding are excluded, as are unplanned outages where the daily SAIDI exceeds the Major Event Day (MED) threshold.
Economic Regulation Authority
2017 Annual Performance Report – Energy Distributors 64
Section 4.5 of Standard IEEE 1366-2003 - Guide for Electric Power Distribution Reliability Indices, Institute for Electrical and Electronic Engineers (IEEE 1366)74 describes a statistical approach to calculate the SAIDI threshold for a MED. The calculation of the MED threshold is based on the SAIDI associated with all of the interruptions that occurred during the reporting period, which is typically one year.75
The purpose of calculating the MED threshold is to remove days where the daily system SAIDI is much larger than the distribution system average for the reporting period.76 This approach allows major events to be separately studied from normal daily operation. This exposes trends in daily operation of the system that would otherwise be hidden by the MEDs.77
It is important to note that, although the SAIDI is used to identify MEDs, the system SAIFI and CAIDI should be calculated based on the removal of the MED values.
The Australian Energy Regulator also uses standard IEEE 1366 to calculate normalised values for SAIDI, SAIFI and CAIDI for the distribution systems in the National Electricity Market (NEM).78 Adopting IEEE 1366 to calculate the normalised system reliability of Western Australian distributors provides opportunities to benchmark their performance with that of comparable distributors in the NEM.
74 IEEE 1366-2003 has been superseded by IEEE 1366-2012. The data provided by distributors in this report
is based on IEEE 1366-2003. 75 The reporting period used for this report is the year ending 30 June. 76 The calculation of the MED threshold uses the natural logarithms of the daily SAIDI values. The MED
threshold is set at 2.5 log-standard deviations above the log-average of the SAIDI data set for the reporting period.
77 Some regulators require distributors to separately report on the cause(s) of interruptions that occurred during MEDs. Often MEDs result from severe weather events, bushfires and the failure of critical network infrastructure beyond the control of the distributor.
78 The National Electricity Market covers the ACT, New South Wales, South Australia, Queensland, Tasmania and Victoria.
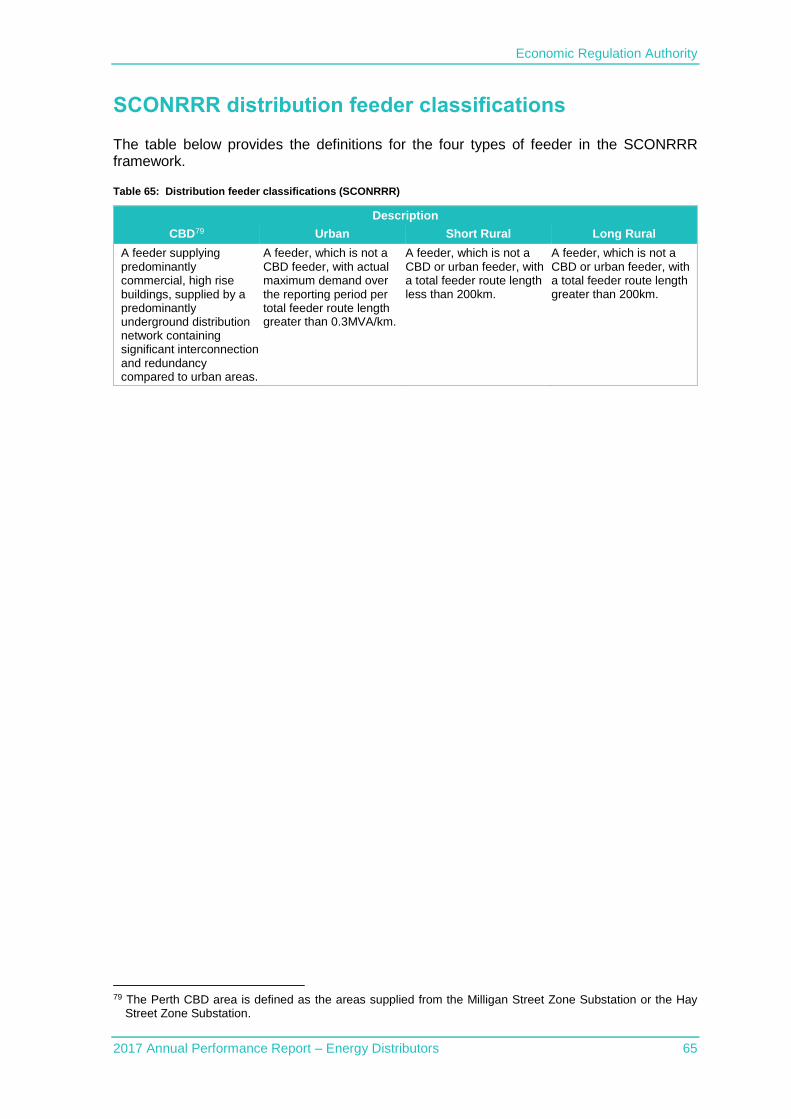
Economic Regulation Authority
2017 Annual Performance Report – Energy Distributors 65
SCONRRR distribution feeder classifications
The table below provides the definitions for the four types of feeder in the SCONRRR framework.
Table 65: Distribution feeder classifications (SCONRRR)
Description
CBD79 Urban Short Rural Long Rural
A feeder supplying predominantly commercial, high rise buildings, supplied by a predominantly underground distribution network containing significant interconnection and redundancy compared to urban areas.
A feeder, which is not a CBD feeder, with actual maximum demand over the reporting period per total feeder route length greater than 0.3MVA/km.
A feeder, which is not a CBD or urban feeder, with a total feeder route length less than 200km.
A feeder, which is not a CBD or urban feeder, with a total feeder route length greater than 200km.
79 The Perth CBD area is defined as the areas supplied from the Milligan Street Zone Substation or the Hay
Street Zone Substation.