Embed Size (px)
Citation preview
2017 ANNUAL REPORT
Building the Kingdom. transforming lives. one investment at a time.

There is so much to be thankful for as we look back on this past year. God has once again showed His goodness and faithfulness. We have not only experienced excellent financial results but have also continued to witness changed lives through the effective ministries of our local churches and the worldwide work they help support.
Next year, ADF will be celebrating its 40th Anniversary. God has been so good to every aspect of this ministry. Many churches and other Alliance ministries have received needed capital to build strategic facilities. Our investors are enjoying a Kingdom Return on Investment (KROI) on their funds, in addition to competitive interest rates. We have a staff that serves our investors and churches in a caring, Christian way, and ADF as an organization remains financially strong and effective in ministry. All the glory has always been and will always be His.
Thank you for your confidence in ADF, your investments in Alliance churches, and the desire of your hearts to see lives transformed.
I trust you will be blessed and encouraged by the information in this report.
Please share your comments, questions, and prayer requests. We always appreciate hearing from you.
Sincerely,
Lawrence L. McCooey, CPA, PFS, CGMA
President
Dear Fellow Investors and Friends of The Alliance Development Fund,
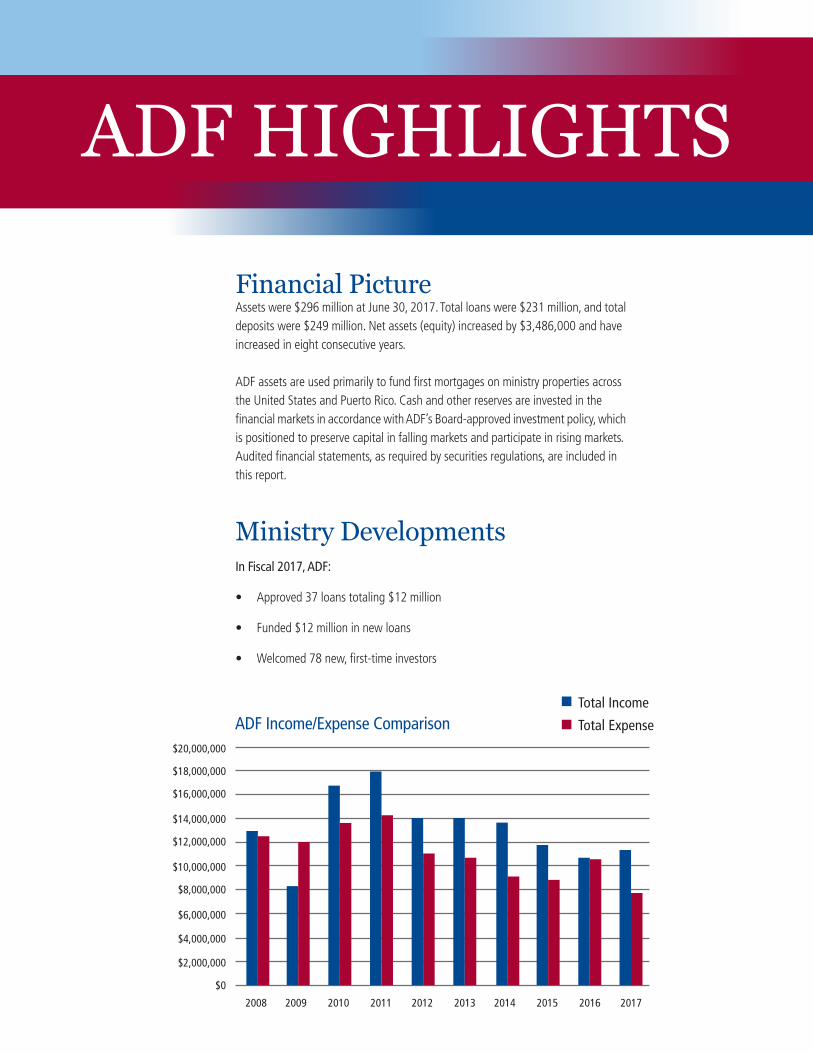
Financial PictureAssets were $296 million at June 30, 2017. Total loans were $231 million, and totaldeposits were $249 million. Net assets (equity) increased by $3,486,000 and haveincreased in eight consecutive years.
ADF assets are used primarily to fund first mortgages on ministry properties acrossthe United States and Puerto Rico. Cash and other reserves are invested in thefinancial markets in accordance with ADF’s Board-approved investment policy, whichis positioned to preserve capital in falling markets and participate in rising markets.Audited financial statements, as required by securities regulations, are included inthis report.
Ministry Developments In Fiscal 2017, ADF:
• Approved 37 loans totaling $12 million
• Funded $12 million in new loans
• Welcomed 78 new, first-time investors
$20,000,000
$18,000,000
$16,000,000
$14,000,000
$12,000,000
$10,000,000
$8,000,000
$6,000,000
$4,000,000
$2,000,000
$0
ADF Income/Expense ComparisonTotal Income
Total Expense
2008 2009 2010 2011 2012 2013 2014 2015 2016 2017
ADF HIGHLIGHTS
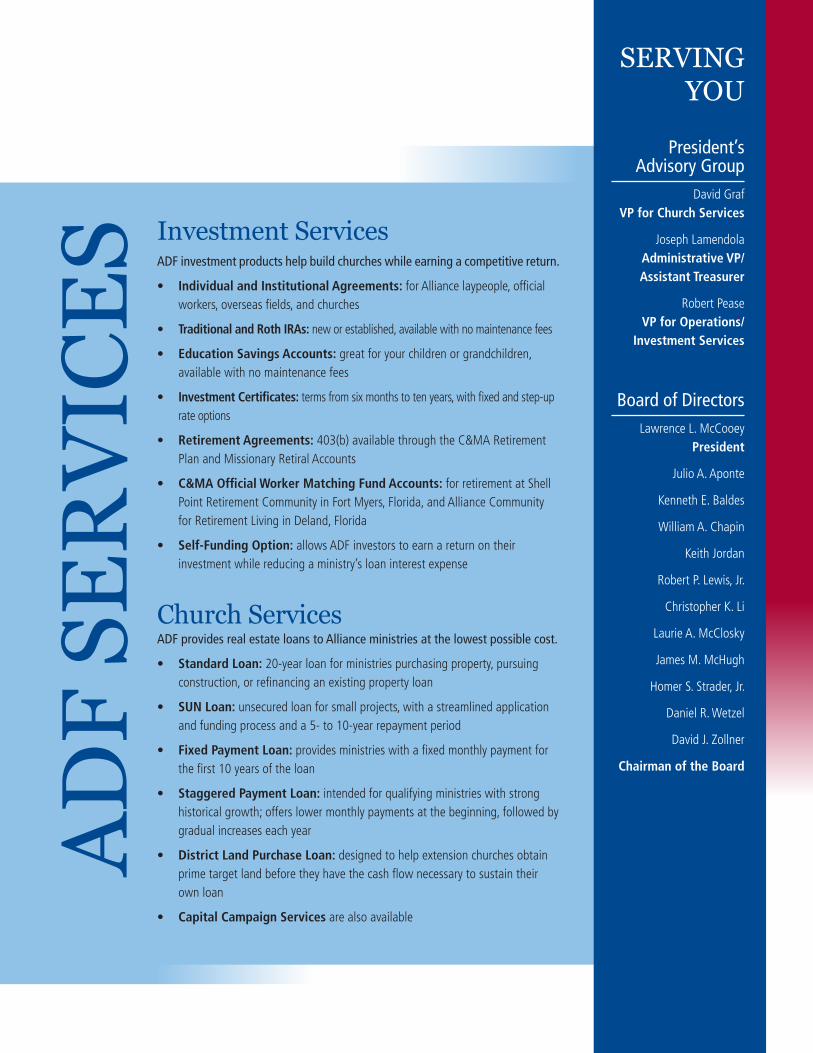
Investment ServicesADF investment products help build churches while earning a competitive return.
• Individual and Institutional Agreements: for Alliance laypeople, official workers, overseas fields, and churches
• Traditional and Roth IRAs: new or established, available with no maintenance fees
• Education Savings Accounts: great for your children or grandchildren, available with no maintenance fees
• Investment Certificates: terms from six months to ten years, with fixed and step-up rate options
• Retirement Agreements: 403(b) available through the C&MA Retirement Plan and Missionary Retiral Accounts
• C&MA Official Worker Matching Fund Accounts: for retirement at Shell Point Retirement Community in Fort Myers, Florida, and Alliance Community for Retirement Living in Deland, Florida
• Self-Funding Option: allows ADF investors to earn a return on their investment while reducing a ministry’s loan interest expense
Church ServicesADF provides real estate loans to Alliance ministries at the lowest possible cost.
• Standard Loan: 20-year loan for ministries purchasing property, pursuing construction, or refinancing an existing property loan
• SUN Loan: unsecured loan for small projects, with a streamlined application and funding process and a 5- to 10-year repayment period
• Fixed Payment Loan: provides ministries with a fixed monthly payment for the first 10 years of the loan
• Staggered Payment Loan: intended for qualifying ministries with strong historical growth; offers lower monthly payments at the beginning, followed by gradual increases each year
• District Land Purchase Loan: designed to help extension churches obtain prime target land before they have the cash flow necessary to sustain their own loan
• Capital Campaign Services are also available
ADF
SER
VICE
SPresident’s
Advisory Group David Graf
VP for Church Services
Joseph Lamendola Administrative VP/ Assistant Treasurer
Robert Pease VP for Operations/
Investment Services
Board of DirectorsLawrence L. McCooey
President
Julio A. Aponte
Kenneth E. Baldes
William A. Chapin
Keith Jordan
Robert P. Lewis, Jr.
Christopher K. Li
Laurie A. McClosky
James M. McHugh
Homer S. Strader, Jr.
Daniel R. Wetzel
David J. Zollner
Chairman of the Board
SERVING YOU
Alliance Mexico FieldGuadalajara, Mexico
Alliance New England DistrictSouth Easton, MA
Bedford Community ChurchBedford Hills, NY
Birmingham International ChurchVestavia Hills, AL
Brooklyn Alliance ChurchBrooklyn, NY
Casper Alliance ChurchCasper, WY
Cherry Tree Alliance ChurchUniontown, PA
Christ Community ChurchRochester, MN
Crosswalk ChurchWaukesha, WI
Faith Alliance Bible ChurchDes Plaines, IL
Fellowship Alliance ChurchEau Claire, WI
Geneva Alliance ChurchGeneva, NY
Grace Alliance ChurchAnchorage, AK
Grace Community Alliance ChurchGreensboro, NC
Grace Montagnard Alliance ChurchCharlotte, NC
Green Community Missionary ChurchRoseburg, OR
Hollywood Hills Alliance ChurchHollywood Hills, FL
Hope Alliance Bible ChurchMaple Heights, OH
House of Prayer Alliance ChurchBemidji, MN
Iglesia Evangelica Hispana De La ACyMRandolph, NJ
Iglesia Nueva CreacionBakersfield, CA
LifeBridge ChurchHouston, TX
MidAmerica DistrictOmaha, NE
Midwest DistrictBloomingdale, IL
Mira Mesa Grace ChapelSan Diego, CA
Morrow Vietnamese Alliance ChurchForest Park, GA
Northwest Houston Vietnamese Alliance ChurchHouston, TX
Quest ChurchMiddletown, OH
Reveal FellowshipLake Worth, FL
Sandhills Alliance ChurchPinehurst, NC
St. Ignatius Alliance ChurchSt. Ignatius, MT
Victory Hmong Alliance ChurchHoschton, GA
Vietnamese Alliance Church of San Gabriel ValleySouth El Monte, CA
Vietnamese Christian Alliance Church of North San DiegoSan Diego, CA
Vietnamese Grace Alliance ChurchBeverly Hills, MI
Vineland Indian ChapelOnamia, MN
West Africa Alliance SeminaryAbidjan, Ivory Coast
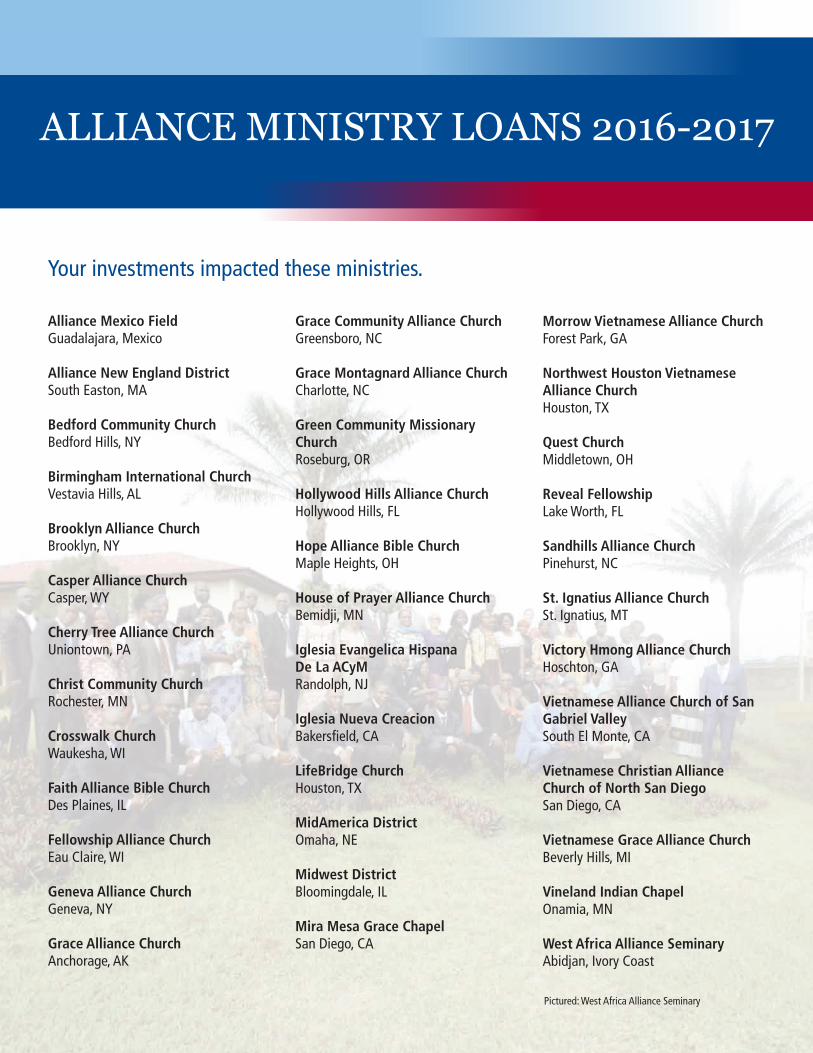
Your investments impacted these ministries.
Pictured: West Africa Alliance Seminary
ALLIANCE MINISTRY LOANS 2016-2017
1801 California Street, Suite 2900 // Denver, CO 80202-2606 303.861.4545 // fax 303.832.5705 // bkd.com
Independent Auditor’s Report
Audit Committee and Board of Directors The Alliance Development Fund, Inc. Colorado Springs, Colorado
We have audited the accompanying financial statements of The Alliance Development Fund, Inc., which comprise the statements of financial position as of June 30, 2017 and 2016, and the related statements of activities and cash flows for the years ended June 30, 2017, 2016 and 2015, and the related notes to the financial statements.
Management’s Responsibility for the Financial Statements
Management is responsible for the preparation and fair presentation of these financial statements in accordance with accounting principles generally accepted in the United States of America; this includes the design, implementation and maintenance of internal control relevant to the preparation and fair presentation of financial statements that are free from material misstatement, whether due to fraud or error.
Auditor’s Responsibility
Our responsibility is to express an opinion on these financial statements based on our audits. We conducted our audits in accordance with auditing standards generally accepted in the United States of America. Those standards require that we plan and perform the audit to obtain reasonable assurance about whether the financial statements are free from material misstatement.
An audit involves performing procedures to obtain audit evidence about the amounts and disclosures in the financial statements. The procedures selected depend on the auditor’s judgment, including the assessment of the risks of material misstatement of the financial statements, whether due to fraud or error. In making those risk assessments, the auditor considers internal control relevant to the entity’s preparation and fair presentation of the financial statements in order to design audit procedures that are appropriate in the circumstances, but not for the purpose of expressing an opinion on the effectiveness of the entity’s internal control. Accordingly, we express no such opinion. An audit also includes evaluating the appropriateness of accounting policies used and the reasonableness of significant accounting estimates made by management, as well as evaluating the overall presentation of the financial statements.
We believe that the audit evidence we have obtained is sufficient and appropriate to provide a basis for our audit opinion.
Opinion
In our opinion, the financial statements referred to above present fairly, in all material respects, the financial position of The Alliance Development Fund, Inc. as of June 30, 2017 and 2016, and the changes in its net assets and its cash flows for the years ended June 30, 2017, 2016 and 2015, in accordance with accounting principles generally accepted in the United States of America.
Denver, Colorado August 24, 2017
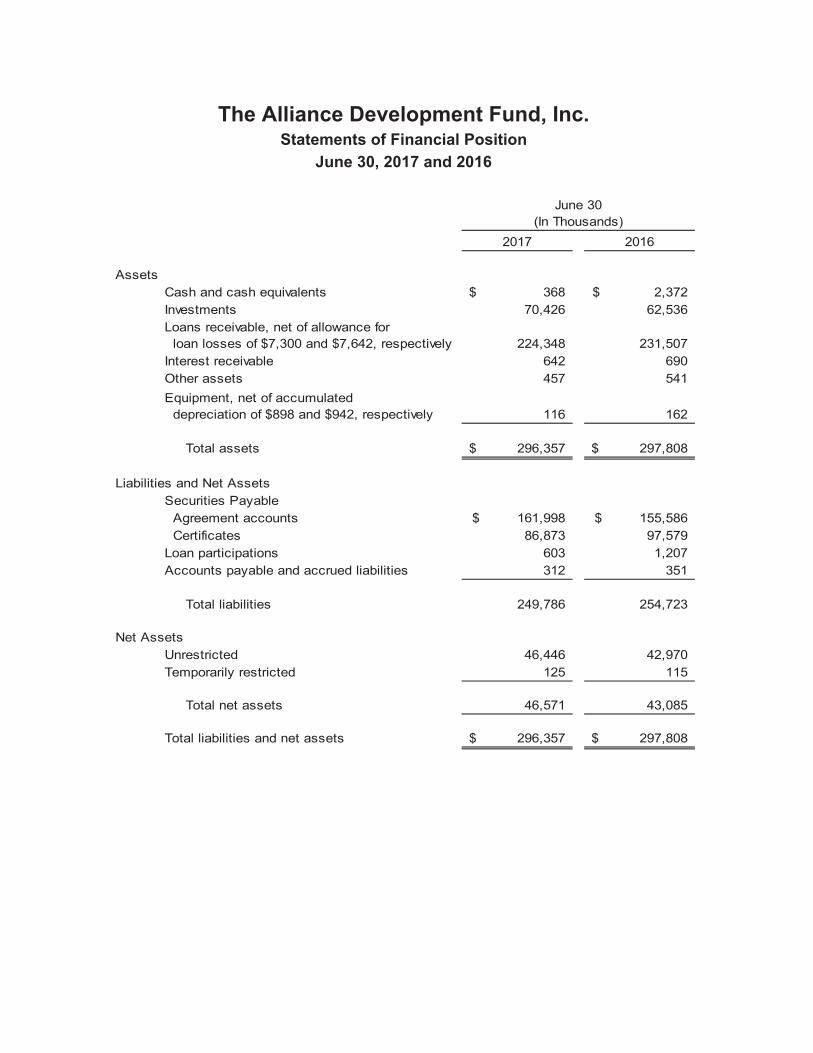
The Alliance Development Fund, Inc. Statements of Financial Position
June 30, 2017 and 2016
2017 2016
Assets Cash and cash equivalents 368$ 2,372$ Investments 70,426 62,536Loans receivable, net of allowance for loan losses of $7,300 and $7,642, respectively 224,348 231,507Interest receivable 642 690Other assets 457 541Equipment, net of accumulated depreciation of $898 and $942, respectively 116 162
Total assets 296,357$ 297,808$
Liabilities and Net AssetsSecurities Payable Agreement accounts 161,998$ 155,586$ Certificates 86,873 97,579Loan participations 603 1,207Accounts payable and accrued liabilities 312 351
Total liabilities 249,786 254,723
Net AssetsUnrestricted 46,446 42,970Temporarily restricted 125 115
Total net assets 46,571 43,085
Total liabilities and net assets 296,357$ 297,808$
(In Thousands)June 30
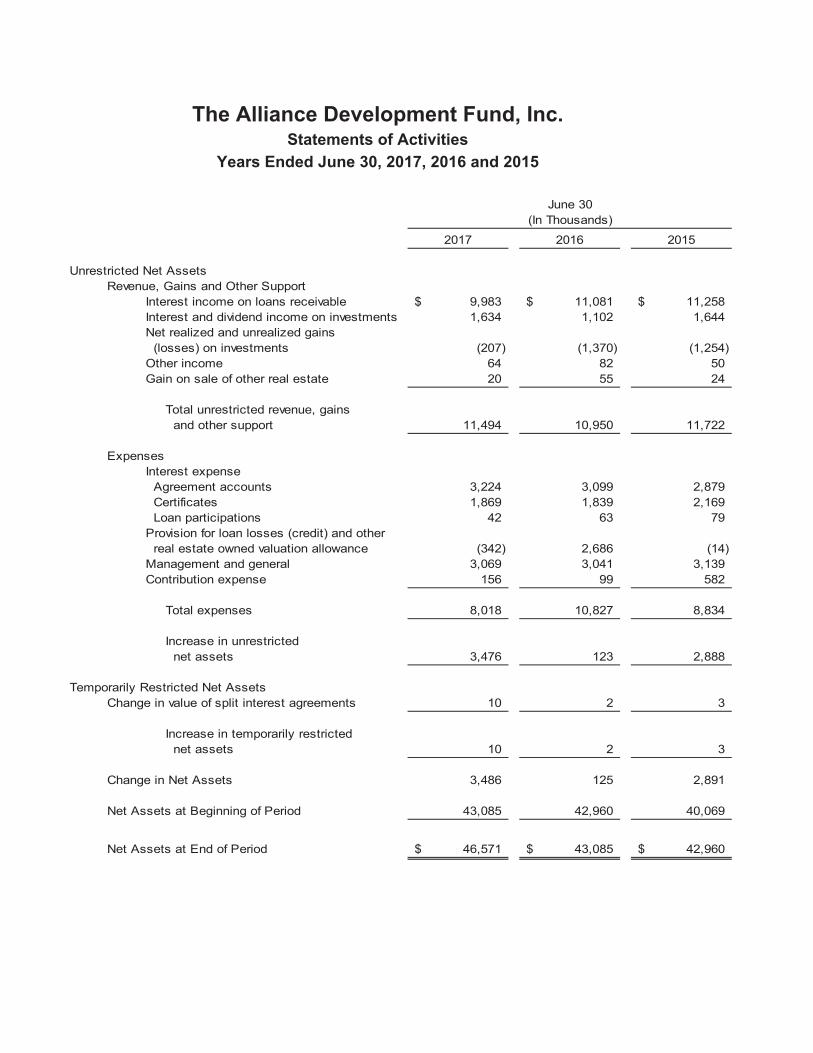
The Alliance Development Fund, Inc. Statements of Activities
Years Ended June 30, 2017, 2016 and 2015
2017 2016 2015
Unrestricted Net AssetsRevenue, Gains and Other Support
Interest income on loans receivable 9,983$ 11,081$ 11,258$ Interest and dividend income on investments 1,634 1,102 1,644Net realized and unrealized gains (losses) on investments (207) (1,370) (1,254)Other income 64 82 50Gain on sale of other real estate 20 55 24
Total unrestricted revenue, gains and other support 11,494 10,950 11,722
ExpensesInterest expense Agreement accounts 3,224 3,099 2,879 Certificates 1,869 1,839 2,169 Loan participations 42 63 79Provision for loan losses (credit) and other real estate owned valuation allowance (342) 2,686 (14)Management and general 3,069 3,041 3,139Contribution expense 156 99 582
Total expenses 8,018 10,827 8,834
Increase in unrestricted net assets 3,476 123 2,888
Temporarily Restricted Net AssetsChange in value of split interest agreements 10 2 3
Increase in temporarily restricted net assets 10 2 3
Change in Net Assets 3,486 125 2,891
Net Assets at Beginning of Period 43,085 42,960 40,069
Net Assets at End of Period 46,571$ 43,085$ 42,960$
(In Thousands)June 30
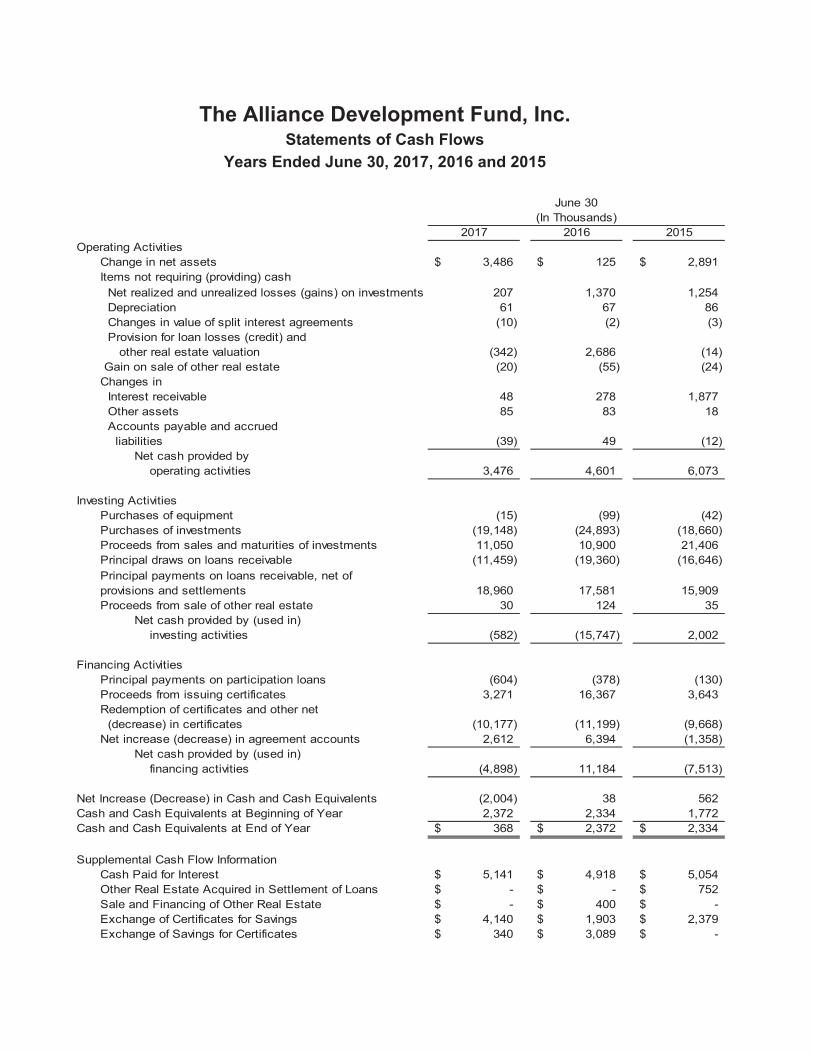
The Alliance Development Fund, Inc. Statements of Cash Flows
Years Ended June 30, 2017, 2016 and 2015
2017 2016 2015Operating Activities
Change in net assets 3,486$ 125$ 2,891$ Items not requiring (providing) cash Net realized and unrealized losses (gains) on investments 207 1,370 1,254 Depreciation 61 67 86 Changes in value of split interest agreements (10) (2) (3) Provision for loan losses (credit) and other real estate valuation (342) 2,686 (14) Gain on sale of other real estate (20) (55) (24)Changes in Interest receivable 48 278 1,877 Other assets 85 83 18 Accounts payable and accrued liabilities (39) 49 (12)
Net cash provided by operating activities 3,476 4,601 6,073
Investing ActivitiesPurchases of equipment (15) (99) (42)Purchases of investments (19,148) (24,893) (18,660)Proceeds from sales and maturities of investments 11,050 10,900 21,406Principal draws on loans receivable (11,459) (19,360) (16,646)Principal payments on loans receivable, net of provisions and settlements 18,960 17,581 15,909Proceeds from sale of other real estate 30 124 35
Net cash provided by (used in) investing activities (582) (15,747) 2,002
Financing ActivitiesPrincipal payments on participation loans (604) (378) (130)Proceeds from issuing certificates 3,271 16,367 3,643Redemption of certificates and other net (decrease) in certificates (10,177) (11,199) (9,668)Net increase (decrease) in agreement accounts 2,612 6,394 (1,358)
Net cash provided by (used in) financing activities (4,898) 11,184 (7,513)
Net Increase (Decrease) in Cash and Cash Equivalents (2,004) 38 562Cash and Cash Equivalents at Beginning of Year 2,372 2,334 1,772Cash and Cash Equivalents at End of Year 368$ 2,372$ 2,334$
Supplemental Cash Flow InformationCash Paid for Interest 5,141$ 4,918$ 5,054$ Other Real Estate Acquired in Settlement of Loans -$ -$ 752$ Sale and Financing of Other Real Estate -$ 400$ -$ Exchange of Certificates for Savings 4,140$ 1,903$ 2,379$ Exchange of Savings for Certificates 340$ 3,089$ -$
(In Thousands)June 30
The Alliance Development Fund, Inc. Notes to Financial Statements June 30, 2017, 2016 and 2015
Note 1: Nature of Operations and Summary of Significant Accounting Policies
Organization: The Alliance Development Fund, Inc. (ADF) was incorporated in the state of Colorado on January 23, 1996, to serve as a supporting organization for The Christian and Missionary Alliance (Denomination), and churches, districts and affiliated organizations of the Denomination (collectively referred to as the “Supported Organizations”). ADF began operations on January 1, 1997. The Denomination is the sole member of ADF and elects its board of directors and president.
ADF raises funds primarily through issuing debt securities to the Denomination, Supported Organizations, and individuals who are affiliated with the Denomination and Supported Organizations or who are ancestors or descendants of such individuals (eligible investors). There is no established public market for these debt securities. ADF uses funds received to issue loans, secured by real estate mortgages, to the Supported Organizations to purchase or construct new churches or parsonages, remodel existing churches or parsonages, and assist in other Supported Organizations projects. Revenue is generated primarily through interest income on loans receivable and interest, dividends, and net realized and unrealized gains on investments.
Cash and Cash Equivalents: ADF considers all liquid investments with original maturities of three months or less to be cash equivalents unless held for investment purposes. At June 30, 2017 and 2016, cash equivalents consisted primarily of checking accounts with a financial institution. At June 30, 2017, ADF’s cash accounts exceeded federally insured limits by approximately $281,000.
Loans Receivable and Interest Receivable: Loans receivable are reported at their outstanding unpaid principal balances, adjusted for the allowance for loan losses and any deferred costs on originated loans. Interest income is accrued on the unpaid principal balance, using the simple interest method. Management reserves the interest receivable on loans when payments are three or more months in arrears or when the likelihood that interest will be repaid is low. Loan origination costs are deferred and recognized as an adjustment of the related loan balance using the straight-line amortization method over the term of the loan, which approximates the interest method.
ADF’s relationship with its borrowers is unlike that of a typical commercial lender. ADF will often make loans to borrowers that would be unable to secure financing from commercial lenders. The ability of each church borrower to pay ADF may heavily depend upon the contributions the church receives from its members. Therefore, payments to ADF may depend on the continued growth in membership of the church borrower, and the contributions by church members, as well as prudent financial management by its leadership. ADF may also accommodate partial, deferred, or late payments more readily than a commercial lender. Such loan practices may result in less money being collected on delinquent loans than a commercial lender would normally collect.
The provision for loan losses charged to expense is based on management’s estimate of the amount required to maintain an allowance for loan losses adequate to cover both identified and unidentified losses in the loan portfolio. The allowance for loan losses is evaluated on a monthly basis by management and is based upon management’s periodic review of the collectability of the loans in light of historical experience, adverse situations that may affect the borrower’s ability to repay, estimated value of any underlying collateral, and prevailing economic conditions. This evaluation is inherently subjective, as it requires estimates that are susceptible to significant revision as more information becomes available. ADF used a five-year average of historical losses for loans collectively evaluated in the allowance for loan loss calculation. No significant changes were made to the allowance for loan loss methodology during the past year. The allowance for loan losses is divided into three classes, listed below, that segregate credit risks for individual loans (Specific Reserve classification) and loans evaluated collectively based on shared characteristics. There are specific reserves for individual loans based on collateral, and additional reserves for individual loans based on qualitative factors.
The Alliance Development Fund, Inc. Notes to Financial Statements June 30, 2017, 2016 and 2015
Loan classifications include:
A. Specific Reserve – Loans in this classification have a specific reserve based on a discounted cash flow model, an appraisal, market value analysis, or other analysis on collateral value and the likelihood of principal repayment. Loans in this classification generally are identified as having significant credit risks during ADF’s periodic evaluations.
B. Underperforming Loans – Loans in this classification generally do not have a specific reserve (A), but have had payments 90 days past due at some point within 24 months of the period end date. This classification is considered a high credit risk.
C. Underperforming States – Loans in this classification do not have a specific reserve (A), have not had a past due loan payment within 24 months of the period end date (B), but are located in U.S. states where property values or economic conditions have decreased year-over-year. Loans in Puerto Rico are included in this classification, based on the Federal Finance Housing Agency’s Home Price Index. This classification is considered a moderate-to-high credit risk. This classification was not used in the previous year. Certain prior year footnotes have been updated to include this category for comparative purposes in this report.
D. Performing Loans – Loans in this classification do not meet the criteria for A, B or C above. This classification is considered a low credit risk.
Management considers loans to be delinquent when payments are more than three months in arrears. Due to the volatility of church cash flows, it is not unusual to have temporarily missed or modified payments. Loans that experience this condition are not considered delinquent. Loans are considered delinquent if no permanent workout agreement exists for loans that have experienced multiple temporarily missed or modified payments.
ADF restructures loan terms to assist church borrowers that encounter financial hardships. ADF classifies a restructuring as a troubled debt restructuring if the borrower is experiencing financial difficulties and the restructuring includes a concession by ADF to the borrower. When a loan is restructured and is subsequently current with its new debt service requirements, the loan is no longer considered delinquent. The interest on these loans is accounted for on the cash-basis or cost-recovery method, until qualifying for return to accrual. Loans are returned to accrual status when the loan is no longer considered delinquent and there is the likelihood that all principal and interest will be repaid.
A loan is considered impaired when, based on current information and events, it is probable that ADF will be unable to collect the scheduled payments of principal or interest when due according to the contractual terms of the loan agreement. Factors considered by management in determining impairment include payment status, collateral value, and the probability of collecting scheduled principal and interest payments when due. Loans that experience insignificant payment delays and payment shortfalls generally are not classified as impaired. Management determines the significance of payment delays and payment shortfalls on a case-by-case basis, taking into consideration all of the circumstances surrounding the loan and the borrower, including the length of the delay, the reasons for the delay, the borrower’s prior payment record, and the amount of the shortfall in relation to the principal and interest owed. Impairment is measured on a loan-by-loan basis for loans by either the present value of expected future cash flows discounted at the loan’s effective interest rate, the loan’s obtainable market price or the fair value of the collateral if the loan is collateral dependent.
Loans with a low probability of timely repayment under current terms may be modified by providing interest-only or term extension concessions. Management will permanently charge-off loan principal on impaired loans when the impairment is not expected be repaid. If the borrower is not expected to meet the terms of a new loan with minor concessions, the whole or part of the loan is charged off or the loan is foreclosed upon and the property is sold at current market value.
The Alliance Development Fund, Inc. Notes to Financial Statements June 30, 2017, 2016 and 2015
Investments: Investments in equity securities with readily determinable fair values, annuity contracts, and all debt securities are recorded at fair value. Investments without readily determinable fair values are recorded at cost or, if impaired, at estimated realizable value. Alternative investments are carried at net asset values as determined by the fund managers.
Investments in mutual funds and other investments may hold cash that is not guaranteed by the Federal Deposit Insurance Corporation (FDIC). This cash is classified as investments within the statements of financial position, as illustrated within Note 2.
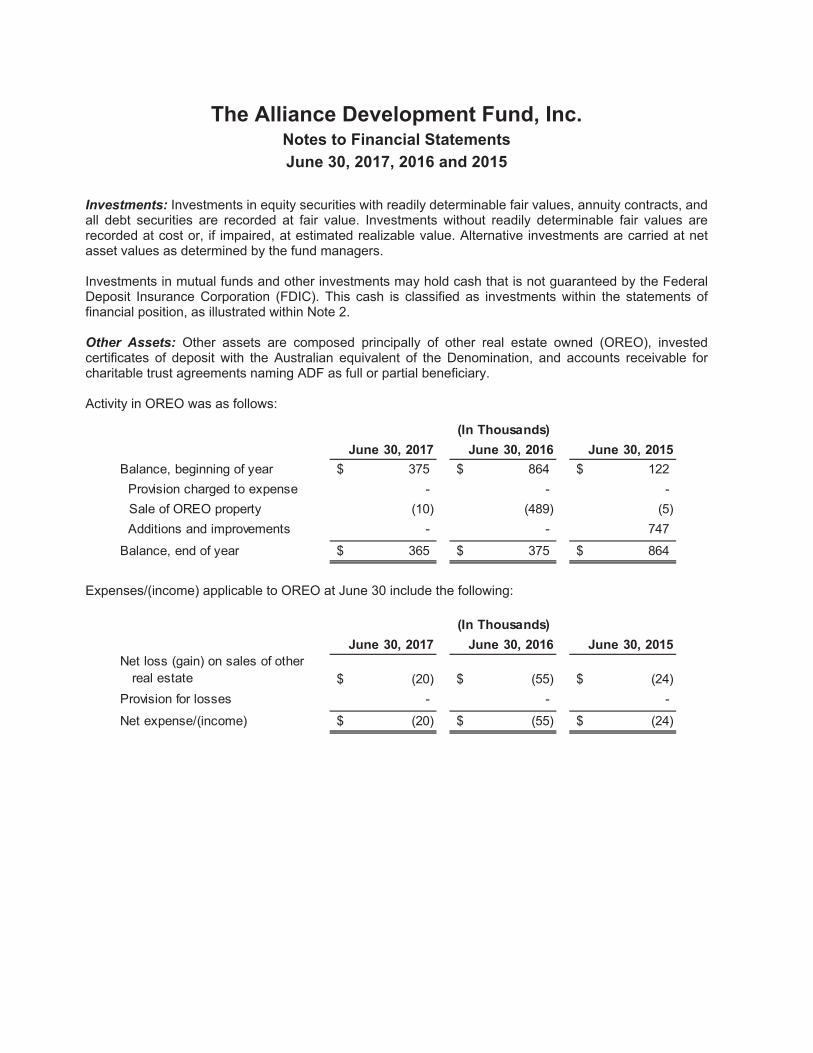
Other Assets: Other assets are composed principally of other real estate owned (OREO), invested certificates of deposit with the Australian equivalent of the Denomination, and accounts receivable for charitable trust agreements naming ADF as full or partial beneficiary.
Activity in OREO was as follows:
Expenses/(income) applicable to OREO at June 30 include the following:
June 30, 2017 June 30, 2016 June 30, 2015Balance, beginning of year 375$ 864$ 122$ Provision charged to expense - - -
Sale of OREO property (10) (489) (5) Additions and improvements - - 747
Balance, end of year 365$ 375$ 864$
(In Thousands)
June 30, 2017 June 30, 2016 June 30, 2015Net loss (gain) on sales of other real estate (20)$ (55)$ (24)$ Provision for losses - - -
Net expense/(income) (20)$ (55)$ (24)$
(In Thousands)
The Alliance Development Fund, Inc. Notes to Financial Statements June 30, 2017, 2016 and 2015
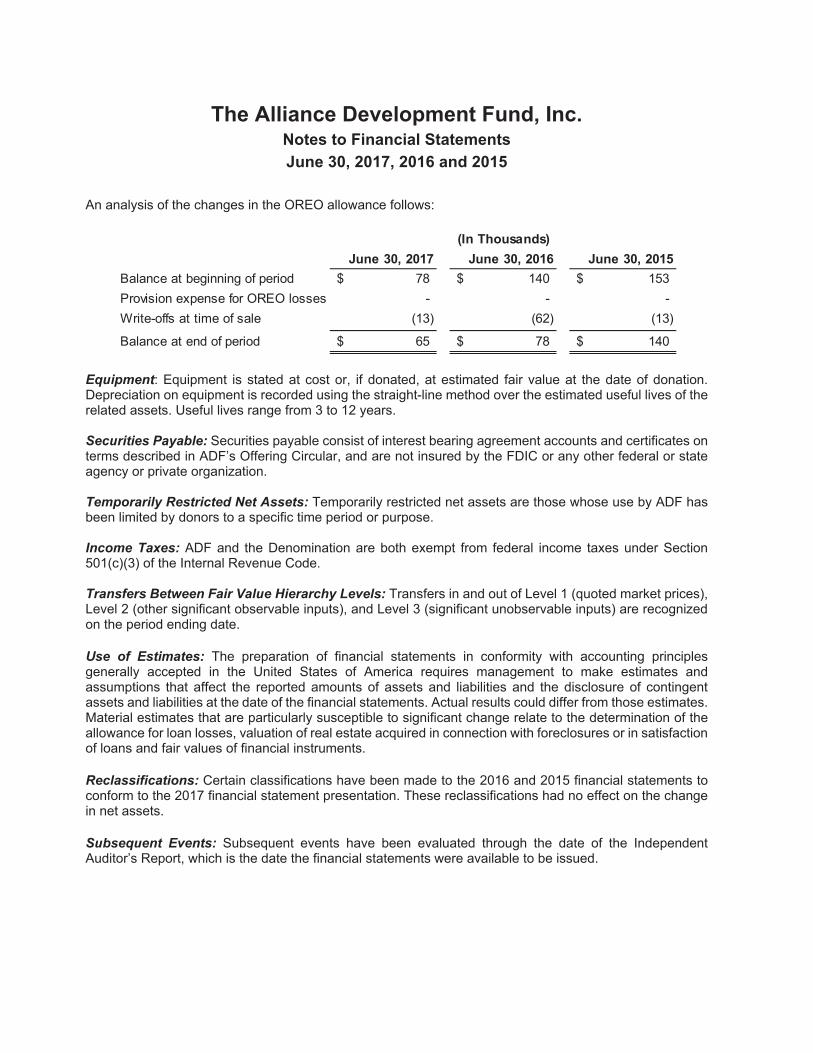
An analysis of the changes in the OREO allowance follows:
Equipment: Equipment is stated at cost or, if donated, at estimated fair value at the date of donation. Depreciation on equipment is recorded using the straight-line method over the estimated useful lives of the related assets. Useful lives range from 3 to 12 years.
Securities Payable: Securities payable consist of interest bearing agreement accounts and certificates on terms described in ADF’s Offering Circular, and are not insured by the FDIC or any other federal or state agency or private organization.
Temporarily Restricted Net Assets: Temporarily restricted net assets are those whose use by ADF has been limited by donors to a specific time period or purpose.
Income Taxes: ADF and the Denomination are both exempt from federal income taxes under Section 501(c)(3) of the Internal Revenue Code.
Transfers Between Fair Value Hierarchy Levels: Transfers in and out of Level 1 (quoted market prices), Level 2 (other significant observable inputs), and Level 3 (significant unobservable inputs) are recognized on the period ending date.
Use of Estimates: The preparation of financial statements in conformity with accounting principles generally accepted in the United States of America requires management to make estimates and assumptions that affect the reported amounts of assets and liabilities and the disclosure of contingent assets and liabilities at the date of the financial statements. Actual results could differ from those estimates. Material estimates that are particularly susceptible to significant change relate to the determination of the allowance for loan losses, valuation of real estate acquired in connection with foreclosures or in satisfaction of loans and fair values of financial instruments.
Reclassifications: Certain classifications have been made to the 2016 and 2015 financial statements to conform to the 2017 financial statement presentation. These reclassifications had no effect on the change in net assets.
Subsequent Events: Subsequent events have been evaluated through the date of the Independent Auditor’s Report, which is the date the financial statements were available to be issued.
June 30, 2017 June 30, 2016 June 30, 2015Balance at beginning of period 78$ 140$ 153$ Provision expense for OREO losses - - - Write-offs at time of sale (13) (62) (13)
Balance at end of period 65$ 78$ 140$
(In Thousands)
The Alliance Development Fund, Inc. Notes to Financial Statements June 30, 2017, 2016 and 2015
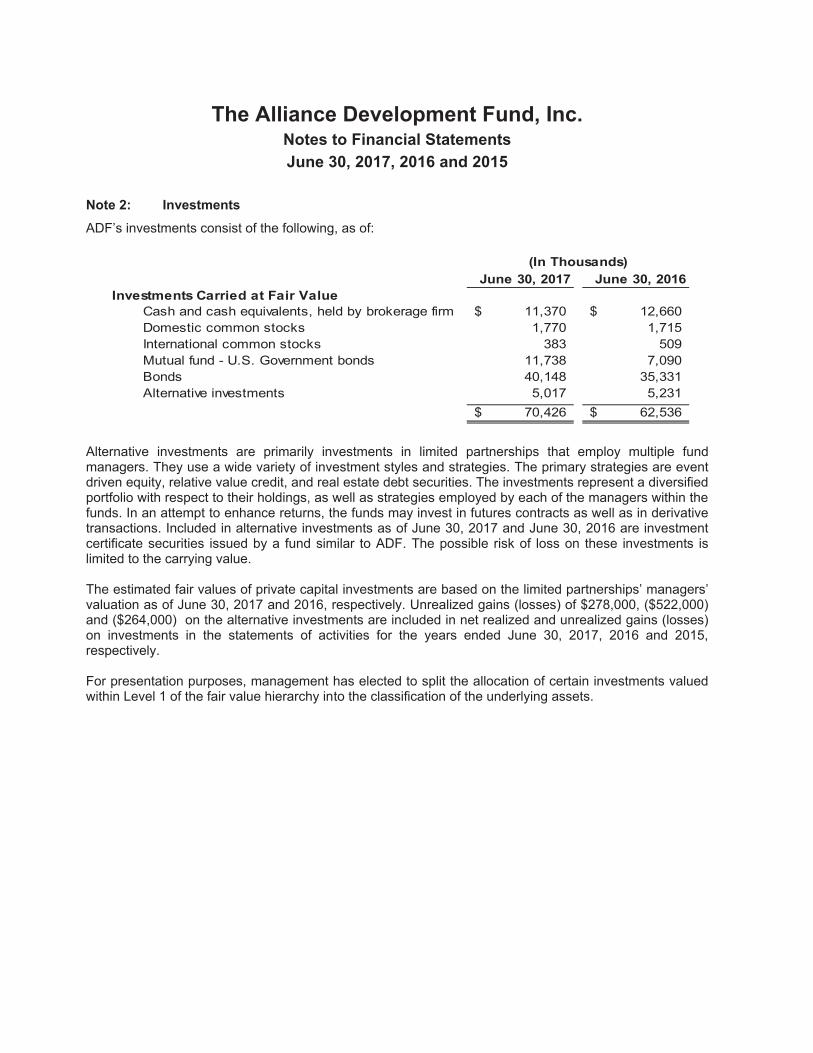
Note 2: Investments
ADF’s investments consist of the following, as of:
June 30, 2017 June 30, 2016Investments Carried at Fair Value
Cash and cash equivalents, held by brokerage firm 11,370$ 12,660$ Domestic common stocks 1,770 1,715International common stocks 383 509Mutual fund - U.S. Government bonds 11,738 7,090Bonds 40,148 35,331Alternative investments 5,017 5,231
70,426$ 62,536$
(In Thousands)
Alternative investments are primarily investments in limited partnerships that employ multiple fund managers. They use a wide variety of investment styles and strategies. The primary strategies are event driven equity, relative value credit, and real estate debt securities. The investments represent a diversified portfolio with respect to their holdings, as well as strategies employed by each of the managers within the funds. In an attempt to enhance returns, the funds may invest in futures contracts as well as in derivative transactions. Included in alternative investments as of June 30, 2017 and June 30, 2016 are investment certificate securities issued by a fund similar to ADF. The possible risk of loss on these investments is limited to the carrying value.
The estimated fair values of private capital investments are based on the limited partnerships’ managers’ valuation as of June 30, 2017 and 2016, respectively. Unrealized gains (losses) of $278,000, ($522,000) and ($264,000) on the alternative investments are included in net realized and unrealized gains (losses) on investments in the statements of activities for the years ended June 30, 2017, 2016 and 2015, respectively.
For presentation purposes, management has elected to split the allocation of certain investments valued within Level 1 of the fair value hierarchy into the classification of the underlying assets.
The Alliance Development Fund, Inc. Notes to Financial Statements June 30, 2017, 2016 and 2015
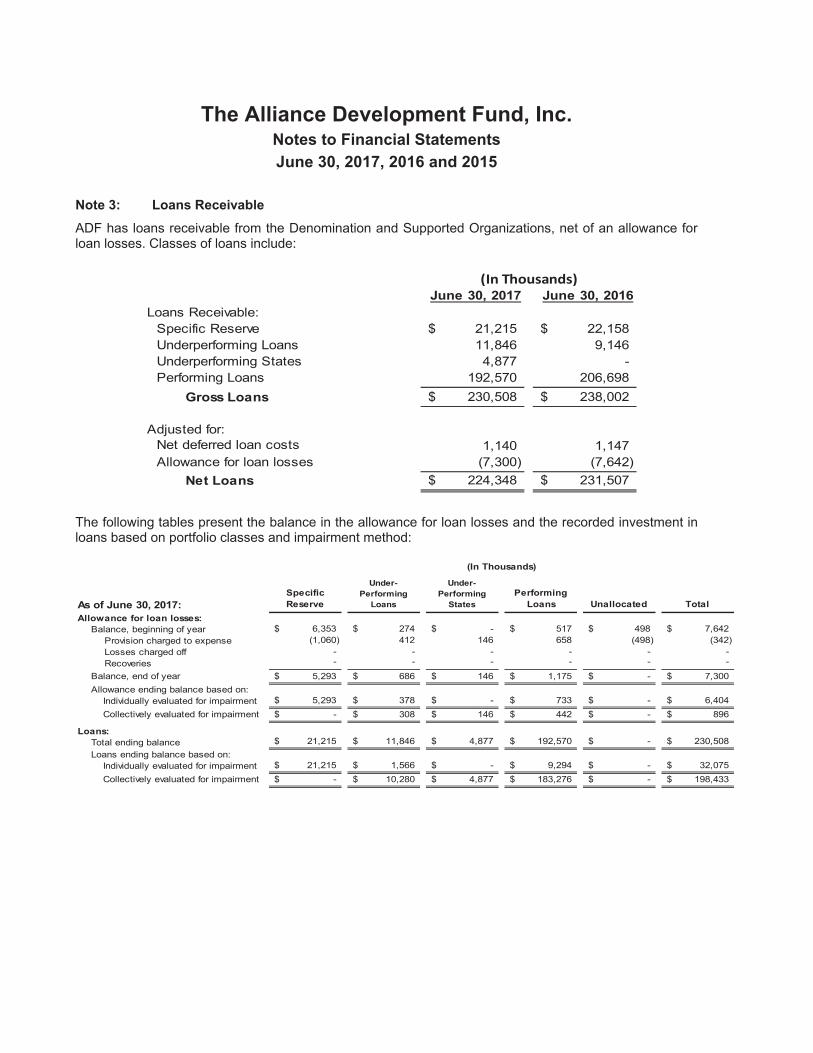
Note 3: Loans Receivable
ADF has loans receivable from the Denomination and Supported Organizations, net of an allowance for loan losses. Classes of loans include:
June 30, 2017 June 30, 2016Loans Receivable:
Specific Reserve 21,215$ 22,158$ Underperforming Loans 11,846 9,146Underperforming States 4,877 - Performing Loans 192,570 206,698
Gross Loans 230,508$ 238,002$
Adjusted for:Net deferred loan costs 1,140 1,147Allowance for loan losses (7,300) (7,642)
Net Loans 224,348$ 231,507$
(In Thousands)
The following tables present the balance in the allowance for loan losses and the recorded investment in loans based on portfolio classes and impairment method:
As of June 30, 2017:Specific Reserve
Under- Performing
Loans
Under- Performing
StatesPerforming
Loans Unallocated TotalAllowance for loan losses:
Balance, beginning of year 6,353$ 274$ -$ 517$ 498$ 7,642$ Provision charged to expense (1,060) 412 146 658 (498) (342)Losses charged off - - - - - - Recoveries - - - - - -
Balance, end of year 5,293$ 686$ 146$ 1,175$ -$ 7,300$ Allowance ending balance based on: Individually evaluated for impairment 5,293$ 378$ -$ 733$ -$ 6,404$ Collectively evaluated for impairment -$ 308$ 146$ 442$ -$ 896$
Loans:Total ending balance 21,215$ 11,846$ 4,877$ 192,570$ -$ 230,508$ Loans ending balance based on: Individually evaluated for impairment 21,215$ 1,566$ -$ 9,294$ -$ 32,075$ Collectively evaluated for impairment -$ 10,280$ 4,877$ 183,276$ -$ 198,433$
(In Thousands)
The Alliance Development Fund, Inc. Notes to Financial Statements June 30, 2017, 2016 and 2015
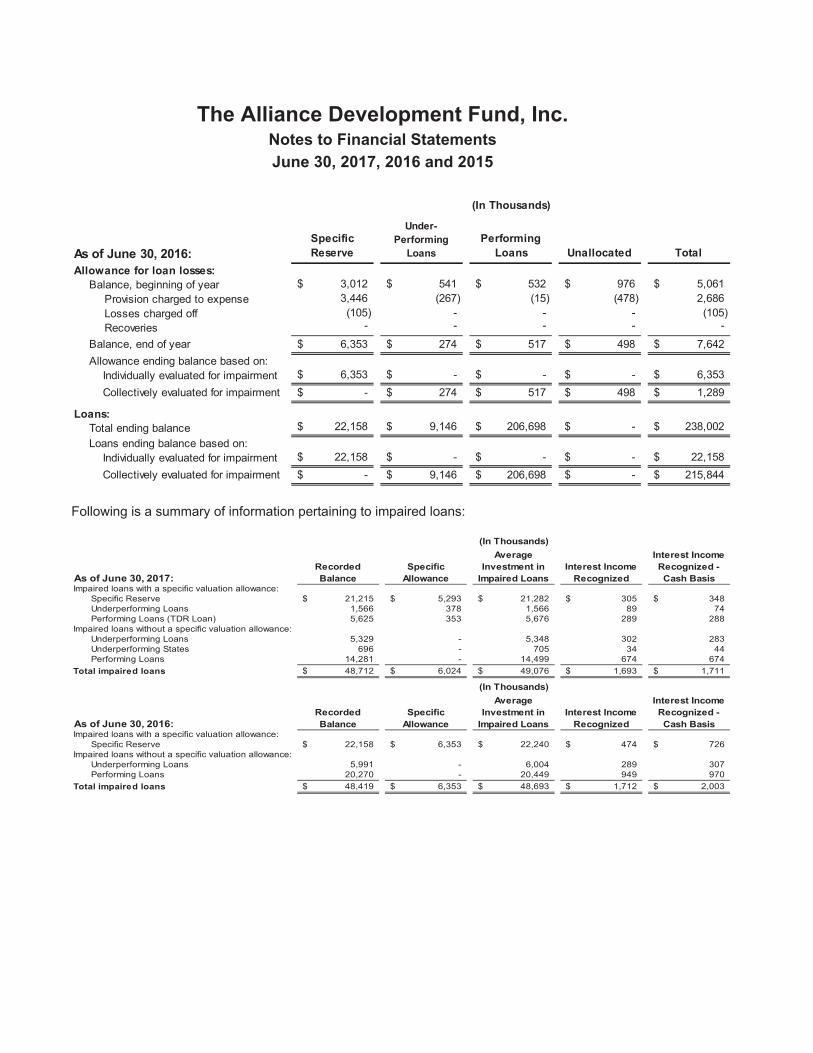
Following is a summary of information pertaining to impaired loans:
As of June 30, 2017:Recorded Balance
Specific Allowance
Average Investment in
Impaired LoansInterest Income
Recognized
Interest Income Recognized - Cash Basis
Impaired loans with a specific valuation allowance:Specific Reserve 21,215$ 5,293$ 21,282$ 305$ 348$ Underperforming Loans 1,566 378 1,566 89 74Performing Loans (TDR Loan) 5,625 353 5,676 289 288
Impaired loans without a specific valuation allowance:Underperforming Loans 5,329 - 5,348 302 283Underperforming States 696 - 705 34 44Performing Loans 14,281 - 14,499 674 674
Total impaired loans 48,712$ 6,024$ 49,076$ 1,693$ 1,711$
As of June 30, 2016:Recorded Balance
Specific Allowance
Average Investment in
Impaired LoansInterest Income
Recognized
Interest Income Recognized - Cash Basis
Impaired loans with a specific valuation allowance:Specific Reserve 22,158$ 6,353$ 22,240$ 474$ 726$
Impaired loans without a specific valuation allowance:Underperforming Loans 5,991 - 6,004 289 307Performing Loans 20,270 - 20,449 949 970
Total impaired loans 48,419$ 6,353$ 48,693$ 1,712$ 2,003$
(In Thousands)
(In Thousands)
As of June 30, 2016:Specific Reserve
Under- Performing
LoansPerforming
Loans Unallocated TotalAllowance for loan losses:
Balance, beginning of year 3,012$ 541$ 532$ 976$ 5,061$ Provision charged to expense 3,446 (267) (15) (478) 2,686Losses charged off (105) - - - (105)Recoveries - - - - -
Balance, end of year 6,353$ 274$ 517$ 498$ 7,642$ Allowance ending balance based on: Individually evaluated for impairment 6,353$ -$ -$ -$ 6,353$ Collectively evaluated for impairment -$ 274$ 517$ 498$ 1,289$
Loans:Total ending balance 22,158$ 9,146$ 206,698$ -$ 238,002$ Loans ending balance based on: Individually evaluated for impairment 22,158$ -$ -$ -$ 22,158$ Collectively evaluated for impairment -$ 9,146$ 206,698$ -$ 215,844$
(In Thousands)
The Alliance Development Fund, Inc. Notes to Financial Statements June 30, 2017, 2016 and 2015
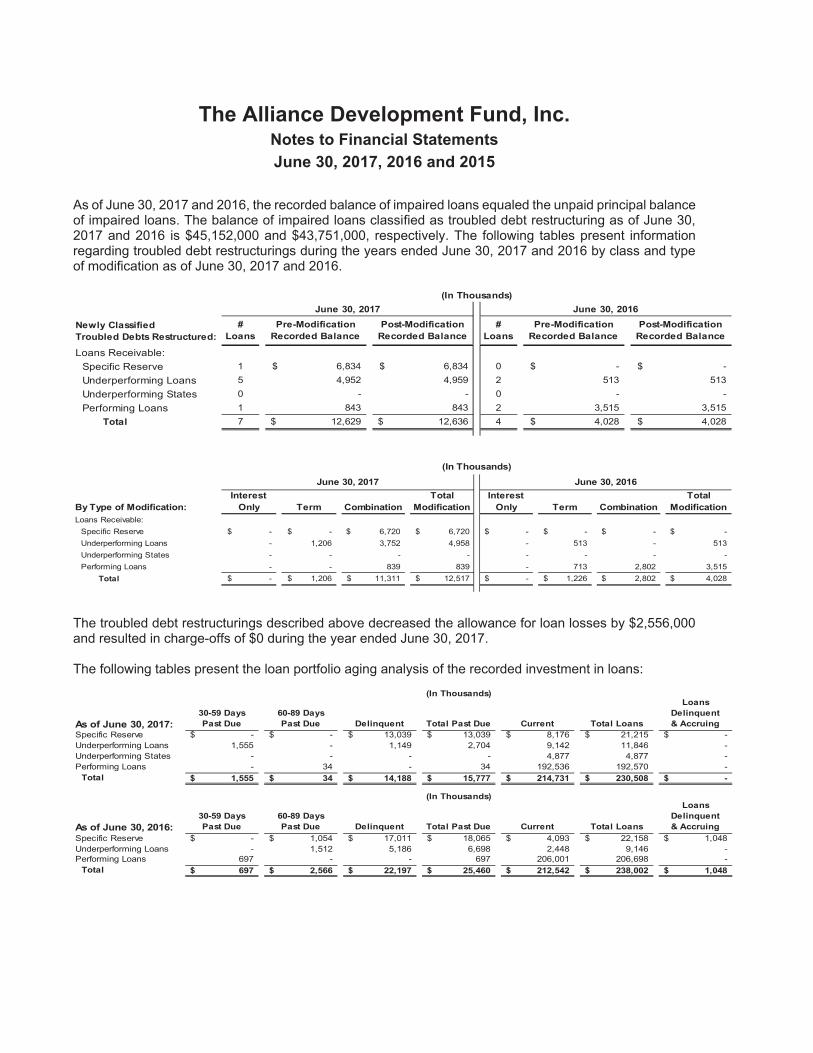
As of June 30, 2017 and 2016, the recorded balance of impaired loans equaled the unpaid principal balance of impaired loans. The balance of impaired loans classified as troubled debt restructuring as of June 30, 2017 and 2016 is $45,152,000 and $43,751,000, respectively. The following tables present information regarding troubled debt restructurings during the years ended June 30, 2017 and 2016 by class and type of modification as of June 30, 2017 and 2016.
Newly Classified Troubled Debts Restructured:
#Loans
Pre-Modification Recorded Balance
Post-Modification Recorded Balance
#Loans
Pre-Modification Recorded Balance
Post-Modification Recorded Balance
Loans Receivable:Specific Reserve 1 6,834$ 6,834$ 0 -$ -$ Underperforming Loans 5 4,952 4,959 2 513 513Underperforming States 0 - - 0 - - Performing Loans 1 843 843 2 3,515 3,515
Total 7 12,629$ 12,636$ 4 4,028$ 4,028$
June 30, 2017 June 30, 2016(In Thousands)
By Type of Modification:Interest
Only Term CombinationTotal
ModificationInterest
Only Term CombinationTotal
ModificationLoans Receivable:
Specific Reserve -$ -$ 6,720$ 6,720$ -$ -$ -$ -$ Underperforming Loans - 1,206 3,752 4,958 - 513 - 513Underperforming States - - - - - - - - Performing Loans - - 839 839 - 713 2,802 3,515
Total -$ 1,206$ 11,311$ 12,517$ -$ 1,226$ 2,802$ 4,028$
June 30, 2017 June 30, 2016
(In Thousands)
The troubled debt restructurings described above decreased the allowance for loan losses by $2,556,000 and resulted in charge-offs of $0 during the year ended June 30, 2017.
The following tables present the loan portfolio aging analysis of the recorded investment in loans:
As of June 30, 2017:30-59 Days Past Due
60-89 Days Past Due Delinquent Total Past Due Current Total Loans
Loans Delinquent& Accruing
Specific Reserve -$ -$ 13,039$ 13,039$ 8,176$ 21,215$ -$ Underperforming Loans 1,555 - 1,149 2,704 9,142 11,846 - Underperforming States - - - - 4,877 4,877 - Performing Loans - 34 - 34 192,536 192,570 -
Total 1,555$ 34$ 14,188$ 15,777$ 214,731$ 230,508$ -$
As of June 30, 2016:30-59 Days Past Due
60-89 Days Past Due Delinquent Total Past Due Current Total Loans
Loans Delinquent& Accruing
Specific Reserve -$ 1,054$ 17,011$ 18,065$ 4,093$ 22,158$ 1,048$ Underperforming Loans - 1,512 5,186 6,698 2,448 9,146 - Performing Loans 697 - - 697 206,001 206,698 -
Total 697$ 2,566$ 22,197$ 25,460$ 212,542$ 238,002$ 1,048$
(In Thousands)
(In Thousands)
The Alliance Development Fund, Inc. Notes to Financial Statements June 30, 2017, 2016 and 2015
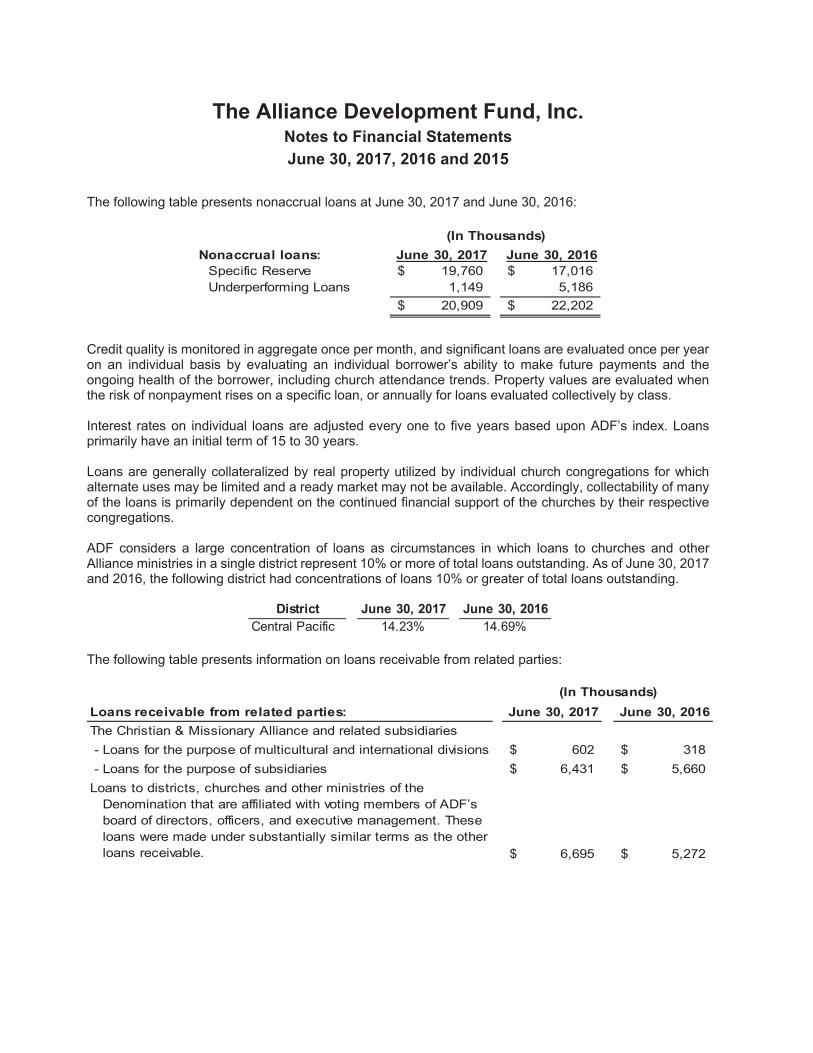
The following table presents nonaccrual loans at June 30, 2017 and June 30, 2016:
Nonaccrual loans: June 30, 2017 June 30, 2016Specific Reserve 19,760$ 17,016$ Underperforming Loans 1,149 5,186
20,909$ 22,202$
(In Thousands)
Credit quality is monitored in aggregate once per month, and significant loans are evaluated once per year on an individual basis by evaluating an individual borrower’s ability to make future payments and the ongoing health of the borrower, including church attendance trends. Property values are evaluated when the risk of nonpayment rises on a specific loan, or annually for loans evaluated collectively by class.
Interest rates on individual loans are adjusted every one to five years based upon ADF’s index. Loans primarily have an initial term of 15 to 30 years.
Loans are generally collateralized by real property utilized by individual church congregations for which alternate uses may be limited and a ready market may not be available. Accordingly, collectability of many of the loans is primarily dependent on the continued financial support of the churches by their respective congregations.
ADF considers a large concentration of loans as circumstances in which loans to churches and other Alliance ministries in a single district represent 10% or more of total loans outstanding. As of June 30, 2017 and 2016, the following district had concentrations of loans 10% or greater of total loans outstanding.
The following table presents information on loans receivable from related parties:
Loans receivable from related parties: June 30, 2017 June 30, 2016The Christian & Missionary Alliance and related subsidiaries - Loans for the purpose of multicultural and international divisions 602$ 318$ - Loans for the purpose of subsidiaries 6,431$ 5,660$ Loans to districts, churches and other ministries of the Denomination that are affiliated with voting members of ADF’s board of directors, officers, and executive management. These loans were made under substantially similar terms as the other loans receivable. 6,695$ 5,272$
(In Thousands)
June 30, 2017 June 30, 2016Central Pacific 14.23% 14.69%
District
The Alliance Development Fund, Inc. Notes to Financial Statements June 30, 2017, 2016 and 2015
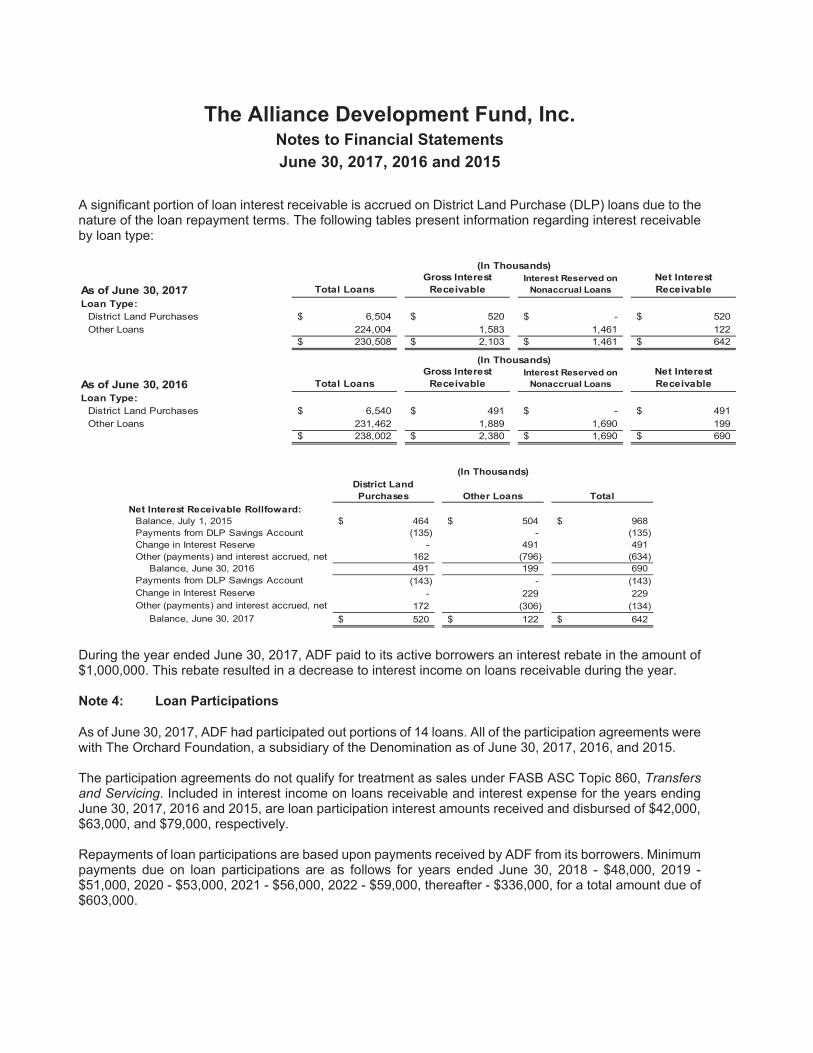
A significant portion of loan interest receivable is accrued on District Land Purchase (DLP) loans due to the nature of the loan repayment terms. The following tables present information regarding interest receivable by loan type:
As of June 30, 2017 Total LoansGross Interest
ReceivableInterest Reserved on
Nonaccrual LoansNet Interest Receivable
Loan Type:District Land Purchases 6,504$ 520$ -$ 520$ Other Loans 224,004 1,583 1,461 122
230,508$ 2,103$ 1,461$ 642$
As of June 30, 2016 Total LoansGross Interest
ReceivableInterest Reserved on
Nonaccrual LoansNet Interest Receivable
Loan Type:District Land Purchases 6,540$ 491$ -$ 491$ Other Loans 231,462 1,889 1,690 199
238,002$ 2,380$ 1,690$ 690$
(In Thousands)
(In Thousands)
District Land Purchases Other Loans Total
Net Interest Receivable Rollfoward:Balance, July 1, 2015 464$ 504$ 968$ Payments from DLP Savings Account (135) - (135)Change in Interest Reserve - 491 491Other (payments) and interest accrued, net 162 (796) (634)
Balance, June 30, 2016 491 199 690Payments from DLP Savings Account (143) - (143)Change in Interest Reserve - 229 229Other (payments) and interest accrued, net 172 (306) (134)
Balance, June 30, 2017 520$ 122$ 642$
(In Thousands)
During the year ended June 30, 2017, ADF paid to its active borrowers an interest rebate in the amount of $1,000,000. This rebate resulted in a decrease to interest income on loans receivable during the year.
Note 4: Loan Participations
As of June 30, 2017, ADF had participated out portions of 14 loans. All of the participation agreements were with The Orchard Foundation, a subsidiary of the Denomination as of June 30, 2017, 2016, and 2015.
The participation agreements do not qualify for treatment as sales under FASB ASC Topic 860, Transfers and Servicing. Included in interest income on loans receivable and interest expense for the years ending June 30, 2017, 2016 and 2015, are loan participation interest amounts received and disbursed of $42,000, $63,000, and $79,000, respectively.
Repayments of loan participations are based upon payments received by ADF from its borrowers. Minimum payments due on loan participations are as follows for years ended June 30, 2018 - $48,000, 2019 - $51,000, 2020 - $53,000, 2021 - $56,000, 2022 - $59,000, thereafter - $336,000, for a total amount due of $603,000.
The Alliance Development Fund, Inc. Notes to Financial Statements June 30, 2017, 2016 and 2015
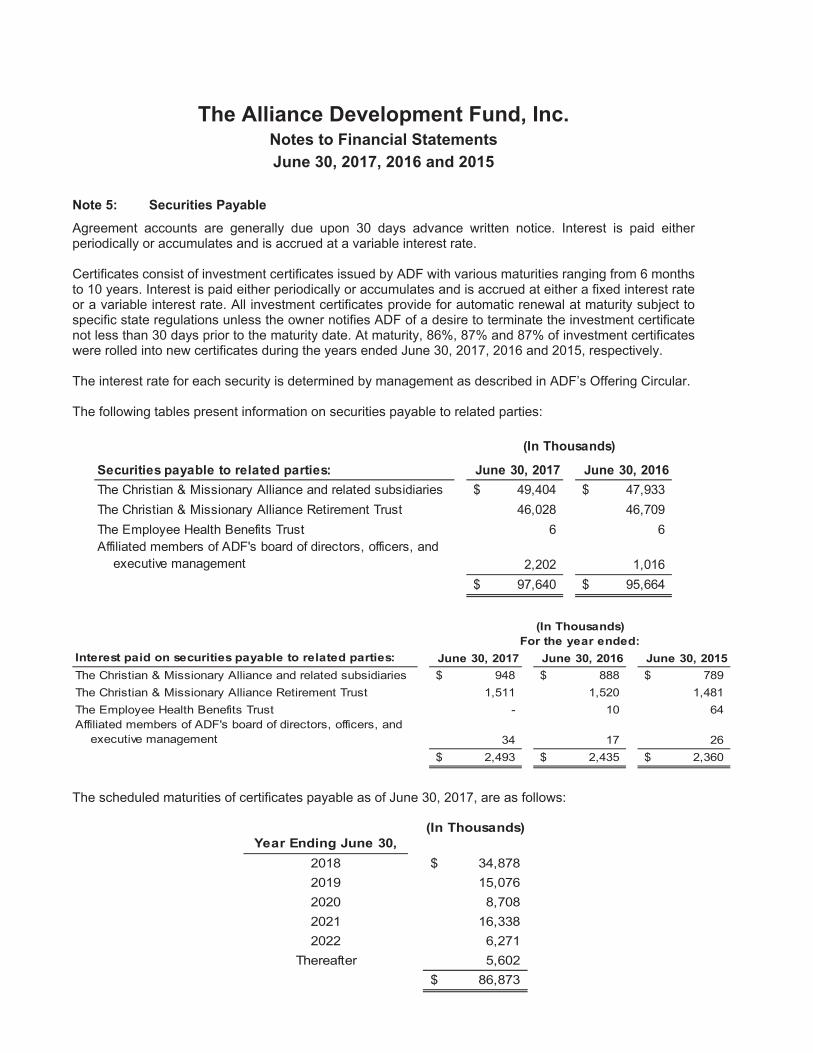
Note 5: Securities Payable
Agreement accounts are generally due upon 30 days advance written notice. Interest is paid either periodically or accumulates and is accrued at a variable interest rate.
Certificates consist of investment certificates issued by ADF with various maturities ranging from 6 months to 10 years. Interest is paid either periodically or accumulates and is accrued at either a fixed interest rate or a variable interest rate. All investment certificates provide for automatic renewal at maturity subject to specific state regulations unless the owner notifies ADF of a desire to terminate the investment certificate not less than 30 days prior to the maturity date. At maturity, 86%, 87% and 87% of investment certificates were rolled into new certificates during the years ended June 30, 2017, 2016 and 2015, respectively.
The interest rate for each security is determined by management as described in ADF’s Offering Circular.
The following tables present information on securities payable to related parties:
Interest paid on securities payable to related parties: June 30, 2017 June 30, 2016 June 30, 2015The Christian & Missionary Alliance and related subsidiaries 948$ 888$ 789$ The Christian & Missionary Alliance Retirement Trust 1,511 1,520 1,481The Employee Health Benefits Trust - 10 64Affiliated members of ADF's board of directors, officers, and executive management 34 17 26
2,493$ 2,435$ 2,360$
(In Thousands)For the year ended:
The scheduled maturities of certificates payable as of June 30, 2017, are as follows:
(In Thousands)Year Ending June 30,
2018 34,878$ 2019 15,0762020 8,7082021 16,3382022 6,271
Thereafter 5,60286,873$
Securities payable to related parties: June 30, 2017 June 30, 2016The Christian & Missionary Alliance and related subsidiaries 49,404$ 47,933$ The Christian & Missionary Alliance Retirement Trust 46,028 46,709The Employee Health Benefits Trust 6 6Affiliated members of ADF's board of directors, officers, and executive management 2,202 1,016
97,640$ 95,664$
(In Thousands)
The Alliance Development Fund, Inc. Notes to Financial Statements June 30, 2017, 2016 and 2015
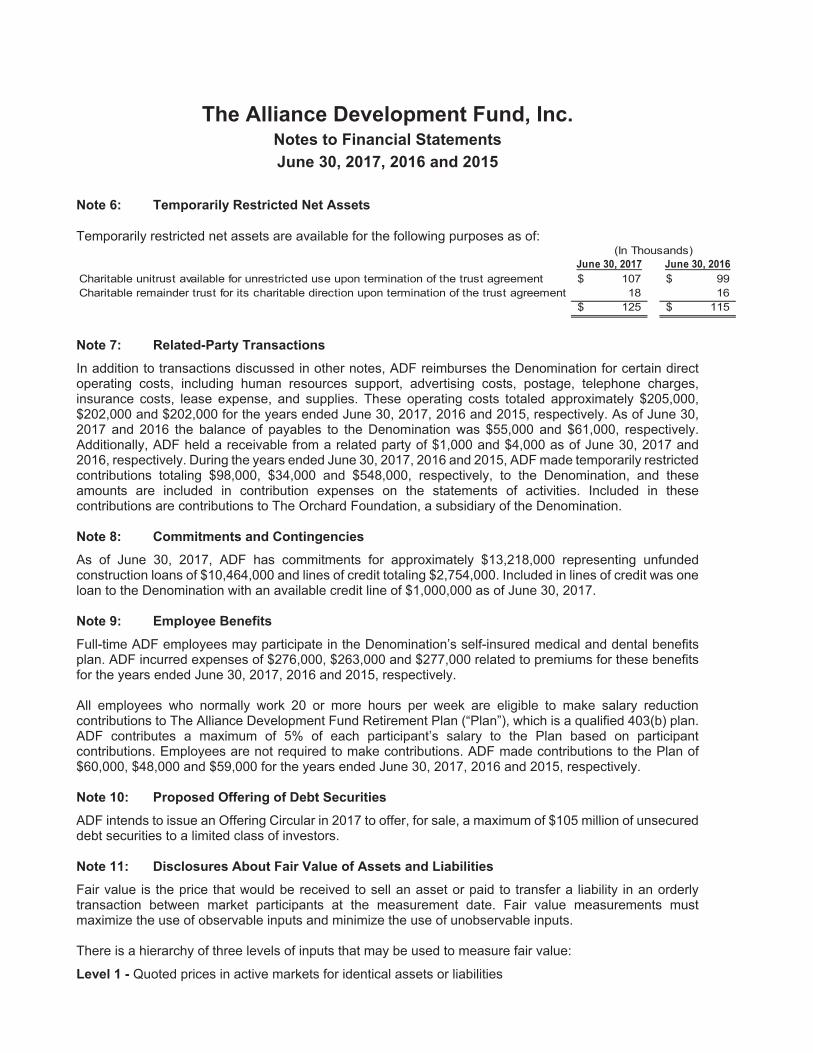
Note 6: Temporarily Restricted Net Assets
Temporarily restricted net assets are available for the following purposes as of:
June 30, 2017 June 30, 2016Charitable unitrust available for unrestricted use upon termination of the trust agreement 107$ 99$ Charitable remainder trust for its charitable direction upon termination of the trust agreement 18 16
125$ 115$
(In Thousands)
Note 7: Related-Party Transactions
In addition to transactions discussed in other notes, ADF reimburses the Denomination for certain direct operating costs, including human resources support, advertising costs, postage, telephone charges, insurance costs, lease expense, and supplies. These operating costs totaled approximately $205,000, $202,000 and $202,000 for the years ended June 30, 2017, 2016 and 2015, respectively. As of June 30, 2017 and 2016 the balance of payables to the Denomination was $55,000 and $61,000, respectively. Additionally, ADF held a receivable from a related party of $1,000 and $4,000 as of June 30, 2017 and 2016, respectively. During the years ended June 30, 2017, 2016 and 2015, ADF made temporarily restricted contributions totaling $98,000, $34,000 and $548,000, respectively, to the Denomination, and these amounts are included in contribution expenses on the statements of activities. Included in these contributions are contributions to The Orchard Foundation, a subsidiary of the Denomination.
Note 8: Commitments and Contingencies
As of June 30, 2017, ADF has commitments for approximately $13,218,000 representing unfunded construction loans of $10,464,000 and lines of credit totaling $2,754,000. Included in lines of credit was one loan to the Denomination with an available credit line of $1,000,000 as of June 30, 2017.
Note 9: Employee Benefits
Full-time ADF employees may participate in the Denomination’s self-insured medical and dental benefits plan. ADF incurred expenses of $276,000, $263,000 and $277,000 related to premiums for these benefits for the years ended June 30, 2017, 2016 and 2015, respectively.
All employees who normally work 20 or more hours per week are eligible to make salary reduction contributions to The Alliance Development Fund Retirement Plan (“Plan”), which is a qualified 403(b) plan. ADF contributes a maximum of 5% of each participant’s salary to the Plan based on participant contributions. Employees are not required to make contributions. ADF made contributions to the Plan of $60,000, $48,000 and $59,000 for the years ended June 30, 2017, 2016 and 2015, respectively.
Note 10: Proposed Offering of Debt Securities
ADF intends to issue an Offering Circular in 2017 to offer, for sale, a maximum of $105 million of unsecured debt securities to a limited class of investors.
Note 11: Disclosures About Fair Value of Assets and Liabilities
Fair value is the price that would be received to sell an asset or paid to transfer a liability in an orderly transaction between market participants at the measurement date. Fair value measurements must maximize the use of observable inputs and minimize the use of unobservable inputs.
There is a hierarchy of three levels of inputs that may be used to measure fair value:
Level 1 - Quoted prices in active markets for identical assets or liabilities
The Alliance Development Fund, Inc. Notes to Financial Statements June 30, 2017, 2016 and 2015
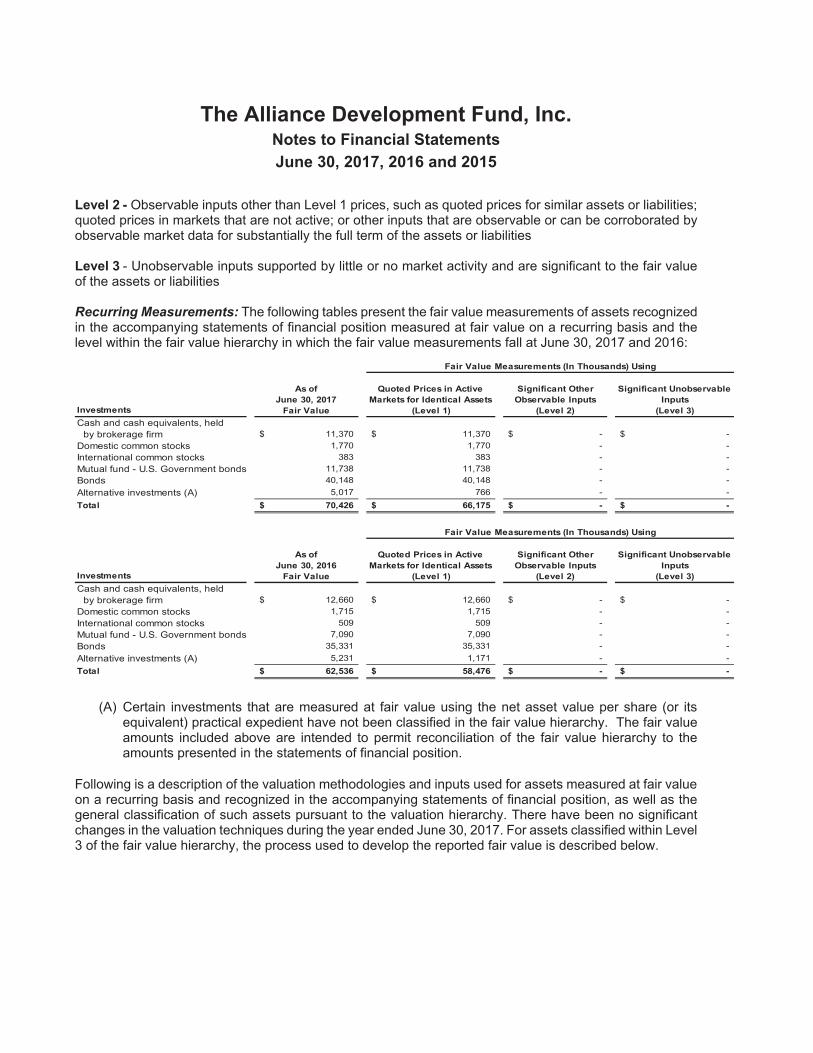
Level 2 - Observable inputs other than Level 1 prices, such as quoted prices for similar assets or liabilities; quoted prices in markets that are not active; or other inputs that are observable or can be corroborated by observable market data for substantially the full term of the assets or liabilities
Level 3 - Unobservable inputs supported by little or no market activity and are significant to the fair value of the assets or liabilities
Recurring Measurements: The following tables present the fair value measurements of assets recognized in the accompanying statements of financial position measured at fair value on a recurring basis and the level within the fair value hierarchy in which the fair value measurements fall at June 30, 2017 and 2016:
As ofJune 30, 2017
Quoted Prices in Active Markets for Identical Assets
Significant Other Observable Inputs
Significant Unobservable Inputs
Investments Fair Value (Level 1) (Level 2) (Level 3)Cash and cash equivalents, held
by brokerage firm 11,370$ 11,370$ -$ -$ Domestic common stocks 1,770 1,770 - - International common stocks 383 383 - - Mutual fund - U.S. Government bonds 11,738 11,738 - - Bonds 40,148 40,148 - - Alternative investments (A) 5,017 766 - - Total 70,426$ 66,175$ -$ -$
As ofJune 30, 2016
Quoted Prices in Active Markets for Identical Assets
Significant Other Observable Inputs
Significant Unobservable Inputs
Investments Fair Value (Level 1) (Level 2) (Level 3)Cash and cash equivalents, held
by brokerage firm 12,660$ 12,660$ -$ -$ Domestic common stocks 1,715 1,715 - - International common stocks 509 509 - - Mutual fund - U.S. Government bonds 7,090 7,090 - - Bonds 35,331 35,331 - - Alternative investments (A) 5,231 1,171 - - Total 62,536$ 58,476$ -$ -$
Fair Value Measurements (In Thousands) Using
Fair Value Measurements (In Thousands) Using
(A) Certain investments that are measured at fair value using the net asset value per share (or its equivalent) practical expedient have not been classified in the fair value hierarchy. The fair value amounts included above are intended to permit reconciliation of the fair value hierarchy to the amounts presented in the statements of financial position.
Following is a description of the valuation methodologies and inputs used for assets measured at fair value on a recurring basis and recognized in the accompanying statements of financial position, as well as the general classification of such assets pursuant to the valuation hierarchy. There have been no significant changes in the valuation techniques during the year ended June 30, 2017. For assets classified within Level 3 of the fair value hierarchy, the process used to develop the reported fair value is described below.
The Alliance Development Fund, Inc. Notes to Financial Statements June 30, 2017, 2016 and 2015
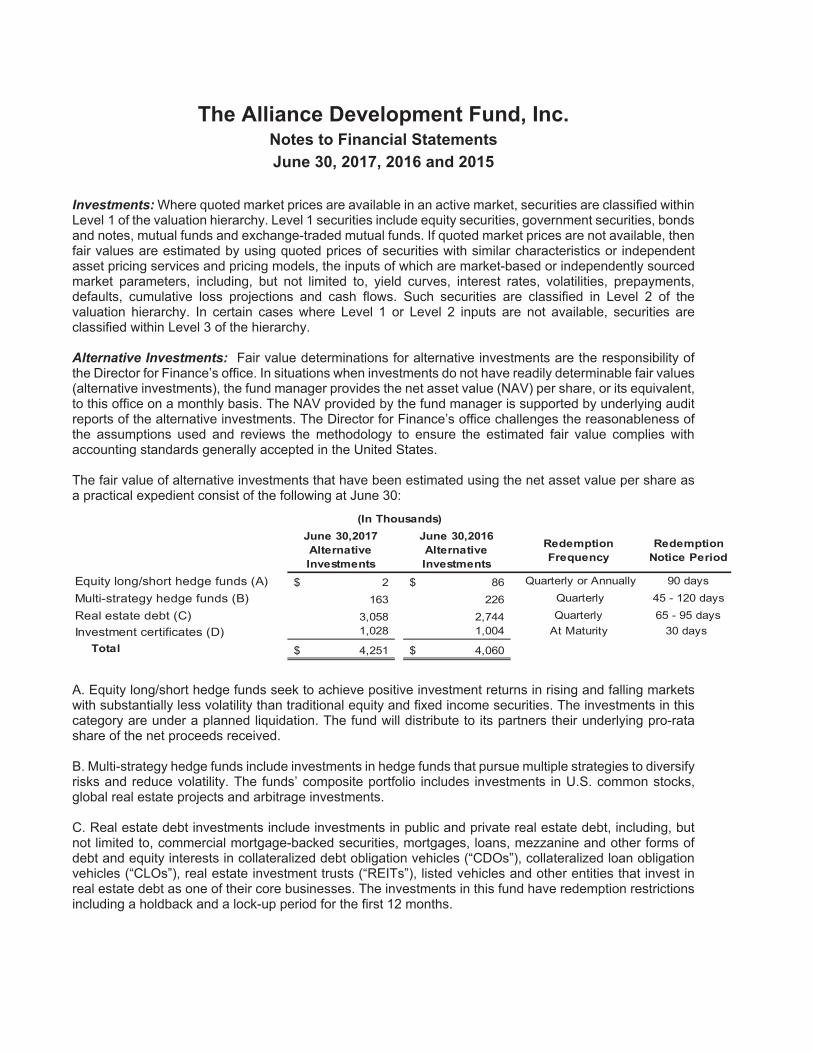
Investments: Where quoted market prices are available in an active market, securities are classified within Level 1 of the valuation hierarchy. Level 1 securities include equity securities, government securities, bonds and notes, mutual funds and exchange-traded mutual funds. If quoted market prices are not available, then fair values are estimated by using quoted prices of securities with similar characteristics or independent asset pricing services and pricing models, the inputs of which are market-based or independently sourced market parameters, including, but not limited to, yield curves, interest rates, volatilities, prepayments, defaults, cumulative loss projections and cash flows. Such securities are classified in Level 2 of the valuation hierarchy. In certain cases where Level 1 or Level 2 inputs are not available, securities are classified within Level 3 of the hierarchy.
Alternative Investments: Fair value determinations for alternative investments are the responsibility of the Director for Finance’s office. In situations when investments do not have readily determinable fair values (alternative investments), the fund manager provides the net asset value (NAV) per share, or its equivalent, to this office on a monthly basis. The NAV provided by the fund manager is supported by underlying audit reports of the alternative investments. The Director for Finance’s office challenges the reasonableness of the assumptions used and reviews the methodology to ensure the estimated fair value complies with accounting standards generally accepted in the United States.
The fair value of alternative investments that have been estimated using the net asset value per share as a practical expedient consist of the following at June 30:
June 30,2017 Alternative Investments
June 30,2016 Alternative Investments
Redemption Frequency
Redemption Notice Period
Equity long/short hedge funds (A) 2$ 86$ Quarterly or Annually 90 days
Multi-strategy hedge funds (B) 163 226 Quarterly 45 - 120 days
Real estate debt (C) 3,058 2,744 Quarterly 65 - 95 days Investment certificates (D) 1,028 1,004 At Maturity 30 days
Total 4,251$ 4,060$
(In Thousands)
A. Equity long/short hedge funds seek to achieve positive investment returns in rising and falling markets with substantially less volatility than traditional equity and fixed income securities. The investments in this category are under a planned liquidation. The fund will distribute to its partners their underlying pro-rata share of the net proceeds received.
B. Multi-strategy hedge funds include investments in hedge funds that pursue multiple strategies to diversify risks and reduce volatility. The funds’ composite portfolio includes investments in U.S. common stocks, global real estate projects and arbitrage investments.
C. Real estate debt investments include investments in public and private real estate debt, including, but not limited to, commercial mortgage-backed securities, mortgages, loans, mezzanine and other forms of debt and equity interests in collateralized debt obligation vehicles (“CDOs”), collateralized loan obligation vehicles (“CLOs”), real estate investment trusts (“REITs”), listed vehicles and other entities that invest in real estate debt as one of their core businesses. The investments in this fund have redemption restrictions including a holdback and a lock-up period for the first 12 months.
The Alliance Development Fund, Inc. Notes to Financial Statements June 30, 2017, 2016 and 2015
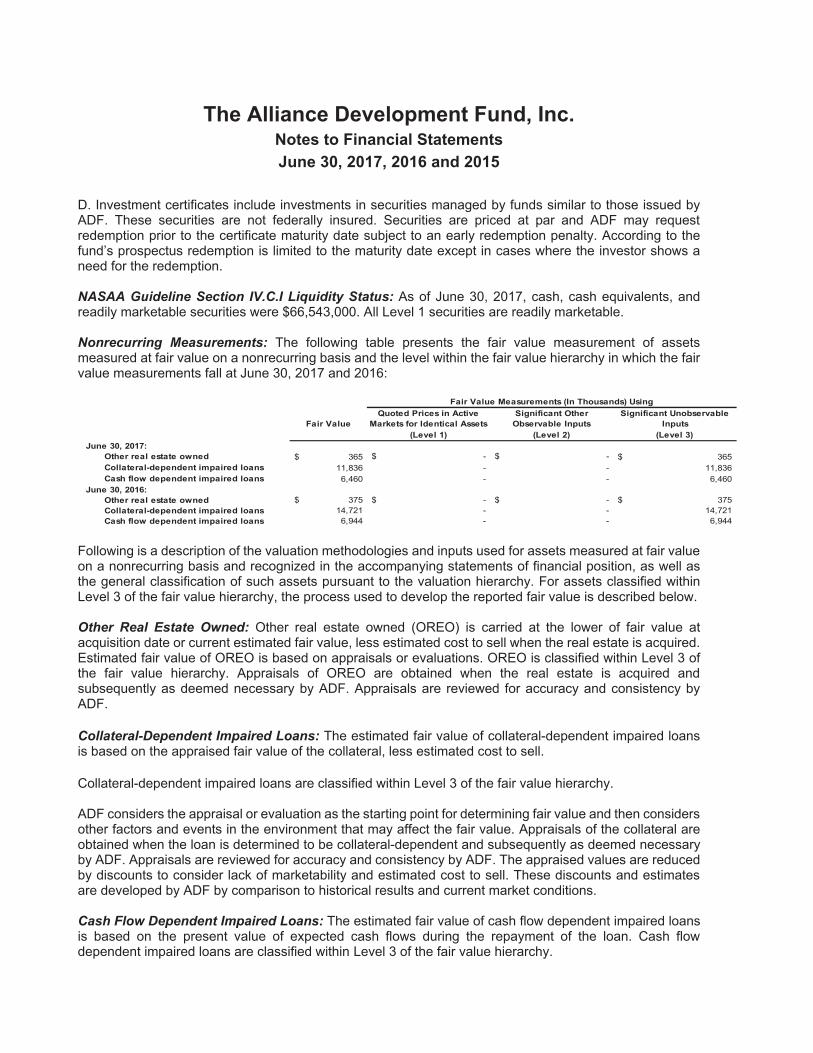
D. Investment certificates include investments in securities managed by funds similar to those issued by ADF. These securities are not federally insured. Securities are priced at par and ADF may request redemption prior to the certificate maturity date subject to an early redemption penalty. According to the fund’s prospectus redemption is limited to the maturity date except in cases where the investor shows a need for the redemption.
NASAA Guideline Section IV.C.I Liquidity Status: As of June 30, 2017, cash, cash equivalents, and readily marketable securities were $66,543,000. All Level 1 securities are readily marketable.
Nonrecurring Measurements: The following table presents the fair value measurement of assets measured at fair value on a nonrecurring basis and the level within the fair value hierarchy in which the fair value measurements fall at June 30, 2017 and 2016:
Quoted Prices in Active Markets for Identical Assets
Significant Other Observable Inputs
Significant Unobservable Inputs
(Level 1) (Level 2) (Level 3)June 30, 2017:
Other real estate owned 365$ $ - $ - 365$ Collateral-dependent impaired loans 11,836 - - 11,836Cash flow dependent impaired loans 6,460 - - 6,460
June 30, 2016:Other real estate owned $ 375 $ - $ - 375$ Collateral-dependent impaired loans 14,721 - - 14,721Cash flow dependent impaired loans 6,944 - - 6,944
Fair Value Measurements (In Thousands) Using
Fair Value
Following is a description of the valuation methodologies and inputs used for assets measured at fair value on a nonrecurring basis and recognized in the accompanying statements of financial position, as well as the general classification of such assets pursuant to the valuation hierarchy. For assets classified within Level 3 of the fair value hierarchy, the process used to develop the reported fair value is described below.
Other Real Estate Owned: Other real estate owned (OREO) is carried at the lower of fair value at acquisition date or current estimated fair value, less estimated cost to sell when the real estate is acquired. Estimated fair value of OREO is based on appraisals or evaluations. OREO is classified within Level 3 of the fair value hierarchy. Appraisals of OREO are obtained when the real estate is acquired and subsequently as deemed necessary by ADF. Appraisals are reviewed for accuracy and consistency by ADF.
Collateral-Dependent Impaired Loans: The estimated fair value of collateral-dependent impaired loans is based on the appraised fair value of the collateral, less estimated cost to sell.
Collateral-dependent impaired loans are classified within Level 3 of the fair value hierarchy.
ADF considers the appraisal or evaluation as the starting point for determining fair value and then considers other factors and events in the environment that may affect the fair value. Appraisals of the collateral are obtained when the loan is determined to be collateral-dependent and subsequently as deemed necessary by ADF. Appraisals are reviewed for accuracy and consistency by ADF. The appraised values are reduced by discounts to consider lack of marketability and estimated cost to sell. These discounts and estimates are developed by ADF by comparison to historical results and current market conditions.
Cash Flow Dependent Impaired Loans: The estimated fair value of cash flow dependent impaired loans is based on the present value of expected cash flows during the repayment of the loan. Cash flow dependent impaired loans are classified within Level 3 of the fair value hierarchy.
The Alliance Development Fund, Inc. Notes to Financial Statements June 30, 2017, 2016 and 2015
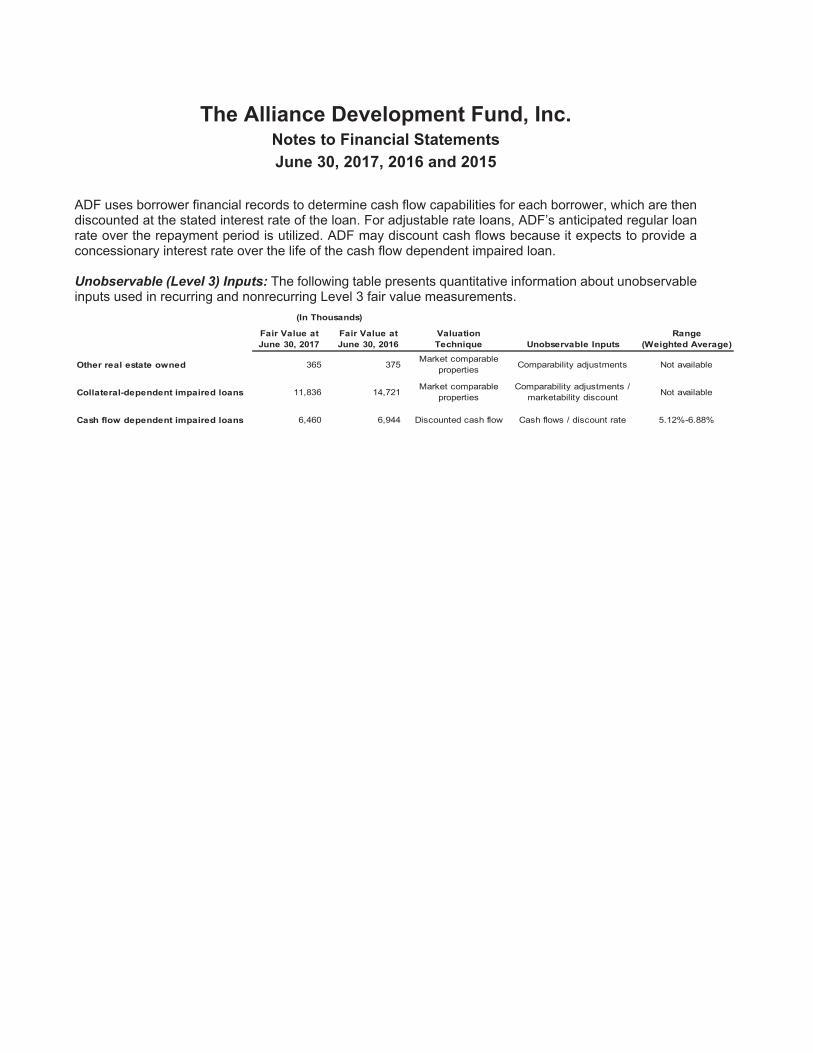
ADF uses borrower financial records to determine cash flow capabilities for each borrower, which are then discounted at the stated interest rate of the loan. For adjustable rate loans, ADF’s anticipated regular loan rate over the repayment period is utilized. ADF may discount cash flows because it expects to provide a concessionary interest rate over the life of the cash flow dependent impaired loan.
Unobservable (Level 3) Inputs: The following table presents quantitative information about unobservable inputs used in recurring and nonrecurring Level 3 fair value measurements.
Fair Value at June 30, 2017
Fair Value at June 30, 2016
Valuation Technique Unobservable Inputs
Range (Weighted Average)
Other real estate owned 365 375Market comparable
properties Comparability adjustments Not available
Collateral-dependent impaired loans 11,836 14,721Market comparable
propertiesComparability adjustments /
marketability discount Not available
Cash flow dependent impaired loans 6,460 6,944 Discounted cash flow Cash flows / discount rate 5.12%-6.88%
(In Thousands)
THIS IS NOT AN OFFERING TO SELL THE SECURITIES OF THE ALLIANCE DEVELOPMENT FUND, INC. NOR CONSTITUTE SOLICITATION OF AN OFFER TO BUY. THERE SHALL NOT BE ANY SALE OF THESE SECURITIES IN ANY STATE IN WHICH OFFER, SOLICITATION, OR SALE IS NOT AUTHORIZED. THE OFFERING IS MADE ONLY BY THE OFFERING CIRCULAR, COPIES OF WHICH MAY BE OBTAINED BY WRITING TO THE ALLIANCE DEVELOPMENT FUND, INC., PO BOX 63419, COLORADO SPRINGS, CO 80962-3419. PLEASE REMEMBER THAT PAST PERFORMANCE IS NO GUARANTEE
OF FUTURE RESULTS. INVESTMENTS ARE NOT INSURED BY THE SECURITIES INVESTOR PROTECTION CORPORATION (SIPC), THE FEDERAL DEPOSIT INSURANCE
CORPORATION (FDIC), OR ANY STATE OR FEDERALLY REGULATED GOVERNMENTAL AGENCY. THE SECURITIES WILL BE OFFERED AND SOLD ONLY TO OR
FOR THE BENEFIT OF PERSONS OR LEGAL ENTITIES OF THE CHRISTIAN AND MISSIONARY ALLIANCE (THE “C&MA”), WHO, AT THE TIME OF RECEIVING AN
OFFERING CIRCULAR AND PURCHASE APPLICATION AND AGREEMENT, ARE MEMBERS OR CONSTITUENTS OF, CONTRIBUTORS TO, OR PARTICIPANTS IN
THE C&MA, THE FUND OR IN ANY CHURCH AND/OR THEIR ORGANIZATIONS, OR IN ANY PROGRAM, ACTIVITY OR ORGANIZATION WHICH CONSTITUTES A
PART OF THE C&MA DENOMINATION OR THE FUND OR IN OTHER RELIGIOUS ORGANIZATIONS THAT HAVE A PROGRAMMATIC RELATIONSHIP WITH THE C&MA
OR THE FUND OR WHO ARE ANCESTORS OR DESCENDANTS OF SUCH PERSONS. IN ADDITION, CERTIFICATES AND RETIREMENT AGREEMENTS MAY BE
SOLD TO IRAS ESTABLISHED FOR THE BENEFIT OF SUCH PERSONS. THE SECURITIES INVOLVE RISKS TO INVESTORS. PROSPECTIVE INVESTORS SHOULD
CONSIDER THE FOLLOWING FACTORS BEFORE MAKING A COMMITMENT TO PURCHASE ANY OF THE SECURITIES. FOR A COMPLETE DISCUSSION OF
THE RISK FACTORS PLEASE REFER TO THE OFFERING CIRCULAR. • THE SECURITIES ARE UNSECURED OBLIGATIONS WITH NO SINKING FUND OR TRUST
INDENTURE • NO RESERVE ACCOUNTS TO FUND POTENTIAL WITHDRAWALS • FUND’S INVESTMENTS SUBJECT TO MARKET RISK • SECURITIES NOT INSURED
OR GUARANTEED • MORTGAGE LOAN DEFAULTS • NET ASSETS ARE THE ONLY SOURCE OF CAPITAL FOR THE FUND • LENDING AND LOAN ENFORCEMENT
POLICIES DIFFER FROM COMMERCIAL LENDERS • TRANSFER RESTRICTIONS • POSSIBLE CHANGES IN FEDERAL OR STATE LAW • DELINQUENT LOANS
MATERIAL TO THE FINANCIAL CONDITION OF THE FUND • NEGATIVE IMPLICATIONS TO VARIABLE INTEREST RATES • UNILATERAL REDEMPTION AUTHORITY
• DEPENDENCY ON PRINCIPAL REPAYMENTS AND CASH RECEIPTS FROM THE SALE OF INVESTMENT OBLIGATIONS • AUTOMATIC RENEWAL OF CERTIFICATES
• GEOGRAPHIC CONCENTRATION OF LOANS
All of us on the ADF team look forward to serving you. Please contact us if you have questions or if we can help you in any way.
The AlliAnce DevelopmenT FunD, inc.PO Box 63419 | Colorado Springs, CO 80962-3419
Fax: 719.268.2259 | E-mail: [email protected]
For information, call:
1.888.878.3060ADFOnline Internet Banking/Web site:
www.adf-inc.com


![[ A ] SPIRITS ADF [ADF] VODKA - BASIC](https://img.pdfslide.net/doc/110x75/6169d8c211a7b741a34c063e/-a-spirits-adf-adf-vodka-basic.jpg)
![Index [drillco-inc.com]](https://img.pdfslide.net/doc/110x75/6212ab94ca04d82b5b23b073/index-drillco-inccom.jpg)

![]d - nwg-inc.com](https://img.pdfslide.net/doc/110x75/624facf12752cd191f0126be/d-nwg-inccom.jpg)


![ADF Annual Report 2010-11 Final[1]](https://img.pdfslide.net/doc/110x75/577d27871a28ab4e1ea42061/adf-annual-report-2010-11-final1.jpg)