Embed Size (px)
Citation preview
2017 Annual Report
in Section 21E of the Securities Exchange Act of 1934, as amended, that involve a number of risks and uncertainties. Such forward-looking
price recovery for oil, current or future liquidity sources or their adequacy to support our anticipated future activities, our ability to furtherreduce our debt levels, possible future write-downs of oil and natural gas reserves, together with assumptions based on current and projected
any future proposed asset sales or dispositions or the timing or proceeds thereof, estimated timing of commencement of carbon dioxide (CO2)
2
volumes or forecasts thereof, hydrocarbon reserve quantities and values, CO2 reserves and supply and their availability, potential reserves, barrels or percentages of recoverable original oil in place, potential increases in worldwide tariffs or other trade restrictions, the likelihood,timing and impact of increased interest rates, the impact of regulatory rulings or changes, anticipated outcomes of pending litigation,prospective legislation affecting the oil and gas industry, environmental regulations, mark-to-market values, competition, long-term forecasts of production, rates of return, estimated costs, changes in costs, future capital expenditures and overall economics, worldwide economicconditions and other variables surrounding our estimated original oil in place, operations and future plans. Such forward-looking statementsgenerally are accompanied by words such as “plan,” “estimate,” “expect,” “predict,” “forecast,” “to our knowledge,” “anticipate,” “projected,” “preliminary,” “should,” “assume,” “believe,” “may” or other words that convey, or are intended to convey, the uncertainty of future events oroutcomes. Such forward-looking information is based upon management’s current plans, expectations, estimates, and assumptions and is
estimates or assumptions expressed in or implied by any forward-looking statements made by us or on our behalf. Among the factors that
future periods; levels of future capital expenditures; effects of our indebtedness; success of our risk management techniques; accuracy of our
the uncertainty of drilling results and reserve estimates; operating hazards and remediation costs; disruption of operations and damages from
regulations, including changes in tax or environmental laws or regulations; and unexpected delays, as well as the risks and uncertaintiesinherent in oil and gas drilling and production activities or that are otherwise discussed in this annual report, including, without limitation, the
with the SEC. Denbury’s proved reserves as of December 31, 2016 and December 31, 2017 were estimated by DeGolyer and MacNaughton, an
report, we also may refer to estimates of original oil in place, resource or reserves “potential,” barrels recoverable, “risked” and “unrisked”
probable and possible reserves, are by their nature more speculative than estimates of proved reserves and are subject to greater uncertainties, and accordingly the likelihood of recovering those reserves is subject to substantially greater risk.
FORWARD-LOOKING STATEMENTS
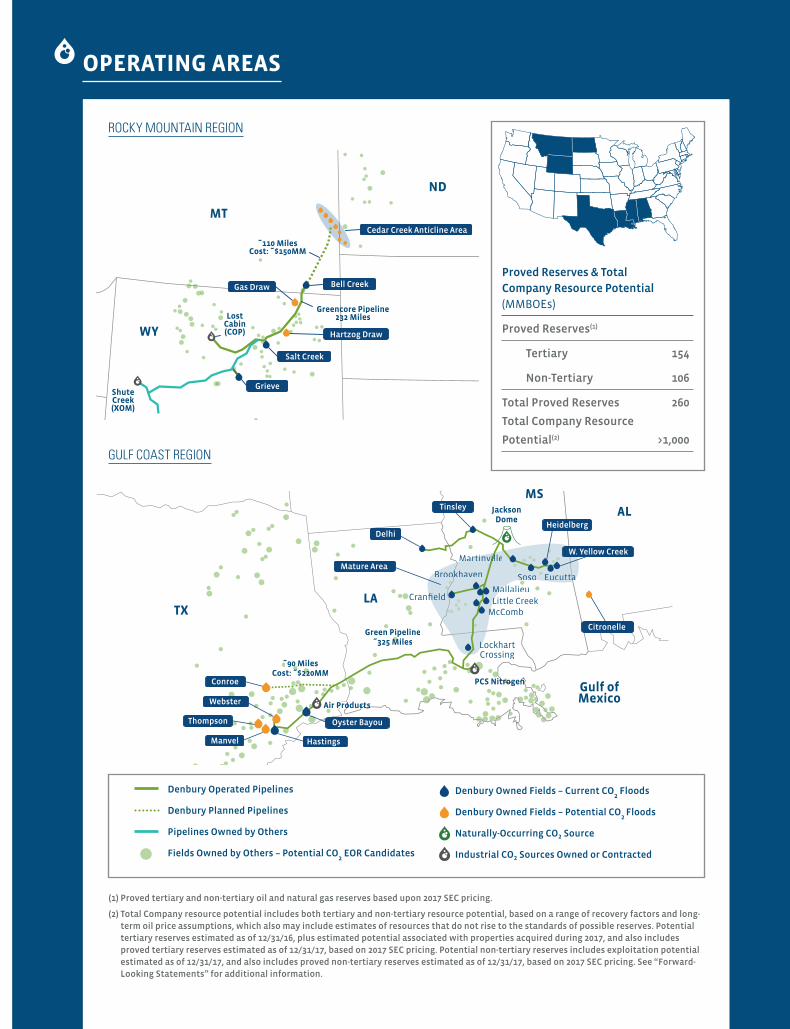
(1) Proved tertiary and non-tertiary oil and natural gas reserves based upon 2017 SEC pricing.
(2) Total Company resource potential includes both tertiary and non-tertiary resource potential, based on a range of recovery factors and long-term oil price assumptions, which also may include estimates of resources that do not rise to the standards of possible reserves. Potential tertiary reserves estimated as of 12/31/16, plus estimated potential associated with properties acquired during 2017, and also includes proved tertiary reserves estimated as of 12/31/17, based on 2017 SEC pricing. Potential non-tertiary reserves includes exploitation potential estimated as of 12/31/17, and also includes proved non-tertiary reserves estimated as of 12/31/17, based on 2017 SEC pricing. See “Forward-Looking Statements” for additional information.
Proved Reserves & Total
Company Resource Potential
(MMBOEs)
Proved Reserves (1)
Tertiary 154
Non-Tertiary 106
Total Proved Reserves 260
Total Company Resource
Potential (2) >1,000GULF COAST REGION
ROCKY MOUNTAIN REGION
Denbury Operated Pipelines
Denbury Planned Pipelines
Pipelines Owned by Others
Fields Owned by Others – Potential CO2 EOR Candidates
Denbury Owned Fields – Current CO2 Floods
Denbury Owned Fields – Potential CO2
Floods
Naturally-Occurring CO2 Source
Industrial CO2 Sources Owned or Contracted
OPERATING AREAS
Gulf of Mexico
JacksonDome
PCS Nitrogenrotrogen
Air ProductsProoducts
Green Pipeline˜325 MilesM
˜90 Miles0 Cost: ˜$220MM22˜
Greencore Pipelinec232 Miles3
p
ShuteCreek(XOM)
LostCabin(COP)
˜110 MilesCost: ˜$150MM
AL
MS
MT
ND
WY
LATX
Cedar Creek Anticline Area
Bell Creek
Hartzog Draw
Gas Draw
Salt Creek
Grieve
LockhartLCrossing
MallalieuMaSosoSoso aaEucuttaaa
MartinMartinvilleil
kBBrookhavenok
Little CreekLMcCombM
Delhi
Tinsley
Mature Area
Heidelberg
Conroe
Webster
Thompson
Manvel Hastings
Oyster Bayou
W. Yellow Creek
Citronelle
•
common stock;
•
•
•
•
• Using our strategic CO2 position to enter a new CO2 EOR
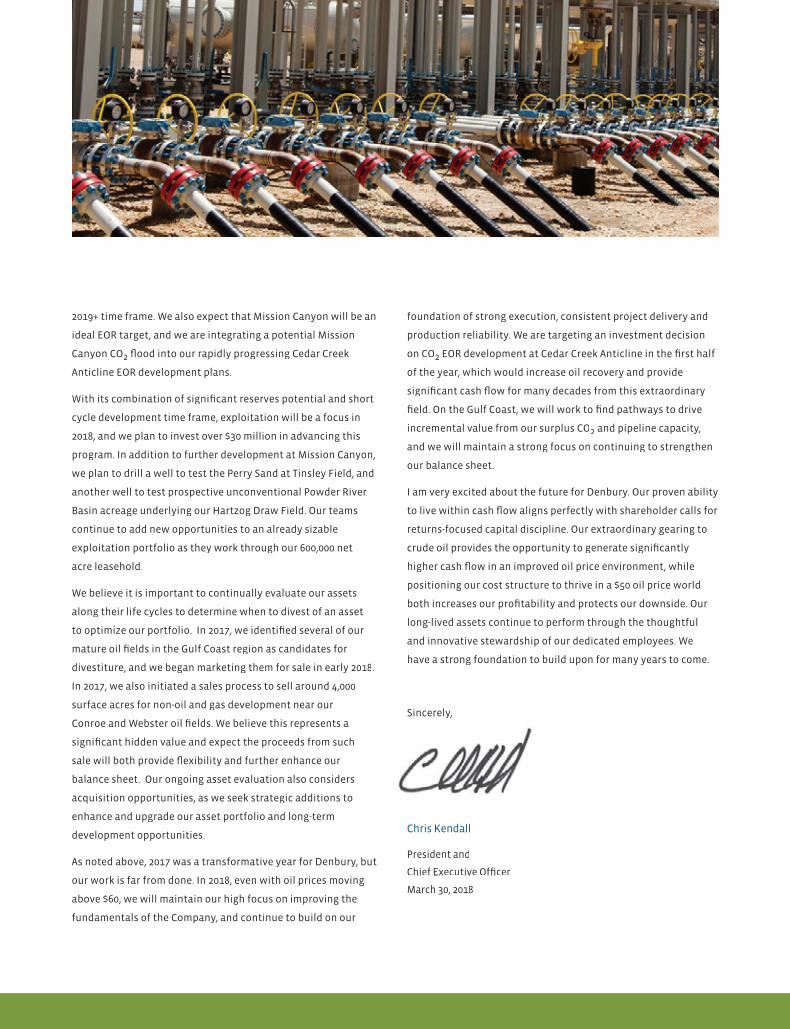
DEAR FELLOW SHAREHOLDERS
Christian S. Kendall
President and
Chief Executive Officer
2 on CO2
2
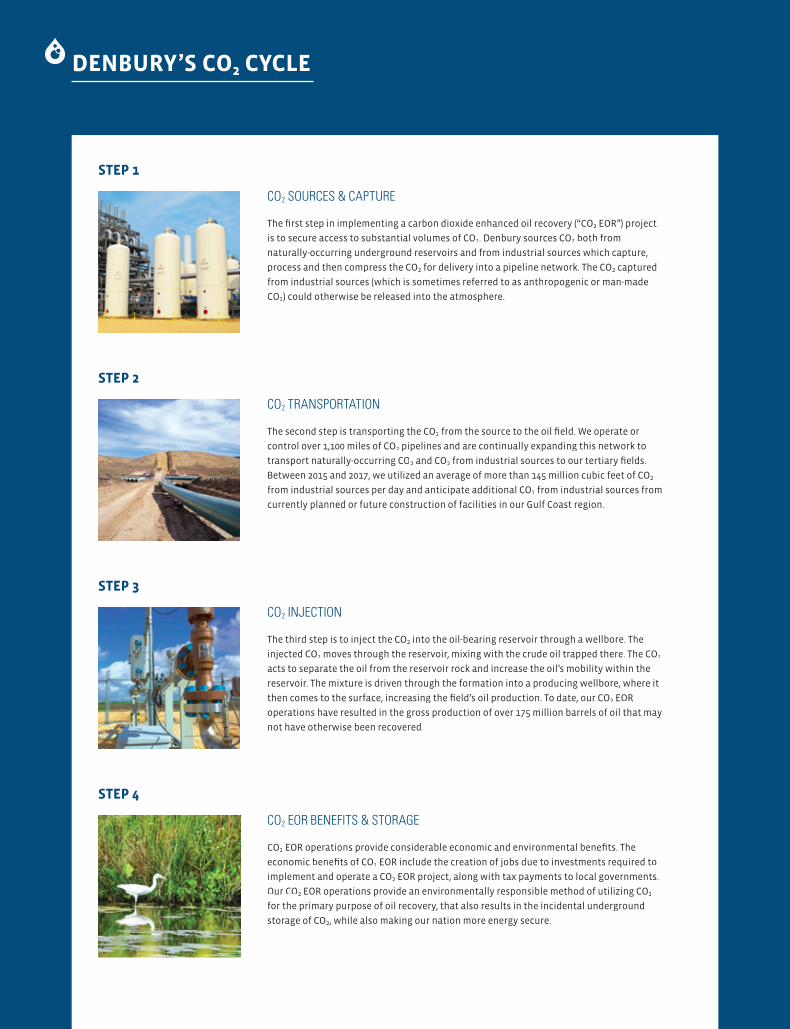
DENBURY’S CO2 CYCLE
STEP 4
CO2 EOR BENEFITS & STORAGE
CO2
2
2
Our CO2 2
2
STEP 3
CO2 INJECTION
2
2 2
2 EOR
STEP 2
CO2 TRANSPORTATION
2
2
2 2
2
2
STEP 1
CO2 SOURCES & CAPTURE
2
2 2
2 2
CO2
UNITED STATT TES SECURITIESAA AND EXCHANGE COMMISSIONWashington, D.C. 20549WW
2017 FORM 10-K(Mark One)
Annual report pursuant to Section 13 or 15(d) of the Securities Exchanger Act of 1934
For the fiscal year ended December 31, 2017OR
Transition rTT eport pursuant to Section 13 or 15(d) of the Securities Exchanger Act of 1934
For the transition period from _________ to________
Commission file number 1-12935r
DENBURYRR RESOURCES INC.Y(Exact name of Registrant as specified in its charter)
Delaware 20-0467835
(State or other jurisdiction of incorporation or organization)r (I.R.S. Employer Identification No.)
5320 Legacy Drive,Plano, TX 75024
(Address of principal executive offices)rr (Zip Code)
Registrant’s telephone number, including area code: (972) 673-2000
Securities registered pursuant to Section 12(b) of the Act:
Title of Each Class: Name of Each Exchange on Which Registered:Common Stock $.001 Par ValueVV New York Stock ExchangeYY
Securities registered pursuant to Section 12(g) of the Act: None
Indicate by check mark if the registrant is a well-known seasoned issuer, as defined in Rule 405 of the Securities Act. YesYY No
Indicate by check mark if the registrant is not required to file reports pursuant to Section 13 or Section 15(d) of the Act. YesYY No
Indicate by check mark whether the registrant (1) has filed all reports required to be filed by Section 13 or 15(d) of the Securities Exchange Act of 1934 during the preceding 12 months (or for such shorter period that the registrant was required to file such reports), and (2) has been subject to such filing requirements for the past 90 days. YesYY No
Indicate by check mark whether the registrant has submitted electronically and posted on its corporate Web site, if anyWW , every Interactive Data File yyrequired to be submitted and posted pursuant to Rule 405 of Regulation S-T during the preceding 12 months (or for such shorter period that the registrant was required to submit and post such files). YesYY No
Indicate by check mark if disclosure of delinquent filers pursuant to Item 405 of Regulation S-K is not contained herein, and will not be contained, to the best of registrant’s knowledge, in definitive proxy or information statements incorporated by reference in Part III of this Form 10-K or any amendment to this Form 10-K.
Indicate by check mark whether the registrant is a large accelerated filer, an accelerated filer, a non-accelerated filer, a smaller reporting company, or anyyemerging growth company. See the definitions of “large accelerated filer”, “accelerated filer”, “smaller reporting company,” and “emeryy ging growth company” in Rule 12-b2 of the Exchange Act.Large accelerated filer Accelerated filer Non-accelerated filer Smaller reporting company Emerging growth company
If an emerging growth company, indicate by check mark if the registrant has elected not to use the extended transition period for complying with any new yyor revised financial accounting standards provided pursuant to Section 13(a) of the Exchange Act.
Indicate by check mark whether the registrant is a shell company (as defined in Rule 12b-2 of the Act). YesYY No
The aggregate market value of the registrant’s common stock held by non-affiliates, based on the closing price of the registrant’ff s common stock as of thelast business day of the registrant’s most recently completed second fiscal quarter was $603,083,628.
The number of shares outstanding of the registrant’s Common Stock as of January 31, 2018, was 401,918,775.
DOCUMENTS INCORPORATED BYAA REFERENCEY
Document: Incorporated as to:
1. Notice and Proxy Statement for the Annual Meeting of Stockholders to be held May 23, 2018. 1. Part III, Items 10, 11, 12, 13, 14
Denbury Resources Inc.
2
2017 Annual Report on Form 10-K Table of Contents
Page Glossary and Selected Abbreviations PART I Item 1. Business and PropertiesItem 1A. Risk FactorsItem 1B. Unresolved Staff CommentsItem 2. PropertiesItem 3. Legal ProceedingsItem 4. Mine Safety Disclosures PART II Item 5.
Market for Registrant’s Common Equity, Related Stockholder Matters and Issuer Purchases of Equity Securities
Item 6. Selected Financial DataItem 7.
Management’s Discussion and Analysis of Financial Condition and Results of Operations
Item 7A. Quantitative and Qualitative Disclosures About Market RiskItem 8. Financial Statements and Supplementary InformationItem 9.
Changes in and Disagreements with Accountants on Accounting and Financial Disclosure
Item 9A. Controls and ProceduresItem 9B. Other Information PART III Item 10. Directors, Executive Officers and Corporate GovernanceItem 11. Executive CompensationItem 12.
Security Ownership of Certain Beneficial Owners and Management and Related Stockholder Matters
Item 13. Certain Relationships and Related Transactions, and Director IndependenceItem 14. Principal Accountant Fees and Services PART IV Item 15. Exhibits and Financial Statement SchedulesItem 16. Form 10-K Summary Signatures
3
52430303131
3234
366161
102102102
103103
103103103
104109110
Denbury Resources Inc.
3
Glossary and Selected Abbreviations
Bbl One stock tank barrel, of 42 U.S. gallons liquid volume, used herein in reference to crude oil or other liquid hydrocarbons.
Bbls/d Barrels of oil or other liquid hydrocarbons produced per day.
Bcf One billion cubic feet of natural gas or CO2.
BOE One barrel of oil equivalent, using the ratio of one barrel of crude oil, condensate or natural gas liquids to 6 Mcf of natural gas.
BOE/d BOEs produced per day.
Btu British thermal unit, which is the heat required to raise the temperature of a one-pound mass of water from 58.5 to 59.5 degrees Fahrenheit (°F).
CO2 Carbon dioxide.
EOR Enhanced oil recovery. In the context of our oil and natural gas production, EOR is also referred to as tertiary recovery.
Finding anddevelopmentcosts
The average cost per BOE to find and develop proved reserves during a given period. It is calculated by dividing (a) costs, which include the sum of (i) the total acquisition, exploration and development costs incurred during the period plus (ii) future development and abandonment costs related to the specified property or group of properties, by (b) the sum of (i) the change in total proved reserves during the period plus (ii) total production during that period.
GAAP Accounting principles generally accepted in the United States of America.
MBbls One thousand barrels of crude oil or other liquid hydrocarbons.
MBOE One thousand BOEs.
Mcf One thousand cubic feet of natural gas or CO2 at a temperature base of 60 degrees Fahrenheit (°F) and at the legal pressure base (14.65 to 15.025 pounds per square inch absolute) of the state or area in which the reserves are located or sales are made.
Mcf/d One thousand cubic feet of natural gas or CO2 per day.
MMBbls One million barrels of crude oil or other liquid hydrocarbons.
MMBOE One million BOEs.
MMBtu One million Btus.
MMcf One million cubic feet of natural gas or CO2.
MMcf/d One million cubic feet of natural gas or CO2 produced per day.
Noncash fair value gains (losses) on commodity derivatives
The net change during the period in the fair market value of commodity derivative positions. Noncash fair value gains (losses) on commodity derivatives is a non-GAAP measure and makes up only a portion of “Commodity derivatives expense (income)” in the Consolidated Statements of Operations, which also includes the impact of settlements on commodity derivatives during the period. Its use is further discussed in Management’s Discussion and Analysis of Financial Condition and Results of Operations – Results of Operations – Operating Results Table.
NYMEX The New York Mercantile Exchange. In the context of our oil and natural gas sales, NYMEX pricing represents the West Texas Intermediate benchmark price for crude oil and Henry Hub benchmark price for natural gas.
ProbableReserves*
Reserves that are less certain to be recovered than proved reserves but which, together with proved reserves, are as likely as not to be recovered.
ProvedDevelopedReserves*
Reserves that can be expected to be recovered through existing wells with existing equipment and operating methods.
Denbury Resources Inc.
4
ProvedReserves*
Reserves that geological and engineering data demonstrate with reasonable certainty to be recoverable in future years from known reservoirs under existing economic and operating conditions.
ProvedUndevelopedReserves*
Reserves that are expected to be recovered from new wells on undrilled acreage or from existing wells, in each case where a relatively major expenditure is required.
PV-10 Value The estimated future gross revenue to be generated from the production of proved reserves, net of estimated future production, development and abandonment costs, and before income taxes, discounted to a present value using an annual discount rate of 10%. PV-10 Values were prepared using average hydrocarbon prices equal to the unweighted arithmetic average of hydrocarbon prices on the first day of each month within the 12-month period preceding the reporting date. PV-10 Value is a non-GAAP measure and does not purport to represent the fair value of our oil and natural gas reserves; its use is further discussed in footnote 3 to the table included in Item 1, Estimated Net Quantities of Proved Oil and Natural Gas Reserves and Present Value of Estimated Future Net Revenues – Oil and Natural Gas Reserve Estimates.
Tcf One trillion cubic feet of natural gas or CO2.
TertiaryRecovery
A term used to represent techniques for extracting incremental oil out of existing oil fields (as opposed to primary and secondary recovery or “non-tertiary” recovery). In the context of our oil and natural gas production, tertiary recovery is also referred to as EOR.
* This definition is an abbreviated version of the complete definition set forth in Rule 4-10(a) of Regulation S-X. For the complete definition see: http://www.ecfr.gov/cgi-bin/text-idx?SID=2d916841db86d079fa060fa63b08d34e&mc=true&node=se17.3.210_14_610&rgn=div8.
Denbury Resources Inc.
5
PART I
Item 1. Business and Properties
GENERAL
Denbury Resources Inc., a Delaware corporation, is an independent oil and natural gas company with 259.7 MMBOE of estimated proved oil and natural gas reserves as of December 31, 2017, of which 97% is oil. Our operations are focused in two key operating areas: the Gulf Coast and Rocky Mountain regions. Our goal is to increase the value of our properties through a combination of exploitation, drilling and proven engineering extraction practices, with the most significant emphasis relating to CO2 enhanced oil recovery operations.
As part of our corporate strategy, we are committed to strong financial discipline, efficient operations and creating long-term value for our shareholders through the following key principles:
• target specific regions where we either have, or believe we can create, a competitive advantage as a result of our ownership or use of CO2 reserves, oil fields and CO2 infrastructure;
• secure properties where we believe additional value can be created through tertiary recovery operations and a combination of other exploitation, development, exploration and marketing techniques;
• acquire properties that give us a majority working interest and operational control or where we believe we can ultimately obtain it;
• maximize the value and cash flow generated from our operations by increasing production and reserves while controlling costs;
• optimize the timing and allocation of capital among our investment opportunities to maximize the rates of return on our investments;
• exercise financial discipline by attempting to balance our development capital expenditures with our cash flows from operations; and
• attract and maintain a highly competitive team of experienced and incentivized personnel.
Denbury has been publicly traded on the New York Stock Exchange since 1997. Our corporate headquarters is located at 5320 Legacy Drive, Plano, Texas 75024, and our phone number is 972-673-2000. At December 31, 2017, we had 879employees, 530 of whom were employed in field operations or at our field offices. We make our annual report on Form 10-K, quarterly reports on Form 10-Q, current reports on Form 8-K, and amendments to those reports, filed or furnished pursuant to section 13(a) or 15(d) of the Securities Exchange Act of 1934, available free of charge on or through our website, www.denbury.com, as soon as reasonably practicable after we electronically file such material with, or furnish it to, the SEC. The public may read and copy any materials we file with the SEC at the SEC’s Public Reference Room at 100 F Street, NE, Washington, DC 20549. The public may obtain information on the operation of the Public Reference Room by calling the SEC at 1-800-SEC-0330. The SEC also maintains a website, http://www.sec.gov, which contains reports, proxy and information statements and other information filed by Denbury. Throughout this Annual Report on Form 10-K (“Form 10-K”) we use the terms “Denbury,” “Company,” “we,” “our” and “us” to refer to Denbury Resources Inc. and, as the context may require, its subsidiaries.
2017 BUSINESS DEVELOPMENTS
Oil prices generally constitute the single largest variable in our operating results. Although NYMEX oil prices hit a three-year peak of $66 in January 2018, over the last few years we have experienced a period of lower oil prices during which NYMEX oil prices have generally averaged in the $40 to $50 per Bbl range, which is roughly 50% lower than the price range over the 2011 through 2014 period. As a result of the lower oil price environment and its impact on our business, our focus has primarily been on preservation of cash and liquidity, together with cost reductions and debt management, rather than concentration on expansion and growth. Our 2017 key accomplishments and business developments included the following:
• Generated average total production of 60,298 BOE/d in 2017, and although a decline of 4% from continuing production in 2016, we successfully arrested the declines in our production that have been ongoing since the end of 2014 with quarter-to-quarter production increases in the second half of 2017.
Denbury Resources Inc.
6
• Successfully and safely managed the impacts of Hurricane Harvey, limiting our downtime and incremental costs to a full-year production impact of approximately 500 BOE/d and incremental lease operating expenses of approximately $4 million.
• Completed our first successful exploitation well at Mission Canyon in the Cedar Creek Anticline with a gross 30-day initial production rate of 1,050 Bbls/d.
• Increased proved reserves at December 31, 2017 to 259.7 MMBOE, from 254.5 MMBOE at December 31, 2016, representing a 127% replacement of 2017 annual production.
• Generated $267.1 million of cash flow from operations in 2017, an annual increase of 22%, and greater than our incurred development capital expenditures in 2017 of $240.8 million.
• Reduced general and administrative expenses to $101.8 million, a 7% reduction from 2016 and a 36% reduction from 2014, reflective of our reductions in personnel and our efforts to reduce costs during the oil price downturn.
• Completed acquisitions of non-operated working interests in West Yellow Creek Field in Mississippi and Salt Creek Field in Wyoming, replacing a significant portion of our current year production through the addition of proved tertiary oil reserves totaling approximately 10.7 MMBbls.
• Completed a series of debt exchanges in December 2017 and early January 2018, resulting in a net reduction of our debt principal balance of $184.4 million, which debt reduction could increase to a reduction of up to $329 million, assuming the new convertible notes issued in those exchanges fully convert into shares of common stock.
• • Modified certain of our financial performance covenants through the remaining term of the Bank Credit Agreement to
provide more flexibility in managing our balance sheet, credit extended by our lenders, and continuing compliance with financial performance covenants. In addition, maintained the $1.05 billion borrowing base under our senior secured bank credit facility, providing us with significant liquidity.
2018 BUSINESS OUTLOOK
We remain diligent in determining our capital budgets in a manner that allows us to maximize value while meeting one of our key objectives of spending within cash flow. For 2018, we have initially budgeted our development capital spending at $300 million to $325 million, excluding capitalized interest and acquisitions, an increase of roughly 30% over 2017 actual capital spending levels. We utilized a NYMEX oil price estimate of $55 per Bbl in developing our 2018 budget, which based on our current projections would generate a level of cash flow that would fully fund our development capital spending plans, with any potential shortfall covered by incremental borrowings on our senior secured bank credit facility, under which we had more than $500 million of availability as of December 31, 2017. With this increased capital spending level, we currently anticipate 2018 average daily production to average between 60,000 and 64,000 BOE/d, from our 2017 average production rate of 60,298 BOE/d.
Our capital spending during 2018 will continue to focus primarily on the continued development of our current tertiary floods, while also increasing our focus on execution of exploitation projects within our existing fields. Planned development activities presented in the discussions that follow may be delayed or modified during the course of 2018 depending primarily upon oil prices and our level of cash flow to fund such development, and we will continue to evaluate the timing of the development of our inventory of fields and related pipelines and facilities. Additionally, we plan to continue our focus on strengthening our financial condition through extension of the maturity of our bank credit facility and opportunistically taking steps to reduce our remaining debt levels and/or extend debt maturities, maintaining and enhancing the efficiencies achieved over the last couple of years, and pursuing opportunities to increase or accelerate growth through organic projects such as accretive acquisitions.
In addition to the Company’s 2018 development plans, the Company is currently engaged in two asset sale processes that could be completed in 2018. In mid-2017, we began actively marketing for sale certain non-productive surface acreage in the Houston area, targeted to receive bids during the second quarter of 2018. In late-February 2018, we initiated a sales process of our mature EOR properties located in Mississippi and Louisiana (discussed under Oil and Natural Gas Operations – Tertiary
Denbury Resources Inc.
7
Oil Properties – Mature properties below), and Citronelle Field located in Alabama as part of our overall portfolio management. These fields produced an average of approximately 7,600 BOE/d during the fourth quarter of 2017. In aggregate, these fields accounted for 13% of our total 2017 production and approximately 7% of our year-end proved reserves. The timing and outcome of the sales process cannot be predicted at this time.
ESTIMATED NET QUANTITIES OF PROVED OIL AND NATURAL GAS RESERVES AND PRESENT VALUE OF ESTIMATED FUTURE NET REVENUES
Oil and Natural Gas Reserve Estimates
DeGolyer and MacNaughton (“D&M”) prepared estimates of our net proved oil and natural gas reserves as of December 31, 2017, 2016 and 2015 (see the summary of D&M’s report as of December 31, 2017, included as an exhibit to this Form 10-K). These estimates of reserves were prepared using an average price equal to the unweighted arithmetic average of hydrocarbon prices on the first day of each month within the 12-month period in accordance with rules and regulations of the SEC. These oil and natural gas reserve estimates do not include any value for probable or possible reserves that may exist, nor do they include any value for undeveloped acreage. The reserve estimates represent our net revenue interest in our properties.
Denbury Resources Inc.
8
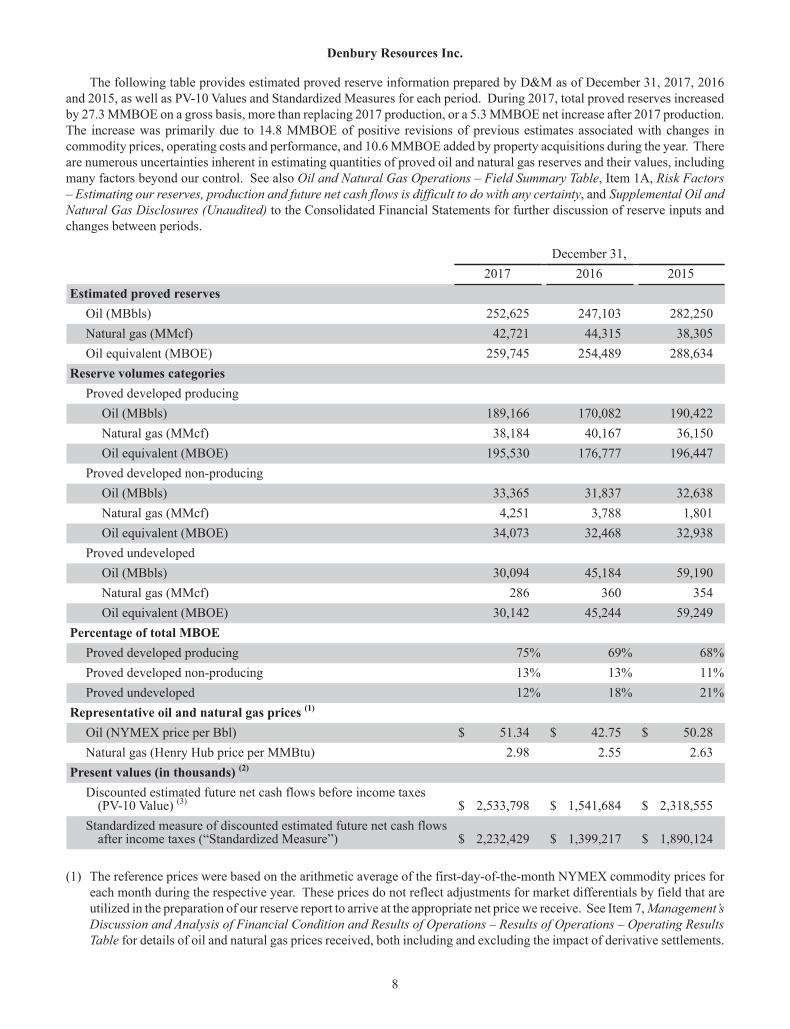
The following table provides estimated proved reserve information prepared by D&M as of December 31, 2017, 2016and 2015, as well as PV-10 Values and Standardized Measures for each period. During 2017, total proved reserves increased by 27.3 MMBOE on a gross basis, more than replacing 2017 production, or a 5.3 MMBOE net increase after 2017 production. The increase was primarily due to 14.8 MMBOE of positive revisions of previous estimates associated with changes in commodity prices, operating costs and performance, and 10.6 MMBOE added by property acquisitions during the year. There are numerous uncertainties inherent in estimating quantities of proved oil and natural gas reserves and their values, including many factors beyond our control. See also Oil and Natural Gas Operations – Field Summary Table, Item 1A, Risk Factors – Estimating our reserves, production and future net cash flows is difficult to do with any certainty, and Supplemental Oil and Natural Gas Disclosures (Unaudited) to the Consolidated Financial Statements for further discussion of reserve inputs and changes between periods.
December 31, 2017 2016 2015Estimated proved reserves
Oil (MBbls) 252,625 247,103 282,250Natural gas (MMcf) 42,721 44,315 38,305Oil equivalent (MBOE) 259,745 254,489 288,634
Reserve volumes categories Proved developed producing
Oil (MBbls) 189,166 170,082 190,422Natural gas (MMcf) 38,184 40,167 36,150Oil equivalent (MBOE) 195,530 176,777 196,447
Proved developed non-producing Oil (MBbls) 33,365 31,837 32,638Natural gas (MMcf) 4,251 3,788 1,801Oil equivalent (MBOE) 34,073 32,468 32,938
Proved undeveloped Oil (MBbls) 30,094 45,184 59,190Natural gas (MMcf) 286 360 354Oil equivalent (MBOE) 30,142 45,244 59,249
Percentage of total MBOE Proved developed producing 75% 69% 68%Proved developed non-producing 13% 13% 11%Proved undeveloped 12% 18% 21%
Representative oil and natural gas prices (1) Oil (NYMEX price per Bbl) $ 51.34 $ 42.75 $ 50.28Natural gas (Henry Hub price per MMBtu) 2.98 2.55 2.63
Present values (in thousands) (2) Discounted estimated future net cash flows before income taxes
(PV-10 Value) (3) $ 2,533,798 $ 1,541,684 $ 2,318,555Standardized measure of discounted estimated future net cash flows
after income taxes (“Standardized Measure”) $ 2,232,429 $ 1,399,217 $ 1,890,124
(1) The reference prices were based on the arithmetic average of the first-day-of-the-month NYMEX commodity prices for each month during the respective year. These prices do not reflect adjustments for market differentials by field that are utilized in the preparation of our reserve report to arrive at the appropriate net price we receive. See Item 7, Management’s Discussion and Analysis of Financial Condition and Results of Operations – Results of Operations – Operating Results Table for details of oil and natural gas prices received, both including and excluding the impact of derivative settlements.
Denbury Resources Inc.
9
(2) Determined based on the average first-day-of-the-month prices for each month, adjusted to prices received by field in accordance with standards set forth in the Financial Accounting Standards Board Codification (“FASC”). PV-10 Values and the Standardized Measure are significantly impacted by the oil prices we receive relative to NYMEX oil prices (our NYMEX oil price differential). The weighted-average oil price differentials utilized were $2.25 per Bbl below representative NYMEX oil prices as of December 31, 2017, compared to $3.39 per Bbl below NYMEX oil prices as of December 31, 2016, and $2.17 per Bbl below NYMEX oil prices as of December 31, 2015.
(3) PV-10 Value is a non-GAAP measure and is different from the Standardized Measure in that PV-10 Value is a pre-tax number and the Standardized Measure is an after-tax number. The information used to calculate PV-10 Value is derived directly from data determined in accordance with FASC Topic 932. The difference between these two amounts, the discounted estimated future income tax, was $301.4 million at December 31, 2017; $142.5 million at December 31, 2016; and $428.4 million at December 31, 2015. We believe that PV-10 Value is a useful supplemental disclosure to the Standardized Measure because the Standardized Measure can be impacted by a company’s unique tax situation, and it is not practical to calculate the Standardized Measure on a property-by-property basis. Because of this, PV-10 Value is a widely used measure within the industry and is commonly used by securities analysts, banks and credit rating agencies to evaluate the estimated future net cash flows from proved reserves on a comparative basis across companies or specific properties. PV-10 Value is commonly used by us and others in our industry to evaluate properties that are bought and sold, to assess the potential return on investment in our oil and natural gas properties, and to perform our impairment testing of oil and natural gas properties. PV-10 Value is not a measure of financial or operating performance under GAAP, nor should it be considered in isolation or as a substitute for the Standardized Measure. Our PV-10 Value and the Standardized Measure do not purport to represent the fair value of our oil and natural gas reserves. See Glossary and Selected Abbreviations for the definition of “PV-10 Value” and see Supplemental Oil and Natural Gas Disclosures (Unaudited) to the Consolidated Financial Statements for additional disclosures about the Standardized Measure.
Our proved non-producing reserves primarily relate to reserves that are to be recovered from productive zones that currently require a response to performance modifications before they can be classified as proved developed producing. Since a majority of our properties are in areas with multiple pay zones, these properties may have both proved producing and proved non-producing reserves.
As of December 31, 2017, our estimated proved undeveloped reserves totaled approximately 30.1 MMBOE, or approximately 12% of our estimated total proved reserves, a decline of 15.1 MMBOE from December 31, 2016 levels for these reserves, which changes are discussed below. Approximately 86% (26.0 MMBOE) of our proved undeveloped oil reserves relate to our CO2 tertiary operations. We generally consider the CO2 tertiary proved undeveloped reserves to be lower risk than other proved undeveloped reserves that require drilling at locations offsetting existing production, because all of these proved undeveloped reserves are associated with tertiary recovery operations in fields and reservoirs that historically produced substantial volumes of oil under primary production. As of December 31, 2017, 19.1 MMBOE of our total proved undeveloped reserves are not scheduled to be developed within five years of initial booking, all of which are part of CO2 EOR projects. We believe these reserves satisfy the conditions to be included as proved reserves because (1) we have established and continue to follow the previously adopted development plan for each of these projects; (2) we have significant ongoing development activities in each of these CO2 EOR projects and (3) we have a historical record of completing the development of comparable long-term projects.
During 2017, we spent approximately $50 million to convert 19.2 MMBOE of proved undeveloped reserves to proved developed reserves, primarily related to continued tertiary development activities at Hastings and Bell Creek fields. Other changes in proved undeveloped reserves during 2017 included adding an additional 2.4 MMBOE primarily related to our tertiary operations at Hastings Field and non-tertiary operations at Cedar Creek Anticline (“CCA”); improved recovery additions of 1.2 MMBOE related to our non-operated working interest at West Yellow Creek Field, acquired in March 2017; and recognizing other net additions of proved undeveloped reserve revisions of 0.5 MMBOE, primarily the result of reserves that were determined to be economic based on 2017 average oil and natural gas prices used in estimating our proved reserves.
During 2017, we provided oil and natural gas reserve estimates for 2016 to the United States Energy Information Agency that were substantially the same as the reserve estimates included in our Form 10-K for the year ended December 31, 2016.
Denbury Resources Inc.
10
Internal Controls Over Reserve Estimates
Reserve information in this report is based on estimates prepared by D&M, an independent petroleum engineering consulting firm located in Dallas, Texas, utilizing data provided by our internal reservoir engineering team and is the responsibility of management. We rely on D&M’s expertise to ensure that our reserve estimates are prepared in compliance with SEC rules and regulations and that appropriate geologic, petroleum engineering, and evaluation principles and techniques are applied in accordance with practices generally recognized by the petroleum industry as presented in the publication of the Society of Petroleum Engineers entitled “Standards Pertaining to the Estimating and Auditing of Oil and Gas Reserves Information (Revision as of February 19, 2007)”. The person responsible for the preparation of the reserve report is a Senior Vice President at D&M; he is a Registered Professional Engineer in the State of Texas. He received a Master of Science degree in Petroleum Engineering from the University of Texas in 1984, and he has in excess of 33 years of experience in oil and gas reservoir studies and evaluations. Our Senior Vice President – Business Development and Technology is primarily responsible for overseeing the independent petroleum engineering firm during the process. Our Senior Vice President – Business Development and Technology has a Bachelor of Science degree in Petroleum Engineering from the Colorado School of Mines and over 33 years of industry experience working with petroleum engineering and reserve estimates. D&M relies on various data provided by our internal reservoir engineering team in preparing its reserve estimates, including such items as oil and natural gas prices, ownership interests, production information, operating costs, planned capital expenditures and other technical data. Our internal reservoir engineering team consists of qualified petroleum engineers who maintain the Company’s internal evaluation of reserves and compare the Company’s information to the reserves prepared by D&M. Management is responsible for designing the internal control procedures used in the preparation of our oil and gas reserves, which include verification of data input into reserve forecasting and economics evaluation software, as well as multi-discipline management reviews. The internal reservoir engineering team reports directly to our Senior Vice President – Business Development and Technology. In addition, our Board of Directors’ Reserves and Health, Safety and Environmental (“HSE”) Committee, on behalf of the Board of Directors, oversees the qualifications, independence, performance and hiring of our independent petroleum engineering firm and reviews the final report and subsequent reporting of our oil and natural gas reserve estimates. The Chairman of the Reserves and HSE Committee holds a Ph.D. in Chemical Engineering from the Massachusetts Institute of Technology and bachelor’s degrees in Chemistry and Mathematics from Capital University in Ohio. He has more than 35 years of industry experience, with responsibilities including reserves preparation and approval.
OIL AND NATURAL GAS OPERATIONS
Summary. Our oil and natural gas properties are concentrated in the Gulf Coast and Rocky Mountain regions of the United States. Currently our properties with proved and producing reserves in the Gulf Coast region are situated in Mississippi, Texas, Louisiana and Alabama, and in the Rocky Mountain region are situated in Montana, North Dakota and Wyoming. Our primary focus is increasing the value of our properties through a combination of exploitation, drilling and proven engineering extraction practices, with the most significant emphasis relating to CO2 EOR operations. Our current portfolio of CO2 EOR projects provides us significant oil production and reserve growth potential in the future, assuming crude oil prices are at levels that support the development of those projects.
We have been conducting and expanding EOR operations on our assets in the Gulf Coast region since 1999, and as a result, we currently have many more CO2 EOR projects in this region than in the Rocky Mountain region. We began operations in the Rocky Mountain region in 2010 in connection with, and following, our merger with Encore Acquisition Company (“Encore”). In the Gulf Coast region, we own what is, to our knowledge, the region’s only significant naturally occurring source of CO2, and these large volumes of naturally occurring CO2 give us a significant competitive advantage in this area. In the Rocky Mountain region, we own an overriding royalty interest equivalent to an approximate one-third ownership interest in Exxon Mobil Corporation’s (“ExxonMobil’s”) CO2 reserves in LaBarge Field in southwestern Wyoming. In addition to the sources of CO2 we currently own, we purchase and use CO2 captured from industrial sources which could otherwise be released into the atmosphere (sometimes referred to as anthropogenic, man-made or industrial-source CO2) in our tertiary operations. These industrial sources of CO2 help us recover additional oil from mature oil fields and, we believe, also provide an economical way to reduce atmospheric CO2 emissions through the concurrent underground storage of CO2 which occurs as part of our oil-producing EOR operations.
Denbury Resources Inc.
11
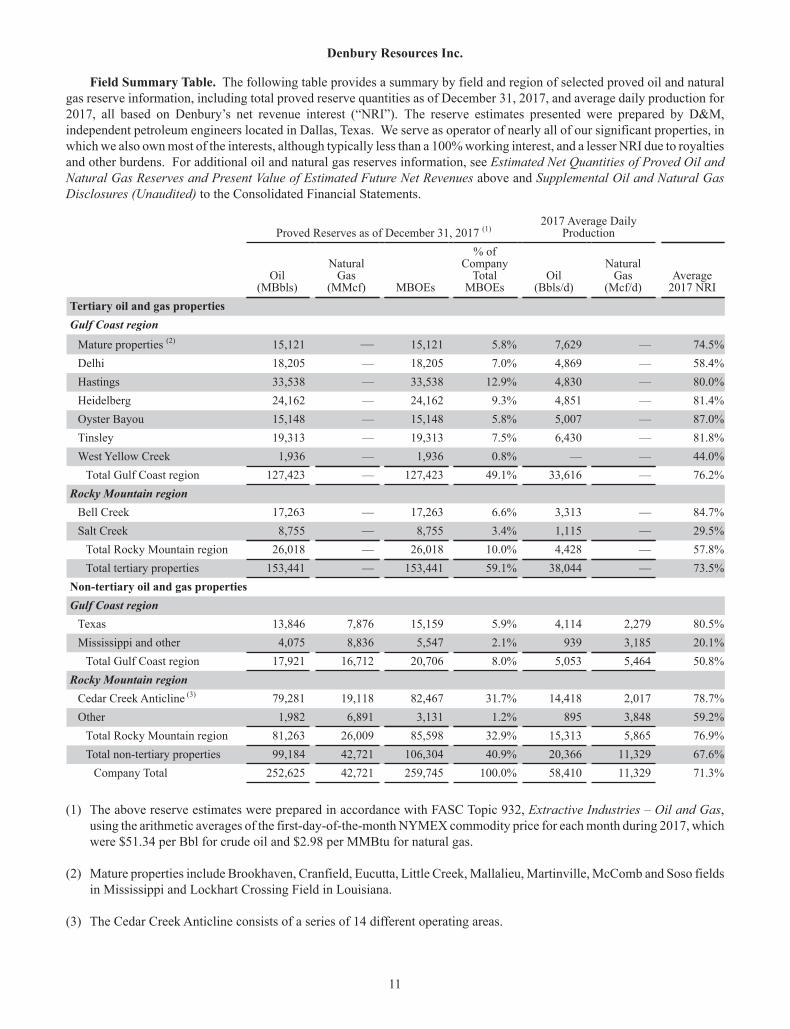
Field Summary Table. The following table provides a summary by field and region of selected proved oil and natural gas reserve information, including total proved reserve quantities as of December 31, 2017, and average daily production for 2017, all based on Denbury’s net revenue interest (“NRI”). The reserve estimates presented were prepared by D&M, independent petroleum engineers located in Dallas, Texas. We serve as operator of nearly all of our significant properties, in which we also own most of the interests, although typically less than a 100% working interest, and a lesser NRI due to royalties and other burdens. For additional oil and natural gas reserves information, see Estimated Net Quantities of Proved Oil and Natural Gas Reserves and Present Value of Estimated Future Net Revenues above and Supplemental Oil and Natural Gas Disclosures (Unaudited) to the Consolidated Financial Statements.
Proved Reserves as of December 31, 2017 (1)2017 Average Daily
Production
Oil(MBbls)
Natural Gas
(MMcf) MBOEs
% of Company
TotalMBOEs
Oil(Bbls/d)
Natural Gas
(Mcf/d)Average
2017 NRITertiary oil and gas propertiesGulf Coast region
Mature properties (2) 15,121 — 15,121 5.8% 7,629 — 74.5%Delhi 18,205 — 18,205 7.0% 4,869 — 58.4%Hastings 33,538 — 33,538 12.9% 4,830 — 80.0%Heidelberg 24,162 — 24,162 9.3% 4,851 — 81.4%Oyster Bayou 15,148 — 15,148 5.8% 5,007 — 87.0%Tinsley 19,313 — 19,313 7.5% 6,430 — 81.8%West Yellow Creek 1,936 — 1,936 0.8% — — 44.0%
Total Gulf Coast region 127,423 — 127,423 49.1% 33,616 — 76.2%Rocky Mountain region
Bell Creek 17,263 — 17,263 6.6% 3,313 — 84.7%Salt Creek 8,755 — 8,755 3.4% 1,115 — 29.5%
Total Rocky Mountain region 26,018 — 26,018 10.0% 4,428 — 57.8%Total tertiary properties 153,441 — 153,441 59.1% 38,044 — 73.5%
Non-tertiary oil and gas propertiesGulf Coast region
Texas 13,846 7,876 15,159 5.9% 4,114 2,279 80.5%Mississippi and other 4,075 8,836 5,547 2.1% 939 3,185 20.1%
Total Gulf Coast region 17,921 16,712 20,706 8.0% 5,053 5,464 50.8%Rocky Mountain region
Cedar Creek Anticline (3) 79,281 19,118 82,467 31.7% 14,418 2,017 78.7%Other 1,982 6,891 3,131 1.2% 895 3,848 59.2%
Total Rocky Mountain region 81,263 26,009 85,598 32.9% 15,313 5,865 76.9%Total non-tertiary properties 99,184 42,721 106,304 40.9% 20,366 11,329 67.6%
Company Total 252,625 42,721 259,745 100.0% 58,410 11,329 71.3%
(1) The above reserve estimates were prepared in accordance with FASC Topic 932, Extractive Industries – Oil and Gas, using the arithmetic averages of the first-day-of-the-month NYMEX commodity price for each month during 2017, which were $51.34 per Bbl for crude oil and $2.98 per MMBtu for natural gas.
(2) Mature properties include Brookhaven, Cranfield, Eucutta, Little Creek, Mallalieu, Martinville, McComb and Soso fields in Mississippi and Lockhart Crossing Field in Louisiana.
(3) The Cedar Creek Anticline consists of a series of 14 different operating areas.
Denbury Resources Inc.
12
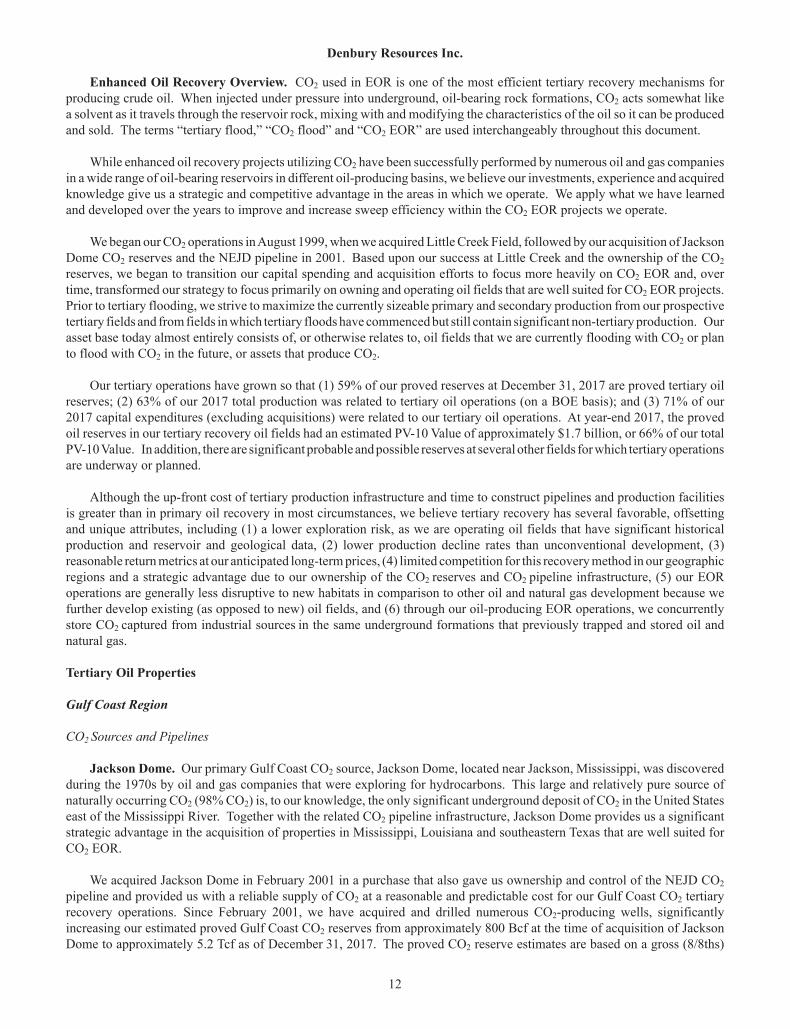
Enhanced Oil Recovery Overview. CO2 used in EOR is one of the most efficient tertiary recovery mechanisms for producing crude oil. When injected under pressure into underground, oil-bearing rock formations, CO2 acts somewhat like a solvent as it travels through the reservoir rock, mixing with and modifying the characteristics of the oil so it can be produced and sold. The terms “tertiary flood,” “CO2 flood” and “CO2 EOR” are used interchangeably throughout this document.
While enhanced oil recovery projects utilizing CO2 have been successfully performed by numerous oil and gas companies in a wide range of oil-bearing reservoirs in different oil-producing basins, we believe our investments, experience and acquired knowledge give us a strategic and competitive advantage in the areas in which we operate. We apply what we have learned and developed over the years to improve and increase sweep efficiency within the CO2 EOR projects we operate.
We began our CO2 operations in August 1999, when we acquired Little Creek Field, followed by our acquisition of Jackson Dome CO2 reserves and the NEJD pipeline in 2001. Based upon our success at Little Creek and the ownership of the CO2reserves, we began to transition our capital spending and acquisition efforts to focus more heavily on CO2 EOR and, over time, transformed our strategy to focus primarily on owning and operating oil fields that are well suited for CO2 EOR projects. Prior to tertiary flooding, we strive to maximize the currently sizeable primary and secondary production from our prospective tertiary fields and from fields in which tertiary floods have commenced but still contain significant non-tertiary production. Our asset base today almost entirely consists of, or otherwise relates to, oil fields that we are currently flooding with CO2 or plan to flood with CO2 in the future, or assets that produce CO2.
Our tertiary operations have grown so that (1) 59% of our proved reserves at December 31, 2017 are proved tertiary oil reserves; (2) 63% of our 2017 total production was related to tertiary oil operations (on a BOE basis); and (3) 71% of our 2017 capital expenditures (excluding acquisitions) were related to our tertiary oil operations. At year-end 2017, the proved oil reserves in our tertiary recovery oil fields had an estimated PV-10 Value of approximately $1.7 billion, or 66% of our total PV-10 Value. In addition, there are significant probable and possible reserves at several other fields for which tertiary operations are underway or planned.
Although the up-front cost of tertiary production infrastructure and time to construct pipelines and production facilities is greater than in primary oil recovery in most circumstances, we believe tertiary recovery has several favorable, offsetting and unique attributes, including (1) a lower exploration risk, as we are operating oil fields that have significant historical production and reservoir and geological data, (2) lower production decline rates than unconventional development, (3) reasonable return metrics at our anticipated long-term prices, (4) limited competition for this recovery method in our geographic regions and a strategic advantage due to our ownership of the CO2 reserves and CO2 pipeline infrastructure, (5) our EOR operations are generally less disruptive to new habitats in comparison to other oil and natural gas development because we further develop existing (as opposed to new) oil fields, and (6) through our oil-producing EOR operations, we concurrently store CO2 captured from industrial sources in the same underground formations that previously trapped and stored oil and natural gas.
Tertiary Oil Properties
Gulf Coast Region
CO2 Sources and Pipelines
Jackson Dome. Our primary Gulf Coast CO2 source, Jackson Dome, located near Jackson, Mississippi, was discovered during the 1970s by oil and gas companies that were exploring for hydrocarbons. This large and relatively pure source of naturally occurring CO2 (98% CO2) is, to our knowledge, the only significant underground deposit of CO2 in the United States east of the Mississippi River. Together with the related CO2 pipeline infrastructure, Jackson Dome provides us a significant strategic advantage in the acquisition of properties in Mississippi, Louisiana and southeastern Texas that are well suited for CO2 EOR.
We acquired Jackson Dome in February 2001 in a purchase that also gave us ownership and control of the NEJD CO2pipeline and provided us with a reliable supply of CO2 at a reasonable and predictable cost for our Gulf Coast CO2 tertiary recovery operations. Since February 2001, we have acquired and drilled numerous CO2-producing wells, significantly increasing our estimated proved Gulf Coast CO2 reserves from approximately 800 Bcf at the time of acquisition of Jackson Dome to approximately 5.2 Tcf as of December 31, 2017. The proved CO2 reserve estimates are based on a gross (8/8ths)

Denbury Resources Inc.
13
basis, of which our net revenue interest is approximately 4.1 Tcf, and is included in the evaluation of proved CO2 reserves prepared by D&M, an independent petroleum engineering consulting firm. In discussing our available CO2 reserves, we make reference to the gross amount of proved and probable reserves, as this is the amount that is available both for our own tertiary recovery programs and for industrial users who are customers of Denbury and others, as we are responsible for distributing the entire CO2 production stream.
In addition to our proved reserves, we estimate that we have 1.0 Tcf of probable CO2 reserves at Jackson Dome. While the majority of these probable reserves are located in structures that have been drilled and tested, such reserves are still considered probable reserves because (1) the original well is plugged; (2) they are located in fault blocks that are immediately adjacent to fault blocks with proved reserves; or (3) they are reserves associated with increasing the ultimate recovery factor from our existing reservoirs with proved reserves. In addition, a significant portion of these probable reserves at Jackson Dome are located in undrilled structures where we have sufficient subsurface and seismic data indicating geophysical attributes that, coupled with our historically high drilling success rate, provide a reasonably high degree of certainty that CO2 is present.
In addition to our drilling at Jackson Dome, we have the capability to expand our processing and dehydration capacities, and install additional pipelines and/or pumping stations necessary to transport the CO2 through our controlled pipeline network. We expect our current proved reserves of CO2, coupled with a risked drilling program at Jackson Dome and CO2 expected to be captured from industrial sources, to provide sufficient quantities of CO2 for us to develop our proved and probable EOR reserves in the Gulf Coast region. In the future, we believe that once a CO2 flood in a field reaches its productive economic limit, we could recycle a portion of the CO2 that remains in that field’s reservoir and utilize it for oil production in another field’s tertiary flood.
In the Gulf Coast region, approximately 87% of our average daily CO2 produced from Jackson Dome or captured from industrial sources in 2017 was used in our tertiary recovery operations, compared to 85% in 2016 and 88% in 2015, with the balance delivered to third-party industrial users. During 2017, we used an average of 493 MMcf/d of CO2 (including CO2captured from industrial sources) for our tertiary activities.
Gulf Coast CO2 Captured from Industrial Sources. In addition to our natural source of CO2, we are currently party to two long-term contracts to purchase CO2 from industrial plants. We have purchased CO2 from an industrial facility in Port Arthur, Texas since 2012 and from an industrial facility in Geismar, Louisiana since 2013, which currently supply approximately 63 MMcf/d of CO2 to our EOR operations. Additionally, we are in ongoing discussions with other parties who have plans to construct plants near the Green Pipeline. In order to capture such volumes, we (or the plant owner) would need to install additional equipment, which includes, at a minimum, compression and dehydration facilities.
Gulf Coast CO2 Pipelines. We acquired the 183-mile NEJD CO2 pipeline that runs from Jackson Dome to near Donaldsonville, Louisiana, as part of the 2001 acquisition of our Jackson Dome CO2 source. Since 2001, we have acquired or constructed over 750 miles of CO2 pipelines, and as of December 31, 2017, we have access to over 950 miles of CO2pipelines, which gives us the ability to deliver CO2 throughout the Gulf Coast region. In addition to the NEJD CO2 pipeline, the major pipelines in the Gulf Coast region are the Free State Pipeline (90 miles), Delta Pipeline (110 miles), Green Pipeline Texas (120 miles), and Green Pipeline Louisiana (200 miles).
Completion of the Green Pipeline allowed for the first CO2 injection into Hastings Field, located near Houston, Texas, in 2010, and gives us the ability to deliver CO2 to oil fields all along the Gulf Coast from Baton Rouge, Louisiana, to Alvin, Texas. At the present time, most of the CO2 flowing in the Green Pipeline is delivered from the Jackson Dome area, but also includes the CO2 we are receiving from the industrial facilities in Port Arthur, Texas and Geismar, Louisiana, and we are currently transporting a third party’s CO2 for a fee to the sales point at Hastings Field. We currently have ample capacity within the Green Pipeline to handle additional volumes that may be required to develop our inventory of CO2 EOR projects in this area.
Tertiary Properties with Tertiary Production and Proved Tertiary Reserves at December 31, 2017
Mature properties. Mature properties include our longest-producing properties which are generally located along our NEJD CO2 pipeline in southwest Mississippi and Louisiana and our Free State Pipeline in east Mississippi. This group of properties includes our initial CO2 field, Little Creek, as well as several other fields (Brookhaven, Cranfield, Eucutta, Lockhart Crossing, Mallalieu, Martinville, McComb and Soso fields). These fields accounted for 20% of our total 2017 CO2 EOR
Denbury Resources Inc.
14
production and approximately 6% of our year-end proved reserves. These fields have been producing for some time, and their production is generally declining.
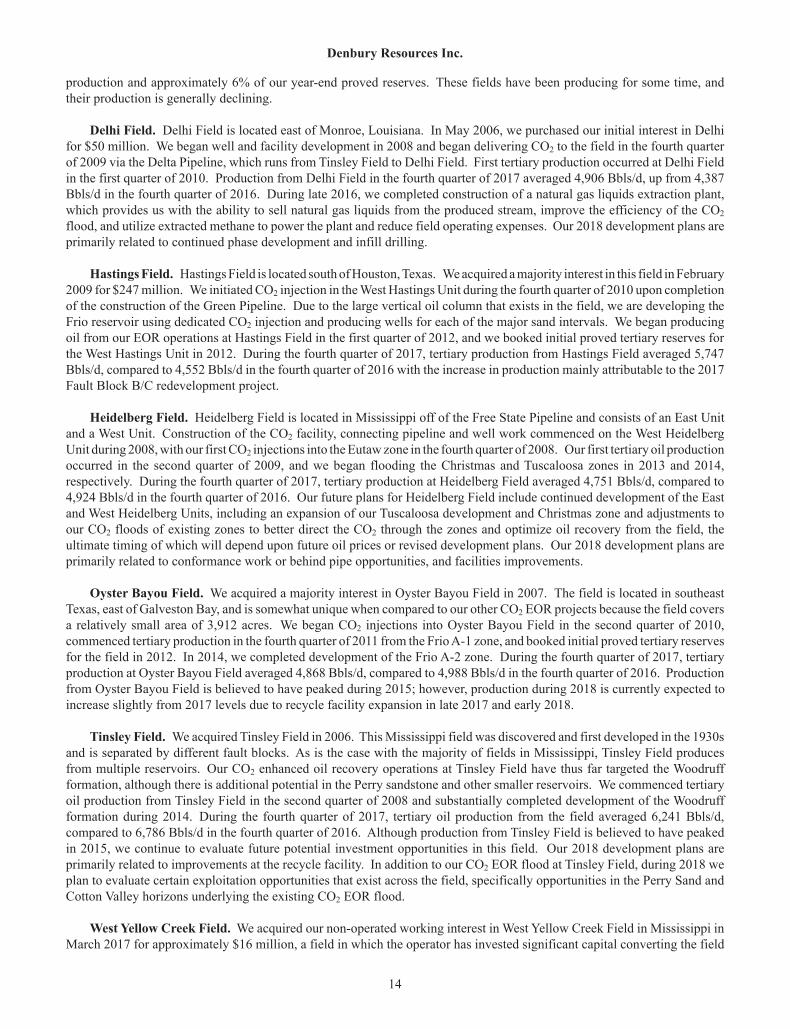
Delhi Field. Delhi Field is located east of Monroe, Louisiana. In May 2006, we purchased our initial interest in Delhi for $50 million. We began well and facility development in 2008 and began delivering CO2 to the field in the fourth quarter of 2009 via the Delta Pipeline, which runs from Tinsley Field to Delhi Field. First tertiary production occurred at Delhi Field in the first quarter of 2010. Production from Delhi Field in the fourth quarter of 2017 averaged 4,906 Bbls/d, up from 4,387 Bbls/d in the fourth quarter of 2016. During late 2016, we completed construction of a natural gas liquids extraction plant, which provides us with the ability to sell natural gas liquids from the produced stream, improve the efficiency of the CO2flood, and utilize extracted methane to power the plant and reduce field operating expenses. Our 2018 development plans are primarily related to continued phase development and infill drilling.
Hastings Field. Hastings Field is located south of Houston, Texas. We acquired a majority interest in this field in February 2009 for $247 million. We initiated CO2 injection in the West Hastings Unit during the fourth quarter of 2010 upon completion of the construction of the Green Pipeline. Due to the large vertical oil column that exists in the field, we are developing the Frio reservoir using dedicated CO2 injection and producing wells for each of the major sand intervals. We began producing oil from our EOR operations at Hastings Field in the first quarter of 2012, and we booked initial proved tertiary reserves for the West Hastings Unit in 2012. During the fourth quarter of 2017, tertiary production from Hastings Field averaged 5,747Bbls/d, compared to 4,552 Bbls/d in the fourth quarter of 2016 with the increase in production mainly attributable to the 2017 Fault Block B/C redevelopment project.
Heidelberg Field. Heidelberg Field is located in Mississippi off of the Free State Pipeline and consists of an East Unit and a West Unit. Construction of the CO2 facility, connecting pipeline and well work commenced on the West Heidelberg Unit during 2008, with our first CO2 injections into the Eutaw zone in the fourth quarter of 2008. Our first tertiary oil production occurred in the second quarter of 2009, and we began flooding the Christmas and Tuscaloosa zones in 2013 and 2014, respectively. During the fourth quarter of 2017, tertiary production at Heidelberg Field averaged 4,751 Bbls/d, compared to 4,924 Bbls/d in the fourth quarter of 2016. Our future plans for Heidelberg Field include continued development of the East and West Heidelberg Units, including an expansion of our Tuscaloosa development and Christmas zone and adjustments to our CO2 floods of existing zones to better direct the CO2 through the zones and optimize oil recovery from the field, the ultimate timing of which will depend upon future oil prices or revised development plans. Our 2018 development plans are primarily related to conformance work or behind pipe opportunities, and facilities improvements.
Oyster Bayou Field. We acquired a majority interest in Oyster Bayou Field in 2007. The field is located in southeast Texas, east of Galveston Bay, and is somewhat unique when compared to our other CO2 EOR projects because the field covers a relatively small area of 3,912 acres. We began CO2 injections into Oyster Bayou Field in the second quarter of 2010, commenced tertiary production in the fourth quarter of 2011 from the Frio A-1 zone, and booked initial proved tertiary reserves for the field in 2012. In 2014, we completed development of the Frio A-2 zone. During the fourth quarter of 2017, tertiary production at Oyster Bayou Field averaged 4,868 Bbls/d, compared to 4,988 Bbls/d in the fourth quarter of 2016. Production from Oyster Bayou Field is believed to have peaked during 2015; however, production during 2018 is currently expected to increase slightly from 2017 levels due to recycle facility expansion in late 2017 and early 2018.
Tinsley Field. We acquired Tinsley Field in 2006. This Mississippi field was discovered and first developed in the 1930s and is separated by different fault blocks. As is the case with the majority of fields in Mississippi, Tinsley Field produces from multiple reservoirs. Our CO2 enhanced oil recovery operations at Tinsley Field have thus far targeted the Woodruff formation, although there is additional potential in the Perry sandstone and other smaller reservoirs. We commenced tertiary oil production from Tinsley Field in the second quarter of 2008 and substantially completed development of the Woodruff formation during 2014. During the fourth quarter of 2017, tertiary oil production from the field averaged 6,241 Bbls/d, compared to 6,786 Bbls/d in the fourth quarter of 2016. Although production from Tinsley Field is believed to have peaked in 2015, we continue to evaluate future potential investment opportunities in this field. Our 2018 development plans are primarily related to improvements at the recycle facility. In addition to our CO2 EOR flood at Tinsley Field, during 2018 we plan to evaluate certain exploitation opportunities that exist across the field, specifically opportunities in the Perry Sand and Cotton Valley horizons underlying the existing CO2 EOR flood.
West Yellow Creek Field. We acquired our non-operated working interest in West Yellow Creek Field in Mississippi in March 2017 for approximately $16 million, a field in which the operator has invested significant capital converting the field
Denbury Resources Inc.
15
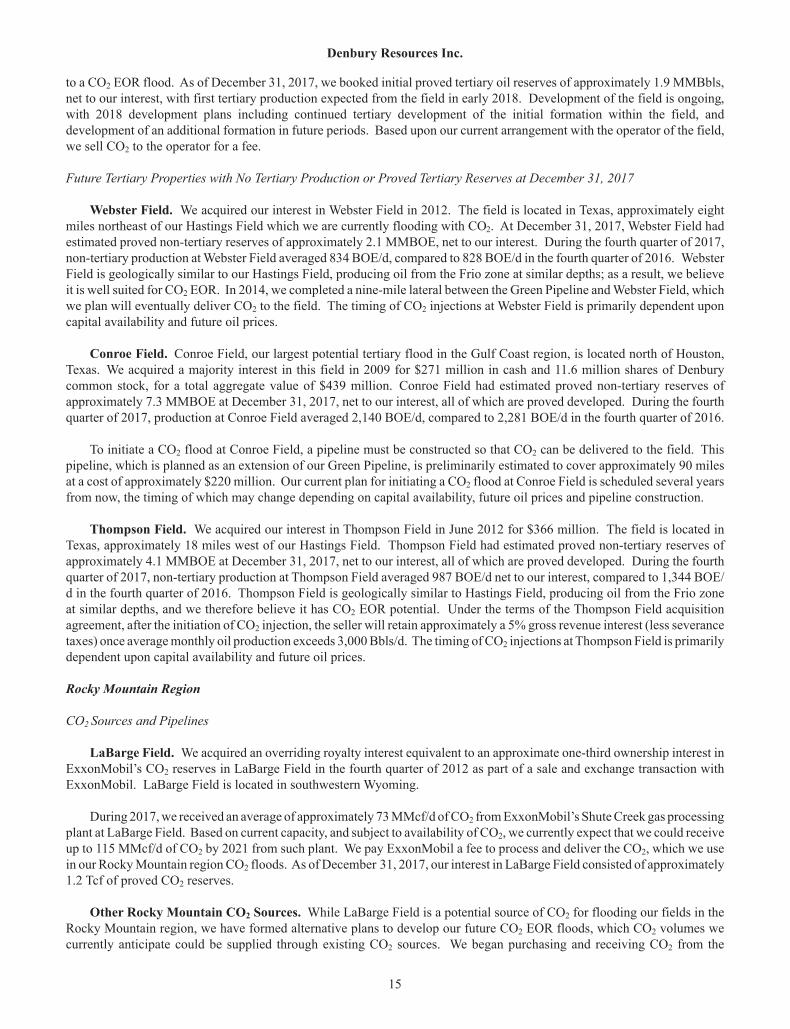
to a CO2 EOR flood. As of December 31, 2017, we booked initial proved tertiary oil reserves of approximately 1.9 MMBbls, net to our interest, with first tertiary production expected from the field in early 2018. Development of the field is ongoing, with 2018 development plans including continued tertiary development of the initial formation within the field, and development of an additional formation in future periods. Based upon our current arrangement with the operator of the field, we sell CO2 to the operator for a fee.
Future Tertiary Properties with No Tertiary Production or Proved Tertiary Reserves at December 31, 2017
Webster Field. We acquired our interest in Webster Field in 2012. The field is located in Texas, approximately eight miles northeast of our Hastings Field which we are currently flooding with CO2. At December 31, 2017, Webster Field had estimated proved non-tertiary reserves of approximately 2.1 MMBOE, net to our interest. During the fourth quarter of 2017, non-tertiary production at Webster Field averaged 834 BOE/d, compared to 828 BOE/d in the fourth quarter of 2016. Webster Field is geologically similar to our Hastings Field, producing oil from the Frio zone at similar depths; as a result, we believe it is well suited for CO2 EOR. In 2014, we completed a nine-mile lateral between the Green Pipeline and Webster Field, which we plan will eventually deliver CO2 to the field. The timing of CO2 injections at Webster Field is primarily dependent upon capital availability and future oil prices.
Conroe Field. Conroe Field, our largest potential tertiary flood in the Gulf Coast region, is located north of Houston, Texas. We acquired a majority interest in this field in 2009 for $271 million in cash and 11.6 million shares of Denbury common stock, for a total aggregate value of $439 million. Conroe Field had estimated proved non-tertiary reserves of approximately 7.3 MMBOE at December 31, 2017, net to our interest, all of which are proved developed. During the fourth quarter of 2017, production at Conroe Field averaged 2,140 BOE/d, compared to 2,281 BOE/d in the fourth quarter of 2016.
To initiate a CO2 flood at Conroe Field, a pipeline must be constructed so that CO2 can be delivered to the field. This pipeline, which is planned as an extension of our Green Pipeline, is preliminarily estimated to cover approximately 90 miles at a cost of approximately $220 million. Our current plan for initiating a CO2 flood at Conroe Field is scheduled several years from now, the timing of which may change depending on capital availability, future oil prices and pipeline construction.
Thompson Field. We acquired our interest in Thompson Field in June 2012 for $366 million. The field is located in Texas, approximately 18 miles west of our Hastings Field. Thompson Field had estimated proved non-tertiary reserves of approximately 4.1 MMBOE at December 31, 2017, net to our interest, all of which are proved developed. During the fourth quarter of 2017, non-tertiary production at Thompson Field averaged 987 BOE/d net to our interest, compared to 1,344 BOE/d in the fourth quarter of 2016. Thompson Field is geologically similar to Hastings Field, producing oil from the Frio zone at similar depths, and we therefore believe it has CO2 EOR potential. Under the terms of the Thompson Field acquisition agreement, after the initiation of CO2 injection, the seller will retain approximately a 5% gross revenue interest (less severance taxes) once average monthly oil production exceeds 3,000 Bbls/d. The timing of CO2 injections at Thompson Field is primarily dependent upon capital availability and future oil prices.
Rocky Mountain Region
CO2 Sources and Pipelines
LaBarge Field. We acquired an overriding royalty interest equivalent to an approximate one-third ownership interest in ExxonMobil’s CO2 reserves in LaBarge Field in the fourth quarter of 2012 as part of a sale and exchange transaction with ExxonMobil. LaBarge Field is located in southwestern Wyoming.
During 2017, we received an average of approximately 73 MMcf/d of CO2 from ExxonMobil’s Shute Creek gas processing plant at LaBarge Field. Based on current capacity, and subject to availability of CO2, we currently expect that we could receive up to 115 MMcf/d of CO2 by 2021 from such plant. We pay ExxonMobil a fee to process and deliver the CO2, which we use in our Rocky Mountain region CO2 floods. As of December 31, 2017, our interest in LaBarge Field consisted of approximately 1.2 Tcf of proved CO2 reserves.
Other Rocky Mountain CO2 Sources. While LaBarge Field is a potential source of CO2 for flooding our fields in the Rocky Mountain region, we have formed alternative plans to develop our future CO2 EOR floods, which CO2 volumes we currently anticipate could be supplied through existing CO2 sources. We began purchasing and receiving CO2 from the
Denbury Resources Inc.
16
ConocoPhillips-operated Lost Cabin gas plant in central Wyoming in the first quarter of 2013, under a contract that provides us as much as 50 MMcf/d of CO2 for use in our Rocky Mountain region CO2 floods.
Greencore Pipeline. The 20-inch Greencore Pipeline in Wyoming is the first CO2 pipeline we constructed in the Rocky Mountain region. We plan to use the pipeline as our trunk line in the Rocky Mountain region, eventually connecting our various Rocky Mountain region CO2 sources to the Cedar Creek Anticline in eastern Montana and western North Dakota. The initial 232-mile section of the Greencore Pipeline begins at the ConocoPhillips-operated Lost Cabin gas plant in Wyoming and terminates at Bell Creek Field in Montana. We completed construction of this section of the pipeline in the fourth quarter of 2012 and received our first CO2 deliveries from the ConocoPhillips-operated Lost Cabin gas plant during the first quarter of 2013. During the first quarter of 2014, we completed construction of an interconnect between our Greencore Pipeline and an existing third-party CO2 pipeline in Wyoming, which enables us to transport CO2 from LaBarge Field to our Bell Creek Field.
Tertiary Properties with Tertiary Production and Proved Tertiary Reserves at December 31, 2017
Bell Creek Field. We acquired our interest in Bell Creek Field in southeast Montana as part of the Encore merger in 2010. The oil-producing reservoir in Bell Creek Field is a sandstone reservoir with characteristics similar to those we have successfully flooded with CO2 in the Gulf Coast region. During 2013, we began first CO2 injections into Bell Creek Field, recorded our first tertiary oil production, and booked initial proved tertiary reserves. Tertiary production, net to our interest, during the fourth quarter of 2017 averaged 3,571 Bbls/d of oil, compared to 3,269 Bbls/d in the fourth quarter of 2016. Our 2018 development plans are primarily related to phase six expansion of the flood. We expect production from this field will continue to increase during 2018.
Salt Creek Field. We acquired our non-operated working interest in Salt Creek Field in Wyoming for approximately $72 million in June 2017. Tertiary production, net to our interest, during the fourth quarter of 2017 averaged 2,172 Bbls/d of oil and is expected to increase over the next several years with minimal capital spending.
Future Tertiary Properties with No Tertiary Production or Proved Tertiary Reserves at December 31, 2017
Cedar Creek Anticline. CCA is the largest potential EOR property that we own and currently our largest producing property, contributing approximately 24% of our 2017 total production. The field is primarily located in Montana but extends over such a large area (approximately 126 miles) that it also extends into North Dakota. CCA is a series of 14 different operating areas, each of which could be considered a field by itself. We acquired our initial interest in CCA as part of the Encore merger in 2010 and acquired additional interests (the “CCA Acquisition”) from a wholly-owned subsidiary of ConocoPhillips in the first quarter of 2013 for $1.0 billion, adding 42.2 MMBOE of incremental proved reserves at that date. Production from CCA, net to our interest, averaged 14,302 BOE/d during the fourth quarter of 2017, compared to production during the fourth quarter of 2016 of 15,186 BOE/d. The non-tertiary proved reserves associated with CCA were 82.5 MMBOE, net to our interest, as of December 31, 2017. Our 2018 development plans for CCA primarily include exploitation and development of six additional wells in the Mission Canyon formation and waterflood infill projects. Our first Mission Canyon exploitation well was drilled during the fourth quarter of 2017 in the Pennel Field in the Cedar Creek Anticline, and began producing on December 30, 2017. Average gross production over the initial 30-day production period was 1,050 Bbls/d of oil.
CCA is located approximately 110 miles north of Bell Creek Field, and we currently expect to ultimately connect this field to our Greencore Pipeline. Our current plan for initiating a CO2 flood at CCA is several years from now, the timing of which may change depending on future oil prices, pipeline permitting and sources and availability of CO2. We are targeting an investment decision in the first half of 2018 regarding a path forward for CO2 flooding at CCA.
Grieve Field. In the second quarter of 2011, we entered into a farm-in agreement, under which we obtained a 65% working interest in Grieve Field, located in Natrona County, Wyoming, in exchange for developing the Grieve Field CO2 flood. We completed a three-mile CO2 pipeline to deliver CO2 from an existing CO2 pipeline to Grieve Field in the fourth quarter of 2012. During the third quarter of 2016, the Company and its joint venture partner in Grieve Field reached an agreement to revise the joint venture arrangement between the parties for the continued development of the field. The revised agreement provides for our partner to fund up to $55 million of the remaining estimated capital to complete development of the facility and fieldwork in exchange for a 14% higher working interest and a disproportionate sharing of revenue from the
Denbury Resources Inc.
17
first 2 million barrels of production. As a result of this agreement, our working interest in the field was reduced from 65% to 51%. This arrangement accelerated the remaining development of the facility and fieldwork, and we currently anticipate first tertiary production in mid-2018.
Hartzog Draw Field. We acquired our interest in Hartzog Draw Field in the fourth quarter of 2012. The field is located in the Powder River Basin of northeastern Wyoming, approximately 12 miles from our Greencore Pipeline. Hartzog Draw Field had estimated proved reserves of approximately 3.1 MMBOE at December 31, 2017, net to our interest, 1.1 MMBOE of which relate to the natural gas producing Big George coal zone. During the fourth quarter of 2017, non-tertiary production averaged 1,518 BOE/d, compared to 1,665 BOE/d in the fourth quarter of 2016. After successfully completing 5 wells in Hartzog Draw Field in 2014, we suspended the non-tertiary development of Hartzog Draw Field in light of the oil price environment. Activity around this field has continued to increase over the past year, with several operators testing various formations for potential development. In 2018, we currently have plans to drill one well testing the deeper formations that exist on our acreage. We believe the oil reservoir characteristics of Hartzog Draw Field make it well suited for CO2 EOR in the future. We currently plan to initiate a CO2 flood at Hartzog Draw Field several years from now, the timing of which is dependent on capital availability and future oil prices.
Other Non-Tertiary Oil Properties
Despite the majority of our oil and natural gas properties discussed above consisting of either existing or planned future tertiary floods, we do also produce oil and natural gas either from fields in both our Gulf Coast and Rocky Mountain regions that are not amenable to EOR or from specific reservoirs (within an existing tertiary field) that are not amenable to EOR. For example, at Heidelberg Field, we produce natural gas from the Selma Chalk reservoir, which is separate from the Christmas and Eutaw reservoirs currently being flooded with CO2. Continuing production from these other non-tertiary properties totaled 1,875 BOE/d during the fourth quarter of 2017, compared to 2,035 BOE/d during the fourth quarter of 2016. OIL AND GAS ACREAGE, PRODUCTIVE WELLS AND DRILLING ACTIVITY
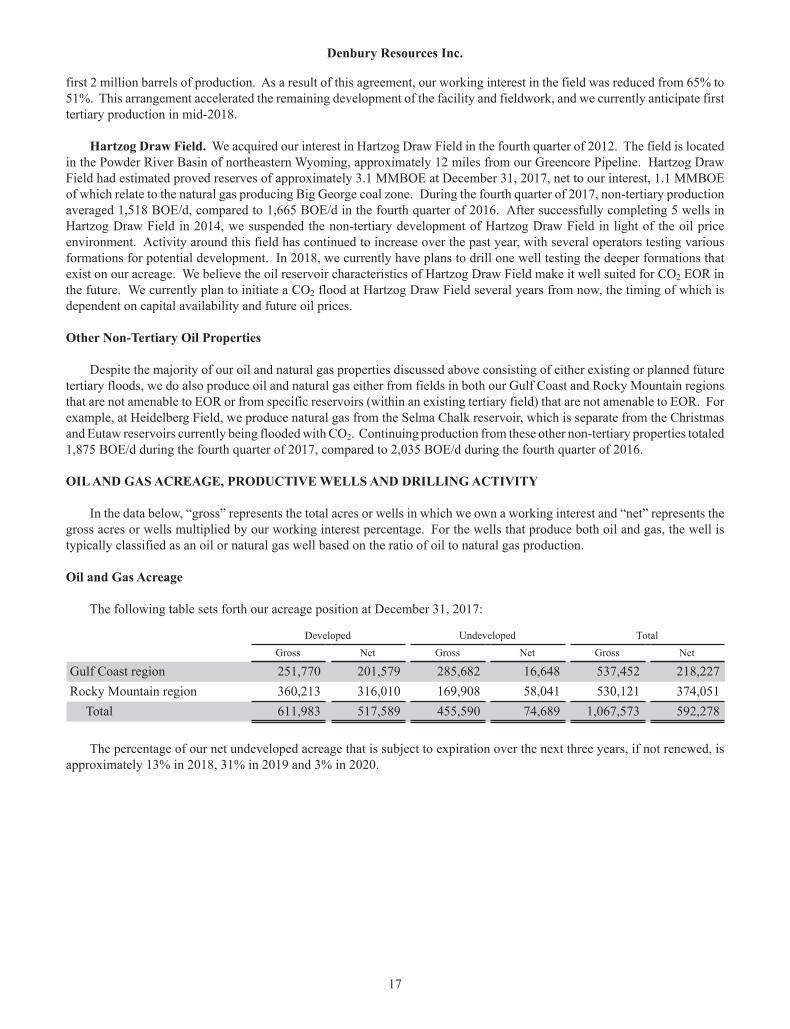
In the data below, “gross” represents the total acres or wells in which we own a working interest and “net” represents the gross acres or wells multiplied by our working interest percentage. For the wells that produce both oil and gas, the well is typically classified as an oil or natural gas well based on the ratio of oil to natural gas production.
Oil and Gas Acreage
The following table sets forth our acreage position at December 31, 2017:
Developed Undeveloped Total Gross Net Gross Net Gross Net
Gulf Coast region 251,770 201,579 285,682 16,648 537,452 218,227Rocky Mountain region 360,213 316,010 169,908 58,041 530,121 374,051
Total 611,983 517,589 455,590 74,689 1,067,573 592,278
The percentage of our net undeveloped acreage that is subject to expiration over the next three years, if not renewed, is approximately 13% in 2018, 31% in 2019 and 3% in 2020.
Denbury Resources Inc.
18
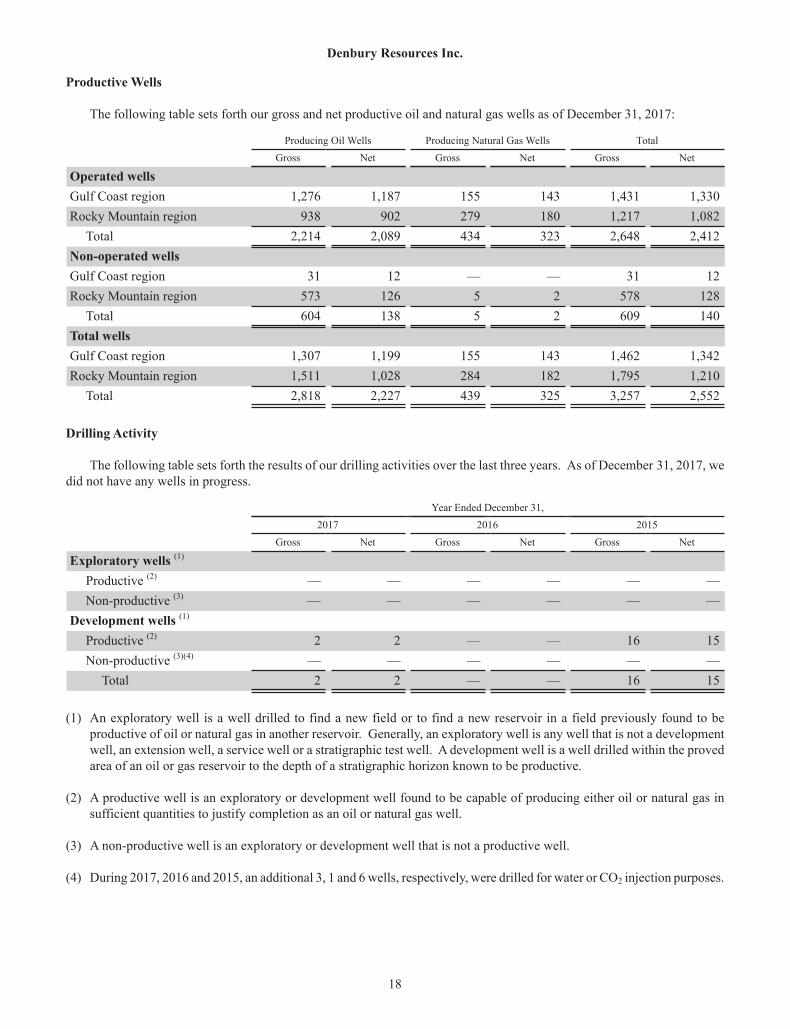
Productive Wells
The following table sets forth our gross and net productive oil and natural gas wells as of December 31, 2017:
Producing Oil Wells Producing Natural Gas Wells Total Gross Net Gross Net Gross Net
Operated wells Gulf Coast region 1,276 1,187 155 143 1,431 1,330Rocky Mountain region 938 902 279 180 1,217 1,082
Total 2,214 2,089 434 323 2,648 2,412Non-operated wells Gulf Coast region 31 12 — — 31 12Rocky Mountain region 573 126 5 2 578 128
Total 604 138 5 2 609 140Total wells Gulf Coast region 1,307 1,199 155 143 1,462 1,342Rocky Mountain region 1,511 1,028 284 182 1,795 1,210
Total 2,818 2,227 439 325 3,257 2,552
Drilling Activity
The following table sets forth the results of our drilling activities over the last three years. As of December 31, 2017, we did not have any wells in progress.
Year Ended December 31, 2017 2016 2015 Gross Net Gross Net Gross Net
Exploratory wells (1) Productive (2) — — — — — —Non-productive (3) — — — — — —
Development wells (1) Productive (2) 2 2 — — 16 15Non-productive (3)(4) — — — — — —
Total 2 2 — — 16 15
(1) An exploratory well is a well drilled to find a new field or to find a new reservoir in a field previously found to be productive of oil or natural gas in another reservoir. Generally, an exploratory well is any well that is not a development well, an extension well, a service well or a stratigraphic test well. A development well is a well drilled within the proved area of an oil or gas reservoir to the depth of a stratigraphic horizon known to be productive.
(2) A productive well is an exploratory or development well found to be capable of producing either oil or natural gas in sufficient quantities to justify completion as an oil or natural gas well.
(3) A non-productive well is an exploratory or development well that is not a productive well.
(4) During 2017, 2016 and 2015, an additional 3, 1 and 6 wells, respectively, were drilled for water or CO2 injection purposes.
Denbury Resources Inc.
19
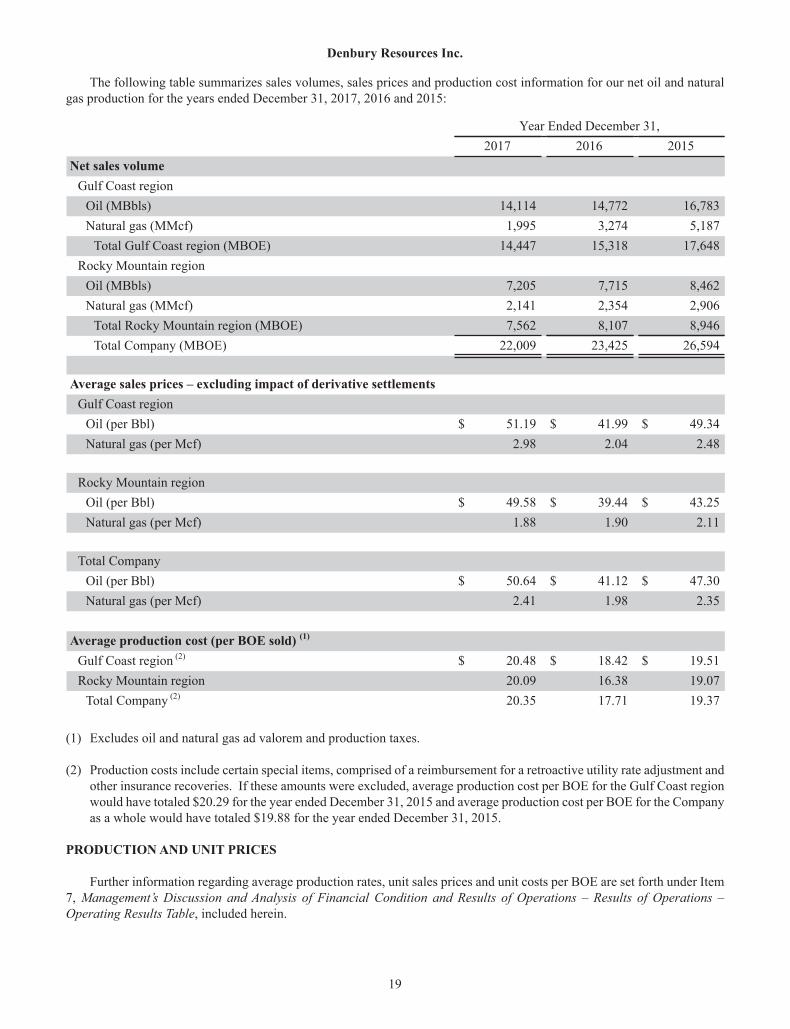
The following table summarizes sales volumes, sales prices and production cost information for our net oil and natural gas production for the years ended December 31, 2017, 2016 and 2015:
Year Ended December 31, 2017 2016 2015Net sales volume
Gulf Coast region Oil (MBbls) 14,114 14,772 16,783Natural gas (MMcf) 1,995 3,274 5,187
Total Gulf Coast region (MBOE) 14,447 15,318 17,648Rocky Mountain region
Oil (MBbls) 7,205 7,715 8,462Natural gas (MMcf) 2,141 2,354 2,906
Total Rocky Mountain region (MBOE) 7,562 8,107 8,946Total Company (MBOE) 22,009 23,425 26,594
Average sales prices – excluding impact of derivative settlements Gulf Coast region
Oil (per Bbl) $ 51.19 $ 41.99 $ 49.34Natural gas (per Mcf) 2.98 2.04 2.48
Rocky Mountain region Oil (per Bbl) $ 49.58 $ 39.44 $ 43.25Natural gas (per Mcf) 1.88 1.90 2.11
Total Company Oil (per Bbl) $ 50.64 $ 41.12 $ 47.30Natural gas (per Mcf) 2.41 1.98 2.35
Average production cost (per BOE sold) (1) Gulf Coast region (2) $ 20.48 $ 18.42 $ 19.51Rocky Mountain region 20.09 16.38 19.07
Total Company (2) 20.35 17.71 19.37
(1) Excludes oil and natural gas ad valorem and production taxes.
(2) Production costs include certain special items, comprised of a reimbursement for a retroactive utility rate adjustment and other insurance recoveries. If these amounts were excluded, average production cost per BOE for the Gulf Coast region would have totaled $20.29 for the year ended December 31, 2015 and average production cost per BOE for the Company as a whole would have totaled $19.88 for the year ended December 31, 2015.
PRODUCTION AND UNIT PRICES
Further information regarding average production rates, unit sales prices and unit costs per BOE are set forth under Item 7, Management’s Discussion and Analysis of Financial Condition and Results of Operations – Results of Operations – Operating Results Table, included herein.
Denbury Resources Inc.
20
TITLE TO PROPERTIES
As is customary in the oil and natural gas industry, Denbury conducts a limited title examination at the time of its acquisition of properties or leasehold interests targeted for enhanced recovery, and curative work is performed with respect to significant defects on higher-value properties of the greatest significance. We believe that title to our oil and natural gas properties is good and defensible, subject only to such exceptions that we believe do not materially interfere with the use of such properties, including encumbrances, easements, restrictions and royalty, overriding royalty and other similar interests.
SIGNIFICANT OIL AND GAS PURCHASERS AND PRODUCT MARKETING
Oil and natural gas sales are made on a day-to-day basis or under short-term contracts at the current area market price. We would not expect the loss of any single purchaser to have a material adverse effect upon our operations; however, the loss of a large single purchaser could potentially reduce the competition for our oil and natural gas production, which in turn could negatively impact the prices we receive. For the years ended December 31, 2017, 2016 and 2015, two purchasers accounted for 10% or more of our oil and natural gas revenues: Plains Marketing LP (22%, 20% and 15% in 2017, 2016 and 2015, respectively) and Marathon Petroleum Company (10%, 14% and 28% in 2017, 2016 and 2015, respectively).
Our ability to market oil and natural gas depends on many factors beyond our control, including the extent of domestic production and imports of oil and natural gas, the proximity of our oil and natural gas production to pipelines and corresponding markets, the available capacity in such pipelines, the demand for oil and natural gas, the effects of weather, and the effects of state and federal regulation. As of December 31, 2017, we have not experienced significant difficulty in finding a market for all of our production as it becomes available or in transporting our production to those markets; however, there is no assurance that we will always be able to market all of our production or obtain favorable prices.
Oil Marketing
Prices received in a regional market fluctuate frequently and can differ from NYMEX pricing due to a variety of reasons, including supply and/or demand factors, crude oil quality and location differentials. The oil differentials we received in the Gulf Coast and Rocky Mountain regions are discussed in further detail below.
Crude oil prices in the Gulf Coast region are impacted significantly by the changes in prices received for our crude oil sold under Light Louisiana Sweet (“LLS”) index prices relative to the change in NYMEX prices. Overall, during 2017, we sold approximately 65% of our crude oil at prices based on, or partially tied to, the LLS index price, and the balance at prices based on various other indexes tied to NYMEX prices, primarily in the Rocky Mountain region. The average LLS-to-NYMEX differential (on a trade-month basis) was a positive $2.85 per Bbl during 2017, compared to a positive $1.70 per Bbl during 2016 and a positive $3.72 per Bbl in 2015. During 2017, our light sweet crude oil production in the Gulf Coast region, on average, sold for $0.26 per Bbl above NYMEX, compared to $1.38 per Bbl below NYMEX in 2016 and $0.56 per Bbl over NYMEX in 2015. Our current markets at various sales points along the Gulf Coast have sufficient demand to accommodate our production, but there can be no assurance of future demand. We are, therefore, monitoring the marketplace for opportunities to strategically enter into long-term marketing arrangements.
The marketing of our Rocky Mountain region oil production is dependent on transportation through local pipelines to market centers in Guernsey, Wyoming; Clearbrook, Minnesota; Wood River, Illinois; and most recently Cushing, Oklahoma. Shipments on some of the pipelines are at or near capacity and may be subject to apportionment. We currently have access to, or have contracted for, sufficient pipeline capacity to move our oil production; however, there can be no assurance that we will be allocated sufficient pipeline capacity to move all of our oil production in the future. Because local demand for production is small in comparison to current production levels, much of the production in the Rocky Mountain region is transported to markets outside of the region. Therefore, prices in the Rocky Mountain region are further influenced by fluctuations in prices (primarily Brent and LLS) in coastal markets and by available pipeline capacity in the Midwest and Cushing markets. For the year ended December 31, 2017, the discount for our oil production in the Rocky Mountain region averaged $1.39 per Bbl, compared to $3.97 per Bbl during 2016 and $5.60 per Bbl during 2015.
Denbury Resources Inc.
21
COMPETITION AND MARKETS
We face competition from other oil and natural gas companies in all aspects of our business, including acquisition of producing properties, oil and gas leases, drilling rights, and CO2 properties; marketing of oil and natural gas; and obtaining and maintaining goods, services and labor. Many of our competitors have substantially larger financial and other resources. Factors that affect our ability to acquire producing properties include available liquidity, available information about prospective properties and our expectations for earning a minimum projected return on our investments. Because of the primary nature of our core assets (our tertiary operations) and our ownership of relatively uncommon significant natural sources of CO2 in the Gulf Coast and Rocky Mountain regions, we believe that we are effective in competing in the market and have less competition than our peers in certain aspects of our business.
The demand for qualified and experienced field personnel to drill wells and conduct field operations and for geologists, geophysicists, engineers and other professionals in the oil and gas industry can fluctuate significantly, often in correlation with commodity prices, causing periodic shortages in such personnel. Prior to the recent downturn in oil prices, the competition for qualified technical personnel had been extensive, and our personnel costs escalated. There were also periods with shortages of drilling rigs and other equipment, as demand for rigs and equipment has increased along with the number of wells being drilled. These factors also cause significant increases in costs for equipment, services and personnel. We cannot be certain when we will experience these issues, and these types of shortages or price increases could significantly decrease our profit margin, cash flow and operating results, and cause significant delays in our development operations.
FEDERAL AND STATE REGULATIONS
Numerous federal, state and local laws and regulations govern the oil and gas industry. Additions or changes to these laws and regulations are often made in response to the current political or economic environment. Compliance with the evolving regulatory landscape is often difficult, and substantial penalties may be incurred for noncompliance. Additionally, the future annual cost of complying with all laws and regulations applicable to our operations is uncertain and will be ultimately determined by several factors, including future changes to legal and regulatory requirements. Management believes that continued compliance with existing laws and regulations applicable to our operations and future compliance therewith will not have a materially adverse effect on our consolidated financial position, results of operations or cash flows, although such laws and regulations, and compliance therewith, could cause significant delays or otherwise impede operations, which may, among other things, cause our expected production rates and cash flows to be less than anticipated.
The following sections describe some specific laws and regulations that may affect us. We cannot predict the cost or impact of these or other future legislative or regulatory initiatives.
Regulation of Natural Gas and Oil Exploration and Production
Our operations are subject to various types of regulation at the federal, state and local levels. Such regulation includes requiring permits for drilling wells; maintaining bonding requirements in order to drill or operate wells and regulating the location of wells; the method of drilling and casing wells; the surface use and restoration of properties upon which wells are drilled; the plugging and abandoning of wells; and the composition or disposal of chemicals and fluids used in connection with operations. Our operations are also subject to various conservation laws and regulations. These include regulation of the size of drilling, spacing or proration units and the density of wells that may be drilled in those units, and the unitization or pooling of oil and gas properties. In addition, federal and state conservation laws, which establish maximum rates of production from oil and gas wells, generally prohibit or restrict the venting or flaring of natural gas and impose certain requirements regarding the ratability of production. The effect of these laws and regulations may limit the amount of oil and natural gas we can produce from our wells and may limit the number of wells or the locations at which we can drill. Regulatory requirements and compliance relative to the oil and gas industry increase our costs of doing business and, consequently, affect our profitability.
Denbury Resources Inc.
22
Federal Regulation of Sales Prices and Transportation
The transportation of, and certain sales with respect to, natural gas in interstate commerce are heavily regulated by agencies of the U.S. federal government and are affected by, among other things, the availability, terms and cost of transportation. Notably, the price and terms of access to pipeline transportation are subject to extensive U.S. federal and state regulation. The Federal Energy Regulatory Commission (“FERC”) is continually proposing and implementing new and/or modified rules and regulations affecting the natural gas industry, some of which may adversely affect the availability and reliability of interruptible transportation service on interstate pipelines. While our sales of crude oil, condensate and natural gas liquids are not currently subject to FERC regulation, our ability to transport and sell such products is dependent on certain pipelines whose rates, terms and conditions of service are subject to FERC regulation. Additional proposals and proceedings that might affect the natural gas industry are considered from time to time by Congress, FERC, state regulatory bodies and the courts, and we cannot predict when or if any such proposals or proceedings might become effective and their effect or impact, if any, on our operations.
Federal Energy and Climate Change Legislation and Regulation
The Pipeline Safety, Regulatory Certainty and Job Creation Act of 2011, among other things, updated federal pipeline safety standards, increased penalties for violations of such standards, gave the Department of Transportation’s Pipeline and Hazardous Materials Safety Administration (the “PHMSA”) authority for new damage prevention and incident notification, and directed the PHMSA to prescribe new minimum safety standards for CO2 pipelines, which safety standards could affect our operations and the costs thereof. While the PHMSA has adopted or proposed to adopt a number of new regulations to implement this act, no new minimum safety standards have been proposed or adopted for CO2 pipelines.
Both federal and state authorities have in recent years proposed new regulations to limit the emission of greenhouse gasses as part of climate change initiatives. For example, both the EPA and BLM have issued regulations for the control of methane emissions. The EPA has promulgated regulations requiring permitting for certain sources of greenhouse gas emissions, and in May 2016, promulgated final regulations to reduce methane and volatile organic compound emissions from the oil and gas sector. A federal appeals courts in July 2017 rejected an attempt by the EPA to delay implementation of the rule, and the EPA has indicated that it may conduct a rulemaking to revise or rescind the rule. Enforcement of these regulations may impose additional costs related to compliance with new emission limits, as well as inspections and maintenance of several types of equipment used in our operations.
Natural Gas Gathering Regulations
State and federal regulation of natural gas gathering facilities generally includes various safety, environmental and, in some circumstances, nondiscriminatory-take requirements. With the increase in construction and operation of natural gas gathering lines in various states, natural gas gathering is receiving greater regulatory scrutiny from state and federal regulatory agencies, which is likely to continue in the future.
Federal, State or Indian Leases
Our operations on federal, state or Indian oil and gas leases, especially those in the Rocky Mountain region, are subject to numerous restrictions, including nondiscrimination statutes. Such operations must be conducted pursuant to certain on-site security regulations and other permits and authorizations issued by the Bureau of Land Management, the Bureau of Ocean Energy Management, the Bureau of Safety and Environmental Enforcement, the Bureau of Indian Affairs, and other federal and state stakeholder agencies.
Environmental Regulations
Our oil and natural gas production, saltwater disposal operations, injection of CO2, and the processing, handling and disposal of materials such as hydrocarbons and naturally occurring radioactive materials (“NORM”) are subject to stringent regulation. We could incur significant costs, including cleanup costs resulting from a release of product, third-party claims for property damage and personal injuries, or penalties and other sanctions as a result of any violations or liabilities under environmental laws and regulations or other laws and regulations applicable to our operations. Changes in, or more stringent
Denbury Resources Inc.
23
enforcement of, environmental laws and other laws applicable to our operations could also result in delays or additional operating costs and capital expenditures.
Various federal, state and local laws and regulations controlling the discharge of materials into the environment, or otherwise relating to the protection of the environment and human health, directly impact our oil and gas exploration, development and production operations. These include, among others, (1) regulations adopted by the EPA and various state agencies regarding approved methods of disposal for certain hazardous and nonhazardous wastes; (2) the Comprehensive Environmental Response, Compensation, and Liability Act and analogous state laws that regulate the removal or remediation of previously disposed wastes (including wastes disposed of or released by prior owners or operators), property contamination (including groundwater contamination), and remedial plugging operations to prevent future contamination; (3) the Clean Air Act and comparable state and local requirements already applicable to our operations and new restrictions on air emissions from our operations, including greenhouse gas emissions and those that could discourage the production of fossil fuels that, when used, ultimately release CO2; (4) the Oil Pollution Act of 1990, which contains numerous requirements relating to the prevention of, and response to, oil spills into waters of the United States; (5) the Resource Conservation and Recovery Act, which is the principal federal statute governing the treatment, storage and disposal of hazardous wastes; (6) the Endangered Species Act and counterpart state legislation, which protects certain species (and their related habitats), including certain species that could be present on our leases, as threatened or endangered; and (7) state regulations and statutes governing the handling, treatment, storage and disposal of NORM and other wastes.
In the Rocky Mountain Region, federal agencies’ actions based upon their environmental review responsibilities under the National Environmental Policy Act can significantly impact the scope and timing of hydrocarbon development by slowing the timing of individual applications for permits to drill and requests for rights-of-way, and delaying large scale planning associated with region-level resource management plans and project-level master development plans.
Management believes that we are currently in substantial compliance with existing applicable environmental laws and regulations, and does not currently anticipate that future compliance will have a materially adverse effect on our consolidated financial position, results of operations or cash flows, although such laws and regulations, and compliance therewith, could cause significant delays or otherwise impede operations, which may, among other things, cause our expected production rates and cash flows to be less than anticipated.
Hydraulic Fracturing
During 2017, we fracture stimulated eleven wells at Hartzog Draw and Bell Creek fields utilizing water-based fluids with no diesel fuel component. We are currently evaluating the potential to refrac additional wells at Bell Creek Field during 2018. We are familiar with the laws and regulations applicable to hydraulic fracturing operations and take steps to ensure compliance with these requirements.
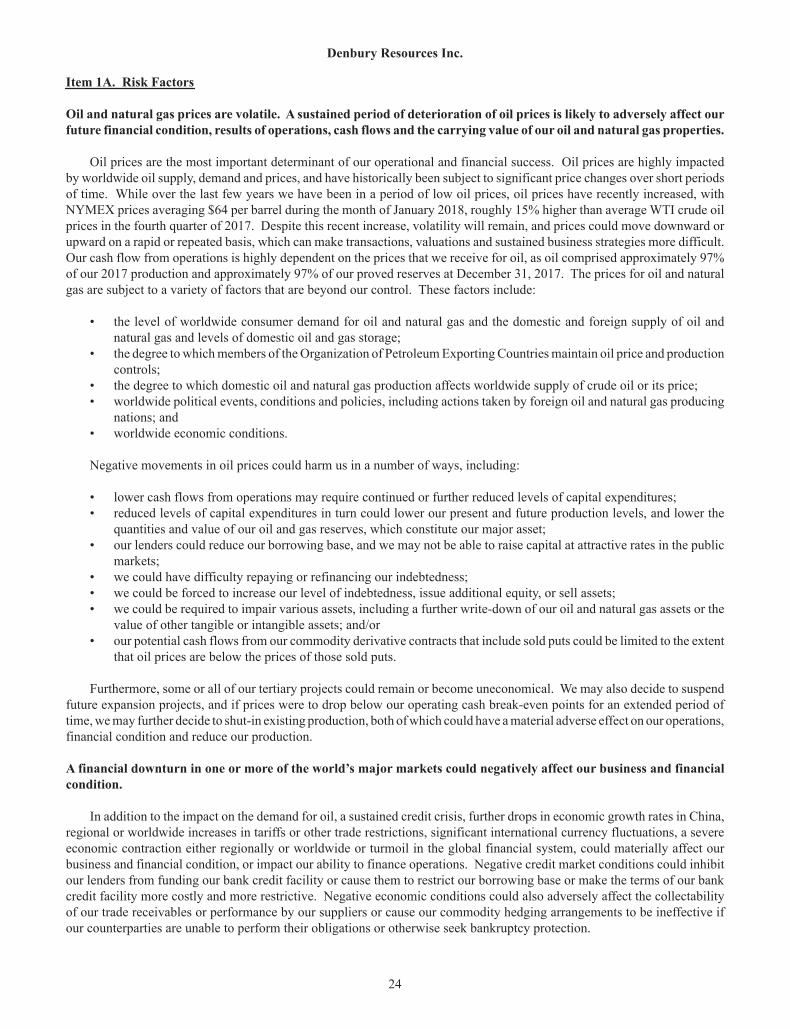
Denbury Resources Inc.
24
Item 1A. Risk Factors
Oil and natural gas prices are volatile. A sustained period of deterioration of oil prices is likely to adversely affect our future financial condition, results of operations, cash flows and the carrying value of our oil and natural gas properties.
Oil prices are the most important determinant of our operational and financial success. Oil prices are highly impacted by worldwide oil supply, demand and prices, and have historically been subject to significant price changes over short periods of time. While over the last few years we have been in a period of low oil prices, oil prices have recently increased, with NYMEX prices averaging $64 per barrel during the month of January 2018, roughly 15% higher than average WTI crude oil prices in the fourth quarter of 2017. Despite this recent increase, volatility will remain, and prices could move downward or upward on a rapid or repeated basis, which can make transactions, valuations and sustained business strategies more difficult. Our cash flow from operations is highly dependent on the prices that we receive for oil, as oil comprised approximately 97%of our 2017 production and approximately 97% of our proved reserves at December 31, 2017. The prices for oil and natural gas are subject to a variety of factors that are beyond our control. These factors include:
• the level of worldwide consumer demand for oil and natural gas and the domestic and foreign supply of oil and natural gas and levels of domestic oil and gas storage;
• the degree to which members of the Organization of Petroleum Exporting Countries maintain oil price and production controls;
• the degree to which domestic oil and natural gas production affects worldwide supply of crude oil or its price;• worldwide political events, conditions and policies, including actions taken by foreign oil and natural gas producing
nations; and• worldwide economic conditions.
Negative movements in oil prices could harm us in a number of ways, including:
• lower cash flows from operations may require continued or further reduced levels of capital expenditures;• reduced levels of capital expenditures in turn could lower our present and future production levels, and lower the
quantities and value of our oil and gas reserves, which constitute our major asset;• our lenders could reduce our borrowing base, and we may not be able to raise capital at attractive rates in the public
markets;• we could have difficulty repaying or refinancing our indebtedness;• we could be forced to increase our level of indebtedness, issue additional equity, or sell assets;• we could be required to impair various assets, including a further write-down of our oil and natural gas assets or the
value of other tangible or intangible assets; and/or• our potential cash flows from our commodity derivative contracts that include sold puts could be limited to the extent
that oil prices are below the prices of those sold puts.
Furthermore, some or all of our tertiary projects could remain or become uneconomical. We may also decide to suspend future expansion projects, and if prices were to drop below our operating cash break-even points for an extended period of time, we may further decide to shut-in existing production, both of which could have a material adverse effect on our operations, financial condition and reduce our production.
A financial downturn in one or more of the world’s major markets could negatively affect our business and financial condition.
In addition to the impact on the demand for oil, a sustained credit crisis, further drops in economic growth rates in China, regional or worldwide increases in tariffs or other trade restrictions, significant international currency fluctuations, a severe economic contraction either regionally or worldwide or turmoil in the global financial system, could materially affect our business and financial condition, or impact our ability to finance operations. Negative credit market conditions could inhibit our lenders from funding our bank credit facility or cause them to restrict our borrowing base or make the terms of our bank credit facility more costly and more restrictive. Negative economic conditions could also adversely affect the collectability of our trade receivables or performance by our suppliers or cause our commodity hedging arrangements to be ineffective if our counterparties are unable to perform their obligations or otherwise seek bankruptcy protection.
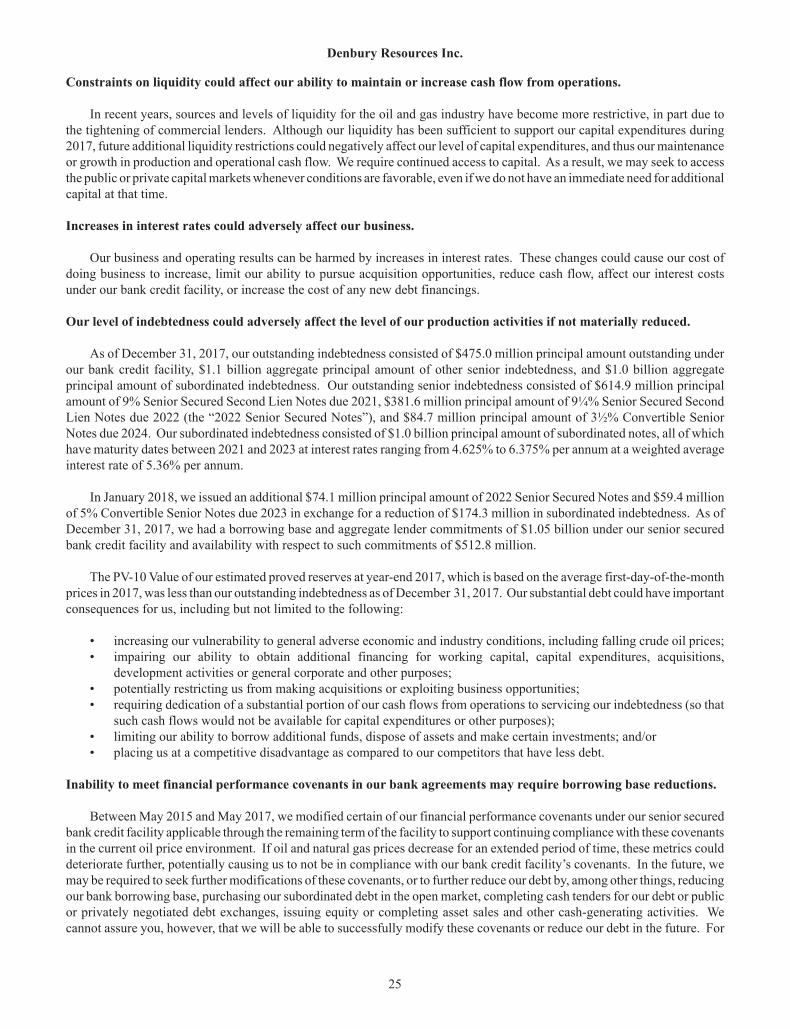
Denbury Resources Inc.
25
Constraints on liquidity could affect our ability to maintain or increase cash flow from operations.
In recent years, sources and levels of liquidity for the oil and gas industry have become more restrictive, in part due to the tightening of commercial lenders. Although our liquidity has been sufficient to support our capital expenditures during 2017, future additional liquidity restrictions could negatively affect our level of capital expenditures, and thus our maintenance or growth in production and operational cash flow. We require continued access to capital. As a result, we may seek to access the public or private capital markets whenever conditions are favorable, even if we do not have an immediate need for additional capital at that time.
Increases in interest rates could adversely affect our business.
Our business and operating results can be harmed by increases in interest rates. These changes could cause our cost of doing business to increase, limit our ability to pursue acquisition opportunities, reduce cash flow, affect our interest costs under our bank credit facility, or increase the cost of any new debt financings.
Our level of indebtedness could adversely affect the level of our production activities if not materially reduced.
As of December 31, 2017, our outstanding indebtedness consisted of $475.0 million principal amount outstanding under our bank credit facility, $1.1 billion aggregate principal amount of other senior indebtedness, and $1.0 billion aggregate principal amount of subordinated indebtedness. Our outstanding senior indebtedness consisted of $614.9 million principal amount of 9% Senior Secured Second Lien Notes due 2021, $381.6 million principal amount of 9¼% Senior Secured Second Lien Notes due 2022 (the “2022 Senior Secured Notes”), and $84.7 million principal amount of 3½% Convertible Senior Notes due 2024. Our subordinated indebtedness consisted of $1.0 billion principal amount of subordinated notes, all of which have maturity dates between 2021 and 2023 at interest rates ranging from 4.625% to 6.375% per annum at a weighted average interest rate of 5.36% per annum.
In January 2018, we issued an additional $74.1 million principal amount of 2022 Senior Secured Notes and $59.4 million of 5% Convertible Senior Notes due 2023 in exchange for a reduction of $174.3 million in subordinated indebtedness. As of December 31, 2017, we had a borrowing base and aggregate lender commitments of $1.05 billion under our senior secured bank credit facility and availability with respect to such commitments of $512.8 million.
The PV-10 Value of our estimated proved reserves at year-end 2017, which is based on the average first-day-of-the-month prices in 2017, was less than our outstanding indebtedness as of December 31, 2017. Our substantial debt could have important consequences for us, including but not limited to the following:
• increasing our vulnerability to general adverse economic and industry conditions, including falling crude oil prices;• impairing our ability to obtain additional financing for working capital, capital expenditures, acquisitions,
development activities or general corporate and other purposes;• potentially restricting us from making acquisitions or exploiting business opportunities;• requiring dedication of a substantial portion of our cash flows from operations to servicing our indebtedness (so that
such cash flows would not be available for capital expenditures or other purposes);• limiting our ability to borrow additional funds, dispose of assets and make certain investments; and/or• placing us at a competitive disadvantage as compared to our competitors that have less debt.
Inability to meet financial performance covenants in our bank agreements may require borrowing base reductions.
Between May 2015 and May 2017, we modified certain of our financial performance covenants under our senior secured bank credit facility applicable through the remaining term of the facility to support continuing compliance with these covenants in the current oil price environment. If oil and natural gas prices decrease for an extended period of time, these metrics could deteriorate further, potentially causing us to not be in compliance with our bank credit facility’s covenants. In the future, we may be required to seek further modifications of these covenants, or to further reduce our debt by, among other things, reducing our bank borrowing base, purchasing our subordinated debt in the open market, completing cash tenders for our debt or public or privately negotiated debt exchanges, issuing equity or completing asset sales and other cash-generating activities. We cannot assure you, however, that we will be able to successfully modify these covenants or reduce our debt in the future. For
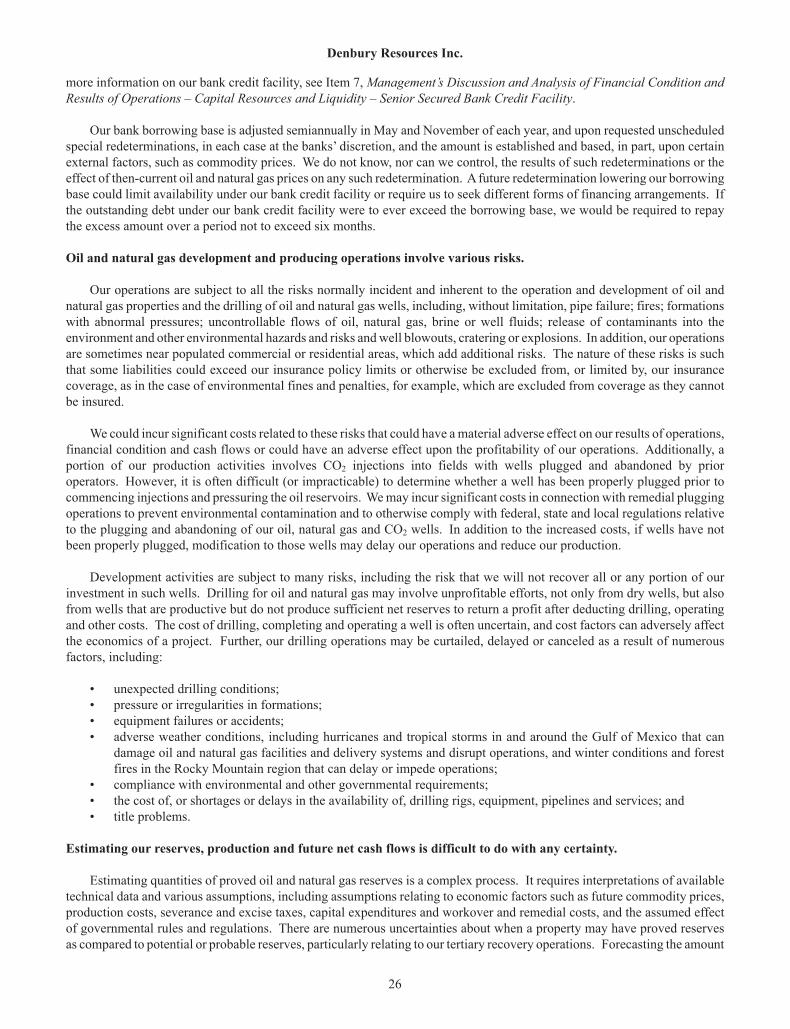
Denbury Resources Inc.
26
more information on our bank credit facility, see Item 7, Management’s Discussion and Analysis of Financial Condition and Results of Operations – Capital Resources and Liquidity – Senior Secured Bank Credit Facility.
Our bank borrowing base is adjusted semiannually in May and November of each year, and upon requested unscheduled special redeterminations, in each case at the banks’ discretion, and the amount is established and based, in part, upon certain external factors, such as commodity prices. We do not know, nor can we control, the results of such redeterminations or the effect of then-current oil and natural gas prices on any such redetermination. A future redetermination lowering our borrowing base could limit availability under our bank credit facility or require us to seek different forms of financing arrangements. If the outstanding debt under our bank credit facility were to ever exceed the borrowing base, we would be required to repay the excess amount over a period not to exceed six months.
Oil and natural gas development and producing operations involve various risks.
Our operations are subject to all the risks normally incident and inherent to the operation and development of oil and natural gas properties and the drilling of oil and natural gas wells, including, without limitation, pipe failure; fires; formations with abnormal pressures; uncontrollable flows of oil, natural gas, brine or well fluids; release of contaminants into the environment and other environmental hazards and risks and well blowouts, cratering or explosions. In addition, our operations are sometimes near populated commercial or residential areas, which add additional risks. The nature of these risks is such that some liabilities could exceed our insurance policy limits or otherwise be excluded from, or limited by, our insurance coverage, as in the case of environmental fines and penalties, for example, which are excluded from coverage as they cannot be insured.
We could incur significant costs related to these risks that could have a material adverse effect on our results of operations, financial condition and cash flows or could have an adverse effect upon the profitability of our operations. Additionally, a portion of our production activities involves CO2 injections into fields with wells plugged and abandoned by prior operators. However, it is often difficult (or impracticable) to determine whether a well has been properly plugged prior to commencing injections and pressuring the oil reservoirs. We may incur significant costs in connection with remedial plugging operations to prevent environmental contamination and to otherwise comply with federal, state and local regulations relative to the plugging and abandoning of our oil, natural gas and CO2 wells. In addition to the increased costs, if wells have not been properly plugged, modification to those wells may delay our operations and reduce our production.
Development activities are subject to many risks, including the risk that we will not recover all or any portion of our investment in such wells. Drilling for oil and natural gas may involve unprofitable efforts, not only from dry wells, but also from wells that are productive but do not produce sufficient net reserves to return a profit after deducting drilling, operating and other costs. The cost of drilling, completing and operating a well is often uncertain, and cost factors can adversely affect the economics of a project. Further, our drilling operations may be curtailed, delayed or canceled as a result of numerous factors, including:
• unexpected drilling conditions;• pressure or irregularities in formations;• equipment failures or accidents;• adverse weather conditions, including hurricanes and tropical storms in and around the Gulf of Mexico that can
damage oil and natural gas facilities and delivery systems and disrupt operations, and winter conditions and forest fires in the Rocky Mountain region that can delay or impede operations;
• compliance with environmental and other governmental requirements;• the cost of, or shortages or delays in the availability of, drilling rigs, equipment, pipelines and services; and• title problems.
Estimating our reserves, production and future net cash flows is difficult to do with any certainty.
Estimating quantities of proved oil and natural gas reserves is a complex process. It requires interpretations of available technical data and various assumptions, including assumptions relating to economic factors such as future commodity prices, production costs, severance and excise taxes, capital expenditures and workover and remedial costs, and the assumed effect of governmental rules and regulations. There are numerous uncertainties about when a property may have proved reserves as compared to potential or probable reserves, particularly relating to our tertiary recovery operations. Forecasting the amount
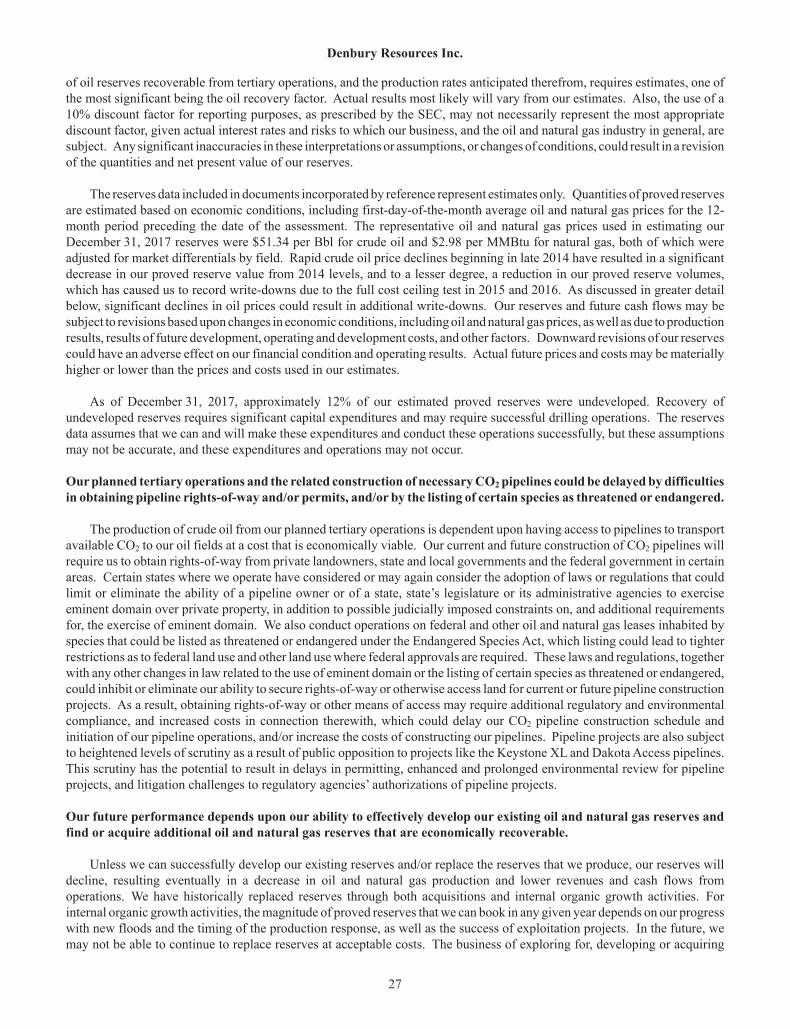
Denbury Resources Inc.
27
of oil reserves recoverable from tertiary operations, and the production rates anticipated therefrom, requires estimates, one of the most significant being the oil recovery factor. Actual results most likely will vary from our estimates. Also, the use of a 10% discount factor for reporting purposes, as prescribed by the SEC, may not necessarily represent the most appropriate discount factor, given actual interest rates and risks to which our business, and the oil and natural gas industry in general, are subject. Any significant inaccuracies in these interpretations or assumptions, or changes of conditions, could result in a revision of the quantities and net present value of our reserves.
The reserves data included in documents incorporated by reference represent estimates only. Quantities of proved reserves are estimated based on economic conditions, including first-day-of-the-month average oil and natural gas prices for the 12-month period preceding the date of the assessment. The representative oil and natural gas prices used in estimating our December 31, 2017 reserves were $51.34 per Bbl for crude oil and $2.98 per MMBtu for natural gas, both of which were adjusted for market differentials by field. Rapid crude oil price declines beginning in late 2014 have resulted in a significant decrease in our proved reserve value from 2014 levels, and to a lesser degree, a reduction in our proved reserve volumes, which has caused us to record write-downs due to the full cost ceiling test in 2015 and 2016. As discussed in greater detail below, significant declines in oil prices could result in additional write-downs. Our reserves and future cash flows may be subject to revisions based upon changes in economic conditions, including oil and natural gas prices, as well as due to production results, results of future development, operating and development costs, and other factors. Downward revisions of our reserves could have an adverse effect on our financial condition and operating results. Actual future prices and costs may be materially higher or lower than the prices and costs used in our estimates.
As of December 31, 2017, approximately 12% of our estimated proved reserves were undeveloped. Recovery of undeveloped reserves requires significant capital expenditures and may require successful drilling operations. The reserves data assumes that we can and will make these expenditures and conduct these operations successfully, but these assumptions may not be accurate, and these expenditures and operations may not occur.
Our planned tertiary operations and the related construction of necessary CO2 pipelines could be delayed by difficulties in obtaining pipeline rights-of-way and/or permits, and/or by the listing of certain species as threatened or endangered.
The production of crude oil from our planned tertiary operations is dependent upon having access to pipelines to transport available CO2 to our oil fields at a cost that is economically viable. Our current and future construction of CO2 pipelines will require us to obtain rights-of-way from private landowners, state and local governments and the federal government in certain areas. Certain states where we operate have considered or may again consider the adoption of laws or regulations that could limit or eliminate the ability of a pipeline owner or of a state, state’s legislature or its administrative agencies to exercise eminent domain over private property, in addition to possible judicially imposed constraints on, and additional requirements for, the exercise of eminent domain. We also conduct operations on federal and other oil and natural gas leases inhabited by species that could be listed as threatened or endangered under the Endangered Species Act, which listing could lead to tighter restrictions as to federal land use and other land use where federal approvals are required. These laws and regulations, together with any other changes in law related to the use of eminent domain or the listing of certain species as threatened or endangered, could inhibit or eliminate our ability to secure rights-of-way or otherwise access land for current or future pipeline construction projects. As a result, obtaining rights-of-way or other means of access may require additional regulatory and environmental compliance, and increased costs in connection therewith, which could delay our CO2 pipeline construction schedule and initiation of our pipeline operations, and/or increase the costs of constructing our pipelines. Pipeline projects are also subject to heightened levels of scrutiny as a result of public opposition to projects like the Keystone XL and Dakota Access pipelines. This scrutiny has the potential to result in delays in permitting, enhanced and prolonged environmental review for pipeline projects, and litigation challenges to regulatory agencies’ authorizations of pipeline projects.
Our future performance depends upon our ability to effectively develop our existing oil and natural gas reserves and find or acquire additional oil and natural gas reserves that are economically recoverable.
Unless we can successfully develop our existing reserves and/or replace the reserves that we produce, our reserves will decline, resulting eventually in a decrease in oil and natural gas production and lower revenues and cash flows from operations. We have historically replaced reserves through both acquisitions and internal organic growth activities. For internal organic growth activities, the magnitude of proved reserves that we can book in any given year depends on our progress with new floods and the timing of the production response, as well as the success of exploitation projects. In the future, we may not be able to continue to replace reserves at acceptable costs. The business of exploring for, developing or acquiring
Denbury Resources Inc.
28
reserves is capital intensive. We may not be able to make the necessary capital investment to maintain or expand our oil and natural gas reserves if our cash flows from operations continue to be reduced, whether due to current oil or natural gas prices or otherwise, or if external sources of capital become limited or unavailable. Further, the process of using CO2 for tertiary recovery, and the related infrastructure, requires significant capital investment prior to any resulting and associated production and cash flows from these projects, heightening potential capital constraints. If our capital expenditures are restricted, or if outside capital resources become limited, we will not be able to maintain our current production levels.
Commodity derivative contracts may expose us to potential financial loss.
To reduce our exposure to fluctuations in the prices of oil and natural gas, we enter into commodity derivative contracts in order to economically hedge a portion of our forecasted oil and natural gas production. As of February 21, 2018, we have oil derivative contracts in place covering 40,500 Bbls/d for 2018, 8,500 Bbls/d for the first half of 2019 and 5,000 Bbls/d for the second half of 2019. Such derivative contracts expose us to risk of financial loss in some circumstances, including when there is a change in the expected differential between the underlying price in the hedging agreement and actual prices received, when the cash benefit from hedges including a sold put is limited to the extent oil prices fall below the price of our sold puts, or when the counterparty to the derivative contract is financially constrained and defaults on its contractual obligations. In addition, these derivative contracts may limit the benefit we would otherwise receive from increases in the prices for oil and natural gas.
Shortages of or delays in the availability of oil field equipment, services and qualified personnel could reduce our cash flow and adversely affect results of operations.
The demand for qualified and experienced field personnel, geologists, geophysicists, engineers and other professionals in the oil and natural gas industry can fluctuate significantly, often in correlation with oil and natural gas prices, causing periodic shortages in such personnel. In the past, during periods of high oil and natural gas prices, we have experienced shortages of oil field and other necessary equipment, including drilling rigs, along with increased prices for such equipment, services and associated personnel. These types of shortages or price increases could significantly decrease our profit margin, cash flow and operating results and/or restrict or delay our ability to drill wells and conduct our operations, possibly causing us to miss our forecasts and projections.
The marketability of our production is dependent upon transportation lines and other facilities, certain of which we do not control. When these facilities are unavailable, our operations can be interrupted and our revenues reduced.
The marketability of our oil and natural gas production depends, in part, upon the availability, proximity and capacity of transportation lines owned by third parties. In general, we do not control these transportation facilities, and our access to them may be limited or denied. A significant disruption in the availability of, and access to, these transportation lines or other production facilities could adversely impact our ability to deliver to market or produce our oil and thereby cause a significant interruption in our operations.
Our production will decline if our access to sufficient amounts of carbon dioxide is limited.
Our long-term strategy is primarily focused on our CO2 tertiary recovery operations. The crude oil production from our tertiary recovery projects depends, in large part, on having access to sufficient amounts of naturally occurring and industrial-source CO2. Our ability to produce oil from these projects would be hindered if our supply of CO2 was limited due to, among other things, problems with our current CO2 producing wells and facilities, including compression equipment, catastrophic pipeline failure or our ability to economically purchase CO2 from industrial sources. This could have a material adverse effect on our financial condition, results of operations and cash flows. Our anticipated future crude oil production from tertiary operations is also dependent on the timing, volumes and location of CO2 injections and, in particular, on our ability to increase our combined purchased and produced volumes of CO2 and inject adequate amounts of CO2 into the proper formation and area within each of our tertiary oil fields.
The development of our naturally occurring CO2 sources involves the drilling of wells to increase and extend the CO2reserves available for use in our tertiary fields. These drilling activities are subject to many of the same drilling and geological risks of drilling and producing oil and gas wells (see Oil and natural gas development and producing operations involve various risks above). Furthermore, recent market conditions may cause the delay or cancellation of construction of plants
Denbury Resources Inc.
29
that produce industrial-source CO2 as a byproduct that we can purchase, thus limiting the amount of industrial-source CO2available for our use in our tertiary operations.
A cyber incident could occur and result in information theft, data corruption, operational disruption, and/or financial loss.
Our business has become increasingly dependent on digital technologies to conduct day-to-day operations, including certain of our exploration, development and production activities. We depend on digital technology, among other things, to process and record financial and operating data; analyze seismic and drilling information; monitor and control pipeline and plant equipment; and process and store personally identifiable information of our employees and royalty owners. Our technologies, systems and networks may become the target of cyber attacks or information security breaches that could result in the disruption of our business operations and/or financial loss.
Although we utilize various procedures and controls to monitor and protect against these threats and to mitigate our exposure to such threats, there can be no assurance that these procedures and controls will be sufficient in preventing security threats from materializing and causing us to suffer such losses in the future. As cyber threats continue to evolve, we may be required to expend significant additional resources to continue to modify or enhance our procedures and controls or to investigate and remediate any cyber vulnerabilities.
We may lose key executive officers or specialized technical employees, which could endanger the future success of our operations.
Our success depends to a significant degree upon the continued contributions of our executive officers, other key management and specialized technical personnel. Our employees, including our executive officers, are employed at will and do not have employment agreements. We believe that our future success depends, in large part, upon our ability to hire and retain highly skilled personnel.
Environmental laws and regulations are costly and stringent.
Our exploration, production, and marketing operations are subject to complex and stringent federal, state, and local laws and regulations governing, among other things, the discharge of substances into the environment or otherwise relating to the protection of human health and the protection of endangered species. These laws and regulations and related public policy considerations affect the costs, manner, and feasibility of our operations and require us to make significant expenditures in order to comply. Failure to comply with these laws and regulations may result in the assessment of administrative, civil, and criminal penalties, the imposition of investigatory and remedial obligations, and the issuance of injunctions that could limit or prohibit our operations. Some of these laws and regulations may impose joint and several, strict liability for contamination resulting from spills, discharges, and releases of substances, including petroleum hydrocarbons and other wastes, without regard to fault, or the legality of the original conduct. Under such laws and regulations, we could be required to remove or remediate previously disposed substances and property contamination, including wastes disposed or released by prior owners or operators.
Enactment of executive, legislative or regulatory proposals under consideration could negatively affect our business.
Numerous executive, legislative and regulatory proposals affecting the oil and gas industry could be introduced by various federal and state authorities. While it is currently anticipated that the President and Congress will attempt to move away from the trend of proposing stricter standards and increasing oversight and regulation at the federal level, it is possible that other proposals affecting the oil and gas industry could be enacted or adopted in the future, which could result in increased costs or additional operating restrictions that could have an effect on demand for oil and natural gas or prices at which it can be sold.
The loss of one or more of our large oil and natural gas purchasers could have an adverse effect on our operations.
For the year ended December 31, 2017, two purchasers individually accounted for 10% or more of our oil and natural gas revenues and, in the aggregate, for 32% of such revenues. The loss of a large single purchaser could adversely impact the prices we receive or the transportation costs we incur.
Denbury Resources Inc.
30
Certain of our operations may be limited during certain periods due to severe weather conditions and other regulations.
Certain of our operations in North Dakota, Montana and Wyoming, including the construction of CO2 pipelines, the drilling of new wells and production from existing wells, are conducted in areas subject to extreme weather conditions, including severe cold, snow and rain, which conditions may cause such operations to be hindered or delayed, or otherwise require that they be conducted only during non-winter months, and depending on the severity of the weather, could have a negative effect on our results of operations in these areas. Further, certain of our operations in these areas are confined to certain time periods due to environmental regulations, federal restrictions on when drilling can take place on federal lands, and lease stipulations designed to protect certain wildlife, which regulations, restrictions and limitations could slow down our operations, cause delays, increase costs and have a negative effect on our results of operations. Our operations in the coastal areas of the Gulf Coast region may be subjected to adverse weather conditions such as hurricanes, flooding and tropical storms in and around the Gulf of Mexico that can damage oil and natural gas facilities and delivery systems and disrupt operations, which can also increase costs and have a negative effect on our results of operations.
If commodity prices decline appreciably, we may be required to write down the carrying value of our oil and natural gas properties.
Under full cost accounting rules related to our oil and natural gas properties, we are required each quarter to perform a ceiling test calculation, with the net capitalized costs of our oil and natural gas properties limited to the lower of unamortized cost or the cost center ceiling. The present value of estimated future net revenues from proved oil and natural gas reserves included in the cost center ceiling is based on the average first-day-of-the-month oil and natural gas price for each month during a 12-month rolling period prior to the end of a particular reporting period. During 2015 and 2016, we recorded full cost pool ceiling test write-downs of our oil and natural gas properties totaling $4.9 billion ($3.1 billion net of tax) and $810.9 million ($508.2 million net of tax), respectively. We did not have a ceiling test write-down during 2017. Future material write-downs of our oil and natural gas properties, as well as future impairment of other long-lived assets, could significantly reduce earnings during the period in which such write-down and/or impairment occurs and would result in a corresponding reduction to long-lived assets and equity. See Item 7, Management’s Discussion and Analysis of Financial Condition and Results of Operations – Critical Accounting Policies and Estimates.
Conversion into common stock of the 3½% Convertible Senior Notes due 2024 or the 5% Convertible Senior Notes due 2023 may dilute the ownership interest of existing stockholders, and might depress the market price of our common stock.
The conversion of some or all of the 3½% Convertible Senior Notes due 2024 or the 5% Convertible Senior Notes due 2023 (see Note 5, Long-Term Debt, to the Consolidated Financial Statements) may dilute the ownership interests of existing stockholders of our common stock. Any sales in the public market of the shares of our common stock issuable upon such conversion could adversely affect prevailing market prices of our common stock. In addition, the existence of the 3½% Convertible Senior Notes due 2024 and the 5% Convertible Senior Notes due 2023 may encourage short selling by market participants because the conversion of both series of notes could be used to satisfy short positions, and anticipated conversion of both series of notes into shares of our common stock could depress the market price of our common stock.
Item 1B. Unresolved Staff Comments
There are no unresolved written SEC staff comments regarding our periodic or current reports under the Securities Exchange Act of 1934 received 180 days or more before the end of the fiscal year to which this annual report on Form 10-K relates.
Item 2. Properties
Information regarding the Company’s properties called for by this item is included in Item 1, Business and Properties – Oil and Natural Gas Operations. We also have various operating leases for rental of office space, office and field equipment, and vehicles. See Item 7, Management’s Discussion and Analysis of Financial Condition and Results of Operations – Capital Resources and Liquidity – Off-Balance Sheet Arrangements, and Note 11, Commitments and Contingencies, to the Consolidated Financial Statements for the future minimum rental payments. Such information is incorporated herein by reference.
Denbury Resources Inc.
31
Item 3. Legal Proceedings
We are involved in various lawsuits, claims and regulatory proceedings incidental to our businesses. While we currently believe that the ultimate outcome of these proceedings, individually and in the aggregate, will not have a material adverse effect on our business or finances, litigation is subject to inherent uncertainties. Although a single or multiple adverse rulings or settlements could possibly have a material adverse effect on our business or finances, we only accrue for losses from litigation and claims if we determine that a loss is probable and the amount can be reasonably estimated.
Riley Ridge Helium Supply Contract Claim
As part of our 2010 and 2011 acquisitions of the Riley Ridge Unit and associated gas processing facility that was under construction, the Company assumed a 20-year helium supply contract under which we agreed to supply the helium separated from the full well stream by operation of the gas processing facility to a third-party purchaser, APMTG Helium, LLC. The helium supply contract provides for the delivery of a minimum contracted quantity of helium, subject to adjustment after startup of the Riley Ridge gas processing facility, with liquidated damages payable if specified quantities of helium are not supplied in accordance with the terms of the contract. The liquidated damages are specified in the contract at up to $8.0 million per contract year and are capped at an aggregate of $46.0 million over the term of the contract. As the gas processing facility has been shut-in since mid-2014, we have not been able to supply helium under the helium supply contract. APMTG Helium, LLC filed a case in November 2014 in the Ninth Judicial District Court of Sublette County, Wyoming, claiming multiple years of liquidated damages for non-delivery of volumes of helium specified under the helium supply contract. In response, we are taking the position that our contractual obligations are excused by virtue of events that fall within the force majeure provisions in the helium supply contract. The evidentiary phase of the trial closed on November 29, 2017. The parties submitted written closing briefs to the District Court on February 23, 2018 and have agreed to submit written rebuttals to such closing briefs by March 30, 2018. Following those submissions, the case will be fully submitted for determination by the District Court. We currently expect a ruling to be made in the second or third quarter of 2018. The Company plans to continue to vigorously defend its position, but we are unable to predict at this time the outcome of this dispute.
Item 4. Mine Safety Disclosures
Not applicable.
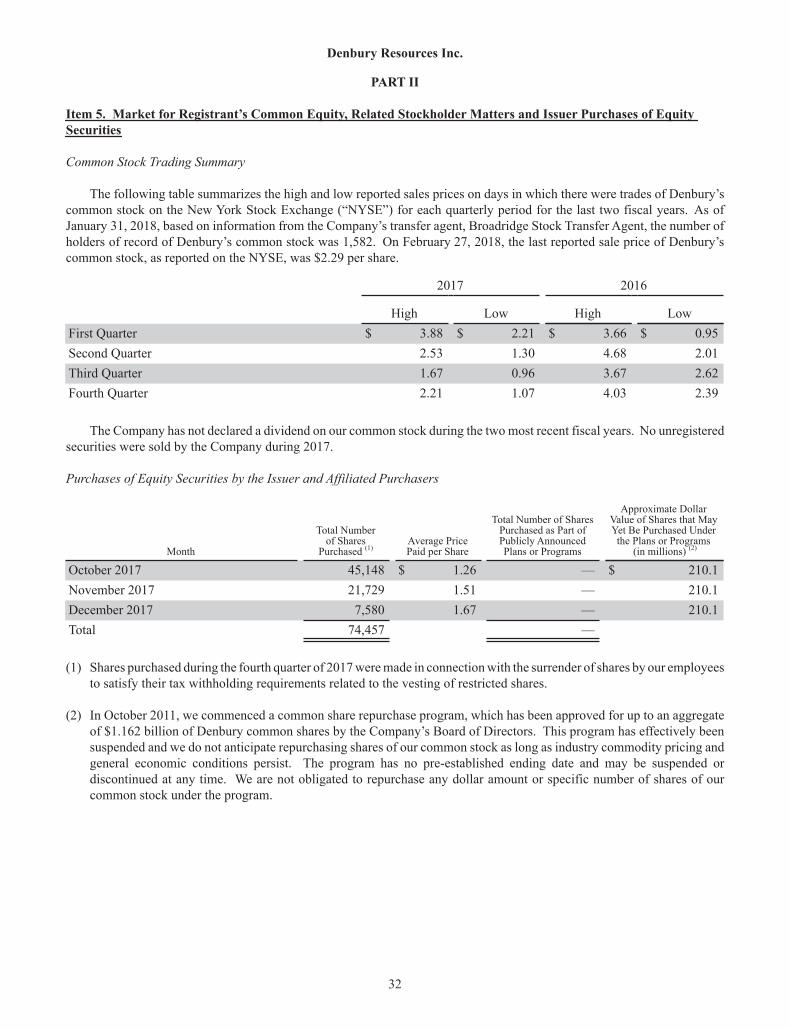
Denbury Resources Inc.
32
PART II
Item 5. Market for Registrant’s Common Equity, Related Stockholder Matters and Issuer Purchases of Equity Securities
Common Stock Trading Summary
The following table summarizes the high and low reported sales prices on days in which there were trades of Denbury’s common stock on the New York Stock Exchange (“NYSE”) for each quarterly period for the last two fiscal years. As of January 31, 2018, based on information from the Company’s transfer agent, Broadridge Stock Transfer Agent, the number of holders of record of Denbury’s common stock was 1,582. On February 27, 2018, the last reported sale price of Denbury’s common stock, as reported on the NYSE, was $2.29 per share.
2017 2016
High Low High LowFirst Quarter $ 3.88 $ 2.21 $ 3.66 $ 0.95Second Quarter 2.53 1.30 4.68 2.01Third Quarter 1.67 0.96 3.67 2.62Fourth Quarter 2.21 1.07 4.03 2.39
The Company has not declared a dividend on our common stock during the two most recent fiscal years. No unregistered securities were sold by the Company during 2017.
Purchases of Equity Securities by the Issuer and Affiliated Purchasers
Month
Total Numberof Shares
Purchased (1)Average PricePaid per Share
Total Number of SharesPurchased as Part ofPublicly AnnouncedPlans or Programs
Approximate Dollar Value of Shares that May Yet Be Purchased Under
the Plans or Programs (in millions) (2)
October 2017 45,148 $ 1.26 — $ 210.1November 2017 21,729 1.51 — 210.1December 2017 7,580 1.67 — 210.1Total 74,457 —
(1) Shares purchased during the fourth quarter of 2017 were made in connection with the surrender of shares by our employees to satisfy their tax withholding requirements related to the vesting of restricted shares.
(2) In October 2011, we commenced a common share repurchase program, which has been approved for up to an aggregate of $1.162 billion of Denbury common shares by the Company’s Board of Directors. This program has effectively been suspended and we do not anticipate repurchasing shares of our common stock as long as industry commodity pricing and general economic conditions persist. The program has no pre-established ending date and may be suspended or discontinued at any time. We are not obligated to repurchase any dollar amount or specific number of shares of our common stock under the program.
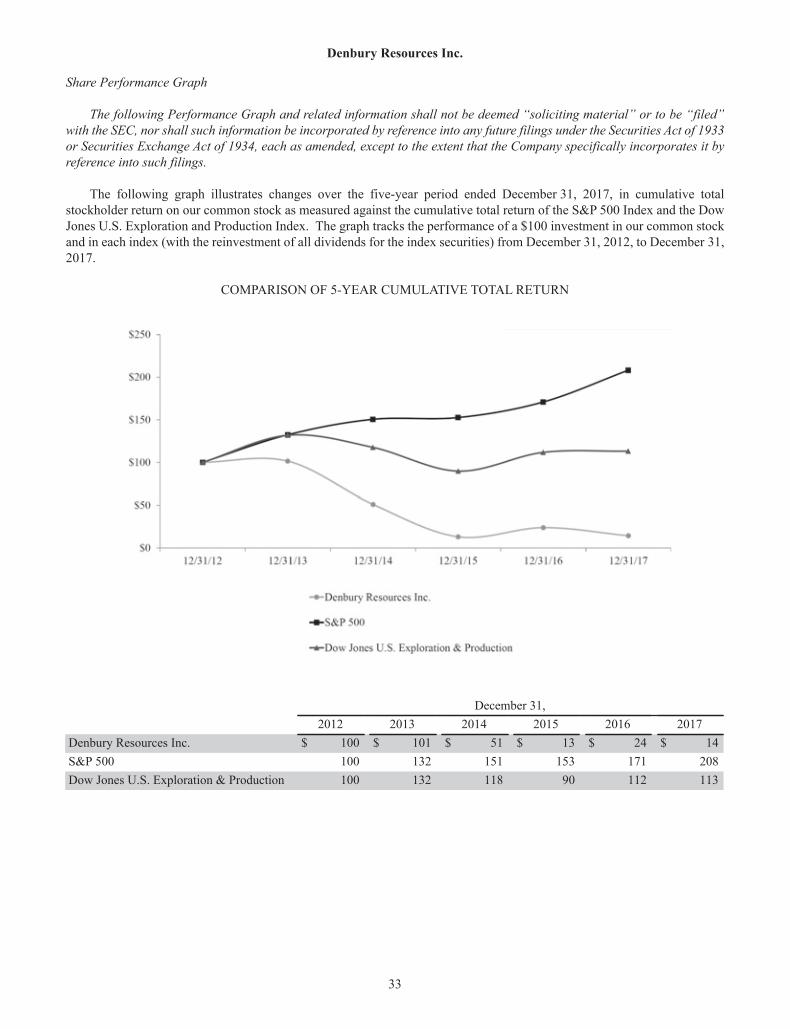
Denbury Resources Inc.
33
Share Performance Graph
The following Performance Graph and related information shall not be deemed “soliciting material” or to be “filed” with the SEC, nor shall such information be incorporated by reference into any future filings under the Securities Act of 1933 or Securities Exchange Act of 1934, each as amended, except to the extent that the Company specifically incorporates it by reference into such filings.
The following graph illustrates changes over the five-year period ended December 31, 2017, in cumulative total stockholder return on our common stock as measured against the cumulative total return of the S&P 500 Index and the Dow Jones U.S. Exploration and Production Index. The graph tracks the performance of a $100 investment in our common stock and in each index (with the reinvestment of all dividends for the index securities) from December 31, 2012, to December 31, 2017.
COMPARISON OF 5-YEAR CUMULATIVE TOTAL RETURN
December 31, 2012 2013 2014 2015 2016 2017Denbury Resources Inc. $ 100 $ 101 $ 51 $ 13 $ 24 $ 14S&P 500 100 132 151 153 171 208Dow Jones U.S. Exploration & Production 100 132 118 90 112 113
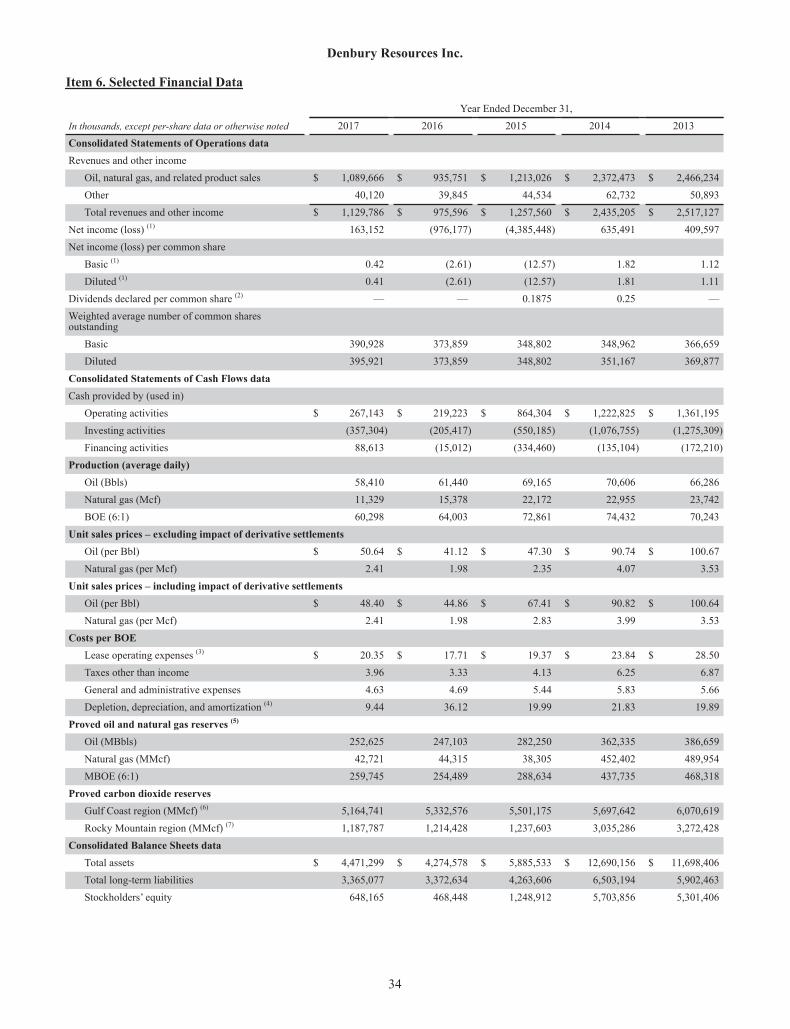
Denbury Resources Inc.
34
Item 6. Selected Financial Data
Year Ended December 31,In thousands, except per-share data or otherwise noted 2017 2016 2015 2014 2013Consolidated Statements of Operations dataRevenues and other income
Oil, natural gas, and related product sales $ 1,089,666 $ 935,751 $ 1,213,026 $ 2,372,473 $ 2,466,234Other 40,120 39,845 44,534 62,732 50,893Total revenues and other income $ 1,129,786 $ 975,596 $ 1,257,560 $ 2,435,205 $ 2,517,127
Net income (loss) (1) 163,152 (976,177) (4,385,448) 635,491 409,597Net income (loss) per common share
Basic (1) 0.42 (2.61) (12.57) 1.82 1.12Diluted (1) 0.41 (2.61) (12.57) 1.81 1.11
Dividends declared per common share (2) — — 0.1875 0.25 —Weighted average number of common sharesoutstanding
Basic 390,928 373,859 348,802 348,962 366,659Diluted 395,921 373,859 348,802 351,167 369,877
Consolidated Statements of Cash Flows dataCash provided by (used in)
Operating activities $ 267,143 $ 219,223 $ 864,304 $ 1,222,825 $ 1,361,195Investing activities (357,304) (205,417) (550,185) (1,076,755) (1,275,309)Financing activities 88,613 (15,012) (334,460) (135,104) (172,210)
Production (average daily)Oil (Bbls) 58,410 61,440 69,165 70,606 66,286Natural gas (Mcf) 11,329 15,378 22,172 22,955 23,742BOE (6:1) 60,298 64,003 72,861 74,432 70,243
Unit sales prices – excluding impact of derivative settlementsOil (per Bbl) $ 50.64 $ 41.12 $ 47.30 $ 90.74 $ 100.67Natural gas (per Mcf) 2.41 1.98 2.35 4.07 3.53
Unit sales prices – including impact of derivative settlementsOil (per Bbl) $ 48.40 $ 44.86 $ 67.41 $ 90.82 $ 100.64Natural gas (per Mcf) 2.41 1.98 2.83 3.99 3.53
Costs per BOELease operating expenses (3) $ 20.35 $ 17.71 $ 19.37 $ 23.84 $ 28.50Taxes other than income 3.96 3.33 4.13 6.25 6.87General and administrative expenses 4.63 4.69 5.44 5.83 5.66Depletion, depreciation, and amortization (4) 9.44 36.12 19.99 21.83 19.89
Proved oil and natural gas reserves (5)
Oil (MBbls) 252,625 247,103 282,250 362,335 386,659Natural gas (MMcf) 42,721 44,315 38,305 452,402 489,954MBOE (6:1) 259,745 254,489 288,634 437,735 468,318
Proved carbon dioxide reservesGulf Coast region (MMcf) (6) 5,164,741 5,332,576 5,501,175 5,697,642 6,070,619Rocky Mountain region (MMcf) (7) 1,187,787 1,214,428 1,237,603 3,035,286 3,272,428
Consolidated Balance Sheets dataTotal assets $ 4,471,299 $ 4,274,578 $ 5,885,533 $ 12,690,156 $ 11,698,406Total long-term liabilities 3,365,077 3,372,634 4,263,606 6,503,194 5,902,463Stockholders’ equity 648,165 468,448 1,248,912 5,703,856 5,301,406
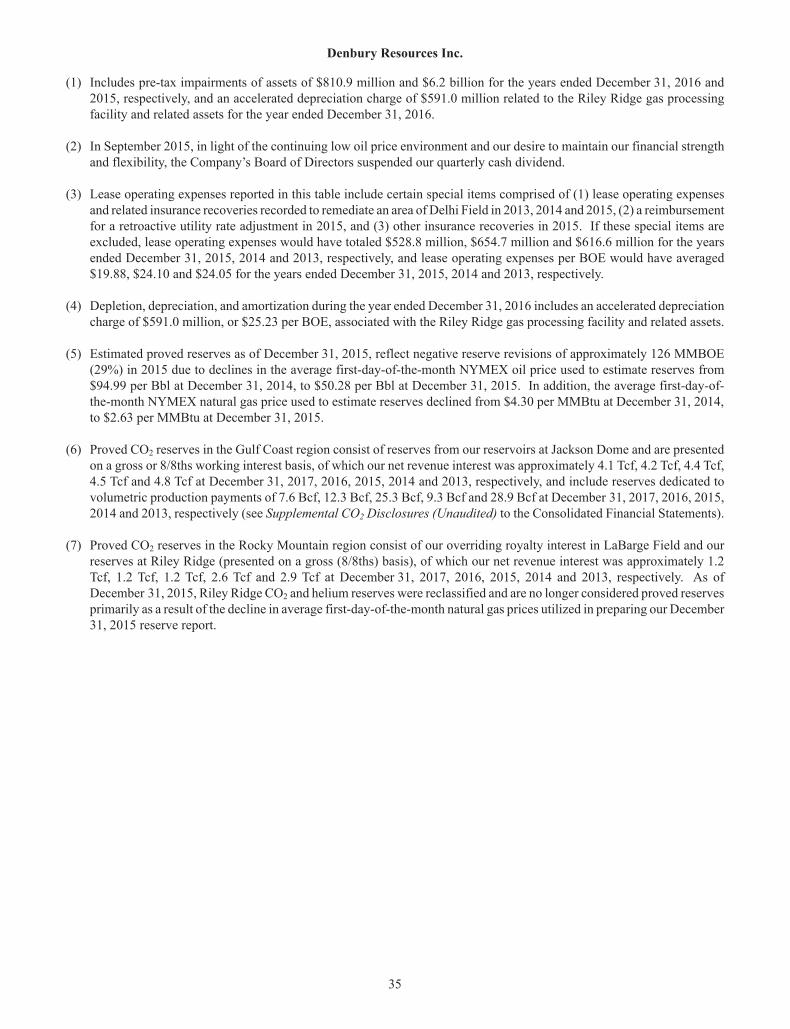
Denbury Resources Inc.
35
(1) Includes pre-tax impairments of assets of $810.9 million and $6.2 billion for the years ended December 31, 2016 and 2015, respectively, and an accelerated depreciation charge of $591.0 million related to the Riley Ridge gas processing facility and related assets for the year ended December 31, 2016.
(2) In September 2015, in light of the continuing low oil price environment and our desire to maintain our financial strength and flexibility, the Company’s Board of Directors suspended our quarterly cash dividend.
(3) Lease operating expenses reported in this table include certain special items comprised of (1) lease operating expenses and related insurance recoveries recorded to remediate an area of Delhi Field in 2013, 2014 and 2015, (2) a reimbursement for a retroactive utility rate adjustment in 2015, and (3) other insurance recoveries in 2015. If these special items are excluded, lease operating expenses would have totaled $528.8 million, $654.7 million and $616.6 million for the years ended December 31, 2015, 2014 and 2013, respectively, and lease operating expenses per BOE would have averaged $19.88, $24.10 and $24.05 for the years ended December 31, 2015, 2014 and 2013, respectively.
(4) Depletion, depreciation, and amortization during the year ended December 31, 2016 includes an accelerated depreciation charge of $591.0 million, or $25.23 per BOE, associated with the Riley Ridge gas processing facility and related assets.
(5) Estimated proved reserves as of December 31, 2015, reflect negative reserve revisions of approximately 126 MMBOE (29%) in 2015 due to declines in the average first-day-of-the-month NYMEX oil price used to estimate reserves from $94.99 per Bbl at December 31, 2014, to $50.28 per Bbl at December 31, 2015. In addition, the average first-day-of-the-month NYMEX natural gas price used to estimate reserves declined from $4.30 per MMBtu at December 31, 2014, to $2.63 per MMBtu at December 31, 2015.
(6) Proved CO2 reserves in the Gulf Coast region consist of reserves from our reservoirs at Jackson Dome and are presented on a gross or 8/8ths working interest basis, of which our net revenue interest was approximately 4.1 Tcf, 4.2 Tcf, 4.4 Tcf, 4.5 Tcf and 4.8 Tcf at December 31, 2017, 2016, 2015, 2014 and 2013, respectively, and include reserves dedicated to volumetric production payments of 7.6 Bcf, 12.3 Bcf, 25.3 Bcf, 9.3 Bcf and 28.9 Bcf at December 31, 2017, 2016, 2015, 2014 and 2013, respectively (see Supplemental CO2 Disclosures (Unaudited) to the Consolidated Financial Statements).
(7) Proved CO2 reserves in the Rocky Mountain region consist of our overriding royalty interest in LaBarge Field and our reserves at Riley Ridge (presented on a gross (8/8ths) basis), of which our net revenue interest was approximately 1.2 Tcf, 1.2 Tcf, 1.2 Tcf, 2.6 Tcf and 2.9 Tcf at December 31, 2017, 2016, 2015, 2014 and 2013, respectively. As of December 31, 2015, Riley Ridge CO2 and helium reserves were reclassified and are no longer considered proved reserves primarily as a result of the decline in average first-day-of-the-month natural gas prices utilized in preparing our December 31, 2015 reserve report.
Denbury Resources Inc. Management’s Discussion and Analysis of Financial Condition and Results of Operations
36
Item 7. Management’s Discussion and Analysis of Financial Condition and Results of Operations
The following discussion and analysis should be read in conjunction with our Consolidated Financial Statements and Notes thereto included in Item 8, Financial Statements and Supplementary Information. Our discussion and analysis includes forward-looking information that involves risks and uncertainties and should be read in conjunction with Risk Factors under Item 1A of this Form 10-K, along with Forward-Looking Information at the end of this section for information on the risks and uncertainties that could cause our actual results to be materially different from our forward-looking statements.
OVERVIEW
Denbury is an independent oil and natural gas company with operations focused in two key operating areas: the Gulf Coast and Rocky Mountain regions. Our goal is to increase the value of our properties through a combination of exploitation, drilling and proven engineering extraction practices, with the most significant emphasis relating to CO2 enhanced oil recovery operations.
Oil Price Impact on Our Business. Our financial results are significantly impacted by changes in oil prices, as 97% of our production is oil. Oil prices are highly impacted by worldwide oil supply and demand and have historically been subject to significant price changes over short periods of time, including the mid-January 2018 move of NYMEX oil prices over $66 per Bbl for the first time in over three years. Over the last few years, we have been in a period of lower oil prices during which oil prices have generally been in a range of $40-$50 per Bbl, which is roughly 50% lower than the oil price range over the 2011 through 2014 period. As a result of the lower oil price environment and its impact on our business, our focus has primarily been on preservation of cash and liquidity, together with cost reductions and debt management, rather than concentration on expansion and growth. We generated $267.1 million of cash flow from operations in 2017, an annual increase of 22%, and greater than our incurred development capital expenditures in 2017 of $240.8 million, thus preserving our liquidity. We have hedged a portion of our estimated oil production through 2019 in order to protect our current level of cash operating costs, as well as our planned 2018 capital spending. Our 2018 capital spending has been budgeted at approximately $300 million to $325 million, excluding capitalized interest and acquisitions, roughly a 30% increase over 2017 capital spending levels. We utilized a NYMEX oil price estimate of $55 per Bbl in developing our 2018 budget, which based on our current projections would generate a level of cash flow that would fully fund our development capital spending plans. With this capital spending level, we currently anticipate our 2018 production to average between 60,000 and 64,000 BOE/d.
2017 Operating Highlights. The primary drivers of our change in operating results between 2017 and 2016 were the following:
• Oil and natural gas revenues increased by $153.9 million, or 16%, in 2017, principally driven by 22% higher realized commodity prices, offset in part by a 6% decrease in average daily production volumes ($56.6 million). Net realized oil price differentials improved by $1.97 per Bbl from the prior-year period.
• Expenses in 2017 were significantly lower than in 2016, as in 2017 we had no ceiling test write-downs, while in 2016, we had both an $810.9 million ($508.2 million net of tax) full cost pool ceiling test write-down for our oil and natural gas properties and an accelerated depreciation charge of $591.0 million ($379.2 million net of tax) related to the Riley Ridge gas processing facility and related assets, offset to a degree by a $115.1 million gain on debt extinguishment.
• Commodity derivative expense decreased by $50.4 million as a result of a $182.3 million decrease in losses from noncash fair value adjustments between the periods, largely offset by a $132.0 million decrease in derivative settlements ($47.8 million in payments on settlements during 2017 compared to $84.2 million in receipts on settlements during 2016).
During 2017, we recognized net income of $163.2 million, or $0.41 per diluted common share, compared to a net loss of $976.2 million, or $2.61 per diluted common share, during 2016. Our 2017 net income includes the effect of a one-time deferred tax benefit of $132.2 million in the fourth quarter of 2017 resulting from the reduction of the federal income tax rate from 35% to 21% as enacted by the Tax Cut and Jobs Act (the “Act”) in December 2017.
We generated $267.1 million of cash flow from operating activities during 2017, compared to $219.2 million during 2016, due primarily to a $153.9 million increase in oil and natural gas revenues and a net decrease in expenses, largely offset by a $132.0 million decline in derivative settlements.
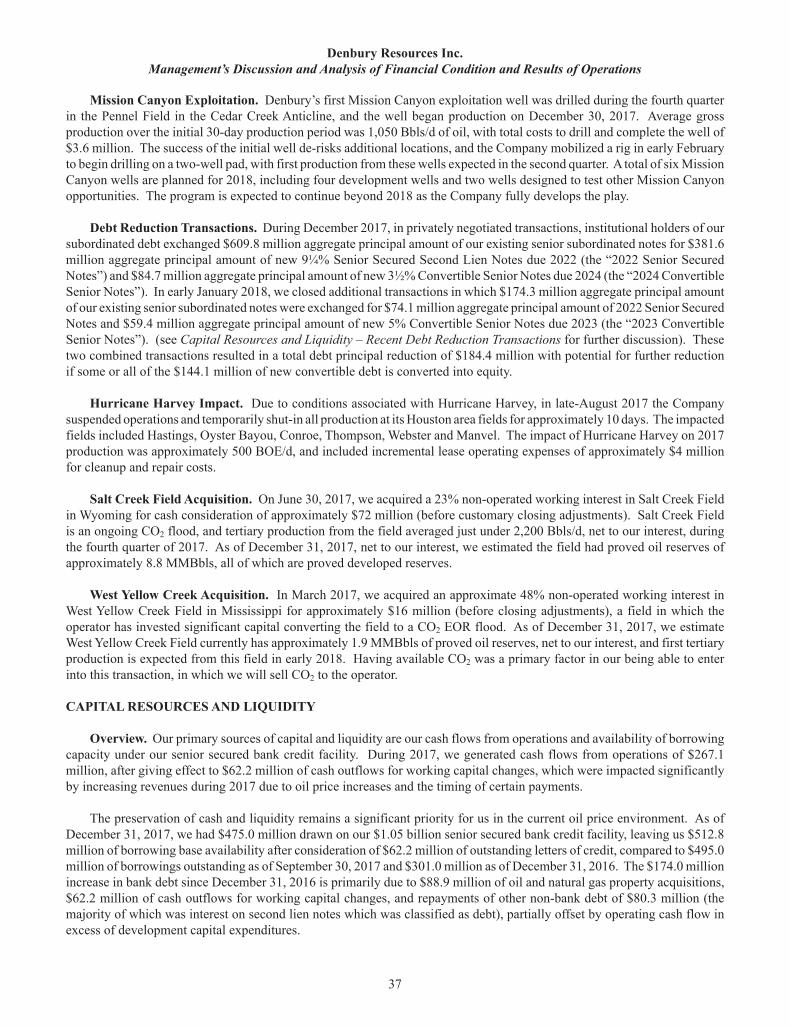
Denbury Resources Inc. Management’s Discussion and Analysis of Financial Condition and Results of Operations
37
Mission Canyon Exploitation. Denbury’s first Mission Canyon exploitation well was drilled during the fourth quarter in the Pennel Field in the Cedar Creek Anticline, and the well began production on December 30, 2017. Average gross production over the initial 30-day production period was 1,050 Bbls/d of oil, with total costs to drill and complete the well of $3.6 million. The success of the initial well de-risks additional locations, and the Company mobilized a rig in early February to begin drilling on a two-well pad, with first production from these wells expected in the second quarter. A total of six Mission Canyon wells are planned for 2018, including four development wells and two wells designed to test other Mission Canyon opportunities. The program is expected to continue beyond 2018 as the Company fully develops the play.
Debt Reduction Transactions. During December 2017, in privately negotiated transactions, institutional holders of our subordinated debt exchanged $609.8 million aggregate principal amount of our existing senior subordinated notes for $381.6 million aggregate principal amount of new 9¼% Senior Secured Second Lien Notes due 2022 (the “2022 Senior Secured Notes”) and $84.7 million aggregate principal amount of new 3½% Convertible Senior Notes due 2024 (the “2024 Convertible Senior Notes”). In early January 2018, we closed additional transactions in which $174.3 million aggregate principal amount of our existing senior subordinated notes were exchanged for $74.1 million aggregate principal amount of 2022 Senior Secured Notes and $59.4 million aggregate principal amount of new 5% Convertible Senior Notes due 2023 (the “2023 Convertible Senior Notes”). (see Capital Resources and Liquidity – Recent Debt Reduction Transactions for further discussion). These two combined transactions resulted in a total debt principal reduction of $184.4 million with potential for further reduction if some or all of the $144.1 million of new convertible debt is converted into equity.
Hurricane Harvey Impact. Due to conditions associated with Hurricane Harvey, in late-August 2017 the Company suspended operations and temporarily shut-in all production at its Houston area fields for approximately 10 days. The impacted fields included Hastings, Oyster Bayou, Conroe, Thompson, Webster and Manvel. The impact of Hurricane Harvey on 2017 production was approximately 500 BOE/d, and included incremental lease operating expenses of approximately $4 million for cleanup and repair costs.
Salt Creek Field Acquisition. On June 30, 2017, we acquired a 23% non-operated working interest in Salt Creek Field in Wyoming for cash consideration of approximately $72 million (before customary closing adjustments). Salt Creek Field is an ongoing CO2 flood, and tertiary production from the field averaged just under 2,200 Bbls/d, net to our interest, during the fourth quarter of 2017. As of December 31, 2017, net to our interest, we estimated the field had proved oil reserves of approximately 8.8 MMBbls, all of which are proved developed reserves.
West Yellow Creek Acquisition. In March 2017, we acquired an approximate 48% non-operated working interest in West Yellow Creek Field in Mississippi for approximately $16 million (before closing adjustments), a field in which the operator has invested significant capital converting the field to a CO2 EOR flood. As of December 31, 2017, we estimate West Yellow Creek Field currently has approximately 1.9 MMBbls of proved oil reserves, net to our interest, and first tertiary production is expected from this field in early 2018. Having available CO2 was a primary factor in our being able to enter into this transaction, in which we will sell CO2 to the operator.
CAPITAL RESOURCES AND LIQUIDITY
Overview. Our primary sources of capital and liquidity are our cash flows from operations and availability of borrowing capacity under our senior secured bank credit facility. During 2017, we generated cash flows from operations of $267.1 million, after giving effect to $62.2 million of cash outflows for working capital changes, which were impacted significantly by increasing revenues during 2017 due to oil price increases and the timing of certain payments.
The preservation of cash and liquidity remains a significant priority for us in the current oil price environment. As of December 31, 2017, we had $475.0 million drawn on our $1.05 billion senior secured bank credit facility, leaving us $512.8 million of borrowing base availability after consideration of $62.2 million of outstanding letters of credit, compared to $495.0 million of borrowings outstanding as of September 30, 2017 and $301.0 million as of December 31, 2016. The $174.0 million increase in bank debt since December 31, 2016 is primarily due to $88.9 million of oil and natural gas property acquisitions, $62.2 million of cash outflows for working capital changes, and repayments of other non-bank debt of $80.3 million (the majority of which was interest on second lien notes which was classified as debt), partially offset by operating cash flow in excess of development capital expenditures.
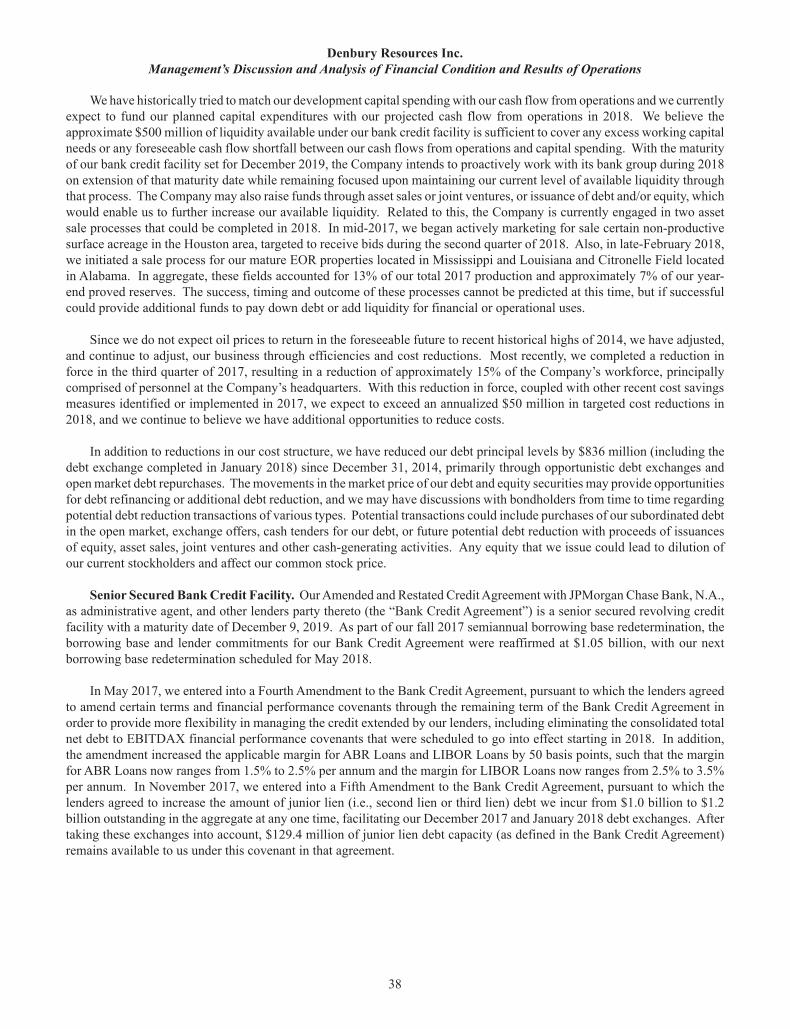
Denbury Resources Inc. Management’s Discussion and Analysis of Financial Condition and Results of Operations
38
We have historically tried to match our development capital spending with our cash flow from operations and we currently expect to fund our planned capital expenditures with our projected cash flow from operations in 2018. We believe the approximate $500 million of liquidity available under our bank credit facility is sufficient to cover any excess working capital needs or any foreseeable cash flow shortfall between our cash flows from operations and capital spending. With the maturity of our bank credit facility set for December 2019, the Company intends to proactively work with its bank group during 2018 on extension of that maturity date while remaining focused upon maintaining our current level of available liquidity through that process. The Company may also raise funds through asset sales or joint ventures, or issuance of debt and/or equity, which would enable us to further increase our available liquidity. Related to this, the Company is currently engaged in two asset sale processes that could be completed in 2018. In mid-2017, we began actively marketing for sale certain non-productive surface acreage in the Houston area, targeted to receive bids during the second quarter of 2018. Also, in late-February 2018, we initiated a sale process for our mature EOR properties located in Mississippi and Louisiana and Citronelle Field located in Alabama. In aggregate, these fields accounted for 13% of our total 2017 production and approximately 7% of our year-end proved reserves. The success, timing and outcome of these processes cannot be predicted at this time, but if successful could provide additional funds to pay down debt or add liquidity for financial or operational uses.
Since we do not expect oil prices to return in the foreseeable future to recent historical highs of 2014, we have adjusted, and continue to adjust, our business through efficiencies and cost reductions. Most recently, we completed a reduction in force in the third quarter of 2017, resulting in a reduction of approximately 15% of the Company’s workforce, principally comprised of personnel at the Company’s headquarters. With this reduction in force, coupled with other recent cost savings measures identified or implemented in 2017, we expect to exceed an annualized $50 million in targeted cost reductions in 2018, and we continue to believe we have additional opportunities to reduce costs.
In addition to reductions in our cost structure, we have reduced our debt principal levels by $836 million (including the debt exchange completed in January 2018) since December 31, 2014, primarily through opportunistic debt exchanges and open market debt repurchases. The movements in the market price of our debt and equity securities may provide opportunities for debt refinancing or additional debt reduction, and we may have discussions with bondholders from time to time regarding potential debt reduction transactions of various types. Potential transactions could include purchases of our subordinated debt in the open market, exchange offers, cash tenders for our debt, or future potential debt reduction with proceeds of issuances of equity, asset sales, joint ventures and other cash-generating activities. Any equity that we issue could lead to dilution of our current stockholders and affect our common stock price.
Senior Secured Bank Credit Facility. Our Amended and Restated Credit Agreement with JPMorgan Chase Bank, N.A., as administrative agent, and other lenders party thereto (the “Bank Credit Agreement”) is a senior secured revolving credit facility with a maturity date of December 9, 2019. As part of our fall 2017 semiannual borrowing base redetermination, the borrowing base and lender commitments for our Bank Credit Agreement were reaffirmed at $1.05 billion, with our next borrowing base redetermination scheduled for May 2018.
In May 2017, we entered into a Fourth Amendment to the Bank Credit Agreement, pursuant to which the lenders agreed to amend certain terms and financial performance covenants through the remaining term of the Bank Credit Agreement in order to provide more flexibility in managing the credit extended by our lenders, including eliminating the consolidated total net debt to EBITDAX financial performance covenants that were scheduled to go into effect starting in 2018. In addition, the amendment increased the applicable margin for ABR Loans and LIBOR Loans by 50 basis points, such that the margin for ABR Loans now ranges from 1.5% to 2.5% per annum and the margin for LIBOR Loans now ranges from 2.5% to 3.5% per annum. In November 2017, we entered into a Fifth Amendment to the Bank Credit Agreement, pursuant to which the lenders agreed to increase the amount of junior lien (i.e., second lien or third lien) debt we incur from $1.0 billion to $1.2 billion outstanding in the aggregate at any one time, facilitating our December 2017 and January 2018 debt exchanges. After taking these exchanges into account, $129.4 million of junior lien debt capacity (as defined in the Bank Credit Agreement) remains available to us under this covenant in that agreement.
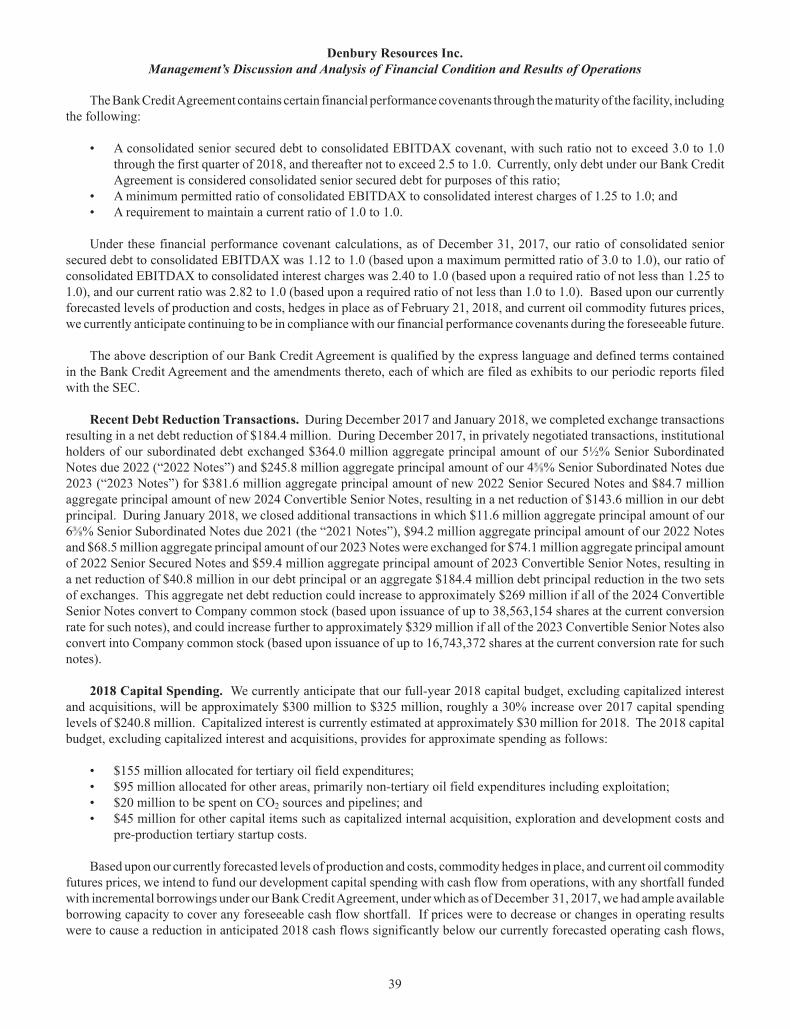
Denbury Resources Inc. Management’s Discussion and Analysis of Financial Condition and Results of Operations
39
The Bank Credit Agreement contains certain financial performance covenants through the maturity of the facility, including the following:
• A consolidated senior secured debt to consolidated EBITDAX covenant, with such ratio not to exceed 3.0 to 1.0 through the first quarter of 2018, and thereafter not to exceed 2.5 to 1.0. Currently, only debt under our Bank Credit Agreement is considered consolidated senior secured debt for purposes of this ratio;
• A minimum permitted ratio of consolidated EBITDAX to consolidated interest charges of 1.25 to 1.0; and• A requirement to maintain a current ratio of 1.0 to 1.0.
Under these financial performance covenant calculations, as of December 31, 2017, our ratio of consolidated senior secured debt to consolidated EBITDAX was 1.12 to 1.0 (based upon a maximum permitted ratio of 3.0 to 1.0), our ratio of consolidated EBITDAX to consolidated interest charges was 2.40 to 1.0 (based upon a required ratio of not less than 1.25 to 1.0), and our current ratio was 2.82 to 1.0 (based upon a required ratio of not less than 1.0 to 1.0). Based upon our currently forecasted levels of production and costs, hedges in place as of February 21, 2018, and current oil commodity futures prices, we currently anticipate continuing to be in compliance with our financial performance covenants during the foreseeable future.
The above description of our Bank Credit Agreement is qualified by the express language and defined terms contained in the Bank Credit Agreement and the amendments thereto, each of which are filed as exhibits to our periodic reports filed with the SEC.
Recent Debt Reduction Transactions. During December 2017 and January 2018, we completed exchange transactions resulting in a net debt reduction of $184.4 million. During December 2017, in privately negotiated transactions, institutional holders of our subordinated debt exchanged $364.0 million aggregate principal amount of our 5½% Senior Subordinated Notes due 2022 (“2022 Notes”) and $245.8 million aggregate principal amount of our 4 % Senior Subordinated Notes due 2023 (“2023 Notes”) for $381.6 million aggregate principal amount of new 2022 Senior Secured Notes and $84.7 million aggregate principal amount of new 2024 Convertible Senior Notes, resulting in a net reduction of $143.6 million in our debt principal. During January 2018, we closed additional transactions in which $11.6 million aggregate principal amount of our 6 % Senior Subordinated Notes due 2021 (the “2021 Notes”), $94.2 million aggregate principal amount of our 2022 Notes and $68.5 million aggregate principal amount of our 2023 Notes were exchanged for $74.1 million aggregate principal amount of 2022 Senior Secured Notes and $59.4 million aggregate principal amount of 2023 Convertible Senior Notes, resulting in a net reduction of $40.8 million in our debt principal or an aggregate $184.4 million debt principal reduction in the two sets of exchanges. This aggregate net debt reduction could increase to approximately $269 million if all of the 2024 Convertible Senior Notes convert to Company common stock (based upon issuance of up to 38,563,154 shares at the current conversion rate for such notes), and could increase further to approximately $329 million if all of the 2023 Convertible Senior Notes also convert into Company common stock (based upon issuance of up to 16,743,372 shares at the current conversion rate for such notes).
2018 Capital Spending. We currently anticipate that our full-year 2018 capital budget, excluding capitalized interest and acquisitions, will be approximately $300 million to $325 million, roughly a 30% increase over 2017 capital spending levels of $240.8 million. Capitalized interest is currently estimated at approximately $30 million for 2018. The 2018 capital budget, excluding capitalized interest and acquisitions, provides for approximate spending as follows:
• $155 million allocated for tertiary oil field expenditures;• $95 million allocated for other areas, primarily non-tertiary oil field expenditures including exploitation;• $20 million to be spent on CO2 sources and pipelines; and• $45 million for other capital items such as capitalized internal acquisition, exploration and development costs and
pre-production tertiary startup costs.
Based upon our currently forecasted levels of production and costs, commodity hedges in place, and current oil commodity futures prices, we intend to fund our development capital spending with cash flow from operations, with any shortfall funded with incremental borrowings under our Bank Credit Agreement, under which as of December 31, 2017, we had ample available borrowing capacity to cover any foreseeable cash flow shortfall. If prices were to decrease or changes in operating results were to cause a reduction in anticipated 2018 cash flows significantly below our currently forecasted operating cash flows,
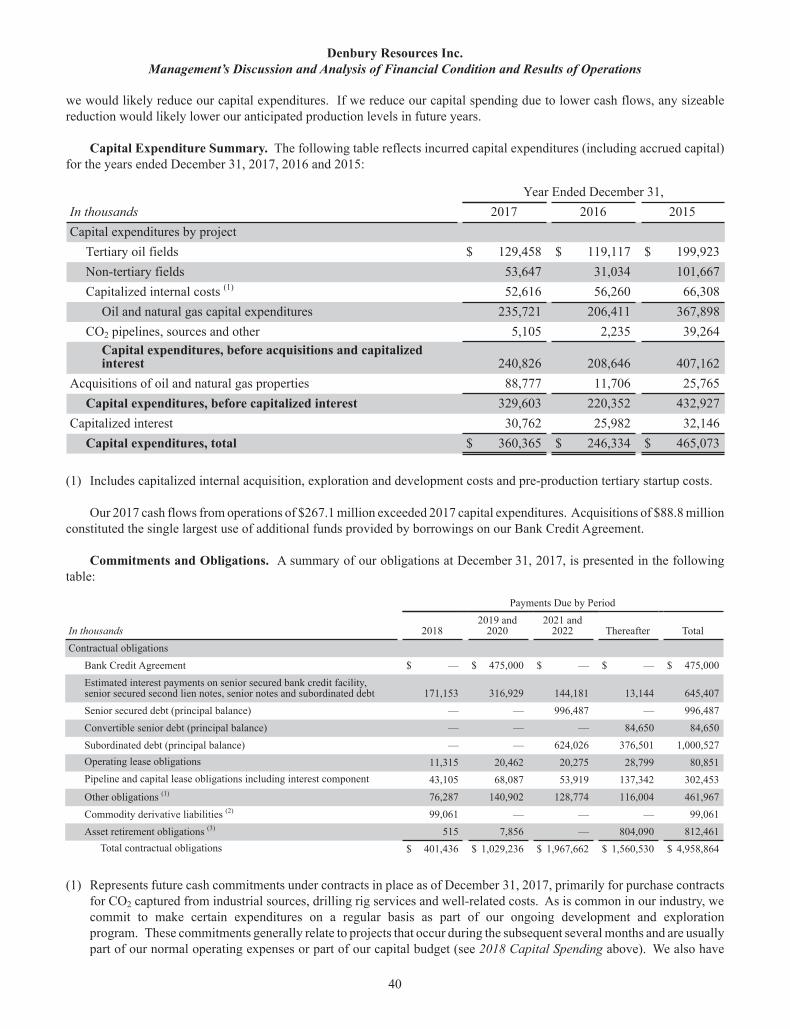
Denbury Resources Inc. Management’s Discussion and Analysis of Financial Condition and Results of Operations
40
we would likely reduce our capital expenditures. If we reduce our capital spending due to lower cash flows, any sizeable reduction would likely lower our anticipated production levels in future years.
Capital Expenditure Summary. The following table reflects incurred capital expenditures (including accrued capital) for the years ended December 31, 2017, 2016 and 2015:
Year Ended December 31,In thousands 2017 2016 2015Capital expenditures by project
Tertiary oil fields $ 129,458 $ 119,117 $ 199,923Non-tertiary fields 53,647 31,034 101,667Capitalized internal costs (1) 52,616 56,260 66,308
Oil and natural gas capital expenditures 235,721 206,411 367,898CO2 pipelines, sources and other 5,105 2,235 39,264
Capital expenditures, before acquisitions and capitalizedinterest 240,826 208,646 407,162
Acquisitions of oil and natural gas properties 88,777 11,706 25,765Capital expenditures, before capitalized interest 329,603 220,352 432,927
Capitalized interest 30,762 25,982 32,146Capital expenditures, total $ 360,365 $ 246,334 $ 465,073
(1) Includes capitalized internal acquisition, exploration and development costs and pre-production tertiary startup costs.
Our 2017 cash flows from operations of $267.1 million exceeded 2017 capital expenditures. Acquisitions of $88.8 millionconstituted the single largest use of additional funds provided by borrowings on our Bank Credit Agreement.
Commitments and Obligations. A summary of our obligations at December 31, 2017, is presented in the following table:
Payments Due by Period
In thousands 20182019 and
20202021 and
2022 Thereafter TotalContractual obligations
Bank Credit Agreement $ — $ 475,000 $ — $ — $ 475,000Estimated interest payments on senior secured bank credit facility,senior secured second lien notes, senior notes and subordinated debt 171,153 316,929 144,181 13,144 645,407Senior secured debt (principal balance) — — 996,487 — 996,487Convertible senior debt (principal balance) — — — 84,650 84,650Subordinated debt (principal balance) — — 624,026 376,501 1,000,527Operating lease obligations 11,315 20,462 20,275 28,799 80,851Pipeline and capital lease obligations including interest component 43,105 68,087 53,919 137,342 302,453Other obligations (1) 76,287 140,902 128,774 116,004 461,967Commodity derivative liabilities (2) 99,061 — — — 99,061Asset retirement obligations (3) 515 7,856 — 804,090 812,461
Total contractual obligations $ 401,436 $ 1,029,236 $ 1,967,662 $ 1,560,530 $ 4,958,864
(1) Represents future cash commitments under contracts in place as of December 31, 2017, primarily for purchase contracts for CO2 captured from industrial sources, drilling rig services and well-related costs. As is common in our industry, we commit to make certain expenditures on a regular basis as part of our ongoing development and exploration program. These commitments generally relate to projects that occur during the subsequent several months and are usually part of our normal operating expenses or part of our capital budget (see 2018 Capital Spending above). We also have
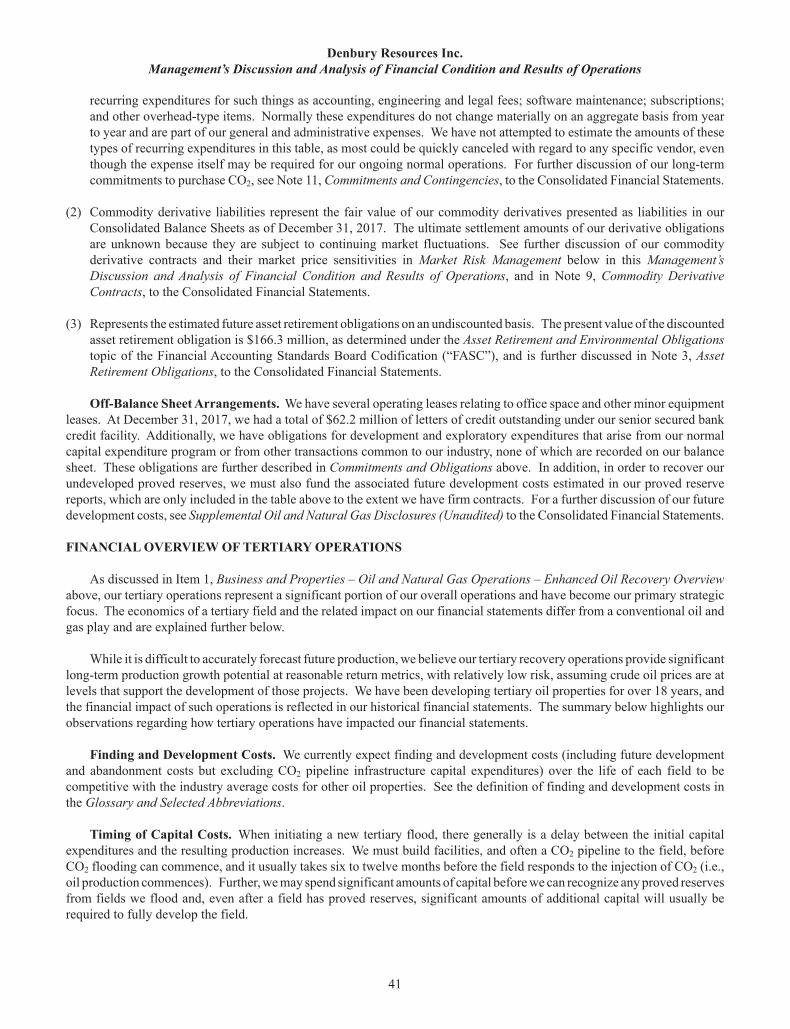
Denbury Resources Inc. Management’s Discussion and Analysis of Financial Condition and Results of Operations
41
recurring expenditures for such things as accounting, engineering and legal fees; software maintenance; subscriptions; and other overhead-type items. Normally these expenditures do not change materially on an aggregate basis from year to year and are part of our general and administrative expenses. We have not attempted to estimate the amounts of these types of recurring expenditures in this table, as most could be quickly canceled with regard to any specific vendor, even though the expense itself may be required for our ongoing normal operations. For further discussion of our long-term commitments to purchase CO2, see Note 11, Commitments and Contingencies, to the Consolidated Financial Statements.
(2) Commodity derivative liabilities represent the fair value of our commodity derivatives presented as liabilities in our Consolidated Balance Sheets as of December 31, 2017. The ultimate settlement amounts of our derivative obligations are unknown because they are subject to continuing market fluctuations. See further discussion of our commodity derivative contracts and their market price sensitivities in Market Risk Management below in this Management’s Discussion and Analysis of Financial Condition and Results of Operations, and in Note 9, Commodity Derivative Contracts, to the Consolidated Financial Statements.
(3) Represents the estimated future asset retirement obligations on an undiscounted basis. The present value of the discounted asset retirement obligation is $166.3 million, as determined under the Asset Retirement and Environmental Obligations topic of the Financial Accounting Standards Board Codification (“FASC”), and is further discussed in Note 3, Asset Retirement Obligations, to the Consolidated Financial Statements.
Off-Balance Sheet Arrangements. We have several operating leases relating to office space and other minor equipment leases. At December 31, 2017, we had a total of $62.2 million of letters of credit outstanding under our senior secured bank credit facility. Additionally, we have obligations for development and exploratory expenditures that arise from our normal capital expenditure program or from other transactions common to our industry, none of which are recorded on our balance sheet. These obligations are further described in Commitments and Obligations above. In addition, in order to recover our undeveloped proved reserves, we must also fund the associated future development costs estimated in our proved reserve reports, which are only included in the table above to the extent we have firm contracts. For a further discussion of our future development costs, see Supplemental Oil and Natural Gas Disclosures (Unaudited) to the Consolidated Financial Statements.
FINANCIAL OVERVIEW OF TERTIARY OPERATIONS
As discussed in Item 1, Business and Properties – Oil and Natural Gas Operations – Enhanced Oil Recovery Overviewabove, our tertiary operations represent a significant portion of our overall operations and have become our primary strategic focus. The economics of a tertiary field and the related impact on our financial statements differ from a conventional oil and gas play and are explained further below.
While it is difficult to accurately forecast future production, we believe our tertiary recovery operations provide significant long-term production growth potential at reasonable return metrics, with relatively low risk, assuming crude oil prices are at levels that support the development of those projects. We have been developing tertiary oil properties for over 18 years, and the financial impact of such operations is reflected in our historical financial statements. The summary below highlights our observations regarding how tertiary operations have impacted our financial statements.
Finding and Development Costs. We currently expect finding and development costs (including future development and abandonment costs but excluding CO2 pipeline infrastructure capital expenditures) over the life of each field to be competitive with the industry average costs for other oil properties. See the definition of finding and development costs in the Glossary and Selected Abbreviations.
Timing of Capital Costs. When initiating a new tertiary flood, there generally is a delay between the initial capital expenditures and the resulting production increases. We must build facilities, and often a CO2 pipeline to the field, before CO2 flooding can commence, and it usually takes six to twelve months before the field responds to the injection of CO2 (i.e., oil production commences). Further, we may spend significant amounts of capital before we can recognize any proved reserves from fields we flood and, even after a field has proved reserves, significant amounts of additional capital will usually be required to fully develop the field.
Denbury Resources Inc. Management’s Discussion and Analysis of Financial Condition and Results of Operations
42
Recognition of Proved Reserves. In order to recognize proved tertiary oil reserves, we must either demonstrate production resulting from the tertiary process or the field must be analogous to an existing tertiary flood. The magnitude of proved reserves that we can book in any given year will depend on our progress with new floods, the timing of the production response from new floods and the performance of our existing floods. Typically, a high percentage of the potential reserves for a tertiary field are recognized when a production response is initially observed, and generally only modest changes are made thereafter.
Production Rates. The production rate at a tertiary flood can vary from quarter to quarter, as a tertiary field’s production may increase rapidly when wells respond to the CO2, plateau temporarily, and then resume growth as additional areas of the field are developed. During a tertiary flood life cycle, facility capacity is increased from time to time, which occasionally requires temporary shutdowns during installation, thereby causing temporary declines in production. We also find it difficult to precisely predict when any given well will respond to the injected CO2, as the CO2 seldom travels through the rock consistently due to heterogeneity in the oil-bearing formations. With the recently low oil prices, our pace of development has generally slowed, thereby leading to a less consistent growth pattern. We find all of these fluctuations to be normal, and generally expect oil production at a tertiary field to increase over time until the field is fully developed, albeit sometimes in inconsistent patterns.
Operating Costs. Tertiary projects may be more expensive to operate than traditional industry operations because of the cost of injecting and recycling the CO2 (primarily due to the cost of the CO2 and the significant energy requirements to re-compress the CO2 back into a near-liquid state for re-injection purposes). The costs of our CO2 and the electricity required to recycle and inject this CO2 comprise nearly half of our typical tertiary operating expenses. Since these costs vary along with commodity and commercial electricity prices, they are highly variable and will increase in a high-commodity-price environment and decrease in a low-price environment. Most of our CO2 operating costs are allocated to our tertiary oil fields and recorded as lease operating expenses (following the commencement of tertiary oil production) at the time the CO2 is injected. These costs have historically represented approximately 20% to 25% of the total operating costs for our tertiary operations. Since we expense all of the operating costs to produce and inject our CO2 (following the commencement of tertiary oil production), operating costs per barrel for a new flood will be higher at the inception of CO2 injection projects because of minimal related oil production at that time.
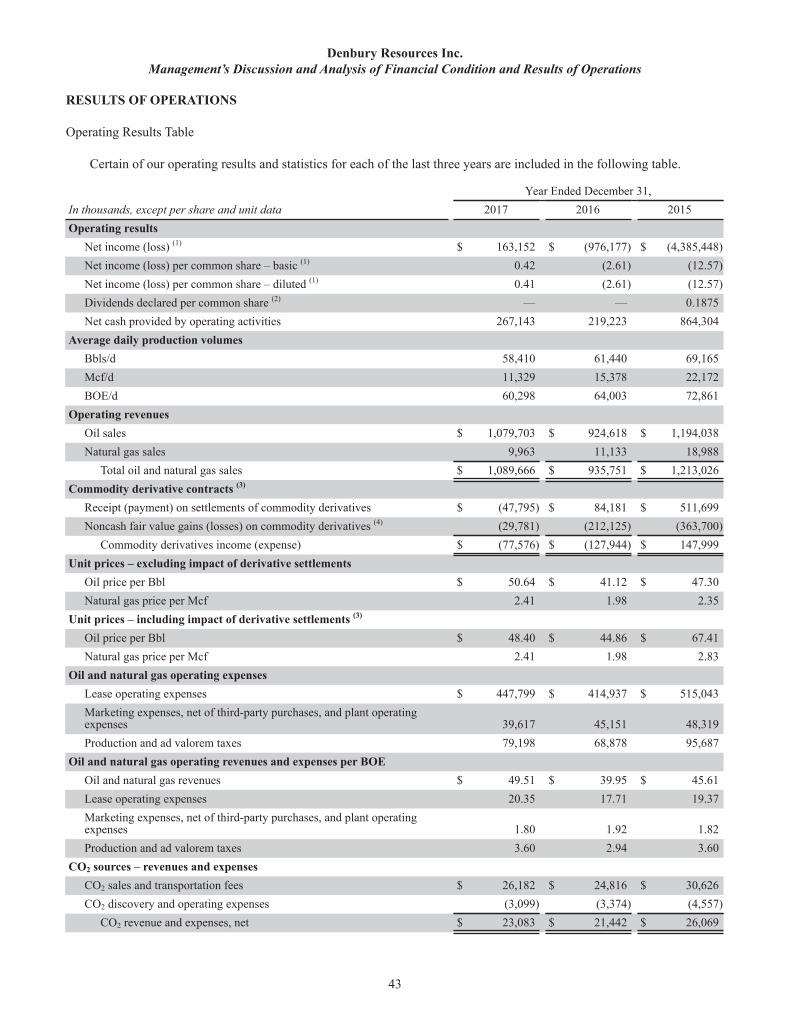
Denbury Resources Inc. Management’s Discussion and Analysis of Financial Condition and Results of Operations
43
RESULTS OF OPERATIONS
Operating Results Table
Certain of our operating results and statistics for each of the last three years are included in the following table.
Year Ended December 31,In thousands, except per share and unit data 2017 2016 2015Operating results
Net income (loss) (1) $ 163,152 $ (976,177) $ (4,385,448)Net income (loss) per common share – basic (1) 0.42 (2.61) (12.57)Net income (loss) per common share – diluted (1) 0.41 (2.61) (12.57)Dividends declared per common share (2) — — 0.1875Net cash provided by operating activities 267,143 219,223 864,304
Average daily production volumes Bbls/d 58,410 61,440 69,165Mcf/d 11,329 15,378 22,172BOE/d 60,298 64,003 72,861
Operating revenues Oil sales $ 1,079,703 $ 924,618 $ 1,194,038Natural gas sales 9,963 11,133 18,988
Total oil and natural gas sales $ 1,089,666 $ 935,751 $ 1,213,026Commodity derivative contracts (3)
Receipt (payment) on settlements of commodity derivatives $ (47,795) $ 84,181 $ 511,699Noncash fair value gains (losses) on commodity derivatives (4) (29,781) (212,125) (363,700)
Commodity derivatives income (expense) $ (77,576) $ (127,944) $ 147,999Unit prices – excluding impact of derivative settlements
Oil price per Bbl $ 50.64 $ 41.12 $ 47.30Natural gas price per Mcf 2.41 1.98 2.35
Unit prices – including impact of derivative settlements (3) Oil price per Bbl $ 48.40 $ 44.86 $ 67.41Natural gas price per Mcf 2.41 1.98 2.83
Oil and natural gas operating expenses Lease operating expenses $ 447,799 $ 414,937 $ 515,043Marketing expenses, net of third-party purchases, and plant operatingexpenses 39,617 45,151 48,319Production and ad valorem taxes 79,198 68,878 95,687
Oil and natural gas operating revenues and expenses per BOE Oil and natural gas revenues $ 49.51 $ 39.95 $ 45.61Lease operating expenses 20.35 17.71 19.37Marketing expenses, net of third-party purchases, and plant operatingexpenses 1.80 1.92 1.82Production and ad valorem taxes 3.60 2.94 3.60
CO2 sources – revenues and expenses CO2 sales and transportation fees $ 26,182 $ 24,816 $ 30,626CO2 discovery and operating expenses (3,099) (3,374) (4,557)
CO2 revenue and expenses, net $ 23,083 $ 21,442 $ 26,069
Denbury Resources Inc. Management’s Discussion and Analysis of Financial Condition and Results of Operations
44
(1) Includes pre-tax full-cost pool ceiling test write-downs of our oil and natural gas properties of $810.9 million and $4.9 billion for the years ended December 31, 2016 and 2015, respectively, an impairment of goodwill of $1.3 billion for the year ended December 31, 2015, and an accelerated depreciation charge of $591.0 million for the year ended December 31, 2016 related to the Riley Ridge gas processing facility and related assets.
(2) In September 2015, in light of the continuing low oil price environment and our desire to maintain our financial strength and flexibility, the Company’s Board of Directors suspended our quarterly cash dividend.
(3) See also Commodity Derivative Contracts below and Market Risk Management for information concerning our commodity derivative transactions.
(4) Noncash fair value gains (losses) on commodity derivatives is a non-GAAP measure and is different from “Commodity derivatives expense (income)” in the Consolidated Statements of Operations in that the noncash fair value gains (losses) on commodity derivatives represent only the net changes between periods of the fair market values of commodity derivative positions, and exclude the impact of settlements on commodity derivatives during the period, which were payments on settlements of $47.8 million for the year ended December 31, 2017 and receipts on settlements of $84.2 million and $511.7 million for the years ended December 31, 2016 and 2015, respectively. We believe that noncash fair value gains (losses) on commodity derivatives is a useful supplemental disclosure to “Commodity derivatives expense (income)” in order to differentiate noncash fair market value adjustments from receipts or payments upon settlements on commodity derivatives during the period. This supplemental disclosure is widely used within the industry and by securities analysts, banks and credit rating agencies in calculating EBITDA and in adjusting net income (loss) to present those measures on a comparative basis across companies, as well as to assess compliance with certain debt covenants. Noncash fair value gains (losses) on commodity derivatives is not a measure of financial or operating performance under GAAP, nor should it be considered in isolation or as a substitute for “Commodity derivatives expense (income)” in the Consolidated Statements of Operations. See also the Glossary and Selected Abbreviations for the definition of noncash fair value gains (losses) on commodity derivatives.
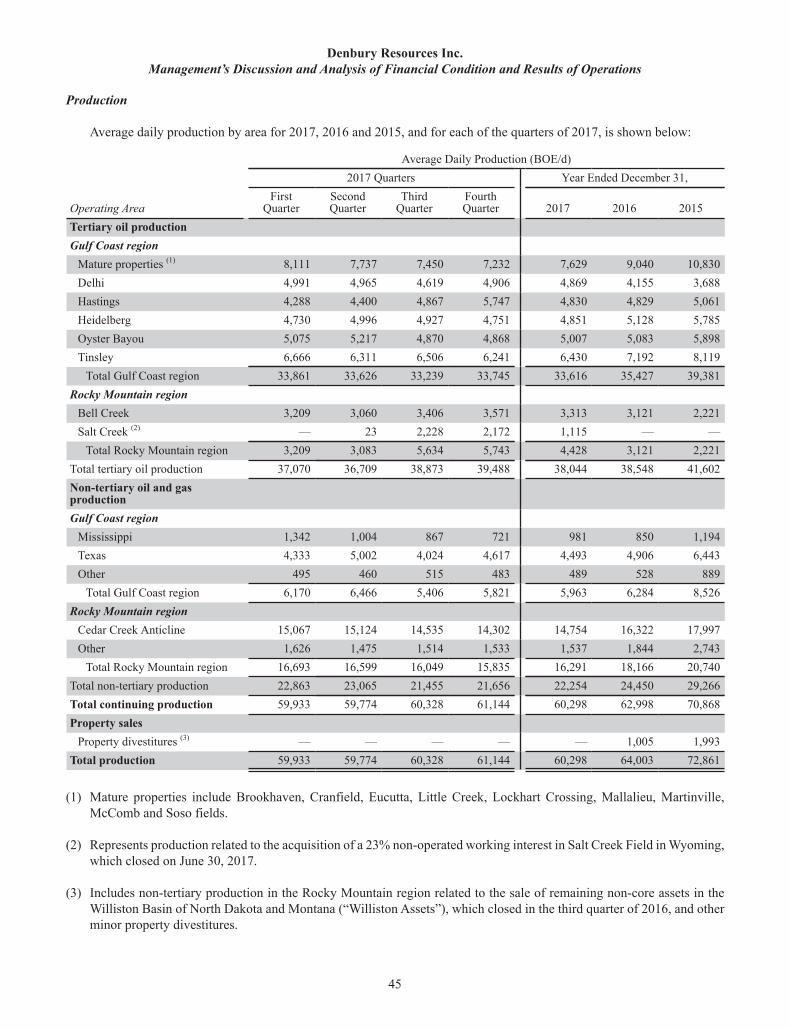
Denbury Resources Inc. Management’s Discussion and Analysis of Financial Condition and Results of Operations
45
Production
Average daily production by area for 2017, 2016 and 2015, and for each of the quarters of 2017, is shown below:
Average Daily Production (BOE/d) 2017 Quarters Year Ended December 31,
Operating AreaFirst
QuarterSecondQuarter
ThirdQuarter
FourthQuarter 2017 2016 2015
Tertiary oil productionGulf Coast region
Mature properties (1) 8,111 7,737 7,450 7,232 7,629 9,040 10,830Delhi 4,991 4,965 4,619 4,906 4,869 4,155 3,688Hastings 4,288 4,400 4,867 5,747 4,830 4,829 5,061Heidelberg 4,730 4,996 4,927 4,751 4,851 5,128 5,785Oyster Bayou 5,075 5,217 4,870 4,868 5,007 5,083 5,898Tinsley 6,666 6,311 6,506 6,241 6,430 7,192 8,119
Total Gulf Coast region 33,861 33,626 33,239 33,745 33,616 35,427 39,381Rocky Mountain region
Bell Creek 3,209 3,060 3,406 3,571 3,313 3,121 2,221Salt Creek (2) — 23 2,228 2,172 1,115 — —
Total Rocky Mountain region 3,209 3,083 5,634 5,743 4,428 3,121 2,221Total tertiary oil production 37,070 36,709 38,873 39,488 38,044 38,548 41,602Non-tertiary oil and gasproductionGulf Coast region
Mississippi 1,342 1,004 867 721 981 850 1,194Texas 4,333 5,002 4,024 4,617 4,493 4,906 6,443Other 495 460 515 483 489 528 889
Total Gulf Coast region 6,170 6,466 5,406 5,821 5,963 6,284 8,526Rocky Mountain region
Cedar Creek Anticline 15,067 15,124 14,535 14,302 14,754 16,322 17,997Other 1,626 1,475 1,514 1,533 1,537 1,844 2,743
Total Rocky Mountain region 16,693 16,599 16,049 15,835 16,291 18,166 20,740Total non-tertiary production 22,863 23,065 21,455 21,656 22,254 24,450 29,266Total continuing production 59,933 59,774 60,328 61,144 60,298 62,998 70,868Property sales
Property divestitures (3) — — — — — 1,005 1,993Total production 59,933 59,774 60,328 61,144 60,298 64,003 72,861
(1) Mature properties include Brookhaven, Cranfield, Eucutta, Little Creek, Lockhart Crossing, Mallalieu, Martinville, McComb and Soso fields.
(2) Represents production related to the acquisition of a 23% non-operated working interest in Salt Creek Field in Wyoming, which closed on June 30, 2017.
(3) Includes non-tertiary production in the Rocky Mountain region related to the sale of remaining non-core assets in the Williston Basin of North Dakota and Montana (“Williston Assets”), which closed in the third quarter of 2016, and other minor property divestitures.
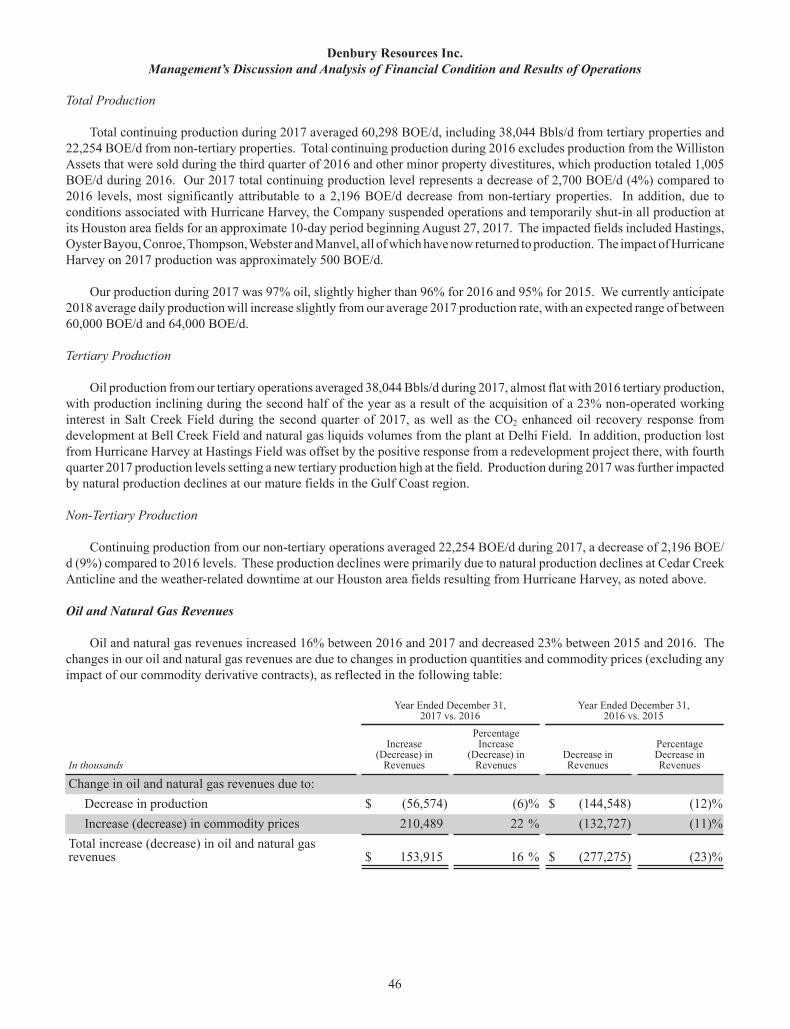
Denbury Resources Inc. Management’s Discussion and Analysis of Financial Condition and Results of Operations
46
Total Production
Total continuing production during 2017 averaged 60,298 BOE/d, including 38,044 Bbls/d from tertiary properties and 22,254 BOE/d from non-tertiary properties. Total continuing production during 2016 excludes production from the Williston Assets that were sold during the third quarter of 2016 and other minor property divestitures, which production totaled 1,005BOE/d during 2016. Our 2017 total continuing production level represents a decrease of 2,700 BOE/d (4%) compared to 2016 levels, most significantly attributable to a 2,196 BOE/d decrease from non-tertiary properties. In addition, due to conditions associated with Hurricane Harvey, the Company suspended operations and temporarily shut-in all production at its Houston area fields for an approximate 10-day period beginning August 27, 2017. The impacted fields included Hastings, Oyster Bayou, Conroe, Thompson, Webster and Manvel, all of which have now returned to production. The impact of Hurricane Harvey on 2017 production was approximately 500 BOE/d.
Our production during 2017 was 97% oil, slightly higher than 96% for 2016 and 95% for 2015. We currently anticipate 2018 average daily production will increase slightly from our average 2017 production rate, with an expected range of between 60,000 BOE/d and 64,000 BOE/d.
Tertiary Production
Oil production from our tertiary operations averaged 38,044 Bbls/d during 2017, almost flat with 2016 tertiary production, with production inclining during the second half of the year as a result of the acquisition of a 23% non-operated working interest in Salt Creek Field during the second quarter of 2017, as well as the CO2 enhanced oil recovery response from development at Bell Creek Field and natural gas liquids volumes from the plant at Delhi Field. In addition, production lost from Hurricane Harvey at Hastings Field was offset by the positive response from a redevelopment project there, with fourth quarter 2017 production levels setting a new tertiary production high at the field. Production during 2017 was further impacted by natural production declines at our mature fields in the Gulf Coast region.
Non-Tertiary Production
Continuing production from our non-tertiary operations averaged 22,254 BOE/d during 2017, a decrease of 2,196 BOE/d (9%) compared to 2016 levels. These production declines were primarily due to natural production declines at Cedar Creek Anticline and the weather-related downtime at our Houston area fields resulting from Hurricane Harvey, as noted above.
Oil and Natural Gas Revenues
Oil and natural gas revenues increased 16% between 2016 and 2017 and decreased 23% between 2015 and 2016. The changes in our oil and natural gas revenues are due to changes in production quantities and commodity prices (excluding any impact of our commodity derivative contracts), as reflected in the following table:
Year Ended December 31,2017 vs. 2016
Year Ended December 31,2016 vs. 2015
In thousands
Increase(Decrease) in
Revenues
PercentageIncrease
(Decrease) inRevenues
Decrease inRevenues
PercentageDecrease inRevenues
Change in oil and natural gas revenues due to: Decrease in production $ (56,574) (6)% $ (144,548) (12)%Increase (decrease) in commodity prices 210,489 22 % (132,727) (11)%
Total increase (decrease) in oil and natural gasrevenues $ 153,915 16 % $ (277,275) (23)%
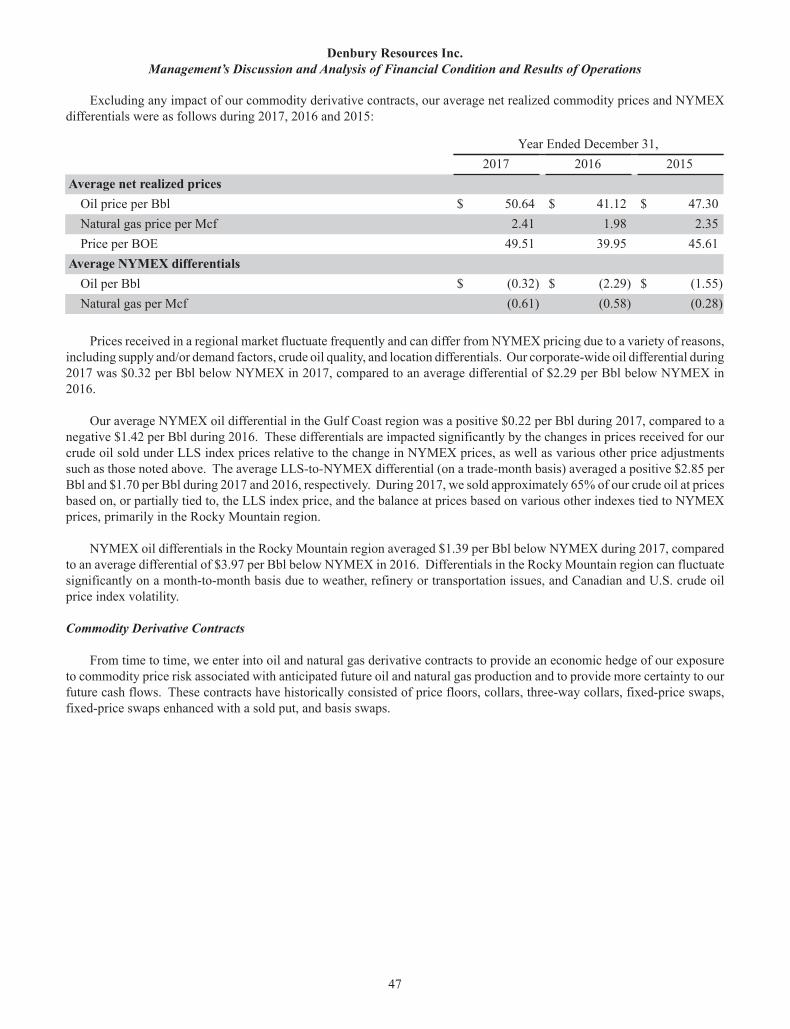
Denbury Resources Inc. Management’s Discussion and Analysis of Financial Condition and Results of Operations
47
Excluding any impact of our commodity derivative contracts, our average net realized commodity prices and NYMEX differentials were as follows during 2017, 2016 and 2015:
Year Ended December 31, 2017 2016 2015Average net realized prices
Oil price per Bbl $ 50.64 $ 41.12 $ 47.30Natural gas price per Mcf 2.41 1.98 2.35Price per BOE 49.51 39.95 45.61
Average NYMEX differentials Oil per Bbl $ (0.32) $ (2.29) $ (1.55)Natural gas per Mcf (0.61) (0.58) (0.28)
Prices received in a regional market fluctuate frequently and can differ from NYMEX pricing due to a variety of reasons, including supply and/or demand factors, crude oil quality, and location differentials. Our corporate-wide oil differential during 2017 was $0.32 per Bbl below NYMEX in 2017, compared to an average differential of $2.29 per Bbl below NYMEX in 2016.
Our average NYMEX oil differential in the Gulf Coast region was a positive $0.22 per Bbl during 2017, compared to a negative $1.42 per Bbl during 2016. These differentials are impacted significantly by the changes in prices received for our crude oil sold under LLS index prices relative to the change in NYMEX prices, as well as various other price adjustments such as those noted above. The average LLS-to-NYMEX differential (on a trade-month basis) averaged a positive $2.85 per Bbl and $1.70 per Bbl during 2017 and 2016, respectively. During 2017, we sold approximately 65% of our crude oil at prices based on, or partially tied to, the LLS index price, and the balance at prices based on various other indexes tied to NYMEX prices, primarily in the Rocky Mountain region.
NYMEX oil differentials in the Rocky Mountain region averaged $1.39 per Bbl below NYMEX during 2017, compared to an average differential of $3.97 per Bbl below NYMEX in 2016. Differentials in the Rocky Mountain region can fluctuate significantly on a month-to-month basis due to weather, refinery or transportation issues, and Canadian and U.S. crude oil price index volatility.
Commodity Derivative Contracts
From time to time, we enter into oil and natural gas derivative contracts to provide an economic hedge of our exposure to commodity price risk associated with anticipated future oil and natural gas production and to provide more certainty to our future cash flows. These contracts have historically consisted of price floors, collars, three-way collars, fixed-price swaps, fixed-price swaps enhanced with a sold put, and basis swaps.
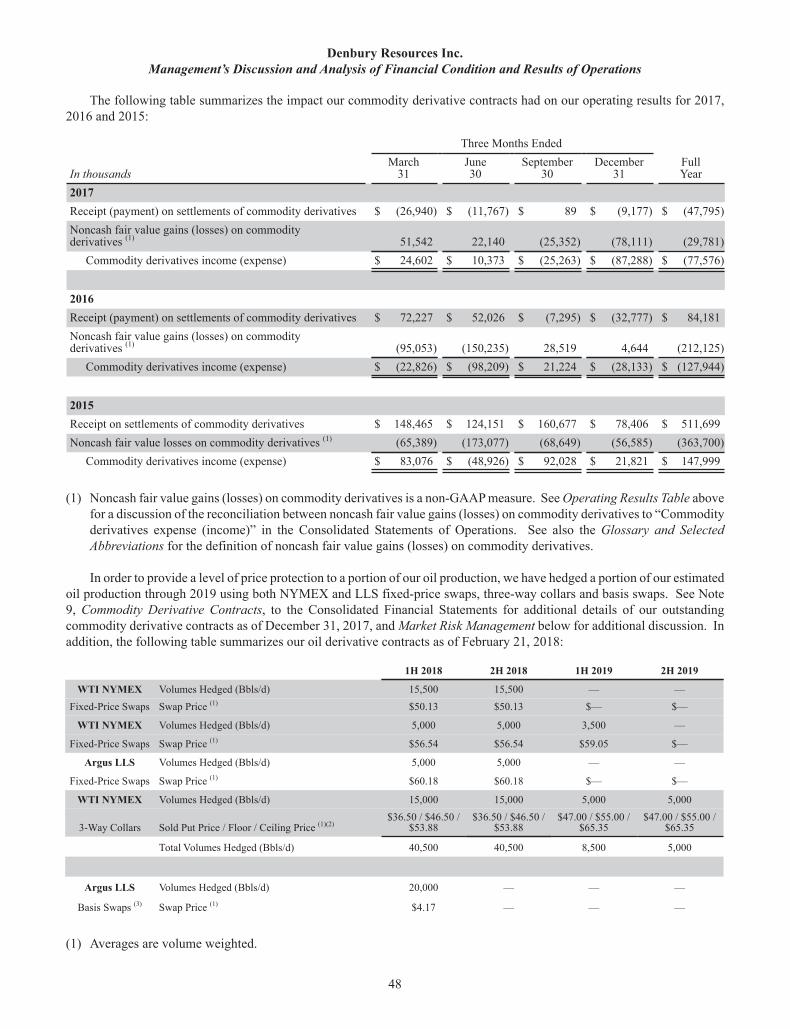
Denbury Resources Inc. Management’s Discussion and Analysis of Financial Condition and Results of Operations
48
The following table summarizes the impact our commodity derivative contracts had on our operating results for 2017, 2016 and 2015:
Three Months Ended
In thousandsMarch
31June30
September30
December31
FullYear
2017Receipt (payment) on settlements of commodity derivatives $ (26,940) $ (11,767) $ 89 $ (9,177) $ (47,795)Noncash fair value gains (losses) on commodity derivatives (1) 51,542 22,140 (25,352) (78,111) (29,781)
Commodity derivatives income (expense) $ 24,602 $ 10,373 $ (25,263) $ (87,288) $ (77,576)
2016Receipt (payment) on settlements of commodity derivatives $ 72,227 $ 52,026 $ (7,295) $ (32,777) $ 84,181Noncash fair value gains (losses) on commodity derivatives (1) (95,053) (150,235) 28,519 4,644 (212,125)
Commodity derivatives income (expense) $ (22,826) $ (98,209) $ 21,224 $ (28,133) $ (127,944)
2015Receipt on settlements of commodity derivatives $ 148,465 $ 124,151 $ 160,677 $ 78,406 $ 511,699Noncash fair value losses on commodity derivatives (1) (65,389) (173,077) (68,649) (56,585) (363,700)
Commodity derivatives income (expense) $ 83,076 $ (48,926) $ 92,028 $ 21,821 $ 147,999
(1) Noncash fair value gains (losses) on commodity derivatives is a non-GAAP measure. See Operating Results Table above for a discussion of the reconciliation between noncash fair value gains (losses) on commodity derivatives to “Commodity derivatives expense (income)” in the Consolidated Statements of Operations. See also the Glossary and Selected Abbreviations for the definition of noncash fair value gains (losses) on commodity derivatives.
In order to provide a level of price protection to a portion of our oil production, we have hedged a portion of our estimated oil production through 2019 using both NYMEX and LLS fixed-price swaps, three-way collars and basis swaps. See Note 9, Commodity Derivative Contracts, to the Consolidated Financial Statements for additional details of our outstanding commodity derivative contracts as of December 31, 2017, and Market Risk Management below for additional discussion. In addition, the following table summarizes our oil derivative contracts as of February 21, 2018:
1H 2018 2H 2018 1H 2019 2H 2019
WTI NYMEX Volumes Hedged (Bbls/d) 15,500 15,500 — —Fixed-Price Swaps Swap Price (1) $50.13 $50.13 $— $—
WTI NYMEX Volumes Hedged (Bbls/d) 5,000 5,000 3,500 —
Fixed-Price Swaps Swap Price (1) $56.54 $56.54 $59.05 $—
Argus LLS Volumes Hedged (Bbls/d) 5,000 5,000 — —
Fixed-Price Swaps Swap Price (1) $60.18 $60.18 $— $—
WTI NYMEX Volumes Hedged (Bbls/d) 15,000 15,000 5,000 5,000
3-Way Collars Sold Put Price / Floor / Ceiling Price (1)(2)$36.50 / $46.50 /
$53.88$36.50 / $46.50 /
$53.88$47.00 / $55.00 /
$65.35$47.00 / $55.00 /
$65.35
Total Volumes Hedged (Bbls/d) 40,500 40,500 8,500 5,000
Argus LLS Volumes Hedged (Bbls/d) 20,000 — — —
Basis Swaps (3) Swap Price (1) $4.17 — — —
(1) Averages are volume weighted.
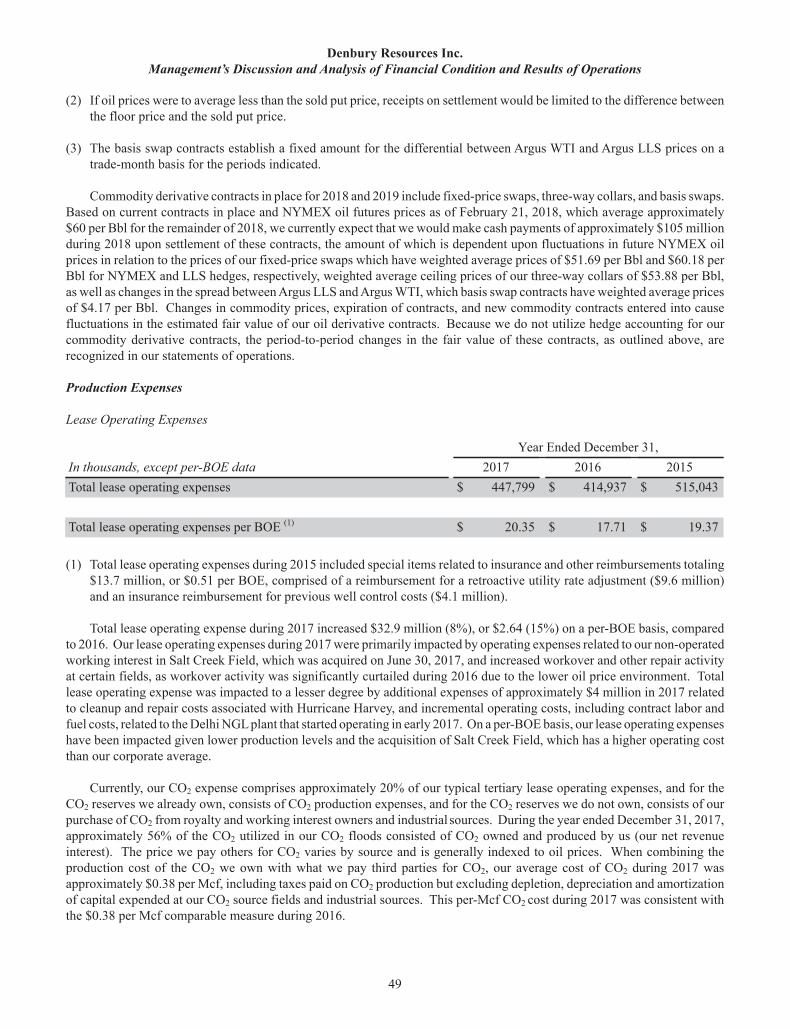
Denbury Resources Inc. Management’s Discussion and Analysis of Financial Condition and Results of Operations
49
(2) If oil prices were to average less than the sold put price, receipts on settlement would be limited to the difference between the floor price and the sold put price.
(3) The basis swap contracts establish a fixed amount for the differential between Argus WTI and Argus LLS prices on a trade-month basis for the periods indicated.
Commodity derivative contracts in place for 2018 and 2019 include fixed-price swaps, three-way collars, and basis swaps. Based on current contracts in place and NYMEX oil futures prices as of February 21, 2018, which average approximately $60 per Bbl for the remainder of 2018, we currently expect that we would make cash payments of approximately $105 million during 2018 upon settlement of these contracts, the amount of which is dependent upon fluctuations in future NYMEX oil prices in relation to the prices of our fixed-price swaps which have weighted average prices of $51.69 per Bbl and $60.18 per Bbl for NYMEX and LLS hedges, respectively, weighted average ceiling prices of our three-way collars of $53.88 per Bbl, as well as changes in the spread between Argus LLS and Argus WTI, which basis swap contracts have weighted average prices of $4.17 per Bbl. Changes in commodity prices, expiration of contracts, and new commodity contracts entered into cause fluctuations in the estimated fair value of our oil derivative contracts. Because we do not utilize hedge accounting for our commodity derivative contracts, the period-to-period changes in the fair value of these contracts, as outlined above, are recognized in our statements of operations.
Production Expenses
Lease Operating Expenses
Year Ended December 31,In thousands, except per-BOE data 2017 2016 2015Total lease operating expenses $ 447,799 $ 414,937 $ 515,043
Total lease operating expenses per BOE (1) $ 20.35 $ 17.71 $ 19.37
(1) Total lease operating expenses during 2015 included special items related to insurance and other reimbursements totaling $13.7 million, or $0.51 per BOE, comprised of a reimbursement for a retroactive utility rate adjustment ($9.6 million) and an insurance reimbursement for previous well control costs ($4.1 million).
Total lease operating expense during 2017 increased $32.9 million (8%), or $2.64 (15%) on a per-BOE basis, compared to 2016. Our lease operating expenses during 2017 were primarily impacted by operating expenses related to our non-operated working interest in Salt Creek Field, which was acquired on June 30, 2017, and increased workover and other repair activity at certain fields, as workover activity was significantly curtailed during 2016 due to the lower oil price environment. Total lease operating expense was impacted to a lesser degree by additional expenses of approximately $4 million in 2017 related to cleanup and repair costs associated with Hurricane Harvey, and incremental operating costs, including contract labor and fuel costs, related to the Delhi NGL plant that started operating in early 2017. On a per-BOE basis, our lease operating expenses have been impacted given lower production levels and the acquisition of Salt Creek Field, which has a higher operating cost than our corporate average.
Currently, our CO2 expense comprises approximately 20% of our typical tertiary lease operating expenses, and for the CO2 reserves we already own, consists of CO2 production expenses, and for the CO2 reserves we do not own, consists of our purchase of CO2 from royalty and working interest owners and industrial sources. During the year ended December 31, 2017, approximately 56% of the CO2 utilized in our CO2 floods consisted of CO2 owned and produced by us (our net revenue interest). The price we pay others for CO2 varies by source and is generally indexed to oil prices. When combining the production cost of the CO2 we own with what we pay third parties for CO2, our average cost of CO2 during 2017 was approximately $0.38 per Mcf, including taxes paid on CO2 production but excluding depletion, depreciation and amortization of capital expended at our CO2 source fields and industrial sources. This per-Mcf CO2 cost during 2017 was consistent with the $0.38 per Mcf comparable measure during 2016.
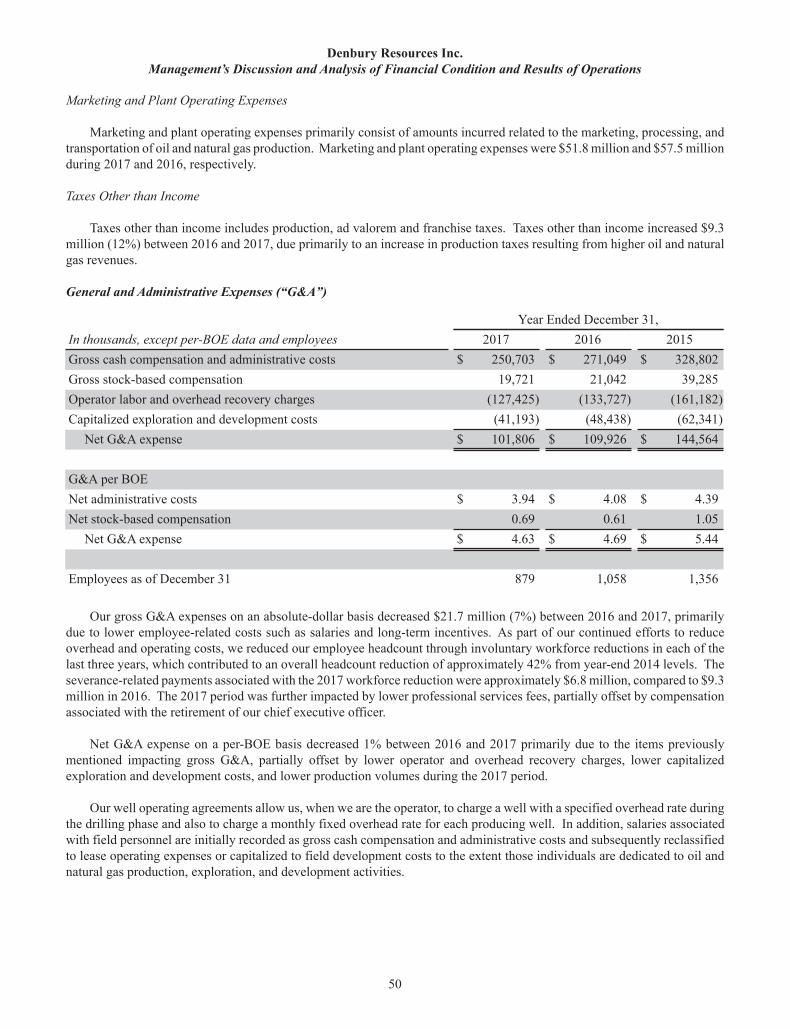
Denbury Resources Inc. Management’s Discussion and Analysis of Financial Condition and Results of Operations
50
Marketing and Plant Operating Expenses
Marketing and plant operating expenses primarily consist of amounts incurred related to the marketing, processing, and transportation of oil and natural gas production. Marketing and plant operating expenses were $51.8 million and $57.5 million during 2017 and 2016, respectively.
Taxes Other than Income
Taxes other than income includes production, ad valorem and franchise taxes. Taxes other than income increased $9.3 million (12%) between 2016 and 2017, due primarily to an increase in production taxes resulting from higher oil and natural gas revenues.
General and Administrative Expenses (“G&A”)
Year Ended December 31,In thousands, except per-BOE data and employees 2017 2016 2015Gross cash compensation and administrative costs $ 250,703 $ 271,049 $ 328,802Gross stock-based compensation 19,721 21,042 39,285Operator labor and overhead recovery charges (127,425) (133,727) (161,182)Capitalized exploration and development costs (41,193) (48,438) (62,341)
Net G&A expense $ 101,806 $ 109,926 $ 144,564
G&A per BOE Net administrative costs $ 3.94 $ 4.08 $ 4.39Net stock-based compensation 0.69 0.61 1.05
Net G&A expense $ 4.63 $ 4.69 $ 5.44
Employees as of December 31 879 1,058 1,356
Our gross G&A expenses on an absolute-dollar basis decreased $21.7 million (7%) between 2016 and 2017, primarily due to lower employee-related costs such as salaries and long-term incentives. As part of our continued efforts to reduce overhead and operating costs, we reduced our employee headcount through involuntary workforce reductions in each of the last three years, which contributed to an overall headcount reduction of approximately 42% from year-end 2014 levels. The severance-related payments associated with the 2017 workforce reduction were approximately $6.8 million, compared to $9.3 million in 2016. The 2017 period was further impacted by lower professional services fees, partially offset by compensation associated with the retirement of our chief executive officer.
Net G&A expense on a per-BOE basis decreased 1% between 2016 and 2017 primarily due to the items previously mentioned impacting gross G&A, partially offset by lower operator and overhead recovery charges, lower capitalized exploration and development costs, and lower production volumes during the 2017 period.
Our well operating agreements allow us, when we are the operator, to charge a well with a specified overhead rate during the drilling phase and also to charge a monthly fixed overhead rate for each producing well. In addition, salaries associated with field personnel are initially recorded as gross cash compensation and administrative costs and subsequently reclassified to lease operating expenses or capitalized to field development costs to the extent those individuals are dedicated to oil and natural gas production, exploration, and development activities.
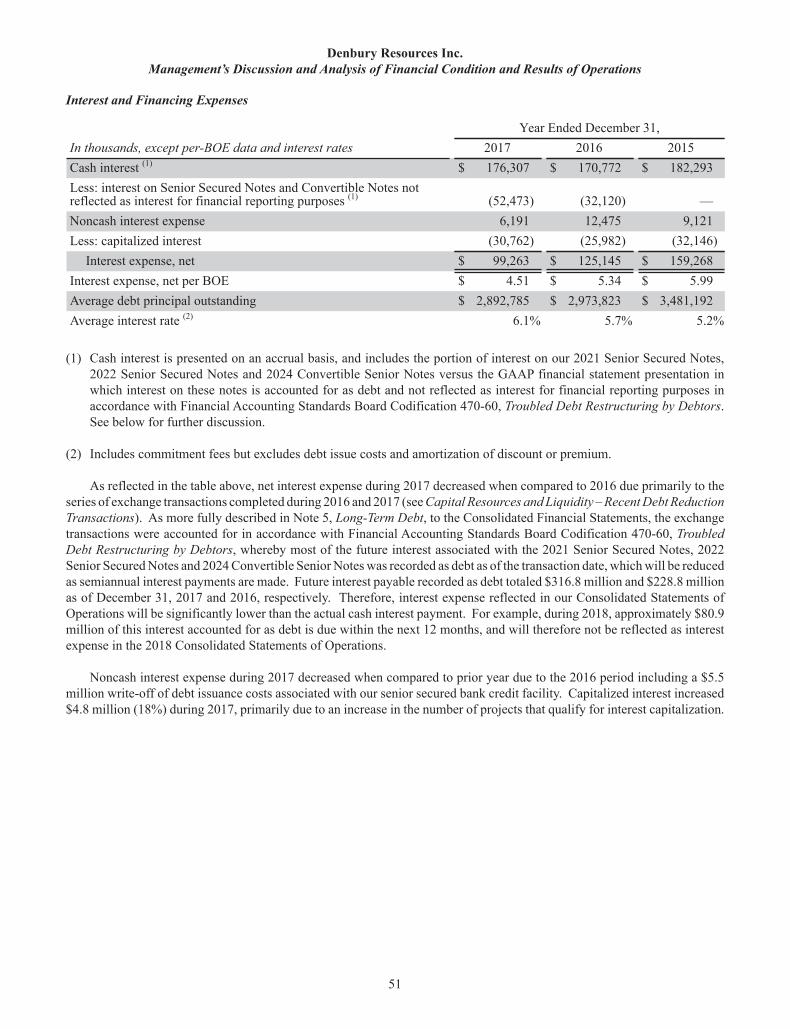
Denbury Resources Inc. Management’s Discussion and Analysis of Financial Condition and Results of Operations
51
Interest and Financing Expenses
Year Ended December 31,In thousands, except per-BOE data and interest rates 2017 2016 2015Cash interest (1) $ 176,307 $ 170,772 $ 182,293Less: interest on Senior Secured Notes and Convertible Notes not reflected as interest for financial reporting purposes (1) (52,473) (32,120) —Noncash interest expense 6,191 12,475 9,121Less: capitalized interest (30,762) (25,982) (32,146)
Interest expense, net $ 99,263 $ 125,145 $ 159,268Interest expense, net per BOE $ 4.51 $ 5.34 $ 5.99Average debt principal outstanding $ 2,892,785 $ 2,973,823 $ 3,481,192Average interest rate (2) 6.1% 5.7% 5.2%
(1) Cash interest is presented on an accrual basis, and includes the portion of interest on our 2021 Senior Secured Notes, 2022 Senior Secured Notes and 2024 Convertible Senior Notes versus the GAAP financial statement presentation in which interest on these notes is accounted for as debt and not reflected as interest for financial reporting purposes in accordance with Financial Accounting Standards Board Codification 470-60, Troubled Debt Restructuring by Debtors. See below for further discussion.
(2) Includes commitment fees but excludes debt issue costs and amortization of discount or premium.
As reflected in the table above, net interest expense during 2017 decreased when compared to 2016 due primarily to the series of exchange transactions completed during 2016 and 2017 (see Capital Resources and Liquidity – Recent Debt Reduction Transactions). As more fully described in Note 5, Long-Term Debt, to the Consolidated Financial Statements, the exchange transactions were accounted for in accordance with Financial Accounting Standards Board Codification 470-60, Troubled Debt Restructuring by Debtors, whereby most of the future interest associated with the 2021 Senior Secured Notes, 2022 Senior Secured Notes and 2024 Convertible Senior Notes was recorded as debt as of the transaction date, which will be reduced as semiannual interest payments are made. Future interest payable recorded as debt totaled $316.8 million and $228.8 million as of December 31, 2017 and 2016, respectively. Therefore, interest expense reflected in our Consolidated Statements of Operations will be significantly lower than the actual cash interest payment. For example, during 2018, approximately $80.9 million of this interest accounted for as debt is due within the next 12 months, and will therefore not be reflected as interest expense in the 2018 Consolidated Statements of Operations.
Noncash interest expense during 2017 decreased when compared to prior year due to the 2016 period including a $5.5 million write-off of debt issuance costs associated with our senior secured bank credit facility. Capitalized interest increased$4.8 million (18%) during 2017, primarily due to an increase in the number of projects that qualify for interest capitalization.
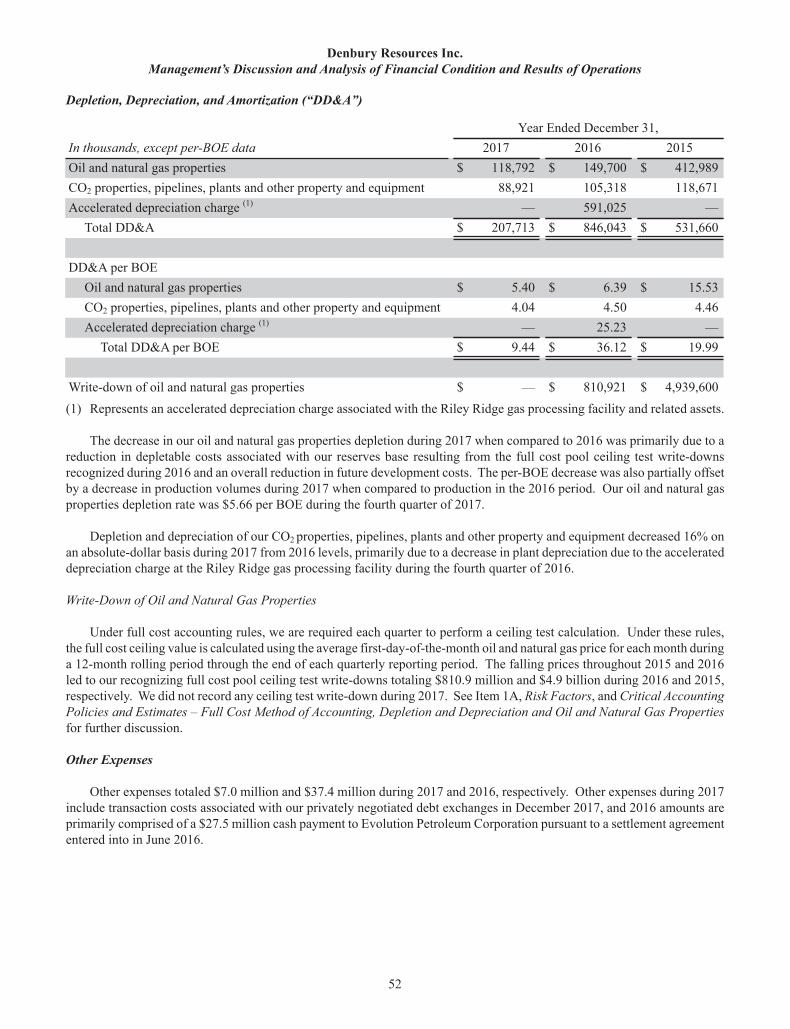
Denbury Resources Inc. Management’s Discussion and Analysis of Financial Condition and Results of Operations
52
Depletion, Depreciation, and Amortization (“DD&A”)
Year Ended December 31,In thousands, except per-BOE data 2017 2016 2015Oil and natural gas properties $ 118,792 $ 149,700 $ 412,989CO2 properties, pipelines, plants and other property and equipment 88,921 105,318 118,671Accelerated depreciation charge (1) — 591,025 —
Total DD&A $ 207,713 $ 846,043 $ 531,660
DD&A per BOE Oil and natural gas properties $ 5.40 $ 6.39 $ 15.53CO2 properties, pipelines, plants and other property and equipment 4.04 4.50 4.46Accelerated depreciation charge (1) — 25.23 —
Total DD&A per BOE $ 9.44 $ 36.12 $ 19.99
Write-down of oil and natural gas properties $ — $ 810,921 $ 4,939,600(1) Represents an accelerated depreciation charge associated with the Riley Ridge gas processing facility and related assets.
The decrease in our oil and natural gas properties depletion during 2017 when compared to 2016 was primarily due to a reduction in depletable costs associated with our reserves base resulting from the full cost pool ceiling test write-downs recognized during 2016 and an overall reduction in future development costs. The per-BOE decrease was also partially offset by a decrease in production volumes during 2017 when compared to production in the 2016 period. Our oil and natural gas properties depletion rate was $5.66 per BOE during the fourth quarter of 2017.
Depletion and depreciation of our CO2 properties, pipelines, plants and other property and equipment decreased 16% on an absolute-dollar basis during 2017 from 2016 levels, primarily due to a decrease in plant depreciation due to the accelerated depreciation charge at the Riley Ridge gas processing facility during the fourth quarter of 2016.
Write-Down of Oil and Natural Gas Properties
Under full cost accounting rules, we are required each quarter to perform a ceiling test calculation. Under these rules, the full cost ceiling value is calculated using the average first-day-of-the-month oil and natural gas price for each month during a 12-month rolling period through the end of each quarterly reporting period. The falling prices throughout 2015 and 2016 led to our recognizing full cost pool ceiling test write-downs totaling $810.9 million and $4.9 billion during 2016 and 2015, respectively. We did not record any ceiling test write-down during 2017. See Item 1A, Risk Factors, and Critical Accounting Policies and Estimates – Full Cost Method of Accounting, Depletion and Depreciation and Oil and Natural Gas Properties for further discussion.
Other Expenses
Other expenses totaled $7.0 million and $37.4 million during 2017 and 2016, respectively. Other expenses during 2017 include transaction costs associated with our privately negotiated debt exchanges in December 2017, and 2016 amounts are primarily comprised of a $27.5 million cash payment to Evolution Petroleum Corporation pursuant to a settlement agreement entered into in June 2016.
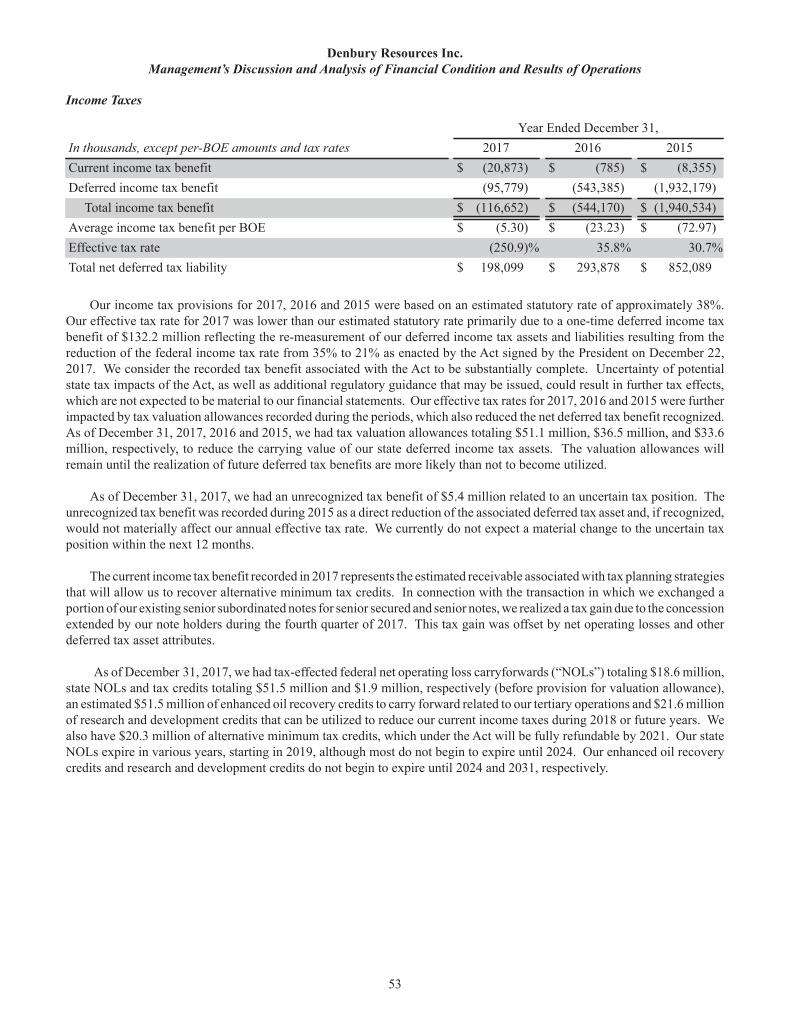
Denbury Resources Inc. Management’s Discussion and Analysis of Financial Condition and Results of Operations
53
Income Taxes
Year Ended December 31,In thousands, except per-BOE amounts and tax rates 2017 2016 2015Current income tax benefit $ (20,873) $ (785) $ (8,355)Deferred income tax benefit (95,779) (543,385) (1,932,179)
Total income tax benefit $ (116,652) $ (544,170) $ (1,940,534)Average income tax benefit per BOE $ (5.30) $ (23.23) $ (72.97)Effective tax rate (250.9)% 35.8% 30.7%Total net deferred tax liability $ 198,099 $ 293,878 $ 852,089
Our income tax provisions for 2017, 2016 and 2015 were based on an estimated statutory rate of approximately 38%. Our effective tax rate for 2017 was lower than our estimated statutory rate primarily due to a one-time deferred income tax benefit of $132.2 million reflecting the re-measurement of our deferred income tax assets and liabilities resulting from the reduction of the federal income tax rate from 35% to 21% as enacted by the Act signed by the President on December 22, 2017. We consider the recorded tax benefit associated with the Act to be substantially complete. Uncertainty of potential state tax impacts of the Act, as well as additional regulatory guidance that may be issued, could result in further tax effects, which are not expected to be material to our financial statements. Our effective tax rates for 2017, 2016 and 2015 were further impacted by tax valuation allowances recorded during the periods, which also reduced the net deferred tax benefit recognized. As of December 31, 2017, 2016 and 2015, we had tax valuation allowances totaling $51.1 million, $36.5 million, and $33.6 million, respectively, to reduce the carrying value of our state deferred income tax assets. The valuation allowances will remain until the realization of future deferred tax benefits are more likely than not to become utilized.
As of December 31, 2017, we had an unrecognized tax benefit of $5.4 million related to an uncertain tax position. The unrecognized tax benefit was recorded during 2015 as a direct reduction of the associated deferred tax asset and, if recognized, would not materially affect our annual effective tax rate. We currently do not expect a material change to the uncertain tax position within the next 12 months.
The current income tax benefit recorded in 2017 represents the estimated receivable associated with tax planning strategies that will allow us to recover alternative minimum tax credits. In connection with the transaction in which we exchanged a portion of our existing senior subordinated notes for senior secured and senior notes, we realized a tax gain due to the concession extended by our note holders during the fourth quarter of 2017. This tax gain was offset by net operating losses and other deferred tax asset attributes.
As of December 31, 2017, we had tax-effected federal net operating loss carryforwards (“NOLs”) totaling $18.6 million, state NOLs and tax credits totaling $51.5 million and $1.9 million, respectively (before provision for valuation allowance), an estimated $51.5 million of enhanced oil recovery credits to carry forward related to our tertiary operations and $21.6 million of research and development credits that can be utilized to reduce our current income taxes during 2018 or future years. We also have $20.3 million of alternative minimum tax credits, which under the Act will be fully refundable by 2021. Our state NOLs expire in various years, starting in 2019, although most do not begin to expire until 2024. Our enhanced oil recovery credits and research and development credits do not begin to expire until 2024 and 2031, respectively.
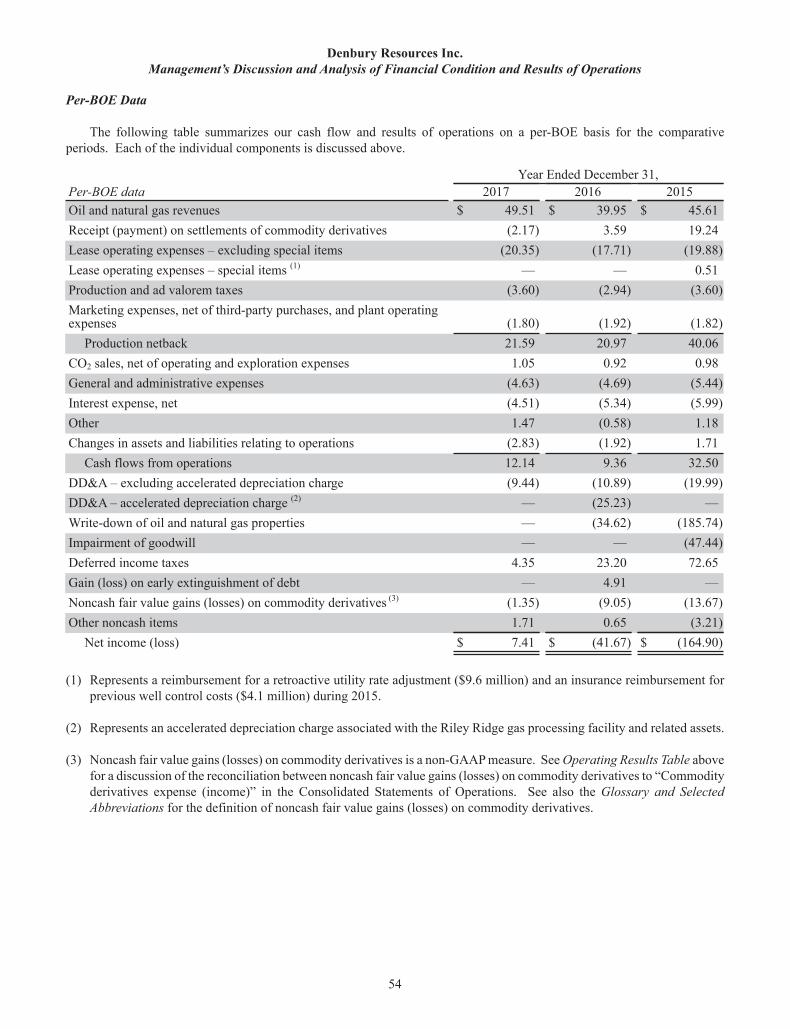
Denbury Resources Inc. Management’s Discussion and Analysis of Financial Condition and Results of Operations
54
Per-BOE Data
The following table summarizes our cash flow and results of operations on a per-BOE basis for the comparative periods. Each of the individual components is discussed above.
Year Ended December 31,Per-BOE data 2017 2016 2015Oil and natural gas revenues $ 49.51 $ 39.95 $ 45.61Receipt (payment) on settlements of commodity derivatives (2.17) 3.59 19.24Lease operating expenses – excluding special items (20.35) (17.71) (19.88)Lease operating expenses – special items (1) — — 0.51Production and ad valorem taxes (3.60) (2.94) (3.60)Marketing expenses, net of third-party purchases, and plant operatingexpenses (1.80) (1.92) (1.82)
Production netback 21.59 20.97 40.06CO2 sales, net of operating and exploration expenses 1.05 0.92 0.98General and administrative expenses (4.63) (4.69) (5.44)Interest expense, net (4.51) (5.34) (5.99)Other 1.47 (0.58) 1.18Changes in assets and liabilities relating to operations (2.83) (1.92) 1.71
Cash flows from operations 12.14 9.36 32.50DD&A – excluding accelerated depreciation charge (9.44) (10.89) (19.99)DD&A – accelerated depreciation charge (2) — (25.23) —Write-down of oil and natural gas properties — (34.62) (185.74)Impairment of goodwill — — (47.44)Deferred income taxes 4.35 23.20 72.65Gain (loss) on early extinguishment of debt — 4.91 —Noncash fair value gains (losses) on commodity derivatives (3) (1.35) (9.05) (13.67)Other noncash items 1.71 0.65 (3.21)
Net income (loss) $ 7.41 $ (41.67) $ (164.90)
(1) Represents a reimbursement for a retroactive utility rate adjustment ($9.6 million) and an insurance reimbursement for previous well control costs ($4.1 million) during 2015.
(2) Represents an accelerated depreciation charge associated with the Riley Ridge gas processing facility and related assets.
(3) Noncash fair value gains (losses) on commodity derivatives is a non-GAAP measure. See Operating Results Table above for a discussion of the reconciliation between noncash fair value gains (losses) on commodity derivatives to “Commodity derivatives expense (income)” in the Consolidated Statements of Operations. See also the Glossary and Selected Abbreviations for the definition of noncash fair value gains (losses) on commodity derivatives.
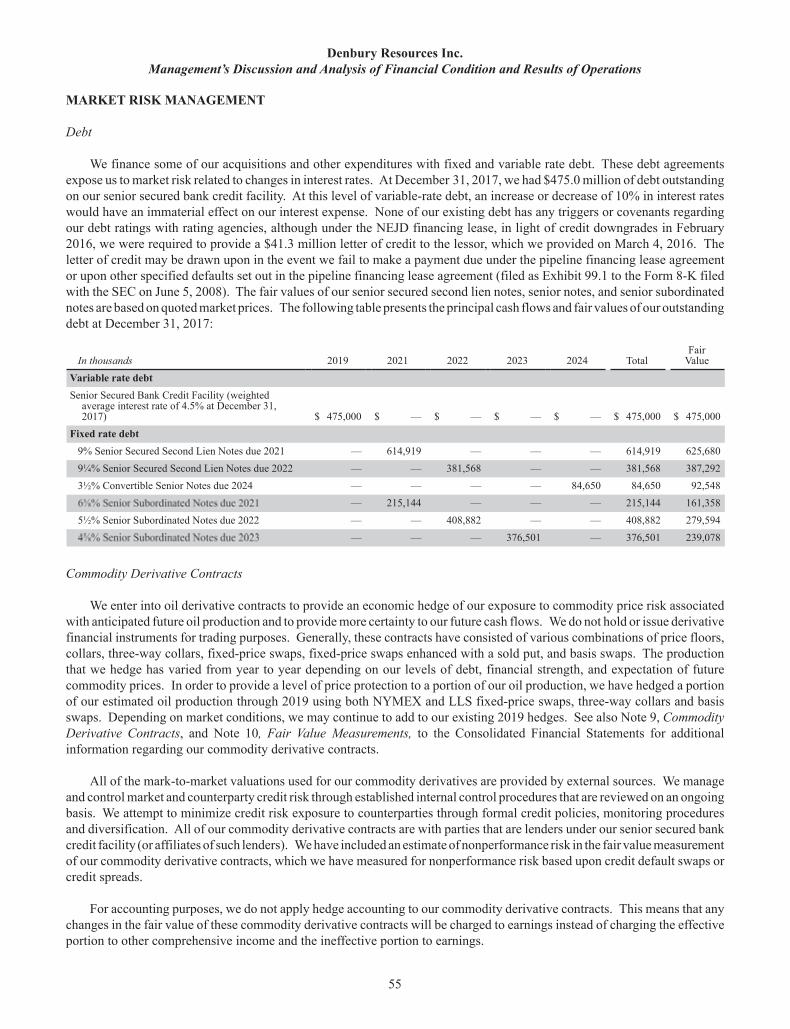
Denbury Resources Inc. Management’s Discussion and Analysis of Financial Condition and Results of Operations
55
MARKET RISK MANAGEMENT
Debt
We finance some of our acquisitions and other expenditures with fixed and variable rate debt. These debt agreements expose us to market risk related to changes in interest rates. At December 31, 2017, we had $475.0 million of debt outstanding on our senior secured bank credit facility. At this level of variable-rate debt, an increase or decrease of 10% in interest rates would have an immaterial effect on our interest expense. None of our existing debt has any triggers or covenants regarding our debt ratings with rating agencies, although under the NEJD financing lease, in light of credit downgrades in February 2016, we were required to provide a $41.3 million letter of credit to the lessor, which we provided on March 4, 2016. The letter of credit may be drawn upon in the event we fail to make a payment due under the pipeline financing lease agreement or upon other specified defaults set out in the pipeline financing lease agreement (filed as Exhibit 99.1 to the Form 8-K filed with the SEC on June 5, 2008). The fair values of our senior secured second lien notes, senior notes, and senior subordinated notes are based on quoted market prices. The following table presents the principal cash flows and fair values of our outstanding debt at December 31, 2017:
In thousands 2019 2021 2022 2023 2024 TotalFair
ValueVariable rate debt Senior Secured Bank Credit Facility (weighted
average interest rate of 4.5% at December 31,2017) $ 475,000 $ — $ — $ — $ — $ 475,000 $ 475,000
Fixed rate debt 9% Senior Secured Second Lien Notes due 2021 — 614,919 — — — 614,919 625,6809¼% Senior Secured Second Lien Notes due 2022 — — 381,568 — — 381,568 387,2923½% Convertible Senior Notes due 2024 — — — — 84,650 84,650 92,548
— 215,144 — — — 215,144 161,3585½% Senior Subordinated Notes due 2022 — — 408,882 — — 408,882 279,594
— — — 376,501 — 376,501 239,078
Commodity Derivative Contracts
We enter into oil derivative contracts to provide an economic hedge of our exposure to commodity price risk associated with anticipated future oil production and to provide more certainty to our future cash flows. We do not hold or issue derivative financial instruments for trading purposes. Generally, these contracts have consisted of various combinations of price floors, collars, three-way collars, fixed-price swaps, fixed-price swaps enhanced with a sold put, and basis swaps. The production that we hedge has varied from year to year depending on our levels of debt, financial strength, and expectation of future commodity prices. In order to provide a level of price protection to a portion of our oil production, we have hedged a portion of our estimated oil production through 2019 using both NYMEX and LLS fixed-price swaps, three-way collars and basis swaps. Depending on market conditions, we may continue to add to our existing 2019 hedges. See also Note 9, Commodity Derivative Contracts, and Note 10, Fair Value Measurements, to the Consolidated Financial Statements for additional information regarding our commodity derivative contracts.
All of the mark-to-market valuations used for our commodity derivatives are provided by external sources. We manage and control market and counterparty credit risk through established internal control procedures that are reviewed on an ongoing basis. We attempt to minimize credit risk exposure to counterparties through formal credit policies, monitoring procedures and diversification. All of our commodity derivative contracts are with parties that are lenders under our senior secured bank credit facility (or affiliates of such lenders). We have included an estimate of nonperformance risk in the fair value measurement of our commodity derivative contracts, which we have measured for nonperformance risk based upon credit default swaps or credit spreads.
For accounting purposes, we do not apply hedge accounting to our commodity derivative contracts. This means that any changes in the fair value of these commodity derivative contracts will be charged to earnings instead of charging the effective portion to other comprehensive income and the ineffective portion to earnings.
Denbury Resources Inc. Management’s Discussion and Analysis of Financial Condition and Results of Operations
56
At December 31, 2017, our commodity derivative contracts were recorded at their fair value, which was a net liabilityof $99.1 million, a $29.8 million increase from the $69.3 million net liability recorded at December 31, 2016. This change is primarily related to the expiration of commodity derivative contracts during 2017, new commodity derivative contracts entered into during 2017 for future periods, and changes in oil futures prices between December 31, 2016 and 2017.
Commodity Derivative Sensitivity Analysis
Based on NYMEX and LLS crude oil futures prices as of December 31, 2017, and assuming both a 10% increase and decrease thereon, we would expect to make payments on our crude oil derivative contracts as shown in the following table:
In thousands Payment
Based on: Futures prices as of December 31, 2017 $ (95,319)
10% increase in prices (185,281)10% decrease in prices (10,497)
Our commodity derivative contracts are used as an economic hedge of our exposure to commodity price risk associated with anticipated future production. As a result, changes in receipts or payments of our commodity derivative contracts due to changes in commodity prices as reflected in the above table would be mostly offset by a corresponding increase or decrease in the cash receipts on sales of our oil and natural gas production to which those commodity derivative contracts relate.
CRITICAL ACCOUNTING POLICIES AND ESTIMATES
The preparation of financial statements in accordance with generally accepted accounting principles requires that we select certain accounting policies and make certain estimates and judgments regarding the application of those policies. Our significant accounting policies are included in Note 1, Significant Accounting Policies, to the Consolidated Financial Statements. These policies, along with the underlying assumptions and judgments by our management in their application, have a significant impact on our consolidated financial statements. Following is a discussion of our most critical accounting estimates, judgments and uncertainties that are inherent in the preparation of our financial statements.
Full Cost Method of Accounting, Depletion and Depreciation and Oil and Natural Gas Properties
Businesses involved in the production of oil and natural gas are required to follow accounting rules that are unique to the oil and gas industry. We apply the full cost method of accounting for our oil and natural gas properties. Another acceptable method of accounting for oil and natural gas production activities is the successful efforts method of accounting. In general, the primary differences between the two methods are related to the capitalization of costs and the evaluation for asset impairment. Under the full cost method, all geological and geophysical costs, exploratory dry holes and delay rentals are capitalized to the full cost pool, whereas under the successful efforts method such costs are expensed as incurred. In the assessment of impairment of oil and natural gas properties, the successful efforts method follows the Accounting for the Impairment or Disposal of Long-Lived Assets topic of the FASC, under which the net book value of assets is measured for impairment against the undiscounted future cash flows using commodity prices consistent with management expectations. Under the full cost method, the full cost pool (net book value of oil and natural gas properties) is measured against future cash flows discounted at 10% using the average first-day-of-the-month oil and natural gas price for each month during a 12-month rolling period through the end of each quarterly reporting period. The financial results for a given period could be substantially different depending on the method of accounting that an oil and gas entity applies. Further, we do not designate our oil and natural gas derivative contracts as hedging instruments for accounting purposes under the Derivatives and Hedging topic of the FASC (see below), and as a result, these contracts are not considered in the full cost ceiling test.
We make significant estimates at the end of each period related to accruals for oil and natural gas revenues, production, capitalized costs and operating expenses. We calculate these estimates with our best available data, which includes, among other things, production reports, price posting, information compiled from daily drilling reports and other internal tracking devices, and analysis of historical results and trends. While management is not aware of any required revisions to its estimates, there will likely be future adjustments resulting from such things as revisions in estimated oil and natural gas volumes, changes
Denbury Resources Inc. Management’s Discussion and Analysis of Financial Condition and Results of Operations
57
in ownership interests, payouts, joint venture audits, re-allocations by the purchasers or pipelines, or other corrections and adjustments common in the oil and gas industry, many of which will require retroactive application. These types of adjustments cannot be currently estimated or determined and will be recorded in the period during which the adjustment occurs.
Under full cost accounting, the estimated quantities of proved oil and natural gas reserves used to compute depletion and the related present value of estimated future net cash flows therefrom used to perform the full cost ceiling test have a significant impact on the underlying financial statements. The process of estimating oil and natural gas reserves is very complex, requiring significant decisions in the evaluation of all available geological, geophysical, engineering and economic data. The data for a given field may also change substantially over time as a result of numerous factors, including additional development activity, evolving production history and continued reassessment of the viability of production under varying economic conditions. As a result, material revisions to existing reserve estimates may occur from time to time. Although every reasonable effort is made to ensure the reported reserve estimates represent the most accurate assessments possible, including the hiring of independent engineers to prepare reported estimates, the subjective decisions and variances in available data for various fields make these estimates generally less precise than other estimates included in our financial statement disclosures. Over the last four years, annual revisions to our reserve estimates, excluding any revisions related to changes in commodity prices, have averaged approximately 1.6% of the previous year’s estimates and have been both positive and negative.
Changes in commodity prices also affect our reserve quantities. These changes in quantities affect our DD&A rate, and the combined effect of changes in quantities and commodity prices impacts our full cost ceiling test calculation. For example, we estimate that a 5% increase in our estimate of proved reserve quantities would have lowered our fourth quarter 2017 DD&A rate from $5.66 per BOE to approximately $5.42 per BOE, and a 5% decrease in our proved reserve quantities would have increased our DD&A rate to approximately $5.92 per BOE. Also, reserve quantities and their ultimate values, determined solely by our lenders, are the primary factors in determining the maximum borrowing base under our senior secured bank credit facility, particularly quantities and values of our proved developed producing reserves.
Under full cost accounting rules, we are required each quarter to perform a ceiling test calculation. The net capitalized costs of oil and natural gas properties are limited to the lower of unamortized cost or the cost center ceiling. The cost center ceiling is defined as (1) the present value of estimated future net revenues from proved oil and natural gas reserves before future abandonment costs (discounted at 10%), based on the average first-day-of-the-month oil and natural gas price for each month during a 12-month rolling period prior to the end of a particular reporting period; plus (2) the cost of properties not being amortized; plus (3) the lower of cost or estimated fair value of unproved properties included in the costs being amortized, if any; less (4) related income tax effects. Our future net revenues from proved oil and natural gas reserves are not reduced for development costs related to the cost of drilling for and developing CO2 reserves nor those related to the cost of constructing CO2 pipelines, as we do not have to incur additional costs to develop the proved oil and natural gas reserves. Therefore, we include in the ceiling test, as a reduction of future net revenues, that portion of our capitalized CO2 costs related to CO2 reserves and CO2 pipelines that we estimate will be consumed in the process of producing our proved oil and natural gas reserves. The fair value of our oil and natural gas derivative contracts is not included in the ceiling test, as we do not designate these contracts as hedging instruments for accounting purposes. The cost center ceiling test is prepared quarterly.
The average first-day-of-the-month NYMEX oil price used in estimating our proved reserves declined throughout 2015 and 2016 and led to our recognizing full cost pool ceiling test write-downs totaling $810.9 million and $4.9 billion during 2016 and 2015, respectively. We did not record any ceiling test write-down during 2017.
We exclude certain unevaluated costs from the amortization base and full cost ceiling test pending the determination of whether proved reserves can be assigned to such properties. These costs are transferred to the full cost amortization base in the course of these properties being developed, tested and evaluated. At least annually, we test these assets for impairment based on an evaluation of management’s expectations of future pricing, evaluation of lease expiration terms, and planned project development activities. As a result of this analysis, we recognized impairments of $21.4 million, $21.0 million and $17.9 million of our unevaluated costs during the years ended December 31, 2017, 2016 and 2015, respectively, whereby these costs were transferred to the full cost amortization base.
Denbury Resources Inc. Management’s Discussion and Analysis of Financial Condition and Results of Operations
58
Tertiary Injection Costs
Our tertiary operations are conducted in reservoirs that have already produced significant amounts of oil over many years; however, in accordance with the rules for recording proved reserves, we cannot recognize proved reserves associated with enhanced recovery techniques such as CO2 injection until we can demonstrate production resulting from the tertiary process or unless the field is analogous to an existing flood. Our costs associated with the CO2 we produce (or acquire) and inject are principally our cash out-of-pocket costs of production, transportation and acquisition, and to pay royalties.
We capitalize, as a development cost, injection costs in fields that are in their development stage, which means we have not yet seen incremental oil production due to the CO2 injections (i.e., a production response). These capitalized development costs will be included in our unevaluated property costs if there are not already proved tertiary reserves in that field. After we see a production response to the CO2 injections (i.e., the production stage), injection costs will be expensed as incurred, and any previously deferred unevaluated development costs will become subject to depletion upon recognition of proved tertiary reserves. During 2017, 2016 and 2015, we capitalized $25.0 million, $17.3 million and $19.4 million, respectively, of tertiary injection costs associated with our tertiary projects.
Income Taxes
We make certain estimates and judgments in determining our income tax expense for financial reporting purposes. These estimates and judgments occur in the calculation of certain tax assets and liabilities that arise from differences in the timing and recognition of revenue and expense for tax and financial reporting purposes. Our federal and state income tax returns are generally not prepared or filed before the consolidated financial statements are prepared; therefore, we estimate the tax basis of our assets and liabilities at the end of each period as well as the effects of tax rate changes, tax credits and net operating loss carryforwards. Adjustments related to these estimates are recorded in our tax provision in the period in which we finalize our income tax returns. Further, we must assess the likelihood that we will be able to recover or utilize our deferred tax assets (primarily our enhanced oil recovery credits and state loss carryforwards). If recovery is not likely, we must record a valuation allowance against such deferred tax assets for the amount we would not expect to recover, which would result in an increase to our income tax expense. As of December 31, 2017, 2016 and 2015, we had tax valuation allowances totaling $51.1 million, $36.5 million, and $33.6 million, respectively, to reduce the carrying value of our state deferred income tax assets. The valuation allowances will remain until the realization of future deferred tax benefits are more likely than not to become utilized. A 1% increase in our statutory tax rate would have increased our calculated income tax expense (benefit) by approximately $0.5 million, ($15.2 million) and ($63.3 million) for the years ended December 31, 2017, 2016 and 2015, respectively. See Note 6, Income Taxes, to the Consolidated Financial Statements and Results of Operations – Income Taxesabove for further information concerning our income taxes.
Fair Value Estimates
The FASC defines fair value, establishes a framework for measuring fair value and expands disclosures about fair value measurements. It does not require us to make any new fair value measurements, but rather establishes a fair value hierarchy that prioritizes the inputs to the valuation techniques used to measure fair value. Level 1 inputs are given the highest priority in the fair value hierarchy, as they represent observable inputs that reflect unadjusted quoted prices for identical assets or liabilities in active markets as of the reporting date, while Level 3 inputs are given the lowest priority, as they represent unobservable inputs that are not corroborated by market data. Valuation techniques that maximize the use of observable inputs are favored. See Note 10, Fair Value Measurements, to the Consolidated Financial Statements for disclosures regarding our recurring fair value measurements.
Significant uses of fair value measurements include:
• assessment of impairment of long-lived assets; and• recorded value of commodity derivative instruments.
Denbury Resources Inc. Management’s Discussion and Analysis of Financial Condition and Results of Operations
59
Impairment Assessment of Long-Lived Assets
We test long-lived assets for impairment that are not subject to our quarterly full cost pool ceiling test, including a portion of our capitalized CO2 properties and pipelines, whenever events or changes in circumstances indicate that the carrying value may not be recoverable. The factors we assess to determine if a long-lived asset impairment test is necessary include, among other factors, a significant adverse change in the business climate that could affect the value of a long-lived asset, a significant decrease in the market price of an asset group, a significant adverse change in the extent or manner in which a long-lived asset (asset group) is being used or in its physical condition, or a current-period operating or cash flow loss combined with a history of operating or cash flow losses or a projection or forecast that demonstrates continuing losses associated with the use of a long-lived asset (asset group).
We perform our long-lived asset impairment test by comparing the net carrying costs of our long-lived asset groups to the respective expected future undiscounted net cash flows that are supported by these long-lived assets which include production of our probable and possible oil and natural gas reserves. If the undiscounted net cash flows are below the net carrying costs for an asset group, we must record an impairment loss by the amount, if any, that net carrying costs exceed the fair value of the long-lived asset group. Management assumptions impacting expected future undiscounted net cash flows include market estimates of future commodity prices, projections of estimated reserve quantities, projections of future rates of production, timing and amount of future development and operating costs, projected availability and cost of CO2, projected recovery factors of tertiary reserves and risk-adjustment factors applied to the net cash flows. We did not record an impairment of long-lived assets during the year ended December 31, 2017.
Commodity Derivative Contracts
Historically, we have entered into oil and natural gas derivative contracts to provide an economic hedge of our exposure to commodity price risk associated with anticipated future oil and natural gas production and to provide more certainty to our future cash flows. We do not hold or issue derivative financial instruments for trading purposes. Generally, these contracts have consisted of various combinations of price floors, collars, three-way collars, fixed-price swaps, fixed-price swaps enhanced with a sold put, and basis swaps. Our derivative financial instruments are recorded on the balance sheet as either an asset or liability measured at fair value. The valuation methods used to measure the fair values of these assets and liabilities require considerable management judgment and estimates to derive the inputs necessary to determine fair value estimates, such as forward prices for commodities, interest rates, volatility factors and credit worthiness, as well as other relevant economic measures. We do not apply hedge accounting to our commodity derivative contracts under the FASC Derivatives and Hedgingtopic; accordingly, changes in the fair value of these instruments are recognized in earnings instead of charging the effective portion to other comprehensive income and the ineffective portion to earnings. While we may experience more volatility in our net income (loss) than if we were to apply hedge accounting treatment as permitted by the FASC Derivatives and Hedgingtopic, we believe that for us, the benefits associated with applying hedge accounting do not outweigh the cost, time and effort to comply with hedge accounting.
Environmental and Litigation Contingencies
The Company makes judgments and estimates in recording liabilities for contingencies such as environmental remediation or ongoing litigation. Liabilities are recorded when it is both probable that a loss has been incurred and such loss is reasonably estimable. Assessments of liabilities are based on information obtained from independent and in-house experts, loss experience in similar situations, actual costs incurred, and other case-by-case factors. Actual costs can vary from such estimates for a variety of reasons. The costs of environmental remediation or litigation can vary from estimates due to new developments regarding the facts and circumstances of each event, including in the case of environmental remediation, the timing of remediation, our understanding of the environmental impact, remediation methods available, and regulatory requirements, and in the case of litigation, differing interpretations of laws and facts and assessments of damages asserted and/or incurred.
Use of Estimates
See Note 1, Significant Accounting Policies, to the Consolidated Financial Statements for a discussion of our use of estimates.
Denbury Resources Inc. Management’s Discussion and Analysis of Financial Condition and Results of Operations
60
Recent Accounting Pronouncements
See Note 1, Significant Accounting Policies, to the Consolidated Financial Statements for a discussion of recent accounting pronouncements.
FORWARD-LOOKING INFORMATION
The data and/or statements contained in this Annual Report on Form 10-K that are not historical facts, including, but not limited to, statements found in the sections entitled “Business and Properties” and “Management’s Discussion and Analysis of Financial Condition and Results of Operations,” are forward-looking statements, as that term is defined in Section 21E of the Securities Exchange Act of 1934, as amended (the “Exchange Act”), that involve a number of risks and uncertainties. Such forward-looking statements may be or may concern, among other things, financial forecasts, future hydrocarbon prices and timing, the degree and length of any price recovery for oil, current or future liquidity sources or their adequacy to support our anticipated future activities, our ability to further reduce our debt levels, possible future write-downs of oil and natural gas reserves, together with assumptions based on current and projected oil and gas prices and oilfield costs, current or future expectations or estimations of our cash flows or the impact of changes in commodity prices on cash flows, availability of capital, borrowing capacity, availability of advantageous commodity derivative contracts or the predicted cash flow benefits therefrom, forecasted capital expenditures, drilling activity or methods, including the timing and location thereof, nature of any future proposed asset sales or dispositions or the timing or proceeds thereof, estimated timing of commencement of CO2 flooding of particular fields or areas, timing of CO2 injections and initial production responses in tertiary flooding projects, development activities, finding costs, anticipated future cost savings, capital budgets, interpretation or prediction of formation details, production rates and volumes or forecasts thereof, hydrocarbon reserve quantities and values, CO2 reserves and supply and their availability, potential reserves, barrels or percentages of recoverable original oil in place, potential increases in worldwide tariffs or other trade restrictions, the likelihood, timing and impact of increased interest rates, the impact of regulatory rulings or changes, anticipated outcomes of pending litigation, prospective legislation affecting the oil and gas industry, environmental regulations, mark-to-market values, competition, long-term forecasts of production, rates of return, estimated costs, changes in costs, future capital expenditures and overall economics, worldwide economic conditions and other variables surrounding our estimated original oil in place, operations and future plans. Such forward-looking statements generally are accompanied by words such as “plan,” “estimate,” “expect,” “predict,” “forecast,” “to our knowledge,” “anticipate,” “projected,” “preliminary,” “should,” “assume,” “believe,” “may” or other words that convey, or are intended to convey, the uncertainty of future events or outcomes. Such forward-looking information is based upon management’s current plans, expectations, estimates, and assumptions and is subject to a number of risks and uncertainties that could significantly and adversely affect current plans, anticipated actions, the timing of such actions and our financial condition and results of operations. As a consequence, actual results may differ materially from expectations, estimates or assumptions expressed in or implied by any forward-looking statements made by us or on our behalf. Among the factors that could cause actual results to differ materially are fluctuations in worldwide oil prices or in U.S. oil prices and consequently in the prices received or demand for our oil and natural gas; decisions as to production levels and/or pricing by OPEC or production levels by U.S. shale producers in future periods; levels of future capital expenditures; effects of our indebtedness; success of our risk management techniques; accuracy of our cost estimates; availability of credit in the commercial banking market; fluctuations in the prices of goods and services; the uncertainty of drilling results and reserve estimates; operating hazards and remediation costs; disruption of operations and damages from well incidents, hurricanes, tropical storms, forest fires, or other natural occurrences; acquisition risks; requirements for capital or its availability; conditions in the worldwide financial, trade and credit markets; general economic conditions; competition; government regulations, including changes in tax or environmental laws or regulations; and unexpected delays, as well as the risks and uncertainties inherent in oil and gas drilling and production activities or that are otherwise discussed in this annual report, including, without limitation, the portions referenced above, and the uncertainties set forth from time to time in our other public reports, filings and public statements.
Denbury Resources Inc.
61
Item 7A. Quantitative and Qualitative Disclosures About Market Risk
The information required by Item 7A is set forth under Market Risk Management in Item 7, Management’s Discussion and Analysis of Financial Condition and Results of Operations.
Item 8. Financial Statements and Supplementary Information
Page Report of Independent Registered Public Accounting FirmConsolidated Balance SheetsConsolidated Statements of OperationsConsolidated Statements of Comprehensive OperationsConsolidated Statements of Cash FlowsConsolidated Statements of Changes in Stockholders’ EquityNotes to Consolidated Financial Statements 1. Significant Accounting Policies2. Asset Acquisition and Assets Held for Sale3. Asset Retirement Obligations4. Property and Equipment5. Long-Term Debt6. Income Taxes7. Stockholders’ Equity8. Stock Compensation9. Commodity Derivative Contracts10. Fair Value Measurements11. Commitments and Contingencies12. Supplemental Cash Flow InformationSupplemental Oil and Natural Gas Disclosures (Unaudited)Supplemental CO2 Disclosures (Unaudited)Unaudited Quarterly Information
626465666768
69767677788386868990929596
100101
62
Report of Independent Registered Public Accounting Firm
To the Board of Directors and Stockholders of Denbury Resources Inc.:
Opinions on the Financial Statements and Internal Control over Financial Reporting
We have audited the accompanying consolidated balance sheets of Denbury Resources Inc. and its subsidiaries as of December 31, 2017 and 2016, and the related consolidated statements of operations, comprehensive operations, changes in stockholders’ equity and cash flows for each of the three years in the period ended December 31, 2017, including the related notes (collectively referred to as the “consolidated financial statements”). We also have audited the Company's internal control over financial reporting as of December 31, 2017, based on criteria established in Internal Control - Integrated Framework (2013) issued by the Committee of Sponsoring Organizations of the Treadway Commission (COSO).
In our opinion, the consolidated financial statements referred to above present fairly, in all material respects, the financial position of the Company as of December 31, 2017 and 2016, and the results of their operations and their cash flows for each of the three years in the period ended December 31, 2017 in conformity with accounting principles generally accepted in the United States of America. Also in our opinion, the Company maintained, in all material respects, effective internal control over financial reporting as of December 31, 2017, based on criteria established in Internal Control - Integrated Framework (2013) issued by the COSO.
Basis for Opinions
The Company's management is responsible for these consolidated financial statements, for maintaining effective internal control over financial reporting, and for its assessment of the effectiveness of internal control over financial reporting, included in Management's Report on Internal Control over Financial Reporting appearing under Item 9A. Our responsibility is to express opinions on the Company’s consolidated financial statements and on the Company's internal control over financial reporting based on our audits. We are a public accounting firm registered with the Public Company Accounting Oversight Board (United States) ("PCAOB") and are required to be independent with respect to the Company in accordance with the U.S. federal securities laws and the applicable rules and regulations of the Securities and Exchange Commission and the PCAOB.
We conducted our audits in accordance with the standards of the PCAOB. Those standards require that we plan and perform the audits to obtain reasonable assurance about whether the consolidated financial statements are free of material misstatement, whether due to error or fraud, and whether effective internal control over financial reporting was maintained in all material respects.
Our audits of the consolidated financial statements included performing procedures to assess the risks of material misstatement of the consolidated financial statements, whether due to error or fraud, and performing procedures that respond to those risks. Such procedures included examining, on a test basis, evidence regarding the amounts and disclosures in the consolidated financial statements. Our audits also included evaluating the accounting principles used and significant estimates made by management, as well as evaluating the overall presentation of the consolidated financial statements. Our audit of internal control over financial reporting included obtaining an understanding of internal control over financial reporting, assessing the risk that a material weakness exists, and testing and evaluating the design and operating effectiveness of internal control based on the assessed risk. Our audits also included performing such other procedures as we considered necessary in the circumstances. We believe that our audits provide a reasonable basis for our opinions.
Definition and Limitations of Internal Control over Financial Reporting
A company’s internal control over financial reporting is a process designed to provide reasonable assurance regarding the reliability of financial reporting and the preparation of financial statements for external purposes in accordance with generally accepted accounting principles. A company’s internal control over financial reporting includes those policies and procedures that (i) pertain to the maintenance of records that, in reasonable detail, accurately and fairly reflect the transactions and dispositions of the assets of the company; (ii) provide reasonable assurance that transactions are recorded as necessary to permit preparation of financial statements in accordance with generally accepted accounting principles, and that receipts and expenditures of the company are being made only in accordance with authorizations of management and directors of the
63
company; and (iii) provide reasonable assurance regarding prevention or timely detection of unauthorized acquisition, use, or disposition of the company’s assets that could have a material effect on the financial statements.
Because of its inherent limitations, internal control over financial reporting may not prevent or detect misstatements. Also, projections of any evaluation of effectiveness to future periods are subject to the risk that controls may become inadequate because of changes in conditions, or that the degree of compliance with the policies or procedures may deteriorate.
/s/ PricewaterhouseCoopers LLPDallas, TexasFebruary 28, 2018
We have served as the Company’s auditor since 2004.
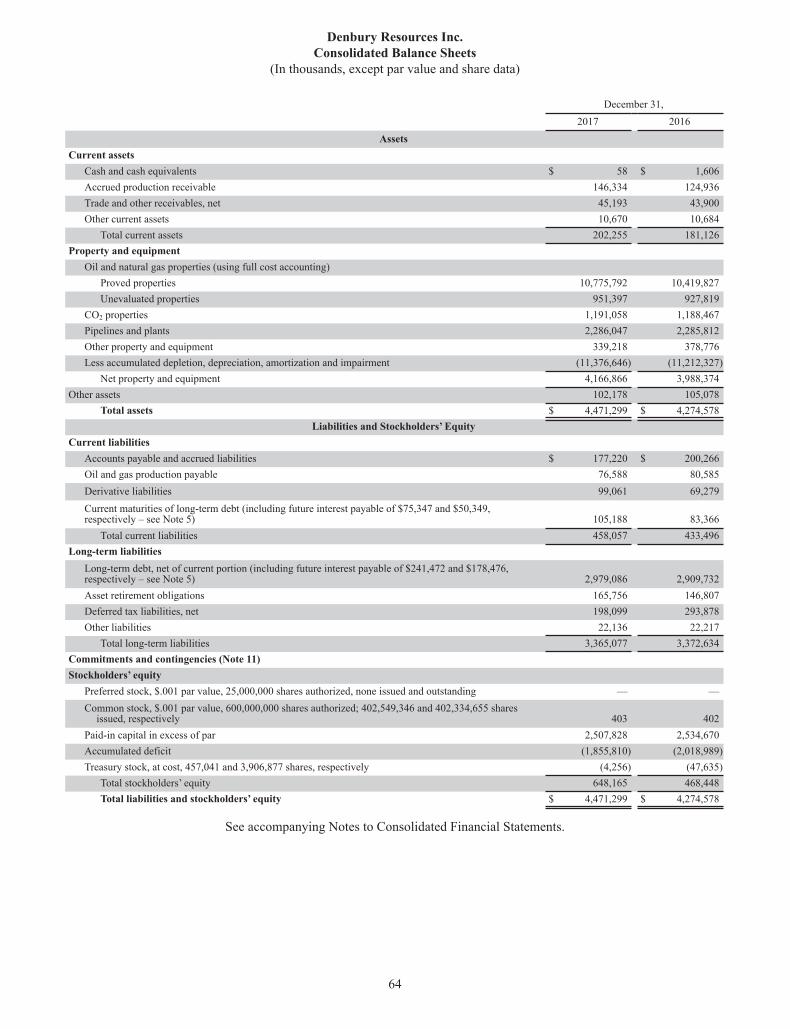
Denbury Resources Inc.Consolidated Balance Sheets
(In thousands, except par value and share data)
64
December 31, 2017 2016
AssetsCurrent assets
Cash and cash equivalents $ 58 $ 1,606Accrued production receivable 146,334 124,936Trade and other receivables, net 45,193 43,900Other current assets 10,670 10,684
Total current assets 202,255 181,126Property and equipment
Oil and natural gas properties (using full cost accounting) Proved properties 10,775,792 10,419,827Unevaluated properties 951,397 927,819
CO2 properties 1,191,058 1,188,467Pipelines and plants 2,286,047 2,285,812Other property and equipment 339,218 378,776Less accumulated depletion, depreciation, amortization and impairment (11,376,646) (11,212,327)
Net property and equipment 4,166,866 3,988,374Other assets 102,178 105,078
Total assets $ 4,471,299 $ 4,274,578Liabilities and Stockholders’ Equity
Current liabilities Accounts payable and accrued liabilities $ 177,220 $ 200,266Oil and gas production payable 76,588 80,585Derivative liabilities 99,061 69,279Current maturities of long-term debt (including future interest payable of $75,347 and $50,349,respectively – see Note 5) 105,188 83,366
Total current liabilities 458,057 433,496Long-term liabilities
Long-term debt, net of current portion (including future interest payable of $241,472 and $178,476,respectively – see Note 5) 2,979,086 2,909,732Asset retirement obligations 165,756 146,807Deferred tax liabilities, net 198,099 293,878Other liabilities 22,136 22,217
Total long-term liabilities 3,365,077 3,372,634Commitments and contingencies (Note 11)Stockholders’ equity
Preferred stock, $.001 par value, 25,000,000 shares authorized, none issued and outstanding — —Common stock, $.001 par value, 600,000,000 shares authorized; 402,549,346 and 402,334,655 shares
issued, respectively 403 402Paid-in capital in excess of par 2,507,828 2,534,670Accumulated deficit (1,855,810) (2,018,989)Treasury stock, at cost, 457,041 and 3,906,877 shares, respectively (4,256) (47,635)
Total stockholders’ equity 648,165 468,448Total liabilities and stockholders’ equity $ 4,471,299 $ 4,274,578
See accompanying Notes to Consolidated Financial Statements.
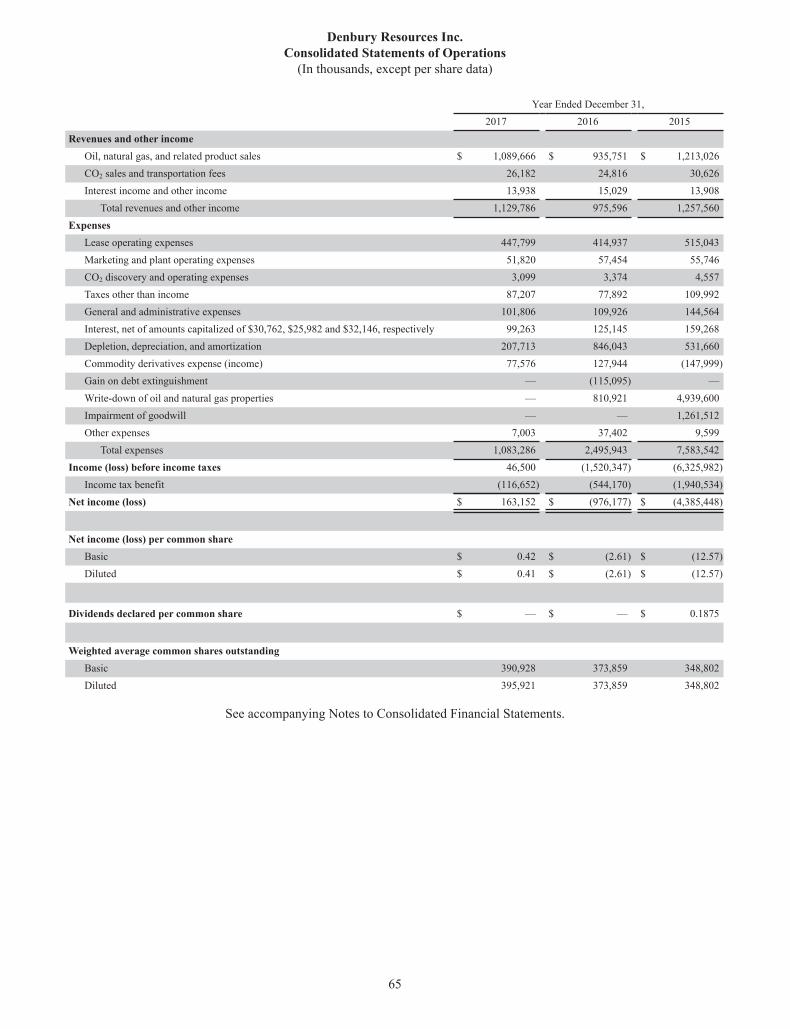
Denbury Resources Inc.Consolidated Statements of Operations
(In thousands, except per share data)
65
Year Ended December 31, 2017 2016 2015Revenues and other income
Oil, natural gas, and related product sales $ 1,089,666 $ 935,751 $ 1,213,026CO2 sales and transportation fees 26,182 24,816 30,626Interest income and other income 13,938 15,029 13,908
Total revenues and other income 1,129,786 975,596 1,257,560Expenses
Lease operating expenses 447,799 414,937 515,043Marketing and plant operating expenses 51,820 57,454 55,746CO2 discovery and operating expenses 3,099 3,374 4,557Taxes other than income 87,207 77,892 109,992General and administrative expenses 101,806 109,926 144,564Interest, net of amounts capitalized of $30,762, $25,982 and $32,146, respectively 99,263 125,145 159,268Depletion, depreciation, and amortization 207,713 846,043 531,660Commodity derivatives expense (income) 77,576 127,944 (147,999)Gain on debt extinguishment — (115,095) —Write-down of oil and natural gas properties — 810,921 4,939,600Impairment of goodwill — — 1,261,512Other expenses 7,003 37,402 9,599
Total expenses 1,083,286 2,495,943 7,583,542Income (loss) before income taxes 46,500 (1,520,347) (6,325,982)
Income tax benefit (116,652) (544,170) (1,940,534)Net income (loss) $ 163,152 $ (976,177) $ (4,385,448)
Net income (loss) per common shareBasic $ 0.42 $ (2.61) $ (12.57)Diluted $ 0.41 $ (2.61) $ (12.57)
Dividends declared per common share $ — $ — $ 0.1875
Weighted average common shares outstanding Basic 390,928 373,859 348,802Diluted 395,921 373,859 348,802
See accompanying Notes to Consolidated Financial Statements.
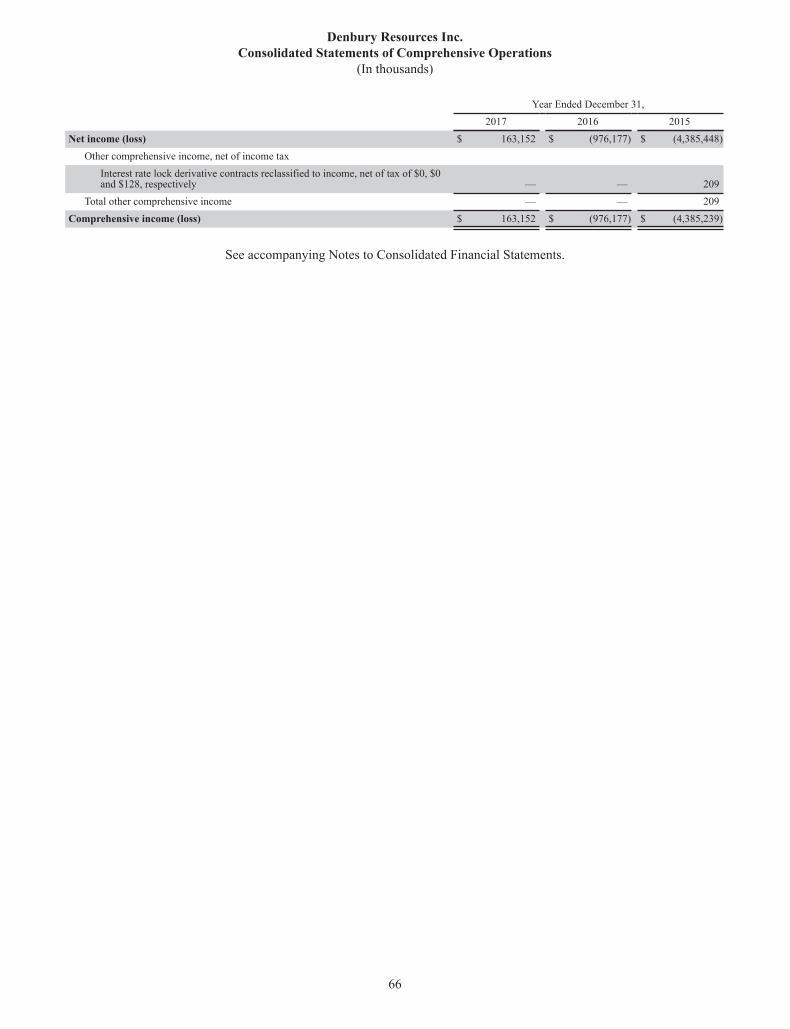
Denbury Resources Inc.Consolidated Statements of Comprehensive Operations
(In thousands)
66
Year Ended December 31, 2017 2016 2015Net income (loss) $ 163,152 $ (976,177) $ (4,385,448)
Other comprehensive income, net of income tax Interest rate lock derivative contracts reclassified to income, net of tax of $0, $0and $128, respectively — — 209
Total other comprehensive income — — 209Comprehensive income (loss) $ 163,152 $ (976,177) $ (4,385,239)
See accompanying Notes to Consolidated Financial Statements.

Denbury Resources Inc.Consolidated Statements of Cash Flows
(In thousands)
67
Year Ended December 31, 2017 2016 2015Cash flows from operating activities
Net income (loss) $ 163,152 $ (976,177) $ (4,385,448)Adjustments to reconcile net income (loss) to cash flows from operating activities
Depletion, depreciation, and amortization 207,713 846,043 531,660Write-down of oil and natural gas properties — 810,921 4,939,600Impairment of goodwill — — 1,261,512Deferred income taxes (95,779) (543,385) (1,932,179)Stock-based compensation 15,154 14,995 30,604Commodity derivatives expense (income) 77,576 127,944 (147,999)Receipt (payment) on settlements of commodity derivatives (47,795) 84,181 511,699Gain on debt extinguishment — (115,095) —Debt issuance costs and discounts 6,191 17,006 9,121Other, net 3,112 (2,161) 343
Changes in assets and liabilities, net of effects from acquisitions Accrued production receivable (21,398) (24,290) 81,213Trade and other receivables (4,421) 35,923 67,047Other current and long-term assets (1,722) (8,661) 241Accounts payable and accrued liabilities (24,710) (34,240) (55,234)Oil and natural gas production payable (3,997) (6,752) (40,833)Other liabilities (5,933) (7,029) (7,043)
Net cash provided by operating activities 267,143 219,223 864,304
Cash flows from investing activities Oil and natural gas capital expenditures (262,867) (243,027) (476,398)Acquisitions of oil and natural gas properties (88,886) (1,310) (21,876)CO2 capital expenditures (2,159) (2,321) (26,301)Pipelines and plants capital expenditures (2,540) (2,666) (31,728)Net proceeds from sales of oil and natural gas properties and equipment 1,696 47,725 563Other (2,548) (3,818) 5,555
Net cash used in investing activities (357,304) (205,417) (550,185)
Cash flows from financing activities Bank repayments (1,589,000) (1,730,500) (1,862,000)Bank borrowings 1,763,000 1,856,500 1,642,000Interest payments on senior secured notes treated as a reduction of debt (50,349) (25,835) —Repayment or repurchases of senior subordinated notes (2,503) (76,708) (485)Pipeline financing and capital lease debt repayments (27,462) (28,849) (33,642)Cash dividends paid (275) (486) (65,426)Other (4,798) (9,134) (14,907)
Net cash provided by (used in) financing activities 88,613 (15,012) (334,460)Net decrease in cash and cash equivalents (1,548) (1,206) (20,341)Cash and cash equivalents at beginning of year 1,606 2,812 23,153Cash and cash equivalents at end of year $ 58 $ 1,606 $ 2,812
See accompanying Notes to Consolidated Financial Statements.
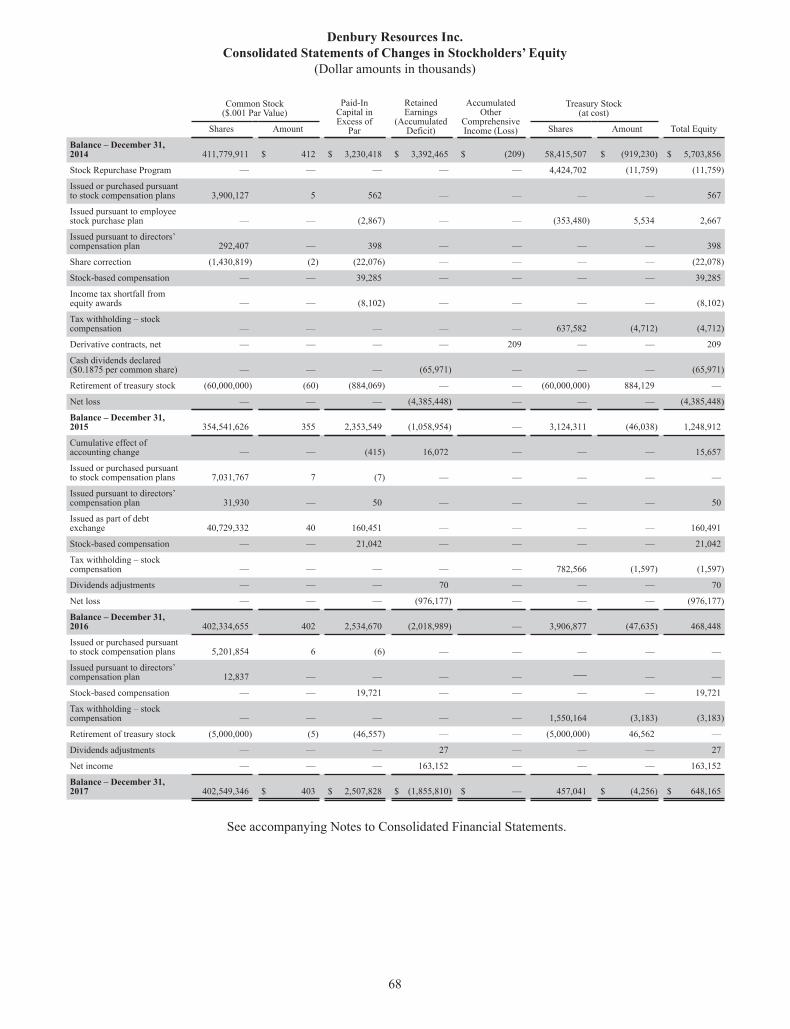
Denbury Resources Inc.Consolidated Statements of Changes in Stockholders’ Equity
(Dollar amounts in thousands)
68
Common Stock($.001 Par Value)
Paid-InCapital inExcess of
Par
RetainedEarnings
(Accumulated Deficit)
AccumulatedOther
ComprehensiveIncome (Loss)
Treasury Stock(at cost)
Total EquityShares Amount Shares Amount
Balance – December 31,2014 411,779,911 $ 412 $ 3,230,418 $ 3,392,465 $ (209) 58,415,507 $ (919,230) $ 5,703,856
Stock Repurchase Program — — — — — 4,424,702 (11,759) (11,759)
Issued or purchased pursuantto stock compensation plans 3,900,127 5 562 — — — — 567
Issued pursuant to employeestock purchase plan — — (2,867) — — (353,480) 5,534 2,667
Issued pursuant to directors’compensation plan 292,407 — 398 — — — — 398
Share correction (1,430,819) (2) (22,076) — — — — (22,078)
Stock-based compensation — — 39,285 — — — — 39,285
Income tax shortfall fromequity awards — — (8,102) — — — — (8,102)
Tax withholding – stockcompensation — — — — — 637,582 (4,712) (4,712)
Derivative contracts, net — — — — 209 — — 209
Cash dividends declared($0.1875 per common share) — — — (65,971) — — — (65,971)
Retirement of treasury stock (60,000,000) (60) (884,069) — — (60,000,000) 884,129 —
Net loss — — — (4,385,448) — — — (4,385,448)
Balance – December 31,2015 354,541,626 355 2,353,549 (1,058,954) — 3,124,311 (46,038) 1,248,912
Cumulative effect ofaccounting change — — (415) 16,072 — — — 15,657
Issued or purchased pursuantto stock compensation plans 7,031,767 7 (7) — — — — —
Issued pursuant to directors’compensation plan 31,930 — 50 — — — — 50
Issued as part of debtexchange 40,729,332 40 160,451 — — — — 160,491
Stock-based compensation — — 21,042 — — — — 21,042
Tax withholding – stockcompensation — — — — — 782,566 (1,597) (1,597)
Dividends adjustments — — — 70 — — — 70
Net loss — — — (976,177) — — — (976,177)
Balance – December 31,2016 402,334,655 402 2,534,670 (2,018,989) — 3,906,877 (47,635) 468,448
Issued or purchased pursuantto stock compensation plans 5,201,854 6 (6) — — — — —
Issued pursuant to directors’compensation plan 12,837 — — — — — — —
Stock-based compensation — — 19,721 — — — — 19,721
Tax withholding – stockcompensation — — — — — 1,550,164 (3,183) (3,183)
Retirement of treasury stock (5,000,000) (5) (46,557) — — (5,000,000) 46,562 —
Dividends adjustments — — — 27 — — — 27
Net income — — — 163,152 — — — 163,152
Balance – December 31,2017 402,549,346 $ 403 $ 2,507,828 $ (1,855,810) $ — 457,041 $ (4,256) $ 648,165
See accompanying Notes to Consolidated Financial Statements.
Denbury Resources Inc. Notes to Consolidated Financial Statements
69
Note 1. Significant Accounting Policies
Organization and Nature of Operations
Denbury Resources Inc., a Delaware corporation, is an independent oil and natural gas company with operations focused in two key operating areas: the Gulf Coast and Rocky Mountain regions. Our goal is to increase the value of our properties through a combination of exploitation, drilling and proven engineering extraction practices, with the most significant emphasis relating to CO2 enhanced oil recovery operations.
Principles of Reporting and Consolidation
The consolidated financial statements herein have been prepared in accordance with accounting principles generally accepted in the United States (“GAAP”) and include the accounts of Denbury and entities in which we hold a controlling financial interest. Undivided interests in oil and gas joint ventures are consolidated on a proportionate basis. All intercompany balances and transactions have been eliminated.
Use of Estimates
The preparation of financial statements in conformity with GAAP requires management to make estimates and assumptions that affect the reported amount of certain assets and liabilities, disclosure of contingent assets and liabilities at the date of the financial statements, and the reported amounts of revenues and expenses during each reporting period. Management believes its estimates and assumptions are reasonable; however, such estimates and assumptions are subject to a number of risks and uncertainties that may cause actual results to differ materially from such estimates. Significant estimates underlying these financial statements include (1) the fair value of financial derivative instruments; (2) the estimated quantities of proved oil and natural gas reserves used to compute depletion of oil and natural gas properties, the related present value of estimated future net cash flows therefrom and the ceiling test; (3) future net cash flow estimates used in the impairment assessment of long-lived assets; (4) the estimated quantities of proved and probable CO2 reserves used to compute depletion of CO2 properties; (5) estimated useful lives used to compute depreciation and amortization of long-lived assets; (6) accruals related to oil and natural gas sales volumes and revenues, capital expenditures and lease operating expenses; (7) the estimated costs and timing of future asset retirement obligations; and (8) estimates made in the calculation of income taxes. While management is not aware of any significant revisions to any of its current year-end estimates, there will likely be future revisions to its estimates resulting from matters such as revisions in estimated oil and natural gas volumes, changes in ownership interests, payouts, joint venture audits, re-allocations by purchasers or pipelines, or other corrections and adjustments common in the oil and natural gas industry, many of which require retroactive application. These types of adjustments cannot be currently estimated and will be recorded in the period in which the adjustment occurs.
Reclassifications
Certain prior period amounts have been reclassified to conform to the current year presentation. Such reclassifications had no impact on our reported net income, current assets, total assets, current liabilities, total liabilities or stockholders’ equity.
Cash Equivalents
We consider all highly liquid investments to be cash equivalents if they have maturities of three months or less at the date of purchase.
Oil and Natural Gas Properties
Capitalized Costs. We follow the full cost method of accounting for oil and natural gas properties. Under this method, all costs related to the acquisition, exploration and development of oil and natural gas reserves are capitalized and accumulated in a single cost center representing our activities, which are undertaken exclusively in the United States. Such costs include lease acquisition costs, geological and geophysical expenditures, lease rentals on undeveloped properties, costs of drilling both productive and nonproductive wells, capitalized interest on qualifying projects, and general and administrative expenses directly related to exploration and development activities, and do not include any costs related to production, general corporate
Denbury Resources Inc. Notes to Consolidated Financial Statements
70
overhead or similar activities. We assign the purchase price of oil and natural gas properties we acquire to proved and unevaluated properties based on the estimated fair values as defined in the Financial Accounting Standards Board Codification (“FASC”) Fair Value Measurement topic. Proceeds received from disposals are credited against accumulated costs except when the sale represents a significant disposal of reserves, in which case a gain or loss would be recognized. A disposal of 25% or more of our proved reserves would be considered significant.
Depletion and Depreciation. The costs capitalized, including production equipment and future development costs, are depleted or depreciated using the unit-of-production method, based on proved oil and natural gas reserves as determined by independent petroleum engineers. Oil and natural gas reserves are converted to equivalent units on a basis of 6,000 cubic feet of natural gas to one barrel of crude oil.
Under full cost accounting, we may exclude certain unevaluated costs from the amortization base pending determination of whether proved reserves can be assigned to such properties. The costs classified as unevaluated are transferred to the full cost amortization base as the properties are developed, tested and evaluated. At least annually, we test these assets for impairment based on an evaluation of management’s expectations of future pricing, evaluation of lease expiration terms, and planned project development activities. As a result of this analysis, we recognized impairments of our unevaluated costs totaling $21.4 million, $21.0 million and $17.9 million during the years ended December 31, 2017, 2016 and 2015, respectively, whereby these costs were transferred to the full cost amortization base.
Write-Down of Oil and Natural Gas Properties. The net capitalized costs of oil and natural gas properties are limited to the lower of unamortized cost or the cost center ceiling. The cost center ceiling is defined as (1) the present value of estimated future net revenues from proved oil and natural gas reserves before future abandonment costs (discounted at 10%), based on the average first-day-of-the-month oil and natural gas price for each month during a 12-month rolling period prior to the end of a particular reporting period; plus (2) the cost of properties not being amortized; plus (3) the lower of cost or estimated fair value of unproved properties included in the costs being amortized, if any; less (4) related income tax effects. Our future net revenues from proved oil and natural gas reserves are not reduced for development costs related to the cost of drilling for and developing CO2 reserves nor those related to the cost of constructing CO2 pipelines, as we do not have to incur additional costs to develop the proved oil and natural gas reserves. Therefore, we include in the ceiling test, as a reduction of future net revenues, that portion of our capitalized CO2 costs related to CO2 reserves and CO2 pipelines that we estimate will be consumed in the process of producing our proved oil and natural gas reserves. The fair value of our oil and natural gas derivative contracts is not included in the ceiling test, as we do not designate these contracts as hedge instruments for accounting purposes. The cost center ceiling test is prepared quarterly.
The average first-day-of-the-month NYMEX oil price used in estimating our proved reserves declined throughout 2015 and 2016 and led to our recognizing full cost pool ceiling test write-downs totaling $810.9 million and $4.9 billion during 2016 and 2015, respectively. We did not record any ceiling test write-down during 2017.
Joint Interest Operations. Substantially all of our oil and natural gas exploration and production activities are conducted jointly with others. These financial statements reflect only our proportionate interest in such activities, and any amounts due from other partners are included in trade receivables.
Tertiary Injection Costs. Our tertiary operations are conducted in reservoirs that have already produced significant amounts of oil over many years; however, in accordance with the SEC rules and regulations for recording proved reserves, we cannot recognize proved reserves associated with enhanced recovery techniques, such as CO2 injection, until we can demonstrate production resulting from the tertiary process or unless the field is analogous to an existing flood.
We capitalize, as a development cost, injection costs in fields that are in their development stage, which means we have not yet seen incremental oil production due to the CO2 injections (i.e., a production response). These capitalized development costs are included in our unevaluated property costs if there are not already proved tertiary reserves in that field. After we see a production response to the CO2 injections (i.e., the production stage), injection costs are expensed as incurred, and once proved reserves are recognized, previously deferred unevaluated development costs become subject to depletion.
Denbury Resources Inc. Notes to Consolidated Financial Statements
71
CO2 Properties
We own and produce CO2 reserves, a non-hydrocarbon resource, that are used in our tertiary oil recovery operations on our own behalf and on behalf of other interest owners in enhanced recovery fields, with a portion sold to third-party industrial users. We record revenue from our sales of CO2 to third parties when it is produced and sold. Expenses related to the production of CO2 are allocated between volumes sold to third parties and volumes consumed internally that are directly related to our tertiary production. The expenses related to third-party sales are recorded in “CO2 discovery and operating expenses,” and the expenses related to internal use are recorded in “Lease operating expenses” in the Consolidated Statements of Operations or are capitalized as oil and natural gas properties in our Consolidated Balance Sheets, depending on the stage of the tertiary flood that is receiving the CO2 (see Tertiary Injection Costs above for further discussion).
Costs incurred to search for CO2 are expensed as incurred until proved or probable reserves are established. Once proved or probable reserves are established, costs incurred to obtain those reserves are capitalized and classified as “CO2 properties” on our Consolidated Balance Sheets. Capitalized CO2 costs are aggregated by geologic formation and depleted on a unit-of-production basis over proved and probable reserves.
Pipelines and Plants
CO2 used in our tertiary floods is transported to our fields through CO2 pipelines. Costs of CO2 pipelines under construction are not depreciated until the pipelines are placed into service. Pipelines are depreciated on a straight-line basis over their estimated useful lives, which range from 15 to 50 years. Capitalized costs include $101.1 million of CO2 pipelines as of December 31, 2017, that were either under construction or had not been placed into service and therefore, were not subject to depreciation during 2017.
Pipelines and plants also include capitalized costs associated with the Riley Ridge gas processing facility in southwestern Wyoming. During the fourth quarter of 2016, we reassessed the estimated useful life of the gas processing facility and related assets, due to the extended shut-in status of the Riley Ridge gas processing facility and our analysis of cost estimates and engineering options to remedy certain existing issues, and recorded accelerated depreciation to fully depreciate capitalized costs related to the facility and intangible assets assigned to helium production rights at Riley Ridge.
Property and Equipment – Other
Other property and equipment, which includes furniture and fixtures, vehicles, computer equipment and software, and capitalized leases, is depreciated principally on a straight-line basis over each asset’s estimated useful life. Vehicles and furniture and fixtures are generally depreciated over a useful life of five to ten years, and computer equipment and software are generally depreciated over a useful life of three to five years. Leasehold improvements are amortized over the shorter of the estimated useful life or the remaining lease term.
Leased property meeting certain capital lease criteria is capitalized, and the present value of the related lease payments is recorded as a liability. Amortization of capitalized leased assets is computed using the straight-line method over the shorter of the estimated useful life or the lease term.
Maintenance and repair costs that do not extend the useful life of the property or equipment are charged to expense as incurred.
Goodwill and Other Intangible Assets
Goodwill previously recorded on our Consolidated Balance Sheets represented the excess of the purchase price over the estimated fair value of the net assets acquired in the acquisition of businesses. Goodwill was not amortized; rather, it was tested for impairment annually during the fourth quarter or when events or changes in circumstances indicated that it was more likely than not the fair value of a reporting unit with goodwill was reduced below its carrying value. Because the fair value of the reporting unit (enterprise value) did not exceed the fair value of assets and liabilities, we recorded a goodwill impairment charge of $1.3 billion during 2015 to fully impair the carrying value of our goodwill.
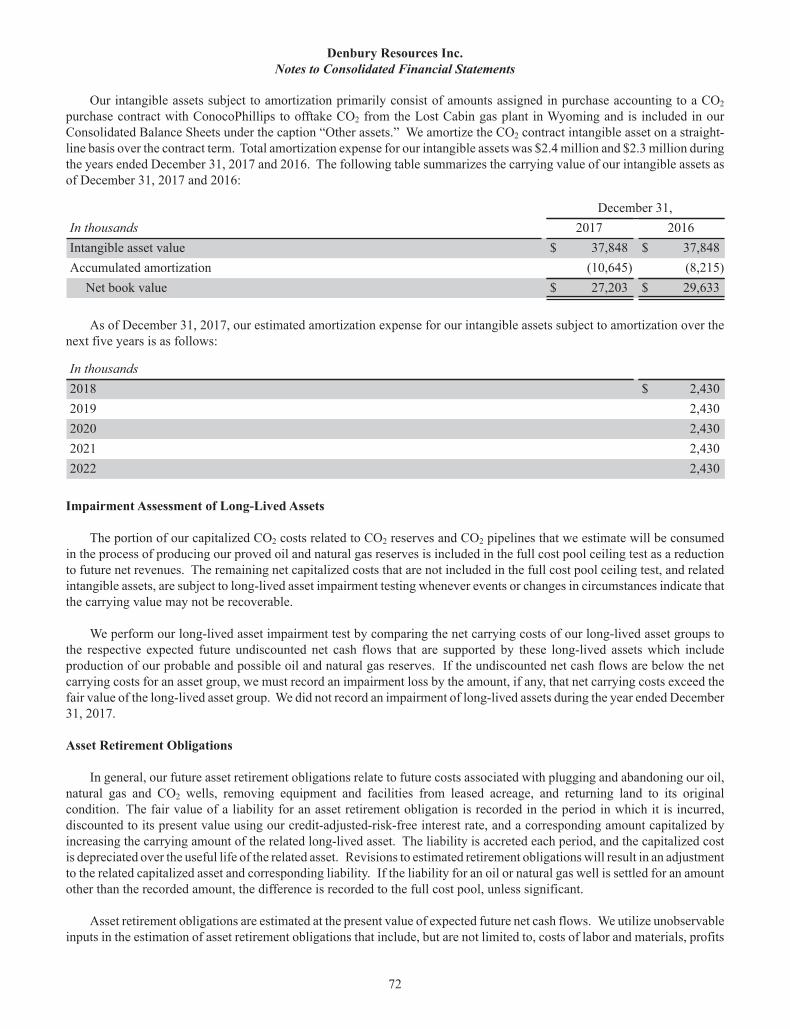
Denbury Resources Inc. Notes to Consolidated Financial Statements
72
Our intangible assets subject to amortization primarily consist of amounts assigned in purchase accounting to a CO2purchase contract with ConocoPhillips to offtake CO2 from the Lost Cabin gas plant in Wyoming and is included in our Consolidated Balance Sheets under the caption “Other assets.” We amortize the CO2 contract intangible asset on a straight-line basis over the contract term. Total amortization expense for our intangible assets was $2.4 million and $2.3 million during the years ended December 31, 2017 and 2016. The following table summarizes the carrying value of our intangible assets as of December 31, 2017 and 2016:
December 31,In thousands 2017 2016Intangible asset value $ 37,848 $ 37,848Accumulated amortization (10,645) (8,215)
Net book value $ 27,203 $ 29,633
As of December 31, 2017, our estimated amortization expense for our intangible assets subject to amortization over the next five years is as follows:
In thousands 2018 $ 2,4302019 2,4302020 2,4302021 2,4302022 2,430
Impairment Assessment of Long-Lived Assets
The portion of our capitalized CO2 costs related to CO2 reserves and CO2 pipelines that we estimate will be consumed in the process of producing our proved oil and natural gas reserves is included in the full cost pool ceiling test as a reduction to future net revenues. The remaining net capitalized costs that are not included in the full cost pool ceiling test, and related intangible assets, are subject to long-lived asset impairment testing whenever events or changes in circumstances indicate that the carrying value may not be recoverable.
We perform our long-lived asset impairment test by comparing the net carrying costs of our long-lived asset groups to the respective expected future undiscounted net cash flows that are supported by these long-lived assets which include production of our probable and possible oil and natural gas reserves. If the undiscounted net cash flows are below the net carrying costs for an asset group, we must record an impairment loss by the amount, if any, that net carrying costs exceed the fair value of the long-lived asset group. We did not record an impairment of long-lived assets during the year ended December 31, 2017.
Asset Retirement Obligations
In general, our future asset retirement obligations relate to future costs associated with plugging and abandoning our oil, natural gas and CO2 wells, removing equipment and facilities from leased acreage, and returning land to its original condition. The fair value of a liability for an asset retirement obligation is recorded in the period in which it is incurred, discounted to its present value using our credit-adjusted-risk-free interest rate, and a corresponding amount capitalized by increasing the carrying amount of the related long-lived asset. The liability is accreted each period, and the capitalized cost is depreciated over the useful life of the related asset. Revisions to estimated retirement obligations will result in an adjustment to the related capitalized asset and corresponding liability. If the liability for an oil or natural gas well is settled for an amount other than the recorded amount, the difference is recorded to the full cost pool, unless significant.
Asset retirement obligations are estimated at the present value of expected future net cash flows. We utilize unobservable inputs in the estimation of asset retirement obligations that include, but are not limited to, costs of labor and materials, profits
Denbury Resources Inc. Notes to Consolidated Financial Statements
73
on costs of labor and materials, the effect of inflation on estimated costs, and the discount rate. Accordingly, asset retirement obligations are considered a Level 3 measurement under the FASC Fair Value Measurement topic.
Commodity Derivative Contracts
We utilize oil and natural gas derivative contracts to mitigate our exposure to commodity price risk associated with our future oil and natural gas production. These derivative contracts have historically consisted of options, in the form of price floors, collars, three-way collars, fixed-price swaps, fixed-price swaps enhanced with a sold put, and basis swaps. Our derivative financial instruments are recorded on the balance sheet as either an asset or a liability measured at fair value. We do not apply hedge accounting to our commodity derivative contracts; accordingly, changes in the fair value of these instruments are recognized in “Commodity derivatives expense (income)” in our Consolidated Statements of Operations in the period of change.
Concentrations of Credit Risk
Our financial instruments that are exposed to concentrations of credit risk consist primarily of cash equivalents, trade and accrued production receivables, and the derivative instruments discussed above. Our cash equivalents represent high-quality securities placed with various investment-grade institutions. This investment practice limits our exposure to concentrations of credit risk. Our trade and accrued production receivables are dispersed among various customers and purchasers; therefore, concentrations of credit risk are limited. We evaluate the credit ratings of our purchasers, and if customers are considered a credit risk, letters of credit are the primary security obtained to support lines of credit. We attempt to minimize our credit risk exposure to the counterparties of our oil and natural gas derivative contracts through formal credit policies, monitoring procedures and diversification. All of our derivative contracts are with parties that are lenders under our senior secured bank credit facility (or affiliates of such lenders). There are no margin requirements with the counterparties of our derivative contracts.
Oil and natural gas sales are made on a day-to-day basis or under short-term contracts at the current area market price. We would not expect the loss of any purchaser to have a material adverse effect upon our operations. For the years ended December 31, 2017, 2016 and 2015, two purchasers accounted for 10% or more of our oil and natural gas revenues: Plains Marketing LP (22%, 20% and 15% in 2017, 2016 and 2015, respectively) and Marathon Petroleum Company (10%, 14% and 28% in 2017, 2016 and 2015, respectively).
Revenue Recognition
Revenue Recognition. Revenue is recognized at the time oil and natural gas is produced and sold. Any amounts due from purchasers of oil and natural gas are included in accrued production receivable.
We follow the sales method of accounting for our oil and natural gas revenue, whereby we recognize revenue on oil or natural gas sold to our purchasers regardless of whether the sales are proportionate to our ownership in the property. A receivable or liability is recognized only to the extent that we have an imbalance on a specific property greater than the expected remaining proved reserves. As of December 31, 2017 and 2016, our aggregate oil and natural gas imbalances were not material to our consolidated financial statements.
We recognize revenue and expenses of purchased producing properties at the time we assume effective control, commencing from either the closing or purchase agreement date, depending on the underlying terms and agreements. We follow the same methodology in reverse when we sell properties by recognizing revenue and expenses of the sold properties until the closing date.
Other Receivables
Denbury, along with other companies, has supported the development of a proposed plant in the Gulf Coast for which one of the by-products would be CO2, and for which Denbury has an offtake agreement. Since early 2015, we have made successive loans towards this development, which totaled approximately $17 million at December 31, 2017. We have recorded these amounts as a loan receivable in “Trade and other receivables, net” on our Consolidated Balance Sheets. We understand
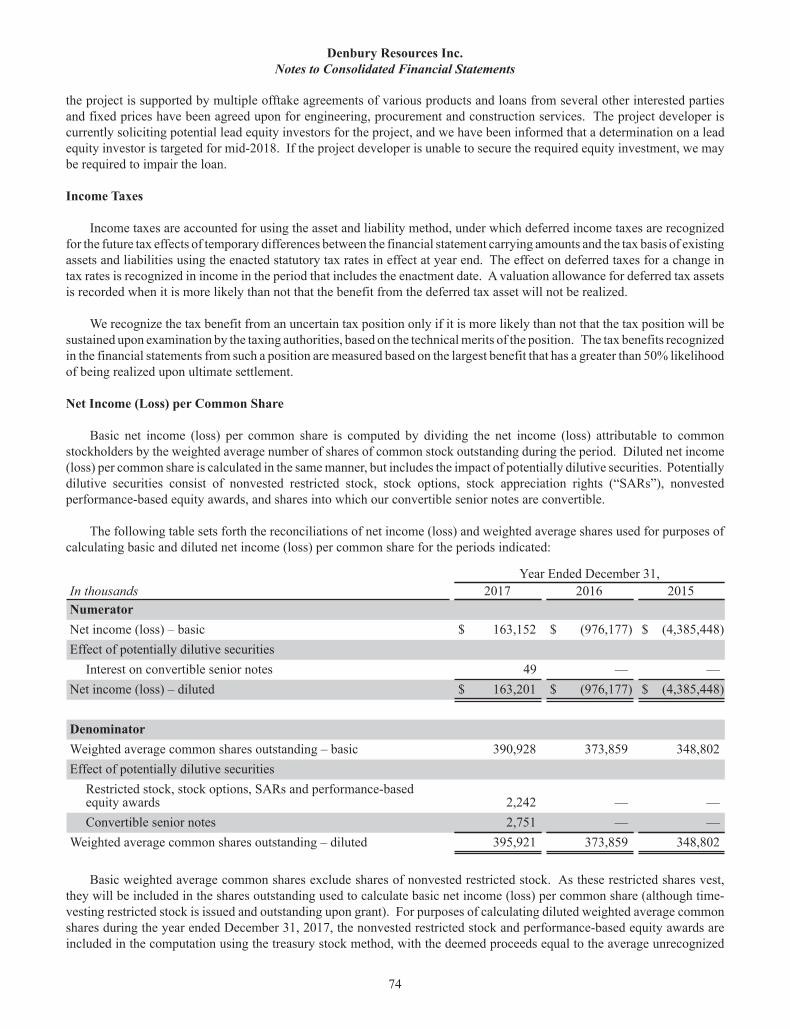
Denbury Resources Inc. Notes to Consolidated Financial Statements
74
the project is supported by multiple offtake agreements of various products and loans from several other interested parties and fixed prices have been agreed upon for engineering, procurement and construction services. The project developer is currently soliciting potential lead equity investors for the project, and we have been informed that a determination on a lead equity investor is targeted for mid-2018. If the project developer is unable to secure the required equity investment, we may be required to impair the loan.
Income Taxes
Income taxes are accounted for using the asset and liability method, under which deferred income taxes are recognized for the future tax effects of temporary differences between the financial statement carrying amounts and the tax basis of existing assets and liabilities using the enacted statutory tax rates in effect at year end. The effect on deferred taxes for a change in tax rates is recognized in income in the period that includes the enactment date. A valuation allowance for deferred tax assets is recorded when it is more likely than not that the benefit from the deferred tax asset will not be realized.
We recognize the tax benefit from an uncertain tax position only if it is more likely than not that the tax position will be sustained upon examination by the taxing authorities, based on the technical merits of the position. The tax benefits recognized in the financial statements from such a position are measured based on the largest benefit that has a greater than 50% likelihood of being realized upon ultimate settlement.
Net Income (Loss) per Common Share
Basic net income (loss) per common share is computed by dividing the net income (loss) attributable to common stockholders by the weighted average number of shares of common stock outstanding during the period. Diluted net income (loss) per common share is calculated in the same manner, but includes the impact of potentially dilutive securities. Potentially dilutive securities consist of nonvested restricted stock, stock options, stock appreciation rights (“SARs”), nonvested performance-based equity awards, and shares into which our convertible senior notes are convertible.
The following table sets forth the reconciliations of net income (loss) and weighted average shares used for purposes of calculating basic and diluted net income (loss) per common share for the periods indicated:
Year Ended December 31,In thousands 2017 2016 2015NumeratorNet income (loss) – basic $ 163,152 $ (976,177) $ (4,385,448)Effect of potentially dilutive securities
Interest on convertible senior notes 49 — —Net income (loss) – diluted $ 163,201 $ (976,177) $ (4,385,448)
DenominatorWeighted average common shares outstanding – basic 390,928 373,859 348,802Effect of potentially dilutive securities
Restricted stock, stock options, SARs and performance-basedequity awards 2,242 — —Convertible senior notes 2,751 — —
Weighted average common shares outstanding – diluted 395,921 373,859 348,802
Basic weighted average common shares exclude shares of nonvested restricted stock. As these restricted shares vest, they will be included in the shares outstanding used to calculate basic net income (loss) per common share (although time-vesting restricted stock is issued and outstanding upon grant). For purposes of calculating diluted weighted average common shares during the year ended December 31, 2017, the nonvested restricted stock and performance-based equity awards are included in the computation using the treasury stock method, with the deemed proceeds equal to the average unrecognized
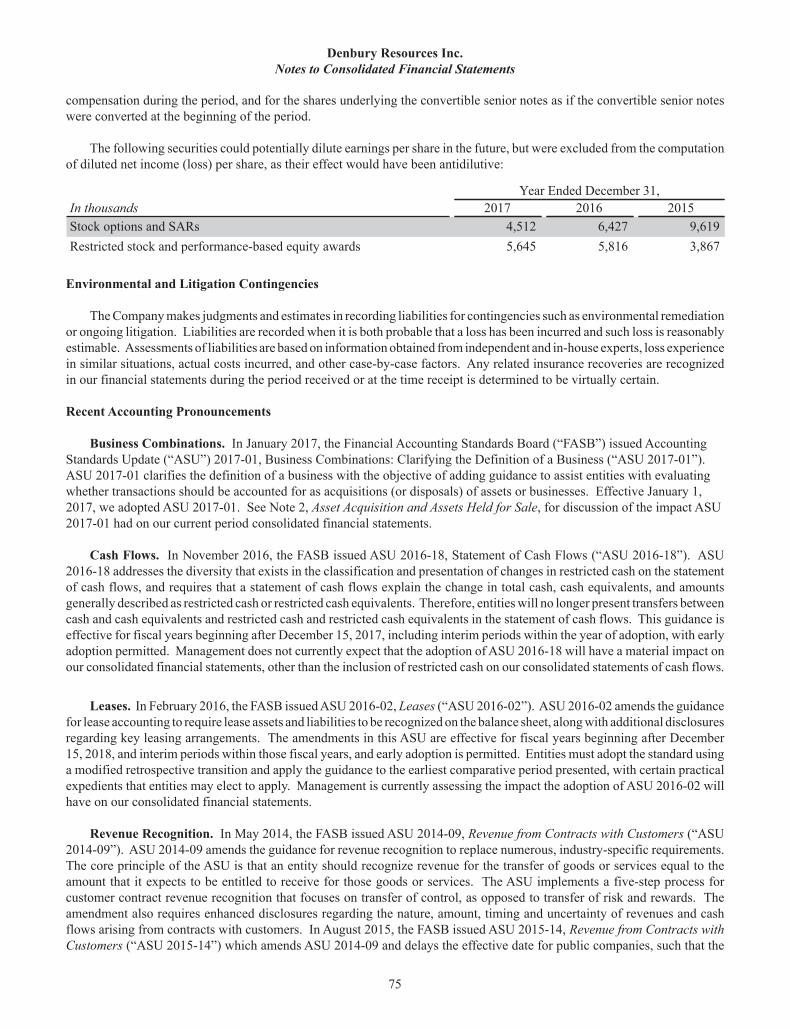
Denbury Resources Inc. Notes to Consolidated Financial Statements
75
compensation during the period, and for the shares underlying the convertible senior notes as if the convertible senior notes were converted at the beginning of the period.
The following securities could potentially dilute earnings per share in the future, but were excluded from the computation of diluted net income (loss) per share, as their effect would have been antidilutive:
Year Ended December 31,In thousands 2017 2016 2015Stock options and SARs 4,512 6,427 9,619Restricted stock and performance-based equity awards 5,645 5,816 3,867
Environmental and Litigation Contingencies
The Company makes judgments and estimates in recording liabilities for contingencies such as environmental remediation or ongoing litigation. Liabilities are recorded when it is both probable that a loss has been incurred and such loss is reasonably estimable. Assessments of liabilities are based on information obtained from independent and in-house experts, loss experience in similar situations, actual costs incurred, and other case-by-case factors. Any related insurance recoveries are recognized in our financial statements during the period received or at the time receipt is determined to be virtually certain.
Recent Accounting Pronouncements
Business Combinations. In January 2017, the Financial Accounting Standards Board (“FASB”) issued Accounting Standards Update (“ASU”) 2017-01, Business Combinations: Clarifying the Definition of a Business (“ASU 2017-01”). ASU 2017-01 clarifies the definition of a business with the objective of adding guidance to assist entities with evaluating whether transactions should be accounted for as acquisitions (or disposals) of assets or businesses. Effective January 1, 2017, we adopted ASU 2017-01. See Note 2, Asset Acquisition and Assets Held for Sale, for discussion of the impact ASU 2017-01 had on our current period consolidated financial statements.
Cash Flows. In November 2016, the FASB issued ASU 2016-18, Statement of Cash Flows (“ASU 2016-18”). ASU 2016-18 addresses the diversity that exists in the classification and presentation of changes in restricted cash on the statement of cash flows, and requires that a statement of cash flows explain the change in total cash, cash equivalents, and amounts generally described as restricted cash or restricted cash equivalents. Therefore, entities will no longer present transfers between cash and cash equivalents and restricted cash and restricted cash equivalents in the statement of cash flows. This guidance is effective for fiscal years beginning after December 15, 2017, including interim periods within the year of adoption, with early adoption permitted. Management does not currently expect that the adoption of ASU 2016-18 will have a material impact on our consolidated financial statements, other than the inclusion of restricted cash on our consolidated statements of cash flows.
Leases. In February 2016, the FASB issued ASU 2016-02, Leases (“ASU 2016-02”). ASU 2016-02 amends the guidance for lease accounting to require lease assets and liabilities to be recognized on the balance sheet, along with additional disclosures regarding key leasing arrangements. The amendments in this ASU are effective for fiscal years beginning after December 15, 2018, and interim periods within those fiscal years, and early adoption is permitted. Entities must adopt the standard using a modified retrospective transition and apply the guidance to the earliest comparative period presented, with certain practical expedients that entities may elect to apply. Management is currently assessing the impact the adoption of ASU 2016-02 will have on our consolidated financial statements.
Revenue Recognition. In May 2014, the FASB issued ASU 2014-09, Revenue from Contracts with Customers (“ASU 2014-09”). ASU 2014-09 amends the guidance for revenue recognition to replace numerous, industry-specific requirements. The core principle of the ASU is that an entity should recognize revenue for the transfer of goods or services equal to the amount that it expects to be entitled to receive for those goods or services. The ASU implements a five-step process for customer contract revenue recognition that focuses on transfer of control, as opposed to transfer of risk and rewards. The amendment also requires enhanced disclosures regarding the nature, amount, timing and uncertainty of revenues and cash flows arising from contracts with customers. In August 2015, the FASB issued ASU 2015-14, Revenue from Contracts with Customers (“ASU 2015-14”) which amends ASU 2014-09 and delays the effective date for public companies, such that the
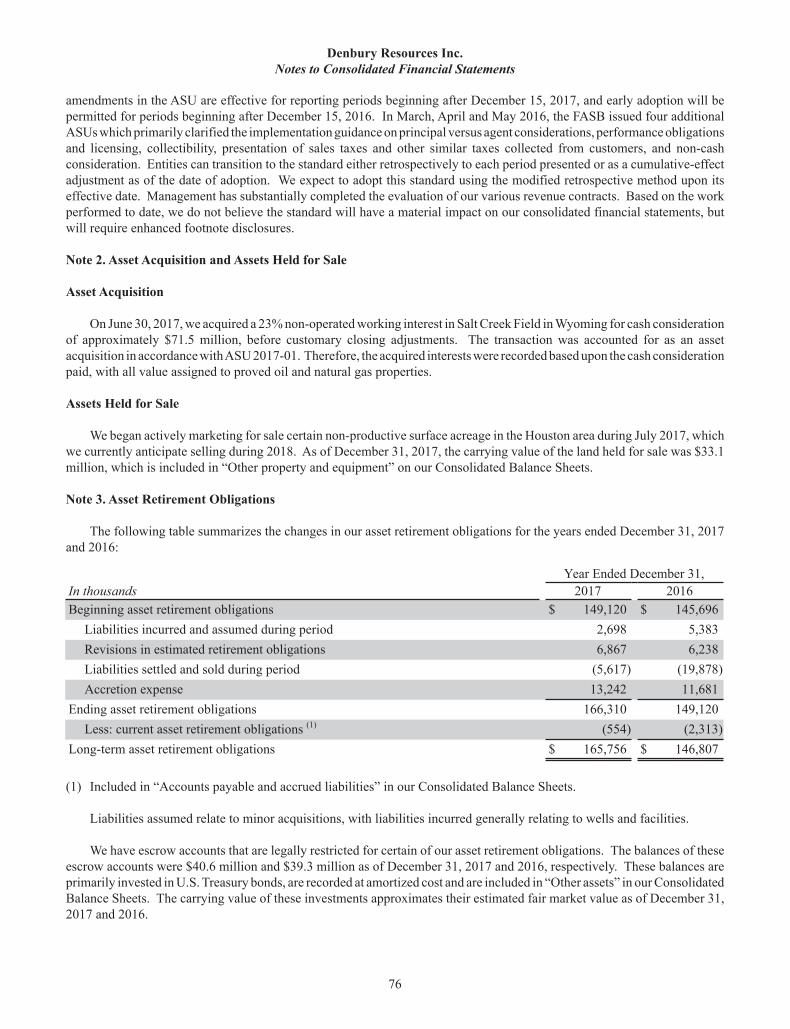
Denbury Resources Inc. Notes to Consolidated Financial Statements
76
amendments in the ASU are effective for reporting periods beginning after December 15, 2017, and early adoption will be permitted for periods beginning after December 15, 2016. In March, April and May 2016, the FASB issued four additional ASUs which primarily clarified the implementation guidance on principal versus agent considerations, performance obligations and licensing, collectibility, presentation of sales taxes and other similar taxes collected from customers, and non-cash consideration. Entities can transition to the standard either retrospectively to each period presented or as a cumulative-effect adjustment as of the date of adoption. We expect to adopt this standard using the modified retrospective method upon its effective date. Management has substantially completed the evaluation of our various revenue contracts. Based on the work performed to date, we do not believe the standard will have a material impact on our consolidated financial statements, but will require enhanced footnote disclosures.
Note 2. Asset Acquisition and Assets Held for Sale
Asset Acquisition
On June 30, 2017, we acquired a 23% non-operated working interest in Salt Creek Field in Wyoming for cash consideration of approximately $71.5 million, before customary closing adjustments. The transaction was accounted for as an asset acquisition in accordance with ASU 2017-01. Therefore, the acquired interests were recorded based upon the cash consideration paid, with all value assigned to proved oil and natural gas properties.
Assets Held for Sale
We began actively marketing for sale certain non-productive surface acreage in the Houston area during July 2017, which we currently anticipate selling during 2018. As of December 31, 2017, the carrying value of the land held for sale was $33.1 million, which is included in “Other property and equipment” on our Consolidated Balance Sheets.
Note 3. Asset Retirement Obligations
The following table summarizes the changes in our asset retirement obligations for the years ended December 31, 2017and 2016:
Year Ended December 31,In thousands 2017 2016Beginning asset retirement obligations $ 149,120 $ 145,696
Liabilities incurred and assumed during period 2,698 5,383Revisions in estimated retirement obligations 6,867 6,238Liabilities settled and sold during period (5,617) (19,878)Accretion expense 13,242 11,681
Ending asset retirement obligations 166,310 149,120Less: current asset retirement obligations (1) (554) (2,313)
Long-term asset retirement obligations $ 165,756 $ 146,807
(1) Included in “Accounts payable and accrued liabilities” in our Consolidated Balance Sheets.
Liabilities assumed relate to minor acquisitions, with liabilities incurred generally relating to wells and facilities.
We have escrow accounts that are legally restricted for certain of our asset retirement obligations. The balances of these escrow accounts were $40.6 million and $39.3 million as of December 31, 2017 and 2016, respectively. These balances are primarily invested in U.S. Treasury bonds, are recorded at amortized cost and are included in “Other assets” in our Consolidated Balance Sheets. The carrying value of these investments approximates their estimated fair market value as of December 31, 2017 and 2016.
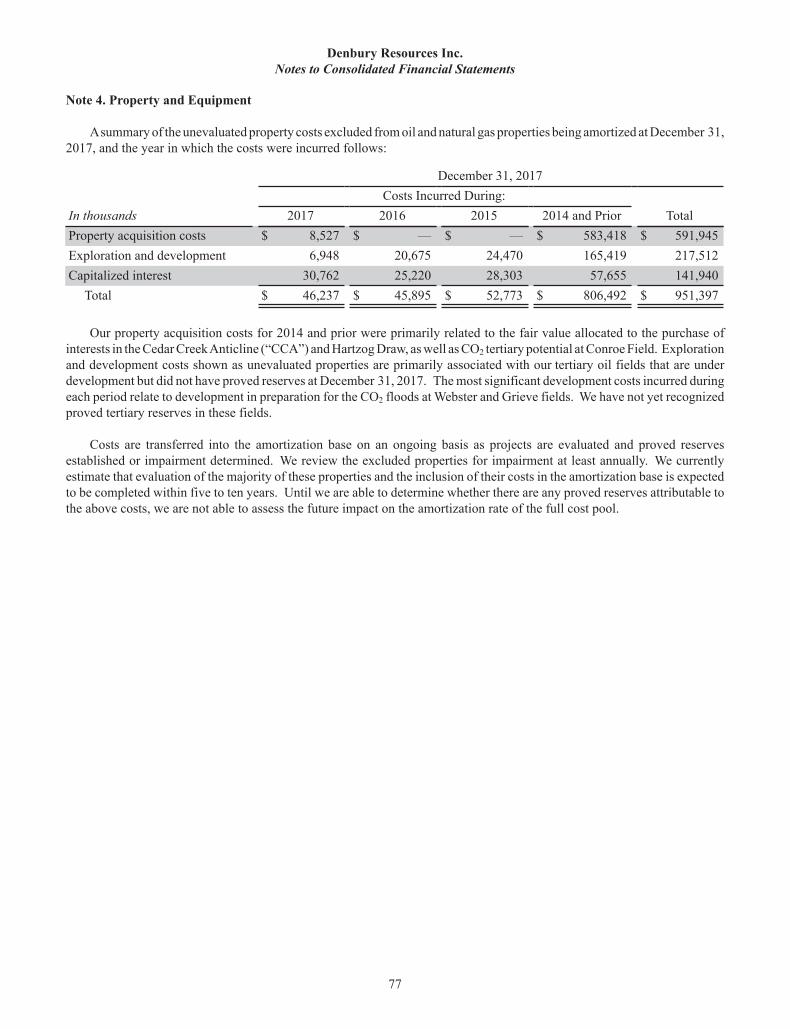
Denbury Resources Inc. Notes to Consolidated Financial Statements
77
Note 4. Property and Equipment
A summary of the unevaluated property costs excluded from oil and natural gas properties being amortized at December 31, 2017, and the year in which the costs were incurred follows:
December 31, 2017 Costs Incurred During: In thousands 2017 2016 2015 2014 and Prior TotalProperty acquisition costs $ 8,527 $ — $ — $ 583,418 $ 591,945Exploration and development 6,948 20,675 24,470 165,419 217,512Capitalized interest 30,762 25,220 28,303 57,655 141,940
Total $ 46,237 $ 45,895 $ 52,773 $ 806,492 $ 951,397
Our property acquisition costs for 2014 and prior were primarily related to the fair value allocated to the purchase of interests in the Cedar Creek Anticline (“CCA”) and Hartzog Draw, as well as CO2 tertiary potential at Conroe Field. Exploration and development costs shown as unevaluated properties are primarily associated with our tertiary oil fields that are under development but did not have proved reserves at December 31, 2017. The most significant development costs incurred during each period relate to development in preparation for the CO2 floods at Webster and Grieve fields. We have not yet recognized proved tertiary reserves in these fields.
Costs are transferred into the amortization base on an ongoing basis as projects are evaluated and proved reserves established or impairment determined. We review the excluded properties for impairment at least annually. We currently estimate that evaluation of the majority of these properties and the inclusion of their costs in the amortization base is expected to be completed within five to ten years. Until we are able to determine whether there are any proved reserves attributable to the above costs, we are not able to assess the future impact on the amortization rate of the full cost pool.
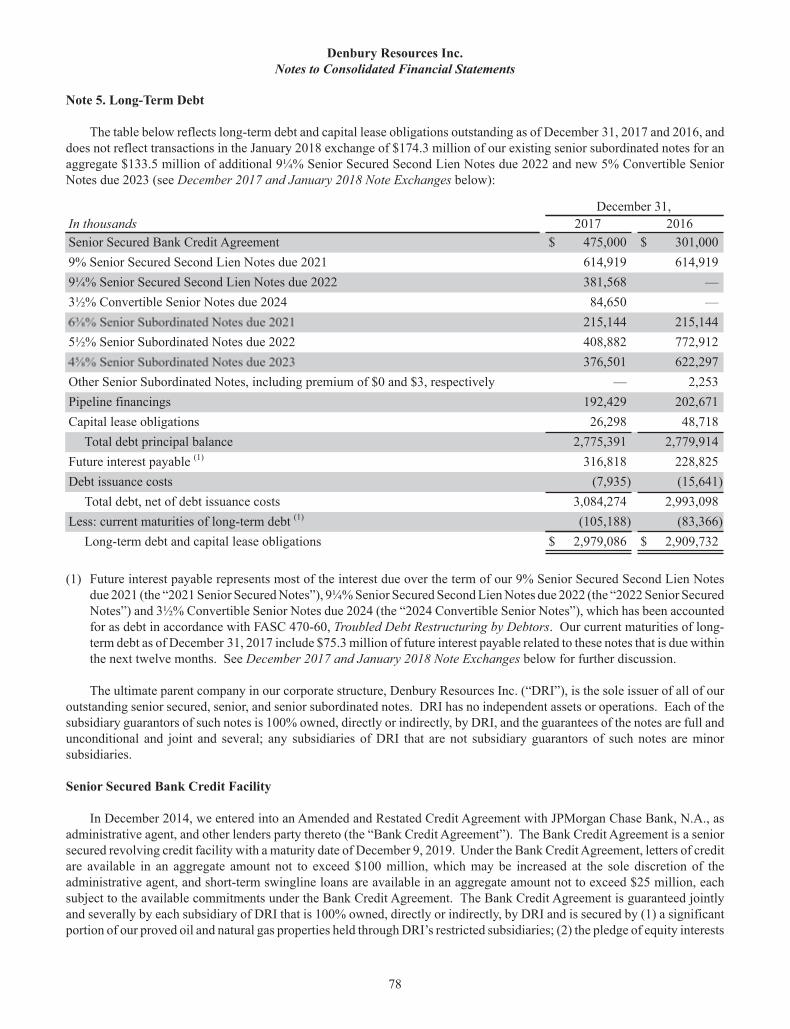
Denbury Resources Inc. Notes to Consolidated Financial Statements
78
Note 5. Long-Term Debt
The table below reflects long-term debt and capital lease obligations outstanding as of December 31, 2017 and 2016, and does not reflect transactions in the January 2018 exchange of $174.3 million of our existing senior subordinated notes for an aggregate $133.5 million of additional 9¼% Senior Secured Second Lien Notes due 2022 and new 5% Convertible Senior Notes due 2023 (see December 2017 and January 2018 Note Exchanges below):
December 31,In thousands 2017 2016Senior Secured Bank Credit Agreement $ 475,000 $ 301,0009% Senior Secured Second Lien Notes due 2021 614,919 614,9199¼% Senior Secured Second Lien Notes due 2022 381,568 —3½% Convertible Senior Notes due 2024 84,650 —
215,144 215,1445½% Senior Subordinated Notes due 2022 408,882 772,912
376,501 622,297Other Senior Subordinated Notes, including premium of $0 and $3, respectively — 2,253Pipeline financings 192,429 202,671Capital lease obligations 26,298 48,718
Total debt principal balance 2,775,391 2,779,914Future interest payable (1) 316,818 228,825Debt issuance costs (7,935) (15,641)
Total debt, net of debt issuance costs 3,084,274 2,993,098Less: current maturities of long-term debt (1) (105,188) (83,366)
Long-term debt and capital lease obligations $ 2,979,086 $ 2,909,732
(1) Future interest payable represents most of the interest due over the term of our 9% Senior Secured Second Lien Notes due 2021 (the “2021 Senior Secured Notes”), 9¼% Senior Secured Second Lien Notes due 2022 (the “2022 Senior Secured Notes”) and 3½% Convertible Senior Notes due 2024 (the “2024 Convertible Senior Notes”), which has been accounted for as debt in accordance with FASC 470-60, Troubled Debt Restructuring by Debtors. Our current maturities of long-term debt as of December 31, 2017 include $75.3 million of future interest payable related to these notes that is due within the next twelve months. See December 2017 and January 2018 Note Exchanges below for further discussion.
The ultimate parent company in our corporate structure, Denbury Resources Inc. (“DRI”), is the sole issuer of all of our outstanding senior secured, senior, and senior subordinated notes. DRI has no independent assets or operations. Each of the subsidiary guarantors of such notes is 100% owned, directly or indirectly, by DRI, and the guarantees of the notes are full and unconditional and joint and several; any subsidiaries of DRI that are not subsidiary guarantors of such notes are minor subsidiaries.
Senior Secured Bank Credit Facility
In December 2014, we entered into an Amended and Restated Credit Agreement with JPMorgan Chase Bank, N.A., as administrative agent, and other lenders party thereto (the “Bank Credit Agreement”). The Bank Credit Agreement is a senior secured revolving credit facility with a maturity date of December 9, 2019. Under the Bank Credit Agreement, letters of credit are available in an aggregate amount not to exceed $100 million, which may be increased at the sole discretion of the administrative agent, and short-term swingline loans are available in an aggregate amount not to exceed $25 million, each subject to the available commitments under the Bank Credit Agreement. The Bank Credit Agreement is guaranteed jointly and severally by each subsidiary of DRI that is 100% owned, directly or indirectly, by DRI and is secured by (1) a significant portion of our proved oil and natural gas properties held through DRI’s restricted subsidiaries; (2) the pledge of equity interests
Denbury Resources Inc. Notes to Consolidated Financial Statements
79
of such subsidiaries; (3) a pledge of commodity derivative agreements of DRI and such subsidiaries (as applicable); and (4) a pledge of deposit accounts, securities accounts and commodity accounts of DRI and such subsidiaries (as applicable).
The Bank Credit Agreement limits our ability to, among other things, incur and repay indebtedness; grant liens; engage in certain mergers, consolidations, liquidations and dissolutions; engage in sales of assets; make acquisitions and investments; make distributions and dividends; and enter into commodity derivative agreements, in each case subject to customary exceptions.
As of December 31, 2017, the borrowing base and lender commitments for the revolving credit facility were $1.05 billion, and scheduled redeterminations of the borrowing base are to occur semiannually, with the next such redetermination being scheduled for May 2018. If our outstanding debt under the Bank Credit Agreement were to ever exceed the borrowing base, we would be required to repay the excess amount over a period not to exceed six months.
As amended, the Bank Credit Agreement contains certain financial performance covenants through the maturity of the facility, including the following:
• A consolidated senior secured debt to consolidated EBITDAX covenant, with such ratio not to exceed 3.0 to 1.0 through the first quarter of 2018, and thereafter not to exceed 2.5 to 1.0. Currently, only debt under our Bank Credit Agreement is considered consolidated senior secured debt for purposes of this ratio;
• A minimum permitted ratio of consolidated EBITDAX to consolidated interest charges of 1.25 to 1.0; and• A requirement to maintain a current ratio of 1.0 to 1.0.
As of December 31, 2017, (1) loans under the Bank Credit Agreement were subject to varying rates of interest based on either (a) for ABR Loans, a base rate determined under the Bank Credit Agreement (the “ABR”) plus an applicable margin ranging from 1.5% to 2.5% per annum, or (b) for LIBOR Loans, the LIBOR rate plus an applicable margin ranging from 2.5%to 3.5% per annum (capitalized terms as defined in the Bank Credit Agreement) and (2) the undrawn portion of the aggregate lender commitments under the Bank Credit Agreement was subject to a commitment fee of 0.50%. As of December 31, 2017, we were in compliance with all debt covenants under the Bank Credit Agreement. The weighted average interest rate on borrowings outstanding under the Bank Credit Agreement was 4.5% and 3.0% as of December 31, 2017 and 2016, respectively.
The above description of our Bank Credit Agreement is qualified by the express language and defined terms contained in the Bank Credit Agreement and the amendments thereto, each of which are filed as exhibits to our periodic reports filed with the SEC.
December 2017 and January 2018 Note Exchanges
During December 2017, we entered into privately negotiated agreements to exchange a total of $609.8 million aggregate principal amount of our existing senior subordinated notes for $381.6 million aggregate principal amount of new 2022 Senior Secured Notes and $84.7 million aggregate principal amount of new 2024 Convertible Senior Notes, resulting in a net reduction in our debt principal from these exchanges of $143.6 million. The exchanged notes consisted of $364.0 million aggregate principal amount of our 5½% Senior Subordinated Notes due 2022 (the “2022 Notes”) and $245.8 million aggregate principal amount of our 4 % Senior Subordinated Notes due 2023 (the “2023 Notes”).
During January 2018, we closed additional transactions to exchange a total of $174.3 million aggregate principal amount of our existing senior subordinated notes for $74.1 million aggregate principal amount of new 2022 Senior Secured Notes and $59.4 million aggregate principal amount of new 5% Convertible Senior Notes due 2023 (the “2023 Convertible Senior Notes”), resulting in a net reduction in our debt principal from these exchanges of $40.8 million. The exchanged notes consisted of $11.6 million aggregate principal amount of our 6 % Senior Subordinated Notes due 2021 (the “2021 Notes”), $94.2 million aggregate principal amount of our 2022 Notes and $68.5 million aggregate principal amount of our 2023 Notes.
In accordance with FASC 470-60, the exchanges were accounted for as a troubled debt restructuring due to the level of concession provided by our senior subordinated note holders. Under this guidance, future interest applicable to the 2022 Senior Secured Notes and 2024 Convertible Senior Notes is recorded as debt up to the point that the principal and future interest of the new notes is equal to the principal amount of the extinguished notes, rather than recognizing a gain on
Denbury Resources Inc. Notes to Consolidated Financial Statements
80
extinguishment for this amount. As of December 31, 2017, $138.3 million of future interest on the 2022 Senior Secured Notes and 2024 Convertible Senior Notes was recorded as debt, which will be reduced as semiannual interest payments are made, with the remaining $32.3 million of future interest to be recognized as interest expense over the term of these notes. Therefore, future interest expense reflected in our Consolidated Statements of Operations on the 2022 Senior Secured Notes and 2024 Convertible Senior Notes will be significantly lower than the actual cash interest payments.
2016 Senior Subordinated Notes Exchange
During May 2016, we entered into privately negotiated agreements to exchange a total of $1,057.8 million of our existing senior subordinated notes for $614.9 million principal amount of our 2021 Senior Secured Notes plus 40.7 million shares of Denbury common stock, resulting in a net reduction from these exchanges of $442.9 million in our debt principal. As a result of this debt exchange, we recognized a gain of $12.0 million during the year ended December 31, 2016, which is included in “Gain on debt extinguishment” in the accompanying Consolidated Statements of Operations.
Senior Secured Second Lien Notes
9% Senior Secured Second Lien Notes due 2021. In May 2016, we issued $614.9 million of 2021 Senior Secured Notes. The 2021 Senior Secured Notes, which bear interest at a rate of 9% per annum, were issued at par in connection with privately negotiated exchanges with a limited number of holders of existing senior subordinated notes (see 2016 Senior Subordinated Notes Exchange above). The 2021 Senior Secured Notes mature on May 15, 2021, and interest is payable semiannually in arrears on May 15 and November 15 of each year, beginning in November 2016. We may redeem the 2021 Senior Secured Notes in whole or in part at our option beginning December 15, 2018, at a redemption price of 109% of the principal amount, and at declining redemption prices thereafter, as specified in the indenture governing the 2021 Senior Secured Notes. Prior to December 15, 2018, we may at our option redeem up to an aggregate of 35% of the principal amount of the 2021 Senior Secured Notes at a price of 109% of par with the proceeds of certain equity offerings. In addition, at any time prior to December 15, 2018, we may redeem the 2021 Senior Secured Notes in whole or in part at a price equal to 100% of the principal amount plus a “make-whole” premium and accrued and unpaid interest. The 2021 Senior Secured Notes are not subject to any sinking fund requirements.
The 2021 Senior Secured Notes are guaranteed jointly and severally by our subsidiaries representing substantially all of our assets, operations and income and are secured by second-priority liens on substantially all of the assets that secure the Bank Credit Agreement, which second-priority liens are contractually subordinated to liens that secure our Bank Credit Agreement and any future additional priority lien debt.
9¼% Senior Secured Second Lien Notes due 2022. In December 2017 and January 2018, we issued $381.6 million and $74.1 million, respectively, of 2022 Senior Secured Notes. The 2022 Senior Secured Notes, which bear interest at a rate of 9.25% per annum, were issued at par in connection with exchanges with a limited number of holders of existing senior subordinated notes (see December 2017and January 2018 Note Exchanges above). The 2022 Senior Secured Notes mature on March 31, 2022, and interest is payable semiannually in arrears on March 31 and September 30 of each year, beginning in March 2018. We may redeem the 2022 Senior Secured Notes in whole or in part at our option beginning March 31, 2019, at a redemption price of 109.25% of the principal amount, and at declining redemption prices thereafter, as specified in the indenture governing the 2022 Senior Secured Notes. Prior to March 31, 2019, we may at our option redeem up to an aggregate of 35% of the principal amount of the 2022 Senior Secured Notes at a price of 109.25% of par with the proceeds of certain equity offerings. In addition, at any time prior to March 31, 2019, we may redeem the 2022 Senior Secured Notes in whole or in part at a price equal to 100% of the principal amount plus a “make-whole” premium and accrued and unpaid interest. The 2022 Senior Secured Notes are not subject to any sinking fund requirements.
The 2022 Senior Secured Notes are guaranteed jointly and severally by our subsidiaries representing substantially all of our assets, operations and income and are secured by second-priority liens on substantially all of the assets that secure the Bank Credit Agreement, which second-priority liens are contractually subordinated to liens that secure our Bank Credit Agreement and any future additional priority lien debt.
Restrictive Covenants in Indentures for Senior Secured Second Lien Notes. Each of the indentures for the 2021 Senior Secured Notes and 2022 Senior Secured Notes contains customary covenants that are generally consistent and that
Denbury Resources Inc. Notes to Consolidated Financial Statements
81
restrict our ability and the ability of our restricted subsidiaries to (1) incur additional debt; (2) make investments; (3) create liens on our assets or the assets of our restricted subsidiaries; (4) create limitations on the ability of our restricted subsidiaries to pay dividends or make other payments to DRI or other restricted subsidiaries; (5) engage in transactions with our affiliates; (6) transfer or sell assets or subsidiary stock; (7) consolidate, merge or transfer all or substantially all of our assets and the assets of our restricted subsidiaries; and (8) make restricted payments (which includes paying dividends on our common stock or redeeming, repurchasing or retiring such stock or subordinated debt (including existing senior subordinated notes)), provided that in certain circumstances we may make unlimited restricted payments so long as we maintain a ratio of total debt to EBITDA (as defined in the indentures) not to exceed 2.5 to 1.0 (both before and after giving effect to any restricted payment). As of December 31, 2017, we were in compliance with all debt covenants under the indentures related to our senior secured second lien notes.
Convertible Senior Notes
3½% Convertible Senior Notes due 2024. In December 2017, we issued $84.7 million of 2024 Convertible Senior Notes. The 2024 Convertible Senior Notes, which bear interest at a rate of 3.5% per annum, were issued at par in connection with privately negotiated exchanges with a limited number of holders of existing senior subordinated notes (see December2017 and January 2018 Note Exchanges above). The 2024 Convertible Senior Notes mature on March 31, 2024, and interest is payable semiannually in arrears on March 31 and September 30 of each year, beginning in March 2018. We do not have the right to redeem the 2024 Convertible Senior Notes prior to their maturity. The 2024 Convertible Senior Notes are convertible into shares of our common stock at any time, at the option of the holders, at a rate of 444.44 shares of common stock per $1,000 principal amount of 2024 Convertible Senior Notes, provided that the conversion rate will be 455.56 shares of common stock per $1,000 principal amount for 2024 Convertible Senior Notes converted prior to April 13, 2018, if any. The 2024 Convertible Senior Notes will be automatically converted into shares of common stock at a rate of 444.44 shares of $1,000 principal amount of 2024 Convertible Senior Notes if the volume weighted average price of the Company’s common stock equals or exceeds the threshold price, which initially is $2.65 per share, for 10 trading days in any period of 15 consecutive trading days, subject to satisfaction of certain other conditions. The 2024 Convertible Senior Notes are convertible into between 37.6 and 38.6 million shares of the Company’s common stock. The 2024 Convertible Senior Notes are not subject to any sinking fund requirements.
5% Convertible Senior Notes due 2023. In January 2018, we issued $59.4 million of 2023 Convertible Senior Notes. The 2023 Convertible Senior Notes, which bear interest at a rate of 5% per annum, were issued at par in exchange offers with a limited number of holders of existing senior subordinated notes (see December 2017 and January 2018 Note Exchanges above). The 2023 Convertible Senior Notes mature on December 15, 2023, and interest is payable semiannually in arrears on June 15 and December 15 of each year, beginning in June 2018. We do not have the right to redeem the 2023 Convertible Senior Notes prior to their maturity. The 2023 Convertible Senior Notes are convertible into shares of our common stock at any time, at the option of the holders, at a rate of 281.69 shares of common stock per $1,000 principal amount of 2023 Convertible Senior Notes, subject to customary adjustments to the conversion rate and threshold price with respect to, among other things, stock dividends and distributions, mergers and reclassifications. The 2023 Convertible Senior Notes will be automatically converted into shares of common stock at this rate if the volume weighted average trading price of the Company’s common stock equals or exceeds the threshold price, which initially is $3.55 per share, for 10 trading days in any period of 15 consecutive trading days, subject to satisfaction of certain other conditions. Additionally, the Company may, based on a determination of its Board of Directors that such changes are in the best interests of the Company, and subject to certain limitations, increase the conversion rate (which increase in conversion rate is limited until January 9, 2019 to no greater than 393.55 shares of common stock per $1,000 principal amount of 2023 Convertible Senior Notes). Any such conversion rate increase would cause a proportional decrease in the threshold price for mandatory conversions, and thereby would enable the Company to require a mandatory conversion into common stock at a lower price than the initial or then-prevailing threshold price.
Restrictive Covenants in Indentures for Convertible Senior Notes. Each of the indentures for the 2024 Convertible Senior Notes and 2023 Convertible Senior Notes contains customary covenants that restrict our ability and the ability of our restricted subsidiaries to (1) incur additional debt; (2) make investments; (3) create liens on our assets or the assets of our restricted subsidiaries; (4) create limitations on the ability of our restricted subsidiaries to pay dividends or make other payments to DRI or other restricted subsidiaries; (5) engage in transactions with our affiliates; (6) transfer or sell assets or subsidiary stock; (7) consolidate, merge or transfer all or substantially all of our assets and the assets of our restricted subsidiaries; and
Denbury Resources Inc. Notes to Consolidated Financial Statements
82
(8) make restricted payments (which includes paying dividends on our common stock or redeeming, repurchasing or retiring such stock or subordinated debt (including existing senior subordinated notes)), provided that in certain circumstances we may make unlimited restricted payments so long as we maintain a ratio of total debt to EBITDA (as defined in the indentures) not to exceed 2.5 to 1.0 (both before and after giving effect to any restricted payment). As of December 31, 2017, we were in compliance with all debt covenants under the indentures related to our convertible senior notes.
Senior Subordinated Notes
6 % Senior Subordinated Notes due 2021. In February 2011, we issued $400 million of 2021 Notes. The 2021 Notes, which bear interest at a rate of 6.375% per annum, were sold at par. The 2021 Notes mature on August 15, 2021, and interest is payable on February 15 and August 15 of each year. At any time prior to August 15, 2018, we may redeem the 2021 Notes in whole or in part at our option at a redemption price of 102.125% of the principal amount, and at declining redemption prices thereafter, as specified in the indenture.
5½% Senior Subordinated Notes due 2022. In April 2014, we issued $1.25 billion of 2022 Notes. The 2022 Notes, which bear interest at a rate of 5.5% per annum, were sold at par. The 2022 Notes mature on May 1, 2022, and interest is payable on May 1 and November 1 of each year. At any time prior to May 1, 2018, we may redeem the 2022 Notes in whole or in part at our option, at a redemption price of 104.125% of the principal amount, and at declining redemption prices thereafter, as specified in the indenture. The 2022 Notes are not subject to any sinking fund requirements.
4 % Senior Subordinated Notes due 2023. In February 2013, we issued $1.2 billion of 2023 Notes. The 2023 Notes, which bear interest at a rate of 4.625% per annum, were sold at par. The 2023 Notes mature on July 15, 2023, and interest is payable on January 15 and July 15 of each year. We may redeem the 2023 Notes in whole or in part at our option beginning January 15, 2018, at a redemption price of 102.313% of the principal amount, and at declining redemption prices thereafter, as specified in the indenture. The 2023 Notes are not subject to any sinking fund requirements.
Restrictive Covenants in Indentures for Senior Subordinated Notes. Each of the indentures for the 2021 Notes, 2022 Notes and 2023 Notes contains certain covenants that are generally consistent and that restrict our ability and the ability of our restricted subsidiaries to take or permit certain actions, including restrictions on our ability and the ability of our restricted subsidiaries to (1) incur additional debt; (2) make investments; (3) create liens on our assets or the assets of our restricted subsidiaries; (4) create restrictions on the ability of our restricted subsidiaries to pay dividends or make other payments to DRI or other restricted subsidiaries; (5) engage in transactions with our affiliates; (6) transfer or sell assets or subsidiary stock; (7) consolidate, merge or transfer all or substantially all of our assets and the assets of our restricted subsidiaries; and (8) make restricted payments (which includes paying dividends on our common stock or redeeming, repurchasing or retiring such stock or subordinated debt), provided that the restricted payments covenant in the indentures for the 2022 and 2023 Notes (the “2022 and 2023 Indentures”) permits us in certain circumstances to make unlimited restricted payments so long as we maintain a ratio of total debt to EBITDA (both as defined in the 2022 and 2023 Indentures) not to exceed 2.5 to 1.0 (both before and after giving effect to any restricted payment), although we will not be able to realize the practical benefit of the restricted payment covenant flexibility in the 2022 and 2023 Indentures until the 2021 Notes have been redeemed or retired. As of December 31, 2017, we were in compliance with all debt covenants under the indentures related to our senior subordinated notes.
2016 Repurchases of Senior Subordinated Notes. During 2016, we repurchased a total of $181.9 million of our outstanding long-term indebtedness, consisting of $9.8 million principal amount of our 2021 Notes, $66.1 million principal amount of our 2022 Notes, and $106.0 million principal amount of our 2023 Notes in open-market transactions for a total purchase price of $76.7 million, excluding accrued interest. In connection with these series of transactions, we recognized a $103.1 million gain on extinguishment, net of unamortized debt issuance costs written off, during the year ended December 31, 2016.
Pipeline Financings
In May 2008, we closed two transactions with Genesis Energy, L.P. (“Genesis”) involving two of our pipelines. The NEJD Pipeline system included a 20-year financing lease, and the Free State Pipeline included a long-term transportation service agreement. These transactions are both accounted for as financing leases.
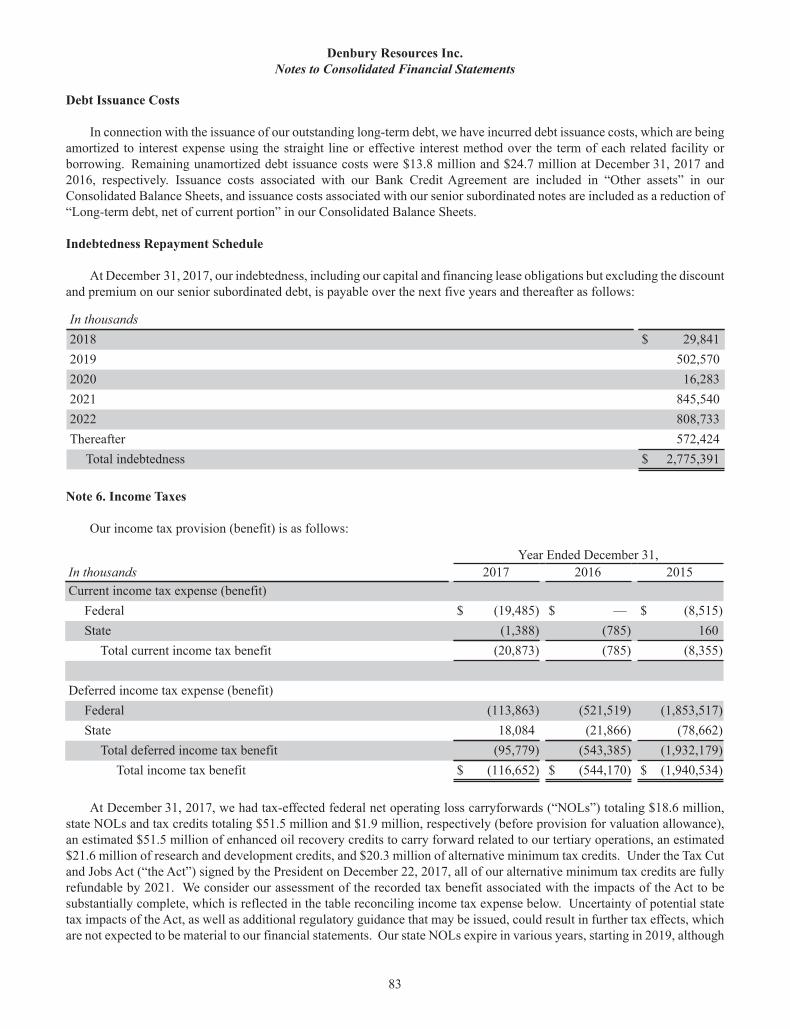
Denbury Resources Inc. Notes to Consolidated Financial Statements
83
Debt Issuance Costs
In connection with the issuance of our outstanding long-term debt, we have incurred debt issuance costs, which are being amortized to interest expense using the straight line or effective interest method over the term of each related facility or borrowing. Remaining unamortized debt issuance costs were $13.8 million and $24.7 million at December 31, 2017 and 2016, respectively. Issuance costs associated with our Bank Credit Agreement are included in “Other assets” in our Consolidated Balance Sheets, and issuance costs associated with our senior subordinated notes are included as a reduction of “Long-term debt, net of current portion” in our Consolidated Balance Sheets.
Indebtedness Repayment Schedule
At December 31, 2017, our indebtedness, including our capital and financing lease obligations but excluding the discount and premium on our senior subordinated debt, is payable over the next five years and thereafter as follows:
In thousands 2018 $ 29,8412019 502,5702020 16,2832021 845,5402022 808,733Thereafter 572,424
Total indebtedness $ 2,775,391
Note 6. Income Taxes
Our income tax provision (benefit) is as follows:
Year Ended December 31,In thousands 2017 2016 2015Current income tax expense (benefit)
Federal $ (19,485) $ — $ (8,515)State (1,388) (785) 160
Total current income tax benefit (20,873) (785) (8,355)
Deferred income tax expense (benefit) Federal (113,863) (521,519) (1,853,517)State 18,084 (21,866) (78,662)
Total deferred income tax benefit (95,779) (543,385) (1,932,179)Total income tax benefit $ (116,652) $ (544,170) $ (1,940,534)
At December 31, 2017, we had tax-effected federal net operating loss carryforwards (“NOLs”) totaling $18.6 million, state NOLs and tax credits totaling $51.5 million and $1.9 million, respectively (before provision for valuation allowance), an estimated $51.5 million of enhanced oil recovery credits to carry forward related to our tertiary operations, an estimated $21.6 million of research and development credits, and $20.3 million of alternative minimum tax credits. Under the Tax Cut and Jobs Act (“the Act”) signed by the President on December 22, 2017, all of our alternative minimum tax credits are fully refundable by 2021. We consider our assessment of the recorded tax benefit associated with the impacts of the Act to be substantially complete, which is reflected in the table reconciling income tax expense below. Uncertainty of potential state tax impacts of the Act, as well as additional regulatory guidance that may be issued, could result in further tax effects, which are not expected to be material to our financial statements. Our state NOLs expire in various years, starting in 2019, although
Denbury Resources Inc. Notes to Consolidated Financial Statements
84
most do not begin to expire until 2024. Our enhanced oil recovery credits and research and development credits begin to expire in 2024 and 2031, respectively.
Deferred income taxes reflect the available tax carryforwards and the temporary differences based on tax laws and statutory rates in effect at the December 31, 2017 and 2016 balance sheet dates. As of December 31, 2017, we had $51.1 million of deferred tax assets associated with State of Louisiana and Mississippi net operating losses and tax credits. A tax valuation allowance was recorded in 2015 to reduce the carrying value of our Louisiana deferred tax assets as the result of a tax law enacted in the State of Louisiana, which limits a company’s utilization of certain deductions, including our net operating loss carryforwards. As of December 31, 2017 tax valuation allowances totaling $35.3 million were recorded for our State of Louisiana deferred tax assets, a reduction of $1.3 million during 2017 due to adjustments of prior year balances. Based on recent losses from falling commodity prices and lower future forecasted income related to our Mississippi deferred tax assets, we concluded it was not more-likely-than-not that the deferred tax assets would be realized. Accordingly, we recorded a valuation allowance against our Mississippi deferred tax assets in the amount of $6.8 million during 2017. Furthermore, as a result of the Act, our deferred tax assets associated with State of Louisiana and Mississippi net operating losses and tax credits were increased by $9.1 million due to a reduction in the federal benefit of state taxes paid. This change was fully offset by an increase in the valuation allowance, resulting in a total increase in valuation allowance during 2017 of $14.6 million. The valuation allowances will remain until the realization of future deferred tax benefits are more likely than not to become utilized.
As of December 31, 2017, we had an unrecognized tax benefit of $5.4 million related to an uncertain tax position. The unrecognized tax benefit was recorded during 2015 as a direct reduction of the associated deferred tax asset and, if recognized, would not materially affect our annual effective tax rate. The tax benefit from an uncertain tax position will only be recognized if it is more likely than not that the tax position will be sustained upon examination by the taxing authorities, based upon the technical merits of the position. We currently do not expect a material change to the uncertain tax position within the next 12 months. Our policy is to recognize penalties and interest related to uncertain tax positions in income tax expense; however, no such amounts were accrued related to the uncertain tax position as of December 31, 2017.
In connection with the transaction in which we exchanged a portion of our existing senior subordinated notes for senior secured and senior notes, we realized a tax gain due to the concession extended by our note holders during the second quarter of 2016 and fourth quarter of 2017. This tax gain was offset by net operating losses and other deferred tax asset attributes.
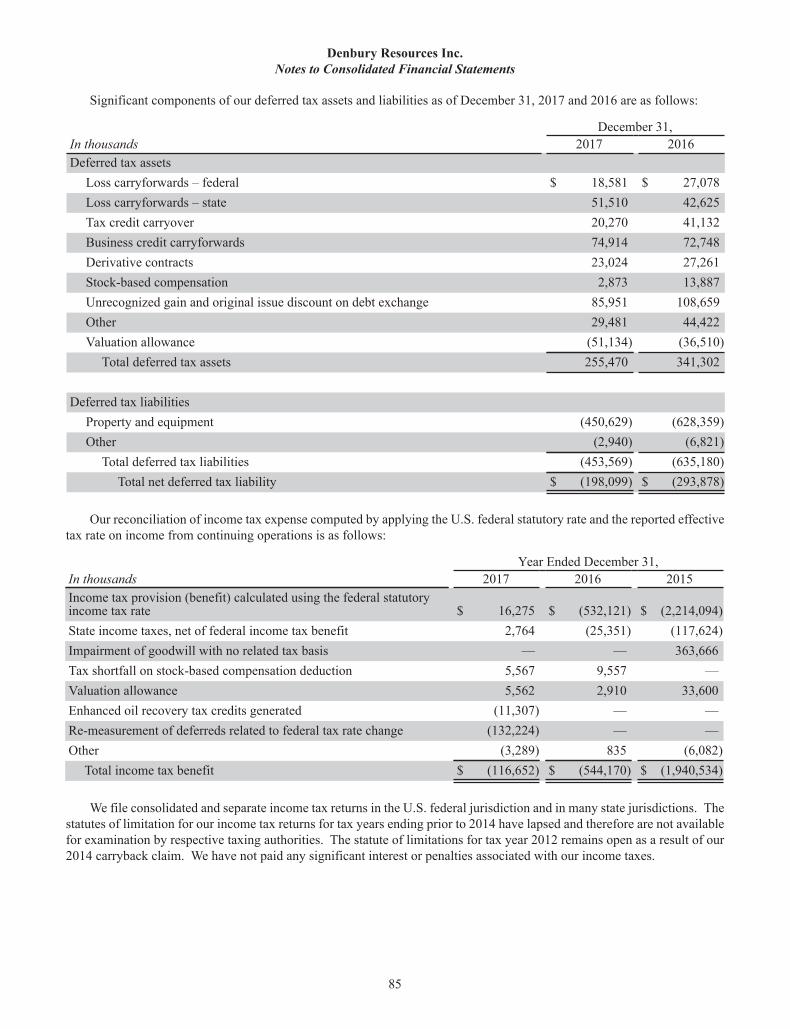
Denbury Resources Inc. Notes to Consolidated Financial Statements
85
Significant components of our deferred tax assets and liabilities as of December 31, 2017 and 2016 are as follows:
December 31,In thousands 2017 2016Deferred tax assets
Loss carryforwards – federal $ 18,581 $ 27,078Loss carryforwards – state 51,510 42,625Tax credit carryover 20,270 41,132Business credit carryforwards 74,914 72,748Derivative contracts 23,024 27,261Stock-based compensation 2,873 13,887Unrecognized gain and original issue discount on debt exchange 85,951 108,659Other 29,481 44,422Valuation allowance (51,134) (36,510)
Total deferred tax assets 255,470 341,302
Deferred tax liabilities Property and equipment (450,629) (628,359)Other (2,940) (6,821)
Total deferred tax liabilities (453,569) (635,180)Total net deferred tax liability $ (198,099) $ (293,878)
Our reconciliation of income tax expense computed by applying the U.S. federal statutory rate and the reported effective tax rate on income from continuing operations is as follows:
Year Ended December 31,In thousands 2017 2016 2015Income tax provision (benefit) calculated using the federal statutoryincome tax rate $ 16,275 $ (532,121) $ (2,214,094)State income taxes, net of federal income tax benefit 2,764 (25,351) (117,624)Impairment of goodwill with no related tax basis — — 363,666Tax shortfall on stock-based compensation deduction 5,567 9,557 —Valuation allowance 5,562 2,910 33,600Enhanced oil recovery tax credits generated (11,307) — —Re-measurement of deferreds related to federal tax rate change (132,224) — —Other (3,289) 835 (6,082)
Total income tax benefit $ (116,652) $ (544,170) $ (1,940,534)
We file consolidated and separate income tax returns in the U.S. federal jurisdiction and in many state jurisdictions. The statutes of limitation for our income tax returns for tax years ending prior to 2014 have lapsed and therefore are not available for examination by respective taxing authorities. The statute of limitations for tax year 2012 remains open as a result of our 2014 carryback claim. We have not paid any significant interest or penalties associated with our income taxes.
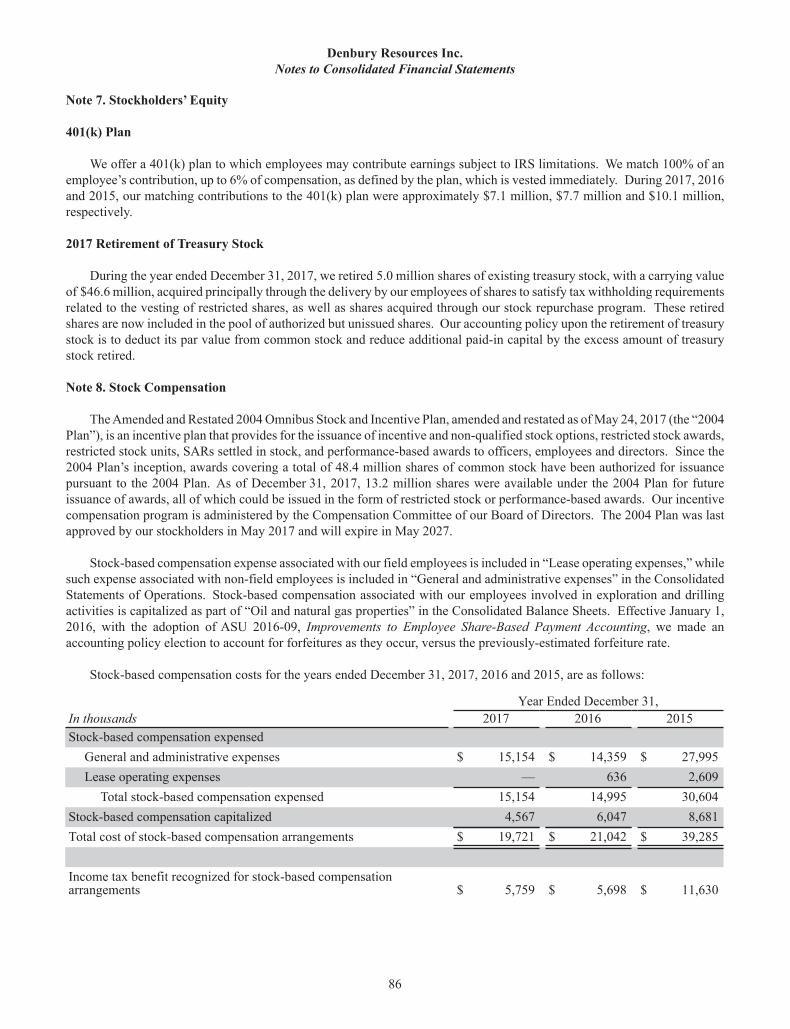
Denbury Resources Inc. Notes to Consolidated Financial Statements
86
Note 7. Stockholders’ Equity
401(k) Plan
We offer a 401(k) plan to which employees may contribute earnings subject to IRS limitations. We match 100% of an employee’s contribution, up to 6% of compensation, as defined by the plan, which is vested immediately. During 2017, 2016and 2015, our matching contributions to the 401(k) plan were approximately $7.1 million, $7.7 million and $10.1 million, respectively.
2017 Retirement of Treasury Stock
During the year ended December 31, 2017, we retired 5.0 million shares of existing treasury stock, with a carrying value of $46.6 million, acquired principally through the delivery by our employees of shares to satisfy tax withholding requirements related to the vesting of restricted shares, as well as shares acquired through our stock repurchase program. These retired shares are now included in the pool of authorized but unissued shares. Our accounting policy upon the retirement of treasury stock is to deduct its par value from common stock and reduce additional paid-in capital by the excess amount of treasury stock retired.
Note 8. Stock Compensation
The Amended and Restated 2004 Omnibus Stock and Incentive Plan, amended and restated as of May 24, 2017 (the “2004 Plan”), is an incentive plan that provides for the issuance of incentive and non-qualified stock options, restricted stock awards, restricted stock units, SARs settled in stock, and performance-based awards to officers, employees and directors. Since the 2004 Plan’s inception, awards covering a total of 48.4 million shares of common stock have been authorized for issuance pursuant to the 2004 Plan. As of December 31, 2017, 13.2 million shares were available under the 2004 Plan for future issuance of awards, all of which could be issued in the form of restricted stock or performance-based awards. Our incentive compensation program is administered by the Compensation Committee of our Board of Directors. The 2004 Plan was last approved by our stockholders in May 2017 and will expire in May 2027.
Stock-based compensation expense associated with our field employees is included in “Lease operating expenses,” while such expense associated with non-field employees is included in “General and administrative expenses” in the Consolidated Statements of Operations. Stock-based compensation associated with our employees involved in exploration and drilling activities is capitalized as part of “Oil and natural gas properties” in the Consolidated Balance Sheets. Effective January 1, 2016, with the adoption of ASU 2016-09, Improvements to Employee Share-Based Payment Accounting, we made an accounting policy election to account for forfeitures as they occur, versus the previously-estimated forfeiture rate.
Stock-based compensation costs for the years ended December 31, 2017, 2016 and 2015, are as follows:
Year Ended December 31,In thousands 2017 2016 2015Stock-based compensation expensed
General and administrative expenses $ 15,154 $ 14,359 $ 27,995Lease operating expenses — 636 2,609
Total stock-based compensation expensed 15,154 14,995 30,604Stock-based compensation capitalized 4,567 6,047 8,681Total cost of stock-based compensation arrangements $ 19,721 $ 21,042 $ 39,285
Income tax benefit recognized for stock-based compensationarrangements $ 5,759 $ 5,698 $ 11,630

Denbury Resources Inc. Notes to Consolidated Financial Statements
87
SARs
Prior to January 1, 2016, we granted SARs settled in stock to our employees. The SARs generally become exercisable over a three-year vesting period, with the specific terms of vesting determined at the time of grant based on guidelines established by the Compensation Committee of the Board of Directors. The SARs expire over terms not to exceed 10 yearsfrom the date of grant, 90 days after termination of employment, 90 days or one year after permanent disability, depending on the award, or one year after the death of the optionee. The SARs were granted with a strike price equal to the fair market value at the time of grant, which is generally defined as the closing price on the NYSE on the date of grant.
The following is a summary of our SAR activity:
Numberof Awards
WeightedAverage
Exercise Price
Weighted AverageRemaining
Contractual Life(in years)
AggregateIntrinsic Value(in thousands)
Outstanding at December 31, 2016 5,940,744 $ 13.57Granted — —Exercised — —Forfeited (193,874) 7.35Expired (2,080,845) 15.04Outstanding at December 31, 2017 3,666,025 13.07 2.6 $ —
Exercisable at end of period 3,053,868 $ 14.19 2.3 $ —
The following is a summary of the total intrinsic value of SARs exercised and grant-date fair value of SARs vested:
Year Ended December 31,In thousands 2017 2016 2015Intrinsic value of SARs exercised $ — $ — $ 60Grant-date fair value of SARs vested 1,818 4,787 6,534
As of December 31, 2017, there was $34 thousand of total compensation cost to be recognized in future periods related
to nonvested share-based SAR compensation arrangements. The cost is expected to be recognized over a weighted-average period of 0.2 years. There were no tax benefits realized from the exercises of SARs for the years ended December 31, 2017, 2016 or 2015.
Restricted Stock
We grant non-performance-based restricted stock to employees and directors as part of our long-term compensation program. Holders of non-performance-based restricted stock awards have the rights of owning non-restricted stock (including voting rights) except that the holders are not entitled to delivery of a portion thereof until certain requirements are met. Beginning in 2014, non-performance-based restricted stock awards provide the holders with forfeitable dividend equivalent rights which vests with the underlying shares. Non-performance-based restricted stock vests over a three-year vesting period, with the specific terms of vesting determined at the time of grant.
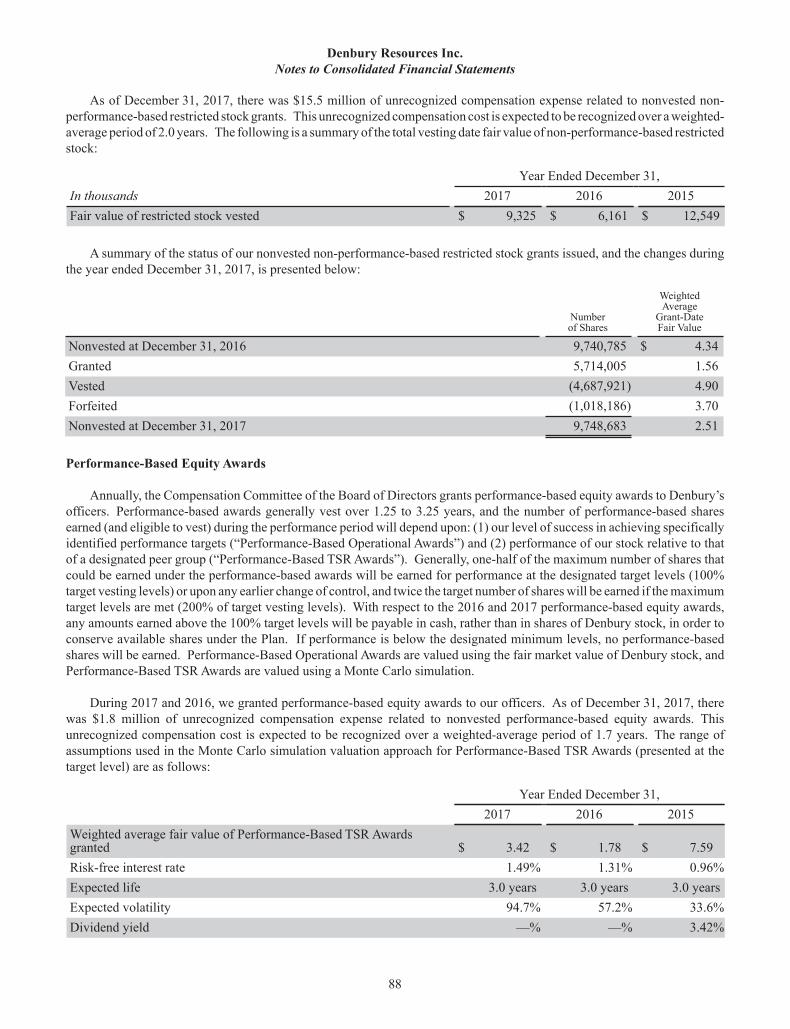
Denbury Resources Inc. Notes to Consolidated Financial Statements
88
As of December 31, 2017, there was $15.5 million of unrecognized compensation expense related to nonvested non-performance-based restricted stock grants. This unrecognized compensation cost is expected to be recognized over a weighted-average period of 2.0 years. The following is a summary of the total vesting date fair value of non-performance-based restricted stock:
Year Ended December 31,In thousands 2017 2016 2015Fair value of restricted stock vested $ 9,325 $ 6,161 $ 12,549
A summary of the status of our nonvested non-performance-based restricted stock grants issued, and the changes during the year ended December 31, 2017, is presented below:
Numberof Shares
WeightedAverage
Grant-DateFair Value
Nonvested at December 31, 2016 9,740,785 $ 4.34Granted 5,714,005 1.56Vested (4,687,921) 4.90Forfeited (1,018,186) 3.70Nonvested at December 31, 2017 9,748,683 2.51
Performance-Based Equity Awards
Annually, the Compensation Committee of the Board of Directors grants performance-based equity awards to Denbury’s officers. Performance-based awards generally vest over 1.25 to 3.25 years, and the number of performance-based shares earned (and eligible to vest) during the performance period will depend upon: (1) our level of success in achieving specifically identified performance targets (“Performance-Based Operational Awards”) and (2) performance of our stock relative to that of a designated peer group (“Performance-Based TSR Awards”). Generally, one-half of the maximum number of shares that could be earned under the performance-based awards will be earned for performance at the designated target levels (100% target vesting levels) or upon any earlier change of control, and twice the target number of shares will be earned if the maximum target levels are met (200% of target vesting levels). With respect to the 2016 and 2017 performance-based equity awards, any amounts earned above the 100% target levels will be payable in cash, rather than in shares of Denbury stock, in order to conserve available shares under the Plan. If performance is below the designated minimum levels, no performance-based shares will be earned. Performance-Based Operational Awards are valued using the fair market value of Denbury stock, and Performance-Based TSR Awards are valued using a Monte Carlo simulation.
During 2017 and 2016, we granted performance-based equity awards to our officers. As of December 31, 2017, there was $1.8 million of unrecognized compensation expense related to nonvested performance-based equity awards. This unrecognized compensation cost is expected to be recognized over a weighted-average period of 1.7 years. The range of assumptions used in the Monte Carlo simulation valuation approach for Performance-Based TSR Awards (presented at the target level) are as follows:
Year Ended December 31, 2017 2016 2015Weighted average fair value of Performance-Based TSR Awardsgranted $ 3.42 $ 1.78 $ 7.59Risk-free interest rate 1.49% 1.31% 0.96%Expected life 3.0 years 3.0 years 3.0 yearsExpected volatility 94.7% 57.2% 33.6%Dividend yield —% —% 3.42%
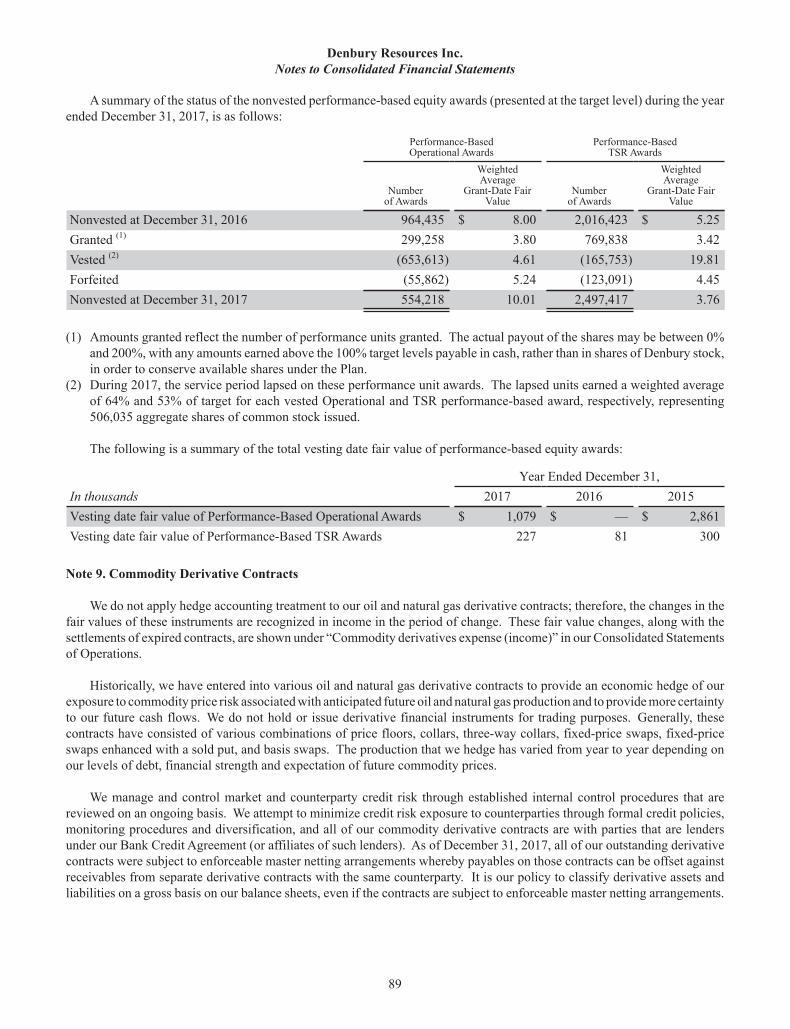
Denbury Resources Inc. Notes to Consolidated Financial Statements
89
A summary of the status of the nonvested performance-based equity awards (presented at the target level) during the year ended December 31, 2017, is as follows:
Performance-BasedOperational Awards
Performance-BasedTSR Awards
Numberof Awards
WeightedAverage
Grant-Date FairValue
Numberof Awards
WeightedAverage
Grant-Date FairValue
Nonvested at December 31, 2016 964,435 $ 8.00 2,016,423 $ 5.25Granted (1) 299,258 3.80 769,838 3.42Vested (2) (653,613) 4.61 (165,753) 19.81Forfeited (55,862) 5.24 (123,091) 4.45Nonvested at December 31, 2017 554,218 10.01 2,497,417 3.76
(1) Amounts granted reflect the number of performance units granted. The actual payout of the shares may be between 0%and 200%, with any amounts earned above the 100% target levels payable in cash, rather than in shares of Denbury stock, in order to conserve available shares under the Plan.
(2) During 2017, the service period lapsed on these performance unit awards. The lapsed units earned a weighted average of 64% and 53% of target for each vested Operational and TSR performance-based award, respectively, representing 506,035 aggregate shares of common stock issued.
The following is a summary of the total vesting date fair value of performance-based equity awards:
Year Ended December 31,In thousands 2017 2016 2015Vesting date fair value of Performance-Based Operational Awards $ 1,079 $ — $ 2,861Vesting date fair value of Performance-Based TSR Awards 227 81 300
Note 9. Commodity Derivative Contracts
We do not apply hedge accounting treatment to our oil and natural gas derivative contracts; therefore, the changes in the fair values of these instruments are recognized in income in the period of change. These fair value changes, along with the settlements of expired contracts, are shown under “Commodity derivatives expense (income)” in our Consolidated Statements of Operations.
Historically, we have entered into various oil and natural gas derivative contracts to provide an economic hedge of our exposure to commodity price risk associated with anticipated future oil and natural gas production and to provide more certainty to our future cash flows. We do not hold or issue derivative financial instruments for trading purposes. Generally, these contracts have consisted of various combinations of price floors, collars, three-way collars, fixed-price swaps, fixed-price swaps enhanced with a sold put, and basis swaps. The production that we hedge has varied from year to year depending on our levels of debt, financial strength and expectation of future commodity prices.
We manage and control market and counterparty credit risk through established internal control procedures that are reviewed on an ongoing basis. We attempt to minimize credit risk exposure to counterparties through formal credit policies, monitoring procedures and diversification, and all of our commodity derivative contracts are with parties that are lenders under our Bank Credit Agreement (or affiliates of such lenders). As of December 31, 2017, all of our outstanding derivative contracts were subject to enforceable master netting arrangements whereby payables on those contracts can be offset against receivables from separate derivative contracts with the same counterparty. It is our policy to classify derivative assets and liabilities on a gross basis on our balance sheets, even if the contracts are subject to enforceable master netting arrangements.
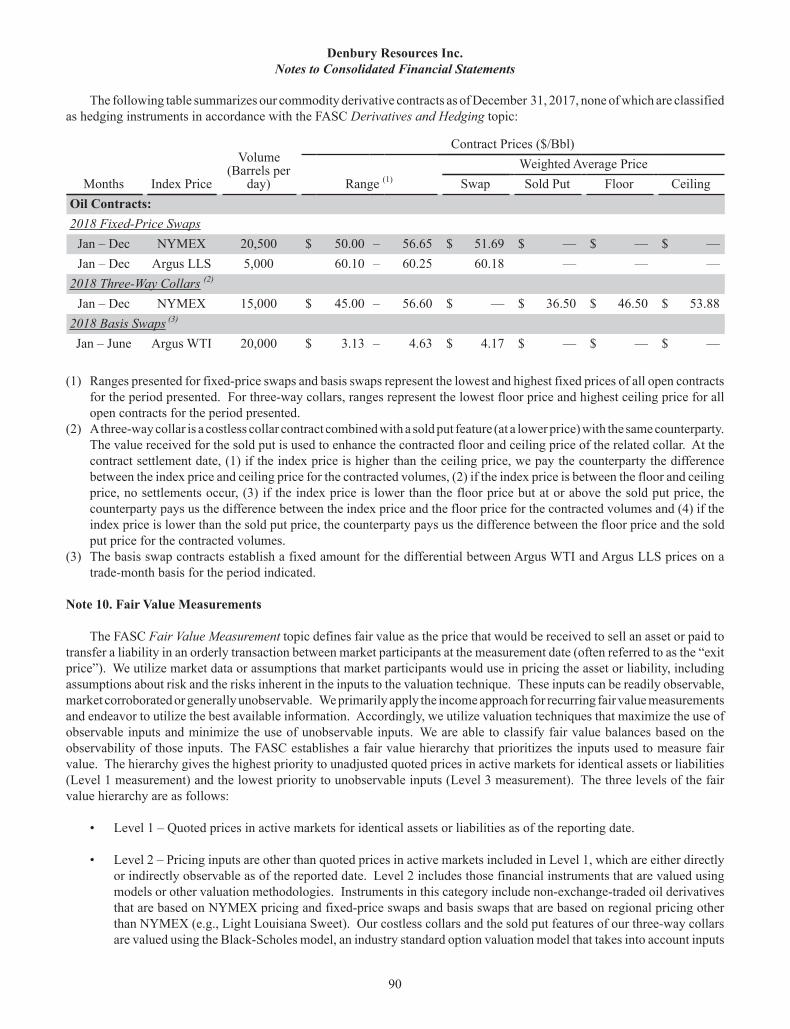
Denbury Resources Inc. Notes to Consolidated Financial Statements
90
The following table summarizes our commodity derivative contracts as of December 31, 2017, none of which are classified as hedging instruments in accordance with the FASC Derivatives and Hedging topic:
Months Index Price
Volume(Barrels per
day)
Contract Prices ($/Bbl)
Range (1) Weighted Average Price
Swap Sold Put Floor CeilingOil Contracts:2018 Fixed-Price Swaps
Jan – Dec NYMEX 20,500 $ 50.00 – 56.65 $ 51.69 $ — $ — $ —Jan – Dec Argus LLS 5,000 60.10 – 60.25 60.18 — — —
2018 Three-Way Collars (2)
Jan – Dec NYMEX 15,000 $ 45.00 – 56.60 $ — $ 36.50 $ 46.50 $ 53.882018 Basis Swaps (3)
Jan – June Argus WTI 20,000 $ 3.13 – 4.63 $ 4.17 $ — $ — $ —
(1) Ranges presented for fixed-price swaps and basis swaps represent the lowest and highest fixed prices of all open contracts for the period presented. For three-way collars, ranges represent the lowest floor price and highest ceiling price for all open contracts for the period presented.
(2) A three-way collar is a costless collar contract combined with a sold put feature (at a lower price) with the same counterparty. The value received for the sold put is used to enhance the contracted floor and ceiling price of the related collar. At the contract settlement date, (1) if the index price is higher than the ceiling price, we pay the counterparty the difference between the index price and ceiling price for the contracted volumes, (2) if the index price is between the floor and ceiling price, no settlements occur, (3) if the index price is lower than the floor price but at or above the sold put price, the counterparty pays us the difference between the index price and the floor price for the contracted volumes and (4) if the index price is lower than the sold put price, the counterparty pays us the difference between the floor price and the sold put price for the contracted volumes.
(3) The basis swap contracts establish a fixed amount for the differential between Argus WTI and Argus LLS prices on a trade-month basis for the period indicated.
Note 10. Fair Value Measurements
The FASC Fair Value Measurement topic defines fair value as the price that would be received to sell an asset or paid to transfer a liability in an orderly transaction between market participants at the measurement date (often referred to as the “exit price”). We utilize market data or assumptions that market participants would use in pricing the asset or liability, including assumptions about risk and the risks inherent in the inputs to the valuation technique. These inputs can be readily observable, market corroborated or generally unobservable. We primarily apply the income approach for recurring fair value measurements and endeavor to utilize the best available information. Accordingly, we utilize valuation techniques that maximize the use of observable inputs and minimize the use of unobservable inputs. We are able to classify fair value balances based on the observability of those inputs. The FASC establishes a fair value hierarchy that prioritizes the inputs used to measure fair value. The hierarchy gives the highest priority to unadjusted quoted prices in active markets for identical assets or liabilities (Level 1 measurement) and the lowest priority to unobservable inputs (Level 3 measurement). The three levels of the fair value hierarchy are as follows:
• Level 1 – Quoted prices in active markets for identical assets or liabilities as of the reporting date.
• Level 2 – Pricing inputs are other than quoted prices in active markets included in Level 1, which are either directly or indirectly observable as of the reported date. Level 2 includes those financial instruments that are valued using models or other valuation methodologies. Instruments in this category include non-exchange-traded oil derivatives that are based on NYMEX pricing and fixed-price swaps and basis swaps that are based on regional pricing other than NYMEX (e.g., Light Louisiana Sweet). Our costless collars and the sold put features of our three-way collars are valued using the Black-Scholes model, an industry standard option valuation model that takes into account inputs
Denbury Resources Inc. Notes to Consolidated Financial Statements
91
such as contractual prices for the underlying instruments, maturity, quoted forward prices for commodities, interest rates, volatility factors and credit worthiness, as well as other relevant economic measures. Substantially all of these assumptions are observable in the marketplace throughout the full term of the instrument, can be derived from observable data or are supported by observable levels at which transactions are executed in the marketplace.
• Level 3 – Pricing inputs include significant inputs that are generally less observable. These inputs may be used with internally developed methodologies that result in management’s best estimate of fair value. As of December 31, 2017, we had no Level 3 recurring fair value measurements. Previous instruments in this category included non-exchange-traded costless collars and three-way collars that were based on regional pricing other than NYMEX (e.g., Light Louisiana Sweet). The valuation models utilized for costless collars and three-way collars were consistent with the methodologies described above; however, the implied volatilities utilized in the valuation of Level 3 instruments were developed using a benchmark, which was considered a significant unobservable input.
We adjust the valuations from the valuation model for nonperformance risk, using our estimate of the counterparty’s credit quality for asset positions and our credit quality for liability positions. We use multiple sources of third-party credit data in determining counterparty nonperformance risk, including credit default swaps.
The following table sets forth by level within the fair value hierarchy our financial assets and liabilities that were accounted for at fair value on a recurring basis as of December 31, 2017 and 2016:
Fair Value Measurements Using:
Quoted Pricesin ActiveMarkets
SignificantOther
ObservableInputs
SignificantUnobservable
InputsIn thousands (Level 1) (Level 2) (Level 3) TotalDecember 31, 2017 Liabilities
Oil derivative contracts – current $ — $ (99,061) $ — $ (99,061)Total Liabilities $ — $ (99,061) $ — $ (99,061)
December 31, 2016 Liabilities
Oil derivative contracts – current $ — $ (68,753) $ (526) $ (69,279)Total Liabilities $ — $ (68,753) $ (526) $ (69,279)
Since we do not apply hedge accounting for our commodity derivative contracts, any gains and losses on our assets and liabilities are included in “Commodity derivatives expense (income)” in the accompanying Consolidated Statements of Operations.
Denbury Resources Inc. Notes to Consolidated Financial Statements
92
Level 3 Fair Value Measurements
The following table summarizes the changes in the fair value of our Level 3 assets and liabilities for the years ended December 31, 2017 and 2016:
Year Ended December 31,In thousands 2017 2016Fair value of Level 3 instruments, beginning of year $ (526) $ 52,834
Fair value adjustments on commodity derivatives 526 (2,135)Receipt on settlements of commodity derivatives — (51,225)
Fair value of Level 3 instruments, end of year $ — $ (526)
The amount of total losses for the period included in earnings attributable to the changein unrealized losses relating to assets or liabilities still held at the reporting date $ — $ (526)
Other Fair Value Measurements
The carrying value of our loans under our Bank Credit Agreement approximate fair value, as they are subject to short-term floating interest rates that approximate the rates available to us for those periods. We use a market approach to determine the fair value of our fixed-rate long-term debt using observable market data. The fair values of our senior secured second lien notes, senior notes, and senior subordinated notes are based on quoted market prices, which are considered Level 1 measurements under the fair value hierarchy. The estimated fair value of the principal amount of our debt as of December 31, 2017 and 2016, excluding pipeline financing and capital lease obligations, was $2,260.6 million and $2,327.8 million, respectively. We have other financial instruments consisting primarily of cash, cash equivalents, short-term receivables and payables that approximate fair value due to the nature of the instrument and the relatively short maturities.
Note 11. Commitments and Contingencies
Leases
We lease office space, equipment and vehicles that have non-cancelable lease terms. Currently, our outstanding leases have terms up to 8 years. We have subleased part of the office space included in our operating leases for which we received rental payments. The following table summarizes operating lease payments paid and sublease rentals received during the periods indicated:
Year Ended December 31,In thousands 2017 2016 2015Operating lease payments $ 25,075 $ 22,744 $ 29,403Sublease rental receipts 4,275 3,074 3,698
Denbury Resources Inc. Notes to Consolidated Financial Statements
93
The following tables summarize by year the remaining non-cancelable future payments under our leases as of December 31, 2017:
In thousands
Pipelineand Capital
Leases2018 $ 43,1052019 40,2152020 27,8722021 26,0922022 27,827Thereafter 137,342
Total minimum lease payments 302,453Less: Amount representing interest (83,726)
Present value of minimum lease payments $ 218,727
In thousandsOperating
Leases2018 $ 11,3152019 10,6752020 9,7872021 10,0202022 10,255Thereafter 28,799
Total minimum lease payments $ 80,851
In addition, we expect to receive approximately $3.5 million for 2018 through 2019 under our sublease agreements.
Commitments
We have entered into long-term commitments to purchase CO2 that are either non-cancelable or cancelable only upon the occurrence of specified future events. The commitments continue for up to 15 years. The price we will pay for CO2generally varies depending on the amount of CO2 delivered and the price of oil. Once all commitments have commenced, our annual commitment under these contracts could range from $14 million to $33 million per year, assuming a $60 per Bbl NYMEX oil price.
The Company has a CO2 offtake agreement with Mississippi Power Company (“MSPC”), providing for our purchase of CO2 generated as a byproduct of the gasification portion of their Kemper County energy facility. After receiving minor amounts of CO2 from the facility during the first half of 2017, in June 2017, MSPC announced the immediate and indefinite suspension of startup and operations activities of the lignite coal gasification portion of the Kemper County energy facility. As a result of this suspension, the Company is not expecting to receive any CO2 from this facility for the foreseeable future.
We are party to long-term contracts that require us to deliver CO2 to our industrial CO2 customers at various contracted prices, plus we have a CO2 delivery obligation to Genesis related to one CO2 volumetric production payment (“VPP”). Based upon the maximum amounts deliverable as stated in the industrial contracts and the VPP, we estimate that we may be obligated to deliver up to 633 Bcf of CO2 to these customers over the next 15 years. The maximum volume required in any given year is approximately 176 MMcf/d, which we judge to be minor given the size of our Jackson Dome proved CO2 reserves at
Denbury Resources Inc. Notes to Consolidated Financial Statements
94
December 31, 2017, our current production capabilities and our projected levels of CO2 usage for our own tertiary flooding program.
Litigation
We are involved in various lawsuits, claims and regulatory proceedings incidental to our businesses. While we currently believe that the ultimate outcome of these proceedings, individually and in the aggregate, will not have a material adverse effect on our financial position, results of operations or cash flows, litigation is subject to inherent uncertainties. Although a single or multiple adverse rulings or settlements could possibly have a material adverse effect on our finances, we only accrue for losses from litigation and claims if we determine that a loss is probable and the amount can be reasonably estimated.
Riley Ridge Helium Supply Contract Claim
As part of our 2010 and 2011 acquisitions of the Riley Ridge Unit and associated gas processing facility that was under construction, the Company assumed a 20-year helium supply contract under which we agreed to supply the helium separated from the full well stream by operation of the gas processing facility to a third-party purchaser, APMTG Helium, LLC. The helium supply contract provides for the delivery of a minimum contracted quantity of helium, subject to adjustment after startup of the Riley Ridge gas processing facility, with liquidated damages payable if specified quantities of helium are not supplied in accordance with the terms of the contract. The liquidated damages are specified in the contract at up to $8.0 million per contract year and are capped at an aggregate of $46.0 million over the term of the contract. As the gas processing facility has been shut-in since mid-2014, we have not been able to supply helium under the helium supply contract. APMTG Helium, LLC filed a case in November 2014 in the Ninth Judicial District Court of Sublette County, Wyoming, claiming multiple years of liquidated damages for non-delivery of volumes of helium specified under the helium supply contract. In response, we are taking the position that our contractual obligations are excused by virtue of events that fall within the force majeure provisions in the helium supply contract. The evidentiary phase of the trial closed on November 29, 2017. The parties submitted written closing briefs to the District Court on February 23, 2018 and have agreed to submit written rebuttals to such closing briefs by March 30, 2018. Following those submissions, the case will be fully submitted for determination by the District Court. We currently expect a ruling to be made in the second or third quarter of 2018. The Company plans to continue to vigorously defend its position, but we are unable to predict at this time the outcome of this dispute.
Other Contingencies
We are subject to audits for various taxes (income, sales and use, and severance) in the various states in which we operate, and from time to time receive assessments for potential taxes that we may owe. In the past, settlement of these matters has not had a material adverse financial impact on us, and currently we have no material assessments for potential taxes.
We are subject to various possible contingencies that arise primarily from interpretation of federal and state laws and regulations affecting the oil and natural gas industry. Such contingencies include differing interpretations as to the prices at which oil and natural gas sales may be made, the prices at which royalty owners may be paid for production from their leases, environmental issues and other matters. Although we believe that we have complied with the various laws and regulations, administrative rulings and interpretations thereof, adjustments could be required as new interpretations and regulations are issued. In addition, production rates, marketing and environmental matters are subject to regulation by various federal and state agencies.
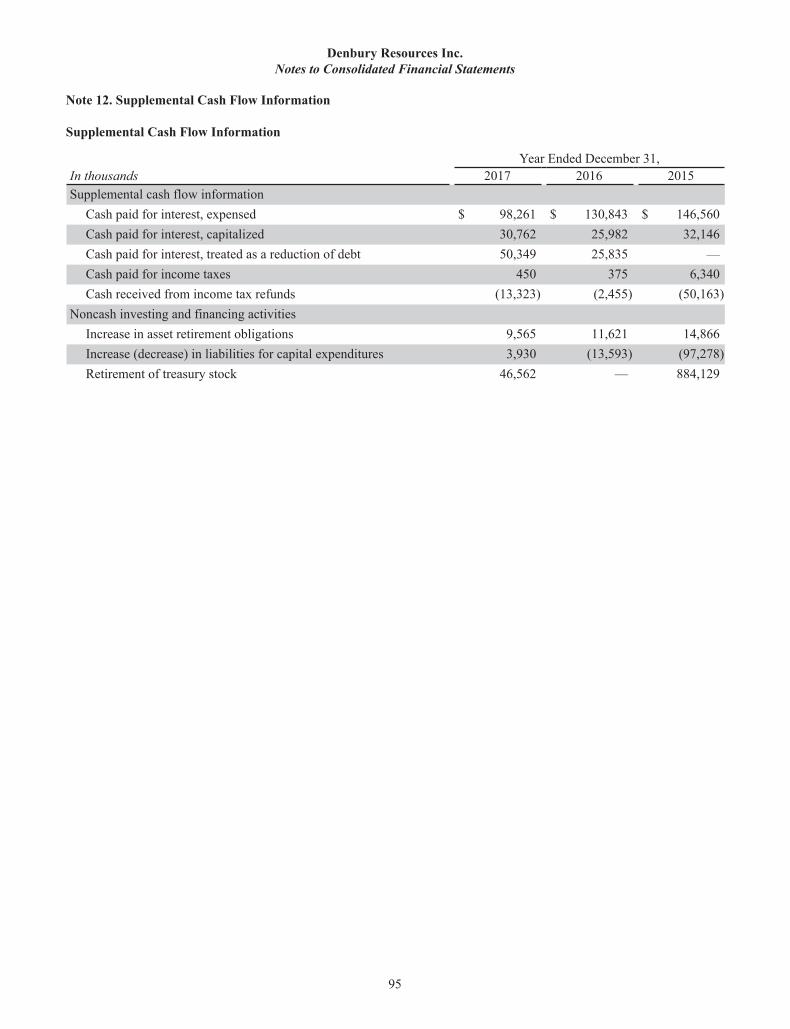
Denbury Resources Inc. Notes to Consolidated Financial Statements
95
Note 12. Supplemental Cash Flow Information
Supplemental Cash Flow Information
Year Ended December 31,In thousands 2017 2016 2015Supplemental cash flow information
Cash paid for interest, expensed $ 98,261 $ 130,843 $ 146,560Cash paid for interest, capitalized 30,762 25,982 32,146Cash paid for interest, treated as a reduction of debt 50,349 25,835 —Cash paid for income taxes 450 375 6,340Cash received from income tax refunds (13,323) (2,455) (50,163)
Noncash investing and financing activities Increase in asset retirement obligations 9,565 11,621 14,866Increase (decrease) in liabilities for capital expenditures 3,930 (13,593) (97,278)Retirement of treasury stock 46,562 — 884,129
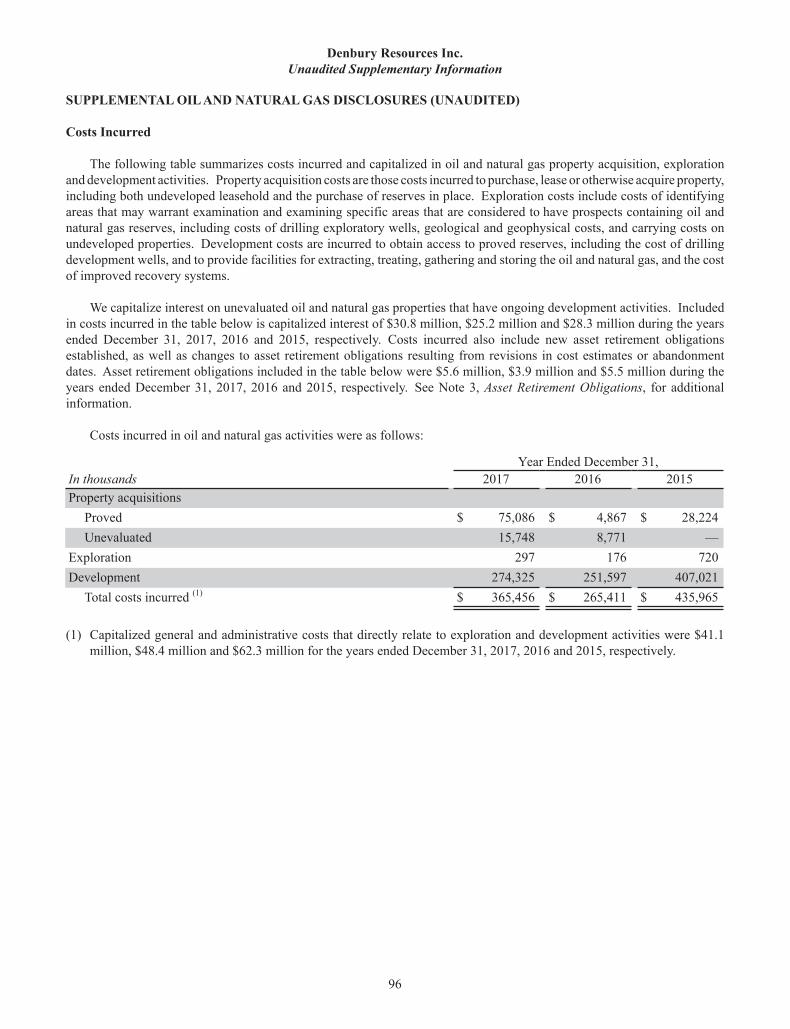
Denbury Resources Inc. Unaudited Supplementary Information
96
SUPPLEMENTAL OIL AND NATURAL GAS DISCLOSURES (UNAUDITED)
Costs Incurred
The following table summarizes costs incurred and capitalized in oil and natural gas property acquisition, exploration and development activities. Property acquisition costs are those costs incurred to purchase, lease or otherwise acquire property, including both undeveloped leasehold and the purchase of reserves in place. Exploration costs include costs of identifying areas that may warrant examination and examining specific areas that are considered to have prospects containing oil and natural gas reserves, including costs of drilling exploratory wells, geological and geophysical costs, and carrying costs on undeveloped properties. Development costs are incurred to obtain access to proved reserves, including the cost of drilling development wells, and to provide facilities for extracting, treating, gathering and storing the oil and natural gas, and the cost of improved recovery systems.
We capitalize interest on unevaluated oil and natural gas properties that have ongoing development activities. Included in costs incurred in the table below is capitalized interest of $30.8 million, $25.2 million and $28.3 million during the years ended December 31, 2017, 2016 and 2015, respectively. Costs incurred also include new asset retirement obligations established, as well as changes to asset retirement obligations resulting from revisions in cost estimates or abandonment dates. Asset retirement obligations included in the table below were $5.6 million, $3.9 million and $5.5 million during the years ended December 31, 2017, 2016 and 2015, respectively. See Note 3, Asset Retirement Obligations, for additional information.
Costs incurred in oil and natural gas activities were as follows:
Year Ended December 31,In thousands 2017 2016 2015Property acquisitions
Proved $ 75,086 $ 4,867 $ 28,224Unevaluated 15,748 8,771 —
Exploration 297 176 720Development 274,325 251,597 407,021
Total costs incurred (1) $ 365,456 $ 265,411 $ 435,965
(1) Capitalized general and administrative costs that directly relate to exploration and development activities were $41.1 million, $48.4 million and $62.3 million for the years ended December 31, 2017, 2016 and 2015, respectively.
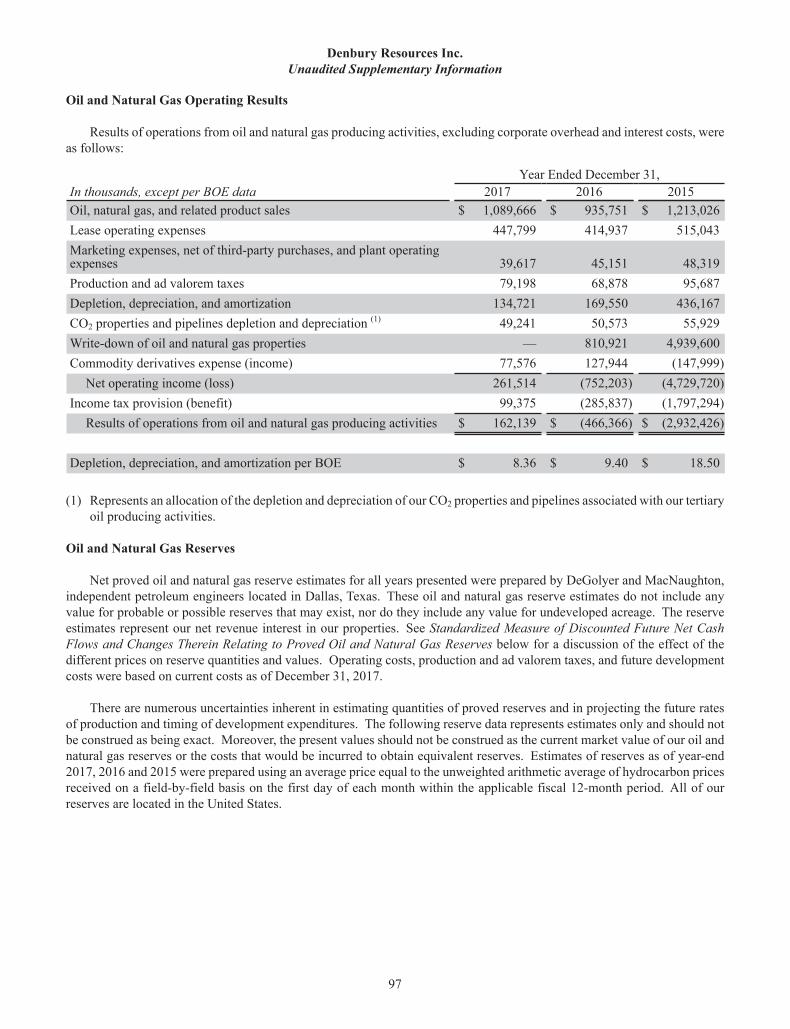
Denbury Resources Inc. Unaudited Supplementary Information
97
Oil and Natural Gas Operating Results
Results of operations from oil and natural gas producing activities, excluding corporate overhead and interest costs, were as follows:
Year Ended December 31,In thousands, except per BOE data 2017 2016 2015Oil, natural gas, and related product sales $ 1,089,666 $ 935,751 $ 1,213,026Lease operating expenses 447,799 414,937 515,043Marketing expenses, net of third-party purchases, and plant operatingexpenses 39,617 45,151 48,319Production and ad valorem taxes 79,198 68,878 95,687Depletion, depreciation, and amortization 134,721 169,550 436,167CO2 properties and pipelines depletion and depreciation (1) 49,241 50,573 55,929Write-down of oil and natural gas properties — 810,921 4,939,600Commodity derivatives expense (income) 77,576 127,944 (147,999)
Net operating income (loss) 261,514 (752,203) (4,729,720)Income tax provision (benefit) 99,375 (285,837) (1,797,294)
Results of operations from oil and natural gas producing activities $ 162,139 $ (466,366) $ (2,932,426)
Depletion, depreciation, and amortization per BOE $ 8.36 $ 9.40 $ 18.50
(1) Represents an allocation of the depletion and depreciation of our CO2 properties and pipelines associated with our tertiary oil producing activities.
Oil and Natural Gas Reserves
Net proved oil and natural gas reserve estimates for all years presented were prepared by DeGolyer and MacNaughton, independent petroleum engineers located in Dallas, Texas. These oil and natural gas reserve estimates do not include any value for probable or possible reserves that may exist, nor do they include any value for undeveloped acreage. The reserve estimates represent our net revenue interest in our properties. See Standardized Measure of Discounted Future Net Cash Flows and Changes Therein Relating to Proved Oil and Natural Gas Reserves below for a discussion of the effect of the different prices on reserve quantities and values. Operating costs, production and ad valorem taxes, and future development costs were based on current costs as of December 31, 2017.
There are numerous uncertainties inherent in estimating quantities of proved reserves and in projecting the future rates of production and timing of development expenditures. The following reserve data represents estimates only and should not be construed as being exact. Moreover, the present values should not be construed as the current market value of our oil and natural gas reserves or the costs that would be incurred to obtain equivalent reserves. Estimates of reserves as of year-end 2017, 2016 and 2015 were prepared using an average price equal to the unweighted arithmetic average of hydrocarbon prices received on a field-by-field basis on the first day of each month within the applicable fiscal 12-month period. All of our reserves are located in the United States.
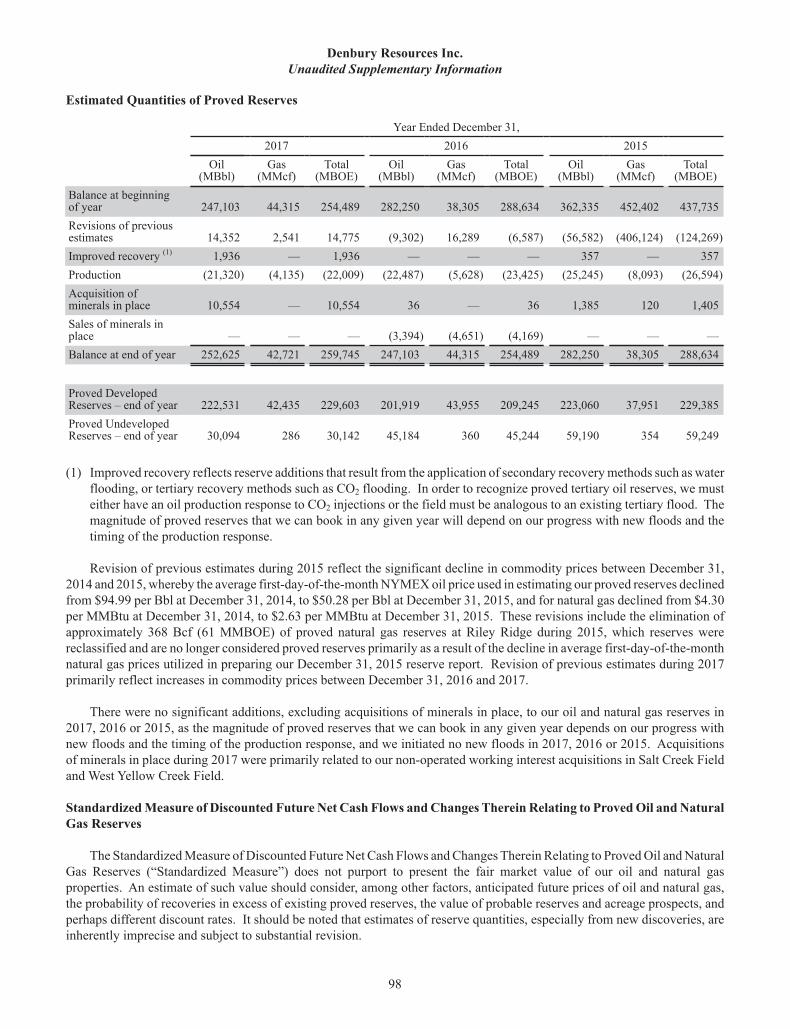
Denbury Resources Inc. Unaudited Supplementary Information
98
Estimated Quantities of Proved Reserves
Year Ended December 31, 2017 2016 2015
Oil(MBbl)
Gas(MMcf)
Total(MBOE)
Oil(MBbl)
Gas(MMcf)
Total(MBOE)
Oil(MBbl)
Gas(MMcf)
Total(MBOE)
Balance at beginningof year 247,103 44,315 254,489 282,250 38,305 288,634 362,335 452,402 437,735Revisions of previousestimates 14,352 2,541 14,775 (9,302) 16,289 (6,587) (56,582) (406,124) (124,269)Improved recovery (1) 1,936 — 1,936 — — — 357 — 357Production (21,320) (4,135) (22,009) (22,487) (5,628) (23,425) (25,245) (8,093) (26,594)Acquisition ofminerals in place 10,554 — 10,554 36 — 36 1,385 120 1,405Sales of minerals inplace — — — (3,394) (4,651) (4,169) — — —Balance at end of year 252,625 42,721 259,745 247,103 44,315 254,489 282,250 38,305 288,634
Proved DevelopedReserves – end of year 222,531 42,435 229,603 201,919 43,955 209,245 223,060 37,951 229,385Proved UndevelopedReserves – end of year 30,094 286 30,142 45,184 360 45,244 59,190 354 59,249
(1) Improved recovery reflects reserve additions that result from the application of secondary recovery methods such as water flooding, or tertiary recovery methods such as CO2 flooding. In order to recognize proved tertiary oil reserves, we must either have an oil production response to CO2 injections or the field must be analogous to an existing tertiary flood. The magnitude of proved reserves that we can book in any given year will depend on our progress with new floods and the timing of the production response.
Revision of previous estimates during 2015 reflect the significant decline in commodity prices between December 31, 2014 and 2015, whereby the average first-day-of-the-month NYMEX oil price used in estimating our proved reserves declined from $94.99 per Bbl at December 31, 2014, to $50.28 per Bbl at December 31, 2015, and for natural gas declined from $4.30 per MMBtu at December 31, 2014, to $2.63 per MMBtu at December 31, 2015. These revisions include the elimination of approximately 368 Bcf (61 MMBOE) of proved natural gas reserves at Riley Ridge during 2015, which reserves were reclassified and are no longer considered proved reserves primarily as a result of the decline in average first-day-of-the-month natural gas prices utilized in preparing our December 31, 2015 reserve report. Revision of previous estimates during 2017 primarily reflect increases in commodity prices between December 31, 2016 and 2017.
There were no significant additions, excluding acquisitions of minerals in place, to our oil and natural gas reserves in 2017, 2016 or 2015, as the magnitude of proved reserves that we can book in any given year depends on our progress with new floods and the timing of the production response, and we initiated no new floods in 2017, 2016 or 2015. Acquisitions of minerals in place during 2017 were primarily related to our non-operated working interest acquisitions in Salt Creek Field and West Yellow Creek Field.
Standardized Measure of Discounted Future Net Cash Flows and Changes Therein Relating to Proved Oil and Natural Gas Reserves
The Standardized Measure of Discounted Future Net Cash Flows and Changes Therein Relating to Proved Oil and Natural Gas Reserves (“Standardized Measure”) does not purport to present the fair market value of our oil and natural gas properties. An estimate of such value should consider, among other factors, anticipated future prices of oil and natural gas, the probability of recoveries in excess of existing proved reserves, the value of probable reserves and acreage prospects, and perhaps different discount rates. It should be noted that estimates of reserve quantities, especially from new discoveries, are inherently imprecise and subject to substantial revision.
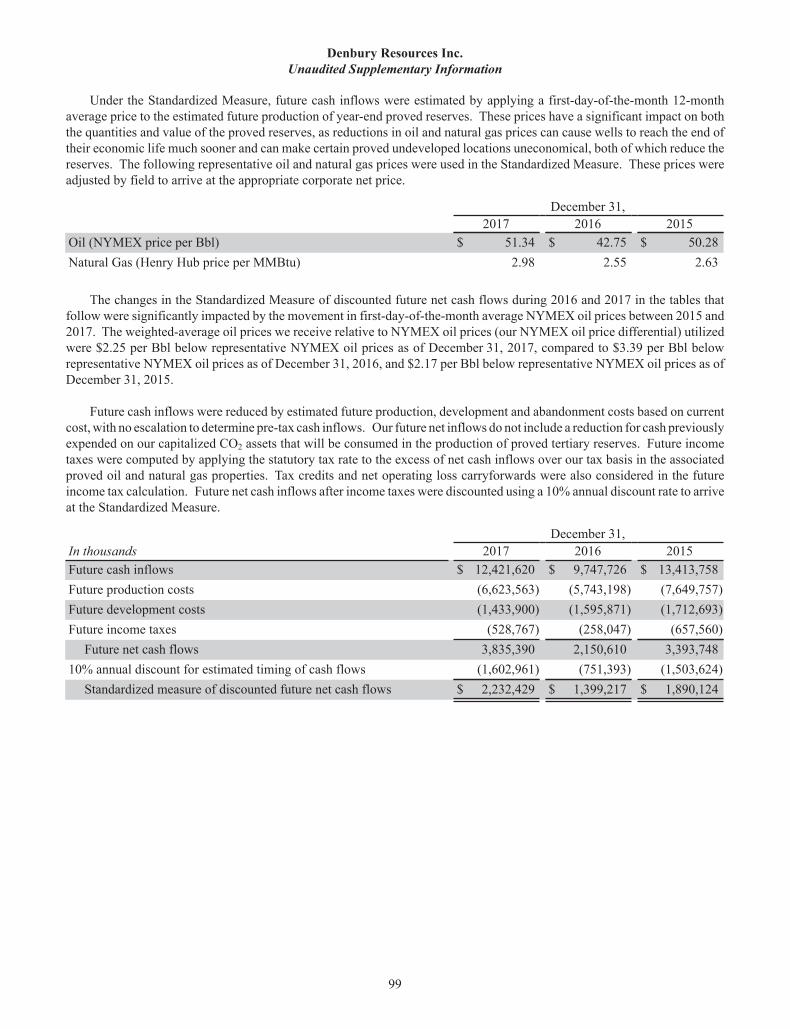
Denbury Resources Inc. Unaudited Supplementary Information
99
Under the Standardized Measure, future cash inflows were estimated by applying a first-day-of-the-month 12-month average price to the estimated future production of year-end proved reserves. These prices have a significant impact on both the quantities and value of the proved reserves, as reductions in oil and natural gas prices can cause wells to reach the end of their economic life much sooner and can make certain proved undeveloped locations uneconomical, both of which reduce the reserves. The following representative oil and natural gas prices were used in the Standardized Measure. These prices were adjusted by field to arrive at the appropriate corporate net price.
December 31, 2017 2016 2015Oil (NYMEX price per Bbl) $ 51.34 $ 42.75 $ 50.28Natural Gas (Henry Hub price per MMBtu) 2.98 2.55 2.63
The changes in the Standardized Measure of discounted future net cash flows during 2016 and 2017 in the tables that follow were significantly impacted by the movement in first-day-of-the-month average NYMEX oil prices between 2015 and 2017. The weighted-average oil prices we receive relative to NYMEX oil prices (our NYMEX oil price differential) utilized were $2.25 per Bbl below representative NYMEX oil prices as of December 31, 2017, compared to $3.39 per Bbl below representative NYMEX oil prices as of December 31, 2016, and $2.17 per Bbl below representative NYMEX oil prices as of December 31, 2015.
Future cash inflows were reduced by estimated future production, development and abandonment costs based on current cost, with no escalation to determine pre-tax cash inflows. Our future net inflows do not include a reduction for cash previously expended on our capitalized CO2 assets that will be consumed in the production of proved tertiary reserves. Future income taxes were computed by applying the statutory tax rate to the excess of net cash inflows over our tax basis in the associated proved oil and natural gas properties. Tax credits and net operating loss carryforwards were also considered in the future income tax calculation. Future net cash inflows after income taxes were discounted using a 10% annual discount rate to arrive at the Standardized Measure.
December 31,In thousands 2017 2016 2015Future cash inflows $ 12,421,620 $ 9,747,726 $ 13,413,758Future production costs (6,623,563) (5,743,198) (7,649,757)Future development costs (1,433,900) (1,595,871) (1,712,693)Future income taxes (528,767) (258,047) (657,560)
Future net cash flows 3,835,390 2,150,610 3,393,74810% annual discount for estimated timing of cash flows (1,602,961) (751,393) (1,503,624)
Standardized measure of discounted future net cash flows $ 2,232,429 $ 1,399,217 $ 1,890,124
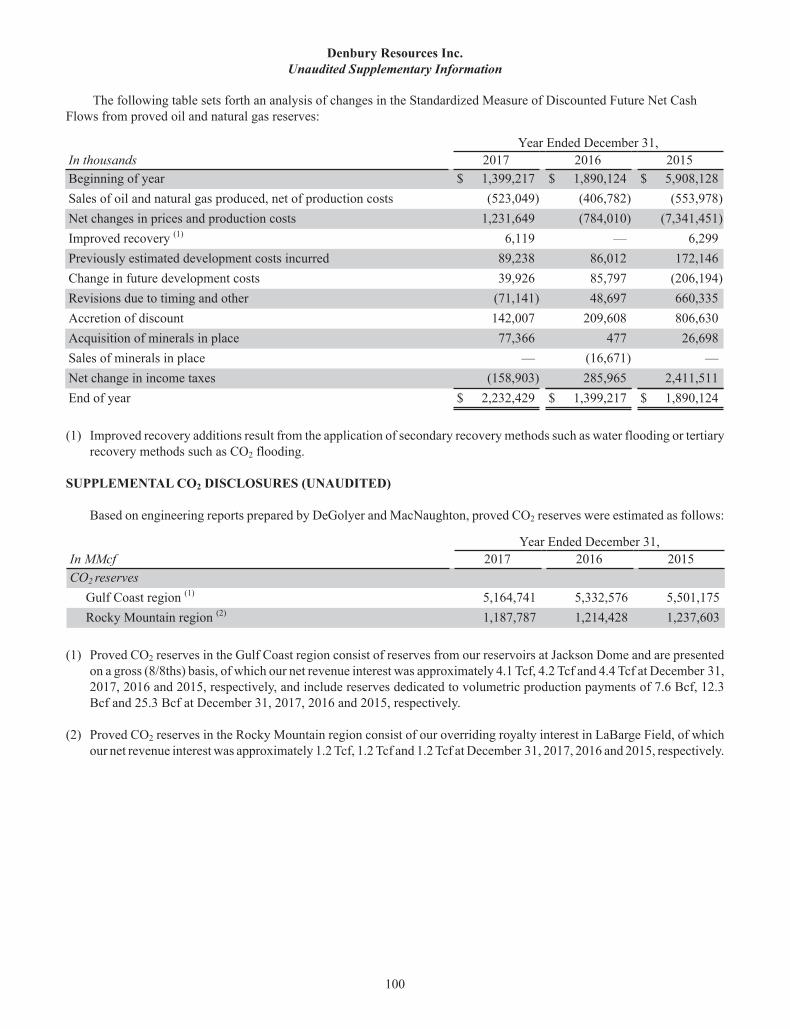
Denbury Resources Inc. Unaudited Supplementary Information
100
The following table sets forth an analysis of changes in the Standardized Measure of Discounted Future Net Cash Flows from proved oil and natural gas reserves:
Year Ended December 31,In thousands 2017 2016 2015Beginning of year $ 1,399,217 $ 1,890,124 $ 5,908,128Sales of oil and natural gas produced, net of production costs (523,049) (406,782) (553,978)Net changes in prices and production costs 1,231,649 (784,010) (7,341,451)Improved recovery (1) 6,119 — 6,299Previously estimated development costs incurred 89,238 86,012 172,146Change in future development costs 39,926 85,797 (206,194)Revisions due to timing and other (71,141) 48,697 660,335Accretion of discount 142,007 209,608 806,630Acquisition of minerals in place 77,366 477 26,698Sales of minerals in place — (16,671) —Net change in income taxes (158,903) 285,965 2,411,511End of year $ 2,232,429 $ 1,399,217 $ 1,890,124
(1) Improved recovery additions result from the application of secondary recovery methods such as water flooding or tertiary recovery methods such as CO2 flooding.
SUPPLEMENTAL CO2 DISCLOSURES (UNAUDITED)
Based on engineering reports prepared by DeGolyer and MacNaughton, proved CO2 reserves were estimated as follows:
Year Ended December 31,In MMcf 2017 2016 2015CO2 reserves
Gulf Coast region (1) 5,164,741 5,332,576 5,501,175Rocky Mountain region (2) 1,187,787 1,214,428 1,237,603
(1) Proved CO2 reserves in the Gulf Coast region consist of reserves from our reservoirs at Jackson Dome and are presented on a gross (8/8ths) basis, of which our net revenue interest was approximately 4.1 Tcf, 4.2 Tcf and 4.4 Tcf at December 31, 2017, 2016 and 2015, respectively, and include reserves dedicated to volumetric production payments of 7.6 Bcf, 12.3 Bcf and 25.3 Bcf at December 31, 2017, 2016 and 2015, respectively.
(2) Proved CO2 reserves in the Rocky Mountain region consist of our overriding royalty interest in LaBarge Field, of which our net revenue interest was approximately 1.2 Tcf, 1.2 Tcf and 1.2 Tcf at December 31, 2017, 2016 and 2015, respectively.
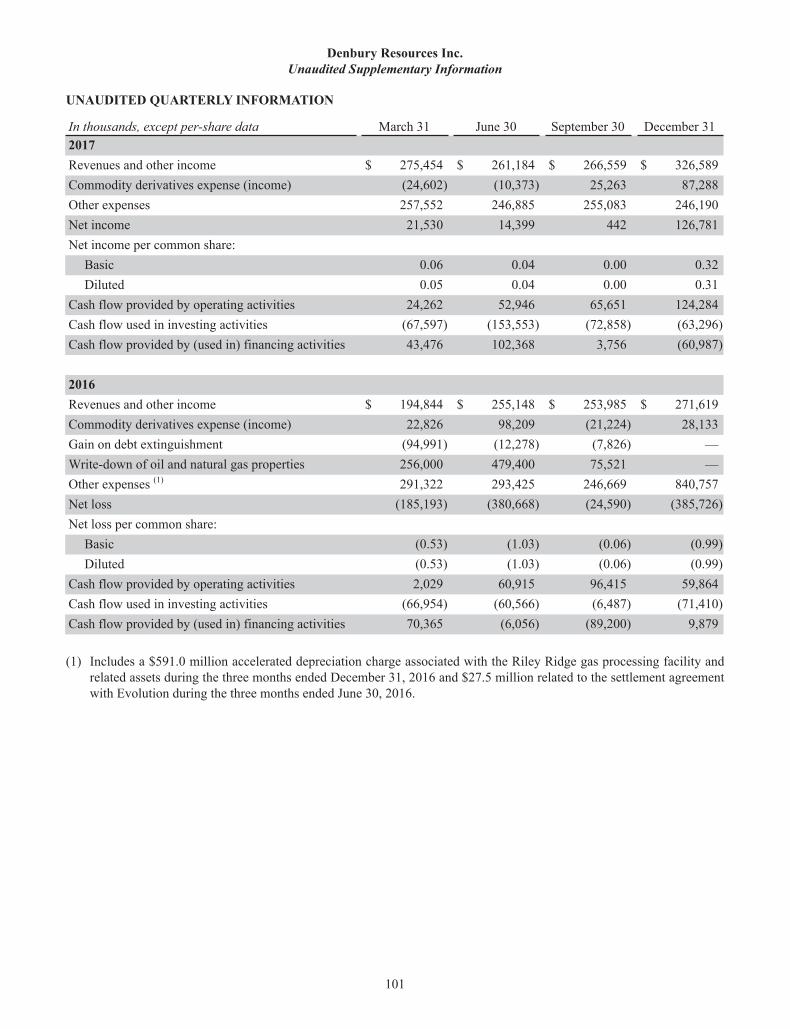
Denbury Resources Inc. Unaudited Supplementary Information
101
UNAUDITED QUARTERLY INFORMATION
In thousands, except per-share data March 31 June 30 September 30 December 312017 Revenues and other income $ 275,454 $ 261,184 $ 266,559 $ 326,589Commodity derivatives expense (income) (24,602) (10,373) 25,263 87,288Other expenses 257,552 246,885 255,083 246,190Net income 21,530 14,399 442 126,781Net income per common share:
Basic 0.06 0.04 0.00 0.32Diluted 0.05 0.04 0.00 0.31
Cash flow provided by operating activities 24,262 52,946 65,651 124,284Cash flow used in investing activities (67,597) (153,553) (72,858) (63,296)Cash flow provided by (used in) financing activities 43,476 102,368 3,756 (60,987)
2016 Revenues and other income $ 194,844 $ 255,148 $ 253,985 $ 271,619Commodity derivatives expense (income) 22,826 98,209 (21,224) 28,133Gain on debt extinguishment (94,991) (12,278) (7,826) —Write-down of oil and natural gas properties 256,000 479,400 75,521 —Other expenses (1) 291,322 293,425 246,669 840,757Net loss (185,193) (380,668) (24,590) (385,726)Net loss per common share:
Basic (0.53) (1.03) (0.06) (0.99)Diluted (0.53) (1.03) (0.06) (0.99)
Cash flow provided by operating activities 2,029 60,915 96,415 59,864Cash flow used in investing activities (66,954) (60,566) (6,487) (71,410)Cash flow provided by (used in) financing activities 70,365 (6,056) (89,200) 9,879
(1) Includes a $591.0 million accelerated depreciation charge associated with the Riley Ridge gas processing facility and related assets during the three months ended December 31, 2016 and $27.5 million related to the settlement agreement with Evolution during the three months ended June 30, 2016.
Denbury Resources Inc.
102
Item 9. Changes in and Disagreements with Accountants on Accounting and Financial Disclosure
None. Item 9A. Controls and Procedures
Evaluation of Disclosure Controls and Procedures
As of the end of the period covered by this report, an evaluation of the effectiveness of the design and operation of our disclosure controls and procedures (as defined in Rule 13a-15(e) under the Exchange Act) was performed under the supervision and with the participation of management, including our Chief Executive Officer and our Chief Financial Officer. Based on that evaluation, our Chief Executive Officer and Chief Financial Officer concluded that our disclosure controls and procedures were effective as of December 31, 2017, to ensure that information that is required to be disclosed in the reports the Company files and submits under the Securities Exchange Act of 1934 is recorded; that it is processed, summarized and reported within the time periods specified in the SEC’s rules and forms; and that information that is required to be disclosed under the Exchange Act is accumulated and communicated to management, including our Chief Executive Officer and our Chief Financial Officer, as appropriate to allow timely decisions regarding required disclosure.
Evaluation of Changes in Internal Control over Financial Reporting
Under the supervision and with the participation of our management, including our Chief Executive Officer and our Chief Financial Officer, we have determined that, during the fourth quarter of fiscal 2017, there were no changes in our internal control over financial reporting that have materially affected, or are reasonably likely to materially affect, our internal control over financial reporting.
Management’s Report on Internal Control over Financial Reporting
Our management is responsible for establishing and maintaining adequate internal control over financial reporting as defined in Rules 13a-15(f) and 15d-15(f) of the Securities Exchange Act of 1934, as amended. Under the supervision and with the participation of our management, including our Chief Executive Officer and our Chief Financial Officer, we assessed the effectiveness of our internal control over financial reporting as of the end of the period covered by this report based on the framework in “Internal Control – Integrated Framework” (2013) issued by the Committee of Sponsoring Organizations of the Treadway Commission. Based on that assessment, our Chief Executive Officer and our Chief Financial Officer concluded that our internal control over financial reporting was effective to provide reasonable assurance regarding the reliability of our financial reporting and the preparation of our financial statements for external purposes in accordance with U.S. generally accepted accounting principles.
The effectiveness of our internal control over financial reporting as of December 31, 2017, has been audited by PricewaterhouseCoopers LLP, an independent registered public accounting firm, as stated in the report that appears herein.
Important Considerations
The effectiveness of our disclosure controls and procedures and our internal control over financial reporting is subject to various inherent limitations, including cost limitations, judgments used in decision making, assumptions about the likelihood of future events, the soundness of our systems, the possibility of human error, and the risk of fraud. Moreover, projections of any evaluation of effectiveness to future periods are subject to the risk that controls may become inadequate because of changes in conditions and the risk that the degree of compliance with policies or procedures may deteriorate over time. Because of these limitations, there can be no assurance that any system of disclosure controls and procedures or internal control over financial reporting will be successful in preventing all errors or fraud or in making all material information known in a timely manner to the appropriate levels of management.
Item 9B. Other Information
None.

Denbury Resources Inc.
103
PART III
Item 10. Directors, Executive Officers and Corporate Governance
Except as disclosed below, information as to Item 10 will be set forth in the Proxy Statement (“Proxy Statement”) for the 2018 Annual Meeting of Shareholders to be held May 23, 2018 (“Annual Meeting”), and is incorporated herein by reference.
Code of Ethics
We have adopted a Code of Ethics for Senior Financial Officers. This Code of Ethics, including any amendments or waivers, is posted on our website at www.denbury.com.
Item 11. Executive Compensation
Information as to Item 11 will be set forth in the Proxy Statement for the Annual Meeting and is incorporated herein by reference.
Item 12. Security Ownership of Certain Beneficial Owners and Management and Related Stockholder Matters
Information as to Item 12 will be set forth in the Proxy Statement for the Annual Meeting and is incorporated herein by reference.
Item 13. Certain Relationships and Related Transactions, and Director Independence
Information as to Item 13 will be set forth in the Proxy Statement for the Annual Meeting and is incorporated herein by reference.
Item 14. Principal Accountant Fees and Services
Information as to Item 14 will be set forth in the Proxy Statement for the Annual Meeting and is incorporated herein by reference.
Denbury Resources Inc.
104
PART IV
Item 15. Exhibits and Financial Statement Schedules
Exhibits. The following exhibits are included as part of this report.
Exhibit No. Exhibit3(a) Second Restated Certificate of Incorporation of Denbury Resources Inc. filed with the Delaware Secretary
of State on October 30, 2014 (incorporated by reference to Exhibit 3(a) of Form 10-Q filed by the Company on November 7, 2014, File No. 001-12935).
3(b) Second Amended and Restated Bylaws of Denbury Resources Inc. as of November 4, 2014 (incorporated by reference to Exhibit 3(b) of Form 10-Q filed by the Company on November 7, 2014, File No. 001-12935).
4(a) Indenture for 6 % Senior Subordinated Notes due 2021, dated as of February 17, 2011, by and among Denbury Resources Inc., certain of its subsidiaries, and Wells Fargo Bank, National Association, as Trustee (incorporated by reference to Exhibit 4.1 of Form 8-K filed by the Company on February 22, 2011, File No. 001-12935).
4(b) First Supplemental Indenture for 6 % Senior Subordinated Notes due 2021, dated as of December 31, 2014, by and among Denbury Resources Inc., certain of its subsidiaries, and Wells Fargo Bank, National Association, as Trustee (incorporated by reference to Exhibit 4(x) of Form 10-K filed by the Company on February 27, 2015, File No. 001-12935).
4(c) Second Supplemental Indenture for 6 % Senior Subordinated Notes due 2021, dated as of September 8, 2017, by and among Denbury Resources Inc., certain of its subsidiaries, and Wilmington Trust, National Association, as Trustee (incorporated by reference to Exhibit 4(a) of Form 10-Q filed by the Company on November 7, 2017, File No. 001-12935).
4(d) Indenture for 4 % Senior Subordinated Notes due 2023, dated as of February 5, 2013, by and among Denbury Resources Inc., certain of its subsidiaries, and Wells Fargo Bank, National Association, as Trustee (incorporated by reference to Exhibit 4.1 of Form 8-K filed by the Company on February 5, 2013, File No. 001-12935).
4(e) First Supplemental Indenture for 4 % Senior Subordinated Notes due 2023, dated as of December 31, 2014, by and among Denbury Resources Inc., certain of its subsidiaries, and Wells Fargo Bank, National Association, as Trustee (incorporated by reference to Exhibit 4(z) of Form 10-K filed by the Company on February 27, 2015, File No. 001-12935).
4(f) Second Supplemental Indenture for 4 % Senior Subordinated Notes due 2023, dated as of September 8, 2017, by and among Denbury Resources Inc., certain of its subsidiaries, and Wilmington Trust, National Association, as Trustee (incorporated by reference to Exhibit 4(b) of Form 10-Q filed by the Company on November 7, 2017, File No. 001-12935).
4(g) Indenture for 5½% Senior Subordinated Notes due 2022, dated as of April 30, 2014, by and among Denbury Resources Inc., certain of its subsidiaries, and Wells Fargo Bank, National Association, as Trustee (incorporated by reference to Exhibit 4.1 of Form 8-K filed by the Company on May 1, 2014, File No. 001-12935).
4(h) First Supplemental Indenture for 5½% Senior Subordinated Notes due 2022, dated as of December 31, 2014, by and among Denbury Resources Inc., certain of its subsidiaries, and Wells Fargo Bank, National Association, as Trustee (incorporated by reference to Exhibit 4(bb) of Form 10-K filed by the Company on February 27, 2015, File No. 001-12935).
Financial Statements and Schedules. Financial statements and schedules filed as a part of this report are presented on page 61. All financial statement schedules have been omitted because they are not applicable, or the required information is presented in the financial statements or the notes to consolidated financial statements.
Denbury Resources Inc.
105
Exhibit No. Exhibit4(i) Second Supplemental Indenture for 5½% Senior Subordinated Notes due 2022, dated as of September 8,
2017, by and among Denbury Resources Inc., certain of its subsidiaries, and Wilmington Trust, National Association, as Trustee (incorporated by reference to Exhibit 4(c) of Form 10-Q filed by the Company on November 7, 2017, File No. 001-12935).
4(j) Indenture for 9% Senior Secured Second Lien Notes due 2021, dated as of May 10, 2016, by and among Denbury Resources Inc., certain of its subsidiaries, and Wilmington Trust, National Association, as Trustee and Collateral Trustee (incorporated by reference to Exhibit 4.1 of Form 8-K filed by the Company on May 11, 2016, File No. 001-12935).
4(k) First Supplemental Indenture for 9% Senior Subordinated Notes due 2021, dated as of September 8, 2017, by and among Denbury Resources Inc., certain of its subsidiaries, and Wilmington Trust, National Association, as Trustee and Collateral Trustee (incorporated by reference to Exhibit 4(d) of Form 10-Q filed by the Company on November 7, 2017, File No. 001-12935).
4(l) Indenture for 9¼% Senior Secured Second Lien Notes due 2022, dated as of December 6, 2017, by and among Denbury Resources Inc., certain of its subsidiaries, and Wilmington Trust, National Association, as Trustee and Collateral Trustee (incorporated by reference to Exhibit 4.1 of Form 8-K filed by the Company on December 12, 2017, File No. 001-12935).
4(m) Indenture for 3½% Convertible Senior Notes due 2024, dated as of December 6, 2017, by and among Denbury Resources Inc., certain of its subsidiaries, and Wilmington Trust, National Association, as Trustee (incorporated by reference to Exhibit 4.3 of Form 8-K filed by the Company on December 12, 2017, File No. 001-12935).
4(n) Indenture, dated as of January 9, 2018, among the Company, the Subsidiary Guarantors named therein, and Wilmington Trust, National Association, as Trustee, with respect to $59,439,000 aggregate principal amount of 5% Convertible Senior Notes due 2023 (incorporated by reference to Exhibit 4.1 of Form 8-K filed by the Company on January 11, 2018, File No. 001-12935).
10(a) Amended and Restated Credit Agreement, dated as of December 9, 2014, by and among Denbury Resources Inc., as Borrower, JPMorgan Chase Bank, N.A., as Administrative Agent, and the lending institutions party thereto (incorporated by reference to Exhibit 10.1 of Form 8-K filed by the Company on December 15, 2014, File No. 001-12935).
10(b) First Amendment to Amended and Restated Credit Agreement, dated as of May 4, 2015, by and among Denbury Resources Inc., as Borrower, JPMorgan Chase Bank, N.A., as Administrative Agent, and the financial institutions party thereto (incorporated by reference to Exhibit 10(a) of Form 10-Q filed by the Company on May 6, 2015, File No. 001-12935).
10(c) Second Amendment to Amended and Restated Credit Agreement, dated as of February 17, 2016, by and among Denbury Resources Inc., as Borrower, JPMorgan Chase Bank, N.A., as Administrative Agent, and the financial institutions party thereto (incorporated by reference to Exhibit 10.1 of Form 8-K filed by the Company on February 23, 2016, File No. 001-12935).
10(d) Third Amendment to Amended and Restated Credit Agreement, dated as of April 18, 2016, by and among Denbury Resources Inc., as Borrower, JPMorgan Chase Bank, N.A., as Administrative Agent, and the financial institutions party thereto (incorporated by reference to Exhibit 10.1 of Form 8-K filed by the Company on April 20, 2016, File No. 001-12935).
10(e) Fourth Amendment to Amended and Restated Credit Agreement, dated as of May 3, 2017, by and among Denbury Resources Inc., as Borrower, JPMorgan Chase Bank, N.A., as Administrative Agent, and the financial institutions party thereto (incorporated by reference to Exhibit 10.1 of Form 8-K filed by the Company on May 4, 2017, File No. 001-12935).
Denbury Resources Inc.
106
Exhibit No. Exhibit10(f) Fifth Amendment to Amended and Restated Credit Agreement, dated as of November 6, 2017, by and among
Denbury Resources Inc., as Borrower, JPMorgan Chase Bank, N.A., as Administrative Agent, and the financial institutions party thereto (incorporated by reference to Exhibit 10(b) of Form 10-Q filed by the Company on November 7, 2017, File No. 001-12935).
10(g) Collateral Trust Agreement, dated as of May 10, 2016, by and among Denbury Resources Inc., certain of its subsidiaries, and Wilmington Trust, National Association, as Trustee and Collateral Trustee (incorporated by reference to Exhibit 10.1 of Form 8-K filed by the Company on May 11, 2016, File No. 001-12935).
10(h) Collateral Trust Joinder, dated as of December 6, 2017, by and among Denbury Resources Inc., certain of its subsidiaries, and Wilmington Trust, National Association, as Trustee and Collateral Trustee (incorporated by reference to Exhibit 10.1 of Form 8-K filed by the Company on December 12, 2017, File No. 001-12935).
10(i) Intercreditor Agreement, dated as of May 10, 2016, by and between JPMorgan Chase Bank, N.A., as Priority Lien Agent, and Wilmington Trust, National Association, as Collateral Trustee (incorporated by reference to Exhibit 10.2 of Form 8-K filed by the Company on May 11, 2016, File No. 001-12935).
10(j) Priority Confirmation Joinder, dated as of December 6, 2017, by and between JPMorgan Chase Bank, N.A., as Priority Lien Agent, and Wilmington Trust, National Association, as Collateral Trustee (incorporated by reference to Exhibit 10.2 of Form 8-K filed by the Company on December 12, 2017, File No. 001-12935).
10(k) Collateral Trust Joinder, dated as of January 9, 2018, among the Company, the Subsidiary Guarantors named therein, Wilmington Trust, National Association, as Trustee, the other parity lien representatives from time to time party thereto and Wilmington Trust, National Association, as Collateral Trustee (incorporated by reference to Exhibit 10.1 of Form 8-K filed by the Company on January 11, 2018, File No. 001-12935).
10(l) Pipeline Financing Lease Agreement, dated as of May 30, 2008, by and between Genesis NEJD Pipeline, LLC, as Lessor, and Denbury Onshore, LLC, as Lessee (incorporated by reference to Exhibit 99.1 of Form 8-K filed by the Company on June 5, 2008, File No. 001-12935).
10(m) Transportation Services Agreement, dated as of May 30, 2008, by and between Genesis Free State Pipeline, LLC and Denbury Onshore, LLC (incorporated by reference to Exhibit 99.2 of Form 8-K filed by the Company on June 5, 2008, File No. 001-12935).
10(n)** Form of Indemnification Agreement, by and between Denbury Resources Inc. and its officers and directors (incorporated by reference to Exhibit 10(a) of Form 10-Q filed by the Company on November 7, 2017, File No. 001-12935).
10(o)** Denbury Resources Inc. Director Deferred Compensation Plan, as amended and restated effective as of December 16, 2015 (incorporated by reference to Exhibit 10(i) of Form 10-K filed by the Company on February 26, 2016, File No. 001-12935).
10(p)** Denbury Resources Inc. Severance Protection Plan, as amended and restated effective as of March 31, 2016 (incorporated by reference to Exhibit 10(f) of Form 10-Q filed by the Company on May 6, 2016, File No. 001-12935).
10(q)** Denbury Resources Inc. 2004 Omnibus Stock and Incentive Plan, as amended and restated effective as of May 24, 2017 (incorporated by reference to Exhibit 10.1 of Form 8-K filed by the Company on May 26, 2017, File No. 001-12935).
10(r)** 2004 Form of Restricted Stock Award that vests on retirement for grants to officers pursuant to the 2004 Omnibus Stock and Incentive Plan for Denbury Resources Inc. (incorporated by reference to Exhibit 10(l) of Form 10-K filed by the Company on March 15, 2005, File No. 001-12935).
Denbury Resources Inc.
107
Exhibit No. Exhibit10(s)** 2015 Form of Restricted Share Award to officers under the 2004 Omnibus Stock and Incentive Plan for
Denbury Resources Inc. (incorporated by reference to Exhibit 10(d) of Form 10-Q filed by the Company on May 6, 2015, File No. 001-12935).
10(t)** 2015 Form of TSR Performance Award under the 2004 Omnibus Stock and Incentive Plan for Denbury Resources Inc. (incorporated by reference to Exhibit 10(e) of Form 10-Q filed by the Company on May 6, 2015, File No. 001-12935).
10(u)** 2015 Form of TSR Performance Award for Phil Rykhoek under the 2004 Omnibus Stock and Incentive Plan for Denbury Resources Inc. (incorporated by reference to Exhibit 10(f) of Form 10-Q filed by the Company on May 6, 2015, File No. 001-12935).
10(v)** 2015 Form of Capital Efficiency Performance Share Award under the 2004 Omnibus Stock and Incentive Plan for Denbury Resources Inc. (incorporated by reference to Exhibit 10(g) of Form 10-Q filed by the Company on May 6, 2015, File No. 001-12935).
10(w)** 2015 Form of Capital Efficiency Performance Share Award for Phil Rykhoek under the 2004 Omnibus Stock and Incentive Plan for Denbury Resources Inc. (incorporated by reference to Exhibit 10(h) of Form 10-Q filed by the Company on May 6, 2015, File No. 001-12935).
10(x)** 2015 Form of Growth and Income Performance Share Award under the 2004 Omnibus Stock and Incentive Plan for Denbury Resources Inc. (incorporated by reference to Exhibit 10(i) of Form 10-Q filed by the Company on May 6, 2015, File No. 001-12935).
10(y)** 2015 Form of Growth and Income Performance Share Award for Phil Rykhoek under the 2004 Omnibus Stock and Incentive Plan for Denbury Resources Inc. (incorporated by reference to Exhibit 10(j) of Form 10-Q filed by the Company on May 6, 2015, File No. 001-12935).
10(z)** 2016 Form of TSR Performance Award-Equity under the 2004 Omnibus Stock and Incentive Plan for Denbury Resources Inc. (incorporated by reference to Exhibit 10(a) of Form 10-Q filed by the Company on May 6, 2016, File No. 001-12935).
10(aa)** 2016 Form of TSR Performance Award-Cash under the 2004 Omnibus Stock and Incentive Plan for Denbury Resources Inc. (incorporated by reference to Exhibit 10(b) of Form 10-Q filed by the Company on May 6, 2016, File No. 001-12935).
10(bb)** 2016 Form of EBITDAX Performance Award-Equity under the 2004 Omnibus Stock and Incentive Plan for Denbury Resources Inc. (incorporated by reference to Exhibit 10(mm) of Form 10-K filed by the Company on March 1, 2017, File No. 001-12935).
10(cc)** 2016 Form of EBITDAX Performance Award-Cash under the 2004 Omnibus Stock and Incentive Plan for Denbury Resources Inc. (incorporated by reference to Exhibit 10(nn) of Form 10-K filed by the Company on March 1, 2017, File No. 001-12935).
10(dd)** 2016 Form of Oil Price Change vs. TSR Performance Award, under the 2004 Omnibus Stock and Incentive Plan for Denbury Resources Inc. (incorporated by reference to Exhibit 10(e) of Form 10-Q filed by the Company on May 6, 2016, File No. 001-12935).
10(ee)** 2016 Form of Restricted Share Award to officers pursuant to the 2004 Omnibus Stock and Incentive Plan for Denbury Resources Inc. (incorporated by reference to Exhibit 10(pp) of Form 10-K filed by the Company on March 1, 2017, File No. 001-12935).
10(ff)** 2016 Form of Restricted Stock Award to non-employee directors pursuant to the 2004 Omnibus Stock and Incentive Plan for Denbury Resources Inc. (incorporated by reference to Exhibit 10(qq) of Form 10-K filed by the Company on March 1, 2017, File No. 001-12935).
Denbury Resources Inc.
108
Exhibit No. Exhibit10(gg)** 2016 Form of Deferred Stock Unit Award pursuant to the Director Deferred Compensation Plan (with respect
to deferred long-term incentive awards) (incorporated by reference to Exhibit 10(rr) of Form 10-K filed by the Company on March 1, 2017, File No. 001-12935).
10(hh)** Standalone Restricted Share New Hire Inducement Award Agreement between Denbury Resources Inc. and Christian S. Kendall, dated September 8, 2015 (incorporated by reference to Exhibit 10.1 of Form 8-K filed by the Company on September 8, 2015, File No. 001-12935).
10(ii)** Restricted Stock Officer Promotion Award pursuant to the 2004 Omnibus Stock and Incentive Plan for Denbury Resources Inc. (incorporated by reference to Exhibit 10(tt) of Form 10-K filed by the Company on March 1, 2017, File No. 001-12935).
10(jj)** 2017 Form of TSR Performance Award-Equity under the 2004 Omnibus Stock and Incentive Plan for Denbury Resources Inc. (incorporated by reference to Exhibit 10(a) of Form 10-Q filed by the Company on May 5, 2017, File No. 001-12935).
10(kk)** 2017 Form of TSR Performance Award-Cash under the 2004 Omnibus Stock and Incentive Plan for Denbury Resources Inc. (incorporated by reference to Exhibit 10(b) of Form 10-Q filed by the Company on May 5, 2017, File No. 001-12935).
10(ll)** 2017 Form of EBITDAX Performance Award-Equity under the 2004 Omnibus Stock and Incentive Plan for Denbury Resources Inc. (incorporated by reference to Exhibit 10(c) of Form 10-Q filed by the Company on May 5, 2017, File No. 001-12935).
10(mm)** 2017 Form of EBITDAX Performance Award-Cash under the 2004 Omnibus Stock and Incentive Plan for Denbury Resources Inc. (incorporated by reference to Exhibit 10(d) of Form 10-Q filed by the Company on May 5, 2017, File No. 001-12935).
10(nn)** 2017 Form of Oil Change vs. TSR Performance Award under the 2004 Omnibus Stock and Incentive Plan for Denbury Resources Inc. (incorporated by reference to Exhibit 10(e) of Form 10-Q filed by the Company on May 5, 2017, File No. 001-12935).
10(oo)** 2017 Form of Restricted Share Award to officers pursuant to the 2004 Omnibus Stock and Incentive Plan for Denbury Resources Inc. (incorporated by reference to Exhibit 10(b) of Form 10-Q filed by the Company on August 8, 2017, File No. 001-12935).
10(pp)** 2017 Form of Restricted Share Award to non-employee directors pursuant to the 2004 Omnibus Stock and Incentive Plan for Denbury Resources Inc. (incorporated by reference to Exhibit 10(c) of Form 10-Q filed by the Company on August 8, 2017, File No. 001-12935).
10(qq)** Officer Retirement Agreement, by and between Denbury Resources Inc. and Phil Rykhoek, dated as of March 21, 2017 (incorporated by reference to Exhibit 10(f) of Form 10-Q filed by the Company on May 5, 2017, File No. 001-12935).
21* List of subsidiaries of Denbury Resources Inc.
23(a)* Consent of PricewaterhouseCoopers LLP.
23(b)* Consent of DeGolyer and MacNaughton.
31(a)* Certification of Chief Executive Officer Pursuant to Section 302 of Sarbanes-Oxley Act of 2002.
31(b)* Certification of Chief Financial Officer Pursuant to Section 302 of Sarbanes-Oxley Act of 2002.
Denbury Resources Inc.
109
Exhibit No. Exhibit32* Certification of Chief Executive Officer and Chief Financial Officer Pursuant to Section 906 of the Sarbanes-
Oxley Act of 2002.
99* The summary of DeGolyer and MacNaughton’s Report as of December 31, 2017, on oil and gas reserves (SEC Case) dated January 31, 2018.
* Included herewith.** Compensation arrangements.
Item 16. Form 10-K Summary
None.
Denbury Resources Inc.
110
SIGNATURES
Pursuant to the requirements of Section 13 or 15(d) of the Securities Exchange Act of 1934, Denbury Resources Inc. has duly caused this report to be signed on its behalf by the undersigned, thereunto duly authorized.
DENBURY RESOURCES INC.
February 28, 2018 /s/ Mark C. Allen Mark C. Allen
Executive Vice President and Chief Financial Officer
February 28, 2018 /s/ Alan RhoadesAlan RhoadesVice President and Chief Accounting Officer
Pursuant to the requirements of the Securities Exchange Act of 1934, this report has been signed below by the following persons on behalf of Denbury Resources Inc. and in the capacities and on the dates indicated.
February 28, 2018 /s/ Christian S. Kendall Christian S. Kendall
Director, President and Chief Executive Officer(Principal Executive Officer)
February 28, 2018 /s/ Mark C. Allen Mark C. Allen
Executive Vice President and Chief Financial Officer(Principal Financial Officer)
February 28, 2018 /s/ Alan Rhoades Alan Rhoades
Vice President and Chief Accounting Officer(Principal Accounting Officer)
February 28, 2018 /s/ John P. DielwartJohn P. DielwartDirector
February 28, 2018 /s/ Michael B. DeckerMichael B. DeckerDirector
February 28, 2018 /s/ Gregory L. McMichaelGregory L. McMichaelDirector
February 28, 2018 /s/ Kevin O. MeyersKevin O. MeyersDirector
Denbury Resources Inc.
111
February 28, 2018 /s/ Lynn A. PetersonLynn A. PetersonDirector
February 28, 2018 /s/ Randy SteinRandy SteinDirector
February 28, 2018 /s/ Laura A. SuggLaura A. SuggDirector
Exhibit 21
LIST OF SUBSIDIARIES
Name of Subsidiary Jurisdiction of Organization
Denbury Operating Company Delaware
Denbury Onshore, LLC Delaware
Denbury Pipeline Holdings, LLC Delaware
Denbury Holdings, Inc. Delaware
Denbury Green Pipeline – Texas, LLC Delaware
Greencore Pipeline Company, LLC Delaware
Denbury Gulf Coast Pipelines, LLC Delaware
Exhibit 23(a)
CONSENT OF INDEPENDENT REGISTERED PUBLIC ACCOUNTING FIRM
We hereby consent to the incorporation by reference in the Registration Statements on Form S-8 (Nos. 333-01006, 333-27995, 333-55999, 333-70485, 333-39172, 333-39218, 333-39224, 333-63198, 333-90398, 333-106253, 333-116249, 333-143848, 333-160178, 333-167480, 333-175273, 333-189438, 333-206320, 333-206808, 333-212402 and 333-218941) and Form S-3 (No. 333-222066) of Denbury Resources Inc. of our report dated February 28, 2018 relating to the consolidated financial statements and the effectiveness of internal control over financial reporting, which appears in this Form 10-K.
/s/ PricewaterhouseCoopers LLPDallas, TexasFebruary 28, 2018
Exhibit 23(b)
DeGolyer and MacNaughton5001 Spring Valley Road
Suite 800 EastDallas, Texas 75244
February 26, 2018
Denbury Resources Inc.5320 Legacy DrivePlano, Texas 75024
Ladies and Gentlemen:
We hereby consent to the use of the name DeGolyer and MacNaughton, to references to DeGolyer and MacNaughton, to the inclusion of our letter report dated January 31, 2018, regarding the proved reserves of Denbury Resources Inc., and to the inclusion of information taken from our reports entitled “Report as of December 31, 2017 on Reserves and Revenue of Certain Properties owned by Denbury Resources Inc. SEC Case,” “Report as of December 31, 2016 on Reserves and Revenue of Certain Properties owned by Denbury Resources Inc. SEC Case,” and “Report as of December 31, 2015 on Reserves and Revenue of Certain Properties owned by Denbury Resources Inc. SEC Case,” in the Annual Report on Form 10-K of Denbury Resources Inc. for the year ended December 31, 2017.
Very truly yours,
/s/ DeGolyer and MacNaughtonDeGolyer and MacNaughtonTexas Registered Engineering Firm F-716
Exhibit 31(a)
CERTIFICATION UNDER SECTION 302 OF THE SARBANES-OXLEY ACT OF 2002
I, Christian S. Kendall, certify that:
1. I have reviewed this report on Form 10-K of Denbury Resources Inc. (the registrant);
2. Based on my knowledge, this report does not contain any untrue statement of a material fact or omit to state a material fact necessary to make the statements made, in light of the circumstances under which such statements were made, not misleading with respect to the period covered by this report;
3. Based on my knowledge, the financial statements, and other financial information included in this report, fairly present in all material respects the financial condition, results of operations and cash flows of the registrant as of, and for, the periods presented in this report;
4. The registrant’s other certifying officers and I are responsible for establishing and maintaining disclosure controls and procedures (as defined in Exchange Act Rules 13a-15(e) and 15d-15(e)) and internal control over financial reporting (as defined in Exchange Act Rules 13a-15(f) and 15d-15(f)) for the registrant and have:
(a) Designed such disclosure controls and procedures, or caused such disclosure controls and procedures to be designed under our supervision, to ensure that material information relating to the registrant, including its consolidated subsidiaries, is made known to us by others within those entities, particularly during the period in which this report is being prepared;
(b) Designed such internal control over financial reporting, or caused such internal control over financial reporting to be designed under our supervision, to provide reasonable assurance regarding the reliability of financial reporting and the preparation of financial statements for external purposes in accordance with generally accepted accounting principles;
(c) Evaluated the effectiveness of the registrant’s disclosure controls and procedures and presented in this report our conclusions about the effectiveness of the disclosure controls and procedures, as of the end of the period covered by this report based on such evaluation; and
(d) Disclosed in this report any change in the registrant’s internal control over financial reporting that occurred during the registrant’s most recent fiscal quarter (the registrant’s fourth fiscal quarter in the case of an annual report) that has materially affected, or is reasonably likely to materially affect, the registrant’s internal control over financial reporting; and
5. The registrant’s other certifying officers and I have disclosed, based on our most recent evaluation of internal control over financial reporting, to the registrant’s auditors and the audit committee of the registrant’s board of directors (or persons performing the equivalent functions):
(a) All significant deficiencies and material weaknesses in the design or operation of internal control over financial reporting which are reasonably likely to adversely affect the registrant’s ability to record, process, summarize and report financial information; and
(b) Any fraud, whether or not material, that involves management or other employees who have a significant role in the registrant’s internal control over financial reporting.
February 28, 2018 /s/ Christian S. KendallChristian S. KendallDirector, President and Chief Executive Officer
Exhibit 31(b)
CERTIFICATION UNDER SECTION 302 OF THE SARBANES-OXLEY ACT OF 2002
I, Mark C. Allen, certify that:
1. I have reviewed this report on Form 10-K of Denbury Resources Inc. (the registrant);
2. Based on my knowledge, this report does not contain any untrue statement of a material fact or omit to state a material fact necessary to make the statements made, in light of the circumstances under which such statements were made, not misleading with respect to the period covered by this report;
3. Based on my knowledge, the financial statements, and other financial information included in this report, fairly present in all material respects the financial condition, results of operations and cash flows of the registrant as of, and for, the periods presented in this report;
4. The registrant’s other certifying officers and I are responsible for establishing and maintaining disclosure controls and procedures (as defined in Exchange Act Rules 13a-15(e) and 15d-15(e)) and internal control over financial reporting (as defined in Exchange Act Rules 13a-15(f) and 15d-15(f)) for the registrant and have:
(a) Designed such disclosure controls and procedures, or caused such disclosure controls and procedures to be designed under our supervision, to ensure that material information relating to the registrant, including its consolidated subsidiaries, is made known to us by others within those entities, particularly during the period in which this report is being prepared;
(b) Designed such internal control over financial reporting, or caused such internal control over financial reporting to be designed under our supervision, to provide reasonable assurance regarding the reliability of financial reporting and the preparation of financial statements for external purposes in accordance with generally accepted accounting principles;
(c) Evaluated the effectiveness of the registrant’s disclosure controls and procedures and presented in this report our conclusions about the effectiveness of the disclosure controls and procedures, as of the end of the period covered by this report based on such evaluation; and
(d) Disclosed in this report any change in the registrant’s internal control over financial reporting that occurred during the registrant’s most recent fiscal quarter (the registrant’s fourth fiscal quarter in the case of an annual report) that has materially affected, or is reasonably likely to materially affect, the registrant’s internal control over financial reporting; and
5. The registrant’s other certifying officers and I have disclosed, based on our most recent evaluation of internal control over financial reporting, to the registrant’s auditors and the audit committee of the registrant’s board of directors (or persons performing the equivalent functions):
(a) All significant deficiencies and material weaknesses in the design or operation of internal control over financial reporting which are reasonably likely to adversely affect the registrant’s ability to record, process, summarize and report financial information; and
(b) Any fraud, whether or not material, that involves management or other employees who have a significant role in the registrant’s internal control over financial reporting.
February 28, 2018 /s/ Mark C. AllenMark C. AllenExecutive Vice President, Chief Financial Officer,Treasurer, and Assistant Secretary
Exhibit 32
Certification of Chief Executive Officer and Chief Financial OfficerPursuant to Section 906 of the Sarbanes-Oxley Act of 2002
In connection with the accompanying Annual Report on Form 10-K for the year ended December 31, 2017 (the Report) of Denbury Resources Inc. (Denbury) as filed with the Securities and Exchange Commission, each of the undersigned, in his capacity as an officer of Denbury, hereby certifies pursuant to 18 U.S.C. Section 1350, as adopted pursuant to Section 906 of the Sarbanes-Oxley Act of 2002, that to his knowledge:
1. The Report fully complies with the requirements of Section 13(a) or 15(d) of the Securities Exchange Act of 1934, as amended; and
2. information contained in the Report fairly presents, in all material respects, the financial condition and results of operations of Denbury.
Dated: February 28, 2018 /s/ Christian S. Kendall Christian S. Kendall Director, President and Chief Executive Officer
Dated: February 28, 2018 /s/ Mark C. Allen
Mark C. AllenExecutive Vice President, Chief Financial Officer,Treasurer, and Assistant Secretary


FINANCIAL INFORMATION REQUESTSFor additional information and to receive
additional copies of the Annual Report
obtain other Denbury public documents,
please contact:
Denbury Resources Inc.
Investor Relations
5320 Legacy Drive
Plano, Texas 75024
972.673.2000
Email: [email protected]
herein, excluding all exhibits other than
by the CEO and CFO. We will send
shareholders our Form 10-K exhibits
and any of our corporate governance
documents, without charge, upon request.
These documents are also available on our
website at www.denbury.com.
ANNUAL MEETING
will be held on Wednesday, May 23, 2018,
at 8:00 A.M. CDT at Denbury’s Corporate
Headquarters, located at 5320 Legacy Drive,
Plano, Texas 75024.
LEGAL COUNSEL
BANKERS
INDEPENDENT REGISTERED PUBLIC ACCOUNTING FIRMPricewaterhouseCoopers LLP
RESERVE ENGINEERSDeGolyer and MacNaughton
STOCK EXCHANGE LISTING
CORPORATE HEADQUARTERSDenbury Resources Inc.
5320 Legacy Drive
Plano, Texas 75024
972. 673. 2000
www.denbury.com
STOCK TRANSFER AGENT & REGISTRAR
changes, please contact:
P.O. Box 1342, Brentwood, NY 11717
866.804.4482
Email: [email protected]
www.shareholder.broadridge.com/bcis
INVESTOR INQUIRIES
Executive Vice President, Chief Financial
Officer, Treasurer and Assistant Secretary
972. 673. 2000
John Mayer
Director of Investor Relations
972. 673. 2383
Email: [email protected]
ANNUAL CERTIFICATIONS
corporate governance listing standards.
BOARD OF DIRECTORS
John P. Dielwart
Chairman of the Board
Vice-Chairman
Partner
President
and Chief Executive Officer
Gregory L. McMichael
Independent Consultant
Kevin O. Meyers
Independent Consultant
Lynn A. Peterson
President and Chief Executive Officer
Independent Consultant
Independent Consultant
CONTACTING BOARD MEMBERSYou may contact our board members by
addressing a letter to Denbury Resources
by email to [email protected]
EXECUTIVE OFFICERS
President and
Chief Executive Officer
Executive Vice President, Chief Financial
Officer, Treasurer and Assistant Secretary
Jim Matthews
Executive Vice President,
Chief Administrative Officer, General
Counsel and Secretary
CORPORATE INFORMATION

Denbury Resources Inc.
5320 Legacy Drive
Plano, Texas 75024
972.673.2000
www.denbury.com