Embed Size (px)
Citation preview

2017 China Apple Crop Outlook
SDIC Zhonglu Fruit Juice CompanyZhonglu America Corporation
Michael Choi
1
2016 Crop Review1
2016 Crop Utilization2
2017 Crop Forecast33
Apple Export, Import, Apple Price44

2
2016 Crop Review1
2
33
44

2,566
1500
11,008Shaanxi
Shandong
Henan
Shanxi
3,601
Hebei
Liaoning
Gansu
4,386
4,286
9,781
3,656
2016 Apple ProductionIn Major Provinces
3
2016 China Apple Production:43,882,000 MT
(Unit: 1,000 MT) Source: China Ministry of Agriculture

Estimate made in Aug 2016 Official Count by China MOA in Jul 2017
4
2016 Apple Production Estimate vs Final Count
(Unit: 1,000 MT) Source: China Ministry of Agriculture

5
Apple Production by Province 2012~2016
2012 2013 2014 2015 2016 ’16:‘155-Year
Average‘16 : 5-yr Average
Shaanxi 9,651 9,428 9,880 10,373 11,008 6.1% 10,067 9.3%
Shandong 8,710 9,305 9,297 9,584 9,781 2.1% 9,335 4.8%
Henan 4,367 4,431 4,417 4,496 4,386 -2.4% 4,520 -0.8%
Shanxi 3,752 3,962 4,173 4,312 4,286 -0.6% 4,097 4.6%
Hebei 3,115 3,201 3,457 3,666 3,656 -0.3% 3,420 6.9%
Gansu 2,488 2,696 2,971 3,286 3,601 9.6% 3,007 19.7%
Liaoning 2,634 2,752 2,476 2,484 2,566 3.3% 2,582 -0.6%
Others 3,774 3,908 4,252 4,412 4,598 4.2% 4,091 12.4%
All China 38,491 39,683 40,923 42,613 43,882 3.0% 41,118 6.7%(Unit: 1,000 MT) Source: China Ministry of Agriculture

6
Apple Production, Planted Acreage2012~2016
38,49139,683
40,92342,613
43,882
2,2312,272
2,3072,328 2,324
2,000
2,050
2,100
2,150
2,200
2,250
2,300
2,350
2,400
2,450
2,500
20,000
25,000
30,000
35,000
40,000
45,000
50,000
2012 2013 2014 2015 2016
(Source: China Ministry of Agriculture)
Apple Production (1,000 MT) Acreage (1,000 Ha)
CAGR: 3.33%
CAGR: 1.03%
7
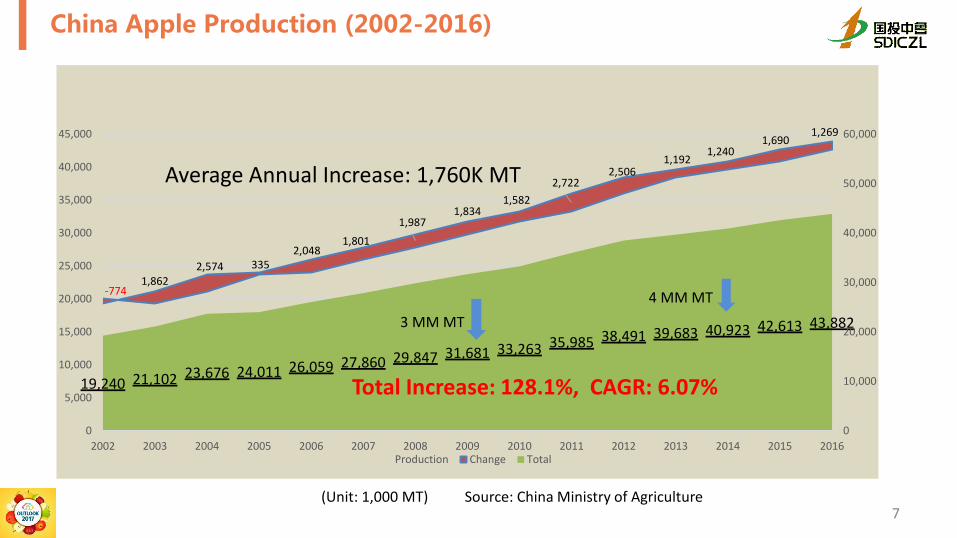
China Apple Production (2002-2016)
-7741,862
2,574 3352,048
1,8011,987
1,8341,582
2,7222,506
1,1921,240
1,6901,269
19,240 21,102 23,676 24,011 26,059 27,860 29,847 31,681 33,263 35,985 38,491 39,683 40,923 42,613 43,882
0
10,000
20,000
30,000
40,000
50,000
60,000
0
5,000
10,000
15,000
20,000
25,000
30,000
35,000
40,000
45,000
2002 2003 2004 2005 2006 2007 2008 2009 2010 2011 2012 2013 2014 2015 2016Production Change Total
3 MM MT
(Unit: 1,000 MT) Source: China Ministry of Agriculture
Average Annual Increase: 1,760K MT
4 MM MT
Total Increase: 128.1%, CAGR: 6.07%

26,867 27,358 29,200 30,872 31,910
9,726 10,475 10,077 10,042 10,324
1,898 1,850 1,646 1,699 1,648
0%
10%
20%
30%
40%
50%
60%
70%
80%
90%
100%
2012 2013 2014 2015 2016
Fuji Others (mostly Gala, Qinguan) Guoguang
8
Apple Crop by Variety2012 ~ 2016
(Unit: 1,000 MT) Source: China Ministry of Agriculture
69.8% 71.4% 72.4% 72.7%68.9%

9
1
Apple Crop Utilization2
33
44

10
CY 2016 Apple Utilization10-Year Utilization for Apple JC
36,043, 82%
3,906, 9%
2,500, 6%
1,500, 3%
2016 Production + Import 43,949K MT
Fresh Consumption AJC Processing
Other Processing Export
28.0%
18.9%
14.4%
12.1%
12.2%
13.5%
8.9%
7.2%
8.1%
8.9%
0.0% 5.0% 10.0% 15.0% 20.0% 25.0% 30.0%
2007
2008
2009
2010
2011
2012
2013
2014
2015
2016
Used for Apple Juice Concentrate
11
1
2
2017 Apple Crop Forecast33
44

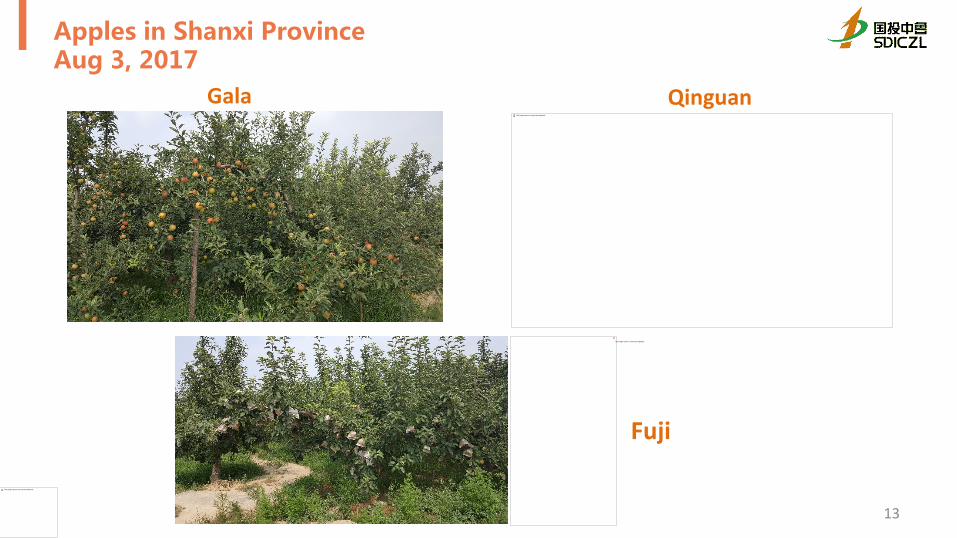
Gala
Qinguan
12
Apples in Shaanxi Province Aug 1, 2017
New Crop Gala Apple
Gala Qinguan
13
Apples in Shanxi Province Aug 3, 2017
Fuji
This image cannot currently be displayed.
This image cannot currently be displayed.
This image cannot currently be displayed.

This image cannot currently be displayed.
14
Fuji Apple in Shandong Aug 5, 2017

15
2017 Apple Crop ForecastFor Major Growing Provinces
ShaanxiGood weather.
Drought impact on early variety. 7%
increase
GansuHail storm, but new acreage,
improved yield: 6% increase
ShandongSevere drought:
6% reduction
Hebei Drought but new acreage
and better yield. 1% increase
LiaoningSevere drought in in the south. Bur new
acreage in the noth. 5% reduction
2017 Crop Forecast: 45,076,000 (2.7% increase from 2016)
ShanxiDrought impact on
early variety, but 6% increase
HenanGood weather. Drought impact on early variety.
7% increase

16
Apple Production by Province 2015~2016 + 2017 E
Provinces 2015 2016 2017 ’17:‘165 Yr (’12-’16)
Average‘17 : 5-yr Average
Shaanxi 10,373 11,008 11,779 7% 10,067 17.0%
Shandong 9,584 9,781 9,194 -6% 9,335 1.5%
Henan 4,496 4,386 4,693 7.% 4,520 6.2%
Shanxi 4,312 4,286 4,543 6% 4,097 10.9%
Hebei 3,666 3,656 3,693 1% 3,420 8.0%
Gansu 3,286 3,601 3,817 6% 3,007 26.9%
Liaoning 2,484 2,566 2,438 -5% 2,582 -5.6%
Others 4,412 4,598 4,920 7% 4,091 17.1%
All China 42,613 43,882 45,076 2.7% 41,118 9.6%(Unit: 1,000 MT) Source: China Ministry of Agriculture

17
1
2
33
Apple Export, Import. Wholesale Price44

18
Apple Export by Year 2012~2017
976 995865 833
1,322
682 682
$984 $1,036$1,188 $1,238
$1,099 $1,127$1,031
$0
$200
$400
$600
$800
$1,000
$1,200
$1,400
0
200
400
600
800
1,000
1,200
1,400
2012 2013 2014 2015 2016 2016 (1-6) 2017 (1-6)
Qty: 1,000 MT Price/MT
Source: China Customs

Bangladesh, 181,437, 14%
India, 147,030, 11%
Thailand, 142,202, 11%
Phillippines, 133,622, 10%Russia, 114,620, 9%
Vistnam, 110,032, 8%
Indonesia, 89,900, 7%
Others, 403,199, 30%
2016 Total Apple Export: 1,322,042 MT
19
2016 Apple Export By Major Countries
(Unit: MT) Source: China Customs

2016 Apple Import
27,020, 40%
19,812, 30%
16,275, 24%
4,002, 6%
Total Import 67,109 MT
USA NZ Chile Others
2017 (1-6) Apple Import
17,628, 40%16,754,
38%
9,116, 20%
787, 2%
Total Import 44,286 MT
USA NZ Chile Others
20
Apple Import by Major Country 2016 + 2017 (1-6)
(Unit: MT) Source: China Customs

9.869.57
8.84 8.89 8.82 8.719.31 9.42
9.13 9.02 8.97 8.76
8.268.76
8.37.95
7.667.39 7.55 7.41 7.38
6.52 6.55 6.797.17 7.27 7.05 6.89 6.92 7.14 7.39 7.63 7.41
7.95 7.917.61
5
6
7
8
9
10
11
Jul Aug Sep Oct Nov Dec Jan Feb Mar Apr May Jun
Prices for 80mm (D) Fuji Apple(CNY/KG)
2014/15 2015/16 2016/17
21
Fuji Apple Wholesale Price Trend 2014~2017

22
China Apple Industry Overview
• Apple Acreage showed decrease in 2016 first time in 20 years: Decrease mostly in some major growing areas but increase in other areas such as Ningxia, Sichuan, Xinjiang, etc. provinces.
• However, apple production has been increasing due to improvement in yield by adopting new technologies and better managment.
• Apple production growth has slowed down in the past 4 years to 3%+/-• Fuji variety continues to be popular taking over 70% of total production.• Fresh + processing apple prices have stayed lower in the past 2 years.• Fresh apple export volume increased to over 1.3 MM MT in 2016 and stayed
strong into 2017 although price has been dropping. However, Apple import volume has been minimal.
• More production in Organic and SOD apples

23
China Apple Industry Trend - Overview
• Apple acreage showed decrease first time in 2016: Decrease mostly in major growing areas as old trees were cut, but still increase in other areas like Ningxia, Xinjiang, Sichuan etc. for the last 3-5 years.
• Apple production growth has slowed down in the past several years: 3%+/-
• Fuji variety continues to be popular: >70%• Fresh apple price has been staying low in the past 2 years, so has
processing apple prices. • Fresh Apple Export increased to over 1.3MM MT and stays strong in
to 2017. However, fresh apple import is minimal <100K MT• More production in organic and SOD apples
Thank you !from
SDIC Zhonglu Fruit Juice Co., Ltd.Zhonglu America Corporation

2017 China Apple Juice Concentrate
SDIC Zhonglu Fruit Juice CompanyZhonglu America Corporation
Michael Choi

25
2016 AJC Production by Province
Shaanxi, 209,180, 38%
Shanxi, 124,833, 22%
Shandong, 73,104, 13%
Gansu, 33,127, 6%
Ningxia, 32,875, 6%
Liaoning, 32,537, 6%
Henan, 22,902, 4%
Others, 29,442, 5%
2016/2017 Production: 558,000 MT
Shaanxi
Shanxi
Shandong
Gansu
Ningxia
Liaoning
Henan
Others
(Source: China Chamber of Commerce - AJC)

503,000
400,000
513,800558,000
600,000
174,663 149,950192,611 209,180
83,598 89,486 114,944 124,83355,056 52,404 67,313 73,104
0
100,000
200,000
300,000
400,000
500,000
600,000
700,000
2013/14 2014/15 2015/16 2016/17 2017/18 E
(Unit: MT)
Total Shaanxi Shanxi Shandong
Linear (Total) Linear (Shaanxi) Linear (Shandong)
26
2013/4~2016/7 AJC Production by Major Provinces
(Source: China Chamber of Commerce - AJC)

27
CY 2016 Apple Utilization10-Year Utilization for Apple JC
36,043, 82%
3,906, 9%
2,500, 6%
1,500, 3%
2016 Production + Import 43,949K MT
Fresh Consumption AJC Processing
Other Processing Export
28.0%
18.9%
14.4%
12.1%
12.2%
13.5%
8.9%
7.2%
8.1%
8.9%
0.0% 5.0% 10.0% 15.0% 20.0% 25.0% 30.0%
2007
2008
2009
2010
2011
2012
2013
2014
2015
2016
Used for Apple Juice Concentrate

Country 2017 (1-6) 2016 (1-6)'17 : ‘16
(1-6) 2016 2015 2016 : 2015USA 144,455 127,803 13.0% 256,883 239,840 7.1%Canada 15,797 14,982 5.4% 24,262 23,131 4.9%Japan 23,333 28,786 -18.9% 49,237 60,881 -19.1%Australia 12,679 11,852 7.0% 23,814 25,400 -6.2%Russia 24,603 24,389 0.9% 50,700 35,925 41.1%Ukraine 198 154 28.6% 242 198 22.2%Germany 4,189 3,362 24.6% 7,121 16,664 -57.3%Holland 2,607 2,838 -8.1% 3,290 4,218 -22.0%S. Africa 17,869 15,809 13.0% 37,957 16,086 136.0%Others 29,238 28,502 2.6% 53,045 51,486 3.0%Total 274,969 258,477 6.4% 506,551 473,829 6.9%
28
Aple JC Export 2005 - 2017 (1-6)
(Unit: MT) Source: China Customs
29
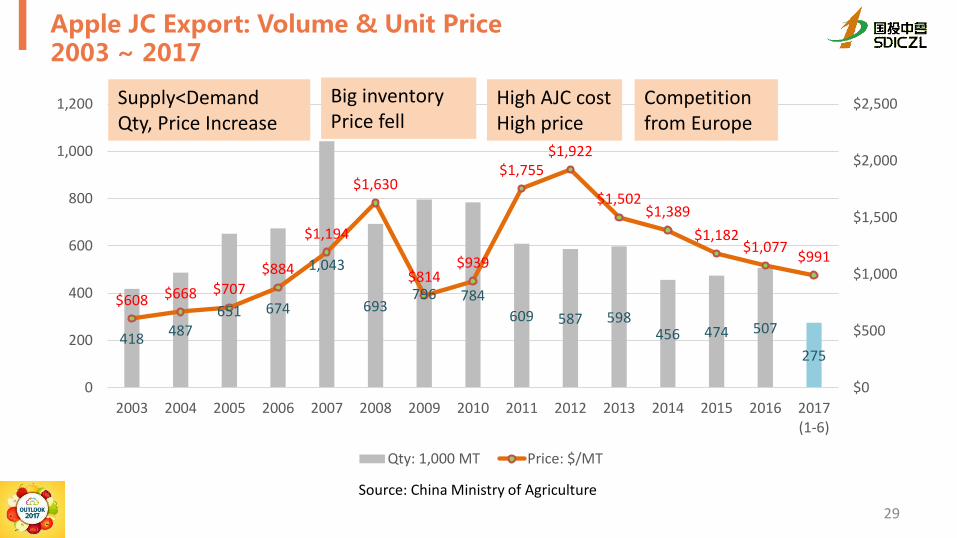
Apple JC Export: Volume & Unit Price2003 ~ 2017
Source: China Ministry of Agriculture
418 487651 674
1,043
693796 784
609 587 598456 474 507
275
$608 $668 $707 $884
$1,194
$1,630
$814 $939
$1,755 $1,922
$1,502 $1,389
$1,182 $1,077 $991
$0
$500
$1,000
$1,500
$2,000
$2,500
0
200
400
600
800
1,000
1,200
2003 2004 2005 2006 2007 2008 2009 2010 2011 2012 2013 2014 2015 2016 2017(1-6)
Qty: 1,000 MT Price: $/MT
Competition from Europe
High AJC costHigh price
Big inventory Price fell
Supply<Demand Qty, Price Increase

30
Processing Apple Price Trend (2013~2016)In Western Provinces
650700
830
950
500
580
730
820 800
550
650650700 700
660620
300
400
500
600
700
800
900
1000
Aug Sept Oct Nov Dec Mar Apr
2013201420152016
Aug 2017
(Unit: CNY/MT)

Chinese Yuan vs US$ - Appreciation Other Cost Increasing Factors
31
Apple JC Production Cost Increasing, New Challenges
• Stricter Environmental Protection Policy for cleaner water, air, soil: AJC plants needed to upgrade waste water recycling equipment, improve waste treatment system >> forced some small plants to close, increased AJC production cost with higher cost of energy, packaging material, coal, etc.
• Interest rates rising• Ocean freight fluctuating to higher level

32
China Apple Industry Trend - Overview
• Apple acreage showed decrease first time in 2016: Decrease mostly in major growing areas as old trees were cut, but still increase in other areas like Ningxia, Xinjiang, Sichuan etc. for the last 3-5 years.
• Apple production growth has slowed down in the past several years: 3%+/-
• Fuji variety continues to be popular: >70%• Fresh apple price has been staying low in the past 2 years, so has
processing apple prices. • Fresh Apple Export increased to over 1.3MM MT and stays strong in
to 2017. However, fresh apple import is minimal <100K MT• More production in organic and SOD apples
Thank you !from
SDIC Zhonglu Fruit Juice Co., Ltd.Zhonglu America Corporation