Embed Size (px)
Citation preview
2017 Citizen Satisfaction
Survey Highlights
PRESENTATION
20 FEBRUARY 2018
2
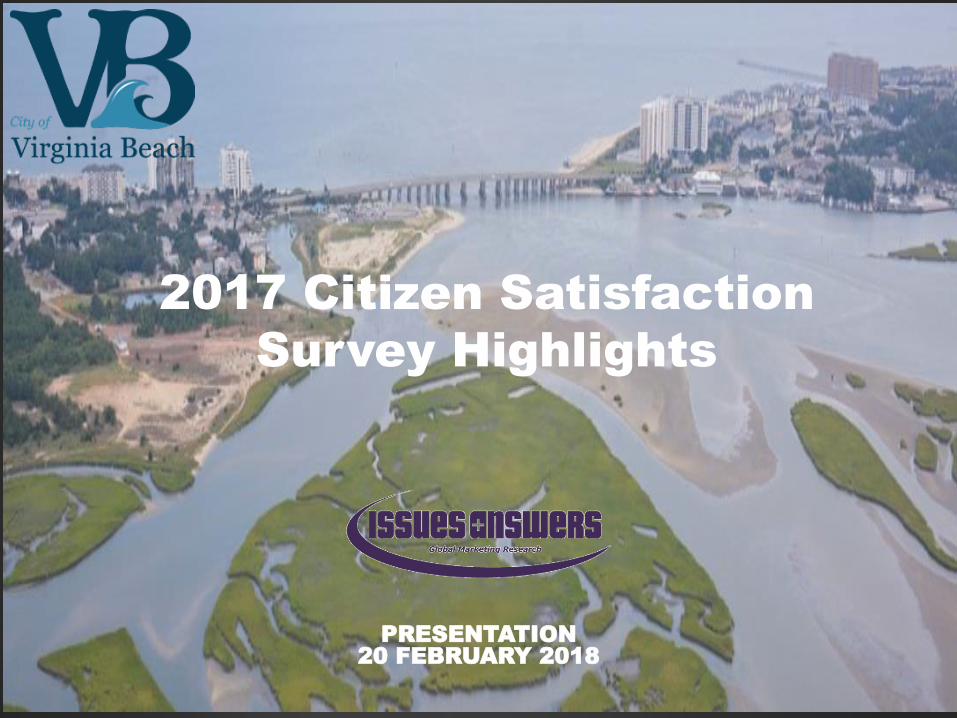
Background & Objectives
Overview
Methodology
Perception of City Services
Perception of Virginia Beach
Sources of Information about
the City
Participation
Wrap Up
Agenda 2
Background
Survey of residents to assess satisfaction with City services roughly every two years
First conducted in 1995
This survey was conducted in December 2017 with analysis in January 2018
Average interview length in 2017 was 16.1 min
500 residents completed interviews
4.4% margin of error
3
Background
Data weighted to correct for sampling variation, ensure projectibility
All of the findings are statistically significant at a 95% level of confidence or higher
A detailed report has been provided
4
Overview
Virginia Beach receives remarkably good scores as a place to live and overall for the services it provides to residents
Historically, satisfaction scores fluctuate in a normal range; most scores stayed in that range this year
The one area about which residents most like to complain – traffic – doesn’t seem to have much impact on how they feel about the City and living here
Their preferred communication vehicle: VBgov.com and local TV news and local news websites
5
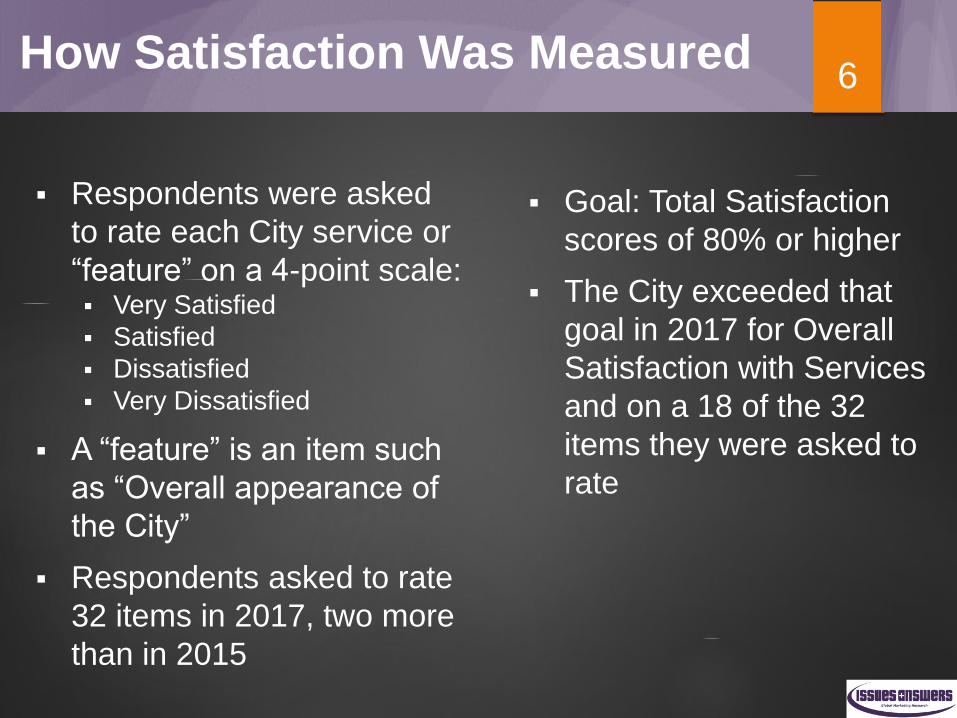
How Satisfaction Was Measured
Respondents were asked
to rate each City service or
“feature” on a 4-point scale: Very Satisfied
Satisfied
Dissatisfied
Very Dissatisfied
A “feature” is an item such
as “Overall appearance of
the City”
Respondents asked to rate
32 items in 2017, two more
than in 2015
Goal: Total Satisfaction
scores of 80% or higher
The City exceeded that
goal in 2017 for Overall
Satisfaction with Services
and on a 18 of the 32
items they were asked to
rate
6
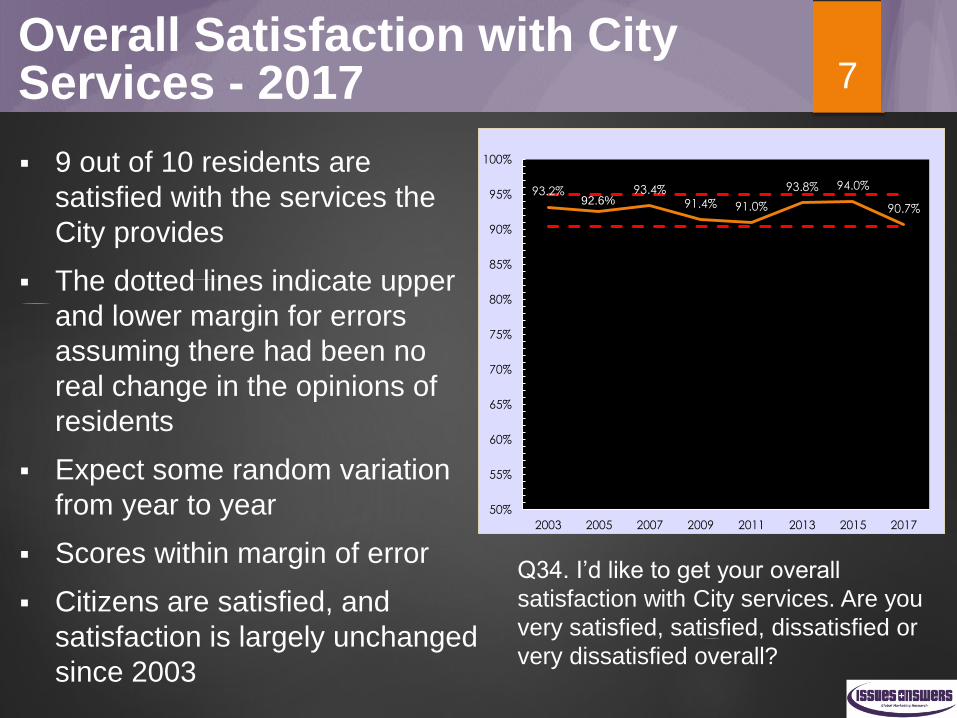
Overall Satisfaction with City Services - 2017
9 out of 10 residents are
satisfied with the services the
City provides
The dotted lines indicate upper
and lower margin for errors
assuming there had been no
real change in the opinions of
residents
Expect some random variation
from year to year
Scores within margin of error
Citizens are satisfied, and
satisfaction is largely unchanged
since 2003
93.2%92.6%
93.4%91.4% 91.0%
93.8% 94.0%
90.7%
50%
55%
60%
65%
70%
75%
80%
85%
90%
95%
100%
2003 2005 2007 2009 2011 2013 2015 2017
Q34. I’d like to get your overall
satisfaction with City services. Are you
very satisfied, satisfied, dissatisfied or
very dissatisfied overall?
7
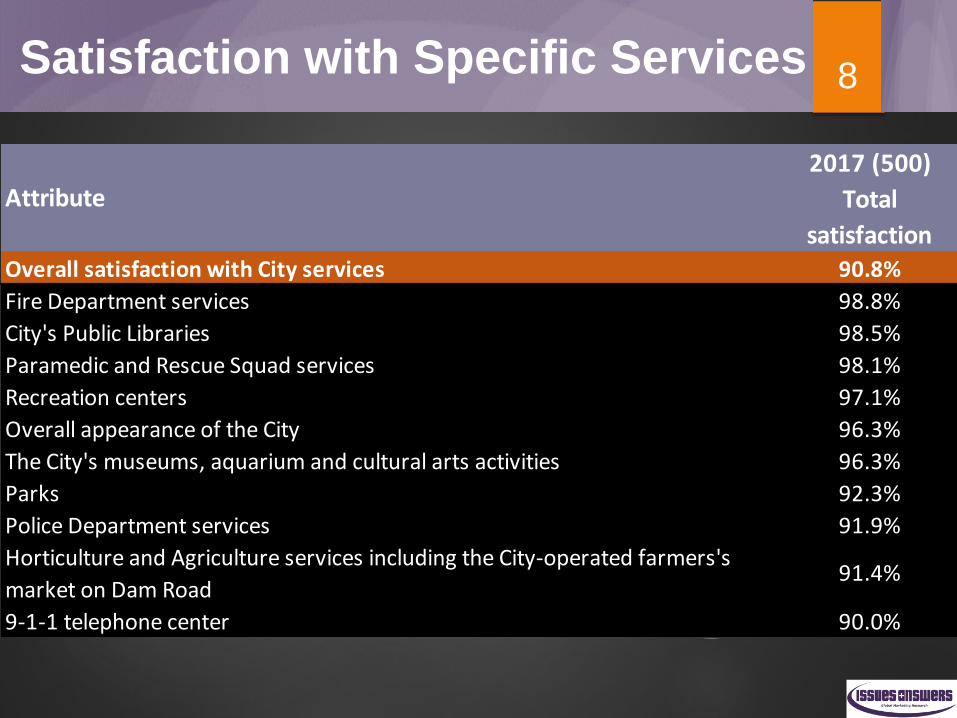
Satisfaction with Specific Services 8
2017 (500)
Total
satisfaction Overall satisfaction with City services 90.8%
Fire Department services 98.8%
City's Public Libraries 98.5%
Paramedic and Rescue Squad services 98.1%
Recreation centers 97.1%
Overall appearance of the City 96.3%
The City's museums, aquarium and cultural arts activities 96.3%
Parks 92.3%
Police Department services 91.9%
Horticulture and Agriculture services including the City-operated farmers's
market on Dam Road91.4%
9-1-1 telephone center 90.0%
Attribute
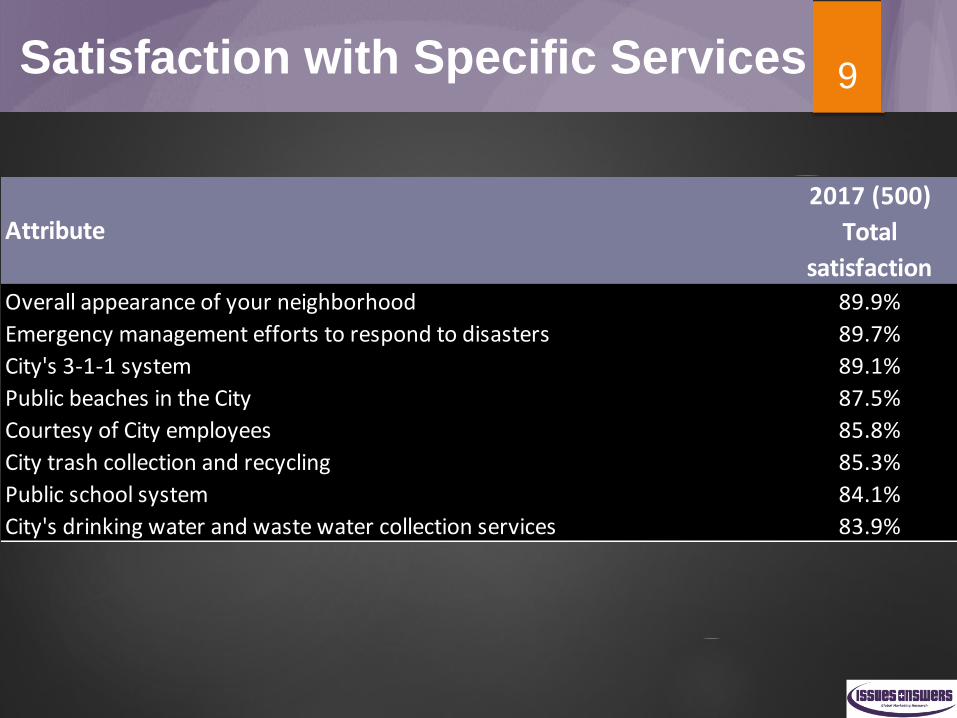
Satisfaction with Specific Services 9
2017 (500)
Total
satisfaction Overall appearance of your neighborhood 89.9%
Emergency management efforts to respond to disasters 89.7%
City's 3-1-1 system 89.1%
Public beaches in the City 87.5%
Courtesy of City employees 85.8%
City trash collection and recycling 85.3%
Public school system 84.1%
City's drinking water and waste water collection services 83.9%
Attribute
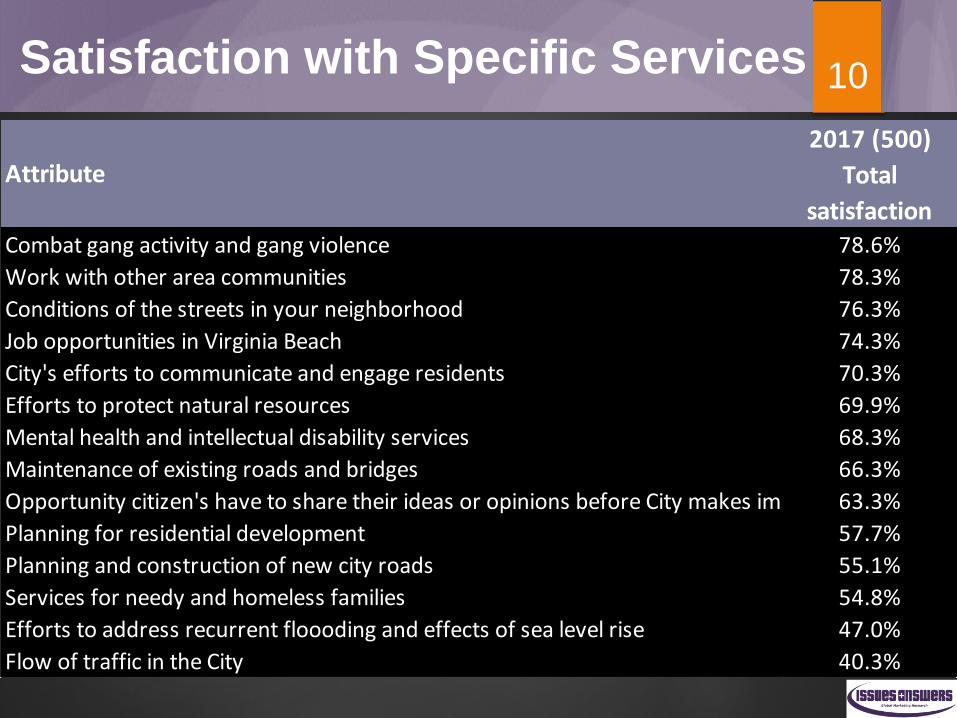
Satisfaction with Specific Services 10
2017 (500)
Total
satisfaction Combat gang activity and gang violence 78.6%
Work with other area communities 78.3%
Conditions of the streets in your neighborhood 76.3%
Job opportunities in Virginia Beach 74.3%
City's efforts to communicate and engage residents 70.3%
Efforts to protect natural resources 69.9%
Mental health and intellectual disability services 68.3%
Maintenance of existing roads and bridges 66.3%
Opportunity citizen's have to share their ideas or opinions before City makes important decisions63.3%
Planning for residential development 57.7%
Planning and construction of new city roads 55.1%
Services for needy and homeless families 54.8%
Efforts to address recurrent floooding and effects of sea level rise 47.0%
Flow of traffic in the City 40.3%
Attribute
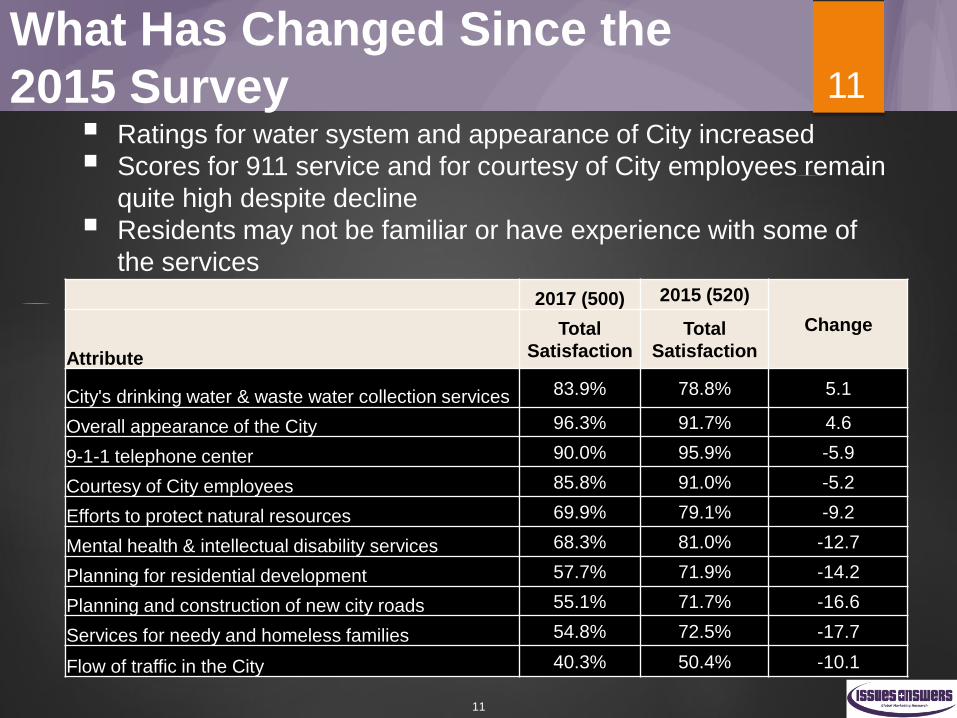
11
Ratings for water system and appearance of City increased
Scores for 911 service and for courtesy of City employees remain
quite high despite decline
Residents may not be familiar or have experience with some of
the services
2017 (500) 2015 (520)
Change
Attribute
Total
Satisfaction
Total
Satisfaction
City's drinking water & waste water collection services 83.9% 78.8% 5.1
Overall appearance of the City 96.3% 91.7% 4.6
9-1-1 telephone center 90.0% 95.9% -5.9
Courtesy of City employees 85.8% 91.0% -5.2
Efforts to protect natural resources 69.9% 79.1% -9.2
Mental health & intellectual disability services 68.3% 81.0% -12.7
Planning for residential development 57.7% 71.9% -14.2
Planning and construction of new city roads 55.1% 71.7% -16.6
Services for needy and homeless families 54.8% 72.5% -17.7
Flow of traffic in the City 40.3% 50.4% -10.1
11
What Has Changed Since the
2015 Survey
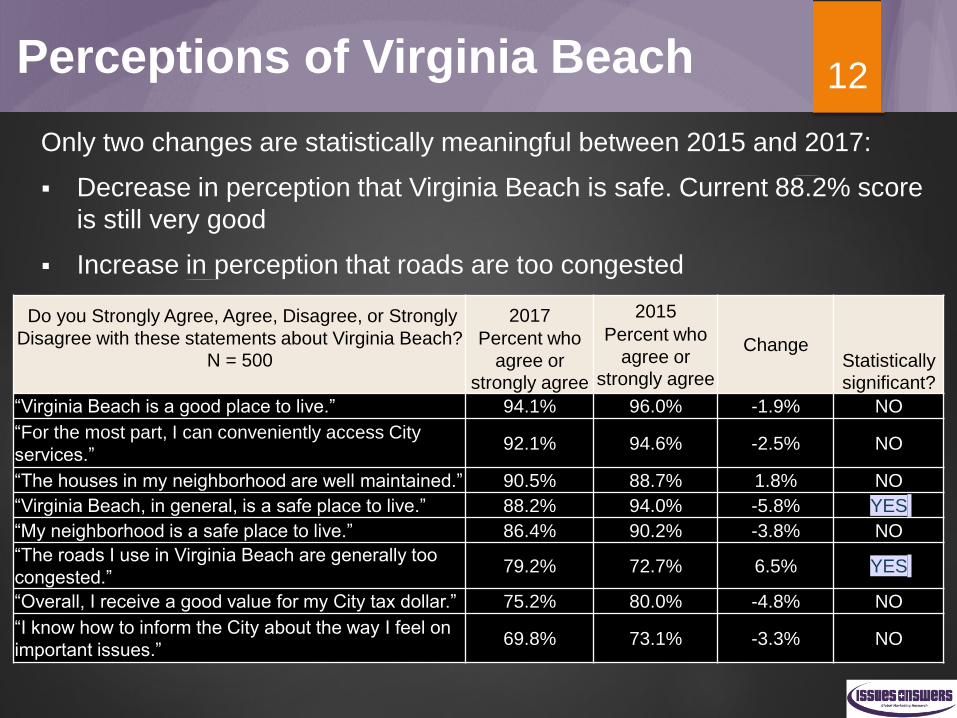
Perceptions of Virginia Beach
Only two changes are statistically meaningful between 2015 and 2017:
Decrease in perception that Virginia Beach is safe. Current 88.2% score
is still very good
Increase in perception that roads are too congested
Do you Strongly Agree, Agree, Disagree, or Strongly
Disagree with these statements about Virginia Beach?
N = 500
2017
Percent who
agree or
strongly agree
2015
Percent who
agree or
strongly agree
ChangeStatistically
significant?
“Virginia Beach is a good place to live.” 94.1% 96.0% -1.9% NO
“For the most part, I can conveniently access City
services.”92.1% 94.6% -2.5% NO
“The houses in my neighborhood are well maintained.” 90.5% 88.7% 1.8% NO
“Virginia Beach, in general, is a safe place to live.” 88.2% 94.0% -5.8% YES
“My neighborhood is a safe place to live.” 86.4% 90.2% -3.8% NO
“The roads I use in Virginia Beach are generally too
congested.”79.2% 72.7% 6.5% YES
“Overall, I receive a good value for my City tax dollar.” 75.2% 80.0% -4.8% NO
“I know how to inform the City about the way I feel on
important issues.”69.8% 73.1% -3.3% NO
12
Perceptions of Safety
Perceptions of safety of neighborhoods in the City has been in gradual
decline for more than a decade. This year, perceptions of the City
overall slipped.
96.4%93.6% 93.2% 93.6%
92.0%90.7% 90.2%
86.4%
50%
55%
60%
65%
70%
75%
80%
85%
90%
95%
100%
2003 2005 2007 2009 2011 2013 2015 2017
"My neighborhood is a safe place to live."
(% "agree" or "strongly agree.)
95.6% 94.8%92.8%
94.2% 94.6% 94.8% 94.0%
88.2%
50%
55%
60%
65%
70%
75%
80%
85%
90%
95%
100%
2003 2005 2007 2009 2011 2013 2015 2017
"Virginia Beach in general is a
safe place to live."
(% "agree" or "strongly agree)
13
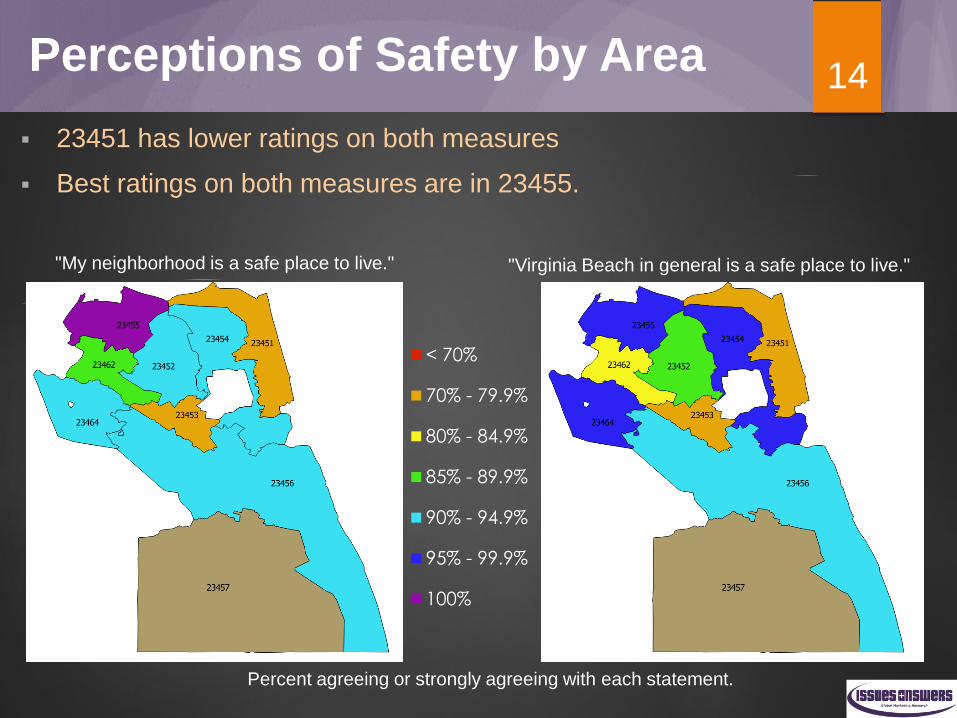
Perceptions of Safety by Area
23451 has lower ratings on both measures
Best ratings on both measures are in 23455.
"My neighborhood is a safe place to live." "Virginia Beach in general is a safe place to live."
Percent agreeing or strongly agreeing with each statement.
< 70%
70% - 79.9%
80% - 84.9%
85% - 89.9%
90% - 94.9%
95% - 99.9%
100%
14
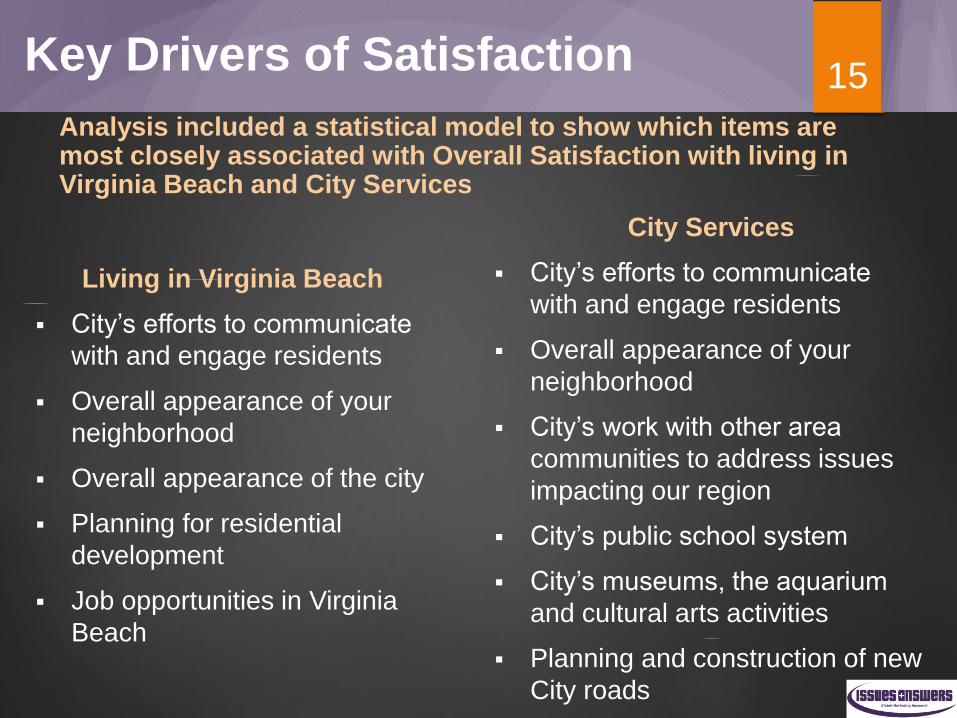
Key Drivers of Satisfaction
Living in Virginia Beach
City’s efforts to communicate
with and engage residents
Overall appearance of your
neighborhood
Overall appearance of the city
Planning for residential
development
Job opportunities in Virginia
Beach
City Services
City’s efforts to communicate
with and engage residents
Overall appearance of your
neighborhood
City’s work with other area
communities to address issues
impacting our region
City’s public school system
City’s museums, the aquarium
and cultural arts activities
Planning and construction of new
City roads
Analysis included a statistical model to show which items are most closely associated with Overall Satisfaction with living in Virginia Beach and City Services
15
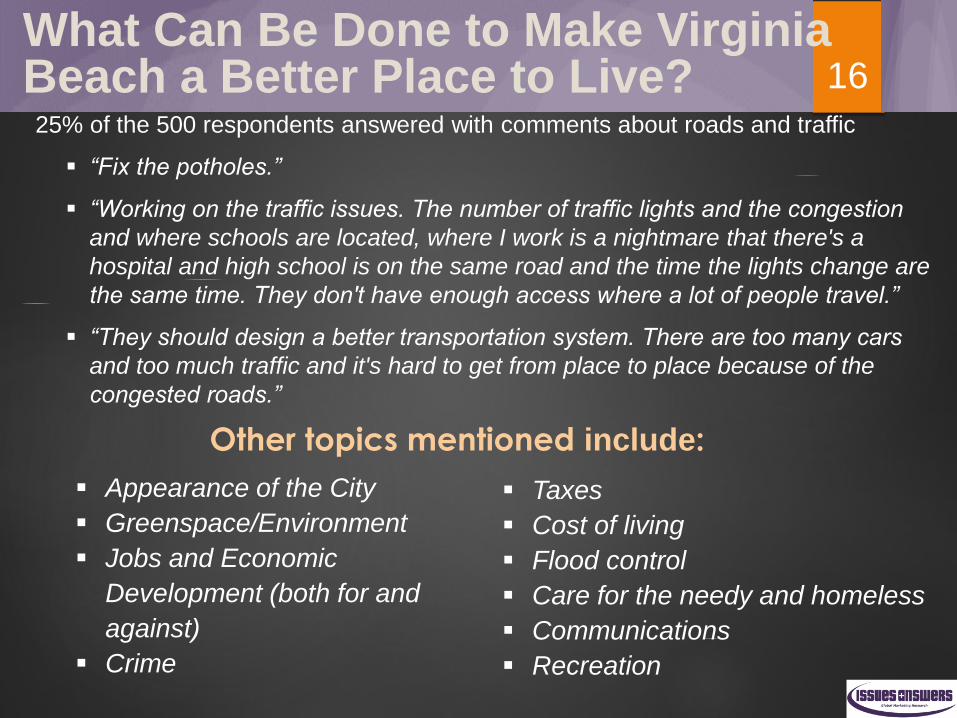
What Can Be Done to Make Virginia Beach a Better Place to Live?25% of the 500 respondents answered with comments about roads and traffic
“Fix the potholes.”
“Working on the traffic issues. The number of traffic lights and the congestion
and where schools are located, where I work is a nightmare that there's a
hospital and high school is on the same road and the time the lights change are
the same time. They don't have enough access where a lot of people travel.”
“They should design a better transportation system. There are too many cars
and too much traffic and it's hard to get from place to place because of the
congested roads.”
Taxes
Cost of living
Flood control
Care for the needy and homeless
Communications
Recreation
Appearance of the City
Greenspace/Environment
Jobs and Economic
Development (both for and
against)
Crime
Other topics mentioned include:
16
Communications with Residents
8%
3%
7%
12%
13%
13%
25%
34%
37%
38%
58%
0% 20% 40% 60% 80%
Do not get…
Some other way
311 call center
Newsletters like City…
Email from the City
Civic league…
City's cable TV…
Radio
Printed newspaper
Friends or family
TV news
Offline Sources Used for Information about City, n= 500
17
8%
2%
3%
6%
15%
19%
20%
26%
31%
66%
0% 20% 40% 60% 80%
Do not use online…
Other
The City's Twitter feed
Other social media…
The City's Nextdoor…
VB Alerts
Facebook pages…
Pilot Online
TV news websites
City website,…
Online Sources Used for
Information about CIty, n = 500
Communications with Residents
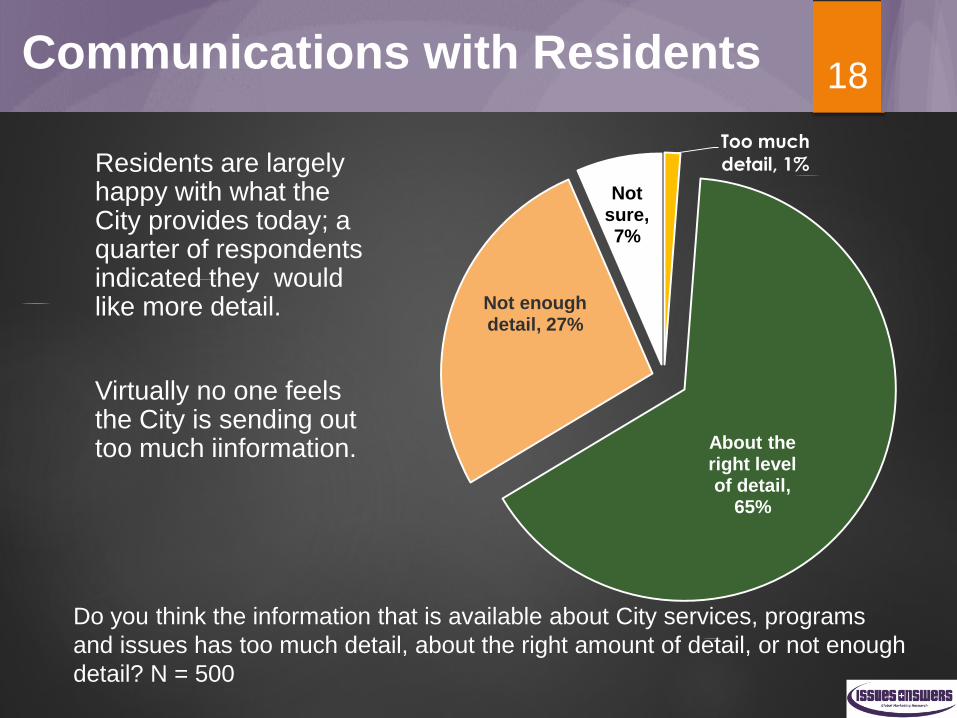
Residents are largely happy with what the City provides today; a quarter of respondents indicated they would like more detail.
Virtually no one feels the City is sending out too much iinformation.
Too much
detail, 1%
About the right level of detail,
65%
Not enough detail, 27%
Not sure, 7%
Do you think the information that is available about City services, programs
and issues has too much detail, about the right amount of detail, or not enough
detail? N = 500
18
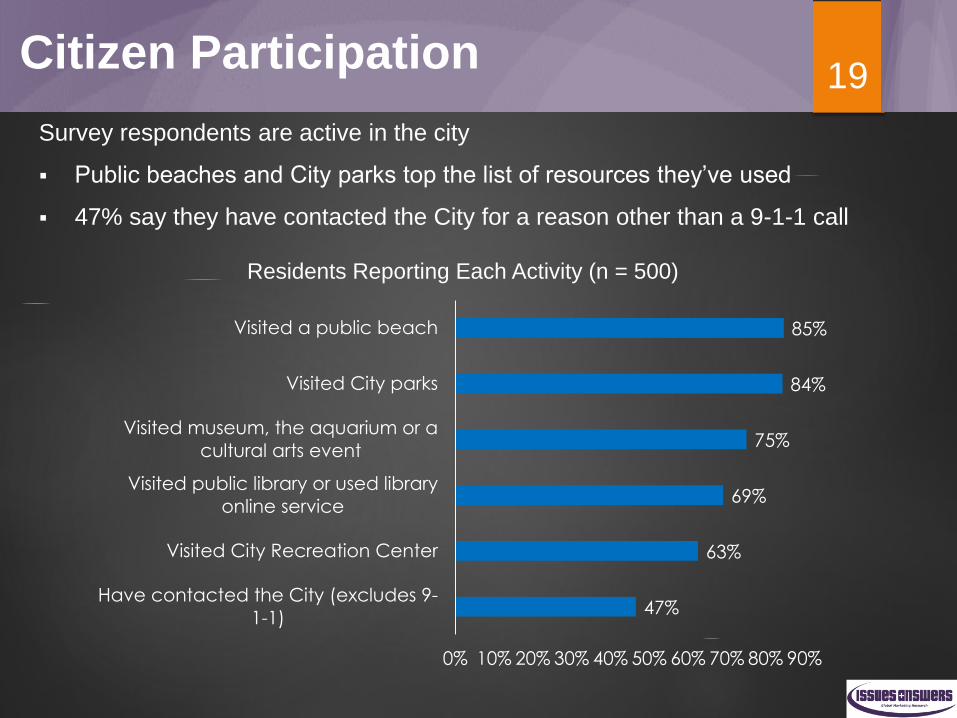
Citizen Participation
Survey respondents are active in the city
Public beaches and City parks top the list of resources they’ve used
47% say they have contacted the City for a reason other than a 9-1-1 call
47%
63%
69%
75%
84%
85%
0% 10% 20% 30% 40% 50% 60% 70% 80% 90%
Have contacted the City (excludes 9-
1-1)
Visited City Recreation Center
Visited public library or used library
online service
Visited museum, the aquarium or a
cultural arts event
Visited City parks
Visited a public beach
Residents Reporting Each Activity (n = 500)
19
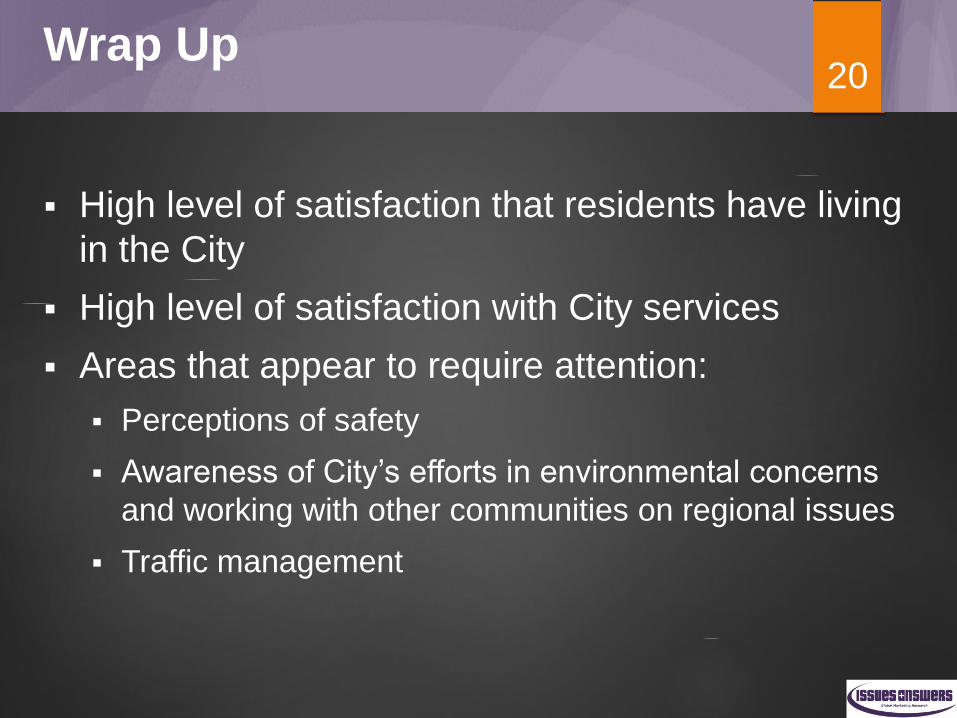
Wrap Up
High level of satisfaction that residents have living
in the City
High level of satisfaction with City services
Areas that appear to require attention:
Perceptions of safety
Awareness of City’s efforts in environmental concerns
and working with other communities on regional issues
Traffic management
20


![nilight[1] - VBgov.com](https://img.pdfslide.net/doc/110x75/61e64249a5466e109a77f614/nilight1-vbgovcom.jpg)