Embed Size (px)
Citation preview
CITIZEN PERSPECTIVE2017 Citizen Survey
1
Survey conducted by Prairie Research AssociatesMay 2017
What is Market Research?
• The process of gathering information to learn more about how customers and potential customers perceive products or services
• Market research can cover a broad spectrum of activities– A short customer satisfaction questionnaire– Studying demographic data for your area– Contract with a professional market research firm to do a broader survey
• Why do market research?– To understand your customers and their preferences – To support evidence-informed business decisions– Regular research allows a business to understand and adapt to changing needs
Successful businesses have extensive knowledge of their customers and their competitors.
2
Survey Method
• Conducted by Prairie Research Associates, Inc.– Prairie Research Associates (2001, 2002, 2015, 2016, and 2017) – Market Dimensions (2009, 2010, 2011, 2013 and 2014) – Dimark (2012)– Telelink (2007)– Kisquared (2004)– Acumen Research (2003)– No survey conducted (2005, 2006 and 2008)
• A random telephone survey• 600 Winnipeggers surveyed in first two weeks of May 2017
– Results in a margin of error of ±4.0%, 19 times out of 20.
• Data presented is based on people who answered the survey question
– (excludes “don’t know” / refused responses)
3
Who Were the Survey Respondents?
The survey was administered to those who indicated they:• Are 18 years or older• Have lived in Winnipeg (or pay taxes to the City) for at
least one year• Agreed to participate in the survey
– “This evening we’re talking to residents of Winnipeg regarding issues affecting the City. The survey will take approximately 15 minutes to complete.”
4
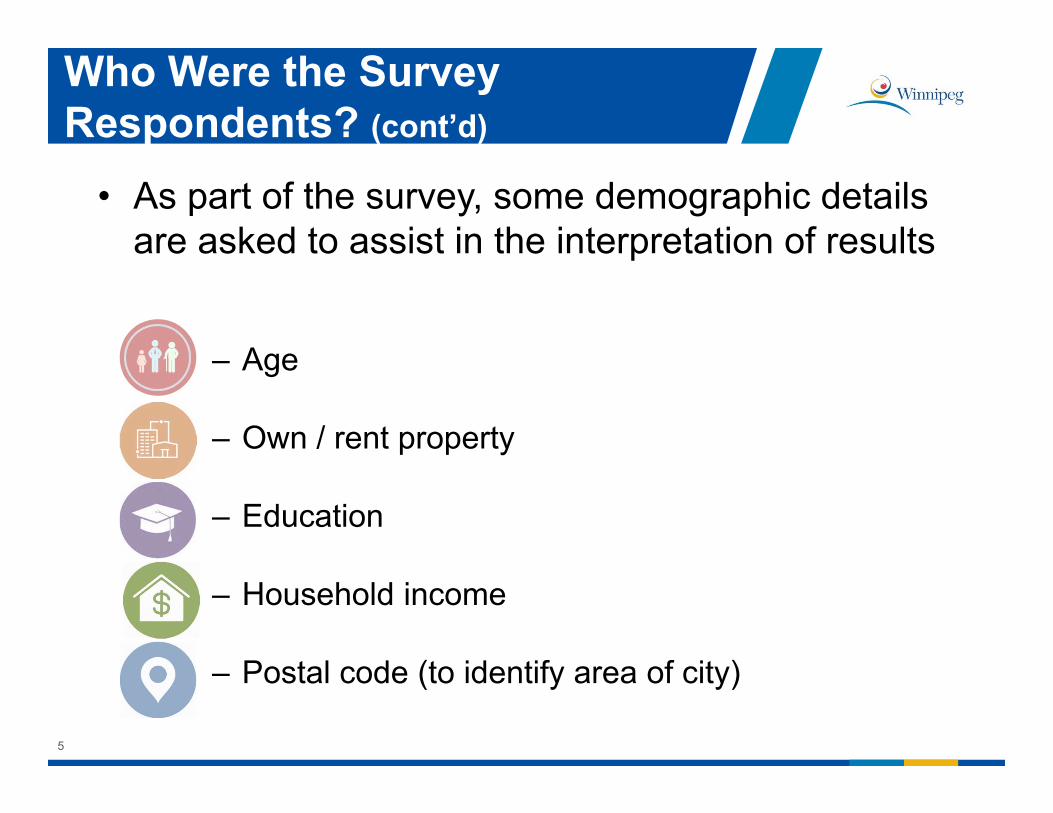
• As part of the survey, some demographic details are asked to assist in the interpretation of results
– Age
– Own / rent property
– Education
– Household income
– Postal code (to identify area of city)
Who Were the Survey Respondents? (cont’d)
5
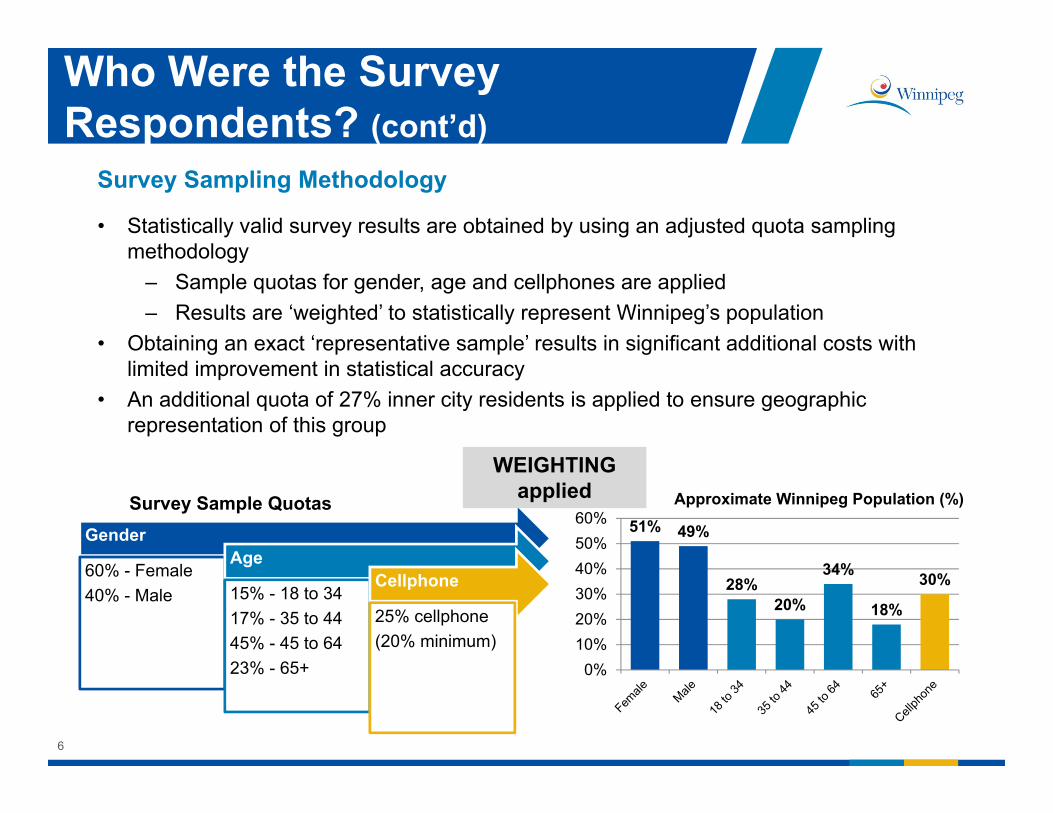
Survey Sampling Methodology
Who Were the Survey Respondents? (cont’d)
6
Gender
60% - Female40% - Male
Age
15% - 18 to 3417% - 35 to 4445% - 45 to 6423% - 65+
Cellphone
25% cellphone(20% minimum)
51% 49%
28%20%
34%
18%
30%
0%10%20%30%40%50%60%
Approximate Winnipeg Population (%)
• Statistically valid survey results are obtained by using an adjusted quota sampling methodology
– Sample quotas for gender, age and cellphones are applied – Results are ‘weighted’ to statistically represent Winnipeg’s population
• Obtaining an exact ‘representative sample’ results in significant additional costs with limited improvement in statistical accuracy
• An additional quota of 27% inner city residents is applied to ensure geographic representation of this group
Survey Sample Quotas
WEIGHTINGapplied
ava
THE RESULTS
7
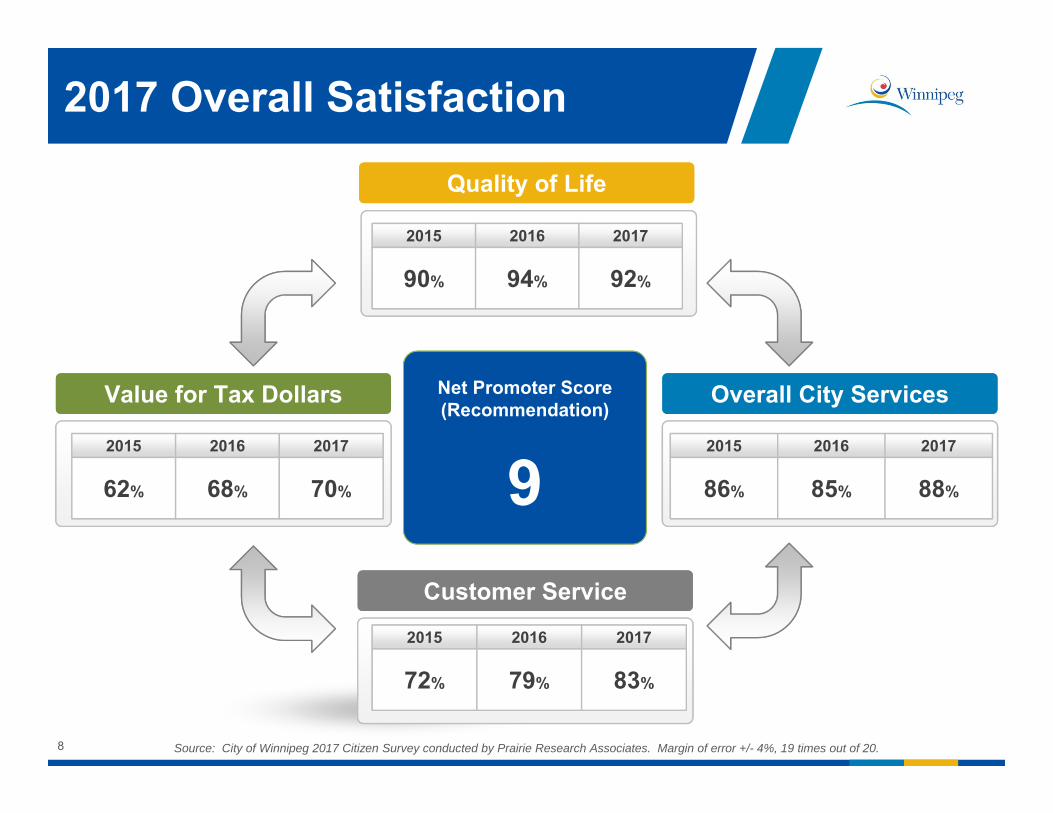
2017 Overall Satisfaction
Net Promoter Score (Recommendation)
9
Quality of LifeQuality of Life
2015
90%
2016
94%
2017
92%
2015
90%
2016
94%
2017
92%
Overall City ServicesOverall City ServicesValue for Tax DollarsValue for Tax Dollars
Customer ServiceCustomer Service
2015
62%
2016
68%
2017
70%
2015
62%
2016
68%
2017
70%
2015
86%
2016
85%
2017
88%
2015
86%
2016
85%
2017
88%
2015
72%
2016
79%
2017
83%
2015
72%
2016
79%
2017
83%
Source: City of Winnipeg 2017 Citizen Survey conducted by Prairie Research Associates. Margin of error +/- 4%, 19 times out of 20.8
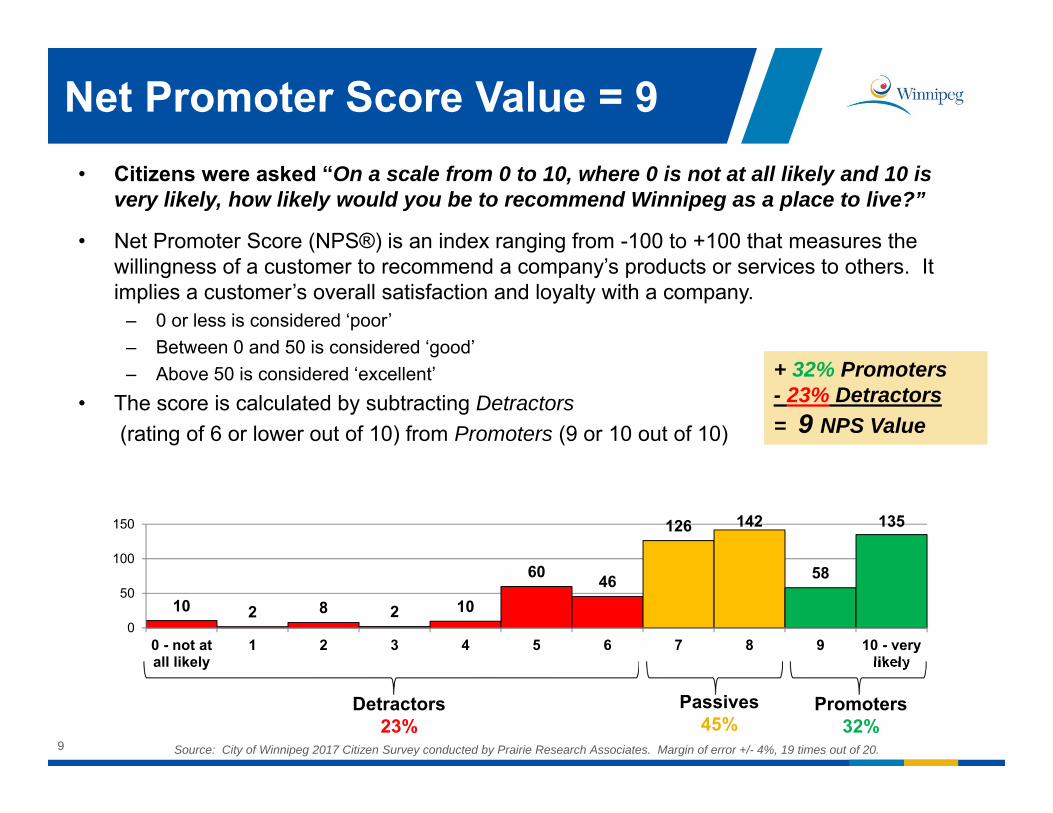
Net Promoter Score Value = 9• Citizens were asked “On a scale from 0 to 10, where 0 is not at all likely and 10 is
very likely, how likely would you be to recommend Winnipeg as a place to live?”
• Net Promoter Score (NPS®) is an index ranging from -100 to +100 that measures the willingness of a customer to recommend a company’s products or services to others. It implies a customer’s overall satisfaction and loyalty with a company.
– 0 or less is considered ‘poor’– Between 0 and 50 is considered ‘good’– Above 50 is considered ‘excellent’
• The score is calculated by subtracting Detractors (rating of 6 or lower out of 10) from Promoters (9 or 10 out of 10)
Source: City of Winnipeg 2017 Citizen Survey conducted by Prairie Research Associates. Margin of error +/- 4%, 19 times out of 20.
Promoters32%
Detractors23%
Passives45%
9
10 2 8 2 10
60 46
126 142
58
135
0
50
100
150
0 - not atall likely
1 2 3 4 5 6 7 8 9 10 - verylikely
+ 32% Promoters- 23% Detractors= 9 NPS Value
ava
QUALITY OF LIFE
10
Quality of Life
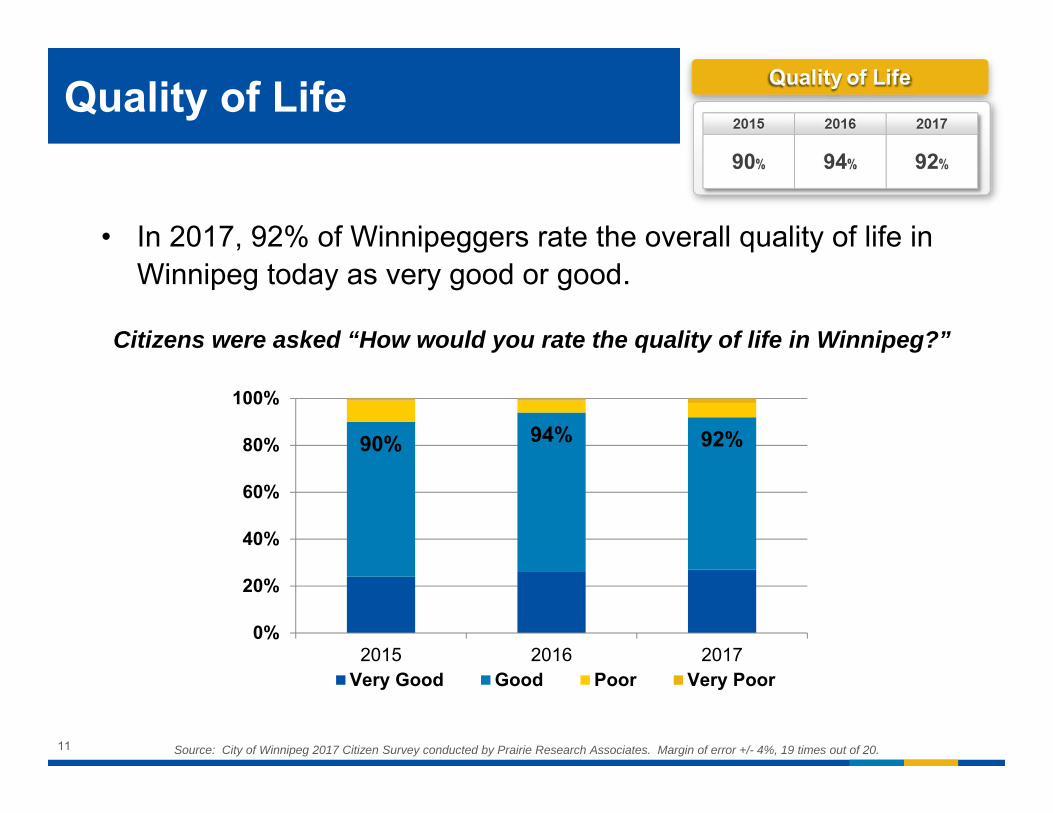
• In 2017, 92% of Winnipeggers rate the overall quality of life in Winnipeg today as very good or good.
Source: City of Winnipeg 2017 Citizen Survey conducted by Prairie Research Associates. Margin of error +/- 4%, 19 times out of 20.
90% 94% 92%
0%
20%
40%
60%
80%
100%
2015 2016 2017Very Good Good Poor Very Poor
Citizens were asked “How would you rate the quality of life in Winnipeg?”
11
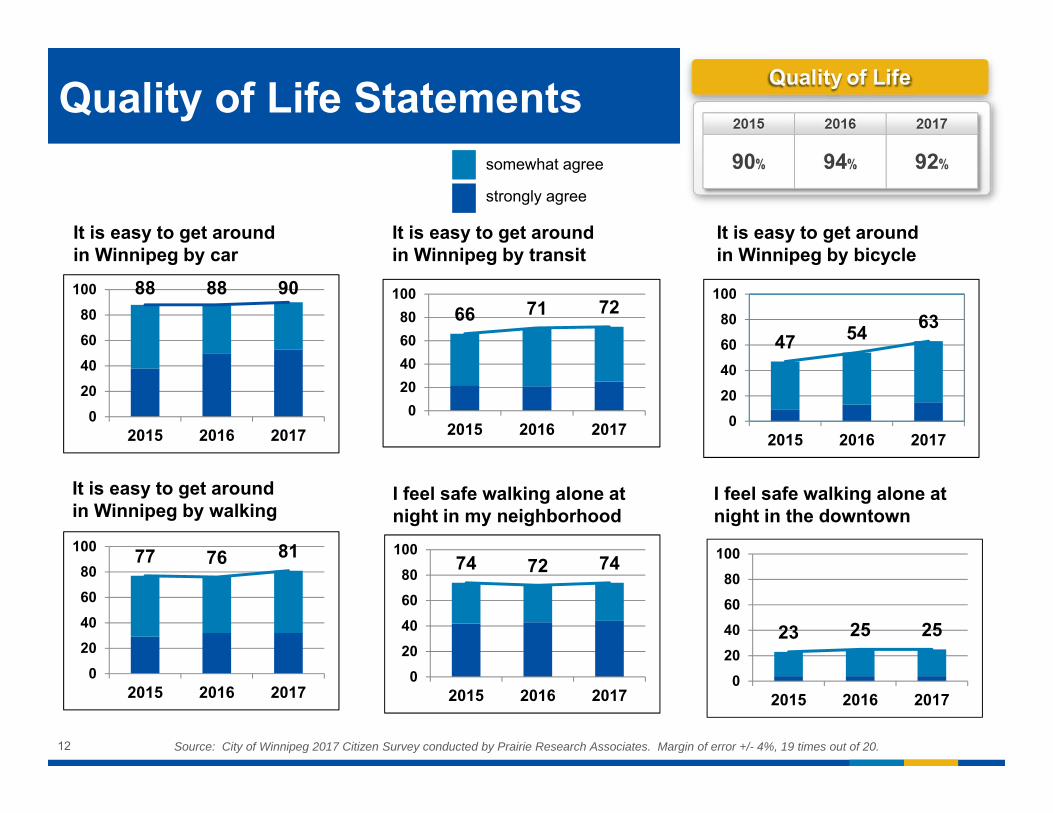
88 88 90
020406080
100
2015 2016 2017
I feel safe walking alone at night in my neighborhood
I feel safe walking alone at night in the downtown
It is easy to get around in Winnipeg by car
It is easy to get around in Winnipeg by bicycle
It is easy to get around in Winnipeg by transit
It is easy to get around in Winnipeg by walking
66 71 72
020406080
100
2015 2016 2017
47 54 63
020406080
100
2015 2016 2017
77 76 81
020406080
100
2015 2016 2017
74 72 74
020406080
100
2015 2016 2017
23 25 25
020406080
100
2015 2016 2017
Quality of Life Statements
Source: City of Winnipeg 2017 Citizen Survey conducted by Prairie Research Associates. Margin of error +/- 4%, 19 times out of 20.
somewhat agree
strongly agree
12
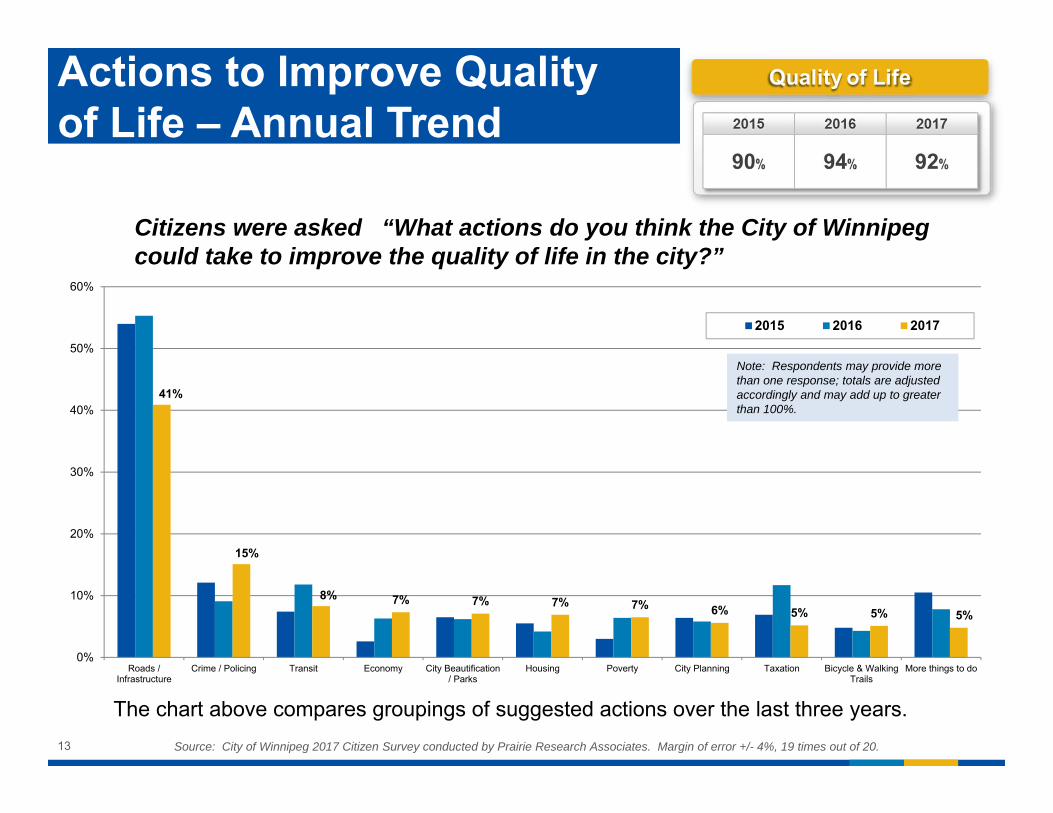
41%
15%
8% 7% 7% 7% 7% 6% 5% 5% 5%
0%
10%
20%
30%
40%
50%
60%
Roads /Infrastructure
Crime / Policing Transit Economy City Beautification/ Parks
Housing Poverty City Planning Taxation Bicycle & WalkingTrails
More things to do
2015 2016 2017
Actions to Improve Quality of Life – Annual Trend
Note: Respondents may provide more than one response; totals are adjusted accordingly and may add up to greater than 100%.
The chart above compares groupings of suggested actions over the last three years.Source: City of Winnipeg 2017 Citizen Survey conducted by Prairie Research Associates. Margin of error +/- 4%, 19 times out of 20.13
Citizens were asked “What actions do you think the City of Winnipeg could take to improve the quality of life in the city?”

Actions to Improve Quality of Life – Annual Trend
When these suggested actions were compared to respondents’ quality of life response, the following improvement areas were the most suggested:
Source: City of Winnipeg 2017 Citizen Survey conducted by Prairie Research Associates. Margin of error +/- 4%, 19 times out of 20.14
• Crime / Policing• Roads / Infrastructure• Poverty
• Roads / Infrastructure• Crime / Policing• Transit
Quality of Life is Good / Very Good (92%)
Quality of Life is Poor / Very Poor (8%)
Citizens were asked “What actions do you think the City of Winnipeg could take to improve the quality of life in the city?”
ava
VALUE FOR TAX DOLLARS
15
Value for Tax Dollars
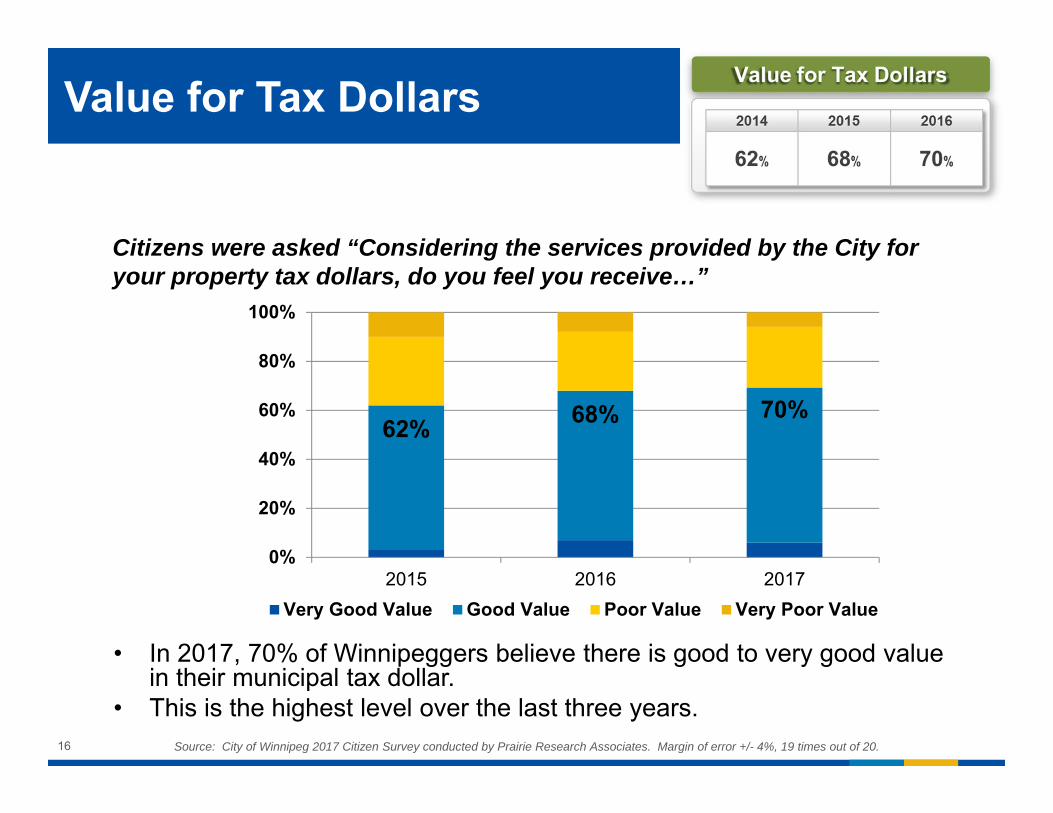
• In 2017, 70% of Winnipeggers believe there is good to very good value in their municipal tax dollar.
• This is the highest level over the last three years.
62% 68% 70%
0%
20%
40%
60%
80%
100%
2015 2016 2017Very Good Value Good Value Poor Value Very Poor Value
Source: City of Winnipeg 2017 Citizen Survey conducted by Prairie Research Associates. Margin of error +/- 4%, 19 times out of 20.
Citizens were asked “Considering the services provided by the City for your property tax dollars, do you feel you receive…”
16
Reason for ‘Value Received for Tax Dollars’
Note: Respondents may provide more than one response; totals are adjusted accordingly and may add up to greater than 100%.
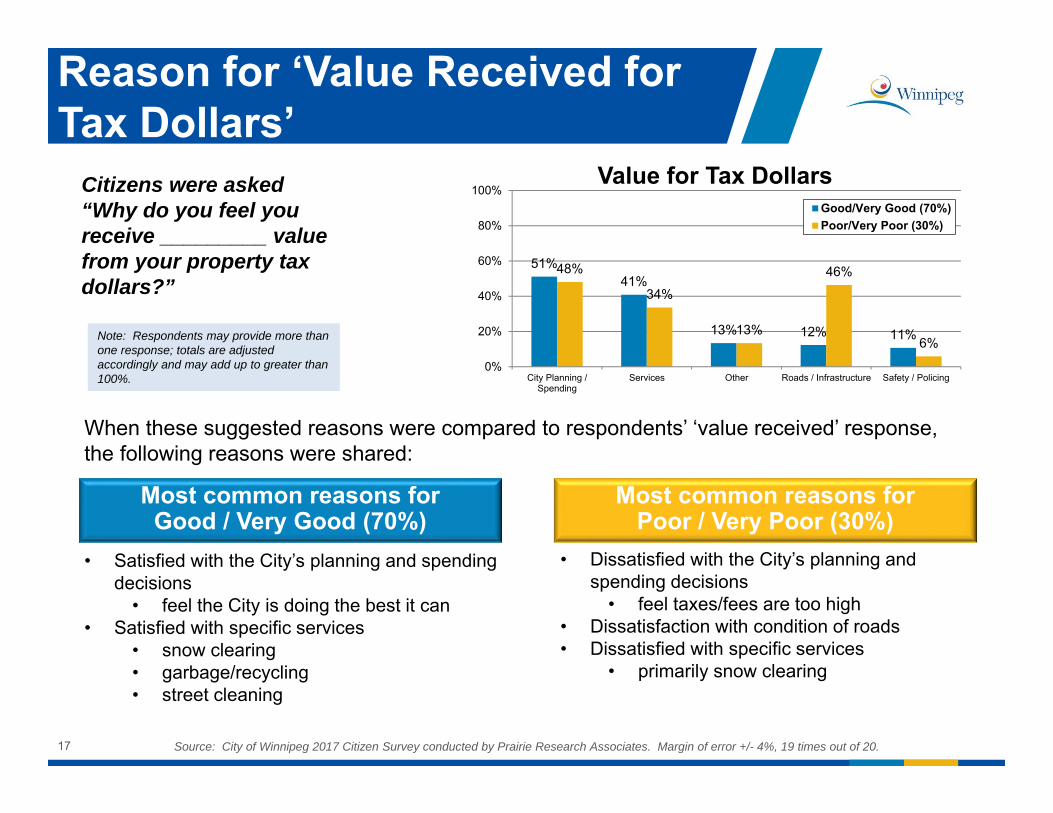
When these suggested reasons were compared to respondents’ ‘value received’ response, the following reasons were shared:
Source: City of Winnipeg 2017 Citizen Survey conducted by Prairie Research Associates. Margin of error +/- 4%, 19 times out of 20.17
Citizens were asked “Why do you feel you receive _________ value from your property tax dollars?”
Most common reasons for Good / Very Good (70%)
Most common reasons for Poor / Very Poor (30%)
51%41%
13% 12% 11%
48%
34%
13%
46%
6%
0%
20%
40%
60%
80%
100%
City Planning /Spending
Services Other Roads / Infrastructure Safety / Policing
Value for Tax DollarsGood/Very Good (70%)Poor/Very Poor (30%)
• Dissatisfied with the City’s planning and spending decisions
• feel taxes/fees are too high• Dissatisfaction with condition of roads• Dissatisfied with specific services
• primarily snow clearing
• Satisfied with the City’s planning and spending decisions
• feel the City is doing the best it can• Satisfied with specific services
• snow clearing• garbage/recycling• street cleaning
avaSATISFACTION WITH CUSTOMER SERVICE
18
Satisfaction with Customer Service
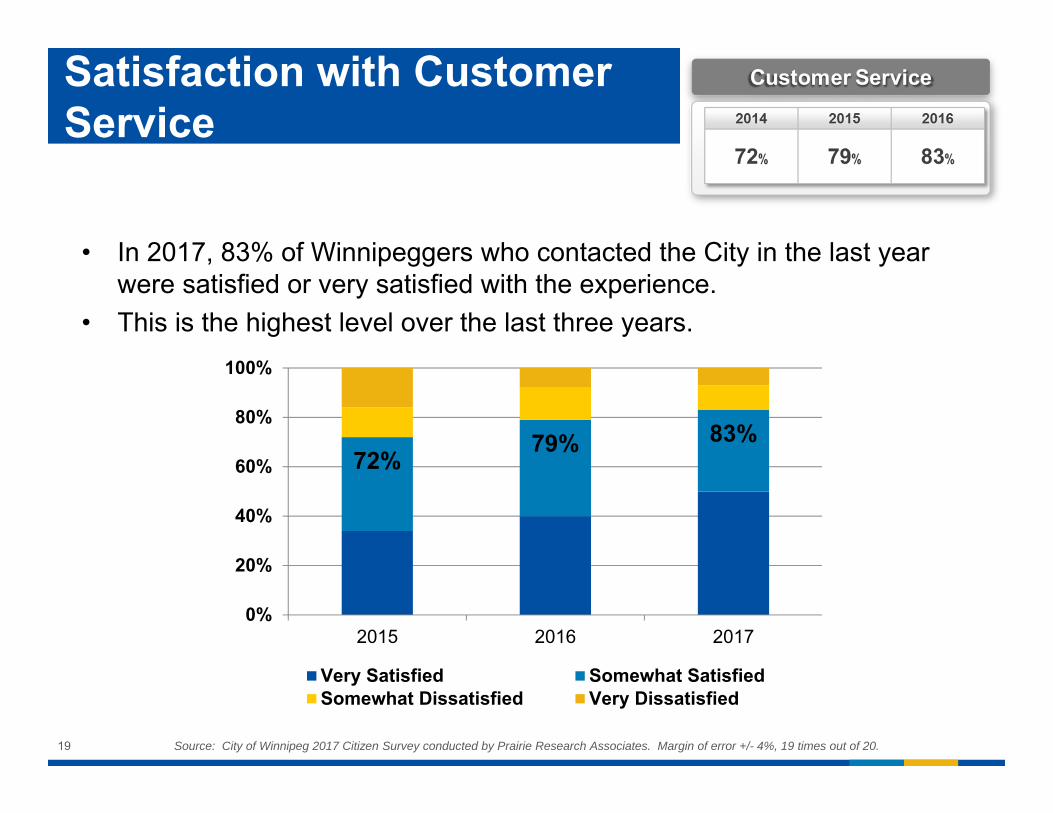
• In 2017, 83% of Winnipeggers who contacted the City in the last year were satisfied or very satisfied with the experience.
• This is the highest level over the last three years.
72%79% 83%
0%
20%
40%
60%
80%
100%
2015 2016 2017
Very Satisfied Somewhat SatisfiedSomewhat Dissatisfied Very Dissatisfied
Source: City of Winnipeg 2017 Citizen Survey conducted by Prairie Research Associates. Margin of error +/- 4%, 19 times out of 20.19
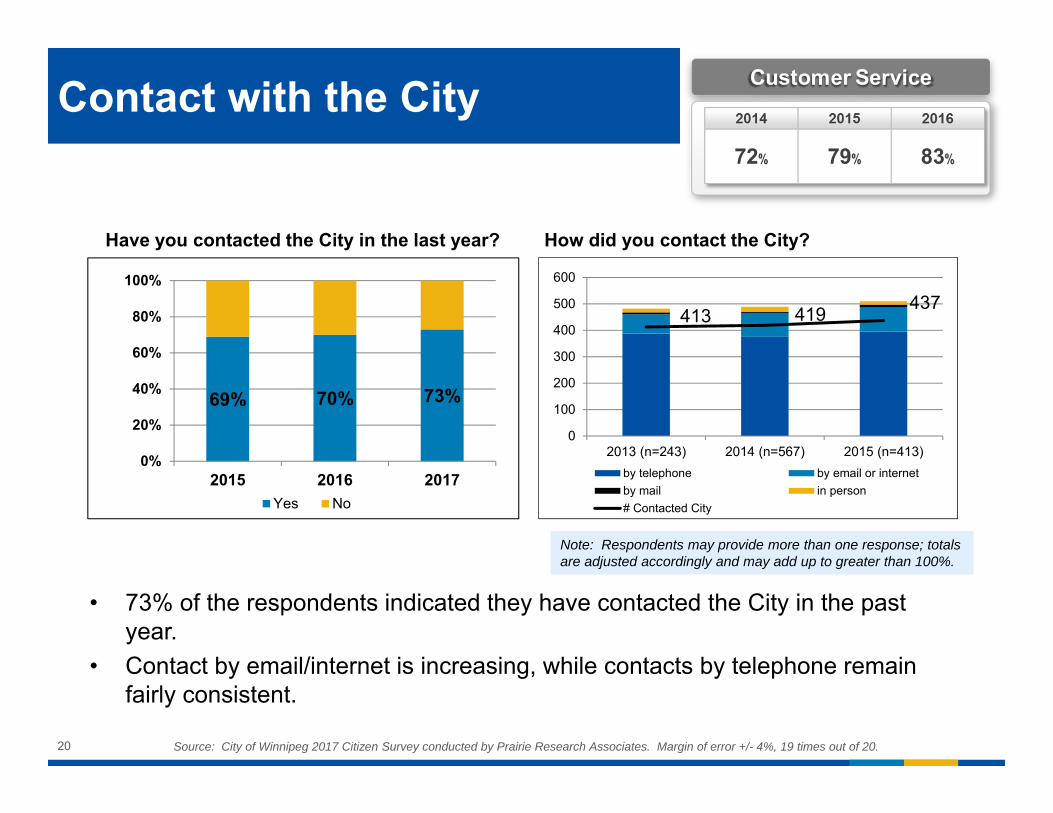
Contact with the City
• 73% of the respondents indicated they have contacted the City in the past year.
• Contact by email/internet is increasing, while contacts by telephone remain fairly consistent.
Source: City of Winnipeg 2017 Citizen Survey conducted by Prairie Research Associates. Margin of error +/- 4%, 19 times out of 20.
How did you contact the City?
69% 70% 73%
0%
20%
40%
60%
80%
100%
2015 2016 2017Yes No
Have you contacted the City in the last year?
Note: Respondents may provide more than one response; totals are adjusted accordingly and may add up to greater than 100%.
20
413 419 437
0
100
200
300
400
500
600
2013 (n=243) 2014 (n=567) 2015 (n=413)by telephone by email or internetby mail in person# Contacted City
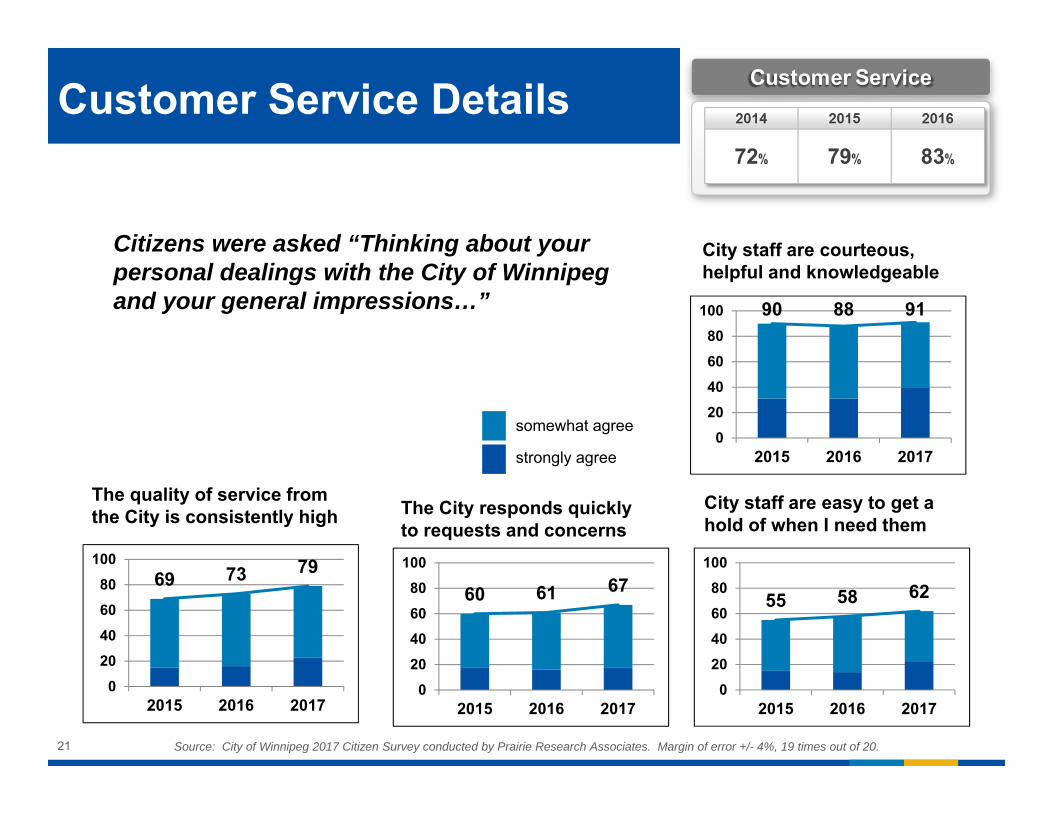
The City responds quickly to requests and concerns
City staff are easy to get a hold of when I need them
City staff are courteous, helpful and knowledgeable
The quality of service from the City is consistently high
90 88 91
020406080
100
2015 2016 2017
69 73 79
020406080
100
2015 2016 2017
60 61 67
020406080
100
2015 2016 2017
55 58 62
020406080
100
2015 2016 2017
somewhat agree
strongly agree
Customer Service Details
Source: City of Winnipeg 2017 Citizen Survey conducted by Prairie Research Associates. Margin of error +/- 4%, 19 times out of 20.
Citizens were asked “Thinking about your personal dealings with the City of Winnipeg and your general impressions…”
21
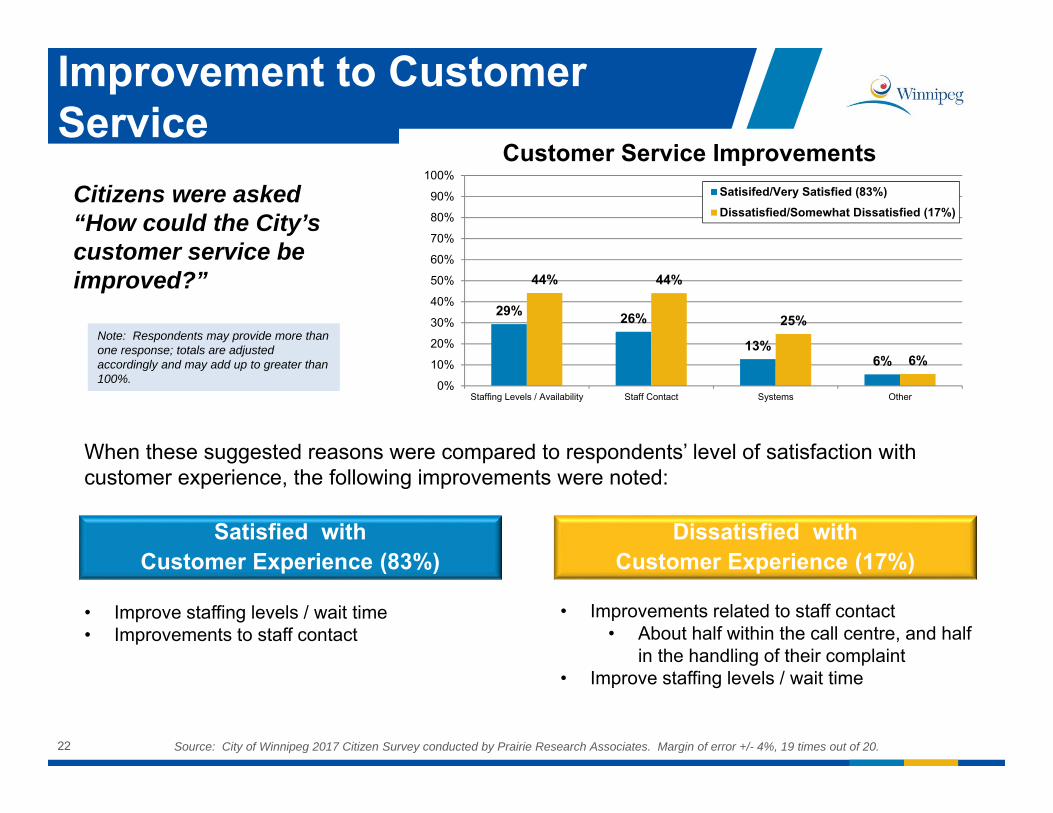
Improvement to Customer Service
Note: Respondents may provide more than one response; totals are adjusted accordingly and may add up to greater than 100%.
When these suggested reasons were compared to respondents’ level of satisfaction with customer experience, the following improvements were noted:
Source: City of Winnipeg 2017 Citizen Survey conducted by Prairie Research Associates. Margin of error +/- 4%, 19 times out of 20.22
• Improvements related to staff contact• About half within the call centre, and half
in the handling of their complaint• Improve staffing levels / wait time
• Improve staffing levels / wait time• Improvements to staff contact
Satisfied with Customer Experience (83%)
Dissatisfied withCustomer Experience (17%)
Citizens were asked “How could the City’s customer service be improved?”
29% 26%
13%6%
44% 44%
25%
6%
0%
10%
20%
30%
40%
50%
60%
70%
80%
90%
100%
Staffing Levels / Availability Staff Contact Systems Other
Customer Service ImprovementsSatisifed/Very Satisfied (83%)Dissatisfied/Somewhat Dissatisfied (17%)

avaSATISFACTION WITH CITY SERVICES
23
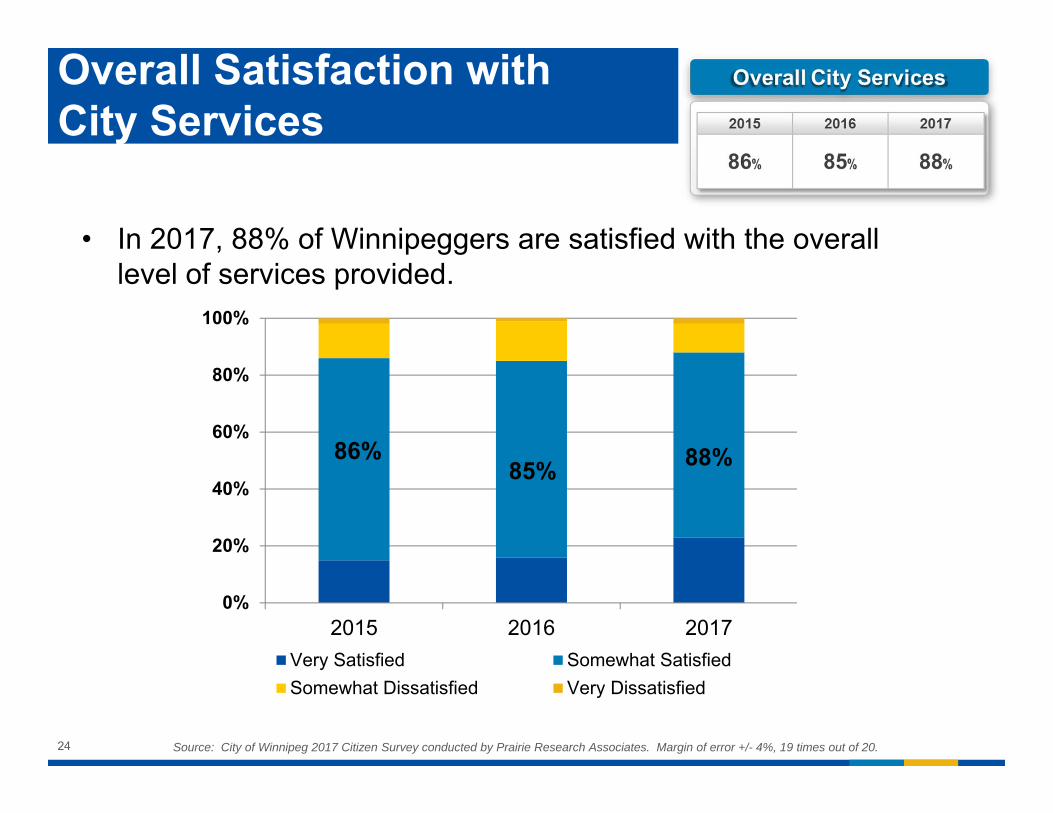
Overall Satisfaction with City Services
• In 2017, 88% of Winnipeggers are satisfied with the overall level of services provided.
86%85% 88%
0%
20%
40%
60%
80%
100%
2015 2016 2017Very Satisfied Somewhat SatisfiedSomewhat Dissatisfied Very Dissatisfied
Source: City of Winnipeg 2017 Citizen Survey conducted by Prairie Research Associates. Margin of error +/- 4%, 19 times out of 20.24
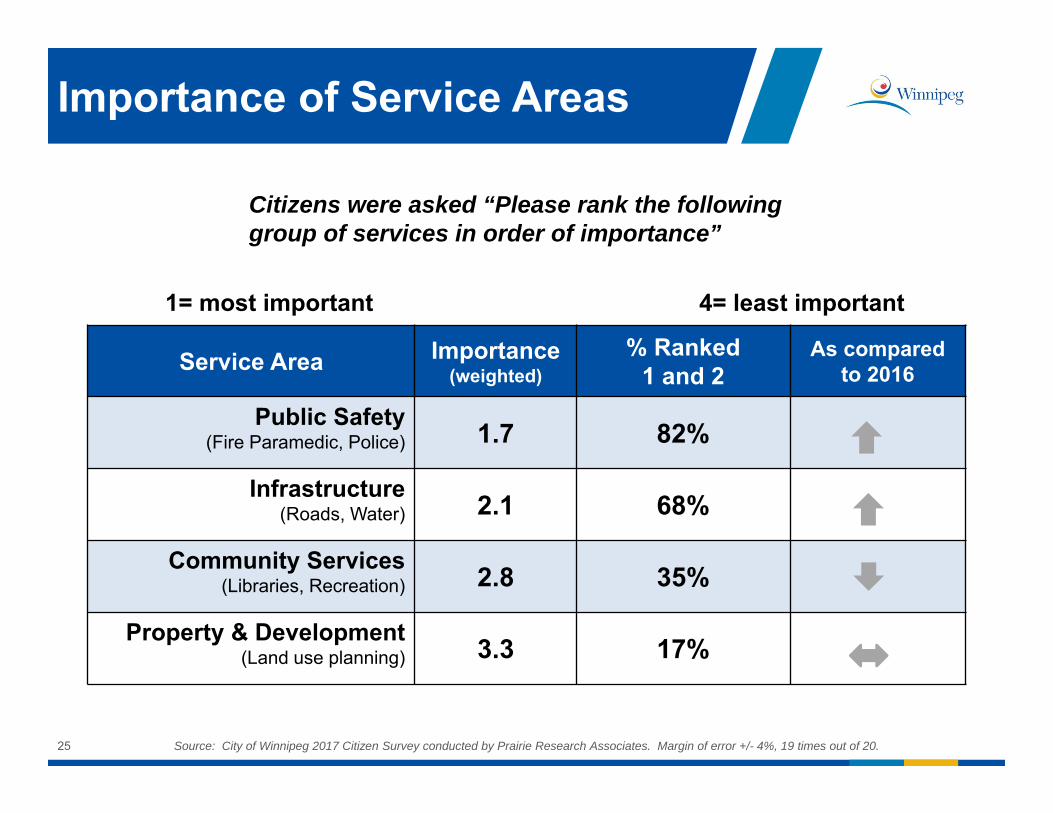
Importance of Service Areas
1= most important 4= least important
Service Area Importance(weighted)
% Ranked 1 and 2
As compared to 2016
Public Safety(Fire Paramedic, Police) 1.7 82%
Infrastructure(Roads, Water) 2.1 68%
Community Services(Libraries, Recreation) 2.8 35%
Property & Development(Land use planning) 3.3 17%
Source: City of Winnipeg 2017 Citizen Survey conducted by Prairie Research Associates. Margin of error +/- 4%, 19 times out of 20.
Citizens were asked “Please rank the following group of services in order of importance”
25
avaINDIVIDUAL SERVICES BY DEPARTMENT
26
Citizens were asked: “Now, I'm going to read you a list of services that are provided by the City of Winnipeg. Please tell me whether you are very dissatisfied, somewhat dissatisfied, somewhat satisfied or
very satisfied with each of the following services.”
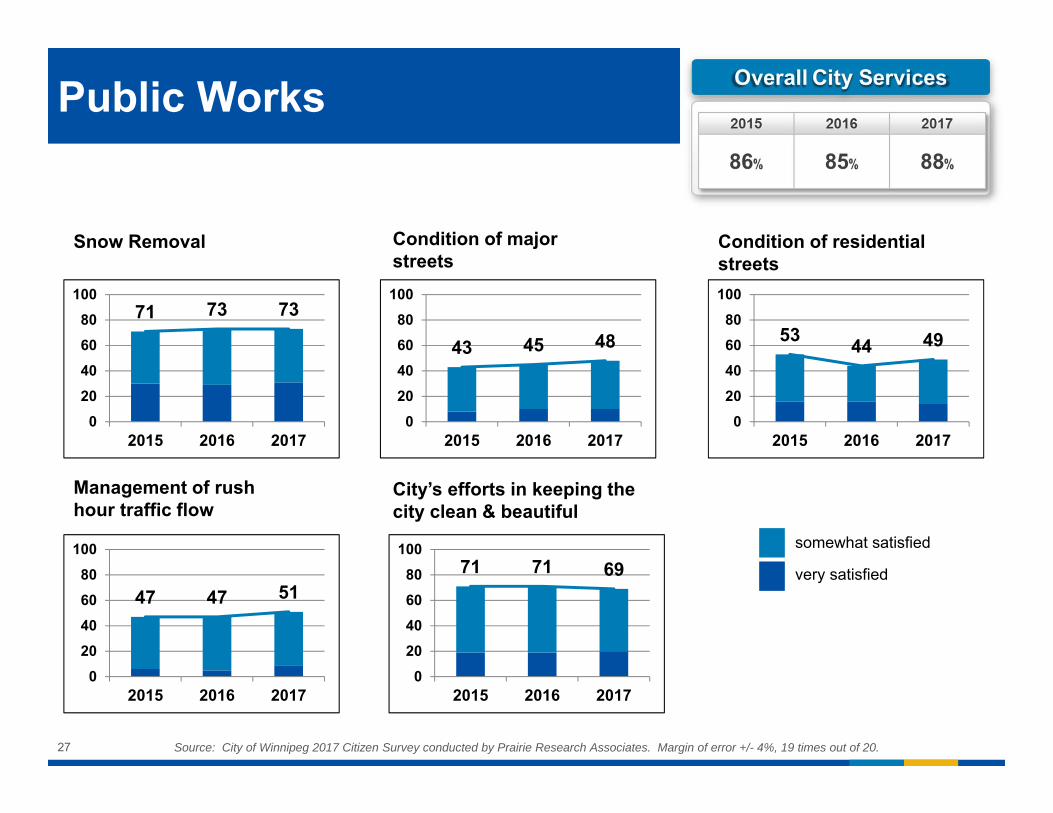
71 73 73
020406080
100
2015 2016 2017
Snow Removal Condition of residential streets
Condition of major streets
Management of rush hour traffic flow
43 45 48
020406080
100
2015 2016 2017
53 44 49
020406080
100
2015 2016 2017
47 47 51
020406080
100
2015 2016 2017
City’s efforts in keeping the city clean & beautiful
71 71 69
020406080
100
2015 2016 2017
Public Works
Source: City of Winnipeg 2017 Citizen Survey conducted by Prairie Research Associates. Margin of error +/- 4%, 19 times out of 20.27
somewhat satisfied
very satisfied
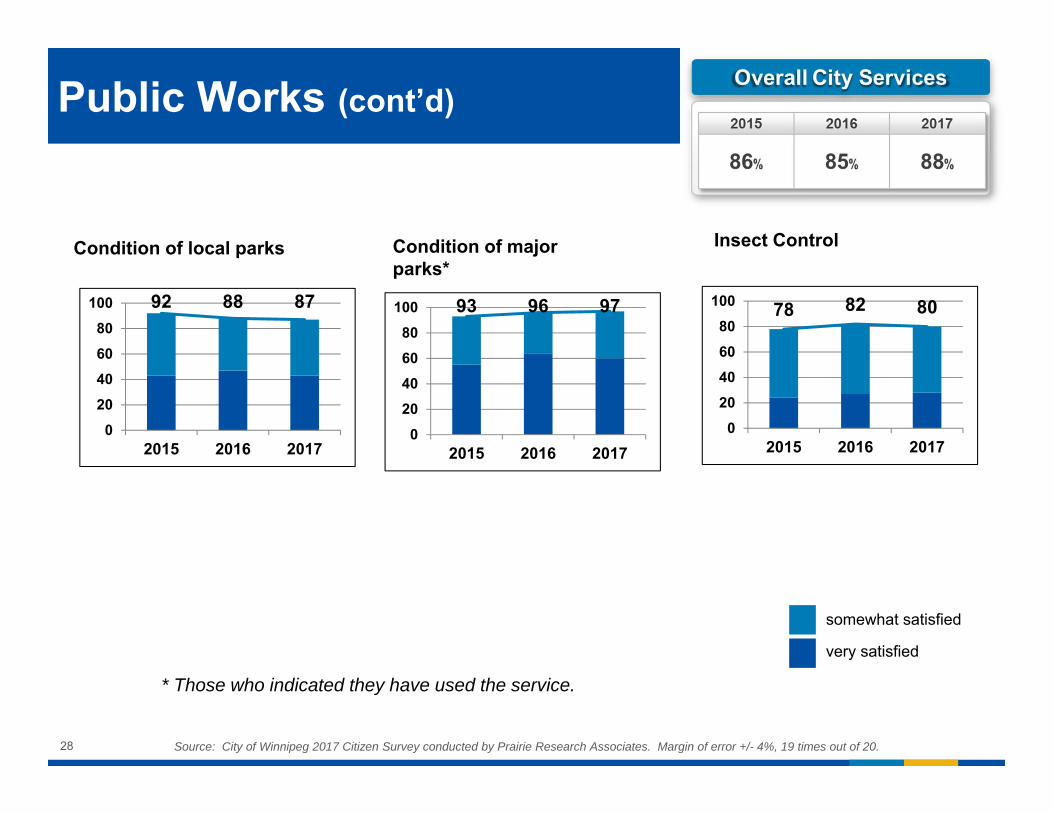
Condition of local parks Insect ControlCondition of major parks*
93 96 97
020406080
100
2015 2016 2017
78 82 80
020406080
100
2015 2016 2017
Public Works (cont’d)
92 88 87
020406080
100
2015 2016 2017
* Those who indicated they have used the service.
Source: City of Winnipeg 2017 Citizen Survey conducted by Prairie Research Associates. Margin of error +/- 4%, 19 times out of 20.28
somewhat satisfied
very satisfied
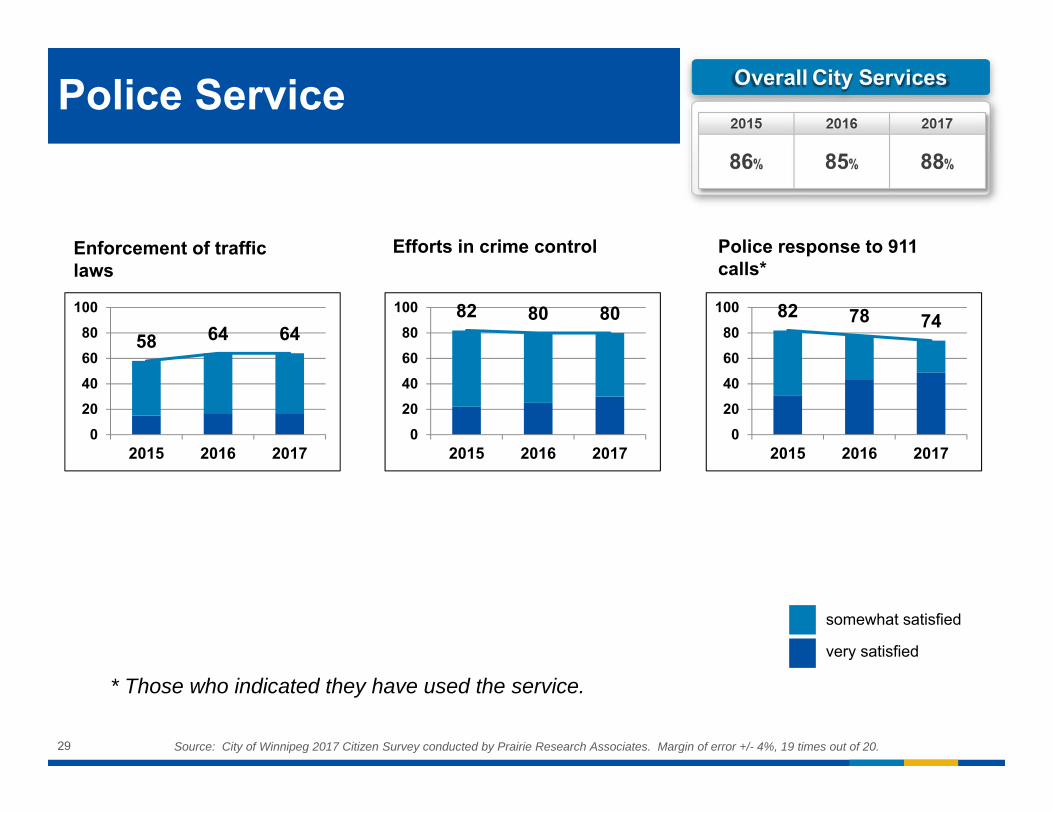
58 64 64
020406080
100
2015 2016 2017
Enforcement of traffic laws
Police response to 911 calls*
Efforts in crime control
82 80 80
020406080
100
2015 2016 2017
82 78 74
020406080
100
2015 2016 2017
Police Service
* Those who indicated they have used the service.
Source: City of Winnipeg 2017 Citizen Survey conducted by Prairie Research Associates. Margin of error +/- 4%, 19 times out of 20.29
somewhat satisfied
very satisfied
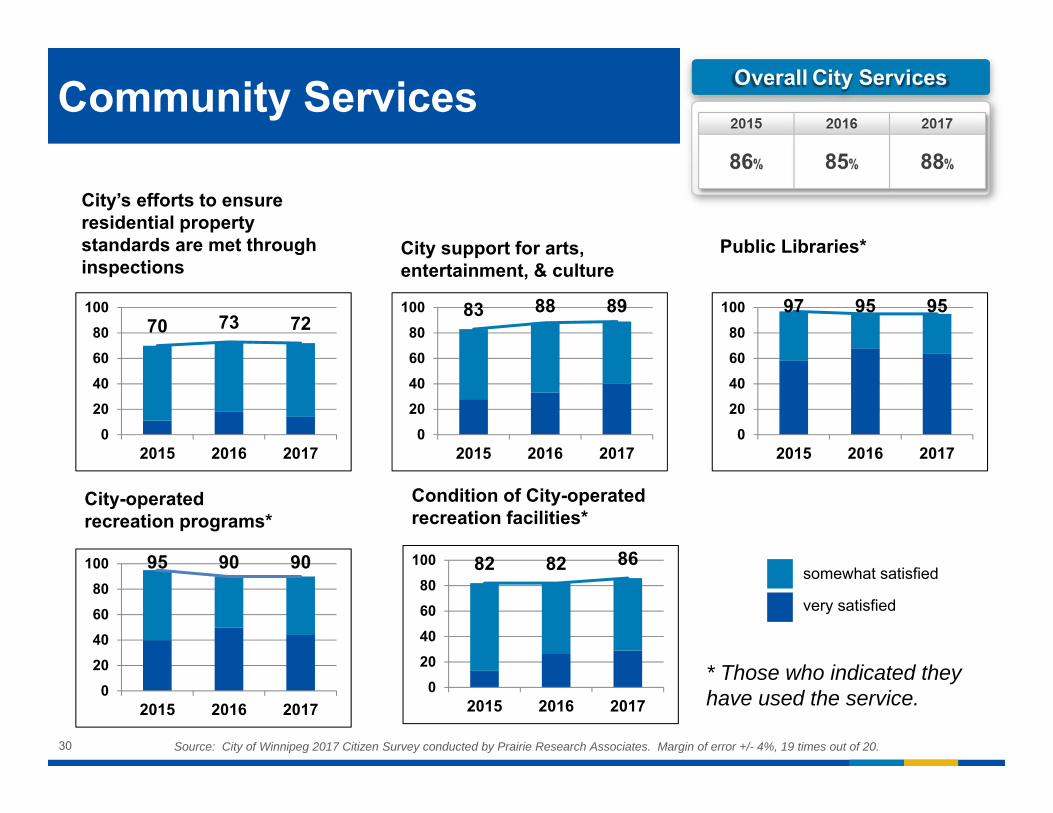
83 88 89
020406080
100
2015 2016 2017
City support for arts, entertainment, & culture
City’s efforts to ensure residential property standards are met through inspections
Public Libraries*
97 95 95
020406080
100
2015 2016 2017
70 73 72
020406080
100
2015 2016 2017
Community Services
82 82 86
020406080
100
2015 2016 2017
Condition of City-operated recreation facilities*
City-operated recreation programs*
95 90 90
020406080
100
2015 2016 2017
* Those who indicated they have used the service.
Source: City of Winnipeg 2017 Citizen Survey conducted by Prairie Research Associates. Margin of error +/- 4%, 19 times out of 20.30
somewhat satisfied
very satisfied

95 98 99
020406080
100
2015 2016 2017
Fire & injury prevention education
Fire & rescue response to fire emergencies
Emergency response capability for medical emergencies*
Level of City preparedness to respond, assist
Safety of existing buildings through fire inspections & enforcement
79 87 88
020406080
100
2015 2016 2017
86 84 87
020406080
100
2015 2016 2017
84 91 89
020406080
100
2015 2016 2017
82 87 88
020406080
100
2015 2016 2017
Fire Paramedic Service
Source: City of Winnipeg 2017 Citizen Survey conducted by Prairie Research Associates. Margin of error +/- 4%, 19 times out of 20.
* Those who indicated they have used the service.
31
somewhat satisfied
very satisfied
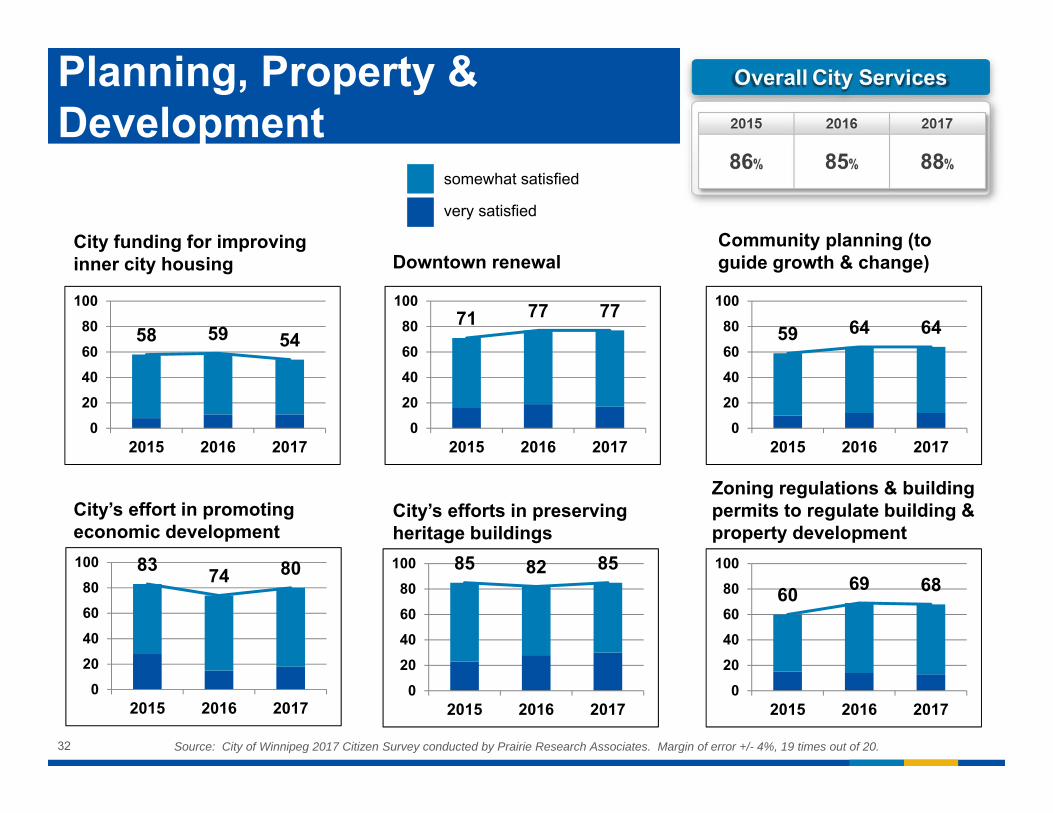
Planning, Property & Development
58 59 54
020406080
100
2015 2016 2017
City’s efforts in preserving heritage buildings
Zoning regulations & building permits to regulate building & property development
City funding for improving inner city housing
Community planning (to guide growth & change)Downtown renewal
City’s effort in promoting economic development
71 77 77
020406080
100
2015 2016 2017
59 64 64
020406080
100
2015 2016 2017
83 74 80
020406080
100
2015 2016 2017
85 82 85
020406080
100
2015 2016 2017
60 69 68
020406080
100
2015 2016 2017
Source: City of Winnipeg 2017 Citizen Survey conducted by Prairie Research Associates. Margin of error +/- 4%, 19 times out of 20.32
somewhat satisfied
very satisfied
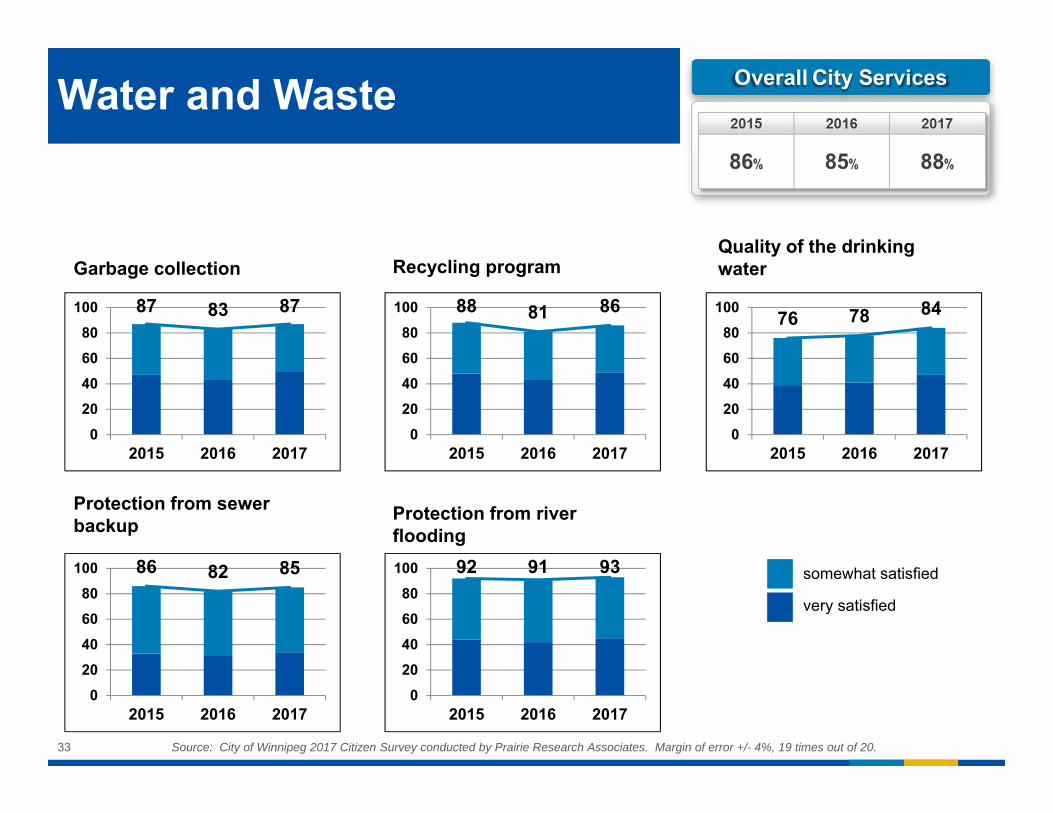
87 83 87
020406080
100
2015 2016 2017
Protection from river flooding
Garbage collectionQuality of the drinking waterRecycling program
Protection from sewer backup
88 81 86
020406080
100
2015 2016 2017
76 78 84
020406080
100
2015 2016 2017
86 82 85
020406080
100
2015 2016 2017
92 91 93
020406080
100
2015 2016 2017
Water and Waste
Source: City of Winnipeg 2017 Citizen Survey conducted by Prairie Research Associates. Margin of error +/- 4%, 19 times out of 20.33
somewhat satisfied
very satisfied
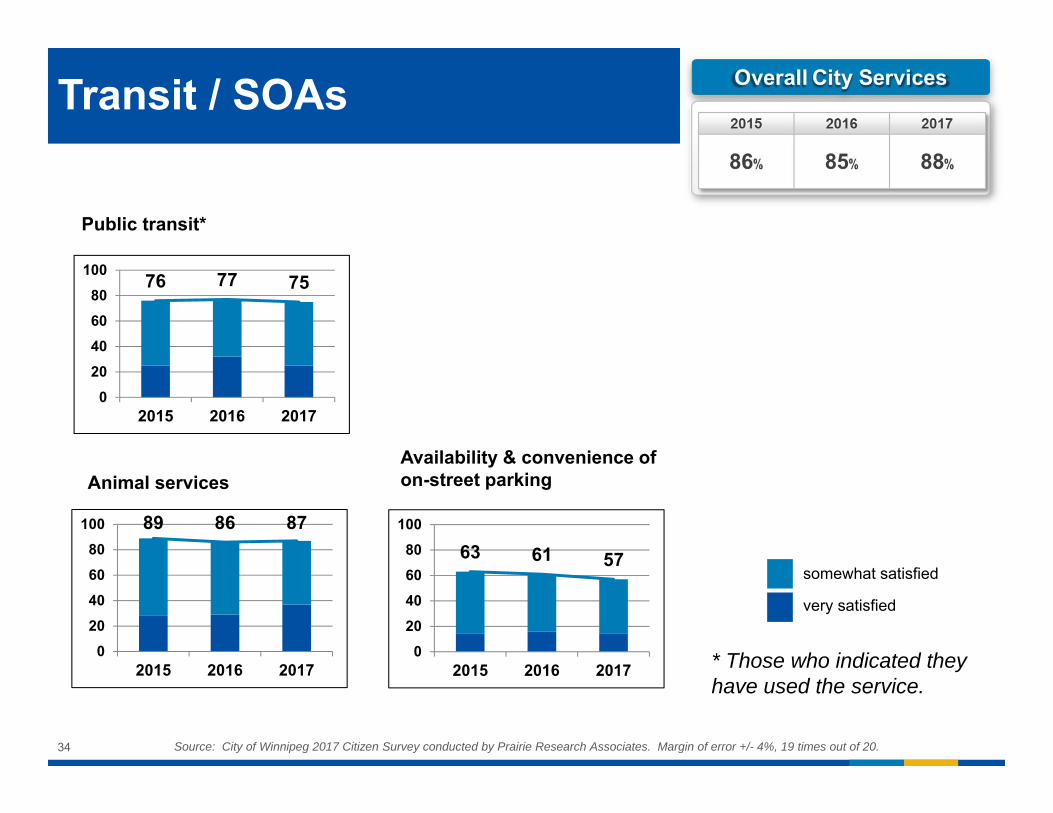
76 77 75
020406080
100
2015 2016 2017
Public transit*
Transit / SOAs
89 86 87
020406080
100
2015 2016 2017
Animal servicesAvailability & convenience of on-street parking
63 61 57
020406080
100
2015 2016 2017
Source: City of Winnipeg 2017 Citizen Survey conducted by Prairie Research Associates. Margin of error +/- 4%, 19 times out of 20.
* Those who indicated they have used the service.
34
somewhat satisfied
very satisfied

ava
USE OF CITY SERVICES
35
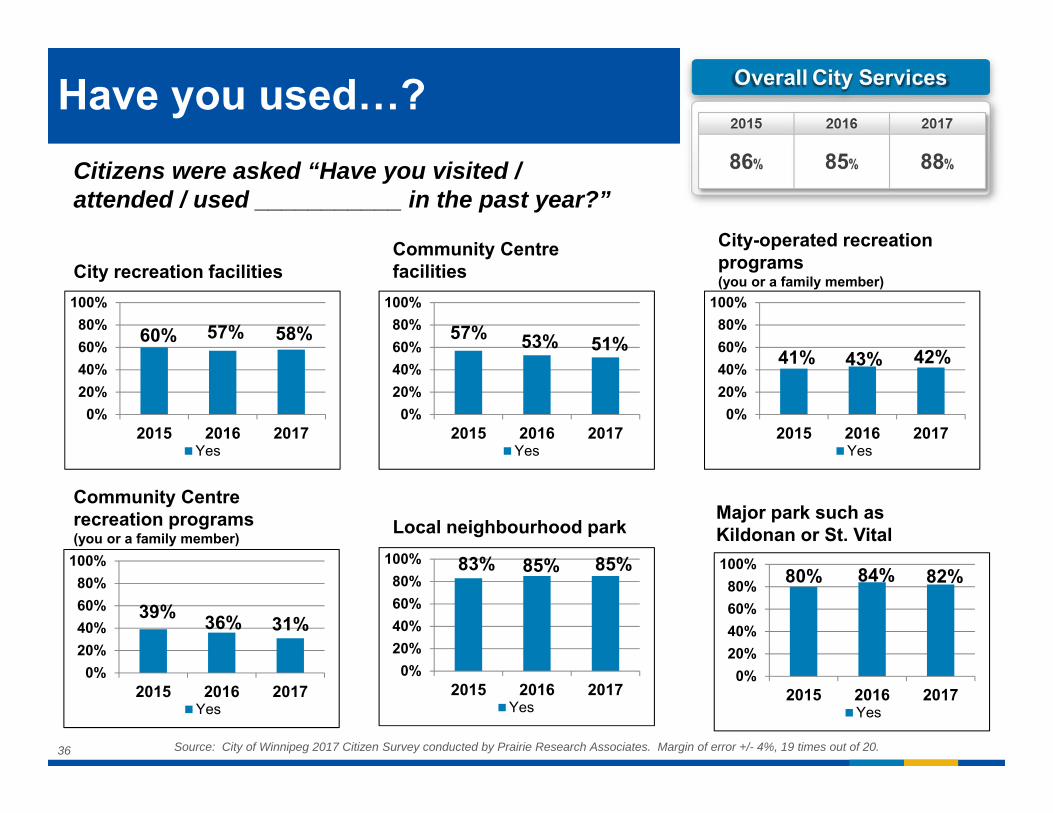
Local neighbourhood parkMajor park such as Kildonan or St. Vital
City recreation facilitiesCity-operated recreation programs (you or a family member)
Community Centre facilities
Community Centre recreation programs(you or a family member)
60% 57% 58%
0%20%40%60%80%
100%
2015 2016 2017Yes
57% 53% 51%
0%20%40%60%80%
100%
2015 2016 2017Yes
41% 43% 42%
0%20%40%60%80%
100%
2015 2016 2017Yes
39% 36% 31%
0%20%40%60%80%
100%
2015 2016 2017Yes
83% 85% 85%
0%20%40%60%80%
100%
2015 2016 2017Yes
80% 84% 82%
0%20%40%60%80%
100%
2015 2016 2017Yes
Have you used…?
Source: City of Winnipeg 2017 Citizen Survey conducted by Prairie Research Associates. Margin of error +/- 4%, 19 times out of 20.36
Citizens were asked “Have you visited / attended / used ___________ in the past year?”
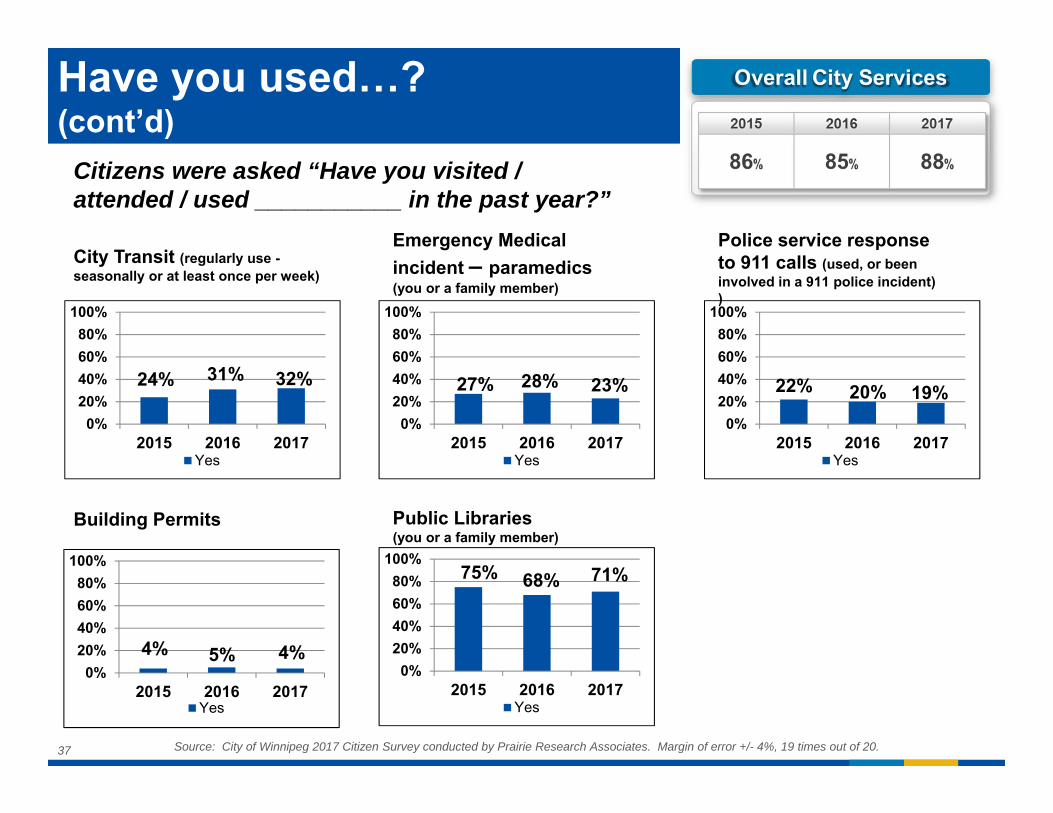
Public Libraries (you or a family member)
City Transit (regularly use -seasonally or at least once per week)
Police service response to 911 calls (used, or been involved in a 911 police incident) )
Emergency Medical incident – paramedics (you or a family member)
Building Permits
Have you used…? (cont’d)
24% 31% 32%
0%20%40%60%80%
100%
2015 2016 2017Yes
27% 28% 23%
0%20%40%60%80%
100%
2015 2016 2017Yes
22% 20% 19%0%
20%40%60%80%
100%
2015 2016 2017Yes
4% 5% 4%0%
20%40%60%80%
100%
2015 2016 2017Yes
75% 68% 71%
0%20%40%60%80%
100%
2015 2016 2017Yes
Source: City of Winnipeg 2017 Citizen Survey conducted by Prairie Research Associates. Margin of error +/- 4%, 19 times out of 20.37
Citizens were asked “Have you visited / attended / used ___________ in the past year?”
ava
38