Embed Size (px)
Citation preview

2017 Demand Response Operations
Markets Activity Report: April 2019
James McAnany
PJM Demand Side Response Operations
April 11, 2019

2017 Load Response Activity Report: April 2019
PJM © 2018 www.pjm.com 2 | P a g e
This page intentionally left blank

2017 Load Response Activity Report: April 2019
PJM © 2018 www.pjm.com 3 | P a g e
Figure 1: DY 17/18 Active Participants in Load Management DR Programs
Economic Load Management Unique
State Zone EDC Locations MW Locations MW Locations MW
DC PEPCO PEPCO 2 18.6 330 95.3 330 95.3
DE DPL DEMEC 1 4.6 28 15.0 29 19.6
DE DPL DOVDE 15 4.9 15 4.9
DE DPL DPL 9 155.9 246 205.2 246 205.2
DE DPL ODEC 13 3.8 13 3.8
IL COMED BATAV 1 1.7 1 1.7
IL COMED COMED 22 59.0 2,277 1,296.0 2,277 1,296.1
IL COMED GENEVA 1 1.0 0 0.0 1 1.0
IL COMED IMEAA1 1 0.3 2 20.7 2 20.7
IN AEP AEPIMP 106 272.6 106 272.6
IN AEP HEREC 1 23.1 1 19.0 1 19.0
IN AEP WVSDI 1 9.6 1 9.6
KY AEP AEPKPT 1 1.1 1 1.1
KY DEOK DEK 59 26.0 59 26.0
KY EKPC EKPC 11 118.0 11 118.0
MD APS AETSAP 53 12.1 168 47.8 169 50.4
MD APS AETSHG 1 1.8 1 0.2 1 0.2
MD APS AETSTH 4 1.3 4 1.3
MD BGE BC 42 590.9 778 758.9 784 765.3
MD DPL DPL 6 74.4 184 116.1 184 116.1
MD DPL EASTON 8 6.0 8 6.0
MD DPL ODEC 1 2.2 17 10.3 17 10.3
MD PEPCO PEPCO 6 334.0 367 428.4 367 428.4
MD PEPCO SMECO 5 1.0 132 48.1 132 48.1
MI AEP COSEDC 1 5.2 1 5.2
NJ AECO AE 8 54.9 232 108.4 232 108.3
NJ AECO VMEU 22 6.4 22 6.4
NJ JCPL JCBGS 8 46.2 446 114.1 451 159.8
NJ PSEG PSEG 13 42.2 1,071 338.2 1,075 361.2
NJ RECO RECO 19 3.0 19 3.0
NY PENELEC PaElec 1 1.2 1 1.2
OH AEP AEPOPT 32 89.4 926 402.9 931 412.7
OH AEP AMPO 52 55.8 52 55.8
OH AEP BUCK 2 19.7 2 19.7
OH ATSI AMPO 12 41.0 12 41.0
OH ATSI BUCK 2 5.6 2 5.6
OH ATSI CPP 14 10.2 14 10.2
OH ATSI OEEDC 14 16.4 995 703.7 995 703.7
OH DAY AMPO 1 7.0 9 15.8 9 15.8
OH DAY BUCK 2 3.9 2 3.9
OH DAY DAYEDC 24 17.3 208 160.5 208 160.5
OH DEOK AMPO 7 11.7 7 11.6
OH DEOK BUCK 2 1.7 2 1.7
OH DEOK DEOEDC 49 109.6 413 187.9 414 222.9
PA APS AETSAP 10 33.9 603 359.9 604 364.4
PA APS CHBDTE 5 2.6 5 2.6
PA ATSI PAPWR 2 14.9 90 94.9 91 95.1
PA DUQ DLCO 10 17.7 337 123.2 338 138.2

2017 Load Response Activity Report: April 2019
PJM © 2018 www.pjm.com 4 | P a g e
Economic Load Management Unique
State Zone EDC Locations MW Locations MW Locations MW
PA METED MetEd 40 39.3 480 205.9 484 212.6
PA PECO PE 59 114.5 1,143 249.1 1,148 306.4
PA PENELEC AECI 17 10.4 17 10.4
PA PENELEC AMPO 1 2.9 1 2.9
PA PENELEC PaElec 7 22.1 535 224.7 537 231.8
PA PENELEC WELLSB 3 0.1 3 0.1
PA PPL AMPO 12 1.6 12 1.6
PA PPL CTZECL 5 1.9 5 1.9
PA PPL PPL 120 157.3 1,256 548.3 1,261 632.0
PA PPL UGI-UI 15 3.4 15 3.4
TN AEP AEPAPT 11 6.5 11 6.5
VA AEP AEPAPT 2 0.4 246 306.5 246 306.5
VA AEP AMPO 17 20.7 17 20.7
VA AEP ODEC 2 0.1 2 0.1
VA AEP RADFRD 1 2.4 1 2.4
VA AEP SALEM 1 0.2 1 0.2
VA AEP VATECH 1 6.9 1 6.9
VA APS ODEC 3 0.9 62 30.7 62 30.7
VA DOM CVEC 6 4.2 6 4.2
VA DOM DOMEDC 49 139.5 923 493.4 925 573.8
VA DOM DOMVME 1 0.3 24 86.4 24 86.4
VA DOM NVEC 3 15.1 42 2.5 44 17.1
VA DOM ODEC 1 0.2 45 14.8 45 14.8
VA DPL ODEC 15 2.2 15 2.2
WV AEP AEPAPT 35 3.5 310 415.9 310 415.9
WV AEP APWVP 4 0.5 4 0.5
WV APS AETSAP 133 47.1 297 197.3 297 197.3
Total 775 2,269 15,695 9,123 15,742 9,520

2017 Load Response Activity Report: April 2019
PJM © 2018 www.pjm.com 5 | P a g e
Figure 2: DY 17/18 MWs in Load Management DR by Resource, Product, and Lead Times
Product
Lead Times (minutes)
Total
Zone Limited Extended Annual 30 60 120 MW
AECO
Pre-Emergency 23.6 83.3 7.6
99.8 5.1 9.6
114.5
Emergency 0.2 0.0 0.0 0.2 0.0 0.0 0.2
Total 23.8 83.3 7.6
100.0 5.1 9.6
114.7
AEP
Pre-Emergency 621.9 654.7 219.7
788.6 56.5 651.2
1,496.3
Emergency 1.4 35.8 12.0 30.9 0.0 18.2 49.1
Total 623.3 690.6 231.7
819.6 56.5 669.4
1,545.5
APS
Pre-Emergency 158.1 310.2 150.9
303.3 17.8 298.1
619.3
Emergency 1.8 18.7 0.0 13.9 0.0 6.7 20.6
Total 160.0 329.0 150.9
317.2 17.8 304.8
639.9
ATSI
Pre-Emergency 301.8 382.3 132.6
350.5 29.9 436.2
816.7
Emergency 1.2 27.1 10.5 27.8 0.3 10.6 38.7
Total 303.0 409.4 143.1
378.3 30.2 446.9
855.4
BGE
Pre-Emergency 62.3 678.9 7.7
684.6 2.7 61.6
748.9
Emergency 0.0 10.0 0.0 10.1 0.0 0.0 10.1
Total 62.4 688.9 7.7
694.7 2.7 61.6
758.9
COMED
Pre-Emergency 231.5 879.4 154.5
935.5 23.7 306.3
1,265.5
Emergency 2.0 39.7 11.3 23.3 5.4 24.2 52.9
Total 233.5 919.1 165.8
958.8 29.1 330.5
1,318.4
DAY
Pre-Emergency 27.0 101.5 42.4
102.7 5.1 63.2
170.9
Emergency 0.0 8.6 0.6 8.6 0.0 0.6 9.2
Total 27.0 110.1 43.0
111.3 5.1 63.7
180.1
DEOK
Pre-Emergency 114.7 32.2 78.1
97.9 79.7 47.4
225.0
Emergency 0.3 2.0 0.0 2.3 0.0 0.0 2.3
Total 115.0 34.2 78.1
100.1 79.7 47.4
227.3
DOM
Pre-Emergency 183.4 297.3 18.7
168.2 35.3 295.9
499.4
Emergency 1.2 72.2 28.5 59.6 7.3 35.1 102.0
Total 184.6 369.6 47.2
227.8 42.6 331.0
601.4
DPL
Pre-Emergency 48.5 292.1 14.9
171.9 15.1 168.5
355.5
Emergency 2.6 5.4 0.0 5.3 2.2 0.4 8.0
Total 51.1 297.5 14.9
177.3 17.3 168.9
363.5
DUQ
Pre-Emergency 20.9 93.1 7.9
76.5 7.8 37.6
121.9
Emergency 0.0 1.3 0.0 1.3 0.0 0.0 1.3
Total 20.9 94.4 7.9
77.8 7.8 37.6
123.2
EKPC
Pre-Emergency 18.5 0.0 97.8
36.4 5.3 74.5
116.2
Emergency 0.0 0.0 1.7 1.7 0.0 0.0 1.7
Total 18.5 0.0 99.5
38.1 5.3 74.5
118.0

2017 Load Response Activity Report: April 2019
PJM © 2018 www.pjm.com 6 | P a g e
Product
Lead Times (minutes)
Total
Zone Limited Extended Annual 30 60 120 MW
JCPL
Pre-Emergency 24.2 67.9 17.1
75.4 1.9 31.9
109.2
Emergency 4.9 0.0 0.0 4.9 0.0 0.0 4.9
Total 29.0 67.9 17.1
80.3 1.9 31.9
114.1
METED
Pre-Emergency 82.7 107.5 14.0
117.2 23.6 63.4
204.2
Emergency 0.6 1.1 0.0 1.7 0.0 0.0 1.7
Total 83.4 108.6 14.0
118.9 23.6 63.4
205.9
PECO
Pre-Emergency 97.7 102.1 18.8
172.8 5.2 40.6
218.6
Emergency 30.5 0.0 0.0 26.9 2.8 0.8 30.5
Total 128.3 102.1 18.8
199.7 8.0 41.4
249.2
PENELEC
Pre-Emergency 65.4 120.0 52.8
114.9 7.7 115.6
238.2
Emergency 0.5 0.7 0.0 0.9 0.0 0.3 1.2
Total 65.9 120.7 52.8
115.8 7.7 115.9
239.3
PEPCO
Pre-Emergency 81.8 477.8 6.0
364.0 1.2 200.4
565.6
Emergency 4.4 1.8 0.0 6.2 0.0 0.0 6.2
Total 86.2 479.5 6.0
370.2 1.2 200.4
571.8
PPL
Pre-Emergency 71.8 146.6 331.7
298.6 61.2 190.4
550.1
Emergency 4.1 0.0 0.8 2.0 0.0 3.0 5.0
Total 75.9 146.6 332.6
300.6 61.2 193.4
555.1
PSEG
Pre-Emergency 138.8 141.4 53.8
274.0 6.8 53.3
334.1
Emergency 4.2 0.0 0.0 1.0 0.0 3.2 4.2
Total 143.0 141.4 53.8
275.0 6.8 56.5
338.2
RECO
Pre-Emergency 1.1 1.3 0.7
3.0 0.0 0.0
3.0
Emergency 0.0 0.0 0.0 0.0 0.0 0.0 0.0
Total 1.1 1.3 0.7
3.0 0.0 0.0
3.0
TOTAL Pre-Emergency 2,375.6 4,969.7 1,427.9 5,235.8 391.6 3,145.8 8,773.2
Emergency 60.0 224.3 65.3
228.6 18.0 103.0
349.6
Total 2,435.6 5,194.0 1,493.3 5,464.5 409.6 3,248.7 9,122.8

2017 Load Response Activity Report: April 2019
PJM © 2018 www.pjm.com 7 | P a g e
Figure 3: DY 17/18 Confirmed Load Management DR Registrations Business Segments
Note: Percent of Nominated Capacity (MWs). Includes Capacity Performance nominated MWs.
Figure 4: DY 17/18 Confirmed Load Management DR Registrations Owner/Company Type
Note: Percent of Nominated Capacity (MWs). Includes Capacity Performance nominated MWs.
2017 Load Response Activity Report: April 2019
PJM © 2018 www.pjm.com 8 | P a g e
Figure 5: DY 17/18 Confirmed Load Management DR Registrations Customer Load Reduction Methods
Note: Percent of Nominated Capacity (MWs). Includes Capacity Performance nominated MWs.
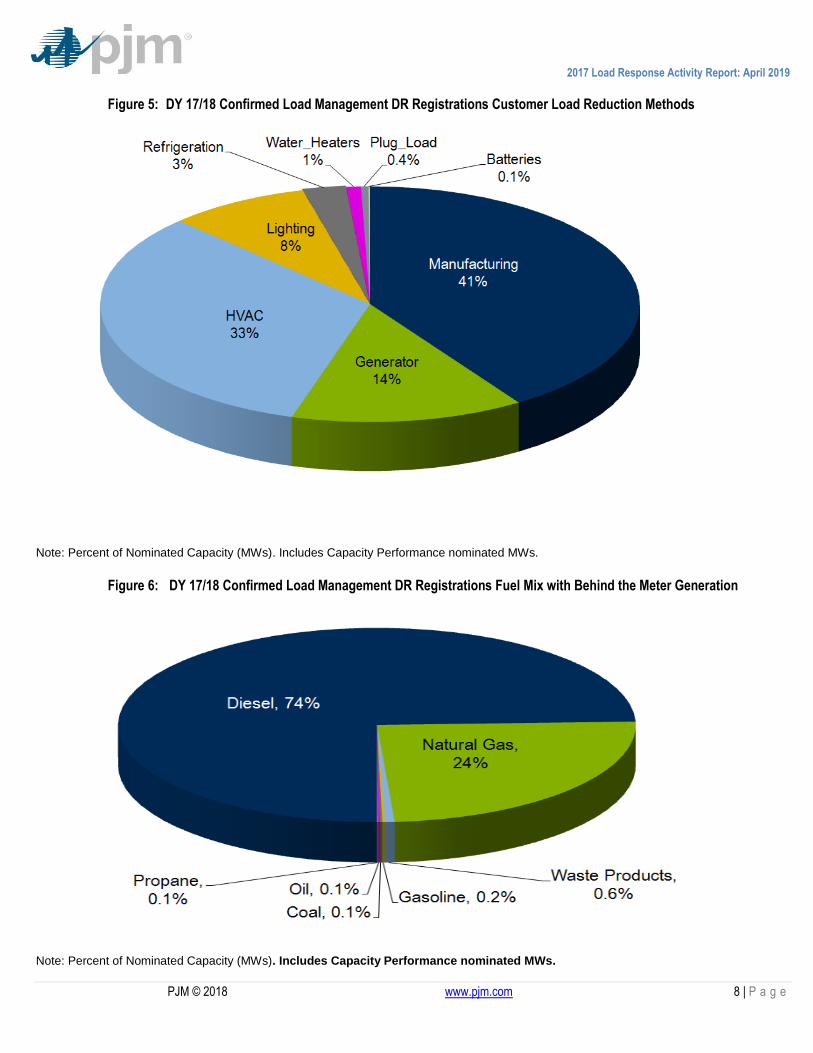
Figure 6: DY 17/18 Confirmed Load Management DR Registrations Fuel Mix with Behind the Meter Generation
Note: Percent of Nominated Capacity (MWs). Includes Capacity Performance nominated MWs.

2017 Load Response Activity Report: April 2019
PJM © 2018 www.pjm.com 9 | P a g e
Figure 7: DY 17/18 Confirmed Load Management DR Registrations Generator and Permit Type
Figure 8: 2017 DY 17/18 Confirmed Load Management DR Registrations Fuel Mix with Behind the Meter Generation

2017 Load Response Activity Report: April 2019
PJM © 2018 www.pjm.com 10 | P a g e
Figure 9: DY 17/18 Confirmed Load Management Full DR Registrations Energy Supply Curve:
This area intentionally left blank

2017 Load Response Activity Report: April 2019
PJM © 2018 www.pjm.com 11 | P a g e
Figure 10: 2017 Economic Demand Response Capability in the Ancillary Service Markets
Capability represents total amount that may be offered. Actual offered and cleared volume may be significantly lower and is represented in subsequent figures/tables in report
Figure 11: 2017 PJM Demand Response Confirmed Regulation Registrations Load Reduction Methods
Note: Percent of CSP Reported Load Reduction MWs

2017 Load Response Activity Report: April 2019
PJM © 2018 www.pjm.com 12 | P a g e
Figure 12: 2017 PJM Demand Response Confirmed Synch Reserve Registrations Load Reduction Methods:
Note: Percent of CSP Reported Load Reduction MWs
Figure 13: PJM Economic Demand Response Capability in Energy Market (3/1/2006-4/5/2018)
Capability represents total amount that may be offered. Actualoffered and cleared volume may be significantly lower and is represented in
subsequent figures/tables in report.

2017 Load Response Activity Report: April 2019
PJM © 2018 www.pjm.com 13 | P a g e
Figure 14: PJM Estimated Revenue for Economic and Load Management DR Markets
*Capacity Net Revenue inclusive of Capacity Credits and Charges. **PJM assumes capacity value at $50 MW Day (PJM does not know the value of capacity credits in the forward market prior to RPM; only a portion of capacity was purchased through the daily capacity market at the time).
This area intentionally left blank

2017 Load Response Activity Report: April 2019
PJM © 2018 www.pjm.com 14 | P a g e
Figure 15: PJM Demand Response Committed MWs by Delivery Year
2017 Load Response Activity Report: April 2019
PJM © 2018 www.pjm.com 15 | P a g e
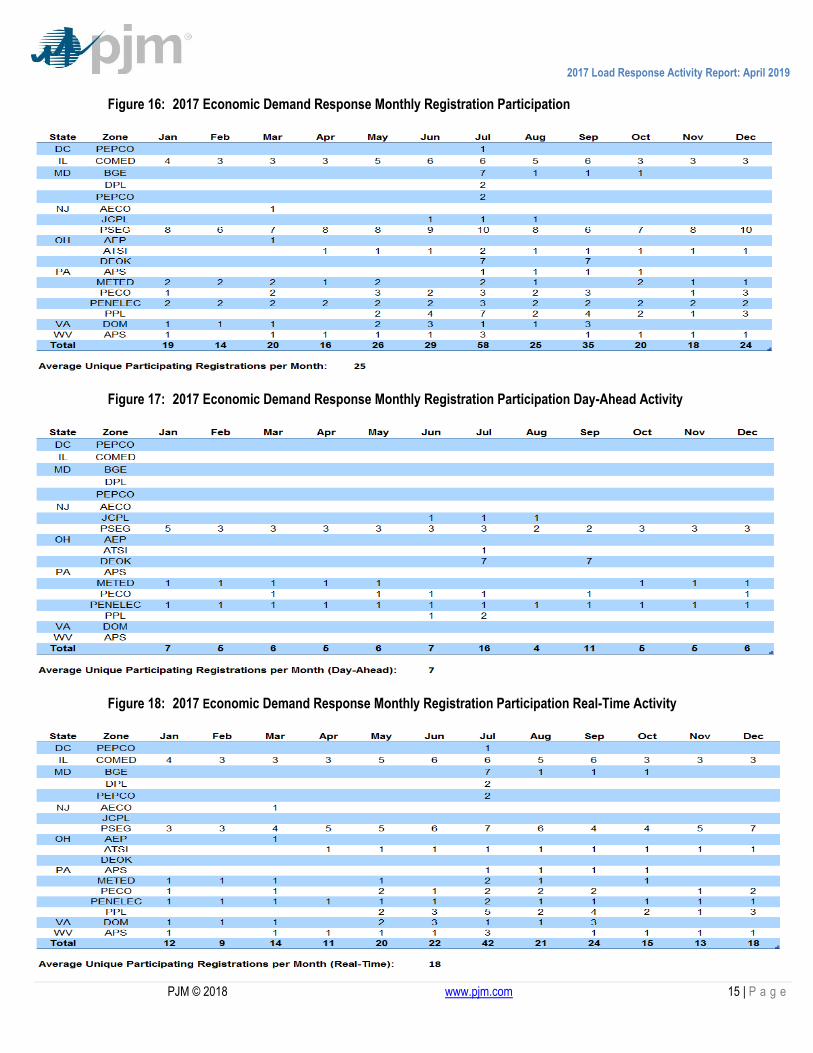
Figure 16: 2017 Economic Demand Response Monthly Registration Participation
Figure 17: 2017 Economic Demand Response Monthly Registration Participation Day-Ahead Activity
Figure 18: 2017 Economic Demand Response Monthly Registration Participation Real-Time Activity

2017 Load Response Activity Report: April 2019
PJM © 2018 www.pjm.com 16 | P a g e
Figure 19: 2017 Economic Demand Response Monthly MWh Reductions
Figure 20: 2017 Economic Demand Response Monthly MWh Reductions Day-Ahead Activity
Figure 21: 2017 Economic Demand Response Monthly MWh Reductions Real-Time Activity

2017 Load Response Activity Report: April 2019
PJM © 2018 www.pjm.com 17 | P a g e
Figure 22: 2017 Economic Demand Response Monthly Energy Market Revenue
Figure 23: 2017 Economic Demand Response Monthly Energy Market Revenue Day-Ahead Activity
Figure 24: 2017 Economic Demand Response Monthly Energy Market Revenue Real-Time Activity

2017 Load Response Activity Report: April 2019
PJM © 2018 www.pjm.com 18 | P a g e
Figure 25: 2017 Economic Demand Response Energy Market Cost Allocation by Zone
Figure 26: 2017 Economic Demand Response Day-Ahead Energy Market Cost Allocation by Zone

2017 Load Response Activity Report: April 2019
PJM © 2018 www.pjm.com 19 | P a g e
Figure 27: 2017 Economic Demand Response Real-Time Energy Market Cost Allocation by Zone
Figure 28: 2017 Load Managment Demand Response Monthly Capacity Revenue from RPM

2017 Load Response Activity Report: April 2019
PJM © 2018 www.pjm.com 20 | P a g e
Figure 29: 2017 Economic Demand Response Dispatched vs Settled Real-Time Energy Market Summary
Figure 30: 2017 Economic Demand Response Cleared vs Settled Day-Ahead Energy Market Summary

2017 Load Response Activity Report: April 2019
PJM © 2018 www.pjm.com 21 | P a g e
Figure 31: 2017 Economic Demand Response Regulation Market Participation
Figure 32: 2017 Economic Demand Response Synchronous Reserve Market Participation
Note: For Figures 31 and 32 above, MWh=sum of the settled MW. Example: 1 MW load available for 12 hours = 12 MWh.

2017 Load Response Activity Report: April 2019
PJM © 2018 www.pjm.com 22 | P a g e
Figure 33: Economic DR Synchronous Reserve Penetration Distribution (Box-plot) for 2017
Notes: 1) Economic Demand Response are Tier2 resources. 2) Percents shown on upper whisker are maximum hourly DR percentage of Total SR Requirement. 3) The Box-plot depicts the distribution of DR hourly assigned (as a percentage of the Total requirement) for a month:
The upper whisker is the maximum value
The box top is the Upper Quartile (75%) value
The line inside the box is the median (50%) value
The box bottom is the Lower Quartile (25%) value
The lower whisker is the minimum value