Embed Size (px)
Citation preview

Data DigestEuropean Fund Market2017 Edition
2017 Edition 02172017
Page 124
Broadridge a global fintech leader with over $7 billion in market capitalization providescommunications technology data and analytics solutions We help drive businesstransformation for our clients with solutions for enriching client engagement navigating riskoptimizing efficiency and generating revenue growth
For more information about Broadridge please visit broadridgecom
Jeacuterocircme CouteurProduct Manager FundFilejeromecouteurbroadridgecom
Barbara FerraresiProduct Manager SalesWatchbarbaraferraresibroadridgecom
Diana MackayEditorialdmmackaywilliamscom
Broadridge Database Featured Global Market Intelligence (GMI)httpgobroadridge1comGMI No part of this document may be distributed reproduced or posted without the express
written permission of Broadridge Financial Solutions Inc copy2017 Broadridge Financial Solutions Inc Broadridge and the Broadridge logo areregistered trademarks of Broadridge Financial Solutions Inc
2017 EDITION
broadridgecom
EUROPEAN FUND MARKET REVIEW
About BroadridgeAuthor Information
Page 224
EUROPEAN FUND MARKET REVIEW 2017 EDITION
2016 ndash a year to remember with fond memories for some but certainly not allAfter four years of bullish net sales flows with long-term funds pulling in well overeuro200bn a year 2016 ended with a sharp reminder of the fragile nature of retail-investor sentiment In a year of historic twists and turns mainstream investorsretreated to the sidelines preferring to keep their savings in deposits and lose onnegative interest rates rather than risk losses on the vagaries of the markets Netinflows slumped to just euro97bn and symptomatic of the high levels of risk-aversion building money market funds gathered an identical volume The latterare supported mainly by institutions but their success reflected the more widelyheld view that safe was best This was the liquidity sectorrsquos strongest year sincethe 2007 financial crisis
Retail investors in the main found the roller coaster ride a little bit too exciting toendure but the European retail market comprises two distinct communitiesmainstream consumers and sophisticated investors including institutions placingmoney directly into funds Whilst consumers watched from the sidelinessophisticated investors manoeuvred client portfolios through a series of rapid-fireallocation decisions to get the best performance from the fast-changing marketsThis made sales flows volatile with large sums moving between different fundsand sectors as news headlines forced continual portfolio reviews In effect afund-sales iceberg with paltry net inflows hiding a landmass of money in motion
broadridgecom
FIGURE 1 - CUMULATIVE NET SALES BY YEAR (eurobn)
Jan Feb Mar Apr May Jun Jul Aug Sep Oct Nov Dec
2013 2014 2015 2016
0
155
310
465
TOTAL OF FUND CLOSURES
NET SALES (H1 2016)
1848TOTAL OF MASTER GROUPS
2694TOTAL OF COMPANIES
33833TOTAL OF FUNDS
TOTAL OF FUND LAUNCHES 2286
2918
TOTAL NET ASSETS (DEC 2016)
NET SALES (2016)
NET SALES (H2 2016)
ASSET GROWTH (2015-2016)
euro8738bn
euro3885bn
euro245bn
euro1685bn
euro193bn
KEY DATA
The year began with a dark cloud over China The Shanghai bourse wentthrough the floor whilst investors were still licking the wounds inflicted by the USFedrsquos interest-rate rise at the back end of 2015 Worries about the state of theglobal economy meant that the year began with two months of cripplingredemptions (euro41bn) forcing the ECB to announce an extension of its bond-buying programme and putting further rate rises from the Fed on hold Everycloud has a silver lining and the central-bank response in this instance sentinvestors racing to buy bonds before the ECB programme was stepped upBetween March and May euro63bn was pumped into investment funds threequarters of which went into fixed income products
References are to long-term funds including ETFs but excludingmoney market funds and funds of funds unless otherwise stated
Then came the Brexit referendum and macro-economic concerns were displacedby anguish over political risk In one month euro18bn was culled from funds withequities suffering the deepest cut But a month later the money was back In asomewhat surprising rush of enthusiasm the shock Brexit vote was followed byfour months of exhilarating sales volumes averaging euro25bn a month In truth thiswas the lull before the next storm - the US presidential election with a criticalItalian referendum following shortly after The election result across the pond wasanother slap in the face for funds It yielded another month of sharp redemptionsand from here the asset-management year limped to a disappointing close
Overview
2016 in brief
Buyer beware
In one month euro18bn was culled from funds
Page 324
2017 EDITION
Velocity favoured the passives although it was underpinned by more secularregulatory pressures encouraging fund selectors to increase their weighting ofpassives in order to reduce portfolio costs Mifid II is a year away but rules relatingto commissions are already causing selectors to consider how best to adapt theirbusiness models to protect their margins Passive fundsrsquo flows failed to overtakethe record they set in 2015 but they dominated the sales intake with 74 of overallinflows split relatively evenly between ETFs and trackers Their dominance in theequity category was even more extreme despite a successful flurry of activeemerging market equity inflows during the third quarter But throughout the yearactive equity funds were bathed in a sea of red (-euro85bn) whilst their passivecounterparts generated inflows of euro25bn
Which groups navigated these challenging market cycles to generate the largestsales flows No surprise that the global powerhouse BlackRock kept the leadingposition that it has held onto for the last four years Net sales of euro16bn for the yearwere a healthy euro2bn ahead of its closest rival Nordea But strip out the passivesfrom BlackRockrsquos results and Nordea skipped into the lead benefiting from thesurge of support given to its blockbuster Stable Return fund This product alonegenerated over euro10bn of inflows to become Europersquos most popular fund of theyear
FIGURE 3 - MARKET SENTIMENT
of funds with negative flows of funds with positive flows
5252
4848
FIGURE 2 - PASSIVE VS ACTIVE NET SALES IN 2016 (eurobn)
Active ETF Index Tracking
12141214
379379
335335
broadridgecom
euro193bnNet Sales 2016
+465Asset Growth 2016
Once again Italian investors proved themselves to be the most resilient to marketshock waves and also the most enthusiastic about cross-border funds LocalItalian groups recorded larger inflows than those in any other market (euro19bn) andaccording to Broadridge SalesWatch data which records the source of sales for allthe significant cross-border groups foreign funds collected a roughly similaramount Bank debt and the constitutional referendum caused some tricky periodsof sales drought but they were temporary and ultimately inconsequential Thesame could not be said of the UK market where investors were riven with pre- andpost-Brexit doubts The UK never a strong market for cross-border groups endedthe year with its worst domestic redemptions on record (-euro34bn) doubling up asthe highest outflows of any European market 2016 was the UKrsquos annus horribilisand it was equities (-euro22bn) particularly the staple UK Equity Income productsthat suffered the deepest cut Other markets to do well were Germany and Spainalthough Spain offered a considerably diminished opportunity to foreign groupsfollowing a strategic shift away from funds-of-funds support by the indigenous bankdistributors
Mixed asset funds remained a beacon of light for active managers their flexiblestrategies difficult for passives to replicate This segment suffered considerabledecay in its sales pace but it still filed euro69bn of net receipts all of which was inactively managed funds Last yearrsquos most successful category though was bondeven though its bubble burst after the US election Net inflows were euro78bn splitroughly 5050 between passive and active funds
Overview
Relentless rise of passives
Market success
Group success
active equity funds were bathed in a sea of red
EUROPEAN FUND MARKET REVIEW
Page 424
2017 EDITION
FIGURE 4 - EUROPEAN NET SALES IN 2016 (eurobn)
Jan 2016 Feb 2016 Mar 2016 Apr 2016 May 2016 Jun 2016 Jul 2016 Aug 2016 Sep 2016 Oct 2016 Nov 2016 Dec 2016
Bond Equity Mixed Assets Money Market
-25
0
25
50
75
FIGURE 5 - GLOBAL NET SALES IN 2016 (eurobn)
Asia-Pacific Europe International Latin America MEA North America
Bond Equity Mixed Assets Money Market
-90
0
90
180
270
broadridgecom
Overview
EUROPEAN FUND MARKET REVIEW
Page 524
2017 EDITION
broadridgecom
FIGURE 6 - HISTORICAL GLOBAL ASSETS (euroT)
2007 2008 2009 2010 2011 2012 2013 2014 2015 2016
Asia-Pacific Europe International Latin America MEA North America
168168
132132159159
186186 185185207207
226226
270270
302302328328
FIGURE 7 - GLOBAL ASSETS BY INVESTMENT TYPE
Bond Equity Mixed Assets Money Market
Asia-Pacific Europe International Latin America MEA North Amercia
Overview
EUROPEAN FUND MARKET REVIEW
Page 624
FIGURE 10 - BEST-SELLING EQUITY FUNDS IN 2016 (eurom)
Fund Name Fund Strategy Fund Sector Net Sales
iShares Core SampP 500 UCITS ETF (USD) Passive Equities North America
Fundsmith Equity Active Equities Global
State Street ACS North America Index Equity Passive Equities North America
DWS Top Dividende Active Equities Global Income
Vanguard Funds Plc - Vanguard SampP 500 UCITS ETF Passive Equities North America
iShares Core MSCI World UCITS ETF Passive Equities Global
4111
3537
3167
2739
2474
2298
2017 EDITION
FIGURE 8 - BEST-SELLING BONDS FUNDS IN 2016 (eurom)
Fund Name Fund Strategy Fund Sector Net Sales
PIMCO GIS Income Fund Active Bonds Global Currencies
Carmignac Seacutecuriteacute Active Bonds EUR Short-Term
Eurizon EasyFund - Treasury EUR T1 Active Bonds Global Currencies
AEAM Dutch Mortgage Fund Active Asset-backed Securities
AB FCP I American Income Portfolio Active Bonds USD
CaixaBank Rentas Euribor FI Active Bonds Target Maturity
6825
5048
4221
3277
2801
2771
broadridgecom
FIGURE 9 - BEST-SELLING MIXED FUNDS IN 2016 (eurom)
Fund Name Fund Strategy Fund Sector Net Sales
Nordea 1 - Stable Return Fund Active Asset Allocation
JPMorgan Investment Funds - Global Macro Opportunities Fund Active Asset Allocation Alternative
Invesco Perpetual Global Targeted Returns Active Asset Allocation Alternative
Invesco Global Targeted Returns Fund Active Asset Allocation Alternative
PrivatFonds Kontrolliert Active Mixed Assets Conservative
Aviva Investors Multi-Strategy Target Return Active Asset Allocation Alternative
10494
5073
4225
3256
2941
2430
Best Sellers
EUROPEAN FUND MARKET REVIEW
Page 724
FIGURE 11 - EUROPEAN MARKET RANKING BY NET SALES IN 2016 (eurom)
Fund Investment Type Group
Fund Market
Bnd Eq MM MM-Enh Mix Oth
Net Sales Net Sales Net Sales Net Sales Net Sales Net Sales
Sum
Net Sales
International
United Kingdom
France
Italy
Spain
Germany
Switzerland
Norway
Finland
Netherlands
Sweden
Turkey
Croatia
Czech Republic
Iceland
Russia
Romania
Bulgaria
Liechtenstein
Slovenia
Lithuania
Malta
Austria
Ukraine
Luxembourg
Latvia
Estonia
Slovakia
Portugal
Hungary
Denmark
Greece
Poland
Belgium
479923
60684
-11564
106168
100666
20062
29453
3041
5618
8494
-12386
4953
2814
1580
-2624
2740
1248
268
145
435
-474085
-216836
-5276
3905
1533
26354
4314
10603
-4023
20114
36936
-210
28
85
-554
-353
-13
184
242
-631
634399
269527
214183
-21924
24792
-9190
-19623
10200
5390
-677
-7061
422
2417
-655
5654
9
-116
184
432
-6487
7977
22124
-4378
-953
27756
6462
5644
349
-29
-6
-6
0
388940
145199
-2987
84278
3349
45687
3715
136
1166
-2651
14796
-314
8
2917
59
-885
639
158
-67
37
10830
-31244
-23726
514
34352
52305
15423
428
4438
-12728
-19522
489
-0
102
34
-211
0
-2
5
76
1487
-16691
-50
-58
-437
-139
1332
114
-107
-1007
-11371
7030
167
-431
2954
-0
-20
-16
321
-117
-1812
-34
-10958
-712
-5861
16405
-444
952
-0
-2330
-2713
-7595
-1123
-5615
3576
-133802
-124
-225
2
-14
443
-86
3
1509
-3
-813
5795
-0
11
-651
-486
-1126
4436
-711
-6119
3451
-44
515
7392
792
-653
3709
10
-489
414
-6788
1033521
235307
192754
168563
163739
162975
39744
24409
18233
12901
12764
5339
5267
4001
2535
1544
1541
788
317
278
196
191
177
-0
-59
-74
-116
-2444
-4332
-4947
-7298
-8621
-19359
-112194
Sum 781897 -597797 959271 59963 687963 36343 1927641
2017 EDITION
broadridgecom
European Sales
EUROPEAN FUND MARKET REVIEW
Page 824
2017 EDITION
FIGURE 13 - TOP AND BOTTOM FIVE SECTORS BY SALES IN 2016 (eurom)
MM
GBP
MM
Eur
o
Asse
t Allo
c Alt
MM
USD
Eq E
m M
kt
Bnd
USD
Corp
HY
Bnd
Flex
Eq Ja
pan
Bnd
Eur
Eq E
urop
e
0
25
50
broadridgecom
FIGURE 12 - TOP SECTORS BY SALES IN 2016 (eurom)
Year
Fund Sector
2015 2016
Net Sales Net Sales Rank Net Sales Net Sales Rank
Money Market GBP
Money Market EUR
Asset Allocation Alternative
Money Market USD
Equities Emerging Markets
Bonds Global Currencies
Bonds Global Corporates
Bonds Emerging Markets
Asset Allocation
Bonds EUR Short-Term
Mixed Assets Conservative
Bonds Inflation Linked
Equities Global
Bonds EUR Corp Inv Grade
Bonds USD
Commodities
Fund of Funds Balanced
Bonds Target Maturity
Fund of Funds Bonds
Bonds Global High Yield
Fund of Funds Asset Allocation
Equities Alternative
21223
35123
53618
32807
-7062
16372
5765
-6289
53125
3817
28844
2545
-6589
7589
1203
2261
24274
-10629
8219
-1241
13
4
1
6
219
15
29
217
2
34
8
40
218
22
58
43
11
223
20
203
43475
37420
34514
17428
15047
15019
14195
12193
12135
11513
11323
10233
10150
8583
8430
7958
7957
7926
7850
7593
1
2
3
4
5
6
7
8
9
10
11
12
13
14
15
16
17
18
19
20
25359
30561
9
7
6916
6717
21
22
All Sector Ranking
EUROPEAN FUND MARKET REVIEW
Page 924
Values
TOP 25
REST
TOTAL
171626
-80785
90841
Values
TOP 25
REST
TOTAL
148629
-96455
52174
2017 EDITION
FIG 15 - TOP MASTER GROUPS BY SALES IN 2016 (eurom) - INC ETFs
Master Groups NAT Funds Net Sales
BlackRock US
Nordea SE
Intesa SP IT
Vanguard US
KBC BE
Aviva GB
VRUnion DE
State Street US
Pictet CH
ORIX Robeco JP
MMCMercer US
La Caixa ES
Northern Trust US
Cr Suisse CH
Flossbach von Storch DE
New York Life Candriam US
Carmignac FR
Bridgewater US
PIMCO US
Fundsmith GB
UBI Banca IT
Amundi FR
Legal amp General GB
Jupiter Investment GB
Royal London GB
522
252
598
64
1000
163
434
184
135
102
51
102
27
357
15
161
20
3
67
2
16190
14405
13638
12506
12296
10521
9056
8698
6764
6573
5512
5505
5211
4968
4515
4412
4367
4023
3956
3854
69
615
84
51
46
3329
3018
2888
2762
2660
FIG 14 - TOP MASTER GROUPS BY SALES IN 2016 (eurom) - EX ETFs
Master Groups NAT Funds Net Sales
Nordea SE
Intesa SP IT
KBC BE
Aviva GB
VRUnion DE
Vanguard US
Pictet CH
ORIX Robeco JP
MMCMercer US
La Caixa ES
Northern Trust US
Cr Suisse CH
Flossbach von Storch DE
New York Life Candriam US
Carmignac FR
PIMCO US
Bridgewater US
State Street US
Fundsmith GB
UBI Banca IT
Legal amp General GB
Jupiter Investment GB
Royal London GB
Aegon NL
Algebris GB
252
598
1000
163
433
46
135
102
51
102
27
356
15
161
20
65
3
84
2
69
14405
13638
12296
10521
9059
8694
6764
6573
5512
5505
5211
4773
4515
4412
4367
4061
4023
3913
3854
3329
84
51
46
78
5
2888
2762
2660
2527
2367
broadridgecom
Note Excludes money market funds and ETFs Note Excludes money market funds
Pan-European Master Groups Sales
EUROPEAN FUND MARKET REVIEW
Page 1024
Values
TOP 25
REST
TOTAL
171626
-80785
90841
2017 EDITION
broadridgecom
Figure 16 - TOP 25 FUNDS BY NET SALES IN 2016 (eurom)
Master Groups Fund Name Domicile Strategy Type Launch Date Net Sales
Nordea Nordea 1 - Stable Return Fund LU Active Mix 200511
PIMCO PIMCO GIS Income Fund IE Active Bnd 201211
JP Morgan JPMorgan Investment Funds - Global Macro Opportunities Fund LU Active Mix 199902
Carmignac Carmignac Seacutecuriteacute FR Active Bnd 199504
Invesco Invesco Perpetual Global Targeted Returns GB Active Mix 201309
Intesa SP Eurizon EasyFund - Treasury EUR T1 LU Active Bnd 201503
BlackRock iShares Core SampP 500 UCITS ETF (USD) IE Passive Eq 201005
Bridgewater Bridgewater Pure Alpha Strategy 18 Volatility VG Active Hdge 199112
Fundsmith Fundsmith Equity GB Active Eq 201011
Aegon AEAM Dutch Mortgage Fund NL Active Bnd 201308
Invesco Invesco Global Targeted Returns Fund LU Active Mix 201312
State Street State Street ACS North America Index Equity GB Passive Eq 201603
VRUnion PrivatFonds Kontrolliert DE Active Mix 201007
AXA AB FCP I American Income Portfolio LU Active Bnd 199307
La Caixa CaixaBank Rentas Euribor FI ES Active Bnd 201606
Deutsche AM DWS Top Dividende DE Active Eq 200304
Cr Suisse CS Nova (Lux) Fixed Maturity Bond Fund 2019 LU Active Bnd 201604
Vanguard Vanguard Funds Plc - Vanguard SampP 500 UCITS ETF IE Passive Eq 201205
Aviva Aviva Investors Multi-Strategy Target Return GB Active Mix 201407
Flossbach von Storch Flossbach von Storch SICAV - Multiple Opportunities LU Active Mix 200710
ORIX Robeco Robeco High Yield Bonds LU Active Bnd 199804
BBVA Group BBVA Bonos Internacional Flexible 0-3 FI ES Active Bnd 201505
La Caixa CaixaBank Rentas Euribor 2 FI ES Active Bnd 201609
BlackRock iShares Core MSCI World UCITS ETF IE Passive Eq 200909
PIMCO PIMCO GIS Global Investment Grade Credit IE Active Bnd 200307
10494
6825
5073
5048
4225
4221
4111
3678
3537
3277
3256
3167
2941
2801
2771
2739
2689
2474
2430
2375
2345
2333
2325
2298
2284
Note Excludes money markets funds
Pan-European Fund Leaders Sales
EUROPEAN FUND MARKET REVIEW
Page 1124
2017 EDITION
FIGURE 18 - TOP 10 MASTER GROUPS BY SALES IN 2016 (eurom)
Master Groups NAT Funds Assets Net Sales
BlackRock US
State Street US
Amundi FR
Vanguard US
UBS CH
Deutsche Boumlrse DE
BNP Paribas FR
Deka DE
Swisscanto CH
Soc GenLyxor FR
292
100
105
18
123
1
35
46
4
254
252952
21134
24805
23790
29060
4157
5551
8321
6578
50859
23549
4785
3825
3811
2503
2150
1130
885
617
550
Sum 978 427205 43805
FIGURE 17- TOP 10 FUNDS BY SALES IN 2016 (eurom)
Master Groups Fund Name Net Sales
BlackRock iShares Core SampP 500 UCITS ETF (USD)
Vanguard Vanguard Funds Plc - Vanguard SampP 500 UCITS ETF
BlackRock iShares Core Euro Corporate Bond UCITS ETF
iShares Core MSCI World UCITS ETF
iShares EURO STOXX 50 UCITS ETF (DE)
Soc GenLyxor Lyxor UCITS ETF EURO STOXX 50
BlackRock iShares Euro High Yield Corporate Bond UCITS ETF
iShares MSCI Europe UCITS ETF (Inc)
Deutsche AM db x-trackers EURO STOXX 50reg UCITS ETF (DR)
BlackRock iShares STOXX Europe 600 (DE)
12016
11539
6864
6540
5099
5010
4792
4397
4216
4138
Sum 64610
broadridgecom
Product ThemesExchange Traded Funds
EUROPEAN FUND MARKET REVIEW
Page 1224
2017 EDITION
FIGURE 20 - TOP 10 MASTER GROUPS BY SALES IN 2016 (eurom)
Master Groups NAT Funds Assets Net Sales
Vanguard US
Northern Trust US
UBS CH
State Street US
Swisscanto CH
Legal amp General GB
Laumlnsfoumlrsaumlkrings SE
KBC BE
Den Norske NO
MMCMercer US
34
26
65
55
69
42
5
30
3
3
79794
13382
64896
33689
27722
26645
3767
4440
2023
5483
8966
5174
4820
4687
2510
1755
1591
1179
994
954
Sum 332 261841 32630
FIGURE 19 - TOP 10 FUNDS BY SALES IN 2016 (eurom)
Master Groups Fund Name Net Sales
State Street State Street ACS North America Index Equity
Vanguard Vanguard Investment Series Plc - Vanguard Global Bond Index Fund
Vanguard Investment Series Plc - Vanguard US Treasury Inflation-Protected Securities Index Fund
LloydsSWIP Scottish Widows Corporate Bond Tracker Fund
Northern Trust Northern Trust World Custom ESG Equity Index
HSBC HSBC Japan Index
Northern Trust Northern Trust Developed Real Estate Index UCITS FGR Fund
Northern Trust UCITS Common Contractual Fund - World Equity Index Fund
Vanguard Vanguard Investment Series Plc - Vanguard Emerging Markets Stock Index Fund
Den Norske DNB Global Indeks
316733
164155
144479
107232
102532
87021
86021
78849
78797
76756
Sum 1242575
broadridgecom
Product ThemesIndex Tracking Funds
EUROPEAN FUND MARKET REVIEW
Page 1324
2017 EDITION
FIG 22 - MARKET SHARE OF PASSIVE FUNDS BY ASSETS IN 2016
Index Tracking ETF Active
88
77
8585
FIG 21 - MARKET SHARE OF PASSIVE FUNDS BY ASSETS IN 2002
Index Tracking ETF Active
3311
9696
FIGURE 23 - HISTORICAL NET SALES (eurobn)
2013 2014 2015 2016
Active ETF Index Tracking
26062606
164164 194194
30403040
405405 438438
20172017
652652
363363187187
387387 335335
Note Excludes money market funds
broadridgecom
Product ThemesActive vs Passive
EUROPEAN FUND MARKET REVIEW
Page 1424
2017 EDITION
FIGURE 25 - TOP 10 MASTER GROUPS BY SALES IN 2016 (eurom)
Master Groups NAT Funds Assets Net Sales
Amundi FR
BlackRock US
Nordea SE
ORIX Robeco JP
Aviva GB
Vanguard US
UBS CH
Fidelity US
Goldman Sachs US
PrudentialMampG GB
9
20
9
11
4
3
18
11
7
4
4791
20800
5829
8750
2427
7762
8808
8444
2382
4021
2473
1923
1632
1340
1182
1117
1024
1013
909
816
Sum 96 74014 13429
broadridgecom
FIGURE 24 - TOP 10 FUNDS BY SALES IN 2016 (eurom)
Master Groups Fund Name Net Sales
BlackRock iShares Core MSCI Emerging Markets IMI UCITS ETF
Amundi Amundi ETF MSCI Emerging Markets UCITS ETF
ORIX Robeco Robeco Emerging Conservative Equities
PrudentialMampG Eastspring Investments Global Emerging Markets Dynamic
Aviva Aviva Investors - Emerging Markets Equity Income Fund
Goldman Sachs GS Emerging Markets Broad Equity Portfolio
Nordea Nordea 1 - Stable Emerging Markets Equity Fund
Vanguard Vanguard Investment Series Plc - Vanguard Emerging Markets Stock Index Fund
Amundi Amundi Funds Equity Emerging World
BTPS BT Hermes Global Emerging Markets
199164
150161
107040
106244
95149
94597
91057
78797
74192
56460
Sum 1052862
Product ThemesEquities Emerging Markets
EUROPEAN FUND MARKET REVIEW
Page 1524
2017 EDITION
broadridgecom
FIGURE 27 - TOP 10 MASTER GROUPS BY SALES IN 2016 (eurom)
Master Groups NAT Funds Assets Net Sales
ORIX Robeco JP
Aviva GB
New York Life Candriam US
Cr Suisse CH
AXA FR
Baring US
PrudentialMampG GB
BNY Mellon US
PIMCO US
Generali IT
2
3
2
3
6
4
3
4
1
4
7741
5701
2634
5010
21215
2269
2780
1135
4641
592
2347
1379
1339
1037
835
621
573
536
501
476
Sum 32 53718 9643
FIGURE 26 - TOP 10 FUNDS BY SALES IN 2016 (eurom)
Master Groups Fund Name Net Sales
ORIX Robeco Robeco High Yield Bonds
Aviva Aviva Investors - Global High Yield Bond
New York Life Candriam Candriam Bonds Credit Opportunities
Cr Suisse CS Nova (Lux) Global Senior Loan Fund
AXA AB FCP I Global High Yield Portfolio
PrudentialMampG MampG Global Floating Rate High Yield
PIMCO PIMCO GIS Global High Yield Bond Fund
Baring Barings Global High Yield Credit Strategies
BNY Mellon BNY Mellon Global Short Dated High Yield Bond Fund
JP Morgan JPMorgan Investment Funds - Global High Yield Bond Fund
234531
133173
115777
103450
96531
70438
50130
49268
42600
35957
Sum 931855
Product DevelopmentBonds Global High Yield
EUROPEAN FUND MARKET REVIEW
Page 1624
2017 EDITION
broadridgecom
FIGURES 28 - FUND LAUNCHES amp CLOSURES
Jan 2016 Feb 2016 Mar 2016 Apr 2016 May 2016 Jun 2016 Jul 2016 Aug 2016 Sep 2016 Oct 2016 Nov 2016 Dec 2016
Fund Launches Fund Closures Fund Mergers
6969
185185
191191
114114
118118
223223
5656
175175
197197
104104
156156
194194
6464
178178
182182
7171
187187
200200
8484
168168
213213
4848
123123
133133
9999
159159
186186
9898
122122
192192
7676
189189
182182
8989
186186
193193
FIGURE 29 - TOP SELLING NEW FUND LAUNCHES IN 2016 (eurom)
Fund Name Fund Domicile Launch Date Net Sales
CS Nova (Lux) Fixed Maturity Bond Fund 2019 Luxembourg 201604
CaixaBank Rentas Euribor 2 FI Spain 201609
CaixaBank Rentas Euribor FI Spain 201606
DWS FlexPension II 2031 Luxembourg 201607
GS USD Treasury Instruments Liquid Reserves Ireland 201605
Multi Manager Access II - High Yield Luxembourg 201604
State Street ACS North America Index Equity United Kingdom 201603
UBI SICAV - Euro Corporate Bond High Potential Luxembourg 201605
UniInstitutional Euro Reserve Plus Germany 201602
Vanguard Investment Series Plc - Vanguard US Treasury Inflation-Protected Securities Index Fund Ireland 201610
2689
2325
2771
1734
1717
3832
3167
1361
3407
1445
Product Development
EUROPEAN FUND MARKET REVIEW
Page 1724
FIGURE 32 - NUMBER OF FUND LAUNCHES BY MAIN ASSET CLASS
2011 2012 2013 2014 2015 2016
Bond Equity Mixed Assets
675675
926926
456456
733733
659659
463463
718718 725725
541541
665665
851851
578578 579579
927927
640640
494494
664664
505505
2017 EDITION
broadridgecom
FIGURE 32 - FUND LAUNCHES BY REGION IN 2016 (eurom)
Fund Region Funds Net Sales
Europe
International
1217
1069
98667
75333
Sum 2286 174000
FIGURE 31 - NUMBER OF FUND LAUNCHES BY STRATEGY
Active ETF Index Tracking
20832083
125125
7878
FIGURE 30 - FUND LAUNCHES BY GROUP IN 2016 (eurom)
Master Group Funds Net Sales
Intesa SP
BNP Paribas
Pioneer
Allianz GI
Cr Suisse
State Street
UBS
GAM Holding
VRUnion
La Caixa
UBI Banca
93
72
34
29
29
23
22
21
18
13
10
1637657
356485
524480
348767
670371
362228
489178
428731
437740
604485
510552
Sum 364 6370676
Product Development
EUROPEAN FUND MARKET REVIEW
Page 1824
Values
TOP 25
REST
TOTAL
130117
-89556
40561
Values
TOP 25
REST
TOTAL
105357
-99044
6312
broadridgecom
FIG 34 - TOP CROSS-BORDER GROUPS BY SALES IN 2016 (eurom) - INC ETFs
Master Groups NAT Funds Net Sales
BlackRock US
Nordea SE
Vanguard US
KBC BE
ORIX Robeco JP
Aviva GB
Pictet CH
MMCMercer US
Cr Suisse CH
State Street US
Amundi FR
Carmignac FR
Bridgewater US
PIMCO US
New York Life Candriam US
Northern Trust US
AXA FR
Old Mutual ZA
Algebris GB
Muzinich US
AQR Capital US
Soc GenLyxor FR
Cr Mutuel FR
Aeris CH
Baring US
440
94
51
79
73
30
101
51
128
161
225
20
3
67
98
19
198
40
5
15
15120
13681
11211
10168
7641
7454
6796
5512
5439
4955
4520
4367
4023
3956
3602
3473
3359
2368
2367
2210
12
305
83
3
56
1802
1632
1547
1503
1410
FIG 33 - TOP CROSS-BORDER GROUPS BY SALES IN 2016 (eurom) - Ex ETFs
Master Groups NAT Funds Net Sales
Nordea SE
KBC BE
ORIX Robeco JP
Aviva GB
Vanguard US
Pictet CH
MMCMercer US
Cr Suisse CH
Carmignac FR
PIMCO US
Bridgewater US
New York Life Candriam US
Northern Trust US
AXA FR
Old Mutual ZA
Algebris GB
Muzinich US
AQR Capital US
Cr Mutuel FR
Aeris CH
Baring US
SYQUANT FR
BTPS BT GB
Jupiter Investment GB
Dimensional US
94
79
73
30
33
101
51
128
20
65
3
98
19
198
40
5
15
12
83
3
13681
10168
7641
7454
7400
6796
5512
5439
4367
4061
4023
3602
3473
3359
2368
2367
2210
1802
1547
1503
56
3
15
19
19
1410
1315
1300
1294
1264
Note exclude money markets funds and ETF Note exclude money market funds
2017 EDITION
Cross-Border Progress
Cross-Border Progress
Group Winners
EUROPEAN FUND MARKET REVIEW
Page 1924
broadridgecom
FIGURE 35 - NET SALES OF CROSS-BORDER GROUPS BY MARKET IN 2016 - ALL FUNDS (eurobn)
-14 0 14 28 42
Cross Border Domestic Round Trip
ItalyGermany
NetherlandsAustria
BelgiumSweden
SpainFrance
United KingdomSwitzerland
FIGURE 36 - NET SALES OF CROSS-BORDER GROUPS BY MARKET IN 2016 - EQUITY ONLY (eurobn)
-284 -213 -142 -71 0 71
Cross Border Domestic Round Trip
GermanySweden
NetherlandsBelgiumAustria
ItalySpain
FranceSwitzerland
United Kingdom
FIGURE 37 - NET SALES OF CROSS-BORDER GROUPS BY MARKET IN 2016 - BOND ONLY (eurobn)
-67 0 67 134 201 268
Cross Border Domestic Round Trip
ItalySpain
United KingdomBelgium
GermanyAustria
NetherlandsSweden
SwitzerlandFrance
Note Excludes money market funds amp ETFs
1 Foreign activity is actual sales as measured bythe Broadridge SalesWatch Confidential Service
2 The 60 members are estimated to account for75-80 of the total cross-border sales activity
Cross-Border Progress
Cross-Border Progress
Cross-Border Share of Sales in Europe
Page 2024
broadridgecom
FIGURE 36 - DOM FRANCE
Domestic Net Sales
Equities Alternative
Protected Fund
Bonds Inflation Linked
Equities France MidSmall Caps
Asset Allocation Alternative
2310
2019
918
776
444
FIGURE 36 - DOM GERMANY
Domestic Net Sales
Asset Allocation Alternative
Mixed Assets Conservative
Real Estate
Bonds EUR
Equities Global Income
5295
3075
1984
1982
1254
FIGURE 36 - DOM ITALY
Domestic Net Sales
Bonds Global Currencies
Mixed Assets Target Maturity
Mixed Assets Conservative
Bonds Emerging Markets
Bonds EUR Corp Inv Grade
7510
4672
3890
2541
1842
FIGURE 36 - DOM SWITZERLAND
Domestic Net Sales
Equities Switzerland
Bonds Global Corporates
Bonds Emerging Markets
Equities Emerging Markets
Bonds CHF
233338
172162
133284
94704
91618
FIGURE 36 - DOM UNITED KINGDOM
Domestic Net Sales
Asset Allocation Alternative
Equities North America
Equities Alternative
Bonds UK Gilt
Bonds Inflation Linked
1041258
207514
186569
179868
170941
FIGURE 36 - SW SECTOR FRANCE
Cross-Border Real Sales
Bonds Global Currencies
Asset Allocation
Bonds Inflation Linked
Equities Europe Income
Bonds Emerging Markets
Confidential
Confidential
Confidential
Confidential
Confidential
FIGURE 36 - SW SECTOR ITALY
Cross-Border Real Sales
Asset Allocation
Bonds EUR Short-Term
Mixed Assets Conservative
Bonds EUR Corp High Yield
Bonds Global Corporates
Confidential
Confidential
Confidential
Confidential
Confidential
FIGURE 36 - SW SECTOR GERMANY
Cross-Border Real Sales
Mixed Assets Income
Asset Allocation Alternative
Bonds EUR Corp High Yield
Bonds Global High Yield
Bonds Emerging Markets
Confidential
Confidential
Confidential
Confidential
Confidential
FIGURE 36 - SW SECTOR SWITZWELAND
Cross-Border Real Sales
Asset Allocation
Bonds Global High Yield
Bonds Global Corporates
Equities Emerging Markets
Bonds Target Maturity
Confidential
Confidential
Confidential
Confidential
Confidential
FIGURE 36 - SW SECTOR UK
Cross-Border Real Sales
Equities Alternative
Bonds Emerging Markets - Local Currency
Bonds Global Corporates
Bonds Emerging Markets
Asset Allocation
Confidential
Confidential
Confidential
Confidential
Confidential
FRANCE
FIGURE 38 - TOP 5 DOMESTIC AND CROSS-BORDERS SECTORS IN THE MAJOR MARKETS (eurom)
GERMANY
ITALY
SWITZERLAND
UNITED KINGDOM
Real Sales dataavailable to SalesWatchmembers only
Cross-Border ProgressDomestic vs Cross-Border Sectors
Page 2124
2017 EDITION
broadridgecom
The following report is based on the unique fund analytics delivered throughBroadridge Global Market Intelligence (GMI) our leading global fundanalytics database The charts and tables in this report reflect only the tip ofthe iceberg in terms of the depth and breadth available from Broadridge GMIThe report offers a high-level overview of European fund flow activity in2016
Global Market Intelligence (GMI) helps you make more strategic decisionsmore effectively allocate your companyrsquos resources and most importantlybe more responsive to your customersrsquo needs all through the combining thepower of the FundFile and SalesWatch datasets
Broadridge FundFile enables deep fund flows analysis of all keygeographical markets covering Asia Pacific Latin America the Middle Eastand Africa and North America and delivers a truly global fund flows solutionBy gradually building the international reach of its global sales data andmaintaining its high quality and ease of use over the past ten years FundFilehas become the unparalleled source of data and analysis with informationon more than 100000 funds
The cross-border dimension of the European funds industryndashtheldquointernationalrdquo fund marketndashcan truly be assessed only with BroadridgeSalesWatch a unique cooperative and confidential benchmarking servicethat allows leading fund groups to track their cross-border sales and assetsagainst their competitorsrsquo by country distribution channel institutional versusretail activity and both gross and net sales This service now counts 60 ofthe leading asset managers among its members (Some sample data takenfrom the tool can be seen on pages 20 and 21 of the current report)
1 All data is at December 2016 unless otherwise stated
2 lsquoInternationalrsquo fund market Broadridge defines an International fund as afund that sources less than 80 of its assets from any single country Somefund groups have domestic and international funds
3 lsquoDomesticrsquo fund market If a fund sources more than 80 of its assets from asingle country then the fund is allocated to that market regardless of itsdomicile
4 Funds of funds have been excluded from all charts and tables (to avoiddouble counting) unless otherwise stated Therefore a market total is the sumof all the investment categories excluding the three funds of funds categories(in-house ex-house and hedge)
5 The investment category lsquootherrsquo includes a variety of different productcategories For most markets especially Belgium Spain and France the figurecomprises guaranteed funds but there are also derivatives and other specialityfunds in the lsquootherrsquo category
6 Property funds are open-ended property funds only
7 Master group Analysis that aggregates the European mutual fund assetsunder the umbrella of their parent company name
8 ETFs are included in broadridgersquos database on mutual funds but thisexcludes exchange-traded commodity products that are not mutual funds
9 References to foreign activity relate to actual sales as measured byBroadridgersquos SalesWatch confidential service The 60 SalesWatch membersare estimated to account for 75-80 of total cross-border sales activity
Footnotes About the Report
EUROPEAN FUND MARKET REVIEW
Page 2224
broadridgecom
Page 2324
broadridgecom
2017 EDITION
Global Market Intelligence reflects our expertiseand understanding of markets worldwide and ofthe evolving needs of asset managers
To learn more and to schedule a free demo ofGlobal Marketing Intelligence visitwwwbroadridgecomGMI today
For more information please contactlauracohenbroadridgecom
No part of this document may be distributed reproduced or posted without the expresswritten permission of Broadridge Financial Solutions Inc copy2017 Broadridge Financial Solutions Inc Broadridge and the Broadridge logo areregistered trademarks of Broadridge Financial Solutions Inc
FundFile SalesWatch
Global
Market
Intelligence
EUROPEAN FUND MARKET REVIEW
Page 2424

2017 EDITION
FIGURE 4 - EUROPEAN NET SALES IN 2016 (eurobn)
Jan 2016 Feb 2016 Mar 2016 Apr 2016 May 2016 Jun 2016 Jul 2016 Aug 2016 Sep 2016 Oct 2016 Nov 2016 Dec 2016
Bond Equity Mixed Assets Money Market
-25
0
25
50
75
FIGURE 5 - GLOBAL NET SALES IN 2016 (eurobn)
Asia-Pacific Europe International Latin America MEA North America
Bond Equity Mixed Assets Money Market
-90
0
90
180
270
broadridgecom
Overview
EUROPEAN FUND MARKET REVIEW
Page 524
2017 EDITION
broadridgecom
FIGURE 6 - HISTORICAL GLOBAL ASSETS (euroT)
2007 2008 2009 2010 2011 2012 2013 2014 2015 2016
Asia-Pacific Europe International Latin America MEA North America
168168
132132159159
186186 185185207207
226226
270270
302302328328
FIGURE 7 - GLOBAL ASSETS BY INVESTMENT TYPE
Bond Equity Mixed Assets Money Market
Asia-Pacific Europe International Latin America MEA North Amercia
Overview
EUROPEAN FUND MARKET REVIEW
Page 624
FIGURE 10 - BEST-SELLING EQUITY FUNDS IN 2016 (eurom)
Fund Name Fund Strategy Fund Sector Net Sales
iShares Core SampP 500 UCITS ETF (USD) Passive Equities North America
Fundsmith Equity Active Equities Global
State Street ACS North America Index Equity Passive Equities North America
DWS Top Dividende Active Equities Global Income
Vanguard Funds Plc - Vanguard SampP 500 UCITS ETF Passive Equities North America
iShares Core MSCI World UCITS ETF Passive Equities Global
4111
3537
3167
2739
2474
2298
2017 EDITION
FIGURE 8 - BEST-SELLING BONDS FUNDS IN 2016 (eurom)
Fund Name Fund Strategy Fund Sector Net Sales
PIMCO GIS Income Fund Active Bonds Global Currencies
Carmignac Seacutecuriteacute Active Bonds EUR Short-Term
Eurizon EasyFund - Treasury EUR T1 Active Bonds Global Currencies
AEAM Dutch Mortgage Fund Active Asset-backed Securities
AB FCP I American Income Portfolio Active Bonds USD
CaixaBank Rentas Euribor FI Active Bonds Target Maturity
6825
5048
4221
3277
2801
2771
broadridgecom
FIGURE 9 - BEST-SELLING MIXED FUNDS IN 2016 (eurom)
Fund Name Fund Strategy Fund Sector Net Sales
Nordea 1 - Stable Return Fund Active Asset Allocation
JPMorgan Investment Funds - Global Macro Opportunities Fund Active Asset Allocation Alternative
Invesco Perpetual Global Targeted Returns Active Asset Allocation Alternative
Invesco Global Targeted Returns Fund Active Asset Allocation Alternative
PrivatFonds Kontrolliert Active Mixed Assets Conservative
Aviva Investors Multi-Strategy Target Return Active Asset Allocation Alternative
10494
5073
4225
3256
2941
2430
Best Sellers
EUROPEAN FUND MARKET REVIEW
Page 724
FIGURE 11 - EUROPEAN MARKET RANKING BY NET SALES IN 2016 (eurom)
Fund Investment Type Group
Fund Market
Bnd Eq MM MM-Enh Mix Oth
Net Sales Net Sales Net Sales Net Sales Net Sales Net Sales
Sum
Net Sales
International
United Kingdom
France
Italy
Spain
Germany
Switzerland
Norway
Finland
Netherlands
Sweden
Turkey
Croatia
Czech Republic
Iceland
Russia
Romania
Bulgaria
Liechtenstein
Slovenia
Lithuania
Malta
Austria
Ukraine
Luxembourg
Latvia
Estonia
Slovakia
Portugal
Hungary
Denmark
Greece
Poland
Belgium
479923
60684
-11564
106168
100666
20062
29453
3041
5618
8494
-12386
4953
2814
1580
-2624
2740
1248
268
145
435
-474085
-216836
-5276
3905
1533
26354
4314
10603
-4023
20114
36936
-210
28
85
-554
-353
-13
184
242
-631
634399
269527
214183
-21924
24792
-9190
-19623
10200
5390
-677
-7061
422
2417
-655
5654
9
-116
184
432
-6487
7977
22124
-4378
-953
27756
6462
5644
349
-29
-6
-6
0
388940
145199
-2987
84278
3349
45687
3715
136
1166
-2651
14796
-314
8
2917
59
-885
639
158
-67
37
10830
-31244
-23726
514
34352
52305
15423
428
4438
-12728
-19522
489
-0
102
34
-211
0
-2
5
76
1487
-16691
-50
-58
-437
-139
1332
114
-107
-1007
-11371
7030
167
-431
2954
-0
-20
-16
321
-117
-1812
-34
-10958
-712
-5861
16405
-444
952
-0
-2330
-2713
-7595
-1123
-5615
3576
-133802
-124
-225
2
-14
443
-86
3
1509
-3
-813
5795
-0
11
-651
-486
-1126
4436
-711
-6119
3451
-44
515
7392
792
-653
3709
10
-489
414
-6788
1033521
235307
192754
168563
163739
162975
39744
24409
18233
12901
12764
5339
5267
4001
2535
1544
1541
788
317
278
196
191
177
-0
-59
-74
-116
-2444
-4332
-4947
-7298
-8621
-19359
-112194
Sum 781897 -597797 959271 59963 687963 36343 1927641
2017 EDITION
broadridgecom
European Sales
EUROPEAN FUND MARKET REVIEW
Page 824
2017 EDITION
FIGURE 13 - TOP AND BOTTOM FIVE SECTORS BY SALES IN 2016 (eurom)
MM
GBP
MM
Eur
o
Asse
t Allo
c Alt
MM
USD
Eq E
m M
kt
Bnd
USD
Corp
HY
Bnd
Flex
Eq Ja
pan
Bnd
Eur
Eq E
urop
e
0
25
50
broadridgecom
FIGURE 12 - TOP SECTORS BY SALES IN 2016 (eurom)
Year
Fund Sector
2015 2016
Net Sales Net Sales Rank Net Sales Net Sales Rank
Money Market GBP
Money Market EUR
Asset Allocation Alternative
Money Market USD
Equities Emerging Markets
Bonds Global Currencies
Bonds Global Corporates
Bonds Emerging Markets
Asset Allocation
Bonds EUR Short-Term
Mixed Assets Conservative
Bonds Inflation Linked
Equities Global
Bonds EUR Corp Inv Grade
Bonds USD
Commodities
Fund of Funds Balanced
Bonds Target Maturity
Fund of Funds Bonds
Bonds Global High Yield
Fund of Funds Asset Allocation
Equities Alternative
21223
35123
53618
32807
-7062
16372
5765
-6289
53125
3817
28844
2545
-6589
7589
1203
2261
24274
-10629
8219
-1241
13
4
1
6
219
15
29
217
2
34
8
40
218
22
58
43
11
223
20
203
43475
37420
34514
17428
15047
15019
14195
12193
12135
11513
11323
10233
10150
8583
8430
7958
7957
7926
7850
7593
1
2
3
4
5
6
7
8
9
10
11
12
13
14
15
16
17
18
19
20
25359
30561
9
7
6916
6717
21
22
All Sector Ranking
EUROPEAN FUND MARKET REVIEW
Page 924
Values
TOP 25
REST
TOTAL
171626
-80785
90841
Values
TOP 25
REST
TOTAL
148629
-96455
52174
2017 EDITION
FIG 15 - TOP MASTER GROUPS BY SALES IN 2016 (eurom) - INC ETFs
Master Groups NAT Funds Net Sales
BlackRock US
Nordea SE
Intesa SP IT
Vanguard US
KBC BE
Aviva GB
VRUnion DE
State Street US
Pictet CH
ORIX Robeco JP
MMCMercer US
La Caixa ES
Northern Trust US
Cr Suisse CH
Flossbach von Storch DE
New York Life Candriam US
Carmignac FR
Bridgewater US
PIMCO US
Fundsmith GB
UBI Banca IT
Amundi FR
Legal amp General GB
Jupiter Investment GB
Royal London GB
522
252
598
64
1000
163
434
184
135
102
51
102
27
357
15
161
20
3
67
2
16190
14405
13638
12506
12296
10521
9056
8698
6764
6573
5512
5505
5211
4968
4515
4412
4367
4023
3956
3854
69
615
84
51
46
3329
3018
2888
2762
2660
FIG 14 - TOP MASTER GROUPS BY SALES IN 2016 (eurom) - EX ETFs
Master Groups NAT Funds Net Sales
Nordea SE
Intesa SP IT
KBC BE
Aviva GB
VRUnion DE
Vanguard US
Pictet CH
ORIX Robeco JP
MMCMercer US
La Caixa ES
Northern Trust US
Cr Suisse CH
Flossbach von Storch DE
New York Life Candriam US
Carmignac FR
PIMCO US
Bridgewater US
State Street US
Fundsmith GB
UBI Banca IT
Legal amp General GB
Jupiter Investment GB
Royal London GB
Aegon NL
Algebris GB
252
598
1000
163
433
46
135
102
51
102
27
356
15
161
20
65
3
84
2
69
14405
13638
12296
10521
9059
8694
6764
6573
5512
5505
5211
4773
4515
4412
4367
4061
4023
3913
3854
3329
84
51
46
78
5
2888
2762
2660
2527
2367
broadridgecom
Note Excludes money market funds and ETFs Note Excludes money market funds
Pan-European Master Groups Sales
EUROPEAN FUND MARKET REVIEW
Page 1024
Values
TOP 25
REST
TOTAL
171626
-80785
90841
2017 EDITION
broadridgecom
Figure 16 - TOP 25 FUNDS BY NET SALES IN 2016 (eurom)
Master Groups Fund Name Domicile Strategy Type Launch Date Net Sales
Nordea Nordea 1 - Stable Return Fund LU Active Mix 200511
PIMCO PIMCO GIS Income Fund IE Active Bnd 201211
JP Morgan JPMorgan Investment Funds - Global Macro Opportunities Fund LU Active Mix 199902
Carmignac Carmignac Seacutecuriteacute FR Active Bnd 199504
Invesco Invesco Perpetual Global Targeted Returns GB Active Mix 201309
Intesa SP Eurizon EasyFund - Treasury EUR T1 LU Active Bnd 201503
BlackRock iShares Core SampP 500 UCITS ETF (USD) IE Passive Eq 201005
Bridgewater Bridgewater Pure Alpha Strategy 18 Volatility VG Active Hdge 199112
Fundsmith Fundsmith Equity GB Active Eq 201011
Aegon AEAM Dutch Mortgage Fund NL Active Bnd 201308
Invesco Invesco Global Targeted Returns Fund LU Active Mix 201312
State Street State Street ACS North America Index Equity GB Passive Eq 201603
VRUnion PrivatFonds Kontrolliert DE Active Mix 201007
AXA AB FCP I American Income Portfolio LU Active Bnd 199307
La Caixa CaixaBank Rentas Euribor FI ES Active Bnd 201606
Deutsche AM DWS Top Dividende DE Active Eq 200304
Cr Suisse CS Nova (Lux) Fixed Maturity Bond Fund 2019 LU Active Bnd 201604
Vanguard Vanguard Funds Plc - Vanguard SampP 500 UCITS ETF IE Passive Eq 201205
Aviva Aviva Investors Multi-Strategy Target Return GB Active Mix 201407
Flossbach von Storch Flossbach von Storch SICAV - Multiple Opportunities LU Active Mix 200710
ORIX Robeco Robeco High Yield Bonds LU Active Bnd 199804
BBVA Group BBVA Bonos Internacional Flexible 0-3 FI ES Active Bnd 201505
La Caixa CaixaBank Rentas Euribor 2 FI ES Active Bnd 201609
BlackRock iShares Core MSCI World UCITS ETF IE Passive Eq 200909
PIMCO PIMCO GIS Global Investment Grade Credit IE Active Bnd 200307
10494
6825
5073
5048
4225
4221
4111
3678
3537
3277
3256
3167
2941
2801
2771
2739
2689
2474
2430
2375
2345
2333
2325
2298
2284
Note Excludes money markets funds
Pan-European Fund Leaders Sales
EUROPEAN FUND MARKET REVIEW
Page 1124
2017 EDITION
FIGURE 18 - TOP 10 MASTER GROUPS BY SALES IN 2016 (eurom)
Master Groups NAT Funds Assets Net Sales
BlackRock US
State Street US
Amundi FR
Vanguard US
UBS CH
Deutsche Boumlrse DE
BNP Paribas FR
Deka DE
Swisscanto CH
Soc GenLyxor FR
292
100
105
18
123
1
35
46
4
254
252952
21134
24805
23790
29060
4157
5551
8321
6578
50859
23549
4785
3825
3811
2503
2150
1130
885
617
550
Sum 978 427205 43805
FIGURE 17- TOP 10 FUNDS BY SALES IN 2016 (eurom)
Master Groups Fund Name Net Sales
BlackRock iShares Core SampP 500 UCITS ETF (USD)
Vanguard Vanguard Funds Plc - Vanguard SampP 500 UCITS ETF
BlackRock iShares Core Euro Corporate Bond UCITS ETF
iShares Core MSCI World UCITS ETF
iShares EURO STOXX 50 UCITS ETF (DE)
Soc GenLyxor Lyxor UCITS ETF EURO STOXX 50
BlackRock iShares Euro High Yield Corporate Bond UCITS ETF
iShares MSCI Europe UCITS ETF (Inc)
Deutsche AM db x-trackers EURO STOXX 50reg UCITS ETF (DR)
BlackRock iShares STOXX Europe 600 (DE)
12016
11539
6864
6540
5099
5010
4792
4397
4216
4138
Sum 64610
broadridgecom
Product ThemesExchange Traded Funds
EUROPEAN FUND MARKET REVIEW
Page 1224
2017 EDITION
FIGURE 20 - TOP 10 MASTER GROUPS BY SALES IN 2016 (eurom)
Master Groups NAT Funds Assets Net Sales
Vanguard US
Northern Trust US
UBS CH
State Street US
Swisscanto CH
Legal amp General GB
Laumlnsfoumlrsaumlkrings SE
KBC BE
Den Norske NO
MMCMercer US
34
26
65
55
69
42
5
30
3
3
79794
13382
64896
33689
27722
26645
3767
4440
2023
5483
8966
5174
4820
4687
2510
1755
1591
1179
994
954
Sum 332 261841 32630
FIGURE 19 - TOP 10 FUNDS BY SALES IN 2016 (eurom)
Master Groups Fund Name Net Sales
State Street State Street ACS North America Index Equity
Vanguard Vanguard Investment Series Plc - Vanguard Global Bond Index Fund
Vanguard Investment Series Plc - Vanguard US Treasury Inflation-Protected Securities Index Fund
LloydsSWIP Scottish Widows Corporate Bond Tracker Fund
Northern Trust Northern Trust World Custom ESG Equity Index
HSBC HSBC Japan Index
Northern Trust Northern Trust Developed Real Estate Index UCITS FGR Fund
Northern Trust UCITS Common Contractual Fund - World Equity Index Fund
Vanguard Vanguard Investment Series Plc - Vanguard Emerging Markets Stock Index Fund
Den Norske DNB Global Indeks
316733
164155
144479
107232
102532
87021
86021
78849
78797
76756
Sum 1242575
broadridgecom
Product ThemesIndex Tracking Funds
EUROPEAN FUND MARKET REVIEW
Page 1324
2017 EDITION
FIG 22 - MARKET SHARE OF PASSIVE FUNDS BY ASSETS IN 2016
Index Tracking ETF Active
88
77
8585
FIG 21 - MARKET SHARE OF PASSIVE FUNDS BY ASSETS IN 2002
Index Tracking ETF Active
3311
9696
FIGURE 23 - HISTORICAL NET SALES (eurobn)
2013 2014 2015 2016
Active ETF Index Tracking
26062606
164164 194194
30403040
405405 438438
20172017
652652
363363187187
387387 335335
Note Excludes money market funds
broadridgecom
Product ThemesActive vs Passive
EUROPEAN FUND MARKET REVIEW
Page 1424
2017 EDITION
FIGURE 25 - TOP 10 MASTER GROUPS BY SALES IN 2016 (eurom)
Master Groups NAT Funds Assets Net Sales
Amundi FR
BlackRock US
Nordea SE
ORIX Robeco JP
Aviva GB
Vanguard US
UBS CH
Fidelity US
Goldman Sachs US
PrudentialMampG GB
9
20
9
11
4
3
18
11
7
4
4791
20800
5829
8750
2427
7762
8808
8444
2382
4021
2473
1923
1632
1340
1182
1117
1024
1013
909
816
Sum 96 74014 13429
broadridgecom
FIGURE 24 - TOP 10 FUNDS BY SALES IN 2016 (eurom)
Master Groups Fund Name Net Sales
BlackRock iShares Core MSCI Emerging Markets IMI UCITS ETF
Amundi Amundi ETF MSCI Emerging Markets UCITS ETF
ORIX Robeco Robeco Emerging Conservative Equities
PrudentialMampG Eastspring Investments Global Emerging Markets Dynamic
Aviva Aviva Investors - Emerging Markets Equity Income Fund
Goldman Sachs GS Emerging Markets Broad Equity Portfolio
Nordea Nordea 1 - Stable Emerging Markets Equity Fund
Vanguard Vanguard Investment Series Plc - Vanguard Emerging Markets Stock Index Fund
Amundi Amundi Funds Equity Emerging World
BTPS BT Hermes Global Emerging Markets
199164
150161
107040
106244
95149
94597
91057
78797
74192
56460
Sum 1052862
Product ThemesEquities Emerging Markets
EUROPEAN FUND MARKET REVIEW
Page 1524
2017 EDITION
broadridgecom
FIGURE 27 - TOP 10 MASTER GROUPS BY SALES IN 2016 (eurom)
Master Groups NAT Funds Assets Net Sales
ORIX Robeco JP
Aviva GB
New York Life Candriam US
Cr Suisse CH
AXA FR
Baring US
PrudentialMampG GB
BNY Mellon US
PIMCO US
Generali IT
2
3
2
3
6
4
3
4
1
4
7741
5701
2634
5010
21215
2269
2780
1135
4641
592
2347
1379
1339
1037
835
621
573
536
501
476
Sum 32 53718 9643
FIGURE 26 - TOP 10 FUNDS BY SALES IN 2016 (eurom)
Master Groups Fund Name Net Sales
ORIX Robeco Robeco High Yield Bonds
Aviva Aviva Investors - Global High Yield Bond
New York Life Candriam Candriam Bonds Credit Opportunities
Cr Suisse CS Nova (Lux) Global Senior Loan Fund
AXA AB FCP I Global High Yield Portfolio
PrudentialMampG MampG Global Floating Rate High Yield
PIMCO PIMCO GIS Global High Yield Bond Fund
Baring Barings Global High Yield Credit Strategies
BNY Mellon BNY Mellon Global Short Dated High Yield Bond Fund
JP Morgan JPMorgan Investment Funds - Global High Yield Bond Fund
234531
133173
115777
103450
96531
70438
50130
49268
42600
35957
Sum 931855
Product DevelopmentBonds Global High Yield
EUROPEAN FUND MARKET REVIEW
Page 1624
2017 EDITION
broadridgecom
FIGURES 28 - FUND LAUNCHES amp CLOSURES
Jan 2016 Feb 2016 Mar 2016 Apr 2016 May 2016 Jun 2016 Jul 2016 Aug 2016 Sep 2016 Oct 2016 Nov 2016 Dec 2016
Fund Launches Fund Closures Fund Mergers
6969
185185
191191
114114
118118
223223
5656
175175
197197
104104
156156
194194
6464
178178
182182
7171
187187
200200
8484
168168
213213
4848
123123
133133
9999
159159
186186
9898
122122
192192
7676
189189
182182
8989
186186
193193
FIGURE 29 - TOP SELLING NEW FUND LAUNCHES IN 2016 (eurom)
Fund Name Fund Domicile Launch Date Net Sales
CS Nova (Lux) Fixed Maturity Bond Fund 2019 Luxembourg 201604
CaixaBank Rentas Euribor 2 FI Spain 201609
CaixaBank Rentas Euribor FI Spain 201606
DWS FlexPension II 2031 Luxembourg 201607
GS USD Treasury Instruments Liquid Reserves Ireland 201605
Multi Manager Access II - High Yield Luxembourg 201604
State Street ACS North America Index Equity United Kingdom 201603
UBI SICAV - Euro Corporate Bond High Potential Luxembourg 201605
UniInstitutional Euro Reserve Plus Germany 201602
Vanguard Investment Series Plc - Vanguard US Treasury Inflation-Protected Securities Index Fund Ireland 201610
2689
2325
2771
1734
1717
3832
3167
1361
3407
1445
Product Development
EUROPEAN FUND MARKET REVIEW
Page 1724
FIGURE 32 - NUMBER OF FUND LAUNCHES BY MAIN ASSET CLASS
2011 2012 2013 2014 2015 2016
Bond Equity Mixed Assets
675675
926926
456456
733733
659659
463463
718718 725725
541541
665665
851851
578578 579579
927927
640640
494494
664664
505505
2017 EDITION
broadridgecom
FIGURE 32 - FUND LAUNCHES BY REGION IN 2016 (eurom)
Fund Region Funds Net Sales
Europe
International
1217
1069
98667
75333
Sum 2286 174000
FIGURE 31 - NUMBER OF FUND LAUNCHES BY STRATEGY
Active ETF Index Tracking
20832083
125125
7878
FIGURE 30 - FUND LAUNCHES BY GROUP IN 2016 (eurom)
Master Group Funds Net Sales
Intesa SP
BNP Paribas
Pioneer
Allianz GI
Cr Suisse
State Street
UBS
GAM Holding
VRUnion
La Caixa
UBI Banca
93
72
34
29
29
23
22
21
18
13
10
1637657
356485
524480
348767
670371
362228
489178
428731
437740
604485
510552
Sum 364 6370676
Product Development
EUROPEAN FUND MARKET REVIEW
Page 1824
Values
TOP 25
REST
TOTAL
130117
-89556
40561
Values
TOP 25
REST
TOTAL
105357
-99044
6312
broadridgecom
FIG 34 - TOP CROSS-BORDER GROUPS BY SALES IN 2016 (eurom) - INC ETFs
Master Groups NAT Funds Net Sales
BlackRock US
Nordea SE
Vanguard US
KBC BE
ORIX Robeco JP
Aviva GB
Pictet CH
MMCMercer US
Cr Suisse CH
State Street US
Amundi FR
Carmignac FR
Bridgewater US
PIMCO US
New York Life Candriam US
Northern Trust US
AXA FR
Old Mutual ZA
Algebris GB
Muzinich US
AQR Capital US
Soc GenLyxor FR
Cr Mutuel FR
Aeris CH
Baring US
440
94
51
79
73
30
101
51
128
161
225
20
3
67
98
19
198
40
5
15
15120
13681
11211
10168
7641
7454
6796
5512
5439
4955
4520
4367
4023
3956
3602
3473
3359
2368
2367
2210
12
305
83
3
56
1802
1632
1547
1503
1410
FIG 33 - TOP CROSS-BORDER GROUPS BY SALES IN 2016 (eurom) - Ex ETFs
Master Groups NAT Funds Net Sales
Nordea SE
KBC BE
ORIX Robeco JP
Aviva GB
Vanguard US
Pictet CH
MMCMercer US
Cr Suisse CH
Carmignac FR
PIMCO US
Bridgewater US
New York Life Candriam US
Northern Trust US
AXA FR
Old Mutual ZA
Algebris GB
Muzinich US
AQR Capital US
Cr Mutuel FR
Aeris CH
Baring US
SYQUANT FR
BTPS BT GB
Jupiter Investment GB
Dimensional US
94
79
73
30
33
101
51
128
20
65
3
98
19
198
40
5
15
12
83
3
13681
10168
7641
7454
7400
6796
5512
5439
4367
4061
4023
3602
3473
3359
2368
2367
2210
1802
1547
1503
56
3
15
19
19
1410
1315
1300
1294
1264
Note exclude money markets funds and ETF Note exclude money market funds
2017 EDITION
Cross-Border Progress
Cross-Border Progress
Group Winners
EUROPEAN FUND MARKET REVIEW
Page 1924
broadridgecom
FIGURE 35 - NET SALES OF CROSS-BORDER GROUPS BY MARKET IN 2016 - ALL FUNDS (eurobn)
-14 0 14 28 42
Cross Border Domestic Round Trip
ItalyGermany
NetherlandsAustria
BelgiumSweden
SpainFrance
United KingdomSwitzerland
FIGURE 36 - NET SALES OF CROSS-BORDER GROUPS BY MARKET IN 2016 - EQUITY ONLY (eurobn)
-284 -213 -142 -71 0 71
Cross Border Domestic Round Trip
GermanySweden
NetherlandsBelgiumAustria
ItalySpain
FranceSwitzerland
United Kingdom
FIGURE 37 - NET SALES OF CROSS-BORDER GROUPS BY MARKET IN 2016 - BOND ONLY (eurobn)
-67 0 67 134 201 268
Cross Border Domestic Round Trip
ItalySpain
United KingdomBelgium
GermanyAustria
NetherlandsSweden
SwitzerlandFrance
Note Excludes money market funds amp ETFs
1 Foreign activity is actual sales as measured bythe Broadridge SalesWatch Confidential Service
2 The 60 members are estimated to account for75-80 of the total cross-border sales activity
Cross-Border Progress
Cross-Border Progress
Cross-Border Share of Sales in Europe
Page 2024
broadridgecom
FIGURE 36 - DOM FRANCE
Domestic Net Sales
Equities Alternative
Protected Fund
Bonds Inflation Linked
Equities France MidSmall Caps
Asset Allocation Alternative
2310
2019
918
776
444
FIGURE 36 - DOM GERMANY
Domestic Net Sales
Asset Allocation Alternative
Mixed Assets Conservative
Real Estate
Bonds EUR
Equities Global Income
5295
3075
1984
1982
1254
FIGURE 36 - DOM ITALY
Domestic Net Sales
Bonds Global Currencies
Mixed Assets Target Maturity
Mixed Assets Conservative
Bonds Emerging Markets
Bonds EUR Corp Inv Grade
7510
4672
3890
2541
1842
FIGURE 36 - DOM SWITZERLAND
Domestic Net Sales
Equities Switzerland
Bonds Global Corporates
Bonds Emerging Markets
Equities Emerging Markets
Bonds CHF
233338
172162
133284
94704
91618
FIGURE 36 - DOM UNITED KINGDOM
Domestic Net Sales
Asset Allocation Alternative
Equities North America
Equities Alternative
Bonds UK Gilt
Bonds Inflation Linked
1041258
207514
186569
179868
170941
FIGURE 36 - SW SECTOR FRANCE
Cross-Border Real Sales
Bonds Global Currencies
Asset Allocation
Bonds Inflation Linked
Equities Europe Income
Bonds Emerging Markets
Confidential
Confidential
Confidential
Confidential
Confidential
FIGURE 36 - SW SECTOR ITALY
Cross-Border Real Sales
Asset Allocation
Bonds EUR Short-Term
Mixed Assets Conservative
Bonds EUR Corp High Yield
Bonds Global Corporates
Confidential
Confidential
Confidential
Confidential
Confidential
FIGURE 36 - SW SECTOR GERMANY
Cross-Border Real Sales
Mixed Assets Income
Asset Allocation Alternative
Bonds EUR Corp High Yield
Bonds Global High Yield
Bonds Emerging Markets
Confidential
Confidential
Confidential
Confidential
Confidential
FIGURE 36 - SW SECTOR SWITZWELAND
Cross-Border Real Sales
Asset Allocation
Bonds Global High Yield
Bonds Global Corporates
Equities Emerging Markets
Bonds Target Maturity
Confidential
Confidential
Confidential
Confidential
Confidential
FIGURE 36 - SW SECTOR UK
Cross-Border Real Sales
Equities Alternative
Bonds Emerging Markets - Local Currency
Bonds Global Corporates
Bonds Emerging Markets
Asset Allocation
Confidential
Confidential
Confidential
Confidential
Confidential
FRANCE
FIGURE 38 - TOP 5 DOMESTIC AND CROSS-BORDERS SECTORS IN THE MAJOR MARKETS (eurom)
GERMANY
ITALY
SWITZERLAND
UNITED KINGDOM
Real Sales dataavailable to SalesWatchmembers only
Cross-Border ProgressDomestic vs Cross-Border Sectors
Page 2124
2017 EDITION
broadridgecom
The following report is based on the unique fund analytics delivered throughBroadridge Global Market Intelligence (GMI) our leading global fundanalytics database The charts and tables in this report reflect only the tip ofthe iceberg in terms of the depth and breadth available from Broadridge GMIThe report offers a high-level overview of European fund flow activity in2016
Global Market Intelligence (GMI) helps you make more strategic decisionsmore effectively allocate your companyrsquos resources and most importantlybe more responsive to your customersrsquo needs all through the combining thepower of the FundFile and SalesWatch datasets
Broadridge FundFile enables deep fund flows analysis of all keygeographical markets covering Asia Pacific Latin America the Middle Eastand Africa and North America and delivers a truly global fund flows solutionBy gradually building the international reach of its global sales data andmaintaining its high quality and ease of use over the past ten years FundFilehas become the unparalleled source of data and analysis with informationon more than 100000 funds
The cross-border dimension of the European funds industryndashtheldquointernationalrdquo fund marketndashcan truly be assessed only with BroadridgeSalesWatch a unique cooperative and confidential benchmarking servicethat allows leading fund groups to track their cross-border sales and assetsagainst their competitorsrsquo by country distribution channel institutional versusretail activity and both gross and net sales This service now counts 60 ofthe leading asset managers among its members (Some sample data takenfrom the tool can be seen on pages 20 and 21 of the current report)
1 All data is at December 2016 unless otherwise stated
2 lsquoInternationalrsquo fund market Broadridge defines an International fund as afund that sources less than 80 of its assets from any single country Somefund groups have domestic and international funds
3 lsquoDomesticrsquo fund market If a fund sources more than 80 of its assets from asingle country then the fund is allocated to that market regardless of itsdomicile
4 Funds of funds have been excluded from all charts and tables (to avoiddouble counting) unless otherwise stated Therefore a market total is the sumof all the investment categories excluding the three funds of funds categories(in-house ex-house and hedge)
5 The investment category lsquootherrsquo includes a variety of different productcategories For most markets especially Belgium Spain and France the figurecomprises guaranteed funds but there are also derivatives and other specialityfunds in the lsquootherrsquo category
6 Property funds are open-ended property funds only
7 Master group Analysis that aggregates the European mutual fund assetsunder the umbrella of their parent company name
8 ETFs are included in broadridgersquos database on mutual funds but thisexcludes exchange-traded commodity products that are not mutual funds
9 References to foreign activity relate to actual sales as measured byBroadridgersquos SalesWatch confidential service The 60 SalesWatch membersare estimated to account for 75-80 of total cross-border sales activity
Footnotes About the Report
EUROPEAN FUND MARKET REVIEW
Page 2224
broadridgecom
Page 2324
broadridgecom
2017 EDITION
Global Market Intelligence reflects our expertiseand understanding of markets worldwide and ofthe evolving needs of asset managers
To learn more and to schedule a free demo ofGlobal Marketing Intelligence visitwwwbroadridgecomGMI today
For more information please contactlauracohenbroadridgecom
No part of this document may be distributed reproduced or posted without the expresswritten permission of Broadridge Financial Solutions Inc copy2017 Broadridge Financial Solutions Inc Broadridge and the Broadridge logo areregistered trademarks of Broadridge Financial Solutions Inc
FundFile SalesWatch
Global
Market
Intelligence
EUROPEAN FUND MARKET REVIEW
Page 2424
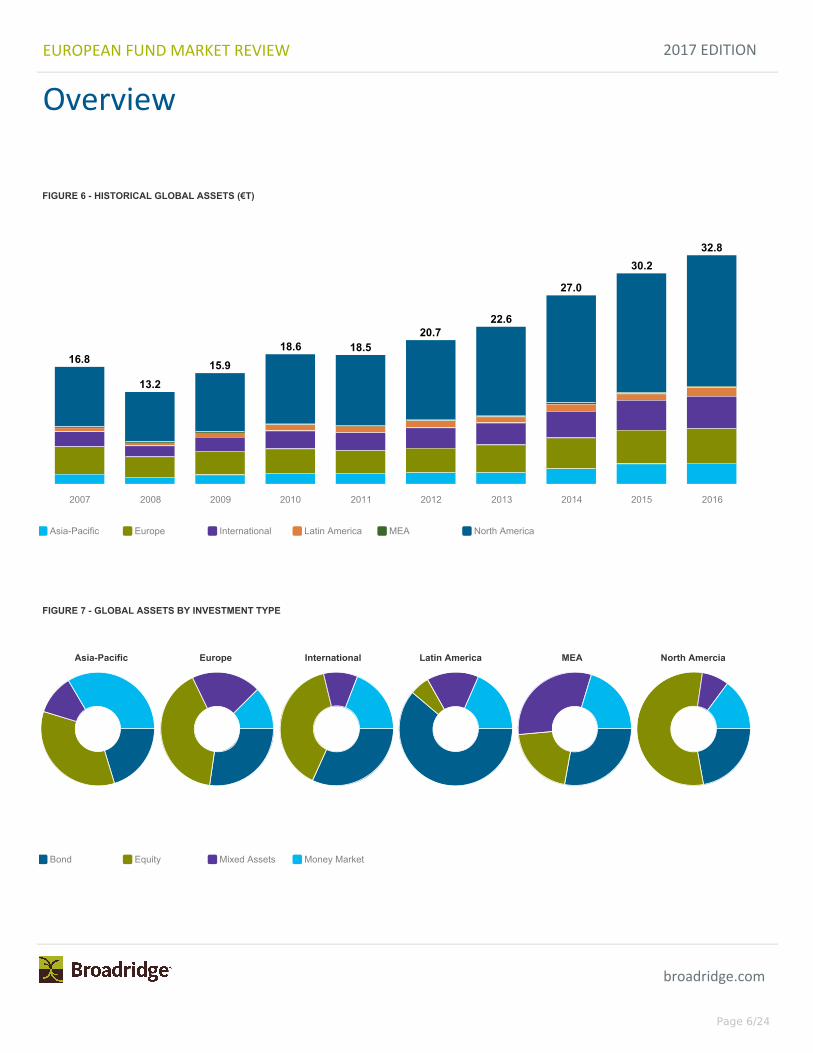
2017 EDITION
broadridgecom
FIGURE 6 - HISTORICAL GLOBAL ASSETS (euroT)
2007 2008 2009 2010 2011 2012 2013 2014 2015 2016
Asia-Pacific Europe International Latin America MEA North America
168168
132132159159
186186 185185207207
226226
270270
302302328328
FIGURE 7 - GLOBAL ASSETS BY INVESTMENT TYPE
Bond Equity Mixed Assets Money Market
Asia-Pacific Europe International Latin America MEA North Amercia
Overview
EUROPEAN FUND MARKET REVIEW
Page 624
FIGURE 10 - BEST-SELLING EQUITY FUNDS IN 2016 (eurom)
Fund Name Fund Strategy Fund Sector Net Sales
iShares Core SampP 500 UCITS ETF (USD) Passive Equities North America
Fundsmith Equity Active Equities Global
State Street ACS North America Index Equity Passive Equities North America
DWS Top Dividende Active Equities Global Income
Vanguard Funds Plc - Vanguard SampP 500 UCITS ETF Passive Equities North America
iShares Core MSCI World UCITS ETF Passive Equities Global
4111
3537
3167
2739
2474
2298
2017 EDITION
FIGURE 8 - BEST-SELLING BONDS FUNDS IN 2016 (eurom)
Fund Name Fund Strategy Fund Sector Net Sales
PIMCO GIS Income Fund Active Bonds Global Currencies
Carmignac Seacutecuriteacute Active Bonds EUR Short-Term
Eurizon EasyFund - Treasury EUR T1 Active Bonds Global Currencies
AEAM Dutch Mortgage Fund Active Asset-backed Securities
AB FCP I American Income Portfolio Active Bonds USD
CaixaBank Rentas Euribor FI Active Bonds Target Maturity
6825
5048
4221
3277
2801
2771
broadridgecom
FIGURE 9 - BEST-SELLING MIXED FUNDS IN 2016 (eurom)
Fund Name Fund Strategy Fund Sector Net Sales
Nordea 1 - Stable Return Fund Active Asset Allocation
JPMorgan Investment Funds - Global Macro Opportunities Fund Active Asset Allocation Alternative
Invesco Perpetual Global Targeted Returns Active Asset Allocation Alternative
Invesco Global Targeted Returns Fund Active Asset Allocation Alternative
PrivatFonds Kontrolliert Active Mixed Assets Conservative
Aviva Investors Multi-Strategy Target Return Active Asset Allocation Alternative
10494
5073
4225
3256
2941
2430
Best Sellers
EUROPEAN FUND MARKET REVIEW
Page 724
FIGURE 11 - EUROPEAN MARKET RANKING BY NET SALES IN 2016 (eurom)
Fund Investment Type Group
Fund Market
Bnd Eq MM MM-Enh Mix Oth
Net Sales Net Sales Net Sales Net Sales Net Sales Net Sales
Sum
Net Sales
International
United Kingdom
France
Italy
Spain
Germany
Switzerland
Norway
Finland
Netherlands
Sweden
Turkey
Croatia
Czech Republic
Iceland
Russia
Romania
Bulgaria
Liechtenstein
Slovenia
Lithuania
Malta
Austria
Ukraine
Luxembourg
Latvia
Estonia
Slovakia
Portugal
Hungary
Denmark
Greece
Poland
Belgium
479923
60684
-11564
106168
100666
20062
29453
3041
5618
8494
-12386
4953
2814
1580
-2624
2740
1248
268
145
435
-474085
-216836
-5276
3905
1533
26354
4314
10603
-4023
20114
36936
-210
28
85
-554
-353
-13
184
242
-631
634399
269527
214183
-21924
24792
-9190
-19623
10200
5390
-677
-7061
422
2417
-655
5654
9
-116
184
432
-6487
7977
22124
-4378
-953
27756
6462
5644
349
-29
-6
-6
0
388940
145199
-2987
84278
3349
45687
3715
136
1166
-2651
14796
-314
8
2917
59
-885
639
158
-67
37
10830
-31244
-23726
514
34352
52305
15423
428
4438
-12728
-19522
489
-0
102
34
-211
0
-2
5
76
1487
-16691
-50
-58
-437
-139
1332
114
-107
-1007
-11371
7030
167
-431
2954
-0
-20
-16
321
-117
-1812
-34
-10958
-712
-5861
16405
-444
952
-0
-2330
-2713
-7595
-1123
-5615
3576
-133802
-124
-225
2
-14
443
-86
3
1509
-3
-813
5795
-0
11
-651
-486
-1126
4436
-711
-6119
3451
-44
515
7392
792
-653
3709
10
-489
414
-6788
1033521
235307
192754
168563
163739
162975
39744
24409
18233
12901
12764
5339
5267
4001
2535
1544
1541
788
317
278
196
191
177
-0
-59
-74
-116
-2444
-4332
-4947
-7298
-8621
-19359
-112194
Sum 781897 -597797 959271 59963 687963 36343 1927641
2017 EDITION
broadridgecom
European Sales
EUROPEAN FUND MARKET REVIEW
Page 824
2017 EDITION
FIGURE 13 - TOP AND BOTTOM FIVE SECTORS BY SALES IN 2016 (eurom)
MM
GBP
MM
Eur
o
Asse
t Allo
c Alt
MM
USD
Eq E
m M
kt
Bnd
USD
Corp
HY
Bnd
Flex
Eq Ja
pan
Bnd
Eur
Eq E
urop
e
0
25
50
broadridgecom
FIGURE 12 - TOP SECTORS BY SALES IN 2016 (eurom)
Year
Fund Sector
2015 2016
Net Sales Net Sales Rank Net Sales Net Sales Rank
Money Market GBP
Money Market EUR
Asset Allocation Alternative
Money Market USD
Equities Emerging Markets
Bonds Global Currencies
Bonds Global Corporates
Bonds Emerging Markets
Asset Allocation
Bonds EUR Short-Term
Mixed Assets Conservative
Bonds Inflation Linked
Equities Global
Bonds EUR Corp Inv Grade
Bonds USD
Commodities
Fund of Funds Balanced
Bonds Target Maturity
Fund of Funds Bonds
Bonds Global High Yield
Fund of Funds Asset Allocation
Equities Alternative
21223
35123
53618
32807
-7062
16372
5765
-6289
53125
3817
28844
2545
-6589
7589
1203
2261
24274
-10629
8219
-1241
13
4
1
6
219
15
29
217
2
34
8
40
218
22
58
43
11
223
20
203
43475
37420
34514
17428
15047
15019
14195
12193
12135
11513
11323
10233
10150
8583
8430
7958
7957
7926
7850
7593
1
2
3
4
5
6
7
8
9
10
11
12
13
14
15
16
17
18
19
20
25359
30561
9
7
6916
6717
21
22
All Sector Ranking
EUROPEAN FUND MARKET REVIEW
Page 924
Values
TOP 25
REST
TOTAL
171626
-80785
90841
Values
TOP 25
REST
TOTAL
148629
-96455
52174
2017 EDITION
FIG 15 - TOP MASTER GROUPS BY SALES IN 2016 (eurom) - INC ETFs
Master Groups NAT Funds Net Sales
BlackRock US
Nordea SE
Intesa SP IT
Vanguard US
KBC BE
Aviva GB
VRUnion DE
State Street US
Pictet CH
ORIX Robeco JP
MMCMercer US
La Caixa ES
Northern Trust US
Cr Suisse CH
Flossbach von Storch DE
New York Life Candriam US
Carmignac FR
Bridgewater US
PIMCO US
Fundsmith GB
UBI Banca IT
Amundi FR
Legal amp General GB
Jupiter Investment GB
Royal London GB
522
252
598
64
1000
163
434
184
135
102
51
102
27
357
15
161
20
3
67
2
16190
14405
13638
12506
12296
10521
9056
8698
6764
6573
5512
5505
5211
4968
4515
4412
4367
4023
3956
3854
69
615
84
51
46
3329
3018
2888
2762
2660
FIG 14 - TOP MASTER GROUPS BY SALES IN 2016 (eurom) - EX ETFs
Master Groups NAT Funds Net Sales
Nordea SE
Intesa SP IT
KBC BE
Aviva GB
VRUnion DE
Vanguard US
Pictet CH
ORIX Robeco JP
MMCMercer US
La Caixa ES
Northern Trust US
Cr Suisse CH
Flossbach von Storch DE
New York Life Candriam US
Carmignac FR
PIMCO US
Bridgewater US
State Street US
Fundsmith GB
UBI Banca IT
Legal amp General GB
Jupiter Investment GB
Royal London GB
Aegon NL
Algebris GB
252
598
1000
163
433
46
135
102
51
102
27
356
15
161
20
65
3
84
2
69
14405
13638
12296
10521
9059
8694
6764
6573
5512
5505
5211
4773
4515
4412
4367
4061
4023
3913
3854
3329
84
51
46
78
5
2888
2762
2660
2527
2367
broadridgecom
Note Excludes money market funds and ETFs Note Excludes money market funds
Pan-European Master Groups Sales
EUROPEAN FUND MARKET REVIEW
Page 1024
Values
TOP 25
REST
TOTAL
171626
-80785
90841
2017 EDITION
broadridgecom
Figure 16 - TOP 25 FUNDS BY NET SALES IN 2016 (eurom)
Master Groups Fund Name Domicile Strategy Type Launch Date Net Sales
Nordea Nordea 1 - Stable Return Fund LU Active Mix 200511
PIMCO PIMCO GIS Income Fund IE Active Bnd 201211
JP Morgan JPMorgan Investment Funds - Global Macro Opportunities Fund LU Active Mix 199902
Carmignac Carmignac Seacutecuriteacute FR Active Bnd 199504
Invesco Invesco Perpetual Global Targeted Returns GB Active Mix 201309
Intesa SP Eurizon EasyFund - Treasury EUR T1 LU Active Bnd 201503
BlackRock iShares Core SampP 500 UCITS ETF (USD) IE Passive Eq 201005
Bridgewater Bridgewater Pure Alpha Strategy 18 Volatility VG Active Hdge 199112
Fundsmith Fundsmith Equity GB Active Eq 201011
Aegon AEAM Dutch Mortgage Fund NL Active Bnd 201308
Invesco Invesco Global Targeted Returns Fund LU Active Mix 201312
State Street State Street ACS North America Index Equity GB Passive Eq 201603
VRUnion PrivatFonds Kontrolliert DE Active Mix 201007
AXA AB FCP I American Income Portfolio LU Active Bnd 199307
La Caixa CaixaBank Rentas Euribor FI ES Active Bnd 201606
Deutsche AM DWS Top Dividende DE Active Eq 200304
Cr Suisse CS Nova (Lux) Fixed Maturity Bond Fund 2019 LU Active Bnd 201604
Vanguard Vanguard Funds Plc - Vanguard SampP 500 UCITS ETF IE Passive Eq 201205
Aviva Aviva Investors Multi-Strategy Target Return GB Active Mix 201407
Flossbach von Storch Flossbach von Storch SICAV - Multiple Opportunities LU Active Mix 200710
ORIX Robeco Robeco High Yield Bonds LU Active Bnd 199804
BBVA Group BBVA Bonos Internacional Flexible 0-3 FI ES Active Bnd 201505
La Caixa CaixaBank Rentas Euribor 2 FI ES Active Bnd 201609
BlackRock iShares Core MSCI World UCITS ETF IE Passive Eq 200909
PIMCO PIMCO GIS Global Investment Grade Credit IE Active Bnd 200307
10494
6825
5073
5048
4225
4221
4111
3678
3537
3277
3256
3167
2941
2801
2771
2739
2689
2474
2430
2375
2345
2333
2325
2298
2284
Note Excludes money markets funds
Pan-European Fund Leaders Sales
EUROPEAN FUND MARKET REVIEW
Page 1124
2017 EDITION
FIGURE 18 - TOP 10 MASTER GROUPS BY SALES IN 2016 (eurom)
Master Groups NAT Funds Assets Net Sales
BlackRock US
State Street US
Amundi FR
Vanguard US
UBS CH
Deutsche Boumlrse DE
BNP Paribas FR
Deka DE
Swisscanto CH
Soc GenLyxor FR
292
100
105
18
123
1
35
46
4
254
252952
21134
24805
23790
29060
4157
5551
8321
6578
50859
23549
4785
3825
3811
2503
2150
1130
885
617
550
Sum 978 427205 43805
FIGURE 17- TOP 10 FUNDS BY SALES IN 2016 (eurom)
Master Groups Fund Name Net Sales
BlackRock iShares Core SampP 500 UCITS ETF (USD)
Vanguard Vanguard Funds Plc - Vanguard SampP 500 UCITS ETF
BlackRock iShares Core Euro Corporate Bond UCITS ETF
iShares Core MSCI World UCITS ETF
iShares EURO STOXX 50 UCITS ETF (DE)
Soc GenLyxor Lyxor UCITS ETF EURO STOXX 50
BlackRock iShares Euro High Yield Corporate Bond UCITS ETF
iShares MSCI Europe UCITS ETF (Inc)
Deutsche AM db x-trackers EURO STOXX 50reg UCITS ETF (DR)
BlackRock iShares STOXX Europe 600 (DE)
12016
11539
6864
6540
5099
5010
4792
4397
4216
4138
Sum 64610
broadridgecom
Product ThemesExchange Traded Funds
EUROPEAN FUND MARKET REVIEW
Page 1224
2017 EDITION
FIGURE 20 - TOP 10 MASTER GROUPS BY SALES IN 2016 (eurom)
Master Groups NAT Funds Assets Net Sales
Vanguard US
Northern Trust US
UBS CH
State Street US
Swisscanto CH
Legal amp General GB
Laumlnsfoumlrsaumlkrings SE
KBC BE
Den Norske NO
MMCMercer US
34
26
65
55
69
42
5
30
3
3
79794
13382
64896
33689
27722
26645
3767
4440
2023
5483
8966
5174
4820
4687
2510
1755
1591
1179
994
954
Sum 332 261841 32630
FIGURE 19 - TOP 10 FUNDS BY SALES IN 2016 (eurom)
Master Groups Fund Name Net Sales
State Street State Street ACS North America Index Equity
Vanguard Vanguard Investment Series Plc - Vanguard Global Bond Index Fund
Vanguard Investment Series Plc - Vanguard US Treasury Inflation-Protected Securities Index Fund
LloydsSWIP Scottish Widows Corporate Bond Tracker Fund
Northern Trust Northern Trust World Custom ESG Equity Index
HSBC HSBC Japan Index
Northern Trust Northern Trust Developed Real Estate Index UCITS FGR Fund
Northern Trust UCITS Common Contractual Fund - World Equity Index Fund
Vanguard Vanguard Investment Series Plc - Vanguard Emerging Markets Stock Index Fund
Den Norske DNB Global Indeks
316733
164155
144479
107232
102532
87021
86021
78849
78797
76756
Sum 1242575
broadridgecom
Product ThemesIndex Tracking Funds
EUROPEAN FUND MARKET REVIEW
Page 1324
2017 EDITION
FIG 22 - MARKET SHARE OF PASSIVE FUNDS BY ASSETS IN 2016
Index Tracking ETF Active
88
77
8585
FIG 21 - MARKET SHARE OF PASSIVE FUNDS BY ASSETS IN 2002
Index Tracking ETF Active
3311
9696
FIGURE 23 - HISTORICAL NET SALES (eurobn)
2013 2014 2015 2016
Active ETF Index Tracking
26062606
164164 194194
30403040
405405 438438
20172017
652652
363363187187
387387 335335
Note Excludes money market funds
broadridgecom
Product ThemesActive vs Passive
EUROPEAN FUND MARKET REVIEW
Page 1424
2017 EDITION
FIGURE 25 - TOP 10 MASTER GROUPS BY SALES IN 2016 (eurom)
Master Groups NAT Funds Assets Net Sales
Amundi FR
BlackRock US
Nordea SE
ORIX Robeco JP
Aviva GB
Vanguard US
UBS CH
Fidelity US
Goldman Sachs US
PrudentialMampG GB
9
20
9
11
4
3
18
11
7
4
4791
20800
5829
8750
2427
7762
8808
8444
2382
4021
2473
1923
1632
1340
1182
1117
1024
1013
909
816
Sum 96 74014 13429
broadridgecom
FIGURE 24 - TOP 10 FUNDS BY SALES IN 2016 (eurom)
Master Groups Fund Name Net Sales
BlackRock iShares Core MSCI Emerging Markets IMI UCITS ETF
Amundi Amundi ETF MSCI Emerging Markets UCITS ETF
ORIX Robeco Robeco Emerging Conservative Equities
PrudentialMampG Eastspring Investments Global Emerging Markets Dynamic
Aviva Aviva Investors - Emerging Markets Equity Income Fund
Goldman Sachs GS Emerging Markets Broad Equity Portfolio
Nordea Nordea 1 - Stable Emerging Markets Equity Fund
Vanguard Vanguard Investment Series Plc - Vanguard Emerging Markets Stock Index Fund
Amundi Amundi Funds Equity Emerging World
BTPS BT Hermes Global Emerging Markets
199164
150161
107040
106244
95149
94597
91057
78797
74192
56460
Sum 1052862
Product ThemesEquities Emerging Markets
EUROPEAN FUND MARKET REVIEW
Page 1524
2017 EDITION
broadridgecom
FIGURE 27 - TOP 10 MASTER GROUPS BY SALES IN 2016 (eurom)
Master Groups NAT Funds Assets Net Sales
ORIX Robeco JP
Aviva GB
New York Life Candriam US
Cr Suisse CH
AXA FR
Baring US
PrudentialMampG GB
BNY Mellon US
PIMCO US
Generali IT
2
3
2
3
6
4
3
4
1
4
7741
5701
2634
5010
21215
2269
2780
1135
4641
592
2347
1379
1339
1037
835
621
573
536
501
476
Sum 32 53718 9643
FIGURE 26 - TOP 10 FUNDS BY SALES IN 2016 (eurom)
Master Groups Fund Name Net Sales
ORIX Robeco Robeco High Yield Bonds
Aviva Aviva Investors - Global High Yield Bond
New York Life Candriam Candriam Bonds Credit Opportunities
Cr Suisse CS Nova (Lux) Global Senior Loan Fund
AXA AB FCP I Global High Yield Portfolio
PrudentialMampG MampG Global Floating Rate High Yield
PIMCO PIMCO GIS Global High Yield Bond Fund
Baring Barings Global High Yield Credit Strategies
BNY Mellon BNY Mellon Global Short Dated High Yield Bond Fund
JP Morgan JPMorgan Investment Funds - Global High Yield Bond Fund
234531
133173
115777
103450
96531
70438
50130
49268
42600
35957
Sum 931855
Product DevelopmentBonds Global High Yield
EUROPEAN FUND MARKET REVIEW
Page 1624
2017 EDITION
broadridgecom
FIGURES 28 - FUND LAUNCHES amp CLOSURES
Jan 2016 Feb 2016 Mar 2016 Apr 2016 May 2016 Jun 2016 Jul 2016 Aug 2016 Sep 2016 Oct 2016 Nov 2016 Dec 2016
Fund Launches Fund Closures Fund Mergers
6969
185185
191191
114114
118118
223223
5656
175175
197197
104104
156156
194194
6464
178178
182182
7171
187187
200200
8484
168168
213213
4848
123123
133133
9999
159159
186186
9898
122122
192192
7676
189189
182182
8989
186186
193193
FIGURE 29 - TOP SELLING NEW FUND LAUNCHES IN 2016 (eurom)
Fund Name Fund Domicile Launch Date Net Sales
CS Nova (Lux) Fixed Maturity Bond Fund 2019 Luxembourg 201604
CaixaBank Rentas Euribor 2 FI Spain 201609
CaixaBank Rentas Euribor FI Spain 201606
DWS FlexPension II 2031 Luxembourg 201607
GS USD Treasury Instruments Liquid Reserves Ireland 201605
Multi Manager Access II - High Yield Luxembourg 201604
State Street ACS North America Index Equity United Kingdom 201603
UBI SICAV - Euro Corporate Bond High Potential Luxembourg 201605
UniInstitutional Euro Reserve Plus Germany 201602
Vanguard Investment Series Plc - Vanguard US Treasury Inflation-Protected Securities Index Fund Ireland 201610
2689
2325
2771
1734
1717
3832
3167
1361
3407
1445
Product Development
EUROPEAN FUND MARKET REVIEW
Page 1724
FIGURE 32 - NUMBER OF FUND LAUNCHES BY MAIN ASSET CLASS
2011 2012 2013 2014 2015 2016
Bond Equity Mixed Assets
675675
926926
456456
733733
659659
463463
718718 725725
541541
665665
851851
578578 579579
927927
640640
494494
664664
505505
2017 EDITION
broadridgecom
FIGURE 32 - FUND LAUNCHES BY REGION IN 2016 (eurom)
Fund Region Funds Net Sales
Europe
International
1217
1069
98667
75333
Sum 2286 174000
FIGURE 31 - NUMBER OF FUND LAUNCHES BY STRATEGY
Active ETF Index Tracking
20832083
125125
7878
FIGURE 30 - FUND LAUNCHES BY GROUP IN 2016 (eurom)
Master Group Funds Net Sales
Intesa SP
BNP Paribas
Pioneer
Allianz GI
Cr Suisse
State Street
UBS
GAM Holding
VRUnion
La Caixa
UBI Banca
93
72
34
29
29
23
22
21
18
13
10
1637657
356485
524480
348767
670371
362228
489178
428731
437740
604485
510552
Sum 364 6370676
Product Development
EUROPEAN FUND MARKET REVIEW
Page 1824
Values
TOP 25
REST
TOTAL
130117
-89556
40561
Values
TOP 25
REST
TOTAL
105357
-99044
6312
broadridgecom
FIG 34 - TOP CROSS-BORDER GROUPS BY SALES IN 2016 (eurom) - INC ETFs
Master Groups NAT Funds Net Sales
BlackRock US
Nordea SE
Vanguard US
KBC BE
ORIX Robeco JP
Aviva GB
Pictet CH
MMCMercer US
Cr Suisse CH
State Street US
Amundi FR
Carmignac FR
Bridgewater US
PIMCO US
New York Life Candriam US
Northern Trust US
AXA FR
Old Mutual ZA
Algebris GB
Muzinich US
AQR Capital US
Soc GenLyxor FR
Cr Mutuel FR
Aeris CH
Baring US
440
94
51
79
73
30
101
51
128
161
225
20
3
67
98
19
198
40
5
15
15120
13681
11211
10168
7641
7454
6796
5512
5439
4955
4520
4367
4023
3956
3602
3473
3359
2368
2367
2210
12
305
83
3
56
1802
1632
1547
1503
1410
FIG 33 - TOP CROSS-BORDER GROUPS BY SALES IN 2016 (eurom) - Ex ETFs
Master Groups NAT Funds Net Sales
Nordea SE
KBC BE
ORIX Robeco JP
Aviva GB
Vanguard US
Pictet CH
MMCMercer US
Cr Suisse CH
Carmignac FR
PIMCO US
Bridgewater US
New York Life Candriam US
Northern Trust US
AXA FR
Old Mutual ZA
Algebris GB
Muzinich US
AQR Capital US
Cr Mutuel FR
Aeris CH
Baring US
SYQUANT FR
BTPS BT GB
Jupiter Investment GB
Dimensional US
94
79
73
30
33
101
51
128
20
65
3
98
19
198
40
5
15
12
83
3
13681
10168
7641
7454
7400
6796
5512
5439
4367
4061
4023
3602
3473
3359
2368
2367
2210
1802
1547
1503
56
3
15
19
19
1410
1315
1300
1294
1264
Note exclude money markets funds and ETF Note exclude money market funds
2017 EDITION
Cross-Border Progress
Cross-Border Progress
Group Winners
EUROPEAN FUND MARKET REVIEW
Page 1924
broadridgecom
FIGURE 35 - NET SALES OF CROSS-BORDER GROUPS BY MARKET IN 2016 - ALL FUNDS (eurobn)
-14 0 14 28 42
Cross Border Domestic Round Trip
ItalyGermany
NetherlandsAustria
BelgiumSweden
SpainFrance
United KingdomSwitzerland
FIGURE 36 - NET SALES OF CROSS-BORDER GROUPS BY MARKET IN 2016 - EQUITY ONLY (eurobn)
-284 -213 -142 -71 0 71
Cross Border Domestic Round Trip
GermanySweden
NetherlandsBelgiumAustria
ItalySpain
FranceSwitzerland
United Kingdom
FIGURE 37 - NET SALES OF CROSS-BORDER GROUPS BY MARKET IN 2016 - BOND ONLY (eurobn)
-67 0 67 134 201 268
Cross Border Domestic Round Trip
ItalySpain
United KingdomBelgium
GermanyAustria
NetherlandsSweden
SwitzerlandFrance
Note Excludes money market funds amp ETFs
1 Foreign activity is actual sales as measured bythe Broadridge SalesWatch Confidential Service
2 The 60 members are estimated to account for75-80 of the total cross-border sales activity
Cross-Border Progress
Cross-Border Progress
Cross-Border Share of Sales in Europe
Page 2024
broadridgecom
FIGURE 36 - DOM FRANCE
Domestic Net Sales
Equities Alternative
Protected Fund
Bonds Inflation Linked
Equities France MidSmall Caps
Asset Allocation Alternative
2310
2019
918
776
444
FIGURE 36 - DOM GERMANY
Domestic Net Sales
Asset Allocation Alternative
Mixed Assets Conservative
Real Estate
Bonds EUR
Equities Global Income
5295
3075
1984
1982
1254
FIGURE 36 - DOM ITALY
Domestic Net Sales
Bonds Global Currencies
Mixed Assets Target Maturity
Mixed Assets Conservative
Bonds Emerging Markets
Bonds EUR Corp Inv Grade
7510
4672
3890
2541
1842
FIGURE 36 - DOM SWITZERLAND
Domestic Net Sales
Equities Switzerland
Bonds Global Corporates
Bonds Emerging Markets
Equities Emerging Markets
Bonds CHF
233338
172162
133284
94704
91618
FIGURE 36 - DOM UNITED KINGDOM
Domestic Net Sales
Asset Allocation Alternative
Equities North America
Equities Alternative
Bonds UK Gilt
Bonds Inflation Linked
1041258
207514
186569
179868
170941
FIGURE 36 - SW SECTOR FRANCE
Cross-Border Real Sales
Bonds Global Currencies
Asset Allocation
Bonds Inflation Linked
Equities Europe Income
Bonds Emerging Markets
Confidential
Confidential
Confidential
Confidential
Confidential
FIGURE 36 - SW SECTOR ITALY
Cross-Border Real Sales
Asset Allocation
Bonds EUR Short-Term
Mixed Assets Conservative
Bonds EUR Corp High Yield
Bonds Global Corporates
Confidential
Confidential
Confidential
Confidential
Confidential
FIGURE 36 - SW SECTOR GERMANY
Cross-Border Real Sales
Mixed Assets Income
Asset Allocation Alternative
Bonds EUR Corp High Yield
Bonds Global High Yield
Bonds Emerging Markets
Confidential
Confidential
Confidential
Confidential
Confidential
FIGURE 36 - SW SECTOR SWITZWELAND
Cross-Border Real Sales
Asset Allocation
Bonds Global High Yield
Bonds Global Corporates
Equities Emerging Markets
Bonds Target Maturity
Confidential
Confidential
Confidential
Confidential
Confidential
FIGURE 36 - SW SECTOR UK
Cross-Border Real Sales
Equities Alternative
Bonds Emerging Markets - Local Currency
Bonds Global Corporates
Bonds Emerging Markets
Asset Allocation
Confidential
Confidential
Confidential
Confidential
Confidential
FRANCE
FIGURE 38 - TOP 5 DOMESTIC AND CROSS-BORDERS SECTORS IN THE MAJOR MARKETS (eurom)
GERMANY
ITALY
SWITZERLAND
UNITED KINGDOM
Real Sales dataavailable to SalesWatchmembers only
Cross-Border ProgressDomestic vs Cross-Border Sectors
Page 2124
2017 EDITION
broadridgecom
The following report is based on the unique fund analytics delivered throughBroadridge Global Market Intelligence (GMI) our leading global fundanalytics database The charts and tables in this report reflect only the tip ofthe iceberg in terms of the depth and breadth available from Broadridge GMIThe report offers a high-level overview of European fund flow activity in2016
Global Market Intelligence (GMI) helps you make more strategic decisionsmore effectively allocate your companyrsquos resources and most importantlybe more responsive to your customersrsquo needs all through the combining thepower of the FundFile and SalesWatch datasets
Broadridge FundFile enables deep fund flows analysis of all keygeographical markets covering Asia Pacific Latin America the Middle Eastand Africa and North America and delivers a truly global fund flows solutionBy gradually building the international reach of its global sales data andmaintaining its high quality and ease of use over the past ten years FundFilehas become the unparalleled source of data and analysis with informationon more than 100000 funds
The cross-border dimension of the European funds industryndashtheldquointernationalrdquo fund marketndashcan truly be assessed only with BroadridgeSalesWatch a unique cooperative and confidential benchmarking servicethat allows leading fund groups to track their cross-border sales and assetsagainst their competitorsrsquo by country distribution channel institutional versusretail activity and both gross and net sales This service now counts 60 ofthe leading asset managers among its members (Some sample data takenfrom the tool can be seen on pages 20 and 21 of the current report)
1 All data is at December 2016 unless otherwise stated
2 lsquoInternationalrsquo fund market Broadridge defines an International fund as afund that sources less than 80 of its assets from any single country Somefund groups have domestic and international funds
3 lsquoDomesticrsquo fund market If a fund sources more than 80 of its assets from asingle country then the fund is allocated to that market regardless of itsdomicile
4 Funds of funds have been excluded from all charts and tables (to avoiddouble counting) unless otherwise stated Therefore a market total is the sumof all the investment categories excluding the three funds of funds categories(in-house ex-house and hedge)
5 The investment category lsquootherrsquo includes a variety of different productcategories For most markets especially Belgium Spain and France the figurecomprises guaranteed funds but there are also derivatives and other specialityfunds in the lsquootherrsquo category
6 Property funds are open-ended property funds only
7 Master group Analysis that aggregates the European mutual fund assetsunder the umbrella of their parent company name
8 ETFs are included in broadridgersquos database on mutual funds but thisexcludes exchange-traded commodity products that are not mutual funds
9 References to foreign activity relate to actual sales as measured byBroadridgersquos SalesWatch confidential service The 60 SalesWatch membersare estimated to account for 75-80 of total cross-border sales activity
Footnotes About the Report
EUROPEAN FUND MARKET REVIEW
Page 2224
broadridgecom
Page 2324
broadridgecom
2017 EDITION
Global Market Intelligence reflects our expertiseand understanding of markets worldwide and ofthe evolving needs of asset managers
To learn more and to schedule a free demo ofGlobal Marketing Intelligence visitwwwbroadridgecomGMI today
For more information please contactlauracohenbroadridgecom
No part of this document may be distributed reproduced or posted without the expresswritten permission of Broadridge Financial Solutions Inc copy2017 Broadridge Financial Solutions Inc Broadridge and the Broadridge logo areregistered trademarks of Broadridge Financial Solutions Inc
FundFile SalesWatch
Global
Market
Intelligence
EUROPEAN FUND MARKET REVIEW
Page 2424

2017 EDITION
FIGURE 13 - TOP AND BOTTOM FIVE SECTORS BY SALES IN 2016 (eurom)
MM
GBP
MM
Eur
o
Asse
t Allo
c Alt
MM
USD
Eq E
m M
kt
Bnd
USD
Corp
HY
Bnd
Flex
Eq Ja
pan
Bnd
Eur
Eq E
urop
e
0
25
50
broadridgecom
FIGURE 12 - TOP SECTORS BY SALES IN 2016 (eurom)
Year
Fund Sector
2015 2016
Net Sales Net Sales Rank Net Sales Net Sales Rank
Money Market GBP
Money Market EUR
Asset Allocation Alternative
Money Market USD
Equities Emerging Markets
Bonds Global Currencies
Bonds Global Corporates
Bonds Emerging Markets
Asset Allocation
Bonds EUR Short-Term
Mixed Assets Conservative
Bonds Inflation Linked
Equities Global
Bonds EUR Corp Inv Grade
Bonds USD
Commodities
Fund of Funds Balanced
Bonds Target Maturity
Fund of Funds Bonds
Bonds Global High Yield
Fund of Funds Asset Allocation
Equities Alternative
21223
35123
53618
32807
-7062
16372
5765
-6289
53125
3817
28844
2545
-6589
7589
1203
2261
24274
-10629
8219
-1241
13
4
1
6
219
15
29
217
2
34
8
40
218
22
58
43
11
223
20
203
43475
37420
34514
17428
15047
15019
14195
12193
12135
11513
11323
10233
10150
8583
8430
7958
7957
7926
7850
7593
1
2
3
4
5
6
7
8
9
10
11
12
13
14
15
16
17
18
19
20
25359
30561
9
7
6916
6717
21
22
All Sector Ranking
EUROPEAN FUND MARKET REVIEW
Page 924
Values
TOP 25
REST
TOTAL
171626
-80785
90841
Values
TOP 25
REST
TOTAL
148629
-96455
52174
2017 EDITION
FIG 15 - TOP MASTER GROUPS BY SALES IN 2016 (eurom) - INC ETFs
Master Groups NAT Funds Net Sales
BlackRock US
Nordea SE
Intesa SP IT
Vanguard US
KBC BE
Aviva GB
VRUnion DE
State Street US
Pictet CH
ORIX Robeco JP
MMCMercer US
La Caixa ES
Northern Trust US
Cr Suisse CH
Flossbach von Storch DE
New York Life Candriam US
Carmignac FR
Bridgewater US
PIMCO US
Fundsmith GB
UBI Banca IT
Amundi FR
Legal amp General GB
Jupiter Investment GB
Royal London GB
522
252
598
64
1000
163
434
184
135
102
51
102
27
357
15
161
20
3
67
2
16190
14405
13638
12506
12296
10521
9056
8698
6764
6573
5512
5505
5211
4968
4515
4412
4367
4023
3956
3854
69
615
84
51
46
3329
3018
2888
2762
2660
FIG 14 - TOP MASTER GROUPS BY SALES IN 2016 (eurom) - EX ETFs
Master Groups NAT Funds Net Sales
Nordea SE
Intesa SP IT
KBC BE
Aviva GB
VRUnion DE
Vanguard US
Pictet CH
ORIX Robeco JP
MMCMercer US
La Caixa ES
Northern Trust US
Cr Suisse CH
Flossbach von Storch DE
New York Life Candriam US
Carmignac FR
PIMCO US
Bridgewater US
State Street US
Fundsmith GB
UBI Banca IT
Legal amp General GB
Jupiter Investment GB
Royal London GB
Aegon NL
Algebris GB
252
598
1000
163
433
46
135
102
51
102
27
356
15
161
20
65
3
84
2
69
14405
13638
12296
10521
9059
8694
6764
6573
5512
5505
5211
4773
4515
4412
4367
4061
4023
3913
3854
3329
84
51
46
78
5
2888
2762
2660
2527
2367
broadridgecom
Note Excludes money market funds and ETFs Note Excludes money market funds
Pan-European Master Groups Sales
EUROPEAN FUND MARKET REVIEW
Page 1024
Values
TOP 25
REST
TOTAL
171626
-80785
90841
2017 EDITION
broadridgecom
Figure 16 - TOP 25 FUNDS BY NET SALES IN 2016 (eurom)
Master Groups Fund Name Domicile Strategy Type Launch Date Net Sales
Nordea Nordea 1 - Stable Return Fund LU Active Mix 200511
PIMCO PIMCO GIS Income Fund IE Active Bnd 201211
JP Morgan JPMorgan Investment Funds - Global Macro Opportunities Fund LU Active Mix 199902
Carmignac Carmignac Seacutecuriteacute FR Active Bnd 199504
Invesco Invesco Perpetual Global Targeted Returns GB Active Mix 201309
Intesa SP Eurizon EasyFund - Treasury EUR T1 LU Active Bnd 201503
BlackRock iShares Core SampP 500 UCITS ETF (USD) IE Passive Eq 201005
Bridgewater Bridgewater Pure Alpha Strategy 18 Volatility VG Active Hdge 199112
Fundsmith Fundsmith Equity GB Active Eq 201011
Aegon AEAM Dutch Mortgage Fund NL Active Bnd 201308
Invesco Invesco Global Targeted Returns Fund LU Active Mix 201312
State Street State Street ACS North America Index Equity GB Passive Eq 201603
VRUnion PrivatFonds Kontrolliert DE Active Mix 201007
AXA AB FCP I American Income Portfolio LU Active Bnd 199307
La Caixa CaixaBank Rentas Euribor FI ES Active Bnd 201606
Deutsche AM DWS Top Dividende DE Active Eq 200304
Cr Suisse CS Nova (Lux) Fixed Maturity Bond Fund 2019 LU Active Bnd 201604
Vanguard Vanguard Funds Plc - Vanguard SampP 500 UCITS ETF IE Passive Eq 201205
Aviva Aviva Investors Multi-Strategy Target Return GB Active Mix 201407
Flossbach von Storch Flossbach von Storch SICAV - Multiple Opportunities LU Active Mix 200710
ORIX Robeco Robeco High Yield Bonds LU Active Bnd 199804
BBVA Group BBVA Bonos Internacional Flexible 0-3 FI ES Active Bnd 201505
La Caixa CaixaBank Rentas Euribor 2 FI ES Active Bnd 201609
BlackRock iShares Core MSCI World UCITS ETF IE Passive Eq 200909
PIMCO PIMCO GIS Global Investment Grade Credit IE Active Bnd 200307
10494
6825
5073
5048
4225
4221
4111
3678
3537
3277
3256
3167
2941
2801
2771
2739
2689
2474
2430
2375
2345
2333
2325
2298
2284
Note Excludes money markets funds
Pan-European Fund Leaders Sales
EUROPEAN FUND MARKET REVIEW
Page 1124
2017 EDITION
FIGURE 18 - TOP 10 MASTER GROUPS BY SALES IN 2016 (eurom)
Master Groups NAT Funds Assets Net Sales
BlackRock US
State Street US
Amundi FR
Vanguard US
UBS CH
Deutsche Boumlrse DE
BNP Paribas FR
Deka DE
Swisscanto CH
Soc GenLyxor FR
292
100
105
18
123
1
35
46
4
254
252952
21134
24805
23790
29060
4157
5551
8321
6578
50859
23549
4785
3825
3811
2503
2150
1130
885
617
550
Sum 978 427205 43805
FIGURE 17- TOP 10 FUNDS BY SALES IN 2016 (eurom)
Master Groups Fund Name Net Sales
BlackRock iShares Core SampP 500 UCITS ETF (USD)
Vanguard Vanguard Funds Plc - Vanguard SampP 500 UCITS ETF
BlackRock iShares Core Euro Corporate Bond UCITS ETF
iShares Core MSCI World UCITS ETF
iShares EURO STOXX 50 UCITS ETF (DE)
Soc GenLyxor Lyxor UCITS ETF EURO STOXX 50
BlackRock iShares Euro High Yield Corporate Bond UCITS ETF
iShares MSCI Europe UCITS ETF (Inc)
Deutsche AM db x-trackers EURO STOXX 50reg UCITS ETF (DR)
BlackRock iShares STOXX Europe 600 (DE)
12016
11539
6864
6540
5099
5010
4792
4397
4216
4138
Sum 64610
broadridgecom
Product ThemesExchange Traded Funds
EUROPEAN FUND MARKET REVIEW
Page 1224
2017 EDITION
FIGURE 20 - TOP 10 MASTER GROUPS BY SALES IN 2016 (eurom)
Master Groups NAT Funds Assets Net Sales
Vanguard US
Northern Trust US
UBS CH
State Street US
Swisscanto CH
Legal amp General GB
Laumlnsfoumlrsaumlkrings SE
KBC BE
Den Norske NO
MMCMercer US
34
26
65
55
69
42
5
30
3
3
79794
13382
64896
33689
27722
26645
3767
4440
2023
5483
8966
5174
4820
4687
2510
1755
1591
1179
994
954
Sum 332 261841 32630
FIGURE 19 - TOP 10 FUNDS BY SALES IN 2016 (eurom)
Master Groups Fund Name Net Sales
State Street State Street ACS North America Index Equity
Vanguard Vanguard Investment Series Plc - Vanguard Global Bond Index Fund
Vanguard Investment Series Plc - Vanguard US Treasury Inflation-Protected Securities Index Fund
LloydsSWIP Scottish Widows Corporate Bond Tracker Fund
Northern Trust Northern Trust World Custom ESG Equity Index
HSBC HSBC Japan Index
Northern Trust Northern Trust Developed Real Estate Index UCITS FGR Fund
Northern Trust UCITS Common Contractual Fund - World Equity Index Fund
Vanguard Vanguard Investment Series Plc - Vanguard Emerging Markets Stock Index Fund
Den Norske DNB Global Indeks
316733
164155
144479
107232
102532
87021
86021
78849
78797
76756
Sum 1242575
broadridgecom
Product ThemesIndex Tracking Funds
EUROPEAN FUND MARKET REVIEW
Page 1324
2017 EDITION
FIG 22 - MARKET SHARE OF PASSIVE FUNDS BY ASSETS IN 2016
Index Tracking ETF Active
88
77
8585
FIG 21 - MARKET SHARE OF PASSIVE FUNDS BY ASSETS IN 2002
Index Tracking ETF Active
3311
9696
FIGURE 23 - HISTORICAL NET SALES (eurobn)
2013 2014 2015 2016
Active ETF Index Tracking
26062606
164164 194194
30403040
405405 438438
20172017
652652
363363187187
387387 335335
Note Excludes money market funds
broadridgecom
Product ThemesActive vs Passive
EUROPEAN FUND MARKET REVIEW
Page 1424
2017 EDITION
FIGURE 25 - TOP 10 MASTER GROUPS BY SALES IN 2016 (eurom)
Master Groups NAT Funds Assets Net Sales
Amundi FR
BlackRock US
Nordea SE
ORIX Robeco JP
Aviva GB
Vanguard US
UBS CH
Fidelity US
Goldman Sachs US
PrudentialMampG GB
9
20
9
11
4
3
18
11
7
4
4791
20800
5829
8750
2427
7762
8808
8444
2382
4021
2473
1923
1632
1340
1182
1117
1024
1013
909
816
Sum 96 74014 13429
broadridgecom
FIGURE 24 - TOP 10 FUNDS BY SALES IN 2016 (eurom)
Master Groups Fund Name Net Sales
BlackRock iShares Core MSCI Emerging Markets IMI UCITS ETF
Amundi Amundi ETF MSCI Emerging Markets UCITS ETF
ORIX Robeco Robeco Emerging Conservative Equities
PrudentialMampG Eastspring Investments Global Emerging Markets Dynamic
Aviva Aviva Investors - Emerging Markets Equity Income Fund
Goldman Sachs GS Emerging Markets Broad Equity Portfolio
Nordea Nordea 1 - Stable Emerging Markets Equity Fund
Vanguard Vanguard Investment Series Plc - Vanguard Emerging Markets Stock Index Fund
Amundi Amundi Funds Equity Emerging World
BTPS BT Hermes Global Emerging Markets
199164
150161
107040
106244
95149
94597
91057
78797
74192
56460
Sum 1052862
Product ThemesEquities Emerging Markets
EUROPEAN FUND MARKET REVIEW
Page 1524
2017 EDITION
broadridgecom
FIGURE 27 - TOP 10 MASTER GROUPS BY SALES IN 2016 (eurom)
Master Groups NAT Funds Assets Net Sales
ORIX Robeco JP
Aviva GB
New York Life Candriam US
Cr Suisse CH
AXA FR
Baring US
PrudentialMampG GB
BNY Mellon US
PIMCO US
Generali IT
2
3
2
3
6
4
3
4
1
4
7741
5701
2634
5010
21215
2269
2780
1135
4641
592
2347
1379
1339
1037
835
621
573
536
501
476
Sum 32 53718 9643
FIGURE 26 - TOP 10 FUNDS BY SALES IN 2016 (eurom)
Master Groups Fund Name Net Sales
ORIX Robeco Robeco High Yield Bonds
Aviva Aviva Investors - Global High Yield Bond
New York Life Candriam Candriam Bonds Credit Opportunities
Cr Suisse CS Nova (Lux) Global Senior Loan Fund
AXA AB FCP I Global High Yield Portfolio
PrudentialMampG MampG Global Floating Rate High Yield
PIMCO PIMCO GIS Global High Yield Bond Fund
Baring Barings Global High Yield Credit Strategies
BNY Mellon BNY Mellon Global Short Dated High Yield Bond Fund
JP Morgan JPMorgan Investment Funds - Global High Yield Bond Fund
234531
133173
115777
103450
96531
70438
50130
49268
42600
35957
Sum 931855
Product DevelopmentBonds Global High Yield
EUROPEAN FUND MARKET REVIEW
Page 1624
2017 EDITION
broadridgecom
FIGURES 28 - FUND LAUNCHES amp CLOSURES
Jan 2016 Feb 2016 Mar 2016 Apr 2016 May 2016 Jun 2016 Jul 2016 Aug 2016 Sep 2016 Oct 2016 Nov 2016 Dec 2016
Fund Launches Fund Closures Fund Mergers
6969
185185
191191
114114
118118
223223
5656
175175
197197
104104
156156
194194
6464
178178
182182
7171
187187
200200
8484
168168
213213
4848
123123
133133
9999
159159
186186
9898
122122
192192
7676
189189
182182
8989
186186
193193
FIGURE 29 - TOP SELLING NEW FUND LAUNCHES IN 2016 (eurom)
Fund Name Fund Domicile Launch Date Net Sales
CS Nova (Lux) Fixed Maturity Bond Fund 2019 Luxembourg 201604
CaixaBank Rentas Euribor 2 FI Spain 201609
CaixaBank Rentas Euribor FI Spain 201606
DWS FlexPension II 2031 Luxembourg 201607
GS USD Treasury Instruments Liquid Reserves Ireland 201605
Multi Manager Access II - High Yield Luxembourg 201604
State Street ACS North America Index Equity United Kingdom 201603
UBI SICAV - Euro Corporate Bond High Potential Luxembourg 201605
UniInstitutional Euro Reserve Plus Germany 201602
Vanguard Investment Series Plc - Vanguard US Treasury Inflation-Protected Securities Index Fund Ireland 201610
2689
2325
2771
1734
1717
3832
3167
1361
3407
1445
Product Development
EUROPEAN FUND MARKET REVIEW
Page 1724
FIGURE 32 - NUMBER OF FUND LAUNCHES BY MAIN ASSET CLASS
2011 2012 2013 2014 2015 2016
Bond Equity Mixed Assets
675675
926926
456456
733733
659659
463463
718718 725725
541541
665665
851851
578578 579579
927927
640640
494494
664664
505505
2017 EDITION
broadridgecom
FIGURE 32 - FUND LAUNCHES BY REGION IN 2016 (eurom)
Fund Region Funds Net Sales
Europe
International
1217
1069
98667
75333
Sum 2286 174000
FIGURE 31 - NUMBER OF FUND LAUNCHES BY STRATEGY
Active ETF Index Tracking
20832083
125125
7878
FIGURE 30 - FUND LAUNCHES BY GROUP IN 2016 (eurom)
Master Group Funds Net Sales
Intesa SP
BNP Paribas
Pioneer
Allianz GI
Cr Suisse
State Street
UBS
GAM Holding
VRUnion
La Caixa
UBI Banca
93
72
34
29
29
23
22
21
18
13
10
1637657
356485
524480
348767
670371
362228
489178
428731
437740
604485
510552
Sum 364 6370676
Product Development
EUROPEAN FUND MARKET REVIEW
Page 1824
Values
TOP 25
REST
TOTAL
130117
-89556
40561
Values
TOP 25
REST
TOTAL
105357
-99044
6312
broadridgecom
FIG 34 - TOP CROSS-BORDER GROUPS BY SALES IN 2016 (eurom) - INC ETFs
Master Groups NAT Funds Net Sales
BlackRock US
Nordea SE
Vanguard US
KBC BE
ORIX Robeco JP
Aviva GB
Pictet CH
MMCMercer US
Cr Suisse CH
State Street US
Amundi FR
Carmignac FR
Bridgewater US
PIMCO US
New York Life Candriam US
Northern Trust US
AXA FR
Old Mutual ZA
Algebris GB
Muzinich US
AQR Capital US
Soc GenLyxor FR
Cr Mutuel FR
Aeris CH
Baring US
440
94
51
79
73
30
101
51
128
161
225
20
3
67
98
19
198
40
5
15
15120
13681
11211
10168
7641
7454
6796
5512
5439
4955
4520
4367
4023
3956
3602
3473
3359
2368
2367
2210
12
305
83
3
56
1802
1632
1547
1503
1410
FIG 33 - TOP CROSS-BORDER GROUPS BY SALES IN 2016 (eurom) - Ex ETFs
Master Groups NAT Funds Net Sales
Nordea SE
KBC BE
ORIX Robeco JP
Aviva GB
Vanguard US
Pictet CH
MMCMercer US
Cr Suisse CH
Carmignac FR
PIMCO US
Bridgewater US
New York Life Candriam US
Northern Trust US
AXA FR
Old Mutual ZA
Algebris GB
Muzinich US
AQR Capital US
Cr Mutuel FR
Aeris CH
Baring US
SYQUANT FR
BTPS BT GB
Jupiter Investment GB
Dimensional US
94
79
73
30
33
101
51
128
20
65
3
98
19
198
40
5
15
12
83
3
13681
10168
7641
7454
7400
6796
5512
5439
4367
4061
4023
3602
3473
3359
2368
2367
2210
1802
1547
1503
56
3
15
19
19
1410
1315
1300
1294
1264
Note exclude money markets funds and ETF Note exclude money market funds
2017 EDITION
Cross-Border Progress
Cross-Border Progress
Group Winners
EUROPEAN FUND MARKET REVIEW
Page 1924
broadridgecom
FIGURE 35 - NET SALES OF CROSS-BORDER GROUPS BY MARKET IN 2016 - ALL FUNDS (eurobn)
-14 0 14 28 42
Cross Border Domestic Round Trip
ItalyGermany
NetherlandsAustria
BelgiumSweden
SpainFrance
United KingdomSwitzerland
FIGURE 36 - NET SALES OF CROSS-BORDER GROUPS BY MARKET IN 2016 - EQUITY ONLY (eurobn)
-284 -213 -142 -71 0 71
Cross Border Domestic Round Trip
GermanySweden
NetherlandsBelgiumAustria
ItalySpain
FranceSwitzerland
United Kingdom
FIGURE 37 - NET SALES OF CROSS-BORDER GROUPS BY MARKET IN 2016 - BOND ONLY (eurobn)
-67 0 67 134 201 268
Cross Border Domestic Round Trip
ItalySpain
United KingdomBelgium
GermanyAustria
NetherlandsSweden
SwitzerlandFrance
Note Excludes money market funds amp ETFs
1 Foreign activity is actual sales as measured bythe Broadridge SalesWatch Confidential Service
2 The 60 members are estimated to account for75-80 of the total cross-border sales activity
Cross-Border Progress
Cross-Border Progress
Cross-Border Share of Sales in Europe
Page 2024
broadridgecom
FIGURE 36 - DOM FRANCE
Domestic Net Sales
Equities Alternative
Protected Fund
Bonds Inflation Linked
Equities France MidSmall Caps
Asset Allocation Alternative
2310
2019
918
776
444
FIGURE 36 - DOM GERMANY
Domestic Net Sales
Asset Allocation Alternative
Mixed Assets Conservative
Real Estate
Bonds EUR
Equities Global Income
5295
3075
1984
1982
1254
FIGURE 36 - DOM ITALY
Domestic Net Sales
Bonds Global Currencies
Mixed Assets Target Maturity
Mixed Assets Conservative
Bonds Emerging Markets
Bonds EUR Corp Inv Grade
7510
4672
3890
2541
1842
FIGURE 36 - DOM SWITZERLAND
Domestic Net Sales
Equities Switzerland
Bonds Global Corporates
Bonds Emerging Markets
Equities Emerging Markets
Bonds CHF
233338
172162
133284
94704
91618
FIGURE 36 - DOM UNITED KINGDOM
Domestic Net Sales
Asset Allocation Alternative
Equities North America
Equities Alternative
Bonds UK Gilt
Bonds Inflation Linked
1041258
207514
186569
179868
170941
FIGURE 36 - SW SECTOR FRANCE
Cross-Border Real Sales
Bonds Global Currencies
Asset Allocation
Bonds Inflation Linked
Equities Europe Income
Bonds Emerging Markets
Confidential
Confidential
Confidential
Confidential
Confidential
FIGURE 36 - SW SECTOR ITALY
Cross-Border Real Sales
Asset Allocation
Bonds EUR Short-Term
Mixed Assets Conservative
Bonds EUR Corp High Yield
Bonds Global Corporates
Confidential
Confidential
Confidential
Confidential
Confidential
FIGURE 36 - SW SECTOR GERMANY
Cross-Border Real Sales
Mixed Assets Income
Asset Allocation Alternative
Bonds EUR Corp High Yield
Bonds Global High Yield
Bonds Emerging Markets
Confidential
Confidential
Confidential
Confidential
Confidential
FIGURE 36 - SW SECTOR SWITZWELAND
Cross-Border Real Sales
Asset Allocation
Bonds Global High Yield
Bonds Global Corporates
Equities Emerging Markets
Bonds Target Maturity
Confidential
Confidential
Confidential
Confidential
Confidential
FIGURE 36 - SW SECTOR UK
Cross-Border Real Sales
Equities Alternative
Bonds Emerging Markets - Local Currency
Bonds Global Corporates
Bonds Emerging Markets
Asset Allocation
Confidential
Confidential
Confidential
Confidential
Confidential
FRANCE
FIGURE 38 - TOP 5 DOMESTIC AND CROSS-BORDERS SECTORS IN THE MAJOR MARKETS (eurom)
GERMANY
ITALY
SWITZERLAND
UNITED KINGDOM
Real Sales dataavailable to SalesWatchmembers only
Cross-Border ProgressDomestic vs Cross-Border Sectors
Page 2124
2017 EDITION
broadridgecom
The following report is based on the unique fund analytics delivered throughBroadridge Global Market Intelligence (GMI) our leading global fundanalytics database The charts and tables in this report reflect only the tip ofthe iceberg in terms of the depth and breadth available from Broadridge GMIThe report offers a high-level overview of European fund flow activity in2016
Global Market Intelligence (GMI) helps you make more strategic decisionsmore effectively allocate your companyrsquos resources and most importantlybe more responsive to your customersrsquo needs all through the combining thepower of the FundFile and SalesWatch datasets
Broadridge FundFile enables deep fund flows analysis of all keygeographical markets covering Asia Pacific Latin America the Middle Eastand Africa and North America and delivers a truly global fund flows solutionBy gradually building the international reach of its global sales data andmaintaining its high quality and ease of use over the past ten years FundFilehas become the unparalleled source of data and analysis with informationon more than 100000 funds
The cross-border dimension of the European funds industryndashtheldquointernationalrdquo fund marketndashcan truly be assessed only with BroadridgeSalesWatch a unique cooperative and confidential benchmarking servicethat allows leading fund groups to track their cross-border sales and assetsagainst their competitorsrsquo by country distribution channel institutional versusretail activity and both gross and net sales This service now counts 60 ofthe leading asset managers among its members (Some sample data takenfrom the tool can be seen on pages 20 and 21 of the current report)
1 All data is at December 2016 unless otherwise stated
2 lsquoInternationalrsquo fund market Broadridge defines an International fund as afund that sources less than 80 of its assets from any single country Somefund groups have domestic and international funds
3 lsquoDomesticrsquo fund market If a fund sources more than 80 of its assets from asingle country then the fund is allocated to that market regardless of itsdomicile
4 Funds of funds have been excluded from all charts and tables (to avoiddouble counting) unless otherwise stated Therefore a market total is the sumof all the investment categories excluding the three funds of funds categories(in-house ex-house and hedge)
5 The investment category lsquootherrsquo includes a variety of different productcategories For most markets especially Belgium Spain and France the figurecomprises guaranteed funds but there are also derivatives and other specialityfunds in the lsquootherrsquo category
6 Property funds are open-ended property funds only
7 Master group Analysis that aggregates the European mutual fund assetsunder the umbrella of their parent company name
8 ETFs are included in broadridgersquos database on mutual funds but thisexcludes exchange-traded commodity products that are not mutual funds
9 References to foreign activity relate to actual sales as measured byBroadridgersquos SalesWatch confidential service The 60 SalesWatch membersare estimated to account for 75-80 of total cross-border sales activity
Footnotes About the Report
EUROPEAN FUND MARKET REVIEW
Page 2224
broadridgecom
Page 2324
broadridgecom
2017 EDITION
Global Market Intelligence reflects our expertiseand understanding of markets worldwide and ofthe evolving needs of asset managers
To learn more and to schedule a free demo ofGlobal Marketing Intelligence visitwwwbroadridgecomGMI today
For more information please contactlauracohenbroadridgecom
No part of this document may be distributed reproduced or posted without the expresswritten permission of Broadridge Financial Solutions Inc copy2017 Broadridge Financial Solutions Inc Broadridge and the Broadridge logo areregistered trademarks of Broadridge Financial Solutions Inc
FundFile SalesWatch
Global
Market
Intelligence
EUROPEAN FUND MARKET REVIEW
Page 2424

Values
TOP 25
REST
TOTAL
171626
-80785
90841
Values
TOP 25
REST
TOTAL
148629
-96455
52174
2017 EDITION
FIG 15 - TOP MASTER GROUPS BY SALES IN 2016 (eurom) - INC ETFs
Master Groups NAT Funds Net Sales
BlackRock US
Nordea SE
Intesa SP IT
Vanguard US
KBC BE
Aviva GB
VRUnion DE
State Street US
Pictet CH
ORIX Robeco JP
MMCMercer US
La Caixa ES
Northern Trust US
Cr Suisse CH
Flossbach von Storch DE
New York Life Candriam US
Carmignac FR
Bridgewater US
PIMCO US
Fundsmith GB
UBI Banca IT
Amundi FR
Legal amp General GB
Jupiter Investment GB
Royal London GB
522
252
598
64
1000
163
434
184
135
102
51
102
27
357
15
161
20
3
67
2
16190
14405
13638
12506
12296
10521
9056
8698
6764
6573
5512
5505
5211
4968
4515
4412
4367
4023
3956
3854
69
615
84
51
46
3329
3018
2888
2762
2660
FIG 14 - TOP MASTER GROUPS BY SALES IN 2016 (eurom) - EX ETFs
Master Groups NAT Funds Net Sales
Nordea SE
Intesa SP IT
KBC BE
Aviva GB
VRUnion DE
Vanguard US
Pictet CH
ORIX Robeco JP
MMCMercer US
La Caixa ES
Northern Trust US
Cr Suisse CH
Flossbach von Storch DE
New York Life Candriam US
Carmignac FR
PIMCO US
Bridgewater US
State Street US
Fundsmith GB
UBI Banca IT
Legal amp General GB
Jupiter Investment GB
Royal London GB
Aegon NL
Algebris GB
252
598
1000
163
433
46
135
102
51
102
27
356
15
161
20
65
3
84
2
69
14405
13638
12296
10521
9059
8694
6764
6573
5512
5505
5211
4773
4515
4412
4367
4061
4023
3913
3854
3329
84
51
46
78
5
2888
2762
2660
2527
2367
broadridgecom
Note Excludes money market funds and ETFs Note Excludes money market funds
Pan-European Master Groups Sales
EUROPEAN FUND MARKET REVIEW
Page 1024
Values
TOP 25
REST
TOTAL
171626
-80785
90841
2017 EDITION
broadridgecom
Figure 16 - TOP 25 FUNDS BY NET SALES IN 2016 (eurom)
Master Groups Fund Name Domicile Strategy Type Launch Date Net Sales
Nordea Nordea 1 - Stable Return Fund LU Active Mix 200511
PIMCO PIMCO GIS Income Fund IE Active Bnd 201211
JP Morgan JPMorgan Investment Funds - Global Macro Opportunities Fund LU Active Mix 199902
Carmignac Carmignac Seacutecuriteacute FR Active Bnd 199504
Invesco Invesco Perpetual Global Targeted Returns GB Active Mix 201309
Intesa SP Eurizon EasyFund - Treasury EUR T1 LU Active Bnd 201503
BlackRock iShares Core SampP 500 UCITS ETF (USD) IE Passive Eq 201005
Bridgewater Bridgewater Pure Alpha Strategy 18 Volatility VG Active Hdge 199112
Fundsmith Fundsmith Equity GB Active Eq 201011
Aegon AEAM Dutch Mortgage Fund NL Active Bnd 201308
Invesco Invesco Global Targeted Returns Fund LU Active Mix 201312
State Street State Street ACS North America Index Equity GB Passive Eq 201603
VRUnion PrivatFonds Kontrolliert DE Active Mix 201007
AXA AB FCP I American Income Portfolio LU Active Bnd 199307
La Caixa CaixaBank Rentas Euribor FI ES Active Bnd 201606
Deutsche AM DWS Top Dividende DE Active Eq 200304
Cr Suisse CS Nova (Lux) Fixed Maturity Bond Fund 2019 LU Active Bnd 201604
Vanguard Vanguard Funds Plc - Vanguard SampP 500 UCITS ETF IE Passive Eq 201205
Aviva Aviva Investors Multi-Strategy Target Return GB Active Mix 201407
Flossbach von Storch Flossbach von Storch SICAV - Multiple Opportunities LU Active Mix 200710
ORIX Robeco Robeco High Yield Bonds LU Active Bnd 199804
BBVA Group BBVA Bonos Internacional Flexible 0-3 FI ES Active Bnd 201505
La Caixa CaixaBank Rentas Euribor 2 FI ES Active Bnd 201609
BlackRock iShares Core MSCI World UCITS ETF IE Passive Eq 200909
PIMCO PIMCO GIS Global Investment Grade Credit IE Active Bnd 200307
10494
6825
5073
5048
4225
4221
4111
3678
3537
3277
3256
3167
2941
2801
2771
2739
2689
2474
2430
2375
2345
2333
2325
2298
2284
Note Excludes money markets funds
Pan-European Fund Leaders Sales
EUROPEAN FUND MARKET REVIEW
Page 1124
2017 EDITION
FIGURE 18 - TOP 10 MASTER GROUPS BY SALES IN 2016 (eurom)
Master Groups NAT Funds Assets Net Sales
BlackRock US
State Street US
Amundi FR
Vanguard US
UBS CH
Deutsche Boumlrse DE
BNP Paribas FR
Deka DE
Swisscanto CH
Soc GenLyxor FR
292
100
105
18
123
1
35
46
4
254
252952
21134
24805
23790
29060
4157
5551
8321
6578
50859
23549
4785
3825
3811
2503
2150
1130
885
617
550
Sum 978 427205 43805
FIGURE 17- TOP 10 FUNDS BY SALES IN 2016 (eurom)
Master Groups Fund Name Net Sales
BlackRock iShares Core SampP 500 UCITS ETF (USD)
Vanguard Vanguard Funds Plc - Vanguard SampP 500 UCITS ETF
BlackRock iShares Core Euro Corporate Bond UCITS ETF
iShares Core MSCI World UCITS ETF
iShares EURO STOXX 50 UCITS ETF (DE)
Soc GenLyxor Lyxor UCITS ETF EURO STOXX 50
BlackRock iShares Euro High Yield Corporate Bond UCITS ETF
iShares MSCI Europe UCITS ETF (Inc)
Deutsche AM db x-trackers EURO STOXX 50reg UCITS ETF (DR)
BlackRock iShares STOXX Europe 600 (DE)
12016
11539
6864
6540
5099
5010
4792
4397
4216
4138
Sum 64610
broadridgecom
Product ThemesExchange Traded Funds
EUROPEAN FUND MARKET REVIEW
Page 1224
2017 EDITION
FIGURE 20 - TOP 10 MASTER GROUPS BY SALES IN 2016 (eurom)
Master Groups NAT Funds Assets Net Sales
Vanguard US
Northern Trust US
UBS CH
State Street US
Swisscanto CH
Legal amp General GB
Laumlnsfoumlrsaumlkrings SE
KBC BE
Den Norske NO
MMCMercer US
34
26
65
55
69
42
5
30
3
3
79794
13382
64896
33689
27722
26645
3767
4440
2023
5483
8966
5174
4820
4687
2510
1755
1591
1179
994
954
Sum 332 261841 32630
FIGURE 19 - TOP 10 FUNDS BY SALES IN 2016 (eurom)
Master Groups Fund Name Net Sales
State Street State Street ACS North America Index Equity
Vanguard Vanguard Investment Series Plc - Vanguard Global Bond Index Fund
Vanguard Investment Series Plc - Vanguard US Treasury Inflation-Protected Securities Index Fund
LloydsSWIP Scottish Widows Corporate Bond Tracker Fund
Northern Trust Northern Trust World Custom ESG Equity Index
HSBC HSBC Japan Index
Northern Trust Northern Trust Developed Real Estate Index UCITS FGR Fund
Northern Trust UCITS Common Contractual Fund - World Equity Index Fund
Vanguard Vanguard Investment Series Plc - Vanguard Emerging Markets Stock Index Fund
Den Norske DNB Global Indeks
316733
164155
144479
107232
102532
87021
86021
78849
78797
76756
Sum 1242575
broadridgecom
Product ThemesIndex Tracking Funds
EUROPEAN FUND MARKET REVIEW
Page 1324
2017 EDITION
FIG 22 - MARKET SHARE OF PASSIVE FUNDS BY ASSETS IN 2016
Index Tracking ETF Active
88
77
8585
FIG 21 - MARKET SHARE OF PASSIVE FUNDS BY ASSETS IN 2002
Index Tracking ETF Active
3311
9696
FIGURE 23 - HISTORICAL NET SALES (eurobn)
2013 2014 2015 2016
Active ETF Index Tracking
26062606
164164 194194
30403040
405405 438438
20172017
652652
363363187187
387387 335335
Note Excludes money market funds
broadridgecom
Product ThemesActive vs Passive
EUROPEAN FUND MARKET REVIEW
Page 1424
2017 EDITION
FIGURE 25 - TOP 10 MASTER GROUPS BY SALES IN 2016 (eurom)
Master Groups NAT Funds Assets Net Sales
Amundi FR
BlackRock US
Nordea SE
ORIX Robeco JP
Aviva GB
Vanguard US
UBS CH
Fidelity US
Goldman Sachs US
PrudentialMampG GB
9
20
9
11
4
3
18
11
7
4
4791
20800
5829
8750
2427
7762
8808
8444
2382
4021
2473
1923
1632
1340
1182
1117
1024
1013
909
816
Sum 96 74014 13429
broadridgecom
FIGURE 24 - TOP 10 FUNDS BY SALES IN 2016 (eurom)
Master Groups Fund Name Net Sales
BlackRock iShares Core MSCI Emerging Markets IMI UCITS ETF
Amundi Amundi ETF MSCI Emerging Markets UCITS ETF
ORIX Robeco Robeco Emerging Conservative Equities
PrudentialMampG Eastspring Investments Global Emerging Markets Dynamic
Aviva Aviva Investors - Emerging Markets Equity Income Fund
Goldman Sachs GS Emerging Markets Broad Equity Portfolio
Nordea Nordea 1 - Stable Emerging Markets Equity Fund
Vanguard Vanguard Investment Series Plc - Vanguard Emerging Markets Stock Index Fund
Amundi Amundi Funds Equity Emerging World
BTPS BT Hermes Global Emerging Markets
199164
150161
107040
106244
95149
94597
91057
78797
74192
56460
Sum 1052862
Product ThemesEquities Emerging Markets
EUROPEAN FUND MARKET REVIEW
Page 1524
2017 EDITION
broadridgecom
FIGURE 27 - TOP 10 MASTER GROUPS BY SALES IN 2016 (eurom)
Master Groups NAT Funds Assets Net Sales
ORIX Robeco JP
Aviva GB
New York Life Candriam US
Cr Suisse CH
AXA FR
Baring US
PrudentialMampG GB
BNY Mellon US
PIMCO US
Generali IT
2
3
2
3
6
4
3
4
1
4
7741
5701
2634
5010
21215
2269
2780
1135
4641
592
2347
1379
1339
1037
835
621
573
536
501
476
Sum 32 53718 9643
FIGURE 26 - TOP 10 FUNDS BY SALES IN 2016 (eurom)
Master Groups Fund Name Net Sales
ORIX Robeco Robeco High Yield Bonds
Aviva Aviva Investors - Global High Yield Bond
New York Life Candriam Candriam Bonds Credit Opportunities
Cr Suisse CS Nova (Lux) Global Senior Loan Fund
AXA AB FCP I Global High Yield Portfolio
PrudentialMampG MampG Global Floating Rate High Yield
PIMCO PIMCO GIS Global High Yield Bond Fund
Baring Barings Global High Yield Credit Strategies
BNY Mellon BNY Mellon Global Short Dated High Yield Bond Fund
JP Morgan JPMorgan Investment Funds - Global High Yield Bond Fund
234531
133173
115777
103450
96531
70438
50130
49268
42600
35957
Sum 931855
Product DevelopmentBonds Global High Yield
EUROPEAN FUND MARKET REVIEW
Page 1624
2017 EDITION
broadridgecom
FIGURES 28 - FUND LAUNCHES amp CLOSURES
Jan 2016 Feb 2016 Mar 2016 Apr 2016 May 2016 Jun 2016 Jul 2016 Aug 2016 Sep 2016 Oct 2016 Nov 2016 Dec 2016
Fund Launches Fund Closures Fund Mergers
6969
185185
191191
114114
118118
223223
5656
175175
197197
104104
156156
194194
6464
178178
182182
7171
187187
200200
8484
168168
213213
4848
123123
133133
9999
159159
186186
9898
122122
192192
7676
189189
182182
8989
186186
193193
FIGURE 29 - TOP SELLING NEW FUND LAUNCHES IN 2016 (eurom)
Fund Name Fund Domicile Launch Date Net Sales
CS Nova (Lux) Fixed Maturity Bond Fund 2019 Luxembourg 201604
CaixaBank Rentas Euribor 2 FI Spain 201609
CaixaBank Rentas Euribor FI Spain 201606
DWS FlexPension II 2031 Luxembourg 201607
GS USD Treasury Instruments Liquid Reserves Ireland 201605
Multi Manager Access II - High Yield Luxembourg 201604
State Street ACS North America Index Equity United Kingdom 201603
UBI SICAV - Euro Corporate Bond High Potential Luxembourg 201605
UniInstitutional Euro Reserve Plus Germany 201602
Vanguard Investment Series Plc - Vanguard US Treasury Inflation-Protected Securities Index Fund Ireland 201610
2689
2325
2771
1734
1717
3832
3167
1361
3407
1445
Product Development
EUROPEAN FUND MARKET REVIEW
Page 1724
FIGURE 32 - NUMBER OF FUND LAUNCHES BY MAIN ASSET CLASS
2011 2012 2013 2014 2015 2016
Bond Equity Mixed Assets
675675
926926
456456
733733
659659
463463
718718 725725
541541
665665
851851
578578 579579
927927
640640
494494
664664
505505
2017 EDITION
broadridgecom
FIGURE 32 - FUND LAUNCHES BY REGION IN 2016 (eurom)
Fund Region Funds Net Sales
Europe
International
1217
1069
98667
75333
Sum 2286 174000
FIGURE 31 - NUMBER OF FUND LAUNCHES BY STRATEGY
Active ETF Index Tracking
20832083
125125
7878
FIGURE 30 - FUND LAUNCHES BY GROUP IN 2016 (eurom)
Master Group Funds Net Sales
Intesa SP
BNP Paribas
Pioneer
Allianz GI
Cr Suisse
State Street
UBS
GAM Holding
VRUnion
La Caixa
UBI Banca
93
72
34
29
29
23
22
21
18
13
10
1637657
356485
524480
348767
670371
362228
489178
428731
437740
604485
510552
Sum 364 6370676
Product Development
EUROPEAN FUND MARKET REVIEW
Page 1824
Values
TOP 25
REST
TOTAL
130117
-89556
40561
Values
TOP 25
REST
TOTAL
105357
-99044
6312
broadridgecom
FIG 34 - TOP CROSS-BORDER GROUPS BY SALES IN 2016 (eurom) - INC ETFs
Master Groups NAT Funds Net Sales
BlackRock US
Nordea SE
Vanguard US
KBC BE
ORIX Robeco JP
Aviva GB
Pictet CH
MMCMercer US
Cr Suisse CH
State Street US
Amundi FR
Carmignac FR
Bridgewater US
PIMCO US
New York Life Candriam US
Northern Trust US
AXA FR
Old Mutual ZA
Algebris GB
Muzinich US
AQR Capital US
Soc GenLyxor FR
Cr Mutuel FR
Aeris CH
Baring US
440
94
51
79
73
30
101
51
128
161
225
20
3
67
98
19
198
40
5
15
15120
13681
11211
10168
7641
7454
6796
5512
5439
4955
4520
4367
4023
3956
3602
3473
3359
2368
2367
2210
12
305
83
3
56
1802
1632
1547
1503
1410
FIG 33 - TOP CROSS-BORDER GROUPS BY SALES IN 2016 (eurom) - Ex ETFs
Master Groups NAT Funds Net Sales
Nordea SE
KBC BE
ORIX Robeco JP
Aviva GB
Vanguard US
Pictet CH
MMCMercer US
Cr Suisse CH
Carmignac FR
PIMCO US
Bridgewater US
New York Life Candriam US
Northern Trust US
AXA FR
Old Mutual ZA
Algebris GB
Muzinich US
AQR Capital US
Cr Mutuel FR
Aeris CH
Baring US
SYQUANT FR
BTPS BT GB
Jupiter Investment GB
Dimensional US
94
79
73
30
33
101
51
128
20
65
3
98
19
198
40
5
15
12
83
3
13681
10168
7641
7454
7400
6796
5512
5439
4367
4061
4023
3602
3473
3359
2368
2367
2210
1802
1547
1503
56
3
15
19
19
1410
1315
1300
1294
1264
Note exclude money markets funds and ETF Note exclude money market funds
2017 EDITION
Cross-Border Progress
Cross-Border Progress
Group Winners
EUROPEAN FUND MARKET REVIEW
Page 1924
broadridgecom
FIGURE 35 - NET SALES OF CROSS-BORDER GROUPS BY MARKET IN 2016 - ALL FUNDS (eurobn)
-14 0 14 28 42
Cross Border Domestic Round Trip
ItalyGermany
NetherlandsAustria
BelgiumSweden
SpainFrance
United KingdomSwitzerland
FIGURE 36 - NET SALES OF CROSS-BORDER GROUPS BY MARKET IN 2016 - EQUITY ONLY (eurobn)
-284 -213 -142 -71 0 71
Cross Border Domestic Round Trip
GermanySweden
NetherlandsBelgiumAustria
ItalySpain
FranceSwitzerland
United Kingdom
FIGURE 37 - NET SALES OF CROSS-BORDER GROUPS BY MARKET IN 2016 - BOND ONLY (eurobn)
-67 0 67 134 201 268
Cross Border Domestic Round Trip
ItalySpain
United KingdomBelgium
GermanyAustria
NetherlandsSweden
SwitzerlandFrance
Note Excludes money market funds amp ETFs
1 Foreign activity is actual sales as measured bythe Broadridge SalesWatch Confidential Service
2 The 60 members are estimated to account for75-80 of the total cross-border sales activity
Cross-Border Progress
Cross-Border Progress
Cross-Border Share of Sales in Europe
Page 2024
broadridgecom
FIGURE 36 - DOM FRANCE
Domestic Net Sales
Equities Alternative
Protected Fund
Bonds Inflation Linked
Equities France MidSmall Caps
Asset Allocation Alternative
2310
2019
918
776
444
FIGURE 36 - DOM GERMANY
Domestic Net Sales
Asset Allocation Alternative
Mixed Assets Conservative
Real Estate
Bonds EUR
Equities Global Income
5295
3075
1984
1982
1254
FIGURE 36 - DOM ITALY
Domestic Net Sales
Bonds Global Currencies
Mixed Assets Target Maturity
Mixed Assets Conservative
Bonds Emerging Markets
Bonds EUR Corp Inv Grade
7510
4672
3890
2541
1842
FIGURE 36 - DOM SWITZERLAND
Domestic Net Sales
Equities Switzerland
Bonds Global Corporates
Bonds Emerging Markets
Equities Emerging Markets
Bonds CHF
233338
172162
133284
94704
91618
FIGURE 36 - DOM UNITED KINGDOM
Domestic Net Sales
Asset Allocation Alternative
Equities North America
Equities Alternative
Bonds UK Gilt
Bonds Inflation Linked
1041258
207514
186569
179868
170941
FIGURE 36 - SW SECTOR FRANCE
Cross-Border Real Sales
Bonds Global Currencies
Asset Allocation
Bonds Inflation Linked
Equities Europe Income
Bonds Emerging Markets
Confidential
Confidential
Confidential
Confidential
Confidential
FIGURE 36 - SW SECTOR ITALY
Cross-Border Real Sales
Asset Allocation
Bonds EUR Short-Term
Mixed Assets Conservative
Bonds EUR Corp High Yield
Bonds Global Corporates
Confidential
Confidential
Confidential
Confidential
Confidential
FIGURE 36 - SW SECTOR GERMANY
Cross-Border Real Sales
Mixed Assets Income
Asset Allocation Alternative
Bonds EUR Corp High Yield
Bonds Global High Yield
Bonds Emerging Markets
Confidential
Confidential
Confidential
Confidential
Confidential
FIGURE 36 - SW SECTOR SWITZWELAND
Cross-Border Real Sales
Asset Allocation
Bonds Global High Yield
Bonds Global Corporates
Equities Emerging Markets
Bonds Target Maturity
Confidential
Confidential
Confidential
Confidential
Confidential
FIGURE 36 - SW SECTOR UK
Cross-Border Real Sales
Equities Alternative
Bonds Emerging Markets - Local Currency
Bonds Global Corporates
Bonds Emerging Markets
Asset Allocation
Confidential
Confidential
Confidential
Confidential
Confidential
FRANCE
FIGURE 38 - TOP 5 DOMESTIC AND CROSS-BORDERS SECTORS IN THE MAJOR MARKETS (eurom)
GERMANY
ITALY
SWITZERLAND
UNITED KINGDOM
Real Sales dataavailable to SalesWatchmembers only
Cross-Border ProgressDomestic vs Cross-Border Sectors
Page 2124
2017 EDITION
broadridgecom
The following report is based on the unique fund analytics delivered throughBroadridge Global Market Intelligence (GMI) our leading global fundanalytics database The charts and tables in this report reflect only the tip ofthe iceberg in terms of the depth and breadth available from Broadridge GMIThe report offers a high-level overview of European fund flow activity in2016
Global Market Intelligence (GMI) helps you make more strategic decisionsmore effectively allocate your companyrsquos resources and most importantlybe more responsive to your customersrsquo needs all through the combining thepower of the FundFile and SalesWatch datasets
Broadridge FundFile enables deep fund flows analysis of all keygeographical markets covering Asia Pacific Latin America the Middle Eastand Africa and North America and delivers a truly global fund flows solutionBy gradually building the international reach of its global sales data andmaintaining its high quality and ease of use over the past ten years FundFilehas become the unparalleled source of data and analysis with informationon more than 100000 funds
The cross-border dimension of the European funds industryndashtheldquointernationalrdquo fund marketndashcan truly be assessed only with BroadridgeSalesWatch a unique cooperative and confidential benchmarking servicethat allows leading fund groups to track their cross-border sales and assetsagainst their competitorsrsquo by country distribution channel institutional versusretail activity and both gross and net sales This service now counts 60 ofthe leading asset managers among its members (Some sample data takenfrom the tool can be seen on pages 20 and 21 of the current report)
1 All data is at December 2016 unless otherwise stated
2 lsquoInternationalrsquo fund market Broadridge defines an International fund as afund that sources less than 80 of its assets from any single country Somefund groups have domestic and international funds
3 lsquoDomesticrsquo fund market If a fund sources more than 80 of its assets from asingle country then the fund is allocated to that market regardless of itsdomicile
4 Funds of funds have been excluded from all charts and tables (to avoiddouble counting) unless otherwise stated Therefore a market total is the sumof all the investment categories excluding the three funds of funds categories(in-house ex-house and hedge)
5 The investment category lsquootherrsquo includes a variety of different productcategories For most markets especially Belgium Spain and France the figurecomprises guaranteed funds but there are also derivatives and other specialityfunds in the lsquootherrsquo category
6 Property funds are open-ended property funds only
7 Master group Analysis that aggregates the European mutual fund assetsunder the umbrella of their parent company name
8 ETFs are included in broadridgersquos database on mutual funds but thisexcludes exchange-traded commodity products that are not mutual funds
9 References to foreign activity relate to actual sales as measured byBroadridgersquos SalesWatch confidential service The 60 SalesWatch membersare estimated to account for 75-80 of total cross-border sales activity
Footnotes About the Report
EUROPEAN FUND MARKET REVIEW
Page 2224
broadridgecom
Page 2324
broadridgecom
2017 EDITION
Global Market Intelligence reflects our expertiseand understanding of markets worldwide and ofthe evolving needs of asset managers
To learn more and to schedule a free demo ofGlobal Marketing Intelligence visitwwwbroadridgecomGMI today
For more information please contactlauracohenbroadridgecom
No part of this document may be distributed reproduced or posted without the expresswritten permission of Broadridge Financial Solutions Inc copy2017 Broadridge Financial Solutions Inc Broadridge and the Broadridge logo areregistered trademarks of Broadridge Financial Solutions Inc
FundFile SalesWatch
Global
Market
Intelligence
EUROPEAN FUND MARKET REVIEW
Page 2424

Values
TOP 25
REST
TOTAL
171626
-80785
90841
2017 EDITION
broadridgecom
Figure 16 - TOP 25 FUNDS BY NET SALES IN 2016 (eurom)
Master Groups Fund Name Domicile Strategy Type Launch Date Net Sales
Nordea Nordea 1 - Stable Return Fund LU Active Mix 200511
PIMCO PIMCO GIS Income Fund IE Active Bnd 201211
JP Morgan JPMorgan Investment Funds - Global Macro Opportunities Fund LU Active Mix 199902
Carmignac Carmignac Seacutecuriteacute FR Active Bnd 199504
Invesco Invesco Perpetual Global Targeted Returns GB Active Mix 201309
Intesa SP Eurizon EasyFund - Treasury EUR T1 LU Active Bnd 201503
BlackRock iShares Core SampP 500 UCITS ETF (USD) IE Passive Eq 201005
Bridgewater Bridgewater Pure Alpha Strategy 18 Volatility VG Active Hdge 199112
Fundsmith Fundsmith Equity GB Active Eq 201011
Aegon AEAM Dutch Mortgage Fund NL Active Bnd 201308
Invesco Invesco Global Targeted Returns Fund LU Active Mix 201312
State Street State Street ACS North America Index Equity GB Passive Eq 201603
VRUnion PrivatFonds Kontrolliert DE Active Mix 201007
AXA AB FCP I American Income Portfolio LU Active Bnd 199307
La Caixa CaixaBank Rentas Euribor FI ES Active Bnd 201606
Deutsche AM DWS Top Dividende DE Active Eq 200304
Cr Suisse CS Nova (Lux) Fixed Maturity Bond Fund 2019 LU Active Bnd 201604
Vanguard Vanguard Funds Plc - Vanguard SampP 500 UCITS ETF IE Passive Eq 201205
Aviva Aviva Investors Multi-Strategy Target Return GB Active Mix 201407
Flossbach von Storch Flossbach von Storch SICAV - Multiple Opportunities LU Active Mix 200710
ORIX Robeco Robeco High Yield Bonds LU Active Bnd 199804
BBVA Group BBVA Bonos Internacional Flexible 0-3 FI ES Active Bnd 201505
La Caixa CaixaBank Rentas Euribor 2 FI ES Active Bnd 201609
BlackRock iShares Core MSCI World UCITS ETF IE Passive Eq 200909
PIMCO PIMCO GIS Global Investment Grade Credit IE Active Bnd 200307
10494
6825
5073
5048
4225
4221
4111
3678
3537
3277
3256
3167
2941
2801
2771
2739
2689
2474
2430
2375
2345
2333
2325
2298
2284
Note Excludes money markets funds
Pan-European Fund Leaders Sales
EUROPEAN FUND MARKET REVIEW
Page 1124
2017 EDITION
FIGURE 18 - TOP 10 MASTER GROUPS BY SALES IN 2016 (eurom)
Master Groups NAT Funds Assets Net Sales
BlackRock US
State Street US
Amundi FR
Vanguard US
UBS CH
Deutsche Boumlrse DE
BNP Paribas FR
Deka DE
Swisscanto CH
Soc GenLyxor FR
292
100
105
18
123
1
35
46
4
254
252952
21134
24805
23790
29060
4157
5551
8321
6578
50859
23549
4785
3825
3811
2503
2150
1130
885
617
550
Sum 978 427205 43805
FIGURE 17- TOP 10 FUNDS BY SALES IN 2016 (eurom)
Master Groups Fund Name Net Sales
BlackRock iShares Core SampP 500 UCITS ETF (USD)
Vanguard Vanguard Funds Plc - Vanguard SampP 500 UCITS ETF
BlackRock iShares Core Euro Corporate Bond UCITS ETF
iShares Core MSCI World UCITS ETF
iShares EURO STOXX 50 UCITS ETF (DE)
Soc GenLyxor Lyxor UCITS ETF EURO STOXX 50
BlackRock iShares Euro High Yield Corporate Bond UCITS ETF
iShares MSCI Europe UCITS ETF (Inc)
Deutsche AM db x-trackers EURO STOXX 50reg UCITS ETF (DR)
BlackRock iShares STOXX Europe 600 (DE)
12016
11539
6864
6540
5099
5010
4792
4397
4216
4138
Sum 64610
broadridgecom
Product ThemesExchange Traded Funds
EUROPEAN FUND MARKET REVIEW
Page 1224
2017 EDITION
FIGURE 20 - TOP 10 MASTER GROUPS BY SALES IN 2016 (eurom)
Master Groups NAT Funds Assets Net Sales
Vanguard US
Northern Trust US
UBS CH
State Street US
Swisscanto CH
Legal amp General GB
Laumlnsfoumlrsaumlkrings SE
KBC BE
Den Norske NO
MMCMercer US
34
26
65
55
69
42
5
30
3
3
79794
13382
64896
33689
27722
26645
3767
4440
2023
5483
8966
5174
4820
4687
2510
1755
1591
1179
994
954
Sum 332 261841 32630
FIGURE 19 - TOP 10 FUNDS BY SALES IN 2016 (eurom)
Master Groups Fund Name Net Sales
State Street State Street ACS North America Index Equity
Vanguard Vanguard Investment Series Plc - Vanguard Global Bond Index Fund
Vanguard Investment Series Plc - Vanguard US Treasury Inflation-Protected Securities Index Fund
LloydsSWIP Scottish Widows Corporate Bond Tracker Fund
Northern Trust Northern Trust World Custom ESG Equity Index
HSBC HSBC Japan Index
Northern Trust Northern Trust Developed Real Estate Index UCITS FGR Fund
Northern Trust UCITS Common Contractual Fund - World Equity Index Fund
Vanguard Vanguard Investment Series Plc - Vanguard Emerging Markets Stock Index Fund
Den Norske DNB Global Indeks
316733
164155
144479
107232
102532
87021
86021
78849
78797
76756
Sum 1242575
broadridgecom
Product ThemesIndex Tracking Funds
EUROPEAN FUND MARKET REVIEW
Page 1324
2017 EDITION
FIG 22 - MARKET SHARE OF PASSIVE FUNDS BY ASSETS IN 2016
Index Tracking ETF Active
88
77
8585
FIG 21 - MARKET SHARE OF PASSIVE FUNDS BY ASSETS IN 2002
Index Tracking ETF Active
3311
9696
FIGURE 23 - HISTORICAL NET SALES (eurobn)
2013 2014 2015 2016
Active ETF Index Tracking
26062606
164164 194194
30403040
405405 438438
20172017
652652
363363187187
387387 335335
Note Excludes money market funds
broadridgecom
Product ThemesActive vs Passive
EUROPEAN FUND MARKET REVIEW
Page 1424
2017 EDITION
FIGURE 25 - TOP 10 MASTER GROUPS BY SALES IN 2016 (eurom)
Master Groups NAT Funds Assets Net Sales
Amundi FR
BlackRock US
Nordea SE
ORIX Robeco JP
Aviva GB
Vanguard US
UBS CH
Fidelity US
Goldman Sachs US
PrudentialMampG GB
9
20
9
11
4
3
18
11
7
4
4791
20800
5829
8750
2427
7762
8808
8444
2382
4021
2473
1923
1632
1340
1182
1117
1024
1013
909
816
Sum 96 74014 13429
broadridgecom
FIGURE 24 - TOP 10 FUNDS BY SALES IN 2016 (eurom)
Master Groups Fund Name Net Sales
BlackRock iShares Core MSCI Emerging Markets IMI UCITS ETF
Amundi Amundi ETF MSCI Emerging Markets UCITS ETF
ORIX Robeco Robeco Emerging Conservative Equities
PrudentialMampG Eastspring Investments Global Emerging Markets Dynamic
Aviva Aviva Investors - Emerging Markets Equity Income Fund
Goldman Sachs GS Emerging Markets Broad Equity Portfolio
Nordea Nordea 1 - Stable Emerging Markets Equity Fund
Vanguard Vanguard Investment Series Plc - Vanguard Emerging Markets Stock Index Fund
Amundi Amundi Funds Equity Emerging World
BTPS BT Hermes Global Emerging Markets
199164
150161
107040
106244
95149
94597
91057
78797
74192
56460
Sum 1052862
Product ThemesEquities Emerging Markets
EUROPEAN FUND MARKET REVIEW
Page 1524
2017 EDITION
broadridgecom
FIGURE 27 - TOP 10 MASTER GROUPS BY SALES IN 2016 (eurom)
Master Groups NAT Funds Assets Net Sales
ORIX Robeco JP
Aviva GB
New York Life Candriam US
Cr Suisse CH
AXA FR
Baring US
PrudentialMampG GB
BNY Mellon US
PIMCO US
Generali IT
2
3
2
3
6
4
3
4
1
4
7741
5701
2634
5010
21215
2269
2780
1135
4641
592
2347
1379
1339
1037
835
621
573
536
501
476
Sum 32 53718 9643
FIGURE 26 - TOP 10 FUNDS BY SALES IN 2016 (eurom)
Master Groups Fund Name Net Sales
ORIX Robeco Robeco High Yield Bonds
Aviva Aviva Investors - Global High Yield Bond
New York Life Candriam Candriam Bonds Credit Opportunities
Cr Suisse CS Nova (Lux) Global Senior Loan Fund
AXA AB FCP I Global High Yield Portfolio
PrudentialMampG MampG Global Floating Rate High Yield
PIMCO PIMCO GIS Global High Yield Bond Fund
Baring Barings Global High Yield Credit Strategies
BNY Mellon BNY Mellon Global Short Dated High Yield Bond Fund
JP Morgan JPMorgan Investment Funds - Global High Yield Bond Fund
234531
133173
115777
103450
96531
70438
50130
49268
42600
35957
Sum 931855
Product DevelopmentBonds Global High Yield
EUROPEAN FUND MARKET REVIEW
Page 1624
2017 EDITION
broadridgecom
FIGURES 28 - FUND LAUNCHES amp CLOSURES
Jan 2016 Feb 2016 Mar 2016 Apr 2016 May 2016 Jun 2016 Jul 2016 Aug 2016 Sep 2016 Oct 2016 Nov 2016 Dec 2016
Fund Launches Fund Closures Fund Mergers
6969
185185
191191
114114
118118
223223
5656
175175
197197
104104
156156
194194
6464
178178
182182
7171
187187
200200
8484
168168
213213
4848
123123
133133
9999
159159
186186
9898
122122
192192
7676
189189
182182
8989
186186
193193
FIGURE 29 - TOP SELLING NEW FUND LAUNCHES IN 2016 (eurom)
Fund Name Fund Domicile Launch Date Net Sales
CS Nova (Lux) Fixed Maturity Bond Fund 2019 Luxembourg 201604
CaixaBank Rentas Euribor 2 FI Spain 201609
CaixaBank Rentas Euribor FI Spain 201606
DWS FlexPension II 2031 Luxembourg 201607
GS USD Treasury Instruments Liquid Reserves Ireland 201605
Multi Manager Access II - High Yield Luxembourg 201604
State Street ACS North America Index Equity United Kingdom 201603
UBI SICAV - Euro Corporate Bond High Potential Luxembourg 201605
UniInstitutional Euro Reserve Plus Germany 201602
Vanguard Investment Series Plc - Vanguard US Treasury Inflation-Protected Securities Index Fund Ireland 201610
2689
2325
2771
1734
1717
3832
3167
1361
3407
1445
Product Development
EUROPEAN FUND MARKET REVIEW
Page 1724
FIGURE 32 - NUMBER OF FUND LAUNCHES BY MAIN ASSET CLASS
2011 2012 2013 2014 2015 2016
Bond Equity Mixed Assets
675675
926926
456456
733733
659659
463463
718718 725725
541541
665665
851851
578578 579579
927927
640640
494494
664664
505505
2017 EDITION
broadridgecom
FIGURE 32 - FUND LAUNCHES BY REGION IN 2016 (eurom)
Fund Region Funds Net Sales
Europe
International
1217
1069
98667
75333
Sum 2286 174000
FIGURE 31 - NUMBER OF FUND LAUNCHES BY STRATEGY
Active ETF Index Tracking
20832083
125125
7878
FIGURE 30 - FUND LAUNCHES BY GROUP IN 2016 (eurom)
Master Group Funds Net Sales
Intesa SP
BNP Paribas
Pioneer
Allianz GI
Cr Suisse
State Street
UBS
GAM Holding
VRUnion
La Caixa
UBI Banca
93
72
34
29
29
23
22
21
18
13
10
1637657
356485
524480
348767
670371
362228
489178
428731
437740
604485
510552
Sum 364 6370676
Product Development
EUROPEAN FUND MARKET REVIEW
Page 1824
Values
TOP 25
REST
TOTAL
130117
-89556
40561
Values
TOP 25
REST
TOTAL
105357
-99044
6312
broadridgecom
FIG 34 - TOP CROSS-BORDER GROUPS BY SALES IN 2016 (eurom) - INC ETFs
Master Groups NAT Funds Net Sales
BlackRock US
Nordea SE
Vanguard US
KBC BE
ORIX Robeco JP
Aviva GB
Pictet CH
MMCMercer US
Cr Suisse CH
State Street US
Amundi FR
Carmignac FR
Bridgewater US
PIMCO US
New York Life Candriam US
Northern Trust US
AXA FR
Old Mutual ZA
Algebris GB
Muzinich US
AQR Capital US
Soc GenLyxor FR
Cr Mutuel FR
Aeris CH
Baring US
440
94
51
79
73
30
101
51
128
161
225
20
3
67
98
19
198
40
5
15
15120
13681
11211
10168
7641
7454
6796
5512
5439
4955
4520
4367
4023
3956
3602
3473
3359
2368
2367
2210
12
305
83
3
56
1802
1632
1547
1503
1410
FIG 33 - TOP CROSS-BORDER GROUPS BY SALES IN 2016 (eurom) - Ex ETFs
Master Groups NAT Funds Net Sales
Nordea SE
KBC BE
ORIX Robeco JP
Aviva GB
Vanguard US
Pictet CH
MMCMercer US
Cr Suisse CH
Carmignac FR
PIMCO US
Bridgewater US
New York Life Candriam US
Northern Trust US
AXA FR
Old Mutual ZA
Algebris GB
Muzinich US
AQR Capital US
Cr Mutuel FR
Aeris CH
Baring US
SYQUANT FR
BTPS BT GB
Jupiter Investment GB
Dimensional US
94
79
73
30
33
101
51
128
20
65
3
98
19
198
40
5
15
12
83
3
13681
10168
7641
7454
7400
6796
5512
5439
4367
4061
4023
3602
3473
3359
2368
2367
2210
1802
1547
1503
56
3
15
19
19
1410
1315
1300
1294
1264
Note exclude money markets funds and ETF Note exclude money market funds
2017 EDITION
Cross-Border Progress
Cross-Border Progress
Group Winners
EUROPEAN FUND MARKET REVIEW
Page 1924
broadridgecom
FIGURE 35 - NET SALES OF CROSS-BORDER GROUPS BY MARKET IN 2016 - ALL FUNDS (eurobn)
-14 0 14 28 42
Cross Border Domestic Round Trip
ItalyGermany
NetherlandsAustria
BelgiumSweden
SpainFrance
United KingdomSwitzerland
FIGURE 36 - NET SALES OF CROSS-BORDER GROUPS BY MARKET IN 2016 - EQUITY ONLY (eurobn)
-284 -213 -142 -71 0 71
Cross Border Domestic Round Trip
GermanySweden
NetherlandsBelgiumAustria
ItalySpain
FranceSwitzerland
United Kingdom
FIGURE 37 - NET SALES OF CROSS-BORDER GROUPS BY MARKET IN 2016 - BOND ONLY (eurobn)
-67 0 67 134 201 268
Cross Border Domestic Round Trip
ItalySpain
United KingdomBelgium
GermanyAustria
NetherlandsSweden
SwitzerlandFrance
Note Excludes money market funds amp ETFs
1 Foreign activity is actual sales as measured bythe Broadridge SalesWatch Confidential Service
2 The 60 members are estimated to account for75-80 of the total cross-border sales activity
Cross-Border Progress
Cross-Border Progress
Cross-Border Share of Sales in Europe
Page 2024
broadridgecom
FIGURE 36 - DOM FRANCE
Domestic Net Sales
Equities Alternative
Protected Fund
Bonds Inflation Linked
Equities France MidSmall Caps
Asset Allocation Alternative
2310
2019
918
776
444
FIGURE 36 - DOM GERMANY
Domestic Net Sales
Asset Allocation Alternative
Mixed Assets Conservative
Real Estate
Bonds EUR
Equities Global Income
5295
3075
1984
1982
1254
FIGURE 36 - DOM ITALY
Domestic Net Sales
Bonds Global Currencies
Mixed Assets Target Maturity
Mixed Assets Conservative
Bonds Emerging Markets
Bonds EUR Corp Inv Grade
7510
4672
3890
2541
1842
FIGURE 36 - DOM SWITZERLAND
Domestic Net Sales
Equities Switzerland
Bonds Global Corporates
Bonds Emerging Markets
Equities Emerging Markets
Bonds CHF
233338
172162
133284
94704
91618
FIGURE 36 - DOM UNITED KINGDOM
Domestic Net Sales
Asset Allocation Alternative
Equities North America
Equities Alternative
Bonds UK Gilt
Bonds Inflation Linked
1041258
207514
186569
179868
170941
FIGURE 36 - SW SECTOR FRANCE
Cross-Border Real Sales
Bonds Global Currencies
Asset Allocation
Bonds Inflation Linked
Equities Europe Income
Bonds Emerging Markets
Confidential
Confidential
Confidential
Confidential
Confidential
FIGURE 36 - SW SECTOR ITALY
Cross-Border Real Sales
Asset Allocation
Bonds EUR Short-Term
Mixed Assets Conservative
Bonds EUR Corp High Yield
Bonds Global Corporates
Confidential
Confidential
Confidential
Confidential
Confidential
FIGURE 36 - SW SECTOR GERMANY
Cross-Border Real Sales
Mixed Assets Income
Asset Allocation Alternative
Bonds EUR Corp High Yield
Bonds Global High Yield
Bonds Emerging Markets
Confidential
Confidential
Confidential
Confidential
Confidential
FIGURE 36 - SW SECTOR SWITZWELAND
Cross-Border Real Sales
Asset Allocation
Bonds Global High Yield
Bonds Global Corporates
Equities Emerging Markets
Bonds Target Maturity
Confidential
Confidential
Confidential
Confidential
Confidential
FIGURE 36 - SW SECTOR UK
Cross-Border Real Sales
Equities Alternative
Bonds Emerging Markets - Local Currency
Bonds Global Corporates
Bonds Emerging Markets
Asset Allocation
Confidential
Confidential
Confidential
Confidential
Confidential
FRANCE
FIGURE 38 - TOP 5 DOMESTIC AND CROSS-BORDERS SECTORS IN THE MAJOR MARKETS (eurom)
GERMANY
ITALY
SWITZERLAND
UNITED KINGDOM
Real Sales dataavailable to SalesWatchmembers only
Cross-Border ProgressDomestic vs Cross-Border Sectors
Page 2124
2017 EDITION
broadridgecom
The following report is based on the unique fund analytics delivered throughBroadridge Global Market Intelligence (GMI) our leading global fundanalytics database The charts and tables in this report reflect only the tip ofthe iceberg in terms of the depth and breadth available from Broadridge GMIThe report offers a high-level overview of European fund flow activity in2016
Global Market Intelligence (GMI) helps you make more strategic decisionsmore effectively allocate your companyrsquos resources and most importantlybe more responsive to your customersrsquo needs all through the combining thepower of the FundFile and SalesWatch datasets
Broadridge FundFile enables deep fund flows analysis of all keygeographical markets covering Asia Pacific Latin America the Middle Eastand Africa and North America and delivers a truly global fund flows solutionBy gradually building the international reach of its global sales data andmaintaining its high quality and ease of use over the past ten years FundFilehas become the unparalleled source of data and analysis with informationon more than 100000 funds
The cross-border dimension of the European funds industryndashtheldquointernationalrdquo fund marketndashcan truly be assessed only with BroadridgeSalesWatch a unique cooperative and confidential benchmarking servicethat allows leading fund groups to track their cross-border sales and assetsagainst their competitorsrsquo by country distribution channel institutional versusretail activity and both gross and net sales This service now counts 60 ofthe leading asset managers among its members (Some sample data takenfrom the tool can be seen on pages 20 and 21 of the current report)
1 All data is at December 2016 unless otherwise stated
2 lsquoInternationalrsquo fund market Broadridge defines an International fund as afund that sources less than 80 of its assets from any single country Somefund groups have domestic and international funds
3 lsquoDomesticrsquo fund market If a fund sources more than 80 of its assets from asingle country then the fund is allocated to that market regardless of itsdomicile
4 Funds of funds have been excluded from all charts and tables (to avoiddouble counting) unless otherwise stated Therefore a market total is the sumof all the investment categories excluding the three funds of funds categories(in-house ex-house and hedge)
5 The investment category lsquootherrsquo includes a variety of different productcategories For most markets especially Belgium Spain and France the figurecomprises guaranteed funds but there are also derivatives and other specialityfunds in the lsquootherrsquo category
6 Property funds are open-ended property funds only
7 Master group Analysis that aggregates the European mutual fund assetsunder the umbrella of their parent company name
8 ETFs are included in broadridgersquos database on mutual funds but thisexcludes exchange-traded commodity products that are not mutual funds
9 References to foreign activity relate to actual sales as measured byBroadridgersquos SalesWatch confidential service The 60 SalesWatch membersare estimated to account for 75-80 of total cross-border sales activity
Footnotes About the Report
EUROPEAN FUND MARKET REVIEW
Page 2224
broadridgecom
Page 2324
broadridgecom
2017 EDITION
Global Market Intelligence reflects our expertiseand understanding of markets worldwide and ofthe evolving needs of asset managers
To learn more and to schedule a free demo ofGlobal Marketing Intelligence visitwwwbroadridgecomGMI today
For more information please contactlauracohenbroadridgecom
No part of this document may be distributed reproduced or posted without the expresswritten permission of Broadridge Financial Solutions Inc copy2017 Broadridge Financial Solutions Inc Broadridge and the Broadridge logo areregistered trademarks of Broadridge Financial Solutions Inc
FundFile SalesWatch
Global
Market
Intelligence
EUROPEAN FUND MARKET REVIEW
Page 2424

2017 EDITION
broadridgecom
FIGURES 28 - FUND LAUNCHES amp CLOSURES
Jan 2016 Feb 2016 Mar 2016 Apr 2016 May 2016 Jun 2016 Jul 2016 Aug 2016 Sep 2016 Oct 2016 Nov 2016 Dec 2016
Fund Launches Fund Closures Fund Mergers
6969
185185
191191
114114
118118
223223
5656
175175
197197
104104
156156
194194
6464
178178
182182
7171
187187
200200
8484
168168
213213
4848
123123
133133
9999
159159
186186
9898
122122
192192
7676
189189
182182
8989
186186
193193
FIGURE 29 - TOP SELLING NEW FUND LAUNCHES IN 2016 (eurom)
Fund Name Fund Domicile Launch Date Net Sales
CS Nova (Lux) Fixed Maturity Bond Fund 2019 Luxembourg 201604
CaixaBank Rentas Euribor 2 FI Spain 201609
CaixaBank Rentas Euribor FI Spain 201606
DWS FlexPension II 2031 Luxembourg 201607
GS USD Treasury Instruments Liquid Reserves Ireland 201605
Multi Manager Access II - High Yield Luxembourg 201604
State Street ACS North America Index Equity United Kingdom 201603
UBI SICAV - Euro Corporate Bond High Potential Luxembourg 201605
UniInstitutional Euro Reserve Plus Germany 201602
Vanguard Investment Series Plc - Vanguard US Treasury Inflation-Protected Securities Index Fund Ireland 201610
2689
2325
2771
1734
1717
3832
3167
1361
3407
1445
Product Development
EUROPEAN FUND MARKET REVIEW
Page 1724
FIGURE 32 - NUMBER OF FUND LAUNCHES BY MAIN ASSET CLASS
2011 2012 2013 2014 2015 2016
Bond Equity Mixed Assets
675675
926926
456456
733733
659659
463463
718718 725725
541541
665665
851851
578578 579579
927927
640640
494494
664664
505505
2017 EDITION
broadridgecom
FIGURE 32 - FUND LAUNCHES BY REGION IN 2016 (eurom)
Fund Region Funds Net Sales
Europe
International
1217
1069
98667
75333
Sum 2286 174000
FIGURE 31 - NUMBER OF FUND LAUNCHES BY STRATEGY
Active ETF Index Tracking
20832083
125125
7878
FIGURE 30 - FUND LAUNCHES BY GROUP IN 2016 (eurom)
Master Group Funds Net Sales
Intesa SP
BNP Paribas
Pioneer
Allianz GI
Cr Suisse
State Street
UBS
GAM Holding
VRUnion
La Caixa
UBI Banca
93
72
34
29
29
23
22
21
18
13
10
1637657
356485
524480
348767
670371
362228
489178
428731
437740
604485
510552
Sum 364 6370676
Product Development
EUROPEAN FUND MARKET REVIEW
Page 1824
Values
TOP 25
REST
TOTAL
130117
-89556
40561
Values
TOP 25
REST
TOTAL
105357
-99044
6312
broadridgecom
FIG 34 - TOP CROSS-BORDER GROUPS BY SALES IN 2016 (eurom) - INC ETFs
Master Groups NAT Funds Net Sales
BlackRock US
Nordea SE
Vanguard US
KBC BE
ORIX Robeco JP
Aviva GB
Pictet CH
MMCMercer US
Cr Suisse CH
State Street US
Amundi FR
Carmignac FR
Bridgewater US
PIMCO US
New York Life Candriam US
Northern Trust US
AXA FR
Old Mutual ZA
Algebris GB
Muzinich US
AQR Capital US
Soc GenLyxor FR
Cr Mutuel FR
Aeris CH
Baring US
440
94
51
79
73
30
101
51
128
161
225
20
3
67
98
19
198
40
5
15
15120
13681
11211
10168
7641
7454
6796
5512
5439
4955
4520
4367
4023
3956
3602
3473
3359
2368
2367
2210
12
305
83
3
56
1802
1632
1547
1503
1410
FIG 33 - TOP CROSS-BORDER GROUPS BY SALES IN 2016 (eurom) - Ex ETFs
Master Groups NAT Funds Net Sales
Nordea SE
KBC BE
ORIX Robeco JP
Aviva GB
Vanguard US
Pictet CH
MMCMercer US
Cr Suisse CH
Carmignac FR
PIMCO US
Bridgewater US
New York Life Candriam US
Northern Trust US
AXA FR
Old Mutual ZA
Algebris GB
Muzinich US
AQR Capital US
Cr Mutuel FR
Aeris CH
Baring US
SYQUANT FR
BTPS BT GB
Jupiter Investment GB
Dimensional US
94
79
73
30
33
101
51
128
20
65
3
98
19
198
40
5
15
12
83
3
13681
10168
7641
7454
7400
6796
5512
5439
4367
4061
4023
3602
3473
3359
2368
2367
2210
1802
1547
1503
56
3
15
19
19
1410
1315
1300
1294
1264
Note exclude money markets funds and ETF Note exclude money market funds
2017 EDITION
Cross-Border Progress
Cross-Border Progress
Group Winners
EUROPEAN FUND MARKET REVIEW
Page 1924
broadridgecom
FIGURE 35 - NET SALES OF CROSS-BORDER GROUPS BY MARKET IN 2016 - ALL FUNDS (eurobn)
-14 0 14 28 42
Cross Border Domestic Round Trip
ItalyGermany
NetherlandsAustria
BelgiumSweden
SpainFrance
United KingdomSwitzerland
FIGURE 36 - NET SALES OF CROSS-BORDER GROUPS BY MARKET IN 2016 - EQUITY ONLY (eurobn)
-284 -213 -142 -71 0 71
Cross Border Domestic Round Trip
GermanySweden
NetherlandsBelgiumAustria
ItalySpain
FranceSwitzerland
United Kingdom
FIGURE 37 - NET SALES OF CROSS-BORDER GROUPS BY MARKET IN 2016 - BOND ONLY (eurobn)
-67 0 67 134 201 268
Cross Border Domestic Round Trip
ItalySpain
United KingdomBelgium
GermanyAustria
NetherlandsSweden
SwitzerlandFrance
Note Excludes money market funds amp ETFs
1 Foreign activity is actual sales as measured bythe Broadridge SalesWatch Confidential Service
2 The 60 members are estimated to account for75-80 of the total cross-border sales activity
Cross-Border Progress
Cross-Border Progress
Cross-Border Share of Sales in Europe
Page 2024
broadridgecom
FIGURE 36 - DOM FRANCE
Domestic Net Sales
Equities Alternative
Protected Fund
Bonds Inflation Linked
Equities France MidSmall Caps
Asset Allocation Alternative
2310
2019
918
776
444
FIGURE 36 - DOM GERMANY
Domestic Net Sales
Asset Allocation Alternative
Mixed Assets Conservative
Real Estate
Bonds EUR
Equities Global Income
5295
3075
1984
1982
1254
FIGURE 36 - DOM ITALY
Domestic Net Sales
Bonds Global Currencies
Mixed Assets Target Maturity
Mixed Assets Conservative
Bonds Emerging Markets
Bonds EUR Corp Inv Grade
7510
4672
3890
2541
1842
FIGURE 36 - DOM SWITZERLAND
Domestic Net Sales
Equities Switzerland
Bonds Global Corporates
Bonds Emerging Markets
Equities Emerging Markets
Bonds CHF
233338
172162
133284
94704
91618
FIGURE 36 - DOM UNITED KINGDOM
Domestic Net Sales
Asset Allocation Alternative
Equities North America
Equities Alternative
Bonds UK Gilt
Bonds Inflation Linked
1041258
207514
186569
179868
170941
FIGURE 36 - SW SECTOR FRANCE
Cross-Border Real Sales
Bonds Global Currencies
Asset Allocation
Bonds Inflation Linked
Equities Europe Income
Bonds Emerging Markets
Confidential
Confidential
Confidential
Confidential
Confidential
FIGURE 36 - SW SECTOR ITALY
Cross-Border Real Sales
Asset Allocation
Bonds EUR Short-Term
Mixed Assets Conservative
Bonds EUR Corp High Yield
Bonds Global Corporates
Confidential
Confidential
Confidential
Confidential
Confidential
FIGURE 36 - SW SECTOR GERMANY
Cross-Border Real Sales
Mixed Assets Income
Asset Allocation Alternative
Bonds EUR Corp High Yield
Bonds Global High Yield
Bonds Emerging Markets
Confidential
Confidential
Confidential
Confidential
Confidential
FIGURE 36 - SW SECTOR SWITZWELAND
Cross-Border Real Sales
Asset Allocation
Bonds Global High Yield
Bonds Global Corporates
Equities Emerging Markets
Bonds Target Maturity
Confidential
Confidential
Confidential
Confidential
Confidential
FIGURE 36 - SW SECTOR UK
Cross-Border Real Sales
Equities Alternative
Bonds Emerging Markets - Local Currency
Bonds Global Corporates
Bonds Emerging Markets
Asset Allocation
Confidential
Confidential
Confidential
Confidential
Confidential
FRANCE
FIGURE 38 - TOP 5 DOMESTIC AND CROSS-BORDERS SECTORS IN THE MAJOR MARKETS (eurom)
GERMANY
ITALY
SWITZERLAND
UNITED KINGDOM
Real Sales dataavailable to SalesWatchmembers only
Cross-Border ProgressDomestic vs Cross-Border Sectors
Page 2124
2017 EDITION
broadridgecom
The following report is based on the unique fund analytics delivered throughBroadridge Global Market Intelligence (GMI) our leading global fundanalytics database The charts and tables in this report reflect only the tip ofthe iceberg in terms of the depth and breadth available from Broadridge GMIThe report offers a high-level overview of European fund flow activity in2016
Global Market Intelligence (GMI) helps you make more strategic decisionsmore effectively allocate your companyrsquos resources and most importantlybe more responsive to your customersrsquo needs all through the combining thepower of the FundFile and SalesWatch datasets
Broadridge FundFile enables deep fund flows analysis of all keygeographical markets covering Asia Pacific Latin America the Middle Eastand Africa and North America and delivers a truly global fund flows solutionBy gradually building the international reach of its global sales data andmaintaining its high quality and ease of use over the past ten years FundFilehas become the unparalleled source of data and analysis with informationon more than 100000 funds
The cross-border dimension of the European funds industryndashtheldquointernationalrdquo fund marketndashcan truly be assessed only with BroadridgeSalesWatch a unique cooperative and confidential benchmarking servicethat allows leading fund groups to track their cross-border sales and assetsagainst their competitorsrsquo by country distribution channel institutional versusretail activity and both gross and net sales This service now counts 60 ofthe leading asset managers among its members (Some sample data takenfrom the tool can be seen on pages 20 and 21 of the current report)
1 All data is at December 2016 unless otherwise stated
2 lsquoInternationalrsquo fund market Broadridge defines an International fund as afund that sources less than 80 of its assets from any single country Somefund groups have domestic and international funds
3 lsquoDomesticrsquo fund market If a fund sources more than 80 of its assets from asingle country then the fund is allocated to that market regardless of itsdomicile
4 Funds of funds have been excluded from all charts and tables (to avoiddouble counting) unless otherwise stated Therefore a market total is the sumof all the investment categories excluding the three funds of funds categories(in-house ex-house and hedge)
5 The investment category lsquootherrsquo includes a variety of different productcategories For most markets especially Belgium Spain and France the figurecomprises guaranteed funds but there are also derivatives and other specialityfunds in the lsquootherrsquo category
6 Property funds are open-ended property funds only
7 Master group Analysis that aggregates the European mutual fund assetsunder the umbrella of their parent company name
8 ETFs are included in broadridgersquos database on mutual funds but thisexcludes exchange-traded commodity products that are not mutual funds
9 References to foreign activity relate to actual sales as measured byBroadridgersquos SalesWatch confidential service The 60 SalesWatch membersare estimated to account for 75-80 of total cross-border sales activity
Footnotes About the Report
EUROPEAN FUND MARKET REVIEW
Page 2224
broadridgecom
Page 2324
broadridgecom
2017 EDITION
Global Market Intelligence reflects our expertiseand understanding of markets worldwide and ofthe evolving needs of asset managers
To learn more and to schedule a free demo ofGlobal Marketing Intelligence visitwwwbroadridgecomGMI today
For more information please contactlauracohenbroadridgecom
No part of this document may be distributed reproduced or posted without the expresswritten permission of Broadridge Financial Solutions Inc copy2017 Broadridge Financial Solutions Inc Broadridge and the Broadridge logo areregistered trademarks of Broadridge Financial Solutions Inc
FundFile SalesWatch
Global
Market
Intelligence
EUROPEAN FUND MARKET REVIEW
Page 2424

Values
TOP 25
REST
TOTAL
130117
-89556
40561
Values
TOP 25
REST
TOTAL
105357
-99044
6312
broadridgecom
FIG 34 - TOP CROSS-BORDER GROUPS BY SALES IN 2016 (eurom) - INC ETFs
Master Groups NAT Funds Net Sales
BlackRock US
Nordea SE
Vanguard US
KBC BE
ORIX Robeco JP
Aviva GB
Pictet CH
MMCMercer US
Cr Suisse CH
State Street US
Amundi FR
Carmignac FR
Bridgewater US
PIMCO US
New York Life Candriam US
Northern Trust US
AXA FR
Old Mutual ZA
Algebris GB
Muzinich US
AQR Capital US
Soc GenLyxor FR
Cr Mutuel FR
Aeris CH
Baring US
440
94
51
79
73
30
101
51
128
161
225
20
3
67
98
19
198
40
5
15
15120
13681
11211
10168
7641
7454
6796
5512
5439
4955
4520
4367
4023
3956
3602
3473
3359
2368
2367
2210
12
305
83
3
56
1802
1632
1547
1503
1410
FIG 33 - TOP CROSS-BORDER GROUPS BY SALES IN 2016 (eurom) - Ex ETFs
Master Groups NAT Funds Net Sales
Nordea SE
KBC BE
ORIX Robeco JP
Aviva GB
Vanguard US
Pictet CH
MMCMercer US
Cr Suisse CH
Carmignac FR
PIMCO US
Bridgewater US
New York Life Candriam US
Northern Trust US
AXA FR
Old Mutual ZA
Algebris GB
Muzinich US
AQR Capital US
Cr Mutuel FR
Aeris CH
Baring US
SYQUANT FR
BTPS BT GB
Jupiter Investment GB
Dimensional US
94
79
73
30
33
101
51
128
20
65
3
98
19
198
40
5
15
12
83
3
13681
10168
7641
7454
7400
6796
5512
5439
4367
4061
4023
3602
3473
3359
2368
2367
2210
1802
1547
1503
56
3
15
19
19
1410
1315
1300
1294
1264
Note exclude money markets funds and ETF Note exclude money market funds
2017 EDITION
Cross-Border Progress
Cross-Border Progress
Group Winners
EUROPEAN FUND MARKET REVIEW
Page 1924
broadridgecom
FIGURE 35 - NET SALES OF CROSS-BORDER GROUPS BY MARKET IN 2016 - ALL FUNDS (eurobn)
-14 0 14 28 42
Cross Border Domestic Round Trip
ItalyGermany
NetherlandsAustria
BelgiumSweden
SpainFrance
United KingdomSwitzerland
FIGURE 36 - NET SALES OF CROSS-BORDER GROUPS BY MARKET IN 2016 - EQUITY ONLY (eurobn)
-284 -213 -142 -71 0 71
Cross Border Domestic Round Trip
GermanySweden
NetherlandsBelgiumAustria
ItalySpain
FranceSwitzerland
United Kingdom
FIGURE 37 - NET SALES OF CROSS-BORDER GROUPS BY MARKET IN 2016 - BOND ONLY (eurobn)
-67 0 67 134 201 268
Cross Border Domestic Round Trip
ItalySpain
United KingdomBelgium
GermanyAustria
NetherlandsSweden
SwitzerlandFrance
Note Excludes money market funds amp ETFs
1 Foreign activity is actual sales as measured bythe Broadridge SalesWatch Confidential Service
2 The 60 members are estimated to account for75-80 of the total cross-border sales activity
Cross-Border Progress
Cross-Border Progress
Cross-Border Share of Sales in Europe
Page 2024
broadridgecom
FIGURE 36 - DOM FRANCE
Domestic Net Sales
Equities Alternative
Protected Fund
Bonds Inflation Linked
Equities France MidSmall Caps
Asset Allocation Alternative
2310
2019
918
776
444
FIGURE 36 - DOM GERMANY
Domestic Net Sales
Asset Allocation Alternative
Mixed Assets Conservative
Real Estate
Bonds EUR
Equities Global Income
5295
3075
1984
1982
1254
FIGURE 36 - DOM ITALY
Domestic Net Sales
Bonds Global Currencies
Mixed Assets Target Maturity
Mixed Assets Conservative
Bonds Emerging Markets
Bonds EUR Corp Inv Grade
7510
4672
3890
2541
1842
FIGURE 36 - DOM SWITZERLAND
Domestic Net Sales
Equities Switzerland
Bonds Global Corporates
Bonds Emerging Markets
Equities Emerging Markets
Bonds CHF
233338
172162
133284
94704
91618
FIGURE 36 - DOM UNITED KINGDOM
Domestic Net Sales
Asset Allocation Alternative
Equities North America
Equities Alternative
Bonds UK Gilt
Bonds Inflation Linked
1041258
207514
186569
179868
170941
FIGURE 36 - SW SECTOR FRANCE
Cross-Border Real Sales
Bonds Global Currencies
Asset Allocation
Bonds Inflation Linked
Equities Europe Income
Bonds Emerging Markets
Confidential
Confidential
Confidential
Confidential
Confidential
FIGURE 36 - SW SECTOR ITALY
Cross-Border Real Sales
Asset Allocation
Bonds EUR Short-Term
Mixed Assets Conservative
Bonds EUR Corp High Yield
Bonds Global Corporates
Confidential
Confidential
Confidential
Confidential
Confidential
FIGURE 36 - SW SECTOR GERMANY
Cross-Border Real Sales
Mixed Assets Income
Asset Allocation Alternative
Bonds EUR Corp High Yield
Bonds Global High Yield
Bonds Emerging Markets
Confidential
Confidential
Confidential
Confidential
Confidential
FIGURE 36 - SW SECTOR SWITZWELAND
Cross-Border Real Sales
Asset Allocation
Bonds Global High Yield
Bonds Global Corporates
Equities Emerging Markets
Bonds Target Maturity
Confidential
Confidential
Confidential
Confidential
Confidential
FIGURE 36 - SW SECTOR UK
Cross-Border Real Sales
Equities Alternative
Bonds Emerging Markets - Local Currency
Bonds Global Corporates
Bonds Emerging Markets
Asset Allocation
Confidential
Confidential
Confidential
Confidential
Confidential
FRANCE
FIGURE 38 - TOP 5 DOMESTIC AND CROSS-BORDERS SECTORS IN THE MAJOR MARKETS (eurom)
GERMANY
ITALY
SWITZERLAND
UNITED KINGDOM
Real Sales dataavailable to SalesWatchmembers only
Cross-Border ProgressDomestic vs Cross-Border Sectors
Page 2124
2017 EDITION
broadridgecom
The following report is based on the unique fund analytics delivered throughBroadridge Global Market Intelligence (GMI) our leading global fundanalytics database The charts and tables in this report reflect only the tip ofthe iceberg in terms of the depth and breadth available from Broadridge GMIThe report offers a high-level overview of European fund flow activity in2016
Global Market Intelligence (GMI) helps you make more strategic decisionsmore effectively allocate your companyrsquos resources and most importantlybe more responsive to your customersrsquo needs all through the combining thepower of the FundFile and SalesWatch datasets
Broadridge FundFile enables deep fund flows analysis of all keygeographical markets covering Asia Pacific Latin America the Middle Eastand Africa and North America and delivers a truly global fund flows solutionBy gradually building the international reach of its global sales data andmaintaining its high quality and ease of use over the past ten years FundFilehas become the unparalleled source of data and analysis with informationon more than 100000 funds
The cross-border dimension of the European funds industryndashtheldquointernationalrdquo fund marketndashcan truly be assessed only with BroadridgeSalesWatch a unique cooperative and confidential benchmarking servicethat allows leading fund groups to track their cross-border sales and assetsagainst their competitorsrsquo by country distribution channel institutional versusretail activity and both gross and net sales This service now counts 60 ofthe leading asset managers among its members (Some sample data takenfrom the tool can be seen on pages 20 and 21 of the current report)
1 All data is at December 2016 unless otherwise stated
2 lsquoInternationalrsquo fund market Broadridge defines an International fund as afund that sources less than 80 of its assets from any single country Somefund groups have domestic and international funds
3 lsquoDomesticrsquo fund market If a fund sources more than 80 of its assets from asingle country then the fund is allocated to that market regardless of itsdomicile
4 Funds of funds have been excluded from all charts and tables (to avoiddouble counting) unless otherwise stated Therefore a market total is the sumof all the investment categories excluding the three funds of funds categories(in-house ex-house and hedge)
5 The investment category lsquootherrsquo includes a variety of different productcategories For most markets especially Belgium Spain and France the figurecomprises guaranteed funds but there are also derivatives and other specialityfunds in the lsquootherrsquo category
6 Property funds are open-ended property funds only
7 Master group Analysis that aggregates the European mutual fund assetsunder the umbrella of their parent company name
8 ETFs are included in broadridgersquos database on mutual funds but thisexcludes exchange-traded commodity products that are not mutual funds
9 References to foreign activity relate to actual sales as measured byBroadridgersquos SalesWatch confidential service The 60 SalesWatch membersare estimated to account for 75-80 of total cross-border sales activity
Footnotes About the Report
EUROPEAN FUND MARKET REVIEW
Page 2224
broadridgecom
Page 2324
broadridgecom
2017 EDITION
Global Market Intelligence reflects our expertiseand understanding of markets worldwide and ofthe evolving needs of asset managers
To learn more and to schedule a free demo ofGlobal Marketing Intelligence visitwwwbroadridgecomGMI today
For more information please contactlauracohenbroadridgecom
No part of this document may be distributed reproduced or posted without the expresswritten permission of Broadridge Financial Solutions Inc copy2017 Broadridge Financial Solutions Inc Broadridge and the Broadridge logo areregistered trademarks of Broadridge Financial Solutions Inc
FundFile SalesWatch
Global
Market
Intelligence
EUROPEAN FUND MARKET REVIEW
Page 2424

broadridgecom
FIGURE 36 - DOM FRANCE
Domestic Net Sales
Equities Alternative
Protected Fund
Bonds Inflation Linked
Equities France MidSmall Caps
Asset Allocation Alternative
2310
2019
918
776
444
FIGURE 36 - DOM GERMANY
Domestic Net Sales
Asset Allocation Alternative
Mixed Assets Conservative
Real Estate
Bonds EUR
Equities Global Income
5295
3075
1984
1982
1254
FIGURE 36 - DOM ITALY
Domestic Net Sales
Bonds Global Currencies
Mixed Assets Target Maturity
Mixed Assets Conservative
Bonds Emerging Markets
Bonds EUR Corp Inv Grade
7510
4672
3890
2541
1842
FIGURE 36 - DOM SWITZERLAND
Domestic Net Sales
Equities Switzerland
Bonds Global Corporates
Bonds Emerging Markets
Equities Emerging Markets
Bonds CHF
233338
172162
133284
94704
91618
FIGURE 36 - DOM UNITED KINGDOM
Domestic Net Sales
Asset Allocation Alternative
Equities North America
Equities Alternative
Bonds UK Gilt
Bonds Inflation Linked
1041258
207514
186569
179868
170941
FIGURE 36 - SW SECTOR FRANCE
Cross-Border Real Sales
Bonds Global Currencies
Asset Allocation
Bonds Inflation Linked
Equities Europe Income
Bonds Emerging Markets
Confidential
Confidential
Confidential
Confidential
Confidential
FIGURE 36 - SW SECTOR ITALY
Cross-Border Real Sales
Asset Allocation
Bonds EUR Short-Term
Mixed Assets Conservative
Bonds EUR Corp High Yield
Bonds Global Corporates
Confidential
Confidential
Confidential
Confidential
Confidential
FIGURE 36 - SW SECTOR GERMANY
Cross-Border Real Sales
Mixed Assets Income
Asset Allocation Alternative
Bonds EUR Corp High Yield
Bonds Global High Yield
Bonds Emerging Markets
Confidential
Confidential
Confidential
Confidential
Confidential
FIGURE 36 - SW SECTOR SWITZWELAND
Cross-Border Real Sales
Asset Allocation
Bonds Global High Yield
Bonds Global Corporates
Equities Emerging Markets
Bonds Target Maturity
Confidential
Confidential
Confidential
Confidential
Confidential
FIGURE 36 - SW SECTOR UK
Cross-Border Real Sales
Equities Alternative
Bonds Emerging Markets - Local Currency
Bonds Global Corporates
Bonds Emerging Markets
Asset Allocation
Confidential
Confidential
Confidential
Confidential
Confidential
FRANCE
FIGURE 38 - TOP 5 DOMESTIC AND CROSS-BORDERS SECTORS IN THE MAJOR MARKETS (eurom)
GERMANY
ITALY
SWITZERLAND
UNITED KINGDOM
Real Sales dataavailable to SalesWatchmembers only
Cross-Border ProgressDomestic vs Cross-Border Sectors
Page 2124
2017 EDITION
broadridgecom
The following report is based on the unique fund analytics delivered throughBroadridge Global Market Intelligence (GMI) our leading global fundanalytics database The charts and tables in this report reflect only the tip ofthe iceberg in terms of the depth and breadth available from Broadridge GMIThe report offers a high-level overview of European fund flow activity in2016
Global Market Intelligence (GMI) helps you make more strategic decisionsmore effectively allocate your companyrsquos resources and most importantlybe more responsive to your customersrsquo needs all through the combining thepower of the FundFile and SalesWatch datasets
Broadridge FundFile enables deep fund flows analysis of all keygeographical markets covering Asia Pacific Latin America the Middle Eastand Africa and North America and delivers a truly global fund flows solutionBy gradually building the international reach of its global sales data andmaintaining its high quality and ease of use over the past ten years FundFilehas become the unparalleled source of data and analysis with informationon more than 100000 funds
The cross-border dimension of the European funds industryndashtheldquointernationalrdquo fund marketndashcan truly be assessed only with BroadridgeSalesWatch a unique cooperative and confidential benchmarking servicethat allows leading fund groups to track their cross-border sales and assetsagainst their competitorsrsquo by country distribution channel institutional versusretail activity and both gross and net sales This service now counts 60 ofthe leading asset managers among its members (Some sample data takenfrom the tool can be seen on pages 20 and 21 of the current report)
1 All data is at December 2016 unless otherwise stated
2 lsquoInternationalrsquo fund market Broadridge defines an International fund as afund that sources less than 80 of its assets from any single country Somefund groups have domestic and international funds
3 lsquoDomesticrsquo fund market If a fund sources more than 80 of its assets from asingle country then the fund is allocated to that market regardless of itsdomicile
4 Funds of funds have been excluded from all charts and tables (to avoiddouble counting) unless otherwise stated Therefore a market total is the sumof all the investment categories excluding the three funds of funds categories(in-house ex-house and hedge)
5 The investment category lsquootherrsquo includes a variety of different productcategories For most markets especially Belgium Spain and France the figurecomprises guaranteed funds but there are also derivatives and other specialityfunds in the lsquootherrsquo category
6 Property funds are open-ended property funds only
7 Master group Analysis that aggregates the European mutual fund assetsunder the umbrella of their parent company name
8 ETFs are included in broadridgersquos database on mutual funds but thisexcludes exchange-traded commodity products that are not mutual funds
9 References to foreign activity relate to actual sales as measured byBroadridgersquos SalesWatch confidential service The 60 SalesWatch membersare estimated to account for 75-80 of total cross-border sales activity
Footnotes About the Report
EUROPEAN FUND MARKET REVIEW
Page 2224
broadridgecom
Page 2324
broadridgecom
2017 EDITION
Global Market Intelligence reflects our expertiseand understanding of markets worldwide and ofthe evolving needs of asset managers
To learn more and to schedule a free demo ofGlobal Marketing Intelligence visitwwwbroadridgecomGMI today
For more information please contactlauracohenbroadridgecom
No part of this document may be distributed reproduced or posted without the expresswritten permission of Broadridge Financial Solutions Inc copy2017 Broadridge Financial Solutions Inc Broadridge and the Broadridge logo areregistered trademarks of Broadridge Financial Solutions Inc
FundFile SalesWatch
Global
Market
Intelligence
EUROPEAN FUND MARKET REVIEW
Page 2424

2017 EDITION
broadridgecom
The following report is based on the unique fund analytics delivered throughBroadridge Global Market Intelligence (GMI) our leading global fundanalytics database The charts and tables in this report reflect only the tip ofthe iceberg in terms of the depth and breadth available from Broadridge GMIThe report offers a high-level overview of European fund flow activity in2016
Global Market Intelligence (GMI) helps you make more strategic decisionsmore effectively allocate your companyrsquos resources and most importantlybe more responsive to your customersrsquo needs all through the combining thepower of the FundFile and SalesWatch datasets
Broadridge FundFile enables deep fund flows analysis of all keygeographical markets covering Asia Pacific Latin America the Middle Eastand Africa and North America and delivers a truly global fund flows solutionBy gradually building the international reach of its global sales data andmaintaining its high quality and ease of use over the past ten years FundFilehas become the unparalleled source of data and analysis with informationon more than 100000 funds
The cross-border dimension of the European funds industryndashtheldquointernationalrdquo fund marketndashcan truly be assessed only with BroadridgeSalesWatch a unique cooperative and confidential benchmarking servicethat allows leading fund groups to track their cross-border sales and assetsagainst their competitorsrsquo by country distribution channel institutional versusretail activity and both gross and net sales This service now counts 60 ofthe leading asset managers among its members (Some sample data takenfrom the tool can be seen on pages 20 and 21 of the current report)
1 All data is at December 2016 unless otherwise stated
2 lsquoInternationalrsquo fund market Broadridge defines an International fund as afund that sources less than 80 of its assets from any single country Somefund groups have domestic and international funds
3 lsquoDomesticrsquo fund market If a fund sources more than 80 of its assets from asingle country then the fund is allocated to that market regardless of itsdomicile
4 Funds of funds have been excluded from all charts and tables (to avoiddouble counting) unless otherwise stated Therefore a market total is the sumof all the investment categories excluding the three funds of funds categories(in-house ex-house and hedge)
5 The investment category lsquootherrsquo includes a variety of different productcategories For most markets especially Belgium Spain and France the figurecomprises guaranteed funds but there are also derivatives and other specialityfunds in the lsquootherrsquo category
6 Property funds are open-ended property funds only
7 Master group Analysis that aggregates the European mutual fund assetsunder the umbrella of their parent company name
8 ETFs are included in broadridgersquos database on mutual funds but thisexcludes exchange-traded commodity products that are not mutual funds
9 References to foreign activity relate to actual sales as measured byBroadridgersquos SalesWatch confidential service The 60 SalesWatch membersare estimated to account for 75-80 of total cross-border sales activity
Footnotes About the Report
EUROPEAN FUND MARKET REVIEW
Page 2224
broadridgecom
Page 2324
broadridgecom
2017 EDITION
Global Market Intelligence reflects our expertiseand understanding of markets worldwide and ofthe evolving needs of asset managers
To learn more and to schedule a free demo ofGlobal Marketing Intelligence visitwwwbroadridgecomGMI today
For more information please contactlauracohenbroadridgecom
No part of this document may be distributed reproduced or posted without the expresswritten permission of Broadridge Financial Solutions Inc copy2017 Broadridge Financial Solutions Inc Broadridge and the Broadridge logo areregistered trademarks of Broadridge Financial Solutions Inc
FundFile SalesWatch
Global
Market
Intelligence
EUROPEAN FUND MARKET REVIEW
Page 2424

broadridgecom
2017 EDITION
Global Market Intelligence reflects our expertiseand understanding of markets worldwide and ofthe evolving needs of asset managers
To learn more and to schedule a free demo ofGlobal Marketing Intelligence visitwwwbroadridgecomGMI today
For more information please contactlauracohenbroadridgecom
No part of this document may be distributed reproduced or posted without the expresswritten permission of Broadridge Financial Solutions Inc copy2017 Broadridge Financial Solutions Inc Broadridge and the Broadridge logo areregistered trademarks of Broadridge Financial Solutions Inc
FundFile SalesWatch
Global
Market
Intelligence
EUROPEAN FUND MARKET REVIEW
Page 2424