Embed Size (px)
Citation preview

1
Pursuant to Chapter 38 of the Rules Governing the Listing of Securities on The Stock Exchange of Hong Kong Limited, the Securities and Futures Commission regulates Hong Kong Exchanges and Clearing Limited in relation to the listing of its shares on The Stock Exchange of Hong Kong Limited. The Securities and Futures Commission takes no responsibility for the contents of this announcement, makes no representation as to its accuracy or completeness, and expressly disclaims any liability whatsoever for any loss howsoever arising from or in reliance upon the whole or any part of the contents of this announcement.
(Financial figures in this announcement are expressed in HKD unless otherwise stated)
2017 FINAL RESULTS, FINAL DIVIDEND AND CLOSURE OF REGISTER OF MEMBERS
The Board is pleased to submit the Group’s consolidated results for the year ended 31 December 2017.
FINANCIAL HIGHLIGHTS 2017
$m 2016
$m
Change
Key messages
Profit attributable to shareholders for 2017 was 28 per cent higher than prior year reflecting the combined effect of revenue
growth and continuing cost discipline. Key highlights for the year include:
Revenue and other income for 2017 was 19 per cent higher than 2016. This growth included:
- Higher trading and clearing fees driven by a 32 per cent increase in Cash Market turnover, partly offset by lower HKFE
volumes and LME revenue;
- An increase in Stock Exchange listing fees from growth in the number of newly listed securities; and
- A significant increase in net investment income from both Corporate and Margin Funds.
Operating expenses grew by 3 per cent against the prior year. While continuing to invest in key strategic initiatives, the
Group has maintained a disciplined approach to cost management.
The EBITDA margin of 73 per cent was 4 per cent higher than 2016, driven by the significant growth in revenue and other
income as compared to the prior year.
2017 2016 Change
KEY MARKET STATISTICS
ADT of equity products traded on the Stock Exchange ($bn) 71.2 50.2 42%
ADT of DWs, CBBCs and warrants traded on the Stock Exchange ($bn) 17.0 16.7 2% ADT traded on the Stock Exchange ($bn) 88.2 66.9 32%
ADV of derivatives contracts traded on the Futures Exchange 441,320 463,841 (5%)
ADV of stock options contracts traded on the Stock Exchange 428,499 297,903 44%
ADV of metals contracts traded on the LME (lots) 624,480 618,627 1%
1 For the purposes of this announcement, EBITDA is defined as earnings before interest expenses and other finance costs, taxation,
depreciation and amortisation. It excludes the Group’s share of results of the joint ventures.
Revenue and other income 13,180 11,116 19%
Operating expenses 3,566 3,455 3%
EBITDA1 9,614 7,661 25%
Profit attributable to shareholders 7,404 5,769 28%
Basic earnings per share $6.03 $4.76 27%
Interim dividend per share $2.55 $2.21 15%
Final dividend per share $2.85 $2.04 40%
$5.40 $4.25 27%
Dividend payout ratio 90% 90% –
(Incorporated in Hong Kong with limited liability)
(Stock Code: 388)

2
CHAIRMAN’S STATEMENT A strong economic upswing across the world had set a favourable backdrop that helped boost investment sentiment in capital markets. In Hong Kong, we witnessed a bullish securities market especially in the fourth quarter of 2017 when the average daily turnover reached $107.3 billion. Building on the mutual market access strategy, HKEX has continued to benefit from increased capital inflows through Stock Connect, and is making great strides towards its objective of becoming the global exchange of choice across asset classes. We are pleased to see that a number of new records have been set on HKEX’s trading platforms.
Our Performance The securities market in Hong Kong recorded a strong performance in 2017 amid robust market momentum. Trading in our derivatives market was also strong, in particular both RMB Currency Futures and Stock Options recorded remarkable growth in trading volume. In London, metals trading volumes on the LME stabilised in 2017 as activity remained constrained by commodities market conditions and other factors.
Given the strong turnover in the Hong Kong securities market and significant growth in our investment income, the Group’s total revenue and other income rose, reaching $13.2 billion for the year ended 31 December 2017, up 19 per cent from 2016, while the profit attributable to shareholders was $7,404 million, up 28 per cent.
Dividend The Board recommends a final dividend of $2.85 per share, which together with the interim dividend of $2.55 paid in September 2017, results in a full-year dividend of $5.40 per share.
Strategic Update In 2017, we made notable achievements in driving forward our strategic plan to build HKEX into a leading global multi-asset class exchange connecting China and the world. The launch of Bond Connect in July marked another important milestone under our mutual market access programme by providing international investors with direct, convenient access to the China Interbank Bond Market via Hong Kong. After implementing Realtime Delivery versus Payment money settlement for the Northbound related transactions in November, we continue to work with regulators and our Mainland counterparts to further enhance the Connect programme, including enabling holiday trading and broadening the programme to cover other asset classes such as ETFs.
Market highlights in 2017
The number of new listings hit an all-time high of 174 companies.
Securities market turnover was over $100 billion for 30 consecutive trading days from 6 November to
15 December, the longest such period since March 2015.
The market capitalisation of the securities market reached a new record-high of $34 trillion on the last trading day
of 2017.
Northbound and Southbound Trading through Stock Connect grew significantly from 2016, increasing by
194 per cent and 170 per cent respectively.
Turnover of securitised derivatives (DWs and CBBCs) was the world’s highest for the 11th consecutive year.
Turnover of RMB Currency Futures - USD/CNH Futures reached a new record-high of 732,569 contracts.
Turnover of Stock Options also set a new record high, rising to 105,839,179 contracts.

3
On the product front, we focused on deepening our capabilities in the fixed income, currency and commodities markets to provide more comprehensive tools for trading, asset allocation and risk management. We rolled out the world’s first USD/CNH dual currency Gold Futures contract with physical settlement in Hong Kong in July, alongside LME Gold and Silver Futures as part of LMEprecious in London. We also launched HKEX’s first ferrous metal product, Iron Ore Futures, in November, complementing its precious and base metals products. Following the introduction of our first RMB Currency Options in March, we announced plans to offer additional long-dated contract months for products in HKEX’s derivatives market in 2018. All these product initiatives, along with our Connect programme, have laid a solid foundation for Hong Kong to become China’s global wealth management centre and the offshore hub for RMB internationalisation. Both our Stock Exchange and the LME made important progress in 2017 through active market engagement and gaining industry support for plans to enhance their competitiveness and accelerate growth, in response to the evolving market environment. In Hong Kong, drawing on the market feedback to the New Board Concept Paper published in June, the Exchange issued the conclusions in December setting out its proposed way forward to expand Hong Kong’s listing regime to facilitate listings of companies from emerging and innovative sectors, subject to appropriate safeguards. The consultation paper on related proposed Listing Rule amendments was subsequently published in February 2018. In London, following a comprehensive period of engagement with the market, the LME announced its Strategic Pathway in September, aiming to protect the physical market, ensure fairness, increase user choice and maximise trading efficiency. As part of its delivery programme announced in October, the LME has reduced the short and medium-dated carry fees. The LME further issued a market consultation in November 2017 on the introduction of an OTC booking fee for financial participants and enhanced trading regulations in support of market fairness. The consultation decision notice will be published in due course. Details of the Group’s performance and initiatives undertaken in 2017 are set out in the Chief Executive’s Review and Business Review sections of this announcement.
Quality Market Throughout 2017, we continued working closely with regulators and stakeholders to uphold the efficiency and quality of our Hong Kong market. Following the implementation of the Volatility Control Mechanism in the derivatives market in January, we introduced a revised stock option position limit model in June, Phase 2 of the Closing Auction Session in the securities market in July and Phase 1 of the after-hours derivatives trading (T+1 session) enhancements in November. The launch of client clearing by OTC Clear in March enables financial institutions in the region that are not OTC Clear Members to enjoy the capital efficiencies of central clearing. Further, the Orion Trading Platform – Securities Market was launched in February 2018 to support new business and meet increased capacity requirements over the next decade. The joint consultation conclusions published together with the SFC in September paved the way for further strengthening of the Exchange’s decision-making and governance structure for listing regulation in Hong Kong. During the year, the Exchange also launched a number of market consultations on listing matters, including GEM reform, capital raisings, delisting and the Corporate Governance Code. The conclusions on the GEM reform were published in December, whilst the conclusions on other areas will be published after completion of a thorough analysis of market feedback.
Environmental, Social and Governance Performance HKEX is committed to high standards of corporate governance as well as social and environmental stewardship, as they help achieve sustainable success for the Group and our stakeholders. In 2017, we engaged an independent external consultant to evaluate the performance of the boards of HKEX and of its two subsidiaries in the UK. We are pleased that the evaluation recognised many strengths of the HKEX Board and concluded that it operates effectively and performs well in its governance of HKEX. The evaluation also concluded that the performance of the LME Board and the LME Clear Board was in compliance with the applicable laws and governance codes and is largely well aligned with international best practices. Underscoring our commitments as a responsible corporate citizen, we are working to establish a charitable foundation to serve as the single channel and point of focus for all of the Group’s corporate giving. This will enable us to better fulfil our corporate social responsibilities and to have a more positive and influential impact on our communities.

4
Details of our efforts in promoting sustainability in our marketplace, workplace, community and environment are set out in our 2017 CSR Report which will be available on the HKEX Group website together with the 2017 Annual Report.
Outlook While the market generally expects that the global economic growth will extend into 2018, stock markets across the world saw increased volatility in the first two months of the year. Geopolitical risks, the fiscal and monetary policies of the US and Europe, a possible rise in trade protection sentiment and potential changes in global capital flows caused by the US tax reform continue to pose challenges to the global financial markets. The world is also moving into a new era of new economy businesses and technology innovations, and the financial markets are facing a landscape filled with both opportunities and challenges. In positioning the Group to continue its success in this new environment, we will focus on completing the listing regime reform, further enhancing cross-border market connectivity, making our derivatives market more competitive and strengthening our risk management and market structure to capture new growth opportunities.
Acknowledgements My term as the Chairman of HKEX will come to an end after conclusion of the 2018 AGM. It has been a privilege to serve on the Board and have the opportunity to work alongside my fellow Board members and the Group’s management over the past six years. I have been most pleased to see the achievement of a number of important milestones and strategic initiatives, including the acquisition of the LME, the implementation of the Connect programme, the launch of the listing regime reform and the renewal of our technology platforms. HKEX has been transformed from a local exchange into an international exchange of multi-asset classes. They provide a solid foundation and unprecedented opportunities for long-term sustainable growth. We have a strong board in place to lead the Group forward, through good times and bad. On behalf of the Board, I would like to express our gratitude to Tim Freshwater, who will also retire after the conclusion of the 2018 AGM, for his valuable contribution and advice during his second six-year term on the Board. Finally, I would like to thank our Shareholders and other stakeholders for their steadfast support to me and to the Group. I am very proud of our employees, and am grateful for their invaluable contribution to the Group’s sustainable success; they are the heroes of HKEX.
CHOW Chung Kong
Chairman

5
CHIEF EXECUTIVE’S REVIEW 2017 was a breakthrough year for the Company. Various new records in the securities and derivatives markets were set, and many of our key initiatives set out in the Strategic Plan 2016-2018 were achieved. We decided to implement the biggest listing regime reform in 25 years after extensive market engagement. Mutual market access continued to be a key theme of our business, and the successful launch of Bond Connect has taken the competitiveness of our market to a whole new level beyond equities. In addition, various new products across different asset classes were launched to broaden our market and meet investor demand across the globe. Our efforts in pushing forward reforms and constantly enhancing our market structures in Hong Kong and London have laid a strong foundation for us to further entrench our value propositions as we enter the final year of our Strategic Plan 2016-2018.
Active and Vibrant Market Performance
Our primary market performed competitively in 2017. HKEX ranked third globally in IPOs with a record high 1741 companies listing and raising $128.5 billion in total. Our existing listed companies also raised $452.9 billion, an increase of 54 per cent over 2016. Total funds raised reached $581.4 billion. In the secondary market, market momentum reached its peak during the fourth quarter. The full-year 2017 ADT for the Cash Market reached $88.2 billion, a 32 per cent increase compared to 2016. Thirty consecutive days for ADT above $100 billion were recorded between November and December 2017. The market capitalisation of the securities market reached $33,999 billion on the last trading day of the year, exceeding the previous record of $31,550 billion set on 26 May 2015. Trading in the derivatives market was strong, largely driven by stock options and index options, with a number of new records set in 2017. Total futures and options turnover reached 214,845,348 contracts, an increase of 14 per cent from 2016. Total options turnover reached record highs of 137,785,021 contracts, an increase of 32 per cent from 2016. Open interest at year-end was 11,155,770 contracts, up from 9,296,110 at the previous year-end.
Average Daily Turnover on
Cash Market
Average Daily Number of Contracts Traded on
Derivatives Market
1 Includes transfers of listing from GEM to the Main Board
$bn Options Contracts (’000) Futures Contracts (’000)
66.9 74.3 77.8
93.2
107.3
Full Year2016
2017 Q1 2017 Q2 2017 Q3 2017 Q4
421 473 495
601 659
340 287 305 304
352
Full Year2016
2017 Q1 2017 Q2 2017 Q3 2017 Q4

6
Business Development Review
Enhancing the Competitiveness of Our Core Businesses
In the primary market, a number of consultations were launched in 2017. The joint consultation with the SFC on proposed enhancements to the Exchange’s decision-making and governance structure for listing regulation and the New Board Concept Paper were concluded in September and December respectively. In relation to the joint consultation, after carefully considering market feedback, the SFC and the Exchange concluded and clarified the respective roles of the SFC and the Exchange under the enhanced structure. The Exchange will remain the primary frontline regulator for listed issuers and the role of the Listing Committee under the Listing Rules will remain largely unchanged. In relation to the New Board Concept Paper, a major breakthrough was made when the market reached a clear consensus on broadening HKEX’s listing regime to facilitate listings of companies from emerging and innovative sectors. Drawing on the feedback received and subsequent regulatory discussions with the SFC, we have proposed a way forward to expand the existing listing regime by introducing two new chapters to the Main Board Listing Rules to allow the listing of (i) Biotech companies which do not meet any of the financial eligibility requirements of the Main Board; and (ii) issuers from emerging and innovative sectors that have weighted voting rights structures, subject to additional disclosure and safeguards. With these reforms, we will put Hong Kong in a position to capture the next generation of opportunities and ensure our market’s long-term prosperity while safeguarding our market’s integrity. Formal consultation on the proposed Listing Rule amendments was launched in February 2018. In the secondary market, we continued to implement major market microstructure upgrades for the securities and derivatives markets in 2017 to enhance our overall competitiveness. These include the introduction of Volatility Control Mechanism in the derivatives market and Phase 2 of the Closing Auction Session to further facilitate trade execution at closing prices. In response to market feedback, we introduced an enhanced stock option position limits regime in June 2017, effectively tripling the maximum position limit for stock options and expanding the scope of activities for hedging exemptions. Consultation on the proposed after-hours trading enhancements was concluded in August 2017, following which the after-hours trading of index futures was extended from 11:45 pm to 1:00 am in November 2017.
Reaching New Milestones for Mutual Market Access
Stock Connect
Shanghai-Hong Kong Stock Connect and Shenzhen-Hong Kong Stock Connect continued to gain wider market acceptance in 2017. Trading volumes in both directions on Stock Connect rose significantly with total Northbound turnover reached RMB2,266 billion, an increase of 194 per cent and Southbound turnover reached $2,259 billion, an increase of 170 per cent from 2016. In particular, Southbound ADT almost trebled to $9.8 billion, accounting for more than 5 per cent of headline ADT. As of the end of 2017, net money inflow into the Mainland and into Hong Kong reached RMB348 billion and $726 billion respectively since launch. The decision by MSCI in June 2017 to include China A Shares in its Emerging Markets Index and All Country World Index in 2018 was an acknowledgement of the important role of Stock Connect in the opening up of the Mainland stock markets. International investors have also shown a growing enthusiasm for China A Shares and the use of Stock Connect. We will continue to work with regulators and Mainland counterparts on enrichment of the variety of traded products, including ETF Connect and further enhancements to the operating model such as holiday trading arrangements and an investor identification regime for Northbound Trading.
7
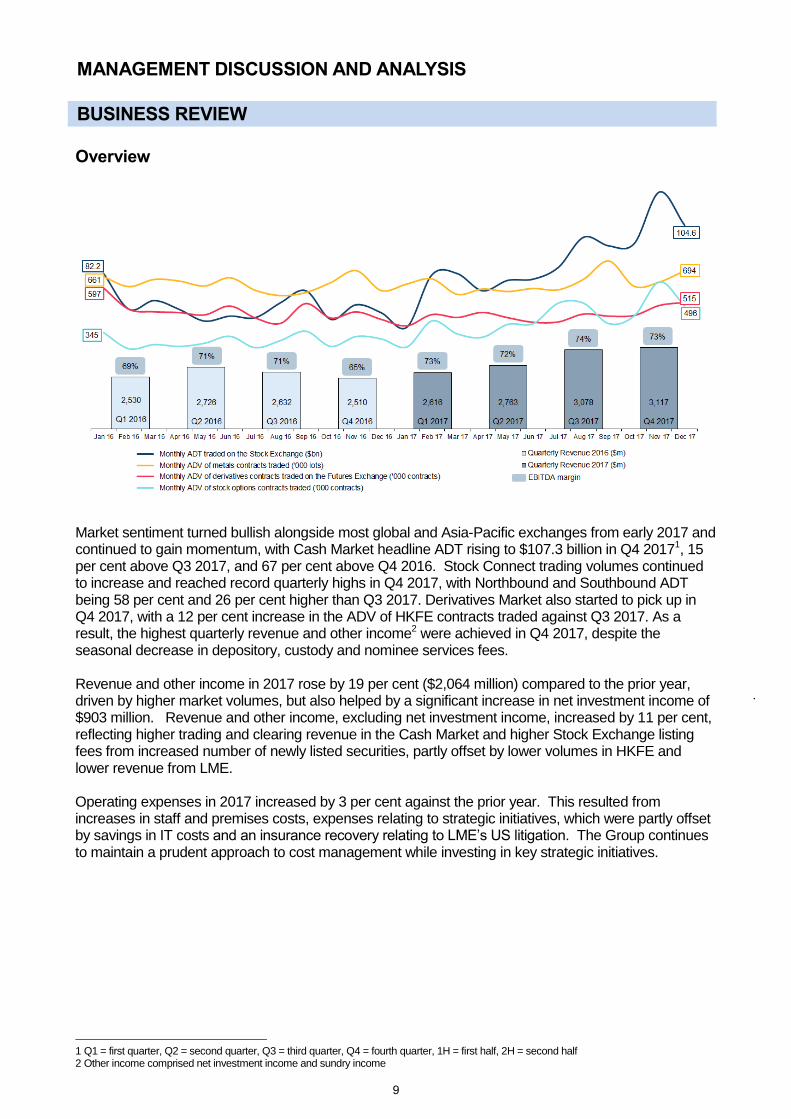
Bond Connect
The successful launch of Bond Connect Northbound trading on 3 July 2017 marked another important milestone for our mutual market access programme. Bond Connect is a significant breakthrough in the opening of the Mainland bond market, allowing a broader group of international investors to access the China Interbank Bond Market (CIBM) via Hong Kong. Bond Connect Company Limited, a joint venture between CFETS and HKEX, was set up to support Bond Connect-related trading services, investor education and other services. Since launch, the overall foreign investor holdings in the CIBM domestic debt securities have reached RMB1,147 billion, an increase of 36 per cent from 30 June 2017.
Expanding Our FIC Product Offerings
In 2017, we continued our efforts to provide a full range of RMB-related derivatives to help entrench Hong Kong as a gateway for cross-border fund flows and a risk management centre in connection with the internationalisation of the RMB. Our USD/CNH Currency Futures contract continued to see notable growth in liquidity with total turnover of 732,569 contracts, representing a 36 per cent growth compared to 2016. New RMB Currency Options were launched on 20 March 2017 to complement our existing currency futures, enabling investors to execute more trading strategies. 5-Year China Ministry of Finance Treasury Bond Futures were launched during April - December 2017 as a pilot scheme for foreign investors to hedge against interest rate volatility of RMB assets. Subject to regulatory development, HKEX will consider launching new RMB interest rate products that are complementary to Bond Connect at an appropriate time. OTC Clear was awarded the “Best OTC Clearing and Risk Management System Implementation” by the Asian Banker and “Clearing House of the Year” by Asia Risk in 2017 as the first international clearing house to provide a clearing service for USD/CNH cross currency swaps. A total of US$38.7 billion notional was cleared by OTC Clear in 2017, up eight-fold from 2016. Going forward, we will further expand OTC Clear’s offering to cover clearing for wider types of RMB-based exchange rate products.
Laying the Groundwork for Our Commodities Business
Impacted by global macroeconomic conditions, the trading volumes of LME metal contracts remained largely at the same level as 2016. ADV of contracts traded on the LME was 624,480 lots, 1 per cent higher than 2016. Declines in volumes of key products including LME Aluminium and Copper were offset by increase in LME Zinc, Nickel, Lead and Ferrous volumes, as well as the launch of LMEprecious contracts. Year-end LME futures market open interest was 2.3 million lots, up 2 per cent year-on-year. In September 2017, the LME published the “LME Strategic Pathway” to set out a vision for supporting the physical market and stimulating volumes, following an extensive and comprehensive period of market engagement. Immediate actions included the implementation of fee reductions on short and medium-dated carries as well as the proposed introduction of a financial OTC booking fee. Expansion in our product offerings continued to be one of the key areas of our commodity strategy in 2017. In July 2017, we launched the LMEprecious and HKEX’s first pair of deliverable CNH and USD Gold Futures. In addition, Iron Ore Futures were introduced in November 2017 as our first ferrous metal product in Hong Kong. These new contracts complemented our existing product offerings and provided investors with new tools for trading, hedging and asset allocation. As part of our commodity strategy, we continued our preparations for Qianhai Mercantile Exchange in Shenzhen. The commodity trading platform will focus on providing physical trading and related enhanced services, with a long term goal of serving China’s real economy and developing representative bulk commodities price benchmarks for Mainland China.

8
Strengthening Platform and Infrastructure Capabilities
We continued to undertake various projects in Hong Kong and London with a view to upgrading and transforming our key systems for the securities and derivatives markets. Major preparation work included the launch of the new trading platform for the securities market, upgrades of the trading and clearing platforms for the derivatives market, as well as the upgrades of the LMEselect electronic trading engine and the LMEsmart matching platform. The planning process for the Next Generation Clearing Platform in areas of data warehouse, risk engine and client portal was completed during the year for delivery over the next two years.
Strategic Outlook – Final Chapter of Strategic Plan 2016-2018
2017 marked the end of the Hong Kong markets floor-trading, open since 1986, as we announced the redevelopment of the Trading Hall and Exchange Exhibition Hall on 27 October 2017. The new HKEX Connect Hall was recently reopened on 20 February, symbolising the beginning of a brand new era for Hong Kong’s financial markets. Looking forward, 2018 is the critical conclusion year of our Strategic Plan 2016-2018. Building on the solid groundwork and the significant progress already made, we strive to make our IPO market more relevant, our equity market more connected, and our derivatives market more competitive. Key areas of focus include implementing listing reform, extension of Stock Connect by including ETFs and other assets, building of new product ecosystems and the launch of derivative products with Mainland underlyings, as well as the launch of new trading systems in the securities and derivatives markets. We are confident that these initiatives will further boost the competitiveness of our market at a time of vast opportunity in the new global economy.
Appreciation
The achievements in 2017 are the result of foresight and hard work over many years. I would like to express my greatest appreciation to the HKEX Group staff who have not only maintained smooth operation of our markets in 2017 but also made great progress and breakthroughs under our Strategic Plan 2016-2018. I would also like to take this opportunity to thank the senior executives who left us in 2017, in particular Bill Chow (Former Chief Technology Officer & Co-head of Information Technology Division), who retired in April after 24 years of service, and Paul Kennedy (Former Group Chief Financial Officer), who remains as a Senior Advisor, for their contributions to the HKEX Group. I must also thank our regulators in Hong Kong and other markets, especially the SFC, the Hong Kong Monetary Authority, market participants and other stakeholders for their continuous support on our various initiatives. Last but not least, I would like to thank my fellow members of the Board for their tremendous trust and guidance. On behalf of the Company, I also would like to express our sincere gratitude to our Chairman, the Honourable Chow Chung Kong, who will step down in April 2018. During his six years of service on the Board, he has upheld shareholder value and played a pivotal role in steering HKEX to achieving our many strategic milestones, including the acquisition of the LME, mutual market access schemes, as well as the listing regime reform. I look forward to receiving his continued counsel and support for the further development of HKEX. I am confident that with our efforts and persistence, we will continue to make the most of the compelling opportunities ahead and cement Hong Kong’s unique role in connecting China and the world.
LI Xiaojia, Charles
Director and Chief Executive
9
MANAGEMENT DISCUSSION AND ANALYSIS
BUSINESS REVIEW Overview
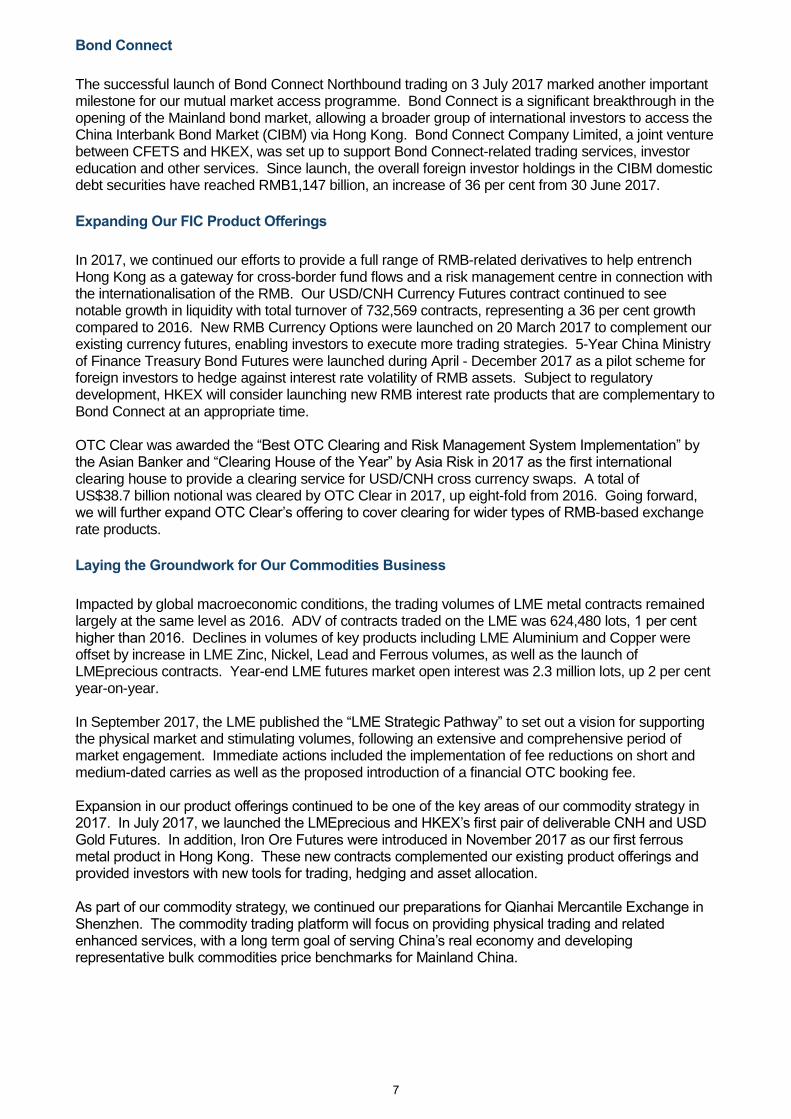
Market sentiment turned bullish alongside most global and Asia-Pacific exchanges from early 2017 and continued to gain momentum, with Cash Market headline ADT rising to $107.3 billion in Q4 20171, 15 per cent above Q3 2017, and 67 per cent above Q4 2016. Stock Connect trading volumes continued to increase and reached record quarterly highs in Q4 2017, with Northbound and Southbound ADT being 58 per cent and 26 per cent higher than Q3 2017. Derivatives Market also started to pick up in Q4 2017, with a 12 per cent increase in the ADV of HKFE contracts traded against Q3 2017. As a result, the highest quarterly revenue and other income2 were achieved in Q4 2017, despite the seasonal decrease in depository, custody and nominee services fees. Revenue and other income in 2017 rose by 19 per cent ($2,064 million) compared to the prior year, driven by higher market volumes, but also helped by a significant increase in net investment income of $903 million. Revenue and other income, excluding net investment income, increased by 11 per cent, reflecting higher trading and clearing revenue in the Cash Market and higher Stock Exchange listing fees from increased number of newly listed securities, partly offset by lower volumes in HKFE and lower revenue from LME. Operating expenses in 2017 increased by 3 per cent against the prior year. This resulted from increases in staff and premises costs, expenses relating to strategic initiatives, which were partly offset by savings in IT costs and an insurance recovery relating to LME’s US litigation. The Group continues to maintain a prudent approach to cost management while investing in key strategic initiatives.
1 Q1 = first quarter, Q2 = second quarter, Q3 = third quarter, Q4 = fourth quarter, 1H = first half, 2H = second half 2 Other income comprised net investment income and sundry income

10
Cash Segment
Key Market Indicators 2017 2016 Change
ADT of equity products traded on the Stock Exchange
1, 2 ($bn)
71.2
50.2
42%
ADT of Northbound Trading – Shanghai-Hong Kong Stock Connect
2 (RMBbn)
5.6
3.2
75%
ADT of Northbound Trading – Shenzhen-Hong Kong Stock Connect
2 (RMBbn)
4.0
1.5
167%
Average daily number of trades of equity products traded on the Stock Exchange
1, 2
1,034,651
895,170
16%
Number of newly listed companies on Main Board
3 94 81 16%
Number of newly listed companies on GEM 80 4 45 78%
Number of companies listed on Main Board at 31 Dec 1,794 1,713 5%
Number of companies listed on GEM at 31 Dec 324 260 25%
Total 2,118 1,973 7%
Market capitalisation of companies listed on Main Board at 31 Dec ($bn)
33,718
24,450
38%
Market capitalisation of companies listed on GEM at 31 Dec ($bn)
281
311
(10%)
1 Excludes DWs, CBBCs and warrants (which are included under the Equity and Financial Derivatives segment) and includes Southbound
Trading ADT of $7.5 billion (2016: $3.6 billion) under Shanghai-Hong Kong Stock Connect and $2.3 billion (2016: $0.5 billion) under Shenzhen-Hong Kong Stock Connect
2 Includes buy and sell trades under Stock Connect. Shenzhen-Hong Kong Stock Connect was launched on 5 December 2016.
3 Includes 13 transfers from GEM (2016: 6)
4 New record high in 2017
2017 $bn
2016 $bn
Change
Total equity funds raised on Main Board
– IPOs 122.6 190.7 (36%)
– Post-IPO 444.8 280.5 59%
Total equity funds raised on GEM
– IPOs 5.9 4.6 28%
– Post-IPO 8.1 14.3 (43%)
260.3 Total 581.4 490.1 19%
Stock Connect – New Record Highs in 2017
2017 2016 Change
Northbound Trading value (RMBbn) 2,266 771 194%
Southbound Trading value ($bn) 2,259 836 170%
Total revenue and other income 1 ($m) 412 177 133%
1 $238 million of which arose from trading and clearing activities (2016: $81 million)

11
Analysis of Results Summary
2017 $m
2016 $m Change
Trading fees and trading tariff 1 1,954 1,421 38%
Stock Exchange listing fees 1 828 770 8%
Market data fees 1 490 422 16%
Other revenue and sundry income 91 70 30%
Total revenue and other income 3,363 2,683 25%
Operating expenses 2 (581) (544) 7%
EBITDA 2,782 2,139 30%
EBITDA margin 83% 80% 3%
1 Excludes DWs, CBBCs and warrants (which are included under the Equity and Financial Derivatives segment)
2 Includes Listing Division costs relating to equity products traded on the Stock Exchange
Trading Fees and Trading Tariff
Trading fees and trading tariff increased by $533 million or 38 per cent. The increase was lower than the 42 per cent growth in ADT of equity products primarily due to an increase in average transaction size, which dampened the increase in trading tariff income.
1
Excludes DWs, CBBCs and warrants (which are included under the Equity and Financial Derivatives segment)
Stock Exchange Listing Fees
2017
$m 2016
$m Change
Annual listing fees 687 646 6%
Initial and subsequent issue listing fees 133 117 14%
Others 8 7 14%
Total 828 770 8%
1,205
216
1,421
1,708
246
1,954
0
500
1,000
1,500
2,000
Trading fees Trading tariff Total
$m
2016 2017
$71.2 bn
$50.2 bn
895
1,035
Average daily number of trades of equity products traded on the Stock Exchange ('000) 1
ADT of equity products traded on the Stock Exchange 1

12
Annual listing fees increased in line with the rise in the total number of listed companies.
Initial and subsequent issue listing fees increased with the number of newly listed companies. However, the average fee per listing was lower as a higher proportion of new listings was on GEM, which charges lower fees than the Main Board.
Market Data Fees Market data fees increased by 16 per cent as a result of higher allocated revenue following a higher percentage increase in the volume of cash equities traded, compared with the increase in the volumes of DWs, CBBCs and warrants traded. EBITDA Operating expenses increased by $37 million or 7 per cent due to additional headcount for strategic projects, annual payroll adjustments and higher variable pay. The increase in EBITDA margin from 80 per cent to 83 per cent reflects the increase in revenue.
Business Update
2017 has been a positive year for the Cash Market, with headline ADT being 32 per cent higher than 2016. In particular, Q4 2017 ADT was up by 67 per cent compared to Q4 2016 and was 15 per cent higher than Q3 2017. Market capitalisation reached a record high of $33,999 billion on 29 December 2017.
Stock Connect
The Stock Connect programme continued to gather momentum in 2017. As Shanghai and Shenzhen Connect celebrated their third and first anniversaries respectively, a number of record highs (see table under Key Market Indicators section) were reached. The increase in trading volume demonstrates an increasing interest among Mainland investors in diversifying their investments into Hong Kong, and rising demand from Hong Kong and international investors for A shares. Northbound turnover over the longer term could potentially benefit from MSCI’s announcement in June 2017 of its plan to include A shares in the Emerging Markets Index and All Country World Index (ACWI) in 2018. On 30 November 2017, the SFC announced an investor identification regime for Northbound Trading, and HKEX published an information paper on the topic on the same date. The new arrangement, which aims to facilitate market surveillance and monitoring in accordance with the home market rule principle of Stock Connect, requires relevant EPs to assign a unique number to each of their Northbound Trading clients, and tag the number to every Northbound order on a real-time basis. The regime is tentatively scheduled to be implemented in Q3 2018.
646 687
1,973 2,118
02004006008001,0001,2001,4001,6001,8002,0002,200
0
200
400
600
800
1,000
2016 2017
Number Fees
$m
Annual Listing Fees
Annual listing fees
Total number of listed companies at 31 Dec
18 13
99 120
117 133
126
174
0
20
40
60
80
100
120
140
160
180
0
20
40
60
80
100
120
140
160
180
200
2016 2017
Number Fees
$m
Initial and Subsequent Issue Listing Fees
Total number of newly listed companies
Initial listing fees
Subsequent issue listing fees

13
Issuer Business
To continue to promote Hong Kong as a preferred listing venue of choice, HKEX organised 24 large-scale events and conducted 86 seminars in both Mainland China and globally in 2017. A key focus for HKEX is to expand Hong Kong’s listing regime to facilitate listings of companies from emerging and innovative sectors. In June and August respectively, HKEX jointly organised conferences with two key technology incubators in Hong Kong – Hong Kong Science and Technology Parks Corporation and Hong Kong Cyberport – to promote Hong Kong’s fundraising landscape to aspiring “new economy” leaders. Similar symposiums were co-organised with hi-tech parks in China, as well as internationally, to further encourage “new economy” companies to consider Hong Kong as the listing venue of choice. ETF Market Development
Following the successful introduction of Leveraged and Inverse Products (L&I Products) on foreign equity indices in 2016, HKEX further expanded its Exchange Traded Product (ETP) market (which comprises ETF and L&I Products) with the successful listings of 18 L&I Products tracking HSI and HSCEI in 2017. In 2017, ETP market capitalisation and ADT grew to $636 billion (up 13 per cent) and $4.7 billion (up 14 per cent) respectively. Closing Auction Session
Phase 2 of the Closing Auction Session (CAS) was launched successfully on 24 July 2017 to further facilitate trade execution at closing prices. The list of CAS Securities was also expanded to include constituents of the Hang Seng Composite SmallCap Index, and input of regulated short selling orders during the CAS was also allowed.
Market Structure Development
HKEX has completed the 2017 Annual Attestation and Inspection Programme and will share our findings with the market in 2018. Practical guidance on compliance with the Exchange Rules, including a set of Illustrative Examples on Short Selling Order Flagging Requirements, has been published. HKEX rolled out enhanced Cash Market and cross market surveillance between SEHK and HKFE markets in order to expand the monitoring coverage in its robust mechanism for market surveillance. In 2018, HKEX will deploy artificial intelligence and machine-learning technology in our real-time surveillance to strengthen market abuse detection.
Bond Connect
Bond Connect is a significant breakthrough in the opening of the Mainland bond market, enhancing HKEX’s position in the fixed income market while expanding the mutual market access programme, that began in 2014, from equity into a new asset class. Bond Connect extends HKEX beyond its traditional equities business and lays the foundation for HKEX’s further developments in FIC, particularly in the derivatives business. Bond Connect has been operating smoothly since its launch on 3 July 2017, allowing a broader group of international investors to access the CIBM. Since the launch of Bond Connect, the overall foreign investor holdings in the CIBM’s domestic debt securities rose to RMB1,147 billion as of 31 December 2017, an increase of 36 per cent from 30 June 2017. As at the end of 2017, 247 approved international investors, 24 onshore dealers, 53 Hong Kong local custodians and 20 Hong Kong foreign exchange settlement banks were participating in Bond Connect. During 2H 2017, the Bond Connect delegation participated in a number of non-deal roadshows and seminars to help local and international investors understand the practical arrangements and latest developments of Bond Connect. BCCL, a joint venture established by CFETS and HKEX, is now working with the Mainland and Hong Kong authorities and financial infrastructure institutions, to introduce further enhancements to Bond Connect.

14
Market Data Business
HKEX continues its efforts to further promote market transparency of Stock Connect trading by increasing the visibility and penetration of securities market data in the Mainland. Marketing programmes with an aim to provide more flexible fee packages such as discounts, fixed fees and mobile application services are well received by the market. In addition, historical data products on Stock Connect as well as a complimentary market data feed, which includes Stock Connect turnover statistics and Northbound daily quota balance, were also launched during 2017 enhancing HKEX’s market data services. Listing Regulation
In 2017, the Stock Exchange issued various proposals and conclusions on Listing Rules amendments as set out in the following table. Details of the consultations and other main policy issues arising in 2017 as well as the proposals under review in 2018 will be set out in the 2017 Listing Committee Report. Proposals and Conclusions in 2017
Consultation paper
1
Consultation Conclusions
1
Effective date of changes (if any)
N/A2
Joint Consultation Paper on Proposed Enhancements to The Stock Exchange of Hong Kong Limited's Decision-making and Governance Structure for Listing Regulation
Jun 2016 Sep 2017
N/A3 New Board Concept Paper Jun 2017 Dec 2017
Review of the Growth Enterprise Market (GEM) and
Changes to the GEM and Main Board Listing Rules
Jun 2017 Dec 2017 15 Feb 2018
Delisting and Other Rule Amendments Sep 2017 1H 2018
(tentative) -
Capital Raisings by Listed Issuers Sep 2017 1H 2018
(tentative) -
Proposed Changes to Documentary Requirements
relating to Listed Issuers and Other Minor Rule Amendments
Nov 2017 1H 2018 (tentative)
-
Review of the Corporate Governance Code and Related
Listing Rules
Nov 2017 2H 2018 (tentative)
-
Proposed Exemption for Aircraft Leasing Activities Nov 2017 2H 2018
(tentative) -
1 All the consultation papers and conclusions are available under the News (Market Consultations) section of the HKEX Market website.
2 The SFC and the Stock Exchange have decided to adopt the way forward as set out in the conclusions including establishing a new Listing
Policy Panel and enhancing governance within the Stock Exchange’s structure for reviewing the Listing Committee’s decisions. The Stock
Exchange will conduct a separate consultation on the review system for decisions of the Listing Committee.
3 Drawing on the feedback received in response to the New Board Concept Paper and subsequent regulatory discussions with the SFC, the
Stock Exchange issued the conclusions to the New Board Concept Paper in December 2017 setting out the proposed way forward to
expand the existing listing regime to facilitate the listing of companies from emerging and innovative sectors, subject to appropriate
safeguards. Following discussions with the SFC and other stakeholders, the Stock Exchange published a Consultation Paper on a Listing
Regime for Companies from Emerging and Innovative Sectors on 23 February 2018 to seek public feedback on the detailed proposals and
proposed amendments to the Listing Rules to give effect to the way forward set out in the conclusions.
Key Initiatives by the Stock Exchange to Promote Issuers’ Self-compliance with the Listing Rules Issued series of listing decisions on interpretation of the Listing Rules, including reasons for rejection and return of new
listing applications, whether certain proposed acquisitions would constitute a reverse takeover, sufficiency of operations or assets to meet Listing Rule requirements and suitability of listing
Published guidance materials including (i) guidance letters on pricing flexibility for IPO and reallocation of shares from placing tranche to the public subscription tranche in an IPO and (ii) revised guidance letters on pre-IPO investments and simplification of listing documents
Published reports on the Stock Exchange’s review of disclosure in issuers’ annual reports and key observations under the financial statements review programme, and provided guidance and recommendations to issuers to promote transparency and high quality disclosures
Published findings of the Stock Exchange’s latest review of listed issuers’ corporate governance practices which examined the level of issuers’ compliance with the Corporate Governance Code and Corporate Governance Report
Launched a new series of quarterly director training webcasts to assist directors in understanding their roles and responsibilities as a director of a Hong Kong listed company
Published the first and bi-annual Enforcement Newsletter summarising news and updates on enforcement activities and highlighting specific areas or conduct that might impact on rule compliance
15
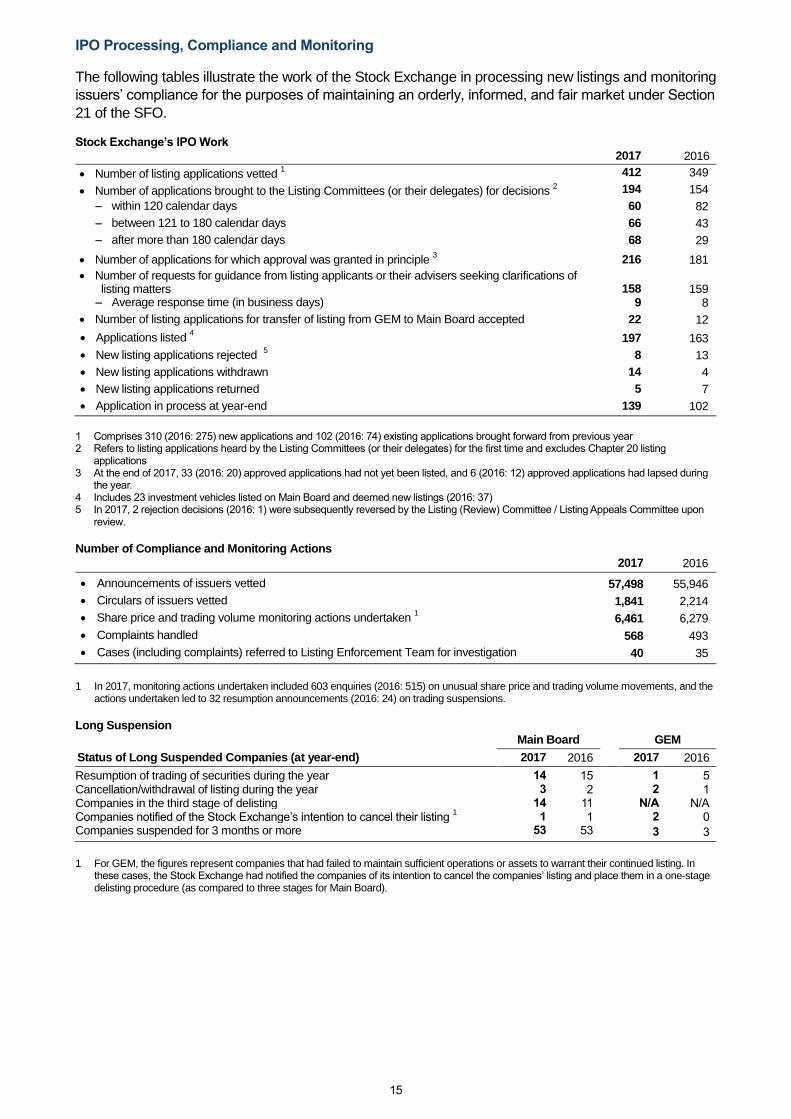
IPO Processing, Compliance and Monitoring
The following tables illustrate the work of the Stock Exchange in processing new listings and monitoring
issuers’ compliance for the purposes of maintaining an orderly, informed, and fair market under Section
21 of the SFO. Stock Exchange’s IPO Work 2017 2016 Number of listing applications vetted
1 412 349
Number of applications brought to the Listing Committees (or their delegates) for decisions 2 194 154
within 120 calendar days 60 82
between 121 to 180 calendar days 66 43
after more than 180 calendar days 68 29
Number of applications for which approval was granted in principle 3 216 181
Number of requests for guidance from listing applicants or their advisers seeking clarifications of listing matters 158 159 Average response time (in business days) 9 8
Number of listing applications for transfer of listing from GEM to Main Board accepted 22 12
Applications listed 4 197 163
New listing applications rejected 5 8 13
New listing applications withdrawn 14 4
New listing applications returned 5 7
Application in process at year-end 139 102
1 Comprises 310 (2016: 275) new applications and 102 (2016: 74) existing applications brought forward from previous year 2 Refers to listing applications heard by the Listing Committees (or their delegates) for the first time and excludes Chapter 20 listing
applications 3 At the end of 2017, 33 (2016: 20) approved applications had not yet been listed, and 6 (2016: 12) approved applications had lapsed during
the year. 4 Includes 23 investment vehicles listed on Main Board and deemed new listings (2016: 37) 5 In 2017, 2 rejection decisions (2016: 1) were subsequently reversed by the Listing (Review) Committee / Listing Appeals Committee upon
review.
Number of Compliance and Monitoring Actions
2017 2016
Announcements of issuers vetted 57,498 55,946
Circulars of issuers vetted 1,841 2,214
Share price and trading volume monitoring actions undertaken 1 6,461 6,279
Complaints handled 568 493
Cases (including complaints) referred to Listing Enforcement Team for investigation 40 35
1 In 2017, monitoring actions undertaken included 603 enquiries (2016: 515) on unusual share price and trading volume movements, and the actions undertaken led to 32 resumption announcements (2016: 24) on trading suspensions.
Long Suspension
Main Board GEM
Status of Long Suspended Companies (at year-end) 2017 2016 2017 2016
Resumption of trading of securities during the year 14 15 1 5 Cancellation/withdrawal of listing during the year 3 2 2 1 Companies in the third stage of delisting 14 11 N/A N/A Companies notified of the Stock Exchange’s intention to cancel their listing
1 1 1 2 0
Companies suspended for 3 months or more 53 53 3 3
1 For GEM, the figures represent companies that had failed to maintain sufficient operations or assets to warrant their continued listing. In
these cases, the Stock Exchange had notified the companies of its intention to cancel the companies’ listing and place them in a one-stage delisting procedure (as compared to three stages for Main Board).

16
Listing Enforcement During 2017, the Stock Exchange continued to adopt a themed approach to enforcement activity. Details will be set out in the 2017 Listing Committee Report. To enhance the transparency of the Stock Exchange’s Listing Rule enforcement work, a bi-annual Enforcement Newsletter was launched in July 2017 which includes news and updates on enforcement activities and specific areas or conduct that might impact on rule compliance while the dedicated “Disciplinary & Enforcement” section on the HKEX Market website continues to provide updated enforcement related information and statistics. Enforcement Statistics
2017 2016 Investigations
1 86
2, 3 71
Public censures 4 8 7
Public statements/criticisms 4 1 1
Warning/caution letters 5 9 15
1 Figures cover cases concluded during the year, and cases which remained active at year-end. 2 There were 28 outstanding investigations (26 of which commenced in 2017) at the end of 2017 as compared to 32 outstanding
investigations (all of which commenced in 2016) at the end of 2016. 3 In 2017, 4 cases (2016: 3) originating from complaints were subject to enforcement investigation, and might give rise to disciplinary
proceedings after investigation. 4 Figures represent only the primary regulatory action from a disciplinary matter. They exclude any other actions taken at a lower level, eg,
private reprimand, in the same case. 5 The warning and caution letters were primarily delivered in circumstances where action before the Listing Committees was not considered
appropriate.
Costs of Listing Function The costs of the front line regulation of listed issuers, performed by the Listing Committees and the Listing Division, are absorbed by the Cash and Equity and Financial Derivatives segments in proportion to the listing fee income of the two segments.
Equity and Financial Derivatives Segment
Key Market Indicators
2017 2016
Change ADT of DWs, CBBCs and warrants traded
on the Stock Exchange ($bn)
17.0
16.7
2%
Average daily number of trades of DWs, CBBCs and warrants traded on the Stock Exchange
205,518
185,850
11%
ADV of derivatives contracts traded on the Futures Exchange 1
440,563 463,722 (5%) ADV of stock options contracts traded on the Stock Exchange 428,499 297,903 44%
Number of newly listed DWs 7,989
2 4,875 64%
Number of newly listed CBBCs 13,235 2 8,896 49%
ADV of contracts traded during AHFT
1 30,148 37,833 (20%)
At
31 Dec 2017 At
31 Dec 2016
Change
Open interest of futures and options 1
11,154,897 9,296,057 20%
1 Excludes London Metal Mini Futures, Gold Futures and Iron Ore Futures contracts (which are included under the Commodities segment) 2 New record highs in 2017

17
Analysis of Results
Summary
2017
$m 2016
$m Change
Trading fees and trading tariff
1 1,498 1,499 (0%)
Stock Exchange listing fees
505 322 57%
Market data fees 1 186 204 (9%)
Other revenue 6 9 (33%)
Total revenue 2,195 2,034
8%
Operating expenses 2 (477) (441) 8%
EBITDA 1,718 1,593 8%
EBITDA margin
78% 78% 0%
1 Excludes cash equities (which are included under the Cash segment) 2 Includes Listing Division costs related to DWs, CBBCs and warrants traded on the Stock Exchange
Trading Fees and Trading Tariff
1
Excludes London Metal Mini Futures, Gold Futures and Iron Ore Futures contracts (which are included under the Commodities segment) 2
Excludes trading fees and trading tariff allocated to the Clearing segment (Derivatives contracts traded on the Futures Exchange – 2017: $218 million; 2016: $229 million; stock options contracts – 2017: $70 million; 2016: $49 million)
Trading fees and trading tariff for the segment are generated from trading of derivatives on the Stock Exchange (ie, DWs, CBBCs, warrants, and stock options) and trading of futures and options on the Futures Exchange. A portion of the trading fees and trading tariff for the futures and options contracts is allocated to the Clearing segment (see Clearing Segment below) as the trading and clearing fees of these products are bundled together in the form of trading fees and tariff.
Trading fees and trading tariff from trading of DWs, CBBCs and warrants rose by $24 million or 5 per cent due to increased ADT and average daily number of trades. The percentage increase was higher than the 2 per cent growth in ADT due to the decrease in average transaction size, which generated a higher growth in trading tariff income.
Market volatility remained subdued in 2017, negatively impacting derivatives trading volumes on the Futures Exchange, similar to equity index derivatives traded on other major exchanges.
Trading fees from futures and options traded on the Futures Exchange dropped by $29 million or 3 per cent. This drop was lower than the 5 per cent decrease in average daily number of contracts traded, as a higher proportion of derivatives contracts traded in 2017 were related to higher fee contracts including HSI products.
457
45
894
103
1,499
475
51
865
107
1,498
0
500
1,000
1,500
Trading fees of DWs,CBBCs and warrants
Trading tariff of DWs,CBBCs and warrants
Trading fees of derivativescontracts traded on the
Futures Exchange
Trading tariff of stockoptions contracts
Total
$m
2016 2017
$16.7 bn $17.0 bn
Average daily number of trades of DWs, CBBCs and warrants ('000)
ADT of DWs, CBBCs and warrants
206
186
464 441
298
428
ADV of stock options contracts ('000) ADV of derivatives contracts traded on the Futures Exchange ('000) 1
1, 2
2

18
1
321 505
322
505 4,875
7,989
8,896
13,235
0
2,000
4,000
6,000
8,000
10,000
12,000
14,000
0
200
400
600
800
1,000
1,200
1,400
2016 2017
Number
Fees
$m
Stock Exchange Listing Fees
Stock Exchange listing fees are mainly derived from initial and subsequent issue listing fees for DWs and CBBCs. The fees increased by $183 million or 57 per cent, reflecting an increase in the number of newly listed DWs and CBBCs.
Market Data Fees
Market data fees dropped by 9 per cent as a result of lower allocated revenue since the percentage
volume increase for DWs, CBBCs and warrants traded was significantly lower than the increase for
cash equities traded.
EBITDA
Operating expenses rose by $36 million or 8 per cent principally due to higher staff costs including
annual payroll adjustments and higher variable pay. As both revenue and operating expenses rose by
8 per cent, the EBITDA margin remained at 78 per cent.
Business Update
ADV of derivatives contracts traded on the Futures Exchange3 in 2017 dropped by 5 per cent against
2016 due to reduced market volatility, but improved in Q4 2017, which was up 12 per cent against Q3
2017.
ADV of stock options contracts reached a record high in 2017, 14 per cent above the previous record in
2015. Trading volume was the highest in Q4 2017, with ADV up by 11 per cent against Q3 2017.
3 Excludes London Metal Mini Futures, Gold Futures and Iron Ore Futures contracts (which are included under the Commodities segment)
Initial and subsequent issue listing fees Others Number of newly listed DWs Number of newly listed CBBCs

19
New Record Highs – Full Year Trading Volume
2017
Number of contracts
Pre-2017 record
Number of contracts
Total Futures and Options 1 214,658,273 189,768,610 (2015)
USD/CNH Futures 732,569 538,594 (2016)
Mini HSI Options 1,640,881 1,424,379 (2016)
HSCEI Options 19,777,920 19,475,726 (2016)
Stock Options 105,839,179 92,463,479 (2015)
1
Excludes London Metal Mini Futures, Gold Futures and Iron Ore Futures contracts (which are included under the Commodities segment)
New Record Highs – Single Day Trading Volume and Open Interest
Single Day Trading Volume Open Interest Date
(2017) Number of contracts
Date (2017)
Number of contracts
Total Futures and Options 1 – – 27 Dec 17,343,759
HSI Futures – – 27 Jun 206,082
HSI Dividend Point Index Futures – – 28 Dec 13,902
HSCEI Dividend Point Index Futures 14 Feb 27,501 – –
HSI Options – – 28 Nov 594,941
Mini HSI Options 6 Dec 19,094 29 Aug 34,161
HSCEI Options – – 27 Dec 3,465,052
Mini-HSCEI Options 30 Oct 9,246 – –
Stock Options – – 28 Nov 12,502,433
USD/CNH Futures 5 Jan 20,338 4 Jan 46,711
1
Excludes London Metal Mini Futures, Gold Futures and Iron Ore Futures contracts (which are included under the Commodities segment)
Average Daily Volume of Major Futures and Options Contracts
131
51 38
134
79
298
127
47 41
117
80
428
0
50
100
150
200
250
300
350
400
450
500
HSI Futures Mini-HSI Futures HSI Options HSCEI Futures HSCEI Options Stock Options
2016 2017
Number of contracts '000

20
After-hours Trading Enhancements
A market consultation on the enhancement of after-hours trading (T+1 Session) was completed and consultation conclusion issued in August 2017. Responses were received from a broad spectrum of market users with extensive support for the proposal. Subject to regulatory approvals and market readiness, HKEX plans to implement the proposed enhancements in three phases:
Extension of trading hours for equity index futures to 01:00 was implemented on 6 November 2017. This extension proved to be popular with investors, with a 48 per cent increase in equity index futures volume in the T+1 Session recorded after 6 November 2017 as compared to the volume before the extension4, and more than 80 per cent of the HKFE EPs participating in the equity index futures in the T+1 Session also participated in the extended trading hours from 23:45 to 01:00.
Inclusion of equity index options in the T+1 Session in 1H 2018.
Further extension of trading hours to 03:00, and the T+1 Session cut-off time will be aligned with the close of trading hours tentatively in Q1 2019.
Equity Futures and Options Market Development Three new stock options on Hang Seng Index constituents (including the first option on a Real Estate Investment Trust) were introduced on 10 April 2017, expanding the stock options universe to 87 classes. Four new stock futures and five new stock options were also launched on 5 February 2018. In addition, regulatory approval has been received for various product initiatives to be launched in 2018 – contract month extension for HSI/HSCEI futures and options up to 5.5 years, and narrow strike intervals for stock index options. Over 60 product educational seminars and briefing sessions were held in 2017, with over 6,000 attendees in Hong Kong, China, Taiwan, Singapore and Malaysia. RMB Currency Futures and Options Market Development
HKEX USD/CNH futures continued to see growth in liquidity and reached a record single-day volume of 20,338 contracts (US$2.0 billion in notional value) and record open interest of 46,711 contracts (US$4.7 billion in notional value) in January 2017. To complement HKEX’s existing RMB Currency Futures suite, RMB Currency Options were launched on 20 March 2017. Enhancements were made to the RMB currency products in 2017. The introduction of an additional contract month in Q1 2017 and the extension of trading hours in Q3 2017 further facilitated efficient hedging on RMB-related risks. Revision of margin levels in Q4 2017 also enhanced capital efficiency and reduced market funding costs on RMB-denominated derivatives products. Other FIC Development On 8 June 2017, HKEX hosted its fourth annual RMB FIC Conference, attracting over 500 industry experts and business leaders, discussing key regulatory and business issues with a special focus on Bond Connect.
4 A comparison between T+1 Session’s average daily volume of the six weeks from 6 November 2017 to 15 December 2017 and the average
daily volume in the T+1 Session from the beginning of 2017 up to 3 November 2017. T Session volume increased by 22 per cent over the same period.

21
Stock Option Position Limits
An enhanced stock option position limits (SOPL) regime, which included tripling the maximum position limit for stock options to 150,000 contracts, and expanding the scope of activities for hedge exemption, was introduced on 1 June 2017. The enhancements were designed to cope with market growth and enhance Hong Kong’s competitiveness as an international financial centre. Since the launch of the regime, investors have increasingly utilised derivatives contracts on HKEX to manage risk. HKEX has enhanced the Large Open Position (LOP) surveillance systems to support the introduction of the revised SOPL model and new products including RMB Currency Options, Ministry of Finance Treasury Bond (MOF T-Bond) Futures, CNH and USD Gold Futures and Iron Ore Futures during the year. HKEX issued a set of Frequently Asked Questions (FAQ) on Position Limits and LOP Reporting to provide guidance on when LOP reporting obligations would be triggered under certain scenarios.
Market Data Business
The derivatives data marketing programme to promote derivatives real-time data in Mainland and overseas has been extended to Thailand and Vietnam, thereby covering a total of 11 regions. HKEX has extended this programme until the end of 2019, demonstrating strong commitment to promoting new derivatives products. Over 40 companies from different regions have joined this marketing programme.
Commodities Segment
Key Market Indicators
2017
2016 Change
ADV of metals contracts traded on the LME (lots)
Aluminium 217,412 221,671 (2%)
Copper 141,602 153,121 (8%)
Zinc 123,037 111,161 11%
Nickel 87,279 81,779 7%
Lead 44,136 43,227 2%
Ferrous 1,476 228 547%
Precious 2,917 - N/A
Others 6,621 7,440 (11%)
624,480 618,627 1%
At 31 Dec 2017
At
31 Dec 2016
Change
Total futures Market Open Interest (lots) 2,253,477 2,212,501 2%

22
Analysis of Results Summary
2017
$m
2016
$m Change
Trading fees and trading tariff 1,116 1,230 (9%)
Market data fees 181 190 (5%)
Other revenue:
Commodities stock levies and warehouse listing fees 77 87 (11%)
Others 62 53 17%
Total revenue 1,436 1,560 (8%)
Operating expenses (659) (597) 10%
EBITDA 777 963 (19%)
EBITDA margin 54% 62% (8%)
Trading Fees and Trading Tariff
While the ADV of metals contracts traded was 1 per cent
higher compared to 2016, the impact of fee reductions for
short- and medium-dated carry trades, a position transfer
fee cap, and new non-fee generating administrative trades
introduced in June 2017, reduced trading fees by $114
million or 9 per cent.
EBITDA
Operating expenses rose by $62 million (10 per cent). Excluding the one-off insurance recovery of $23 million (relating to the costs of warehouse litigation in the US incurred in prior years), operating expenses rose by 14 per cent, largely driven by increased costs for strategic initiatives, including the establishment of QME in the Mainland. The overall increase was partly offset by savings on IT and LME operating costs. As a result of the drop in revenue and the increase in operating expenses for strategic initiatives, EBITDA margin dropped from 62 per cent in 2016 to 54 per cent in 2017. Business Update
LME
2017 was a key year for the LME’s IT programme, and several systems upgrades were undertaken during the year. These included the LMEselect electronic trading engine and the LMEsmart matching platform. Work was also undertaken to ensure that the LME is compliant with all applicable Markets in Financial Instruments Directive II (MiFID II) regulations, which came into force on 3 January 2018.
1,230 1,116
619 624
0
100
200
300
400
500
600
700
0
500
1,000
1,500
2016 2017
Contracts '000 lots
Fees
$m
Trading fees and trading tariff
ADV of metals contracts traded on the LME

23
In April 2017, the LME published a Discussion Paper on Market Structure, covering various topics of relevance to the ongoing development of the market. In September 2017, the LME published an analysis of the feedback received, which included 162 written responses, together with an announcement of the “LME Strategic Pathway”. The Strategic Pathway set out the LME’s proposed route to further develop its franchise on the basis of four key principles: serve the physical market, ensure fairness, increase user choice and maximise trading efficiency. It also provided insight into the LME’s strategic direction, setting out key projects and changes for the LME Group over the next three years – including proposed new contracts, systems upgrades and market structure changes. The most immediate impact of the Strategic Pathway was that the LME reduced fees on both short- and medium-dated carries (on 1 October 2017 and 1 November 2017 respectively) to further support the physical user base and encourage use of the daily date structure. The LMEprecious contracts were successfully launched on 10 July 2017, and 639,546 lots (1,989 tonnes) of gold and 95,625 lots (14,871 tonnes) of silver have been traded up to the end of 2017. Since the first day of trading, there has been liquidity out to 5 years and open interest reached 23,938 and 2,033 lots of gold and silver respectively as of 29 December 2017. This strong start has demonstrated the industry’s appetite to trade precious metals on-exchange and to clear centrally, and is also an indication of the commitment from the industry to the LMEprecious initiative. Going forward, the LME will look to launch Asian hours market making, trade at settlement functionality and options for gold and silver. In November 2017, the LME launched a consultation on the introduction of a financial OTC booking fee and trading regulations in support of market fairness. The aim of the financial OTC booking fee is to rebalance the current disparity between the fees paid by members servicing their clients with an LME client contract and those servicing their clients with an OTC contract based on LME prices at a substantially reduced fee. The consultation closed on 12 January 2018 and the LME will issue a decision notice to market participants in due course. 2017 also saw the conclusion of the LME’s warehouse reform programme – designed to reduce structural queues at LME-listed warehouses to below 50 days – with the final structural queue dissipating by the end of the third quarter. The LME will continue to monitor any operational queues which emerge during the normal course of warehouse operations.
Product Development HKFE launched dual currencies physically-delivered Gold Futures contracts and Iron Ore Futures contracts in July and November 2017 respectively. These products aim to give a boost to RMB internationalisation and strengthen Hong Kong as a comprehensive capital market that can serve as a risk management centre for both Mainland and international investors. As of 31 December 2017, a total of 110,763 contracts of CNH Gold Futures, and 55,372 contracts of USD Gold Futures have been traded, with the combined ADV increasing from 1,690 contracts in July 2017 (equivalent to 1.69 tonnes) to 2,823 contracts (equivalent to 2.823 tonnes) at the end of December. For Iron Ore Futures, a total of 18,230 contracts (equivalent to 1,823,000 tonnes) were traded up to 31 December 2017. LME Week The annual LME Asia Week 2017 event, held in Hong Kong on 10 May 2017, attracted over 800 attendees to the Metals Seminar and over 1,800 participants to the Gala Dinner. As part of the programme, HKEX hosted an industry forum at QME, attracting more than 300 guests. The annual LME Week 2017 was held in London, attracting over 900 delegates to the Metals Seminar on 30 October 2017, and 1,950 participants to the Annual Dinner on 31 October 2017. QME
The development of QME as HKEX’s onshore commodity trading platform is continuing, with the aim of building an efficient onshore commodities trading platform that serves the Mainland’s real economy by meeting the needs of domestic producers and industrial users. The operational plans for the delivery of QME are periodically reviewed with our partners to synchronise its development with the emerging regulatory environment, which dictates the pace at which the platform can develop.

24
Clearing Segment
Key Market Indicators
2017 2016
Change
ADT on the Stock Exchange ($bn) 88.2 66.9 32%
Average daily number of Stock Exchange trades 1,240,169 1,081,020 15%
Average value per trade ($) 71,159 61,908 15%
Average daily value of Settlement Instructions (SIs) settled by CCASS ($bn)
220.5
181.9
21%
Average daily number of SIs 92,459 83,194 11%
Average value per SI ($) 2,385,005 2,186,693 9%
ADV of metal contracts traded on the LME (lots) 624,480 618,627 1%
624,480 Analysis of Results
Summary
2017 $m
2016
$m
Change
Trading fees and trading tariff – allocated from Equity and Financial Derivatives segment
288
278
4%
Clearing and settlement fees 2,691 2,358 14%
Depository, custody and nominee services fees 892 857 4%
Other revenue and sundry income 145 98 48%
4,016 3,591 12%
Net investment income
809 547 48%
Total revenue and other income 4,825 4,138 17%
Operating expenses (752) (702) 7%
EBITDA 4,073 3,436 19%
EBITDA margin 84% 83% 1%
Trading Fees and Trading Tariff
Trading fees and trading tariff allocated for clearing derivatives products rose 4 per cent, due to a 44 per cent growth in ADV of stock options traded, partially offset by a 5 per cent drop in ADV of derivatives contracts traded on the Futures Exchange (see commentary for the Equity and Financial Derivatives segment).

25
Clearing and Settlement Fees
Clearing and settlement fees for the Cash Market and for SIs increased by 23 per cent and 15 per cent respectively. The increase was primarily driven by a higher number of transactions, and 7 per cent and 3 per cent higher average fee per Cash Market trade and per SI transaction respectively. Despite a 1 per cent increase in ADV of metals contracts traded, clearing fees for LME Clear dropped by $43 million or 7 per cent due to a position transfer fee cap, fee reductions for short- and medium-dated carry trades, and new non-fee generating administrative trades introduced in June 2017. Depository, Custody and Nominee Services Fees
Depository, custody and nominee services fees are not directly impacted by changes in market activity. They rose by $35 million or 4 per cent due to higher portfolio fees from the increase in the overall portfolio value held under Southbound and Northbound Trading of Stock Connect, and increase in electronic IPO services fees, but was partly offset by lower scrip fees.
Other Revenue and Sundry Income
Other revenue rose by $47 million due to a one-off post-liquidation interest payment of $55 million received from Lehman’s liquidators in March 2017. The post-liquidation interest was then appropriated to the HKSCC Guarantee Fund reserve from retained earnings in 2017.
1,334
392
42
590
2,358
1,645
451
48
547
2,691
0
1,000
2,000
3,000
Clearing fees for CashMarket
Fees for SIs Clearing fees for futures,options and OTC contracts
Clearing fees for LME Clear Total
$m
2016 2017
$66.9 bn
$88.2 bn
Average daily value of SIs ADT on the Stock Exchange
869
762
619 624
ADV of metals contracts traded on the LME ('000 lots)
ADV of futures and options contracts ('000)
$220.5 bn $181.9 bn
26
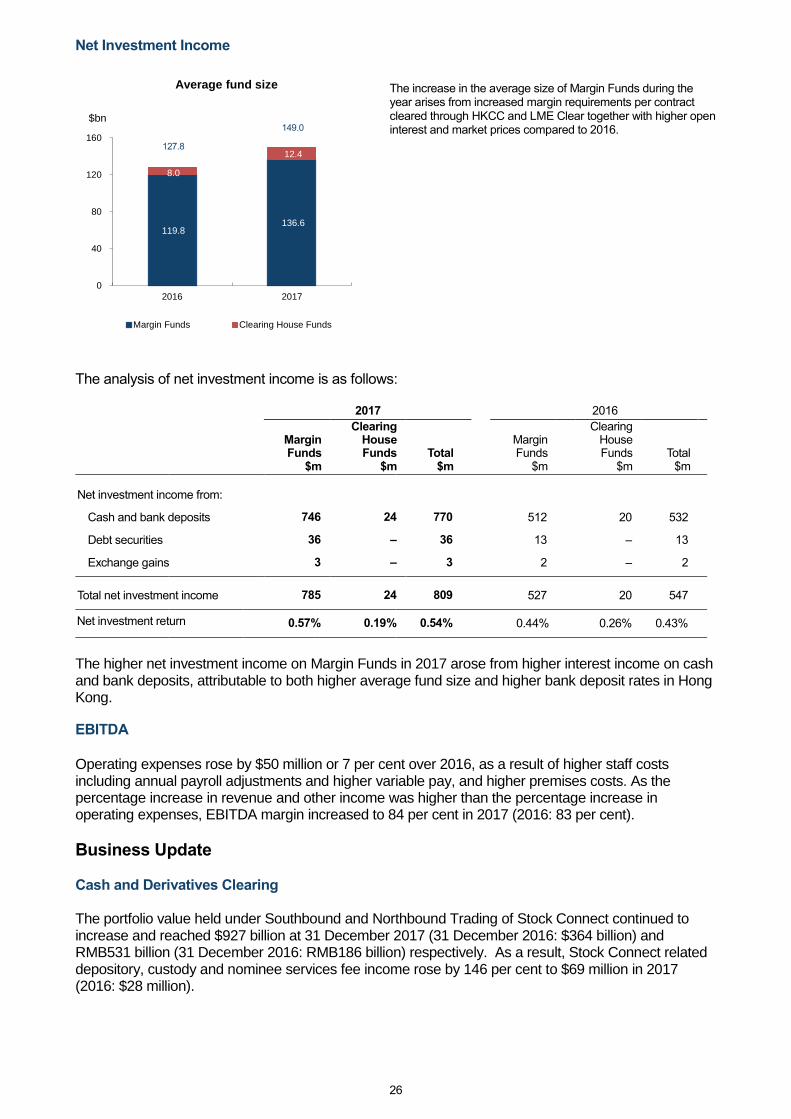
Net Investment Income
The increase in the average size of Margin Funds during the year arises from increased margin requirements per contract cleared through HKCC and LME Clear together with higher open interest and market prices compared to 2016.
The analysis of net investment income is as follows:
2017 2016
Margin Funds
$m
Clearing House Funds
$m
Total $m
Margin Funds
$m
Clearing House Funds
$m
Total $m
Net investment income from:
Cash and bank deposits 746 24 770 512 20 532
Debt securities 36 – 36 13 – 13
Exchange gains 3 – 3 2 – 2
Total net investment income 785 24 809 527 20 547
Net investment return 0.57% 0.19% 0.54% 0.44% 0.26% 0.43%
The higher net investment income on Margin Funds in 2017 arose from higher interest income on cash and bank deposits, attributable to both higher average fund size and higher bank deposit rates in Hong Kong. EBITDA
Operating expenses rose by $50 million or 7 per cent over 2016, as a result of higher staff costs including annual payroll adjustments and higher variable pay, and higher premises costs. As the percentage increase in revenue and other income was higher than the percentage increase in operating expenses, EBITDA margin increased to 84 per cent in 2017 (2016: 83 per cent).
Business Update Cash and Derivatives Clearing The portfolio value held under Southbound and Northbound Trading of Stock Connect continued to increase and reached $927 billion at 31 December 2017 (31 December 2016: $364 billion) and RMB531 billion (31 December 2016: RMB186 billion) respectively. As a result, Stock Connect related depository, custody and nominee services fee income rose by 146 per cent to $69 million in 2017 (2016: $28 million).
119.8 136.6
8.0
12.4
0
40
80
120
160
2016 2017
$bn
Average fund size
Margin Funds Clearing House Funds
73.1
127.8
149.0

27
As part of HKSCC’s ongoing efforts to enhance Stock Connect, Realtime Delivery versus Payment (RDP) money settlement in RMB, HKD and USD for Northbound SIs of Stock Connect was introduced to reduce counterparty risk exposure between CCASS participants in November 2017. This new feature is expected to enable more European fund managers to invest in A shares through Stock Connect. USD and CNH Gold Futures contracts launched in July 2017 are the first physically delivered commodities contracts cleared in Hong Kong. The physical delivery process has been smooth and the number of “Physical Delivery Participants” has grown as CPs are showing increasing interest in the newly launched contracts. HKCC continues to improve margining efficiencies for CPs by offering margin offsets between correlated equity derivatives (HSI and HSCEI futures and options) and foreign exchange/commodity derivatives (USD, Gold and CNH futures and options). HKEX has undertaken a comprehensive review of its risk management framework across HKSCC, HKCC and SEOCH and is in the process of implementing changes to its default fund structure and the introduction of a new value-at-risk (VaR) margin model for the Cash Market. This will offer overall capital savings to market participants through the implementation of Next Generation Risk Management Platform scheduled for 2019. To complement the extension of trading hours for equity index futures to 01:00 from November 2017, HKCC has also extended its clearing risk management and operations coverage to 01:45 to provide CPs with greater flexibility in managing their post-trade activities. HKEX, together with ChinaClear, Central Depository Company Pakistan and National Securities Depository India, co-organised the World Forum of Central Securities Depositories (WFC 2017) in Hong Kong from 14 to 17 November 2017. Over 250 delegates from 58 regions around the world attended, exchanging ideas on the business development, application of fintech and market outlook of the Central Securities Depository industry. OTC Clear
OTC Clear was awarded the “Best OTC Clearing and Risk Management System Implementation” by the Asian Banker and the “Clearing House of the Year” by Asia Risk in recognition of its Cross Currency Swap (CCS) propositions. In 2017, a total of US$38.7 billion notional was cleared by OTC Clear, nearly nine times of that in 2016. Apart from launching client clearing services and accepting non-cash collateral in Q1 2017, OTC Clear expanded its product suite to HKD basis swaps and non-deliverable interest rate swaps denominated in four Asian currencies in Q2 2017 and increased the daily notional exchanges risk limits for CCS in response to strong market demand in Q3 2017. OTC Clear also admitted banks incorporated in Australia, Singapore and France, bringing the number of clearing members to 20 by December 2017 (December 2016: 13). LME Clear
In 2017, LME Clear delivered two upgrades to its clearing system: providing clearing services for LMEprecious; and implementing changes to ensure that LME Clear is compliant with all applicable MiFID II regulations. In addition, changes were made to its reporting tools to meet the requirements of the Bank of England’s new reporting regime.

28
Platform and Infrastructure Segment
Analysis of Results Summary
2017
$m
2016
$m
Change
Network, terminal user, dataline and software sub-license fees 413 406 2%
Hosting services fees 143 129 11%
Others 4 5 (20%)
Total revenue 560 540 4%
Operating expenses (151) (152) (1%)
EBITDA 409 388 5%
EBITDA margin 73% 72% 1%
Network, Terminal User, Dataline and Software Sub-license Fees
Network, terminal user, dataline and software sub-license fees increased due to organic growth from new EPs and China Connect Exchange Participants (CCEPs) migrating from Open Gateway to China Connect Central Gateway (CCCG), but this was partly offset by a decrease in sales of throttles.
Hosting Services Fees
Hosting services fees increased due to organic growth from both new customer subscriptions and increased usage by existing customers.
EBITDA
EBITDA margin increased from 72 per cent to 73 per cent, reflecting the increase in revenue and other income.
Business Update During 2017, all major trading, clearing, settlement, and market data dissemination systems for the Cash, Derivatives and Commodities Markets continued to perform reliably. The LME experienced two software incidents during 1H 2017, the second of which temporarily delayed the clearing processes for a number of trades. These matters have been duly resolved. The Orion Trading Platform – Securities Market platform, which replaces the current Third Generation Automatic Order Matching and Execution System (AMS/3.8), was successfully launched in February 2018. This new system allows HKEX to provide new functionalities and support increased trading capacity for 400 million transactions daily, double that of the previous AMS/3.8 system. CCCG was successfully introduced on 17 July 2017 to facilitate Northbound Trading for CCEPs. Over 90 per cent of Northbound Trading is now traded through CCEPs which have migrated onto the CCCG infrastructure, with full migration expected by Q1 2018. HKEX continued development work on upgrades to the derivatives platforms, the Hong Kong Futures Automated Trading System (HKATS) and the Derivatives Clearing and Settlement System (DCASS), which are scheduled for rollout by 2H 2018. The upgrades will bring simplified infrastructure to the Derivatives Market, with a reduction of the hardware footprint required at participants’ premises. Project and technical briefing sessions were held in 2017 and a web corner for the project has been established to foster communication with participants.

29
The HKEX Market website was rebuilt and rolled out in November 2017 with an entirely new design that aligns with HKEX’s new corporate image released in 2016. The new website contains multiple enhancements which streamline navigation and enhance market data functionality. At the end of December 2017, 108 EPs were using HKEX’s Hosting Services. These EPs generated, in aggregate, approximately 52 per cent of the Cash Market turnover and 64 per cent of the trading volume of the Derivatives Market.
Corporate Items
“Corporate Items” is not a business segment but comprises central income (including net investment income of the Corporate Funds), the costs of central support functions that provide services to all operating segments and other costs not directly related to any operating segments.
Revenue and Other Income
2017 $m
2016
$m
Change
Net investment income 790 149 430%
Others 11 12 (8%)
Total revenue and other income 801 161 398%
Net Investment Income
The average fund size increased principally due to cash generated and retained by the business after cash dividends paid.
The analysis of net investment income is as follows:
2017 $m
2016
$m
Net investment income from:
Cash and bank deposits 142 82
Collective investment schemes 632 6
Equity securities 14 27
Debt securities - 75
Exchange gains/(losses) 2 (41)
Total net investment income 790 149
Net investment return 3.83% 0.86%
17.4
20.6
0
3
6
9
12
15
18
21
24
2016 2017
$bn
Average fund size
Corporate Funds

30
In 2017, a one-off receipt of $14 million deferred consideration on sale of LCH shares was recognised in net investment income under equity securities. Excluding such gain, net investment income of the Corporate Funds in 2017 increased by $627 million principally due to the fair value gains on collective investment schemes held under the external portfolio in 2017. Higher interest income on cash and bank deposits, attributable to both higher interest rates and higher average fund size, also contributed to the increase in net investment income. As the valuation of investments reflect movements in market prices, fair value gains or losses may fluctuate or reverse until the investments are sold or redeemed.
Expenses, Other Costs and Taxation
Operating Expenses
Staff costs and related expenses increased by $238 million or 12 per cent mainly due to annual payroll adjustments, increase in performance-related variable pay, and increased headcount for strategic initiatives including QME. IT and computer maintenance expenses fell by $67 million or 13 per cent, mainly attributable to lower IT costs of the LME Group as a result of cost savings for renewal of IT maintenance contracts and the depreciation of GBP. IT costs of services and goods directly consumed by Participants amounted to $73 million, same as in 2016. Premises expenses increased due to the net effect of the expiry of a number of lease agreements and the consolidation of office locations to increase operating efficiency. Legal and professional fees decreased by $27 million or 25 per cent, attributable to a one-off insurance recovery of $23 million relating to the warehouse litigation in the US. Other operating expenses decreased by $47 million or 11 per cent due to the reclassification of banking facility commitment fees of $41 million (2016: $38 million)5 under finance costs (see below). Excluding such commitment fees, other operating expenses dropped by $9 million or 2 per cent, due to lower investment management services costs.
5 No restatement of prior year comparatives was made as the amount was considered immaterial.
STAFF COSTS & RELATED
EXPENSES
2,035
500 333
54 106
427
3,455
2,273
433 354
47 79
380
3,566
IT & COMPUTER MAINTENANCE
EXPENSES
PREMISES
EXPENSES
PRODUCT MARKETING & PROMOTION
EXPENSES
LEGAL & PROFESSIONAL
FEES
OTHER OPERATING EXPENSES
+12% -13% +6% -13% -25% -11%
($m)
2016 2017 2016 2017 2016 2017 2016 2017 2016 2017
+3%
TOTAL
2017 2016 2016 2017

31
Depreciation and Amortisation
2017 $m
2016
$m Change
Depreciation and amortisation 858 771 11%
Depreciation and amortisation increased by $87 million or 11 per cent, attributable to new offices completed during the year and depreciation of new IT systems.
Finance Costs
2017
$m
2016
$m Change
Finance costs 134 82 63%
The increase in finance costs was due to the reclassification of banking facility commitment fees from other operating expenses of $41 million for 2017 (see above), and negative interest paid for Euro and Japanese Yen margin deposits.
Taxation
2017
$m
2016
$m Change
Taxation 1,255 1,058 19%
Taxation increased due to higher profit before taxation in 2017 and a deferred tax credit of $31 million in 2016 arising from reduction in UK Corporation Tax rate, but was partly offset by higher non-taxable investment income.
FINANCIAL REVIEW
Changes to Key Items in Consolidated Statement of Financial Position
(A) Financial Assets and Financial Liabilities
At 31 Dec 2017
$m
At 31 Dec 2016
$m
Change
Financial assets
Cash and cash equivalents 155,660 115,723 35%
Financial assets measured at fair value through profit or loss 95,037 70,066 36%
Financial assets measured at amortised cost 30,817 29,167 6%
Total 281,514 214,956 31%

32
The Group’s financial assets comprised financial assets of Corporate Funds, Margin Funds, Clearing House Funds, base and precious metals derivatives contracts, and cash prepayments for A shares traded under Stock Connect, as follows:
At 31 Dec 2017
$m
At 31 Dec 2016
$m
Change
Financial assets
Corporate Funds1 21,464 17,670 21%
Margin Funds2 155,384 125,803 24%
Clearing House Funds 17,642 9,602 84%
Base and precious metals derivatives contracts cleared through LME Clear 85,335 61,618 38%
Cash prepayments for A shares 1,689 263 542%
Total 281,514 214,956 31%
1 The amounts at 31 December 2016 exclude a prepayment of $600 million for collective investment schemes but include $300 million of investments purchased for collective investment schemes not yet settled.
2 Excludes Settlement Reserve Fund and Settlement Guarantee Fund paid to ChinaClear and margin receivable from CPs of
$2,430 million (31 December 2016: $1,043 million), which are included in accounts receivable, prepayments and other deposits.
At 31 Dec 2017
$m
At 31 Dec 2016
$m
Change
Financial liabilities
Base and precious metals derivatives contracts cleared through LME Clear
85,335
61,618
38%
Other financial liabilities at fair value through profit or loss - 9 (100%)
Margin deposits, Mainland security and settlement deposits, and cash collateral from CPs
157,814
126,846
24%
CPs’ contributions to Clearing House Funds 16,626 8,656 92%
Total 259,775 197,129 32%
The 24 per cent increase in financial assets and financial liabilities of Margin Funds at 31 December 2017 against those at 31 December 2016 was mainly attributable to increased contributions required from members of LME Clear and CPs of SEOCH in response to an increase in open positions on metal contracts and stock options respectively, and higher metal contract prices. The increase in financial assets and financial liabilities of Clearing House Funds was mainly attributable to higher contributions required from members of LME Clear and CPs of SEOCH in response to changes in risk exposures. After adjusting for prepayments and unsettled investments in collective investment schemes (footnote 1 above), Corporate Funds at 31 December 2017 increased by $3,494 million as compared to those at 31 December 2016 due to the retention of cash generated by the business over the past year partly offset by the cash paid for the 2016 final dividend and 2017 interim dividend. A portion of the Corporate Funds is invested in collective investment schemes which are designed to enhance returns and mitigate portfolio volatility and asset class concentration risk.

33
(B) Fixed Assets, Intangible Assets and Capital Commitments
The total net book value of the Group’s fixed assets and intangible assets rose by $83 million from $19,311 million at 31 December 2016 to $19,394 million at 31 December 2017. The increase was mainly due to additions of $788 million, and exchange gains of $153 million arising from the effect of the appreciation of USD against HKD on the Group’s investments in overseas subsidiaries, but was partly offset by depreciation and amortisation of $858 million. Additions during the year mainly related to the establishment of a commodities trading platform in Mainland China, the renovation of new offices, and the development and upgrade of various trading and clearing systems including the enhancement of Stock Connect technology infrastructure. The Group’s capital expenditure commitments at 31 December 2017, including those authorised by the Board but not yet contracted for, amounted to $1,433 million (31 December 2016: $981 million). These related mainly to the renovation of new offices, and the development and upgrade of various IT systems including the cash, derivatives and commodities trading and clearing systems, and IT systems to facilitate mutual stock market access between Mainland China and Hong Kong.
(C) Significant Investments Held, Material Acquisitions and Disposals of Subsidiaries, and
Future Plans for Material Investments or Capital Assets
On 22 March 2017, the Group entered into an agreement to sell a 9.99 per cent stake in QME (formerly known as Gangrong Trading Services (Shenzhen) Limited) to an independent third party at a consideration of RMB25 million. After the transfer, the Group’s interest in QME dropped to 90.01 per cent. On 26 May 2017 and 1 June 2017, RMB135 million and RMB15 million were further injected by the Group and the non-controlling interests respectively into QME as its registered capital. BCCL, a joint venture established by CFETS and HKEX, was incorporated on 6 June 2017. On 10 August 2017, the Group injected $14 million into BCCL for a 40 per cent stake in BCCL.
Save for those disclosed in this announcement, there were no other significant investments held, nor were there material acquisitions or disposals of subsidiaries during the year under review. Apart from those disclosed in this announcement, there was no plan authorised by the Board for other material investments or additions of capital assets at the date of this announcement.
(D) Equity attributable to Shareholders and Return on Equity Equity attributable to shareholders increased by $5,007 million to $37,273 million at 31 December 2017 from $32,266 million at 31 December 2016. This arose principally from the $3,037 million shares issued in lieu of cash dividends and an increase in retained earnings of $1,756 million mainly attributable to profit for the year less dividends declared.
Return on equity increased by 2 per cent due to the increase in profit attributable to shareholders in 2017.
32,266
37,273
18 20
0
10
20
30
0
10,000
20,000
30,000
40,000
50,000
60,000
70,000
2016 2017
Return on equity
%
Equity $m
Equity attributable to Shareholders and Return on Equity
Equity attributable to shareholders Return on equity1
1 Based on equity attributable to shareholders at year-end

34
Liquidity, Financial Resources and Gearing
Working capital rose by $2,330 million to $19,452 million at 31 December 2017 (31 December 2016: $17,122 million). The increase was mainly due to profit attributable to shareholders of $7,404 million, which was partly offset by the 2016 final dividend and 2017 interim dividend (net of scrip dividends) of $2,587 million, early repayment of USD floating rate bank borrowings of $1,586 million and reclassification of borrowings of $1,027 million from non-current liabilities to current liabilities as they became repayable within twelve months. At 31 December 2017, the Group had the following outstanding borrowings: At 31 Dec 2017 At 31 Dec 2016
Carrying value $m
Maturity
Carrying value $m
Maturity
USD floating rate bank borrowings
-
N/A
1,586
Jul 2020 & Jul 2021
2 USD fixed rate notes with
average coupon of 2.8 per cent
1,533
Dec 2018 & Jan 2019
1,519
Dec 2018 & Jan 2019
Written put options to non-
controlling interests
327
N/A
317
N/A
1,860 3,422
At 31 December 2017, the Group had a gross gearing ratio (ie, gross debt divided by adjusted capital) of 5 per cent (31 December 2016: 11 per cent), and a net gearing ratio (ie, net debt divided by adjusted capital) of zero per cent (31 December 2016: zero per cent). For this purpose, gross debt is defined as total borrowings and net debt is defined as total borrowings less cash and cash equivalents of Corporate Funds (and will be zero when the amount of cash and cash equivalents of Corporate Funds is greater than total borrowings), and adjusted capital as all components of equity attributable to shareholders other than designated reserves. Apart from the borrowings used to fund the acquisition of the LME Group, banking facilities have been put in place for contingency purposes. At 31 December 2017, the Group’s total available banking facilities for its daily operations amounted to $18,963 million (31 December 2016: $18,947 million), which included $11,954 million (31 December 2016: $11,938 million) of committed banking facilities and $7,000 million (31 December 2016: $7,000 million) of repurchase facilities. The Group has also put in place foreign exchange facilities for its daily clearing operations and for the RMB Trading Support Facility to support the trading of RMB stocks listed on the Stock Exchange. At 31 December 2017, the total amount of such facilities was RMB21,500 million (31 December 2016: RMB21,500 million). In addition, the Group has arranged contingency banking facilities amounting to RMB13,000 million (31 December 2016: RMB13,000 million) for settling payment obligations to ChinaClear should there be events that disrupt normal settlement arrangements for Stock Connect, eg, natural disasters or extreme weather conditions in Hong Kong. At 31 December 2017, 88 per cent (31 December 2016: 85 per cent) of the Group’s cash and cash equivalents were denominated in HKD or USD.
Pledges of Assets LME Clear receives securities, gold bullion and warrants as collateral for margins posted by its CPs. The total fair value of this collateral was US$1,319 million (HK$10,311 million) at 31 December 2017 (31 December 2016: US$1,781 million (HK$13,808 million)). LME Clear is obliged to return this non-cash collateral upon request when the CPs’ collateral obligations have been substituted with cash collateral or otherwise discharged. LME Clear also holds securities as collateral in respect of its investments in overnight triparty reverse repurchase agreements under which it is obliged to return equivalent securities to the counterparties at maturity of the reverse repurchase agreements. The fair value of this collateral was US$11,462 million (HK$89,602 million) at 31 December 2017 (31 December 2016: US$9,418 million (HK$73,022 million)).

35
The above non-cash collateral, which LME Clear is permitted to sell or repledge in the absence of default by the counterparties, was not recorded on the consolidated statement of financial position of the Group at 31 December 2017. Such non-cash collateral, together with certain financial assets amounting to US$471 million (HK$3,686 million) at 31 December 2017 (31 December 2016: US$430 million (HK$3,334 million)), have been repledged to LME Clear’s investment agent and custodian banks under first floating charge and security arrangements for the settlement and depository services they provide in respect of the collateral and investments held. The floating charge could convert to a fixed charge in the event of contract termination, or default or insolvency of LME Clear.
Exposure to Fluctuations in Exchange Rates and Related Hedges The functional currency of the Hong Kong and PRC entities are HKD and RMB respectively and the functional currency of LME entities is USD. Foreign exchange risks arise mainly from the Group’s investment and bank deposits in currencies other than HKD and USD and its GBP expenditure for the LME entities. Forward foreign exchange contracts and foreign currency bank deposits may be used to hedge the currency exposure of the Group’s non-HKD and non-USD assets and liabilities and highly probable forecast transactions to mitigate risks arising from fluctuations in exchange rates. Foreign currency margin deposits received by the Group in Hong Kong are mainly hedged by investments in the same currencies, and unhedged investments in USD may not exceed 20 per cent of the Margin Funds. For LME Clear, investments of Margin Funds and Default Fund will generally be in the currency in which cash was received. Up to 50 per cent of the External Portfolio may be invested in non-HKD or non-USD investments not hedged back to HKD or USD. The aggregate net open foreign currency positions at 31 December 2017 amounted to $1,035 million, of which $200 million were non-USD exposures (31 December 2016: $2,425 million, of which $276 million were non-USD exposures). There were no outstanding forward foreign exchange contracts at 31 December 2017 (31 December 2016: the maximum gross nominal value of outstanding forward foreign exchange contracts amounted to $1,529 million).
Contingent Liabilities
At 31 December 2017, the Group’s material contingent liabilities were as follows:
(a) The Group had a contingent liability in respect of potential calls to be made by the SFC to
replenish all or part of compensation less recoveries paid by the Unified Exchange Compensation Fund established under the repealed Securities Ordinance up to an amount not exceeding $71 million (31 December 2016: $71 million). Up to 31 December 2017, no calls had been made by the SFC in this connection.
(b) The Group had undertaken to indemnify the Collector of Stamp Revenue against any
underpayment of stamp duty by its Participants of up to $200,000 for each Participant. In the unlikely event that all of its 622 trading Participants (31 December 2016: 556) covered by the indemnity at 31 December 2017 defaulted, the maximum contingent liability of the Group under the indemnity would amount to $124 million (31 December 2016: $111 million).
(c) HKEX has given an undertaking in favour of HKSCC to contribute up to $50 million in the
event of HKSCC being wound up while it is a wholly-owned subsidiary of HKEX or within one year after HKSCC ceases to be a wholly-owned subsidiary of HKEX, for payment of the liabilities of HKSCC contracted before HKSCC ceases to be a wholly-owned subsidiary of HKEX, and for the costs of winding up.

36
CONSOLIDATED INCOME STATEMENT FOR THE YEAR ENDED 31 DECEMBER 2017
Note
2017 $m
2016 $m
Trading fees and trading tariff 4,856 4,428
Stock Exchange listing fees 1,333 1,092
Clearing and settlement fees 2,691 2,358
Depository, custody and nominee services fees 892 857
Market data fees 857 816
Other revenue 3 945 847
REVENUE 11,574 10,398
Investment income 2,171 826
Interest rebates to Participants (572) (130)
Net investment income Net investment income 4 1,599 696
Sundry income 7 22
REVENUE AND OTHER INCOME 2 13,180 11,116
OPERATING EXPENSES
Staff costs and related expenses (2,273) (2,035)
IT and computer maintenance expenses (433) (500)
Premises expenses (354) (333)
Product marketing and promotion expenses (47) (54)
Legal and professional fees (79) (106)
Other operating expenses 5 (380) (427)
(3,566) (3,455)
EBITDA
9,614 7,661
Depreciation and amortisation (858) (771)
OPERATING PROFIT 8,756 6,890
Finance costs 6 (134) (82)
Share of losses of joint ventures (12) (9)
PROFIT BEFORE TAXATION 2 8,610 6,799
TAXATION 7 (1,255) (1,058)
PROFIT FOR THE YEAR 7,355 5,741
PROFIT/(LOSS) ATTRIBUTABLE TO:
Shareholders of HKEX 7,404 5,769
Non-controlling interests (49) (28)
PROFIT FOR THE YEAR 7,355 5,741
Basic earnings per share 8(a) $6.03 $4.76
Diluted earnings per share 8(b) $6.02 $4.75

37
CONSOLIDATED STATEMENT OF COMPREHENSIVE INCOME FOR THE YEAR ENDED 31 DECEMBER 2017
2017 $m
2016 $m
PROFIT FOR THE YEAR 7,355 5,741
OTHER COMPREHENSIVE INCOME
Items that may be reclassified subsequently to profit or loss:
Currency translation differences of foreign subsidiaries
recorded in exchange reserve
156
(6)
Cash flow hedges 1 -
OTHER COMPREHENSIVE INCOME 157 (6)
TOTAL COMPREHENSIVE INCOME 7,512 5,735
TOTAL COMPREHENSIVE INCOME ATTRIBUTABLE TO:
Shareholders of HKEX 7,561 5,763
Non-controlling interests (49) (28)
TOTAL COMPREHENSIVE INCOME 7,512 5,735

38
CONSOLIDATED STATEMENT OF FINANCIAL POSITION AT 31 DECEMBER 2017
At 31 Dec 2017
At 31 Dec 2016
Note
Current
$m
Non-current
$m
Total
$m
Current
$m
Non-current
$m
Total
$m ASSETS
Cash and cash equivalents 10 155,660 – 155,660 115,723 – 115,723
Financial assets measured at fair value through profit or loss
10
95,037
–
95,037
70,066
–
70,066
Financial assets measured at amortised cost
10
30,757
60
30,817
29,093
74
29,167
Accounts receivable, prepayments and deposits
10, 11
16,564
21
16,585
12,928
21
12,949
Interests in joint ventures – 61 61 – 59 59
Goodwill and other intangible assets – 17,925 17,925 – 17,812 17,812
Fixed assets – 1,469 1,469 – 1,499 1,499
Lease premium for land – 20 20 – 21 21
Deferred tax assets – 30 30 – 22 22
Total assets 298,018 19,586 317,604 227,810 19,508 247,318
LIABILITIES AND EQUITY
Liabilities
Financial liabilities at fair value through profit or loss
85,335
–
85,335
61,627
–
61,627
Margin deposits, Mainland security and settlement deposits, and cash collateral from CPs
157,814
–
157,814
126,846
–
126,846
Accounts payable, accruals and other liabilities
12
16,159 51
16,210
12,246 30
12,276
Deferred revenue 957 – 957 842 – 842
Taxation payable 505 – 505 356 – 356
Other financial liabilities 58 – 58 37 – 37
CPs’ contributions to Clearing House Funds
16,626 – 16,626 8,656 – 8,656
Borrowings 13 1,027 833 1,860 – 3,422 3,422
Provisions 85 68 153 78 81 159
Deferred tax liabilities – 711 711 – 713 713
Total liabilities 278,566 1,663 280,229 210,688 4,246 214,934
Equity
Share capital 25,141 22,085
Shares held for Share Award Scheme (606) (599)
Employee share-based compensation reserve 222 226
Hedging reserve 1 -
Exchange reserve (104) (260)
Designated reserves 822 773
Reserve relating to written put options to non-controlling interests
(293)
(293)
Retained earnings 14 12,090 10,334
Equity attributable to shareholders of HKEX
Non-controlling interests Equity attributable to shareholders of HKEX 37,273 32,266
Non-controlling interests 102 118
Total equity 37,375 32,384
Total liabilities and equity 317,604 247,318
251,860 238,177 Net current assets 19,452 17,122

39
NOTES TO THE CONSOLIDATED FINANCIAL STATEMENTS 1. Basis of Preparation and Accounting Policies
These consolidated financial statements have been prepared in accordance with Hong Kong Financial Reporting Standards (HKFRSs), which include all applicable individual HKFRSs, Hong Kong Accounting Standards (HKASs) and interpretations (INTs) issued by the HKICPA.
The financial information relating to the years ended 31 December 2017 and 2016 included in this preliminary announcement of annual results 2017 do not constitute the Company's statutory annual consolidated financial statements for those years but is derived from those financial statements. Further information relating to these statutory financial statements required to be disclosed in accordance with section 436 of the Companies Ordinance is as follows:
The Company has delivered the financial statements for the year ended 31 December 2016 to the Registrar of Companies as required by section 662(3) of, and Part 3 of Schedule 6 to, the Companies Ordinance and will deliver the financial statements for the year ended 31 December 2017 in due course.
The Company's auditor has reported on the financial statements of the Group for both years. The auditor’s reports were unqualified; did not include a reference to any matters to which the auditor drew attention by way of emphasis without qualifying its reports; and did not contain a statement under sections 406(2), 407(2) or (3) of the Companies Ordinance.
Adoption of new/revised HKFRSs
In 2017, the Group has adopted the following amendments to HKFRSs which were effective for accounting periods beginning on or after 1 January 2017:
Amendments to HKAS 7 Statement of Cash Flows – Disclosure Initiative
Amendments to HKAS 12 Income Taxes – Recognition of Deferred Tax Assets for Unrealised Losses
The adoption of these amendments to HKFRSs does not have any financial impact on the Group. Only amendments to HKAS 7 require the disclosure of changes in liabilities arising from financing activities.
New/revised HKFRSs issued before 31 December 2017 but not yet effective and not early adopted
The Group has not applied the following new/revised HKFRSs which were issued before 31 December 2017 and are pertinent to its operations but not yet effective:
HKFRS 9 (2014) Financial Instruments1
HKFRS 15 Revenue from Contracts with Customers1
HKFRS 16 Leases2
HK(IFRIC)-Int 22 Foreign Currency Transactions and Advance Consideration1
HK(IFRIC)-Int 23 Uncertainty over Income Tax Treatments2
1 Effective for accounting periods beginning on or after 1 January 2018
2 Effective for accounting periods beginning on or after 1 January 2019
HKFRS 9 (2014) will only affect the classification of debt securities held for Margin Funds and recognition of impairment provisions. It will not affect the classification of other securities held by the Group.
Currently, debt securities held for Margin Funds amounting to $3,059 million are classified as financial assets measured at fair value through profit or loss. Under HKFRS 9 (2014), they will satisfy the conditions for classification as a new category of financial assets, financial assets measured at fair value through other comprehensive income. Accordingly, the related cumulative fair value losses of $4 million will have to be transferred from retained earnings to the revaluation reserve on 1 January 2018. Subsequent changes in fair value of these debt securities shall be taken to the revaluation reserve. Interest income, foreign exchange differences, impairment losses, and gains or losses on disposal of these debt securities will continue to be recognised in consolidated income statement.
The new impairment model under HKFRS 9 (2014) requires the recognition of provision for impairment losses based on expected credit losses rather than incurred credit losses. There will be no significant change in the amount of provision for impairment losses to be recognised at 1 January 2018.
The Group will apply the new rules retrospectively from 1 January 2018. With the practical expedients permitted under the standard, comparatives for 2017 will not be restated.

40
HKFRS 15 is based on the principle that revenue is recognised when control of goods or services is transferred to customers. Based on the assessments undertaken to date, the Group does not expect significant financial impact arising from the change in revenue recognition policy adopted by the Group. The Group will apply the standard using the modified retrospective approach and comparatives will not be restated.
HKFRS 16 will primarily affect the accounting for the Group’s operating leases. At 31 December 2017, the Group had non-cancellable operating lease commitments of $2,629 million. Upon adoption of HKFRS 16 the majority of operating lease commitments will be recognised in the consolidated statement of financial position as lease liabilities and right-of-use assets. The lease liabilities would subsequently be measured at amortised cost and the right-of-use asset will be measured at cost and depreciated on a straight-line basis during the lease term. The Group intends to apply the simplified transition approach and will not restate comparatives amounts for the year prior to its first adoption.
The adoption of HK(IFRIC)-Int 22 and HK(IFRIC)-Int 23 would not have any financial impact on the Group.
There are no other new/revised HKFRSs not yet effective that are expected to have any impact on the Group.
2. Operating Segments
The Group has five reportable segments (“Corporate Items” is not a reportable segment). The segments are managed separately as each segment offers different products and services and requires different IT systems and marketing strategies. The operations in each of the Group’s reportable segments are as follows:
The Cash segment covers all equity products traded on the Cash Market platforms, the Shanghai Stock Exchange and the Shenzhen Stock Exchange through Stock Connect, sales of market data relating to these products and other related activities. The major sources of revenue of the segment are trading fees, trading tariff, listing fees of equity products and market data fees.
The Equity and Financial Derivatives segment refers to derivatives products traded on the Stock Exchange and the Futures Exchange and other related activities. These include the provision and maintenance of trading platforms for a range of equity and financial derivatives products, such as stock and equity index futures and options, DWs, CBBCs and warrants and sales of related market data. The major sources of revenue are trading fees, trading tariff, listing fees of derivatives products and market data fees.
The Commodities segment refers to the operations of the LME, which operates an exchange in the UK for the trading of base and precious metals futures and options contracts, and the development of the new commodity trading platform in the Mainland. It also covers the Asia Commodities contracts and gold and iron ore futures contracts traded on the Futures Exchange. The major sources of revenue of the segment are trading fees of commodity products, commodity market data fees and fees from ancillary operations.
The Clearing segment refers to the operations of the five clearing houses, which are responsible for clearing, settlement and custodian activities of the exchanges of the Group and Northbound trades under Stock Connect, and clearing and settlement of over-the-counter derivatives contracts. Its principal sources of revenue are derived from providing clearing, settlement, depository, custody and nominee services and net investment income earned on the Margin Funds and Clearing House Funds.
The Platform and Infrastructure segment refers to all services in connection with providing users with
access to the platform and infrastructure of the Group. Its major sources of revenue are network, terminal
user, dataline and software sub-license fees and hosting services fees.
Central income (including net investment income of Corporate Funds) and central costs (costs of central support functions that provide services to all operating segments and other costs not directly related to any operating segment) are included as “Corporate Items”.
The chief operating decision-maker assesses the performance of the operating segments principally based on their EBITDA.
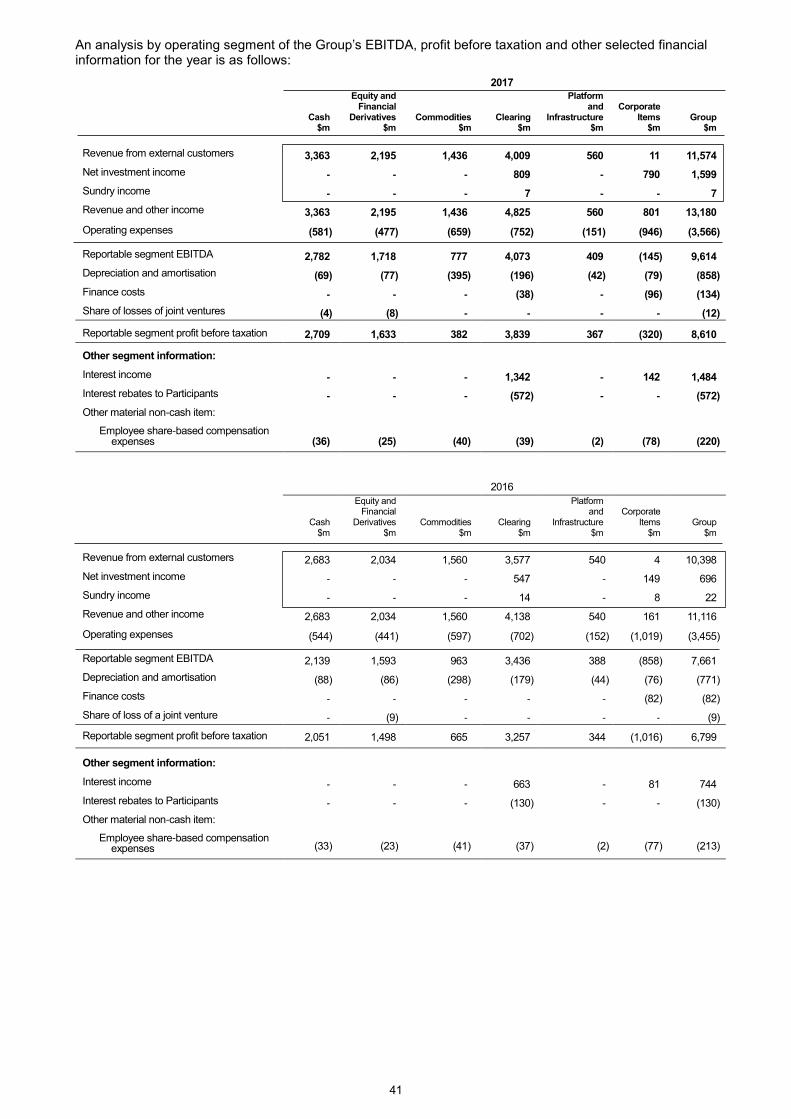
41
An analysis by operating segment of the Group’s EBITDA, profit before taxation and other selected financial information for the year is as follows:
2017
Cash $m
Equity and Financial
Derivatives $m
Commodities $m
Clearing $m
Platform and
Infrastructure $m
Corporate
Items $m
Group $m
Revenue from external customers 3,363 2,195 1,436 4,009 560 11 11,574
Net investment income - - - 809 - 790 1,599
Sundry income - - - 7 - - 7
Revenue and other income 3,363 2,195 1,436 4,825 560 801 13,180
Operating expenses (581) (477) (659) (752) (151) (946) (3,566)
Reportable segment EBITDA 2,782 1,718 777 4,073 409 (145) 9,614
Depreciation and amortisation (69) (77) (395) (196) (42) (79) (858)
Finance costs - - - (38) - (96) (134)
Share of losses of joint ventures (4) (8) - - - - (12)
Reportable segment profit before taxation 2,709
1,633
382
3,839 367
(320)
8,610
Other segment information:
Interest income - - - 1,342 - 142 1,484
Interest rebates to Participants - - - (572) - - (572)
Other material non-cash item:
Employee share-based compensation expenses
(36)
(25)
(40)
(39)
(2)
(78)
(220)
2016
Cash $m
Equity and Financial
Derivatives $m
Commodities $m
Clearing $m
Platform and
Infrastructure $m
Corporate
Items $m
Group $m
Revenue from external customers 2,683 2,034 1,560 3,577 540 4 10,398
Net investment income - - - 547 - 149 696
Sundry income - - - 14 - 8 22
Revenue and other income 2,683 2,034 1,560 4,138 540 161 11,116
Operating expenses (544) (441) (597) (702) (152) (1,019) (3,455)
Reportable segment EBITDA 2,139 1,593 963 3,436 388 (858) 7,661
Depreciation and amortisation (88) (86) (298) (179) (44) (76) (771)
Finance costs - - - - - (82) (82)
Share of loss of a joint venture - (9) - - - - (9)
Reportable segment profit before taxation 2,051 1,498 665 3,257 344 (1,016) 6,799
Other segment information:
Interest income - - - 663 - 81 744
Interest rebates to Participants - - - (130) - - (130)
Other material non-cash item:
Employee share-based compensation expenses (33) (23) (41) (37) (2) (77) (213)

42
(a) Geographical information
The Group’s revenue from external customers is derived from its operations in Hong Kong and the UK. Such information and the Group’s non-current assets (excluding financial assets and deferred tax assets) by geographical location are detailed below:
Revenue Non-current assets
2017
$m
2016
$m
At
31 Dec 2017
$m
At
31 Dec 2016
$m
Hong Kong (place of domicile) 9,544 8,192 2,067 1,978
United Kingdom 2,030 2,206 17,351 17,333
Mainland China - - 78 101
11,574 10,398 19,496 19,412
(b) Information about major customers
In 2017 and 2016, the revenue from the Group’s largest customer amounted to less than 10 per cent of the Group’s total revenue.
3. Other Revenue
2017
$m 2016
$m
Network, terminal user, dataline and software sub-license fees 413 406
Hosting services fees 143 129
Commodities stock levies and warehouse listing fees 77 87
Participants’ subscription and application fees 84 76
Accommodation income (note (a)) 48 48
Sales of Trading Rights 41 26
Post-liquidation interest arising from a Participant’s default on market contracts (note (b))
55
-
Miscellaneous revenue 84 75
945 847
(a) Accommodation income mainly comprises income from CPs on securities deposited as alternatives to
cash deposits of Margin Funds, income from CPs on currencies deposited if the relevant bank deposit rates are negative, and interest shortfall collected from LME Clear Participants on cash collateral where the investment return on the collateral is below the benchmarked interest rates stipulated in the clearing rules of LME Clear.
(b) In 2017, the liquidators of Lehman paid post-liquidation interest of $55 million on Lehman’s debts arising from its default on market contracts, and an equal amount was appropriated to the HKSCC Guarantee Fund reserve from retained earnings during the year ended 31 December 2017.

43
4. Net Investment Income
2017 $m
2016 $m
Gross interest income from financial assets measured at amortised cost 1,484 744
Interest rebates to Participants (572) (130)
Net interest income 912 614
Net fair value gains including interest income on financial assets
mandatorily measured at fair value through profit or loss and
financial liabilities at fair value through profit or loss
682
98
Others 5 (16)
Net investment income 1,599 696
5. Other Operating Expenses
2017
$m 2016
$m
Bank charges (note 6(a)) 19 57
Communication expenses 14 14
Contribution to Financial Reporting Council 8 7
Custodian and fund management related fees 27 35
Financial data subscription fees 28 25
Insurance 11 11
License fees 31 32
Repairs and maintenance expenses 61 62
Security expenses 18 18
Travel expenses 54 39
Other miscellaneous expenses 109 127
380 427
6. Finance Costs
2017
$m 2016
$m Interest and finance charges for financial liabilities not at fair value
through profit or loss (note (a))
121
81
Negative interest on Euro and Japanese Yen deposits 13 -
Net foreign exchange losses on financing activities - 1
134 82
(a) For the year ended 31 December 2017, the total interest expenses for financial liabilities not at fair value
through profit or loss amounted to $80 million (2016: $81 million). For the year ended 31 December 2017, banking facility commitment fees of $41 million (2016: $38 million) that relate to liquidity support provided to the Group’s clearing houses, have been reclassified from bank charges, under other operating expenses, to finance costs to more appropriately reflect the nature of the costs incurred. No restatement of prior year comparatives was made as the amount was considered immaterial to the overall financial statements.

44
7. Taxation
Taxation charge/(credit) in the consolidated income statement represented:
2017 $m
2016 $m
Current tax – Hong Kong Profits Tax
- - Provision for the year 1,047 879
- Over provision in respect of prior years (4) (3)
- 1,043 876
Current tax – Overseas Tax
- - Provision for the year 229 223
- (Over)/under provision in respect of prior years (4) 8
- 225 231
Total current tax (note (a)) 1,268 1,107
Deferred tax
- - Reversal of temporary differences (13) (18)
- Impact of changes in UK Corporation Tax rate (note (b)) - (31)
- Total deferred tax (13) (49)
Taxation charge 1,255 1,058
(a) Hong Kong Profits Tax has been provided at the rate of 16.5 per cent (2016: 16.5 per cent) on the
estimated assessable profit for the year. Taxation on overseas profits has been calculated on the estimated assessable profit at the rates of taxation prevailing in the countries in which the Group operates, with the average corporation tax rate applicable to the subsidiaries in the UK being 19.25 per cent (2016: 20 per cent).
(b) The UK Corporation Tax rate will be reduced to 17 per cent effective from 1 April 2020 through the enactment of the 2016 Finance Act. As a result of the reduction in UK Corporation Tax rate, the Group’s net deferred tax liabilities decreased by $31 million in 2016.
8. Earnings Per Share The calculation of the basic and diluted earnings per share is as follows:
(a) Basic earnings per share
2017 2016
Profit attributable to shareholders ($m) 7,404 5,769
Weighted average number of shares in issue less
shares held for Share Award Scheme (in ’000) 1,227,674 1,212,376
Basic earnings per share ($) 6.03 4.76
(b) Diluted earnings per share
2017 2016
Profit attributable to shareholders ($m) 7,404 5,769
Weighted average number of shares in issue less
shares held for Share Award Scheme (in ’000) 1,227,674 1,212,376
Effect of Awarded Shares (in ’000) 3,124 3,071
Weighted average number of shares for the purpose of
calculating diluted earnings per share (in ’000) 1,230,798 1,215,447
Diluted earnings per share ($) 6.02 4.75
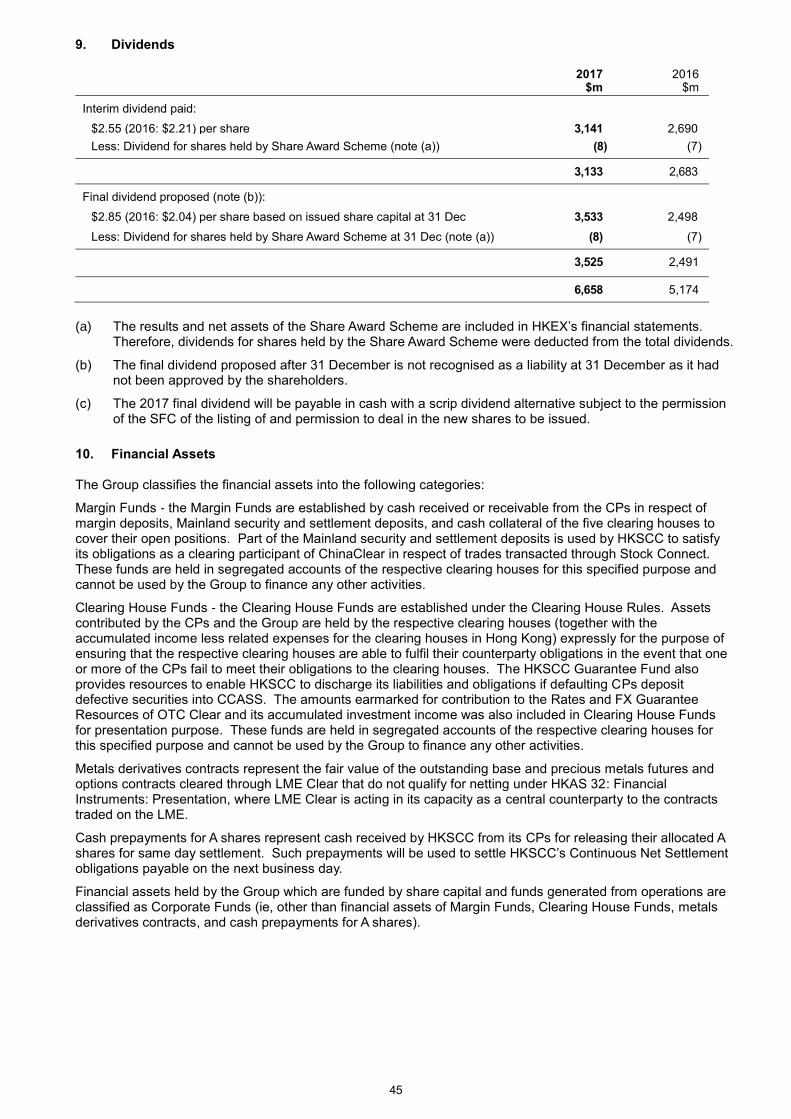
45
9. Dividends
2017 $m
2016 $m
Interim dividend paid:
$2.55 (2016: $2.21) per share
3,141
2,690
Less: Dividend for shares held by Share Award Scheme (note (a)) (8) (7)
3,133 2,683
Final dividend proposed (note (b)):
$2.85 (2016: $2.04) per share based on issued share capital at 31 Dec
3,533
2,498
Less: Dividend for shares held by Share Award Scheme at 31 Dec (note (a)) (8) (7)
3,525 2,491
6,658 5,174
(a) The results and net assets of the Share Award Scheme are included in HKEX’s financial statements.
Therefore, dividends for shares held by the Share Award Scheme were deducted from the total dividends.
(b) The final dividend proposed after 31 December is not recognised as a liability at 31 December as it had not been approved by the shareholders.
(c) The 2017 final dividend will be payable in cash with a scrip dividend alternative subject to the permission of the SFC of the listing of and permission to deal in the new shares to be issued.
10. Financial Assets The Group classifies the financial assets into the following categories:
Margin Funds - the Margin Funds are established by cash received or receivable from the CPs in respect of margin deposits, Mainland security and settlement deposits, and cash collateral of the five clearing houses to cover their open positions. Part of the Mainland security and settlement deposits is used by HKSCC to satisfy its obligations as a clearing participant of ChinaClear in respect of trades transacted through Stock Connect. These funds are held in segregated accounts of the respective clearing houses for this specified purpose and cannot be used by the Group to finance any other activities.
Clearing House Funds - the Clearing House Funds are established under the Clearing House Rules. Assets contributed by the CPs and the Group are held by the respective clearing houses (together with the accumulated income less related expenses for the clearing houses in Hong Kong) expressly for the purpose of ensuring that the respective clearing houses are able to fulfil their counterparty obligations in the event that one or more of the CPs fail to meet their obligations to the clearing houses. The HKSCC Guarantee Fund also provides resources to enable HKSCC to discharge its liabilities and obligations if defaulting CPs deposit defective securities into CCASS. The amounts earmarked for contribution to the Rates and FX Guarantee Resources of OTC Clear and its accumulated investment income was also included in Clearing House Funds for presentation purpose. These funds are held in segregated accounts of the respective clearing houses for this specified purpose and cannot be used by the Group to finance any other activities.
Metals derivatives contracts represent the fair value of the outstanding base and precious metals futures and options contracts cleared through LME Clear that do not qualify for netting under HKAS 32: Financial Instruments: Presentation, where LME Clear is acting in its capacity as a central counterparty to the contracts traded on the LME.
Cash prepayments for A shares represent cash received by HKSCC from its CPs for releasing their allocated A shares for same day settlement. Such prepayments will be used to settle HKSCC’s Continuous Net Settlement obligations payable on the next business day.
Financial assets held by the Group which are funded by share capital and funds generated from operations are classified as Corporate Funds (ie, other than financial assets of Margin Funds, Clearing House Funds, metals derivatives contracts, and cash prepayments for A shares).

46
The financial assets are invested into the cash and cash equivalents, financial assets measured at fair value through profit or loss, financial assets measured at amortised cost, and accounts receivable and deposits, details of which are as follows:
At 31 Dec 2017
$m
At 31 Dec 2016
$m
Margin Funds
Cash and cash equivalents 122,844 96,698
Financial assets measured at fair value through profit or loss 3,059 3,323
Financial assets measured at amortised cost 29,481 25,782
Accounts receivable and deposits 2,430 1,043
157,814 126,846
Clearing House Funds
Cash and cash equivalents 17,581
9,476
Financial assets measured at amortised cost 61 126
17,642 9,602
Metals derivatives contracts
Financial assets measured at fair value through profit or loss 85,335 61,618
Cash prepayments for A shares
Cash and cash equivalents 1,689 263
Corporate Funds
Cash and cash equivalents 13,546
9,286
Financial assets measured at fair value through profit or loss 6,643 5,125
Financial assets measured at amortised cost 1,275 3,259
21,464 17,670
283,944 215,999
The expected maturity dates of the financial assets are analysed as follows:
At 31 Dec 2017 At 31 Dec 2016
Margin
Funds
$m
Clearing
House
Funds
$m
Metals
derivatives
contracts
$m
Cash
prepayments
for
A shares
$m
Corporate
Funds
$m
Total
$m
Margin
Funds
$m
Clearing
House
Funds
$m
Metals
derivatives
contracts
$m
Cash
prepayments
for
A shares
$m
Corporate
Funds
$m
Corporate
Funds
$m
Total
$m
Within 12 months 157,814
84
17,642 85,335 1,689 21,404 283,884 126,846 9,602 61,618 263 17,596 215,925
Over 12 months – – – – 60 60 – – – – 74 74
157,814 17,642 85,335 1,689 21,464 283,944 126,846 9,602 61,618 263 17,670 215,999
11. Accounts Receivable, Prepayments and Deposits The Group’s accounts receivable, prepayments and deposits mainly represented the Group’s Continuous Net Settlement money obligations receivable under the T+2 settlement cycle, which accounted for 75 per cent (31 December 2016: 78 per cent) of the total accounts receivable, prepayments and deposits. Continuous Net Settlement money obligations receivable mature within two days after the trade date. The majority of the remaining accounts receivable, prepayments and deposits were due within three months.
12. Accounts Payable, Accruals and Other Liabilities The Group’s accounts payable, accruals and other liabilities mainly represented the Group’s Continuous Net Settlement money obligations payable, which accounted for 88 per cent (31 December 2016: 84 per cent) of the total accounts payable, accruals and other liabilities. Continuous Net Settlement money obligations payable mature within two days after the trade date. The majority of the remaining accounts payable, accruals and other liabilities would mature within three months.

47
13. Borrowings
At 31 Dec 2017
$m
At 31 Dec 2016
$m
Bank borrowings (note (a)) - 1,586
Notes (note (b)) 1,533 1,519
Written put options to non-controlling interests (note (c)) 327 317
Total borrowings 1,860 3,422
Analysed as:
Non-current liabilities 833 3,422
Current liabilities 1,027 -
1,860 3,422
(a) Bank borrowings
In 2017, the bank borrowings were fully repaid.
(b) Notes
In December 2013 and January 2014, HKEX issued US$100 million (HK$775 million) and US$95 million (HK$737 million) of fixed rate senior notes which will be due in December 2018 and January 2019 respectively.
(c) Written put options to non-controlling interests
OTC Clear issued non-voting ordinary shares to certain third party shareholders at a total consideration of $340 million. As part of the arrangement, put options were written by HKEX to the non-controlling interests to sell part or all of their non-voting ordinary shares in OTC Clear to HKEX at the initial subscription price of $210,000 per share less accumulated dividends received by the non-controlling interests. The put options are exercisable by the non-controlling interests at any time following the date falling five years after the shares were issued if the non-controlling interests can demonstrate to HKEX that they have used reasonable endeavours for at least three months to find a suitable purchaser for their shares at a price equal to or more than their fair market values. The carrying amount of written put options represents the present value of the amount payable by HKEX to acquire the shares held by non-controlling interests at the date at which the written put options first become exercisable. $245 million of the written put options will become exercisable in October 2018 and the remaining $82 million will become exercisable in August 2020.
14. Retained Earnings
2017 $m
2016 $m
At 1 Jan 10,334 10,691
Profit attributable to shareholders 7,404 5,769
Transfer (to)/from Clearing House Funds reserves (49) 5
Dividends:
2016/2015 final dividend (2,491) (3,459)
2017/2016 interim dividend (3,133) (2,683)
Unclaimed HKEX dividends forfeited 26 22
Vesting of shares of Share Award Scheme (16) (11)
Tax credit relating to Share Award Scheme 3 -
Changes in ownership interests in a subsidiary 12 -
At 31 Dec 12,090 10,334

48
SCOPE OF WORK OF PRICEWATERHOUSECOOPERS HONG KONG The financial figures in this announcement of the Group’s results for the year ended 31 December 2017 have been agreed by the Group’s external auditor, PricewaterhouseCoopers Hong Kong (PwC), to the amounts set out in the Group’s draft consolidated financial statements for the year. The work performed by PwC in this respect did not constitute an assurance engagement in accordance with Hong Kong Standards on Auditing, Hong Kong Standards on Review Engagements or Hong Kong Standards on Assurance Engagements issued by the HKICPA, and consequently no assurance has been expressed by PwC on this announcement.
REVIEW OF 2017 CONSOLIDATED FINANCIAL STATEMENTS The Audit Committee (AC) reviewed the 2017 Consolidated Financial Statements in conjunction with HKEX’s external auditor. Based on this review and discussions with management, the AC was satisfied that the Consolidated Financial Statements were prepared in accordance with applicable accounting standards and fairly present the Group’s financial position and results for the year ended 31 December 2017.
DISTRIBUTABLE RESERVES
As at 31 December 2017, HKEX’s distributable reserves, calculated under Part 6 of the Companies Ordinance (Chapter 622 of the Laws of Hong Kong), amounted to $7.3 billion (31 December 2016: $6.4 billion).
FINAL DIVIDEND
The Board recommends the payment of a final dividend of $2.85 per share (2016: $2.04 per share) to Shareholders whose names appear on HKEX’s Register of Members on 3 May 2018, and the retention of the remaining profit for the year. Including the interim dividend, total dividend for 2017 amounts to a total of $5.40 per share (2016: $4.25 per share), which represents a payout ratio of 90 per cent (2016: 90 per cent) of the profit attributable to shareholders for the year ended 31 December 2017. Dividends for shares held in trust under the Share Award Scheme amount to $16 million (2016: $14 million). The Board also proposes to offer a scrip dividend alternative to allow Shareholders to elect to receive the final dividend wholly or partly in the form of new fully paid shares in lieu of cash.
SCRIP DIVIDEND ALTERNATIVE
Subject to Shareholders’ approval at the 2018 AGM of the proposed final dividend and a general mandate to issue shares, the final dividend will be payable in cash with a scrip alternative where a 3 per cent discount on the subscription price will be offered to Shareholders who elect to subscribe for shares. The scrip dividend alternative is also conditional upon the SFC’s granting the listing of, and permission to deal in, new shares of HKEX to be issued pursuant thereto. A circular containing details of the scrip dividend alternative, where available, together with an election form (where applicable) is expected to be despatched to Shareholders on or about Wednesday, 9 May 2018. The scrip share subscription price for calculating the number of new shares to be allotted will be announced on or about Tuesday, 15 May 2018. Definitive share certificates in respect of the scrip dividend and dividend warrants are expected to be despatched to Shareholders on Friday, 1 June 2018.

49
CLOSURE OF HKEX’S REGISTER OF MEMBERS
For the purposes of determining Shareholders’ eligibility to attend and vote at the 2018 AGM, and entitlement to the final dividend, HKEX’s Register of Members will be closed as set out below: (i) For determining eligibility to attend and vote at the 2018 AGM:
– Latest time to lodge transfer documents for registration with HKEX’s registrar
At 4:30 pm on 19 April 2018
– Closure of HKEX’s Register of Members 20 April 2018 to 25 April 2018 (both dates inclusive)
– Record date 25 April 2018 (ii) For determining entitlement to the final dividend:
– Ex-dividend date 27 April 2018 – Latest time to lodge transfer documents for registration with
HKEX’s registrar At 4:30 pm on 30 April 2018
– Closure of HKEX’s Register of Members 2 May 2018 to 3 May 2018
(both dates inclusive) – Record date 3 May 2018
During the above closure periods, no transfer of shares will be registered. To be eligible to attend and vote at the 2018 AGM, and to qualify for the 2017 final dividend, all properly completed transfer forms accompanied by the relevant share certificates must be lodged for registration with HKEX’s registrar, Hong Kong Registrars Limited, at Shops 1712-1716, 17th Floor, Hopewell Centre, 183 Queen’s Road East, Wan Chai, Hong Kong no later than the aforementioned latest time.
ANNUAL GENERAL MEETING
The 2018 AGM will be held on Wednesday, 25 April 2018 at 4:30 pm at the HKEX Connect Hall on the 1st Floor, One and Two Exchange Square, Central, Hong Kong. The Notice of the 2018 AGM, which constitutes part of a circular to Shareholders, will be sent together with the 2017 Annual Report. The Notice of the 2018 AGM, the circular which sets out details of the business to be conducted at the 2018 AGM and the proxy form will be available under the Investor Relations section of the HKEX Group website. The results of the voting on the proposed resolutions will be published on the HKEX Group website shortly after the 2018 AGM is held. All Shareholders are encouraged to attend the 2018 AGM and exercise their right to vote. Shareholders are invited to ask questions related to the business of the meeting, and will be able to meet with Directors and the senior management.
APPOINTMENT AND ELECTION OF DIRECTORS The service term of C K Chow and Tim Freshwater (Government Appointed Directors), and T C Chan, Fred Hu and John Williamson (Elected Directors) will expire at the conclusion of the 2018 AGM. On 12 February 2018, the Government appointed Cha May-Lung, Laura and Hung Pi Cheng, Benjamin as members of the Board, each for a term of approximately two years from the conclusion of the 2018 AGM until the end of the annual general meeting to be held in 2020. On 14 February 2018, the Nomination Committee, having reviewed the Board’s composition, nominated T C Chan, Fred Hu and John Williamson to the Board for it to recommend to Shareholders for re-election at the 2018 AGM. The nominations were made in accordance with the Nomination Policy and the objective criteria (including without limitation, gender, age, cultural and educational background, ethnicity, professional experience, skills, knowledge and length of service), with due regard for the benefits of diversity, as set out under the Board Diversity Policy. The Nomination Committee had also taken into account the respective contributions of Mr Chan, Dr Hu and Mr Williamson to the Board and their firm commitment to their roles, and it was satisfied with their independence having regard to the criteria laid down in the Main Board Listing Rules. Mr Chan, who is a member of the Nomination Committee, abstained from voting at the Committee meeting when his own nomination was being considered.

50
On 28 February 2018, the Board accepted the nomination by the Nomination Committee and recommended Mr Chan, Dr Hu and Mr Williamson to stand for re-election at the 2018 AGM. Mr Chan, Dr Hu and Mr Williamson do not have any service contracts with any member of the Group that are not determinable by the Group within one year without compensation (other than statutory compensation). Their particulars will be set out in the circular to Shareholders.
COMPLIANCE WITH CORPORATE GOVERNANCE CODE
Throughout the year 2017, HKEX complied with all code provisions and, where appropriate, adopted the recommended best practices set out in the Corporate Governance Code, with the exceptions of Code Provisions A.4.1 (re-election of non-executive directors) and A.4.2 (retirement by rotation of directors).
The Government Appointed Directors, all being Non-executive Directors, are not subject to election or re-election by Shareholders as their appointments are governed by the SFO. HKEX’s Chief Executive in his capacity as a Director is not subject to retirement by rotation, as his term on the Board is coterminous with his employment with HKEX under HKEX’s Articles of Association.
HKEX has applied the principles of the Corporate Governance Code to its corporate governance structure and practices in the manner as described in the Corporate Governance Report contained in the 2017 Annual Report and on the HKEX Group website.
PURCHASE, SALE OR REDEMPTION OF HKEX’S LISTED SECURITIES
During 2017, neither the Company nor any of its subsidiaries purchased, sold or redeemed any of HKEX shares, except that the trustee of the Share Award Scheme, pursuant to the terms of the rules and trust deed of the Share Award Scheme, purchased on the Stock Exchange a total of 999,700 HKEX shares at a total consideration of $228 million.
PUBLICATION OF 2017 FINAL RESULTS AND ANNUAL REPORT This announcement is published on the HKEXnews website at www.hkexnews.hk and the HKEX Group website at http://www.hkexgroup.com/Investor-Relations/Regulatory-Disclosure/Announcements/2018. The 2017 Annual Report will be available on the HKEXnews and HKEX Group websites and despatched to Shareholders on or about Wednesday, 21 March 2018. By Order of the Board Hong Kong Exchanges and Clearing Limited Joseph Mau Group Company Secretary
Hong Kong, 28 February 2018
At the date of this announcement, the Board comprises 12 Independent Non-executive Directors, namely Mr CHOW Chung Kong (Chairman), Mr Apurv BAGRI, Mr CHAN Tze Ching, Ignatius, Mr CHEAH Cheng Hye, Mr Timothy George FRESHWATER, Ms FUNG Yuen Mei, Anita, Mr Rafael GIL-TIENDA, Dr HU Zuliu, Fred, Mrs LEUNG KO May Yee, Margaret, Mr LEUNG Pak Hon, Hugo, Mr John Mackay McCulloch WILLIAMSON and Mr YIU Kin Wah, Stephen, and one Executive Director, Mr LI Xiaojia, Charles, who is also HKEX’s Chief Executive.

51
GLOSSARY
2018 AGM HKEX’s annual general meeting to be held on 25 April 2018
ADT Average daily turnover value
ADV Average daily volume (in number of contracts/lots)
AHFT After-Hours Futures Trading
Awarded Shares Shares awarded under the Share Award Scheme
BCCL Bond Connect Company Limited
Board HKEX’s board of directors
Bond Connect A mutual bond market access programme between Hong Kong and Mainland China, under which Northbound trading enables overseas investors to invest in the China Interbank Bond Market, and Southbound trading will be explored at a later stage
Cash Market HKEX’s securities related business excluding stock options
CBBCs Callable Bull/Bear Contracts
CCASS Central Clearing and Settlement System
CFETS China Foreign Exchange Trade System (National Interbank Funding Center)
ChinaClear China Securities Depository and Clearing Corporation Limited
CNH Offshore RMB traded outside Mainland China
Corporate Governance Code and Corporate Governance Report
Refer to Appendix 14 to the Main Board Listing Rules
CP(s) Clearing Participant(s)
CSR Corporate Social Responsibility
Derivatives Market HKEX’s derivatives related business including stock options
Director(s) HKEX’s director(s)
DWs Derivative warrants
Elected Directors Directors elected by the Shareholders at general meetings
EP(s) Exchange Participant(s)
ETF(s) Exchange Traded Fund(s)
Euro The official currency of the Eurozone
Exchange or SEHK or Stock Exchange
The Stock Exchange of Hong Kong Limited
FIC Fixed income and currency
Futures Exchange or HKFE Hong Kong Futures Exchange Limited
GEM Formerly known as “Growth Enterprise Market”
GEM Listing Rules Rules Governing the Listing of Securities on GEM of The Stock Exchange of Hong Kong Limited
Government Appointed Directors
Directors appointed by the Financial Secretary of the Hong Kong Special Administrative Region of the People’s Republic of China pursuant to Section 77 of the SFO
Group or HKEX Group HKEX and its subsidiaries
HKCC HKFE Clearing Corporation Limited
HKEX or the Company Hong Kong Exchanges and Clearing Limited
HKICPA Hong Kong Institute of Certified Public Accountants
HKSCC Hong Kong Securities Clearing Company Limited
HSCEI Hang Seng China Enterprises Index
HSI Hang Seng Index
IPO(s) Initial Public Offering(s)

52
Iron Ore Futures TSI Iron Ore Fines 62 per cent Fe CFR China Futures
IT Information Technology
Lehman Lehman Brothers Securities Asia Limited
LCH LCH.Clearnet Group Limited
Listing Committees Listing Committee and GEM Listing Committee
Listing Rule(s) Main Board Listing Rules and GEM Listing Rules
LME The London Metal Exchange
LME Clear LME Clear Limited
LME Group HKEX Investment (UK) Limited, LME Holdings Limited, the LME and LME Clear
London Metal Mini Futures London Aluminium/Zinc/Copper/Nickel/Tin/Lead Mini Futures
Main Board Listing Rules Rules Governing the Listing of Securities on The Stock Exchange of Hong Kong Limited
MSCI MSCI Inc.
Northbound Trading Hong Kong and overseas investors trading in eligible securities that are listed on the Shanghai Stock Exchange or the Shenzhen Stock Exchange through Stock Connect
OTC Over-the-counter
OTC Clear OTC Clearing Hong Kong Limited
QME Qianhai Mercantile Exchange Co., Ltd.
RMB Renminbi
SEOCH The SEHK Options Clearing House Limited
SFC Securities and Futures Commission
SFO Securities and Futures Ordinance (Chapter 571 of the Laws of Hong Kong)
Shanghai-Hong Kong Stock Connect or Shanghai Connect
A mutual market access programme that links the stock markets in Shanghai and Hong Kong, enabling investors in Hong Kong and Mainland China to trade and settle shares listed on the other market via the exchange and clearing house in their home market
Shareholder(s) HKEX’s shareholder(s)
Share Award Scheme or the Scheme
The Employees’ Share Award Scheme adopted by the Board on 14 September 2005 which was subsequently amended on 16 August 2006, 13 May 2010, 17 December 2013 and 17 June 2015
Shenzhen-Hong Kong Stock Connect or Shenzhen Connect
A mutual market access programme that links the stock markets in Shenzhen and Hong Kong, enabling investors in Hong Kong and Mainland China to trade and settle shares listed on the other market via the exchange and clearing house in their home market
Southbound Trading Mainland investors trading in eligible securities that are listed on the Stock Exchange through Stock Connect
Stock Connect Shanghai-Hong Kong Stock Connect and Shenzhen-Hong Kong Stock Connect
UK United Kingdom
US United States of America
US$/USD United States dollar
$/HK$/HKD Hong Kong dollar
$bn/bn Hong Kong dollar in billion/billion
$m Hong Kong dollar in million
£/GBP Pound sterling