Embed Size (px)
Citation preview
1
Hong Kong Exchanges and Clearing Limited and The Stock Exchange of Hong Kong Limited take no responsibility for the contents of this announcement, make no representation as to its accuracy or completeness and expressly disclaim any liability whatsoever for any loss howsoever arising from or in reliance upon the whole or any part of the contents of this announcement.
(Incorporated in Hong Kong with limited liability)(Stock Code: 01111)
2017 FINAL RESULTS
RESULTS FOR THE YEAR ENDED 31 DECEMBER 2017
HIgHLIgHTS
• Operating profit before impairment allowances amounted to HK$1,356 million, a decrease of6% year-on-year.
• Profit before tax was 2% higher than 2016 to HK$1,709 million.
• Profit attributable to equity owners amounted to HK$1,565 million, an increase of 10% overthat of last year.
• Cost to income ratio was at 49.96%.
• Return on shareholders’ equity of 9.89% (9.61% in 2016) and earnings per share of HK$2.17(HK$1.94 per share in 2016).
• Total assets increased by 19% to HK$163.7 billion.
• Total dividends for the financial year of 2017, including the interim cash dividend ofHK$0.15 per share paid in September 2017, amounted to HK$0.54 per share (2016 totaldividends: HK$0.54 per share).
• Total dividend payout as a percentage of an adjusted profit attributable to equity owners lessthe distribution paid on the additional equity instruments will be 38.46%.
• Total capital ratio increased from 16.32% in December 2016 to 17.60% in December 2017,the Tier 1 capital ratio was at 13.30% and the Common Equity Tier 1 capital ratio was at11.30%.
2
The board of directors (the “Board”) of Chong Hing Bank Limited (the “Bank” or “Chong Hing Bank”) is pleased to announce the consolidated results of the Bank and its subsidiaries (the “Group”) for the year ended 31 December 2017, together with the comparative figures for the corresponding year in 2016. The financial information in this announcement is based on the audited consolidated financial statements of the Group and does not constitute the Group’s statutory accounts for the year ended 31 December 2017. The 2017 final results have been reviewed by the Audit Committee of the Bank.
CONTENTS
1 Highlights2 Contents4 Chairman’s Statement6 Chief Executive’s Statement18 Consolidated Income Statement19 Consolidated Statement of Comprehensive Income20 Consolidated Statement of Financial Position21 Consolidated Statement of Changes in Equity23 Consolidated Statement of Cash Flows25 Financial Review
25 General25 Application of new and revised Hong Kong Financial Reporting Standards
(“HKFRSs”)25 New and revised HKFRSs issued but not yet effective27 Segment information33 Net interest income34 Net fee and commission income35 Net (loss) income from trading and investments36 Other operating income37 Operating expenses38 Taxation39 Dividends39 Earnings per share – basic and diluted39 Cash and short-term funds40 Derivative financial instruments42 Investments in securities44 Transfer of financial assets45 Advances and other accounts
3
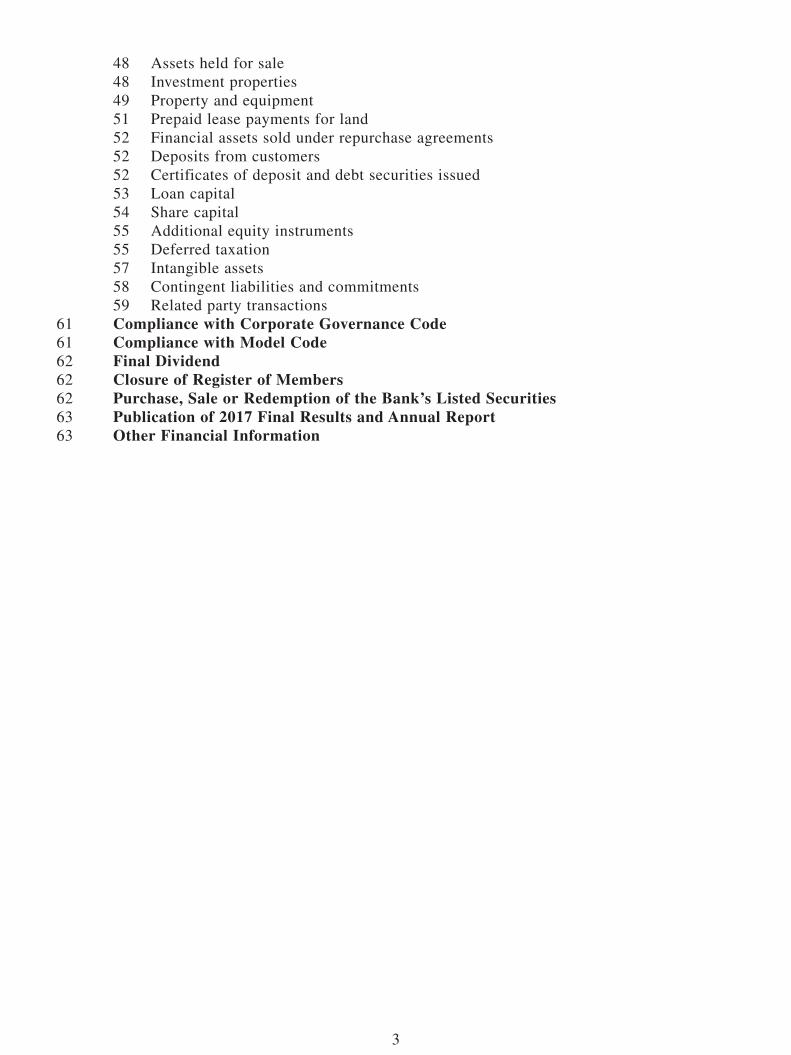
48 Assets held for sale48 Investment properties49 Property and equipment51 Prepaid lease payments for land52 Financial assets sold under repurchase agreements52 Deposits from customers52 Certificates of deposit and debt securities issued53 Loan capital54 Share capital55 Additional equity instruments55 Deferred taxation57 Intangible assets58 Contingent liabilities and commitments59 Related party transactions
61 Compliance with Corporate governance Code61 Compliance with Model Code62 Final Dividend62 Closure of Register of Members62 Purchase, Sale or Redemption of the Bank’s Listed Securities63 Publication of 2017 Final Results and Annual Report63 Other Financial Information
4
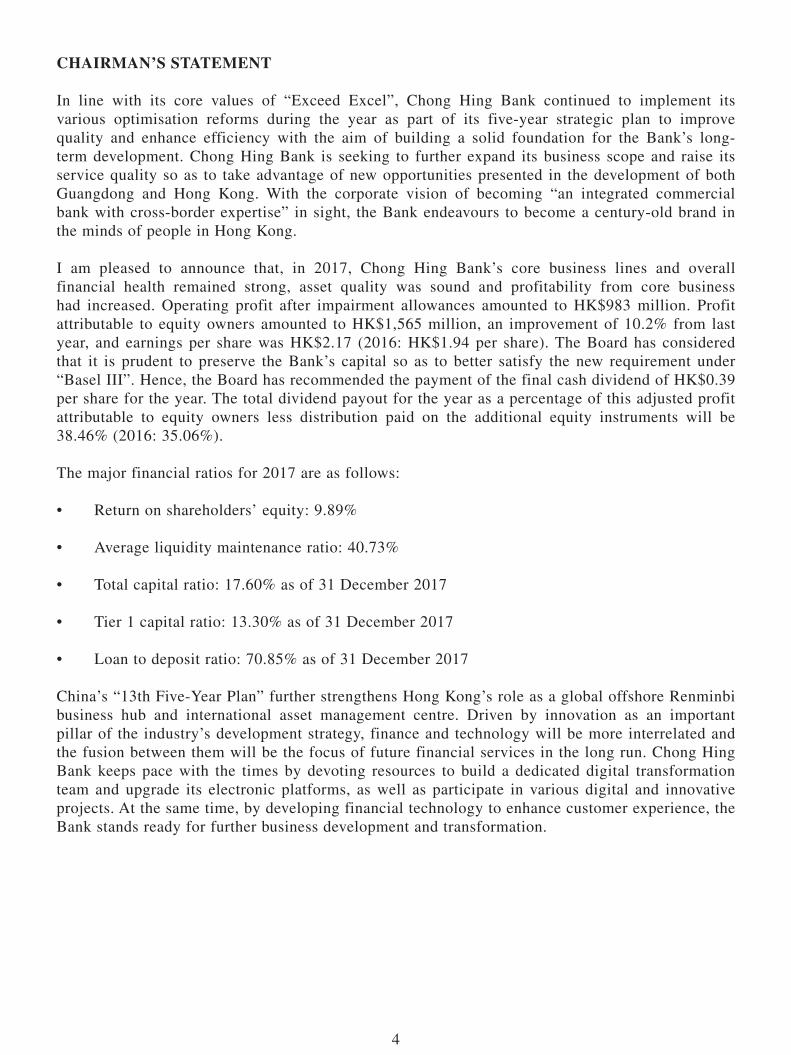
CHAIRMAN’S STATEMENT
In line with its core values of “Exceed Excel”, Chong Hing Bank continued to implement its various optimisation reforms during the year as part of its five-year strategic plan to improve quality and enhance efficiency with the aim of building a solid foundation for the Bank’s long-term development. Chong Hing Bank is seeking to further expand its business scope and raise its service quality so as to take advantage of new opportunities presented in the development of both Guangdong and Hong Kong. With the corporate vision of becoming “an integrated commercial bank with cross-border expertise” in sight, the Bank endeavours to become a century-old brand in the minds of people in Hong Kong.
I am pleased to announce that, in 2017, Chong Hing Bank’s core business lines and overall financial health remained strong, asset quality was sound and profitability from core business had increased. Operating profit after impairment allowances amounted to HK$983 million. Profit attributable to equity owners amounted to HK$1,565 million, an improvement of 10.2% from last year, and earnings per share was HK$2.17 (2016: HK$1.94 per share). The Board has considered that it is prudent to preserve the Bank’s capital so as to better satisfy the new requirement under “Basel III”. Hence, the Board has recommended the payment of the final cash dividend of HK$0.39 per share for the year. The total dividend payout for the year as a percentage of this adjusted profit attributable to equity owners less distribution paid on the additional equity instruments will be 38.46% (2016: 35.06%).
The major financial ratios for 2017 are as follows:
• Return on shareholders’ equity: 9.89%
• Average liquidity maintenance ratio: 40.73%
• Total capital ratio: 17.60% as of 31 December 2017
• Tier 1 capital ratio: 13.30% as of 31 December 2017
• Loan to deposit ratio: 70.85% as of 31 December 2017
China’s “13th Five-Year Plan” further strengthens Hong Kong’s role as a global offshore Renminbi business hub and international asset management centre. Driven by innovation as an important pillar of the industry’s development strategy, finance and technology will be more interrelated and the fusion between them will be the focus of future financial services in the long run. Chong Hing Bank keeps pace with the times by devoting resources to build a dedicated digital transformation team and upgrade its electronic platforms, as well as participate in various digital and innovative projects. At the same time, by developing financial technology to enhance customer experience, the Bank stands ready for further business development and transformation.

5
China’s economic growth is on a steady track with a year-on-year GDP growth of 6.9%, marking a new benchmark of RMB80 trillion in 2017. Guangzhou is among the top cities in China’s provincial development in terms of GDP, and the financial industry is one of Guangzhou’s ten pillar industries. In 2017, the Fortune Global Forum was held in Guangzhou, where Fortune 500 companies, multinational corporations, governmental bodies and social celebrities congregated and exchanged views on the structural formulation of the new global economy. The event focused the world’s attention on Guangzhou and helped promote innovation and development in the city.
As a core member of the financial sector of the Guangzhou-based Yuexiu Group, Chong Hing Bank has continued to take advantage of the Yuexiu Group’s resources in establishing the strategic position of the Guangzhou Branch to oversee its branch network in Mainland China. It also sought to deepen the regional synergies between Guangdong and Hong Kong, as well as expand its Mainland operations to attract high-quality Mainland customers, thereby establishing its unique role in the Pearl River Delta region. With new business opportunities associated with China’s Belt and Road Initiative, the Framework Agreement on Deepening Guangdong-Hong Kong-Macao Cooperation in the Development of the Bay Area and the free trade zones in Guangdong, the financial cooperation between Guangdong, Hong Kong and Macau will be strengthened further. Leveraging its advantageous positions in Guangdong and Hong Kong as well as its comprehensive integrated financial services system, Chong Hing Bank will be able to cater to the financial services needs on both sides and better capture cross-border business opportunities following on from the national policies. The Bank will continue to take a prudent and proactive approach towards achieving the vision of becoming “an integrated commercial bank with cross-border expertise”.
In 2017, Chong Hing Bank established a customised corporate culture accountability structure and philosophy in line with the “Bank Culture Reform” guidelines issued by the Hong Kong Monetary Authority, bearing in mind the banking industry’s specifics and the Bank’s strategic proposition. The concept of Core Values, Vision and Mission determines Chong Hing Bank’s value orientation and strategic objectives, while the Management Concepts, Enterprise Spirit and Corporate Style of the Bank make up the underlying concept of its corporate culture and formulate the basis for its code of conduct. Chong Hing Bank is committed to implementing its philosophy in its business operation and management, and will endeavour to consolidate its team through high-quality corporate culture, so that it may work together as one to expand its business further.
There are quite a few challenges that Chong Hing Bank has to overcome while facing the fast-changing business environment. I would like to express my gratitude to all the Directors for their valuable guidance and advice on the Bank’s sustainable growth; and, on behalf of the Board, I would also like to convey my sincere appreciation to our shareholders, customers and business partners for their long-term support and trust. Finally, I sincerely appreciate the Bank’s management team and staff members of all levels for their continuous collaborations and persistent dedication, which is instrumental in moving Chong Hing Bank forward on its path of pursuing excellence.
Zhang ZhaoxingChairman
Hong Kong, 29 March 2018
6
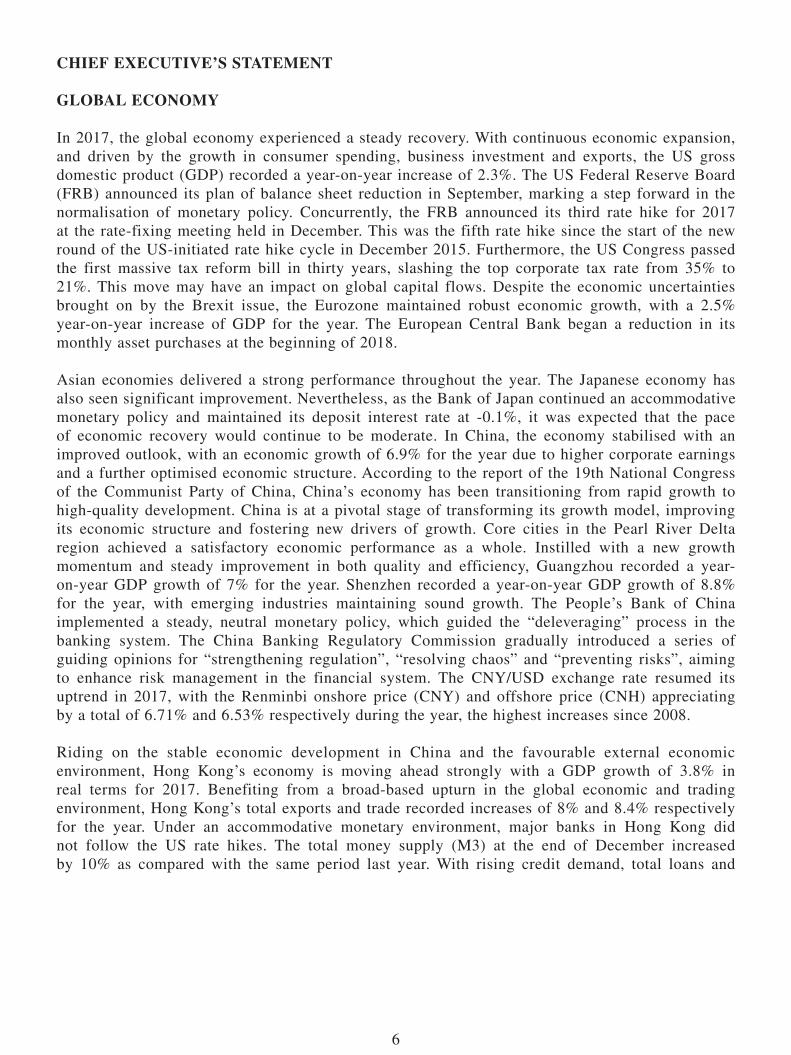
CHIEF ExECUTIvE’S STATEMENT
gLOBAL ECONOMY
In 2017, the global economy experienced a steady recovery. With continuous economic expansion, and driven by the growth in consumer spending, business investment and exports, the US gross domestic product (GDP) recorded a year-on-year increase of 2.3%. The US Federal Reserve Board (FRB) announced its plan of balance sheet reduction in September, marking a step forward in the normalisation of monetary policy. Concurrently, the FRB announced its third rate hike for 2017 at the rate-fixing meeting held in December. This was the fifth rate hike since the start of the new round of the US-initiated rate hike cycle in December 2015. Furthermore, the US Congress passed the first massive tax reform bill in thirty years, slashing the top corporate tax rate from 35% to 21%. This move may have an impact on global capital flows. Despite the economic uncertainties brought on by the Brexit issue, the Eurozone maintained robust economic growth, with a 2.5% year-on-year increase of GDP for the year. The European Central Bank began a reduction in its monthly asset purchases at the beginning of 2018.
Asian economies delivered a strong performance throughout the year. The Japanese economy has also seen significant improvement. Nevertheless, as the Bank of Japan continued an accommodative monetary policy and maintained its deposit interest rate at -0.1%, it was expected that the pace of economic recovery would continue to be moderate. In China, the economy stabilised with an improved outlook, with an economic growth of 6.9% for the year due to higher corporate earnings and a further optimised economic structure. According to the report of the 19th National Congress of the Communist Party of China, China’s economy has been transitioning from rapid growth to high-quality development. China is at a pivotal stage of transforming its growth model, improving its economic structure and fostering new drivers of growth. Core cities in the Pearl River Delta region achieved a satisfactory economic performance as a whole. Instilled with a new growth momentum and steady improvement in both quality and efficiency, Guangzhou recorded a year-on-year GDP growth of 7% for the year. Shenzhen recorded a year-on-year GDP growth of 8.8% for the year, with emerging industries maintaining sound growth. The People’s Bank of China implemented a steady, neutral monetary policy, which guided the “deleveraging” process in the banking system. The China Banking Regulatory Commission gradually introduced a series of guiding opinions for “strengthening regulation”, “resolving chaos” and “preventing risks”, aiming to enhance risk management in the financial system. The CNY/USD exchange rate resumed its uptrend in 2017, with the Renminbi onshore price (CNY) and offshore price (CNH) appreciating by a total of 6.71% and 6.53% respectively during the year, the highest increases since 2008.
Riding on the stable economic development in China and the favourable external economic environment, Hong Kong’s economy is moving ahead strongly with a GDP growth of 3.8% in real terms for 2017. Benefiting from a broad-based upturn in the global economic and trading environment, Hong Kong’s total exports and trade recorded increases of 8% and 8.4% respectively for the year. Under an accommodative monetary environment, major banks in Hong Kong did not follow the US rate hikes. The total money supply (M3) at the end of December increased by 10% as compared with the same period last year. With rising credit demand, total loans and

7
advances from authorised institutions at the end of December achieved a year-on-year growth of 16.1%. During the year, the booming Hong Kong property market has contributed to a 21-month continuous growth in the private domestic housing price index as of December, the most persistent growth ever recorded. The number of property registrations in the entire market for the year increased by 14.8% to 83,815 as compared with the previous year, reaching a five-year high. Fuelled by a favourable global economy and capital inflows from China and foreign countries, the Hong Kong stock market surged for eight consecutive months from January 2017 and broke through the 30,000 mark in November, hitting a ten-year high. The Hang Seng Index ended the year at 29,919 points, with an accumulated increase of 36% for the year. The Shanghai-Hong Kong Stock Connect and the Shenzhen-Hong Kong Stock Connect also achieved record high turnovers.
RESULTS ANNOUNCEMENT AND PROFIT ANALYSIS
The results for the financial year of 2017 of the Bank, on a consolidated basis, are summarised below:
Key Financial Data
31 December(12 months)
Variance2017 2016HK$’000 HK$’000 %
1. Operating profit after impairment allowances 983,413 1,475,871 -33.372. Profit attributable to equity owners 1,564,867 1,419,704 +10.223. Net interest income 2,317,128 2,044,800 +13.324. Net fee and commission income 327,471 259,584 +26.155. Net (loss) income from trading and
investments(93,938) 230,059 -140.83
6. Other operating income 158,895 139,853 +13.627. Operating expenses 1,353,633 1,227,552 +10.278. Net (charge) reversal of impairment
allowances on loans and advances(371,591) 40,198 -1,024.40
As of 31 December
2017
As of 31 December
2016 VarianceHK$’000 HK$’000 %
9. Total loans and advances to customers 86,698,372 70,689,155 +22.6510. Total customer deposits 118,758,674 102,880,629 +15.4311. Investments in securities 39,153,501 29,727,952 +31.7112. Total assets 163,747,114 137,772,051 +18.85
8
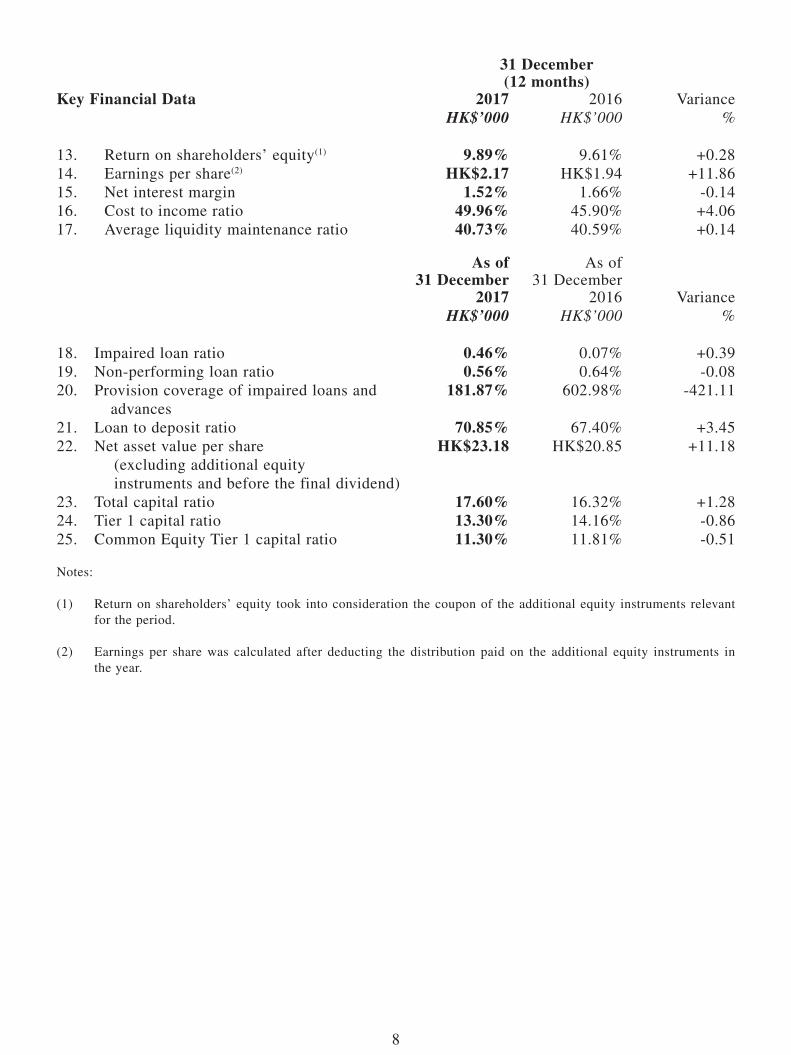
Key Financial Data
31 December (12 months)
Variance2017 2016HK$’000 HK$’000 %
13. Return on shareholders’ equity(1) 9.89% 9.61% +0.2814. Earnings per share(2) HK$2.17 HK$1.94 +11.8615. Net interest margin 1.52% 1.66% -0.1416. Cost to income ratio 49.96% 45.90% +4.0617. Average liquidity maintenance ratio 40.73% 40.59% +0.14
As of 31 December
2017
As of 31 December
2016 VarianceHK$’000 HK$’000 %
18. Impaired loan ratio 0.46% 0.07% +0.3919. Non-performing loan ratio 0.56% 0.64% -0.0820. Provision coverage of impaired loans and
advances181.87% 602.98% -421.11
21. Loan to deposit ratio 70.85% 67.40% +3.4522. Net asset value per share (excluding additional equity instruments and before the final dividend)
HK$23.18 HK$20.85 +11.18
23. Total capital ratio 17.60% 16.32% +1.2824. Tier 1 capital ratio 13.30% 14.16% -0.8625. Common Equity Tier 1 capital ratio 11.30% 11.81% -0.51
Notes:
(1) Return on shareholders’ equity took into consideration the coupon of the additional equity instruments relevant for the period.
(2) Earnings per share was calculated after deducting the distribution paid on the additional equity instruments in the year.
9
ANALYSIS OF KEY FINANCIAL DATA
In 2017, profit attributable to equity owners of the Bank increased by 10.2% year-on-year to HK$1,565 million.
Net interest income increased by 13.3% to HK$2,317 million. The improvement in net interest income was achieved mainly through the growth of loans and advances and investment in debt securities. The increase in interest expenses was mainly attributable to the increase in deposits from customers. Net interest margin at 1.52% was 14 basis points less than the same period last year. After excluding penalty cost factor, year over year net interest margin dropped 7 basis points.
Net fee and commission income improved by 26.2% to HK$327 million, which was mainly attributable to a 33.1% increase in commission income arising from securities dealings as the stock market turnover was much higher than the same period last year.
Net loss from trading and investments at HK$94 million was due to the RMB appreciation resulting in a translation loss of HK$195 million. The increase in net gains on disposal of the available-for-sale debt securities of HK$97 million partly offset the RMB translation loss.
The Bank strived for operation enhancement and at the same time invested in talents and systems to support business growth and expansion into the Mainland.
To optimise the use of resources, certain assets that were not considered essential to the core business lines had been sold, and a net gain of HK$657 million was recorded in 2017.
Total loans and advances to customers increased by HK$16 billion to HK$86.7 billion, with noticeable growth in term loans and syndication loans. With careful management on the exposure of credit risk, asset quality of loans and advances continued to be good with impaired loan ratio at 0.46%, non-performing loan ratio at 0.56% and provision coverage of impaired loans and advances at 182%.
Total customer deposits increased by 15.4% to HK$118.8 billion. The Bank continued to maintain a stable deposit base, allowing the Bank to balance loan growth and investment in debt securities, as well as wealth management and cross-border financial business needs.
Total assets increased by 18.9% to HK$163.7 billion. As at 31 December 2017, 87.7% of the Bank’s assets was based in Hong Kong.
As a result of proactive management of assets and liabilities, the Bank’s liquidity remained stable, the loan to deposit ratio was 70.85%, and the liquidity maintenance ratio was an average of 40.73%.
Total capital ratio was at 17.60%, the Tier 1 capital ratio was at 13.30% and the Common Equity Tier 1 capital ratio was at 11.30%.
Overall, the Bank’s core business lines, financial positions and asset quality are strong, while impaired loan ratio remains low with high provision coverage. Capital adequacy ratio and liquidity maintenance ratio are above the relevant statutory requirements.
10
DIvIDEND
To properly balance sharing of success with preserving capital for future growth, the Board has recommended the payment of the final cash dividend of HK$0.39 per share for the financial year of 2017 (2016 final cash dividend: HK$0.39 per share) to the shareholders whose names appear on the register of members of the Bank on Tuesday, 29 May 2018. Total dividends for the financial year of 2017, including the interim cash dividend of HK$0.15 per share paid on 25 September 2017 (2016 interim cash dividend: HK$0.15 per share), amounted to HK$0.54 per share (2016 total dividends: HK$0.54 per share).
ISSUANCE OF TIER 2 SUBORDINATED NOTES
To raise funds for Basel III-compliant Tier 2 capital, the Bank settled and closed a US$382,903,000 Tier 2 Subordinated Notes (the “New Notes”) offering on 26 July 2017. The New Notes are 10-year non-call 5-year fixed rate notes, with a fixed coupon rate of 3.876% per annum, payable semi-annually for the first five years; the interest rate will be reset on 26 July 2022.
The aggregate principal amount of the New Notes is US$382,903,000. This includes US$22,903,000 of “New Exchange Notes” (being the New Notes issued pursuant to the exchange offer by the Bank to the holders of its US$225 million 6.000% Subordinated Notes due 2020) and US$360 million of “New Money Notes”. The final deal size is the largest ever international bond offering transaction by the Bank and is also the first Basel III-compliant transaction by the Bank. In line with the Bank’s prudent and stable development approach, the proceeds from the offering will be used to strengthen the Bank’s capital base and fund the growth of its operations and development. The New Notes have been listed on the Stock Exchange of Hong Kong under Stock Code of 05249 on 27 July 2017.
BUSINESS REvIEW
Corporate Banking
By strengthening its capability in offering professional services and facilitating customer-oriented product innovation, Chong Hing Bank is committed to providing a one-stop banking services platform for our corporate customers in Hong Kong and the Mainland. The Bank also fully supports Hong Kong Mortgage Corporation Limited’s “SME Financing Guarantee Scheme” in addition to participating in the Hong Kong Government’s “SME Loan Guarantee Scheme” to foster the development of SMEs.
In recent years, the Bank has strived to develop its loan syndication business, which recorded a satisfactory performance. In 2017, the Bank completed 42 syndicated loans and acted as the lead arranger for six of them. Moreover, the Bank proceeded to book-run its first ever syndicated loan with another bank in the region’s loan syndication market. This is a milestone in loan syndication business for the Bank. By virtue of its syndicated and bilateral loans, the Bank was able to maintain growth in total corporate loans in 2017, while non-interest income from business also improved as compared with the same period in 2016.

11
Being an integrated commercial bank offering cross-border expertise and leveraging on its competitive edge in network interaction between Hong Kong and Mainland China, the Bank provides various cross-border financial products and services to accommodate customers’ funding requirements in Hong Kong and Mainland China, and effectively manages their interest rate and exchange risks through its treasury product portfolio.
Personal Banking
The Bank provides its personal banking customers with various personal financial management services, including deposits, mortgage loans, consumer finance, wealth management and private banking, etc. Apart from enhancing communication with existing customers, our personal banking team continues to expand its customer base in financial management, focusing its attention on product development and improving service quality, and promoting its products through a variety of activities. The team will remain committed to delivering quality banking services and products for Hong Kong and cross-border personal customers in Guangdong and Hong Kong.
The personal banking business continued to maintain stable business growth in 2017:
• As the investment market was strong during the year, a certain amount of customers’ deposits was channelled into securities and related investment products. Through a series of promotional activities and efforts to expand the customer base, total deposits in personal customers recorded a steady growth of 6.98%. Advances to personal banking customers steadily grew by 4.14% without compromising loan quality, while the loan quality stayed at a healthy level. In addition, the Bank recruited a good number of quality customers during the year, creating a solid foundation for further business expansion.
• The Bank proactively promoted the development of its wealth management business, with the sales of investment products maintaining a strong growth momentum. Coupled with heightened investment sentiment in the market, the commission income grew more than 64% year-on-year, marking a strong double-digit growth for three consecutive years. The Bank launched a number of new services during the year, including the “Online Fund Search” tool and the enhanced foreign currency trading channels to improve customer experience and optimise transaction procedures. On the sales of life insurance products, the Bank adjusted its marketing strategies and offered diverse products to suit different customers. The Bank will continually drive its online trading platform development and expand its working partners of wealth management products in order to meet Hong Kong and cross-border customers’ wealth management needs.
• In the area of credit card business, the Bank launched various customer reward programmes and market promotions to attract new customers and improve the credit card utilisation rate. The Bank also devoted efforts to developing its merchant-acquiring business. Meanwhile, commission income from the merchant-acquiring business increased by over 43% year-on-year.
Financial Markets Business
With regard to its treasury business, the Bank optimised the balance sheet by effectively utilising various financial instruments while strictly complying with the established risk controls. At the same time, the Bank adjusted its investment management strategies to successfully enhance asset quality and return on investment. Despite the narrowing spread in 2017, the returns on the Bank’s bond and credits portfolio recorded positive results.
12
Mainland Operations
Mainland business is the Bank’s strategic priority. The Bank endeavoured to accelerate its business development, optimise organisational structure, strengthen risk controls as well as drive the development of the information system and the personnel team in order to lay a solid foundation and platform for sustainable and efficient operations.
Business Development
In 2017, the Mainland branches and sub-branches have been growing steadily in their scale of operation, while core businesses are also seeing healthy growth. Profitability rose steadily and asset quality remained sound. The customer base has expanded and the product range remained comprehensive.
The Bank’s loan business has seen a new breakthrough. As the government’s public finance deposits increased steadily, new sources of funds were secured, and qualifications were granted for government agency business.
The Mainland branches and sub-branches continued to focus on serving the real economy. In response to the national strategies on industrial upgrading and supply-side structural reform, they focused on supporting high quality manufacturers and service enterprises in China. With the implementation of the Belt and Road Initiative and the Guangdong-Hong Kong-Macao Greater Bay Area Initiative, the Bank leveraged on opportunities in various businesses to build up a comprehensive cross-border and regional financial service system, while proactively optimising product structures and enhancing the market competitiveness of the assets business. Mainland branches and sub-branches also joined forces to optimise their loan structure through regulating the deployment of loans.
Furthermore, continuous growth is also seen in the interbank financial business. Interest income surged significantly and the Bank has attained several interbank business qualifications. Both the Guangzhou Branch and the Shenzhen Branch have become bond market members of the National Interbank funding centre. The Guangzhou Branch was also admitted as a foreign currency lending member and RMB/FX spot member of the National Interbank funding centre. These moves served to lay a solid foundation for business development.
The cross-border business continued to grow with more product lines made available for our customers. In addition, we successfully launched onshore guarantees for offshore loans, direct Renminbi cross-border loans and Renminbi cross-border cash pooling, etc.
Infrastructure
In accordance with the requirements of the regulatory bodies in the Mainland and Hong Kong, the Bank persisted in optimising its organisational structure, further enhancing its risk management regime, improving its procedures and workflows, and uplifting the supporting capability of its various systems.
Credit Risk Management – Facing the economic “new normal”, the Bank’s Mainland branches and sub-branches strengthened their risk controls and maintained good asset quality with zero non-performing loans. They also established a centralised management mechanism to oversee the whole process of loan granting, covering the pre-approval, in-process and post-approval stages, realising sound risk management. They also strengthened market and liquidity risk management by further solidifying the liquidity control indexing system and preparing a contingency plan for managing liquidity risk in case of risk events.
13
Information System – In order to continuously improve the customer experience, during the year the Bank upgraded its information infrastructure and proceeded with the development of new Internet banking. To better cater for business development and fulfil regulatory requirements, the Bank accelerated the interfacing between its internal and external systems. In addition, a new interbank foreign currency trading system, bond system and electronics commercial draft system are being developed to strengthen business growth.
Compliance – Compliance control and the crime prevention regime were further heightened in the year, with the establishment of systems covering the Mainland branches, and more frequent and thorough internal checking on compliance in order to prevent violation of regulations and criminal conduct.
Chong Hing Securities Limited
In 2017, the Hong Kong stock market was on a bullish course, with strong turnover that was in line with the robust performance of overseas stock markets. The overall turnover of Chong Hing Securities was 61.3% higher than last year, significantly outperforming the 31.9% year-on-year growth in the overall trading volume of the Hong Kong stock market, whereas its total profit before taxation grew by 102.1%. In 2018, backed by the Stock Connects between Mainland China and Hong Kong, the southbound capital from Mainland China is expected to continue to support the performance of the Hong Kong stock market. The Bank maintains a cautiously optimistic outlook for our stock brokerage business.
Chong Hing Insurance Company Limited
In 2017, notwithstanding the intense competition in the Hong Kong insurance industry and decline in overall underwriting profit, Chong Hing Insurance still recorded a 14% year-on-year increase in investment return as driven by market sentiments.
Affected by several typhoons in 2017, Chong Hing Insurance registered lower profits for its property damage insurance business. Nevertheless, the overall business performance continued to improve.
Chong Hing Insurance will continue to leverage on the bancassurance model to explore new business opportunities, and seek to realise the full potential of its strong business network. The Bank will also explore new business opportunities in order to achieve better performance and results.
Future Development
The Bank continues to invest for its sustainable development. The year 2017 was the foundation year of the Bank’s customer resource management and efforts to promote synergy. In addition to establishing the relevant systems and mechanisms, the Bank adopted a two-pronged approach of enhancing synergy with the Yuexiu Group as well as synergy within the Bank, and as a result, initial business connections and the expected outcome were achieved.
The Bank is also committed to building a modern operation platform, accelerating bank restructuring and process improvement, and further enhancing customer experience and cost-effectiveness, including the establishment of a centralised trading service team to strengthen the productivity of branches and customer managers. In order to further consolidate and optimise internal resources, the Bank established a digital transformation team to promote innovation and the transformation to digital banking. In addition, the Bank’s centralised treasury receipt and payment system was officially launched during the year, and land security deposit system was also completed by early 2018, signifying a new phase in the expansion of the Bank’s business in the Mainland.
The successive launch of various IT systems in 2017 was instrumental in enhancing the Bank’s capacity to serve its customers and monitor risks.

14
CORPORATE CULTURE
During the year, the Bank officially established its corporate culture, which comprises six key elements, namely Core Values, Vision, Mission, Management Concepts, Enterprise Spirit and Corporate Style. The Bank hopes to create an excellent corporate culture by making sustainable and long-term efforts to optimise governance and enhance cohesion. The formulation of the corporate culture is also in response to the “Bank Culture Reform” guidelines issued by the Hong Kong Monetary Authority to all banks in March 2017.
In order to put the new corporate values into practice, the Bank has launched a new performance management system to reward employees whose performances are in line with the corporate culture. The Bank has also established core competencies and related behavioural indicators to make objective assessments and assist our employees in developing career plans.
CORPORATE RESPONSIBILITY
Established in 1948, Chong Hing Bank is dedicated to providing comprehensive banking services for people from all walks of life. The Bank currently operates a network of 39 branches in Hong Kong, three branches and four sub-branches in the Mainland, and one branch in Macau.
Having the community at heart, the Bank gives back to society through active participation in volunteer activities, charitable donations and supporting community and art events held by charity organisations and art groups. It also sponsors projects to show its care for needy groups.
Community Events
• In January, the Bank donated to the “Green Power Hike for a Green Future”, held by Green Power, and the “Charity Cycling Marathon”.
• In May and July, the Bank sponsored the social skill classes for children with special needs held by the Hong Kong Association of the Deaf. Visits to the association were also organised for staff members to participate in a creative light clay workshop with the hearing-impaired children, helping them integrate into society.
• In June, the Bank participated in the “Financial Education Workshop” jointly held by The Hong Kong Association of Banks and The Salvation Army to share tips on financial management with participants.
• In December, the Bank visited the Hong Kong Playground Association’s Tsing Yi Centre to share knowledge on saving money with primary school students in the district.
Through the Bank’s branch network and cooperation with numerous charity organisations such as the Tung Wah Group of Hospitals, Yan Chai Hospital and Médecins Sans Frontières, the Bank organised a variety of community fund-raising activities, including selling raffle tickets and collecting donations from flag bags on flag-selling day. Furthermore, to contribute to public welfare, the Bank inserted promotional leaflets of charity organisations into its bank mailers sent to customers.
15
Art Events
• In July, the Bank sponsored “Heritage Showtime on LOK KU ROAD”, a local art and cultural event.
• In October, the Bank sponsored “Fine Art Asia”, a fair showcasing a wide range of collectable fine art from Asia and the West.
• In December, the Bank sponsored “Ink Asia”, featuring contemporary ink art.
The Bank seeks to promote and foster the development of art and culture through sponsoring events as well as expositions held by different art groups.
Achievements under Corporate Responsibility
The Bank is committed to giving back to society and protecting the environment in a variety of ways to fulfil our social responsibility. For its achievements in this regard, the Bank gained recognition from various sectors.
• The Bank was granted a “10 Years Plus Caring Company” logo by the Hong Kong Council of Social Service. It was a recognition that the Bank has continuously participated in community events to serve and care for society.
• The Bank’s branch network assisted the Tung Wah Group of Hospitals in selling raffle tickets to raise funds, achieving great success. In 2017, the Bank was awarded the title of “Runner-up in the Commercial and Industrial Institutes and Groups Category in the Charity Raffle Tickets Selling Competition” and received the “Raffle Tickets Selling Award” from the Tung Wah Group of Hospitals.
• In order to help minimise the light nuisance and energy wastage that may be caused by external lighting installations, the Bank realised its pledge to switch off external lights at the pre-set time in response to the “Charter on External Lighting” organised by the Environment Bureau of the Hong Kong SAR Government. Many branches complied with the lighting requirements, and the Bank was presented with the “Platinum Award” for its efforts.
• The Bank was awarded “The Employer of Choice Award” by JobMarket in recognition of its superior talent management strategies and practices.
CORPORATE gOvERNANCE
The Bank fully appreciates that compliance with the relevant statutory and regulatory requirements and maintaining good corporate governance standards are imperative to its sustainable development. The Bank has deployed considerable resources and implemented the relevant measures to ensure that the statutory and regulatory requirements are fully complied with, and that a high standard of corporate governance is maintained.
For details of the Bank’s corporate governance practices, please refer to the section entitled “Corporate Governance Report” of the Bank’s 2017 Annual Report.
16
AWARDS
The Bank aims to offer quality banking services to its customers. In 2017, it achieved excellent results in different fields and received awards and recognition from different organisations.
In May 2017, the Bank received the “Straight Through Processing (STP) Award” from the Bank of New York Mellon for the ninth consecutive year. This award recognised the Bank’s outstanding performance in payment formatting and a high STP rate of over 95% in fully-automated US dollar payment processing without manual intervention.
The Bank works closely with SMEs with the goal of achieving mutual growth while providing them with diversified banking services. This support has been widely recognised by the industry. In June, the Bank received the “Best SME’s Partner Award” from the Hong Kong General Chamber of Small and Medium Business for the ninth time.
In November, the Bank received the “STP Award” from CitiBank Asia Pacific for the first time as an indication that the rate of fully-automated STP exceeded 97% and as recognition of the Bank’s quality services.
In December, the Bank received for the first time the “Five Stars Honor Award”, the highest award at the “Distinguished Banks of the Year” competition hosted by Hong Kong Life Insurance, indicating that the remarkable performance of the Bank was widely recognised.
OUTLOOK
Hong Kong and the Mainland are connected geographically and many aspects of their developments are complementary. Under China’s Belt and Road Initiative and the Guangdong-Hong Kong-Macao Greater Bay Area Initiative, Hong Kong will be able to further cement our pivotal role as a hub for infrastructure financing, trading and investment.
The Bank will seize the opportunities brought about by the closer integration of Hong Kong with the Mainland, in particular the regional linkage, and target cross-border financial services as its core development direction. The branches in Hong Kong and the branch and sub-branch network throughout the core Pearl River Delta region of the Bank have established a platform for the provision of cross-border services. Leveraging on its diversified cross-border banking products, and being equipped with a customer-oriented and innovative mindset, the Bank created a solid business foundation for cross-border business. The Bank will continue to provide quality banking services to customers from both Hong Kong and the Mainland through deepening synergy with the business of the Yuexiu Group, and fulfil its vision of becoming “an integrated commercial bank with cross-border expertise”.
Having our roots in Hong Kong for decades, Chong Hing Bank has established a remarkable brand, assembled a professional management team and developed loyal customers. The Bank will adhere to its solid and prudent operating principles, continuously exploit and seize opportunities in various fields, drive its sustainable and healthy development and endeavour to achieve satisfactory results in order to accomplish its corporate mission: “To benefit Customers, Employees, Shareholders and Community”.
17
APPRECIATION
In 2017, with the hard work of all staff members of Chong Hing Bank, the efficiency of both the management and operations of the Bank received a boost while its core competence gained constant enhancement. I would like to thank all the Directors on the Board for their wise counsel and support. I would also like to express my gratitude to the management team and all our staff members for their tireless contributions. I also take this opportunity to convey my appreciation to our shareholders and customers for their long-standing support and trust. Chong Hing Bank was established in 1948, and is currently marking its 70th year with a solid foundation and a progressive spirit. Looking forward, the Bank will proactively grasp the opportunity to achieve quality, sustained growth and accomplish outstanding results on our path to excellence.
Zong JianxinChief Executive
Hong Kong, 29 March 2018
18
CONSOLIDATED INCOME STATEMENTfor the year ended 31 December 2017
2017 2016 varianceHK$’000 HK$’000 %
Interest income 3,800,391 3,001,170 +26.63Interest expense (1,483,263) (956,370) +55.09
Net interest income 2,317,128 2,044,800 +13.32
Fee and commission income 424,545 344,494 +23.24Fee and commission expenses (97,074) (84,910) +14.33
Net fee and commission income 327,471 259,584 +26.15Net (loss) income from trading and investments (93,938) 230,059 -140.83Other operating income 158,895 139,853 +13.62Operating expenses (1,353,633) (1,227,552) +10.27
Operating profit before impairment allowances 1,355,923 1,446,744 -6.28Net (charge) reversal of impairment allowances on loans and advances (371,591) 40,198 -1,024.40Impairment loss on investments in securities (919) (11,071) -91.70
Operating profit after impairment allowances 983,413 1,475,871 -33.37Net gains on disposal of assets held for sale 2,878 – –Net gains on disposal of property and equipment 654,619 24,757 +2,544.18Net gains on disposal of other investments – 160,729 -100.00Net gains on disposal of and fair value adjustments on investment properties 12,632 2,026 +523.49Impairment loss on goodwill – (11,000) -100.00
Share of profits of associates 55,723 31,617 +76.24
Profit before taxation 1,709,265 1,684,000 +1.50Taxation (144,398) (264,296) -45.37
Profit for the year – Attributable to equity owners of the Bank 1,564,867 1,419,704 +10.22
Earnings per share – basic and diluted HK$2.17 HK$1.94 +11.86

19
CONSOLIDATED STATEMENT OF COMPREHENSIvE INCOMEfor the year ended 31 December 2017
2017 2016HK$’000 HK$’000
Profit for the year 1,564,867 1,419,704
Other comprehensive income Items that may not be reclassified subsequently to profit or loss: Surplus on transfer of land and buildings to investment properties – 16,229 Surplus on remeasurement of retirement benefit 5,647 – Income tax effect relating to retirement benefit (932) – Items that may be reclassified subsequently to profit or loss: Exchange differences arising on translation 249,271 (168,225) Fair value gains of available-for-sale securities arising during the year 354,316 202,037 Amount reclassified to the profit or loss upon impairment of available-for-sale securities 290 11,071 Amount reclassified to the profit or loss upon disposal of available-for-sale securities (113,937) (178,309) Income tax effect relating to disposal of available-for-sale securities 18,800 29,421 Income tax effect relating to fair value change of available-for-sale securities (58,419) (35,869) Share of other comprehensive income of associates 4,647 497
Other comprehensive income for the year (net of tax) 459,683 (123,148)
Total comprehensive income for the year 2,024,550 1,296,556
Total comprehensive income attributable to: Equity owners of the Bank 2,024,550 1,296,556
20
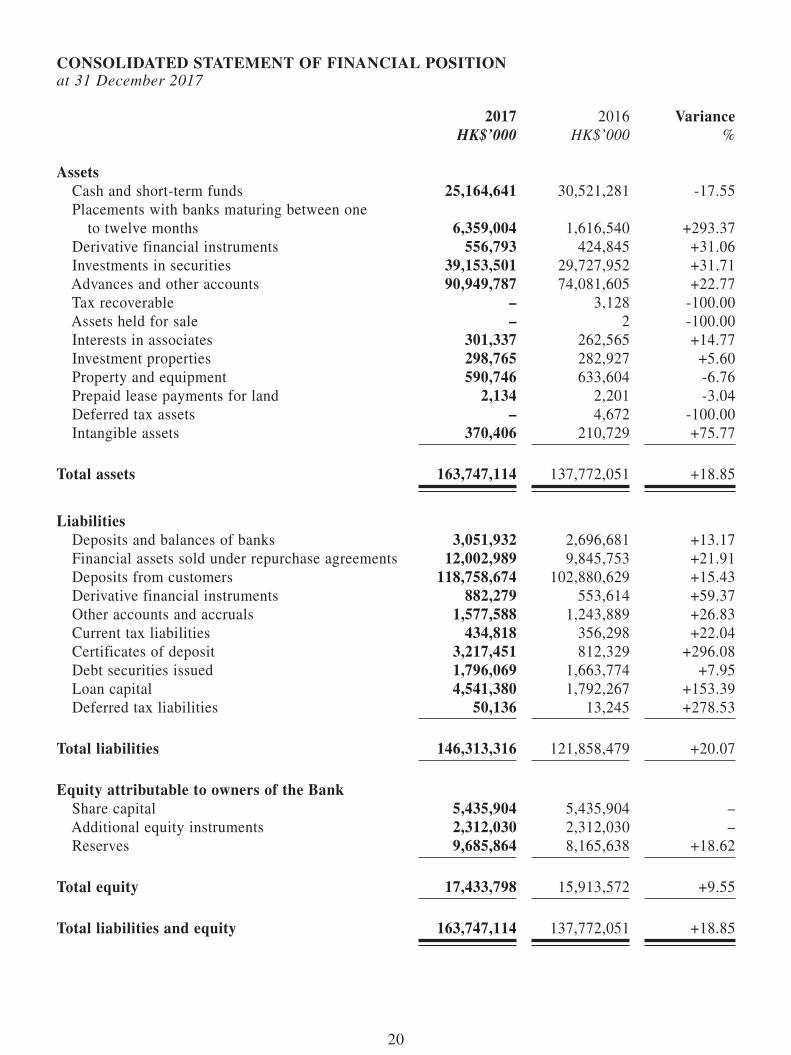
CONSOLIDATED STATEMENT OF FINANCIAL POSITIONat 31 December 2017
2017 2016 varianceHK$’000 HK$’000 %
Assets Cash and short-term funds 25,164,641 30,521,281 -17.55 Placements with banks maturing between one to twelve months 6,359,004 1,616,540 +293.37 Derivative financial instruments 556,793 424,845 +31.06 Investments in securities 39,153,501 29,727,952 +31.71 Advances and other accounts 90,949,787 74,081,605 +22.77 Tax recoverable – 3,128 -100.00 Assets held for sale – 2 -100.00 Interests in associates 301,337 262,565 +14.77 Investment properties 298,765 282,927 +5.60 Property and equipment 590,746 633,604 -6.76 Prepaid lease payments for land 2,134 2,201 -3.04 Deferred tax assets – 4,672 -100.00 Intangible assets 370,406 210,729 +75.77
Total assets 163,747,114 137,772,051 +18.85
Liabilities Deposits and balances of banks 3,051,932 2,696,681 +13.17 Financial assets sold under repurchase agreements 12,002,989 9,845,753 +21.91 Deposits from customers 118,758,674 102,880,629 +15.43 Derivative financial instruments 882,279 553,614 +59.37 Other accounts and accruals 1,577,588 1,243,889 +26.83 Current tax liabilities 434,818 356,298 +22.04 Certificates of deposit 3,217,451 812,329 +296.08 Debt securities issued 1,796,069 1,663,774 +7.95 Loan capital 4,541,380 1,792,267 +153.39 Deferred tax liabilities 50,136 13,245 +278.53
Total liabilities 146,313,316 121,858,479 +20.07
Equity attributable to owners of the Bank Share capital 5,435,904 5,435,904 – Additional equity instruments 2,312,030 2,312,030 – Reserves 9,685,864 8,165,638 +18.62
Total equity 17,433,798 15,913,572 +9.55
Total liabilities and equity 163,747,114 137,772,051 +18.85
21
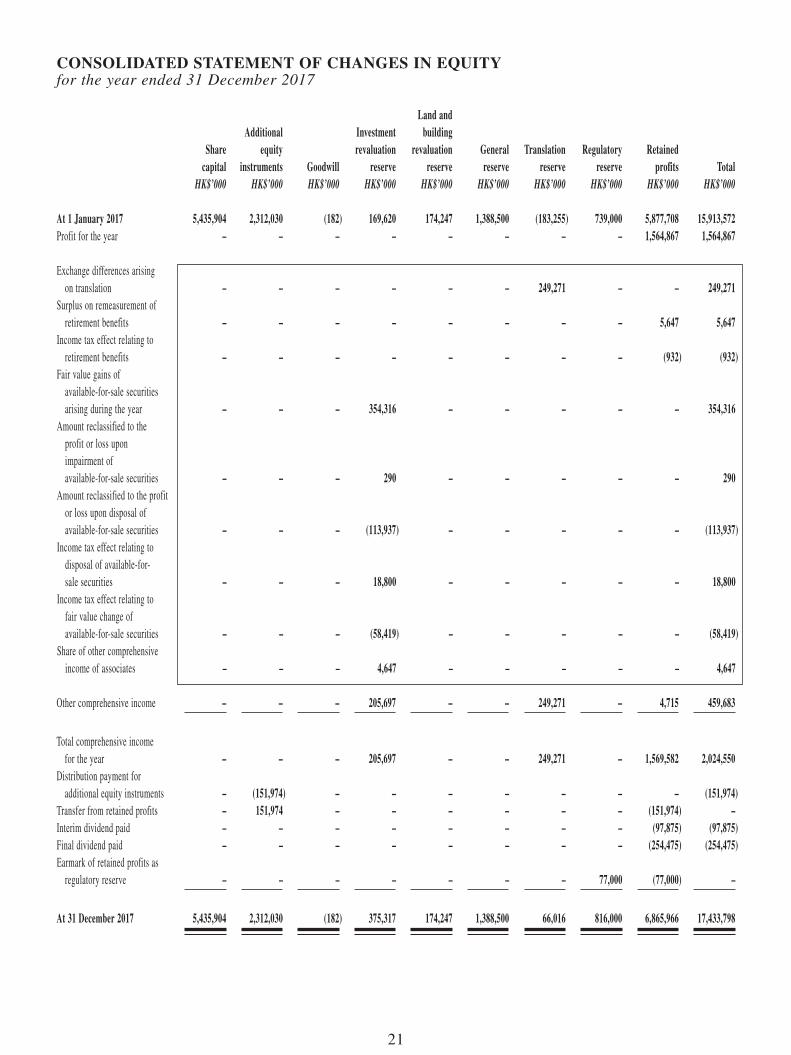
CONSOLIDATED STATEMENT OF CHANgES IN EQUITYfor the year ended 31 December 2017
Sharecapital
Additionalequity
instruments goodwill
Investmentrevaluation
reserve
Land andbuilding
revaluationreserve
generalreserve
Translationreserve
Regulatoryreserve
Retainedprofits Total
HK$’000 HK$’000 HK$’000 HK$’000 HK$’000 HK$’000 HK$’000 HK$’000 HK$’000 HK$’000 At 1 January 2017 5,435,904 2,312,030 (182) 169,620 174,247 1,388,500 (183,255) 739,000 5,877,708 15,913,572Profit for the year – – – – – – – – 1,564,867 1,564,867
Exchange differences arising on translation – – – – – – 249,271 – – 249,271Surplus on remeasurement of retirement benefits – – – – – – – – 5,647 5,647Income tax effect relating to retirement benefits – – – – – – – – (932) (932)Fair value gains of available-for-sale securities arising during the year – – – 354,316 – – – – – 354,316Amount reclassified to the profit or loss upon impairment of available-for-sale securities – – – 290 – – – – – 290Amount reclassified to the profit or loss upon disposal of available-for-sale securities – – – (113,937) – – – – – (113,937)Income tax effect relating to disposal of available-for- sale securities – – – 18,800 – – – – – 18,800Income tax effect relating to fair value change of available-for-sale securities – – – (58,419) – – – – – (58,419)Share of other comprehensive income of associates – – – 4,647 – – – – – 4,647
Other comprehensive income – – – 205,697 – – 249,271 – 4,715 459,683
Total comprehensive income for the year – – – 205,697 – – 249,271 – 1,569,582 2,024,550Distribution payment for additional equity instruments – (151,974) – – – – – – – (151,974)Transfer from retained profits – 151,974 – – – – – – (151,974) –Interim dividend paid – – – – – – – – (97,875) (97,875)Final dividend paid – – – – – – – – (254,475) (254,475)Earmark of retained profits as regulatory reserve – – – – – – – 77,000 (77,000) –
At 31 December 2017 5,435,904 2,312,030 (182) 375,317 174,247 1,388,500 66,016 816,000 6,865,966 17,433,798
22
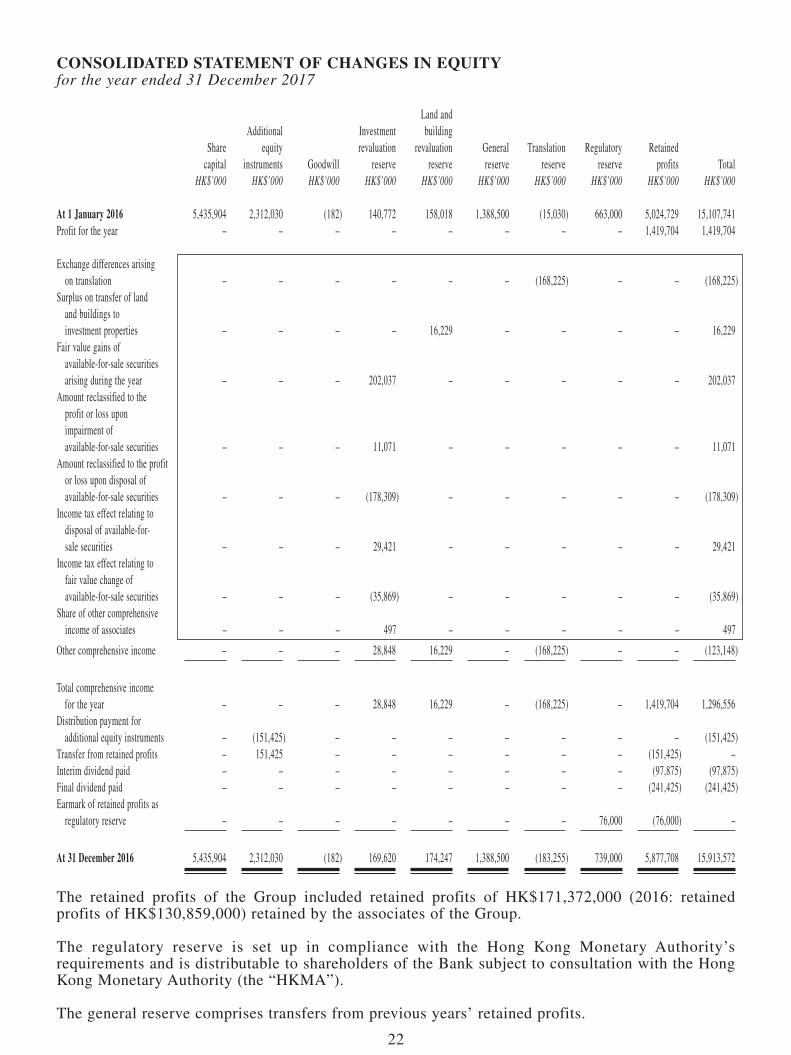
CONSOLIDATED STATEMENT OF CHANgES IN EQUITYfor the year ended 31 December 2017
Sharecapital
Additionalequity
instruments Goodwill
Investmentrevaluation
reserve
Land andbuilding
revaluationreserve
Generalreserve
Translationreserve
Regulatoryreserve
Retainedprofits Total
HK$’000 HK$’000 HK$’000 HK$’000 HK$’000 HK$’000 HK$’000 HK$’000 HK$’000 HK$’000 At 1 January 2016 5,435,904 2,312,030 (182) 140,772 158,018 1,388,500 (15,030) 663,000 5,024,729 15,107,741Profit for the year – – – – – – – – 1,419,704 1,419,704
Exchange differences arising on translation – – – – – – (168,225) – – (168,225)Surplus on transfer of land and buildings to investment properties – – – – 16,229 – – – – 16,229Fair value gains of available-for-sale securities arising during the year – – – 202,037 – – – – – 202,037Amount reclassified to the profit or loss upon impairment of available-for-sale securities – – – 11,071 – – – – – 11,071Amount reclassified to the profit or loss upon disposal of available-for-sale securities – – – (178,309) – – – – – (178,309)Income tax effect relating to disposal of available-for- sale securities – – – 29,421 – – – – – 29,421Income tax effect relating to fair value change of available-for-sale securities – – – (35,869) – – – – – (35,869)Share of other comprehensive income of associates – – – 497 – – – – – 497
Other comprehensive income – – – 28,848 16,229 – (168,225) – – (123,148)
Total comprehensive income for the year – – – 28,848 16,229 – (168,225) – 1,419,704 1,296,556Distribution payment for additional equity instruments – (151,425) – – – – – – – (151,425)Transfer from retained profits – 151,425 – – – – – – (151,425) –Interim dividend paid – – – – – – – – (97,875) (97,875)Final dividend paid – – – – – – – – (241,425) (241,425)Earmark of retained profits as regulatory reserve – – – – – – – 76,000 (76,000) –
At 31 December 2016 5,435,904 2,312,030 (182) 169,620 174,247 1,388,500 (183,255) 739,000 5,877,708 15,913,572
The retained profits of the Group included retained profits of HK$171,372,000 (2016: retained profits of HK$130,859,000) retained by the associates of the Group.
The regulatory reserve is set up in compliance with the Hong Kong Monetary Authority’s requirements and is distributable to shareholders of the Bank subject to consultation with the Hong Kong Monetary Authority (the “HKMA”).
The general reserve comprises transfers from previous years’ retained profits.
23
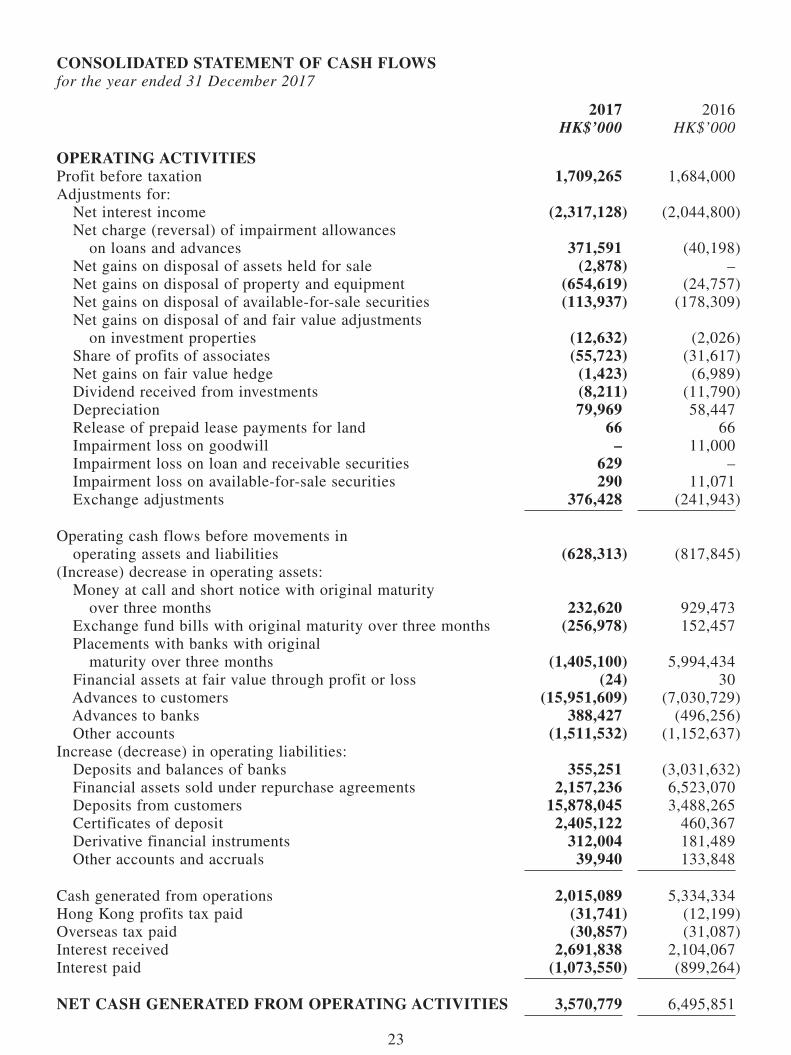
CONSOLIDATED STATEMENT OF CASH FLOWSfor the year ended 31 December 2017
2017 2016HK$’000 HK$’000
OPERATINg ACTIvITIESProfit before taxation 1,709,265 1,684,000Adjustments for: Net interest income (2,317,128) (2,044,800) Net charge (reversal) of impairment allowances on loans and advances 371,591 (40,198) Net gains on disposal of assets held for sale (2,878) – Net gains on disposal of property and equipment (654,619) (24,757) Net gains on disposal of available-for-sale securities (113,937) (178,309) Net gains on disposal of and fair value adjustments on investment properties (12,632) (2,026) Share of profits of associates (55,723) (31,617) Net gains on fair value hedge (1,423) (6,989) Dividend received from investments (8,211) (11,790) Depreciation 79,969 58,447 Release of prepaid lease payments for land 66 66 Impairment loss on goodwill – 11,000 Impairment loss on loan and receivable securities 629 – Impairment loss on available-for-sale securities 290 11,071 Exchange adjustments 376,428 (241,943)
Operating cash flows before movements in operating assets and liabilities (628,313) (817,845)(Increase) decrease in operating assets: Money at call and short notice with original maturity over three months 232,620 929,473 Exchange fund bills with original maturity over three months (256,978) 152,457 Placements with banks with original maturity over three months (1,405,100) 5,994,434 Financial assets at fair value through profit or loss (24) 30 Advances to customers (15,951,609) (7,030,729) Advances to banks 388,427 (496,256) Other accounts (1,511,532) (1,152,637)Increase (decrease) in operating liabilities: Deposits and balances of banks 355,251 (3,031,632) Financial assets sold under repurchase agreements 2,157,236 6,523,070 Deposits from customers 15,878,045 3,488,265 Certificates of deposit 2,405,122 460,367 Derivative financial instruments 312,004 181,489 Other accounts and accruals 39,940 133,848
Cash generated from operations 2,015,089 5,334,334Hong Kong profits tax paid (31,741) (12,199)Overseas tax paid (30,857) (31,087)Interest received 2,691,838 2,104,067Interest paid (1,073,550) (899,264)
NET CASH gENERATED FROM OPERATINg ACTIvITIES 3,570,779 6,495,851
24
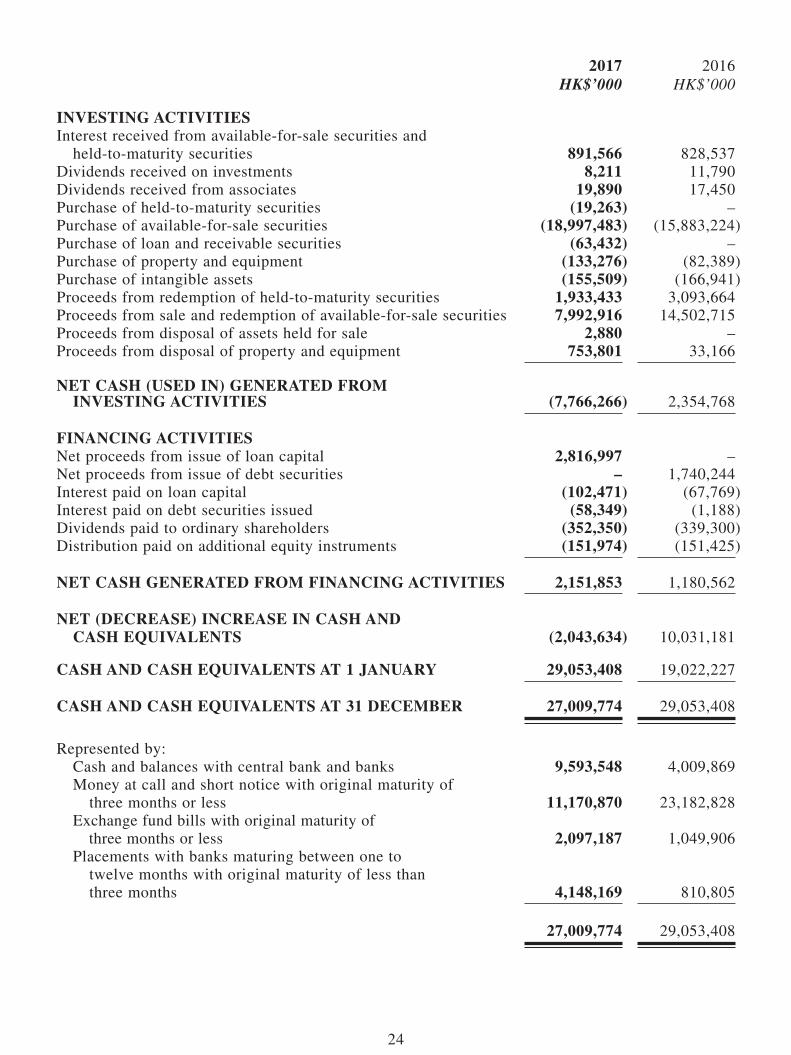
2017 2016HK$’000 HK$’000
INvESTINg ACTIvITIESInterest received from available-for-sale securities and held-to-maturity securities 891,566 828,537Dividends received on investments 8,211 11,790Dividends received from associates 19,890 17,450Purchase of held-to-maturity securities (19,263) –Purchase of available-for-sale securities (18,997,483) (15,883,224)Purchase of loan and receivable securities (63,432) –Purchase of property and equipment (133,276) (82,389)Purchase of intangible assets (155,509) (166,941)Proceeds from redemption of held-to-maturity securities 1,933,433 3,093,664Proceeds from sale and redemption of available-for-sale securities 7,992,916 14,502,715Proceeds from disposal of assets held for sale 2,880 –Proceeds from disposal of property and equipment 753,801 33,166
NET CASH (USED IN) gENERATED FROM INvESTINg ACTIvITIES (7,766,266) 2,354,768
FINANCINg ACTIvITIESNet proceeds from issue of loan capital 2,816,997 –Net proceeds from issue of debt securities – 1,740,244Interest paid on loan capital (102,471) (67,769)Interest paid on debt securities issued (58,349) (1,188)Dividends paid to ordinary shareholders (352,350) (339,300)Distribution paid on additional equity instruments (151,974) (151,425)
NET CASH gENERATED FROM FINANCINg ACTIvITIES 2,151,853 1,180,562
NET (DECREASE) INCREASE IN CASH AND CASH EQUIvALENTS (2,043,634) 10,031,181
CASH AND CASH EQUIvALENTS AT 1 JANUARY 29,053,408 19,022,227
CASH AND CASH EQUIvALENTS AT 31 DECEMBER 27,009,774 29,053,408
Represented by: Cash and balances with central bank and banks 9,593,548 4,009,869 Money at call and short notice with original maturity of three months or less 11,170,870 23,182,828 Exchange fund bills with original maturity of three months or less 2,097,187 1,049,906 Placements with banks maturing between one to twelve months with original maturity of less than three months 4,148,169 810,805
27,009,774 29,053,408
25
FINANCIAL REvIEWfor the year ended 31 December 2017
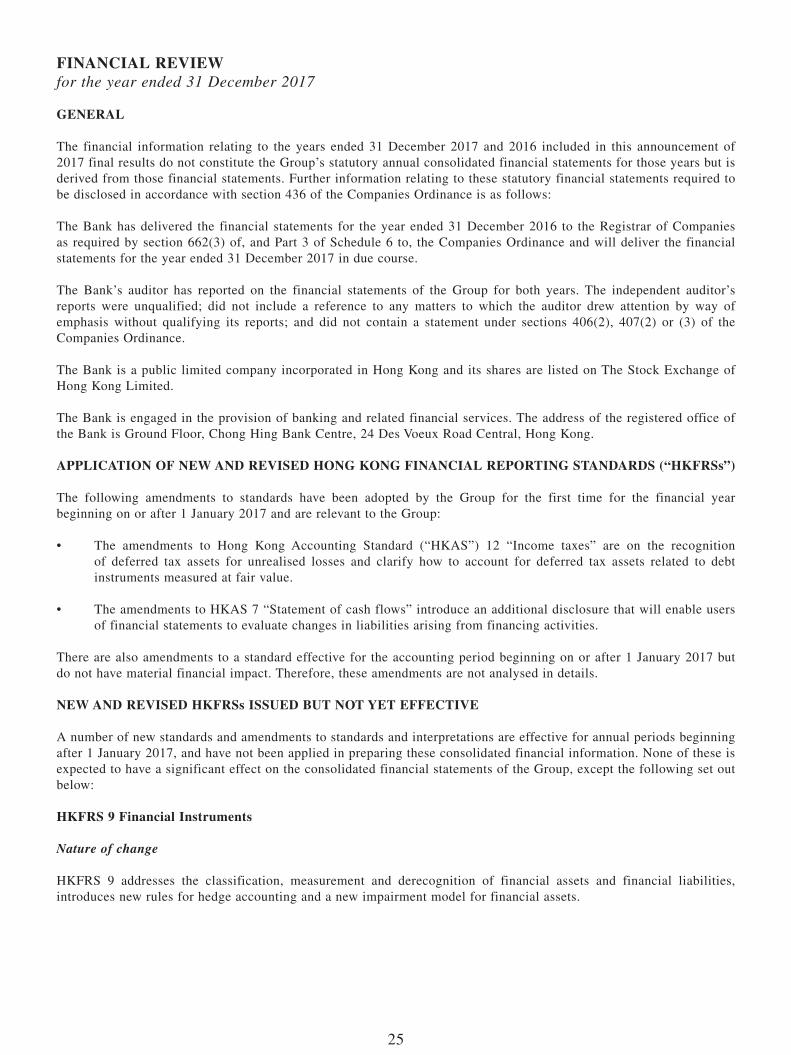
gENERAL
The financial information relating to the years ended 31 December 2017 and 2016 included in this announcement of 2017 final results do not constitute the Group’s statutory annual consolidated financial statements for those years but is derived from those financial statements. Further information relating to these statutory financial statements required to be disclosed in accordance with section 436 of the Companies Ordinance is as follows:
The Bank has delivered the financial statements for the year ended 31 December 2016 to the Registrar of Companies as required by section 662(3) of, and Part 3 of Schedule 6 to, the Companies Ordinance and will deliver the financial statements for the year ended 31 December 2017 in due course.
The Bank’s auditor has reported on the financial statements of the Group for both years. The independent auditor’s reports were unqualified; did not include a reference to any matters to which the auditor drew attention by way of emphasis without qualifying its reports; and did not contain a statement under sections 406(2), 407(2) or (3) of the Companies Ordinance.
The Bank is a public limited company incorporated in Hong Kong and its shares are listed on The Stock Exchange of Hong Kong Limited.
The Bank is engaged in the provision of banking and related financial services. The address of the registered office of the Bank is Ground Floor, Chong Hing Bank Centre, 24 Des Voeux Road Central, Hong Kong.
APPLICATION OF NEW AND REvISED HONg KONg FINANCIAL REPORTINg STANDARDS (“HKFRSs”)
The following amendments to standards have been adopted by the Group for the first time for the financial year beginning on or after 1 January 2017 and are relevant to the Group:
• The amendments to Hong Kong Accounting Standard (“HKAS”) 12 “Income taxes” are on the recognition of deferred tax assets for unrealised losses and clarify how to account for deferred tax assets related to debt instruments measured at fair value.
• The amendments to HKAS 7 “Statement of cash flows” introduce an additional disclosure that will enable users of financial statements to evaluate changes in liabilities arising from financing activities.
There are also amendments to a standard effective for the accounting period beginning on or after 1 January 2017 but do not have material financial impact. Therefore, these amendments are not analysed in details.
NEW AND REvISED HKFRSs ISSUED BUT NOT YET EFFECTIvE
A number of new standards and amendments to standards and interpretations are effective for annual periods beginning after 1 January 2017, and have not been applied in preparing these consolidated financial information. None of these is expected to have a significant effect on the consolidated financial statements of the Group, except the following set out below:
HKFRS 9 Financial Instruments
Nature of change
HKFRS 9 addresses the classification, measurement and derecognition of financial assets and financial liabilities, introduces new rules for hedge accounting and a new impairment model for financial assets.
26
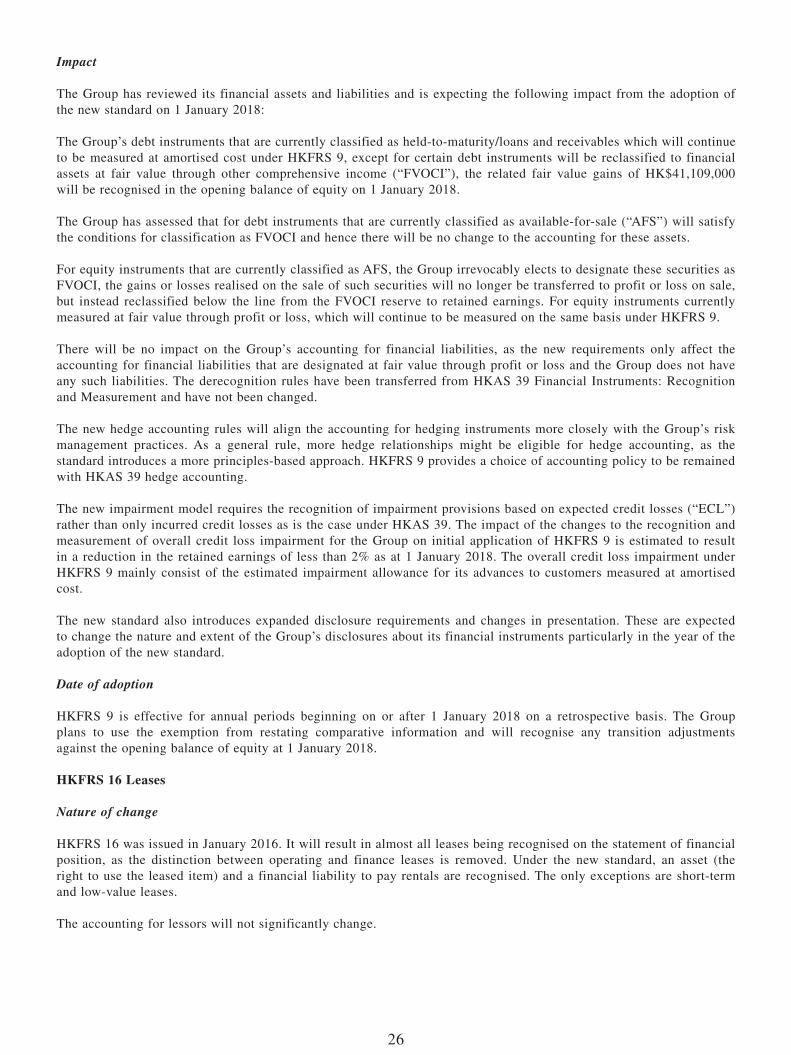
Impact
The Group has reviewed its financial assets and liabilities and is expecting the following impact from the adoption of the new standard on 1 January 2018:
The Group’s debt instruments that are currently classified as held-to-maturity/loans and receivables which will continue to be measured at amortised cost under HKFRS 9, except for certain debt instruments will be reclassified to financial assets at fair value through other comprehensive income (“FVOCI”), the related fair value gains of HK$41,109,000 will be recognised in the opening balance of equity on 1 January 2018.
The Group has assessed that for debt instruments that are currently classified as available-for-sale (“AFS”) will satisfy the conditions for classification as FVOCI and hence there will be no change to the accounting for these assets.
For equity instruments that are currently classified as AFS, the Group irrevocably elects to designate these securities as FVOCI, the gains or losses realised on the sale of such securities will no longer be transferred to profit or loss on sale, but instead reclassified below the line from the FVOCI reserve to retained earnings. For equity instruments currently measured at fair value through profit or loss, which will continue to be measured on the same basis under HKFRS 9.
There will be no impact on the Group’s accounting for financial liabilities, as the new requirements only affect the accounting for financial liabilities that are designated at fair value through profit or loss and the Group does not have any such liabilities. The derecognition rules have been transferred from HKAS 39 Financial Instruments: Recognition and Measurement and have not been changed.
The new hedge accounting rules will align the accounting for hedging instruments more closely with the Group’s risk management practices. As a general rule, more hedge relationships might be eligible for hedge accounting, as the standard introduces a more principles-based approach. HKFRS 9 provides a choice of accounting policy to be remained with HKAS 39 hedge accounting.
The new impairment model requires the recognition of impairment provisions based on expected credit losses (“ECL”) rather than only incurred credit losses as is the case under HKAS 39. The impact of the changes to the recognition and measurement of overall credit loss impairment for the Group on initial application of HKFRS 9 is estimated to result in a reduction in the retained earnings of less than 2% as at 1 January 2018. The overall credit loss impairment under HKFRS 9 mainly consist of the estimated impairment allowance for its advances to customers measured at amortised cost.
The new standard also introduces expanded disclosure requirements and changes in presentation. These are expected to change the nature and extent of the Group’s disclosures about its financial instruments particularly in the year of the adoption of the new standard.
Date of adoption
HKFRS 9 is effective for annual periods beginning on or after 1 January 2018 on a retrospective basis. The Group plans to use the exemption from restating comparative information and will recognise any transition adjustments against the opening balance of equity at 1 January 2018.
HKFRS 16 Leases
Nature of change
HKFRS 16 was issued in January 2016. It will result in almost all leases being recognised on the statement of financial position, as the distinction between operating and finance leases is removed. Under the new standard, an asset (the right to use the leased item) and a financial liability to pay rentals are recognised. The only exceptions are short-term and low-value leases.
The accounting for lessors will not significantly change.
27
Impact
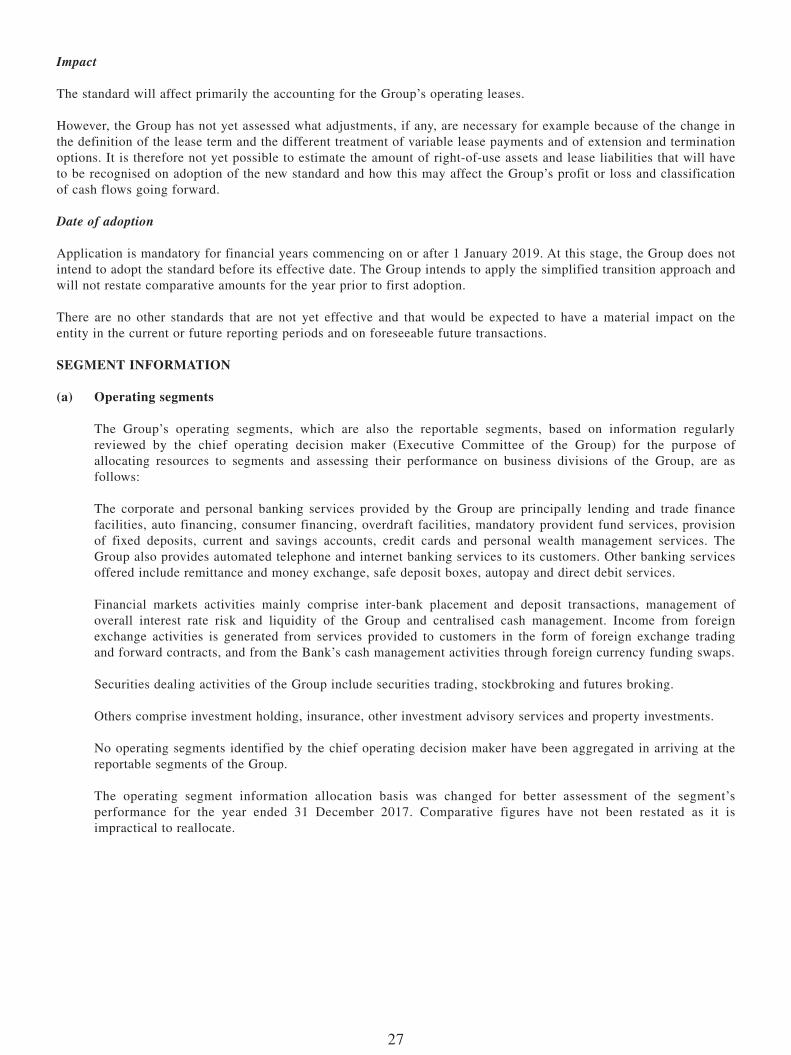
The standard will affect primarily the accounting for the Group’s operating leases.
However, the Group has not yet assessed what adjustments, if any, are necessary for example because of the change in the definition of the lease term and the different treatment of variable lease payments and of extension and termination options. It is therefore not yet possible to estimate the amount of right-of-use assets and lease liabilities that will have to be recognised on adoption of the new standard and how this may affect the Group’s profit or loss and classification of cash flows going forward.
Date of adoption
Application is mandatory for financial years commencing on or after 1 January 2019. At this stage, the Group does not intend to adopt the standard before its effective date. The Group intends to apply the simplified transition approach and will not restate comparative amounts for the year prior to first adoption.
There are no other standards that are not yet effective and that would be expected to have a material impact on the entity in the current or future reporting periods and on foreseeable future transactions.
SEgMENT INFORMATION
(a) Operating segments
The Group’s operating segments, which are also the reportable segments, based on information regularly reviewed by the chief operating decision maker (Executive Committee of the Group) for the purpose of allocating resources to segments and assessing their performance on business divisions of the Group, are as follows:
The corporate and personal banking services provided by the Group are principally lending and trade finance facilities, auto financing, consumer financing, overdraft facilities, mandatory provident fund services, provision of fixed deposits, current and savings accounts, credit cards and personal wealth management services. The Group also provides automated telephone and internet banking services to its customers. Other banking services offered include remittance and money exchange, safe deposit boxes, autopay and direct debit services.
Financial markets activities mainly comprise inter-bank placement and deposit transactions, management of overall interest rate risk and liquidity of the Group and centralised cash management. Income from foreign exchange activities is generated from services provided to customers in the form of foreign exchange trading and forward contracts, and from the Bank’s cash management activities through foreign currency funding swaps.
Securities dealing activities of the Group include securities trading, stockbroking and futures broking.
Others comprise investment holding, insurance, other investment advisory services and property investments.
No operating segments identified by the chief operating decision maker have been aggregated in arriving at the reportable segments of the Group.
The operating segment information allocation basis was changed for better assessment of the segment’s performance for the year ended 31 December 2017. Comparative figures have not been restated as it is impractical to reallocate.
28
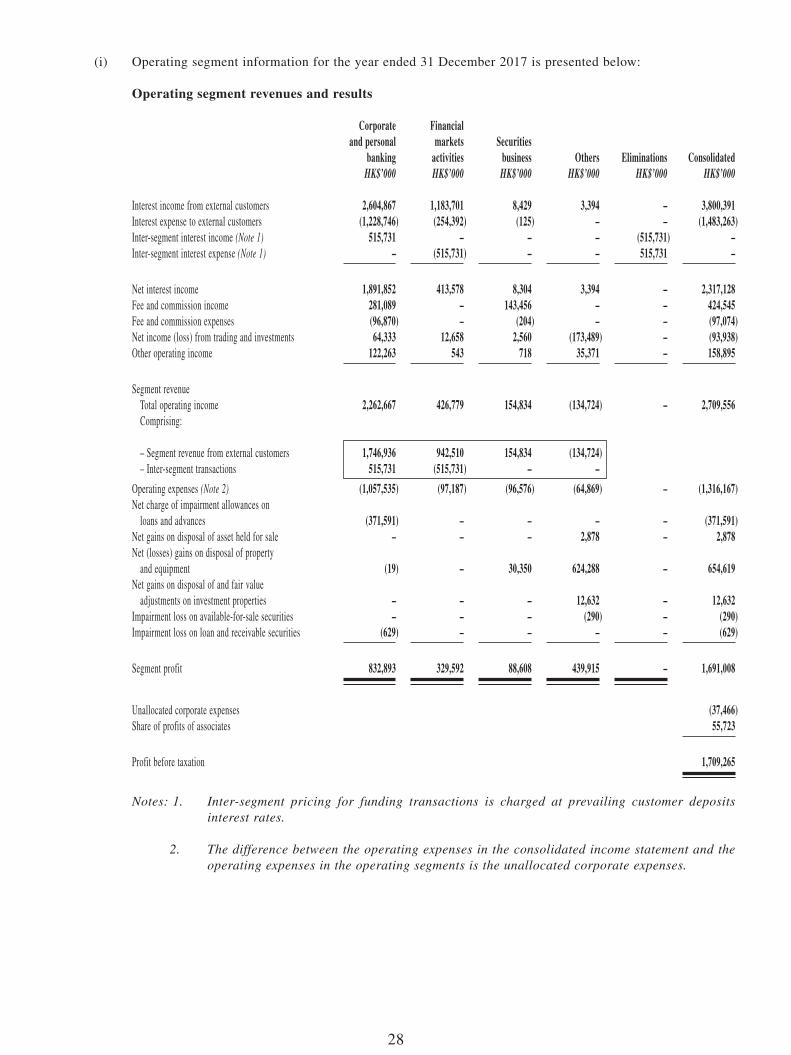
(i) Operating segment information for the year ended 31 December 2017 is presented below:
Operating segment revenues and results
Corporate Financialand personal markets Securities
banking activities business Others Eliminations ConsolidatedHK$’000 HK$’000 HK$’000 HK$’000 HK$’000 HK$’000
Interest income from external customers 2,604,867 1,183,701 8,429 3,394 – 3,800,391Interest expense to external customers (1,228,746) (254,392) (125) – – (1,483,263)Inter-segment interest income (Note 1) 515,731 – – – (515,731) –Inter-segment interest expense (Note 1) – (515,731) – – 515,731 –
Net interest income 1,891,852 413,578 8,304 3,394 – 2,317,128Fee and commission income 281,089 – 143,456 – – 424,545Fee and commission expenses (96,870) – (204) – – (97,074)Net income (loss) from trading and investments 64,333 12,658 2,560 (173,489) – (93,938)Other operating income 122,263 543 718 35,371 – 158,895
Segment revenue Total operating income 2,262,667 426,779 154,834 (134,724) – 2,709,556 Comprising:
– Segment revenue from external customers 1,746,936 942,510 154,834 (134,724) – Inter-segment transactions 515,731 (515,731) – –
Operating expenses (Note 2) (1,057,535) (97,187) (96,576) (64,869) – (1,316,167)Net charge of impairment allowances on loans and advances (371,591) – – – – (371,591)Net gains on disposal of asset held for sale – – – 2,878 – 2,878Net (losses) gains on disposal of property and equipment (19) – 30,350 624,288 – 654,619Net gains on disposal of and fair value adjustments on investment properties – – – 12,632 – 12,632Impairment loss on available-for-sale securities – – – (290) – (290)Impairment loss on loan and receivable securities (629) – – – – (629)
Segment profit 832,893 329,592 88,608 439,915 – 1,691,008
Unallocated corporate expenses (37,466)Share of profits of associates 55,723
Profit before taxation 1,709,265
Notes: 1. Inter-segment pricing for funding transactions is charged at prevailing customer deposits interest rates.
2. The difference between the operating expenses in the consolidated income statement and the operating expenses in the operating segments is the unallocated corporate expenses.
29
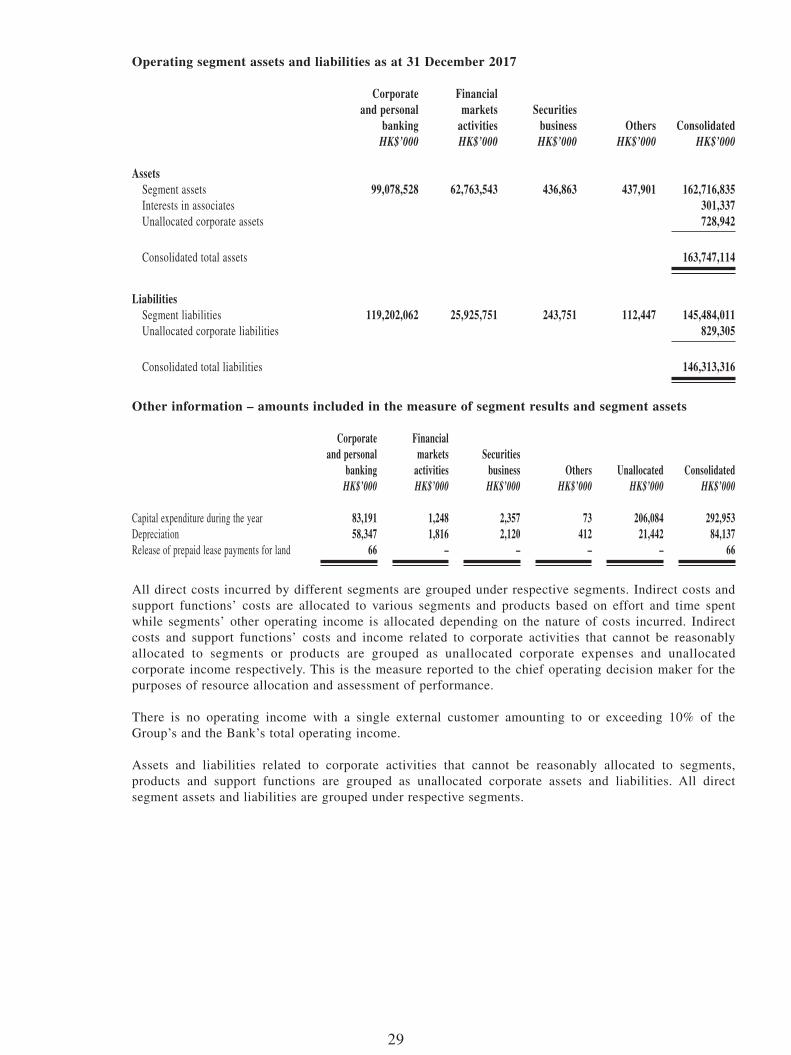
Operating segment assets and liabilities as at 31 December 2017
Corporate Financialand personal markets Securities
banking activities business Others ConsolidatedHK$’000 HK$’000 HK$’000 HK$’000 HK$’000
Assets Segment assets 99,078,528 62,763,543 436,863 437,901 162,716,835 Interests in associates 301,337 Unallocated corporate assets 728,942
Consolidated total assets 163,747,114
Liabilities Segment liabilities 119,202,062 25,925,751 243,751 112,447 145,484,011 Unallocated corporate liabilities 829,305
Consolidated total liabilities 146,313,316
Other information – amounts included in the measure of segment results and segment assets
Corporate Financialand personal markets Securities
banking activities business Others Unallocated ConsolidatedHK$’000 HK$’000 HK$’000 HK$’000 HK$’000 HK$’000
Capital expenditure during the year 83,191 1,248 2,357 73 206,084 292,953Depreciation 58,347 1,816 2,120 412 21,442 84,137Release of prepaid lease payments for land 66 – – – – 66
All direct costs incurred by different segments are grouped under respective segments. Indirect costs and support functions’ costs are allocated to various segments and products based on effort and time spent while segments’ other operating income is allocated depending on the nature of costs incurred. Indirect costs and support functions’ costs and income related to corporate activities that cannot be reasonably allocated to segments or products are grouped as unallocated corporate expenses and unallocated corporate income respectively. This is the measure reported to the chief operating decision maker for the purposes of resource allocation and assessment of performance.
There is no operating income with a single external customer amounting to or exceeding 10% of the Group’s and the Bank’s total operating income.
Assets and liabilities related to corporate activities that cannot be reasonably allocated to segments, products and support functions are grouped as unallocated corporate assets and liabilities. All direct segment assets and liabilities are grouped under respective segments.
30
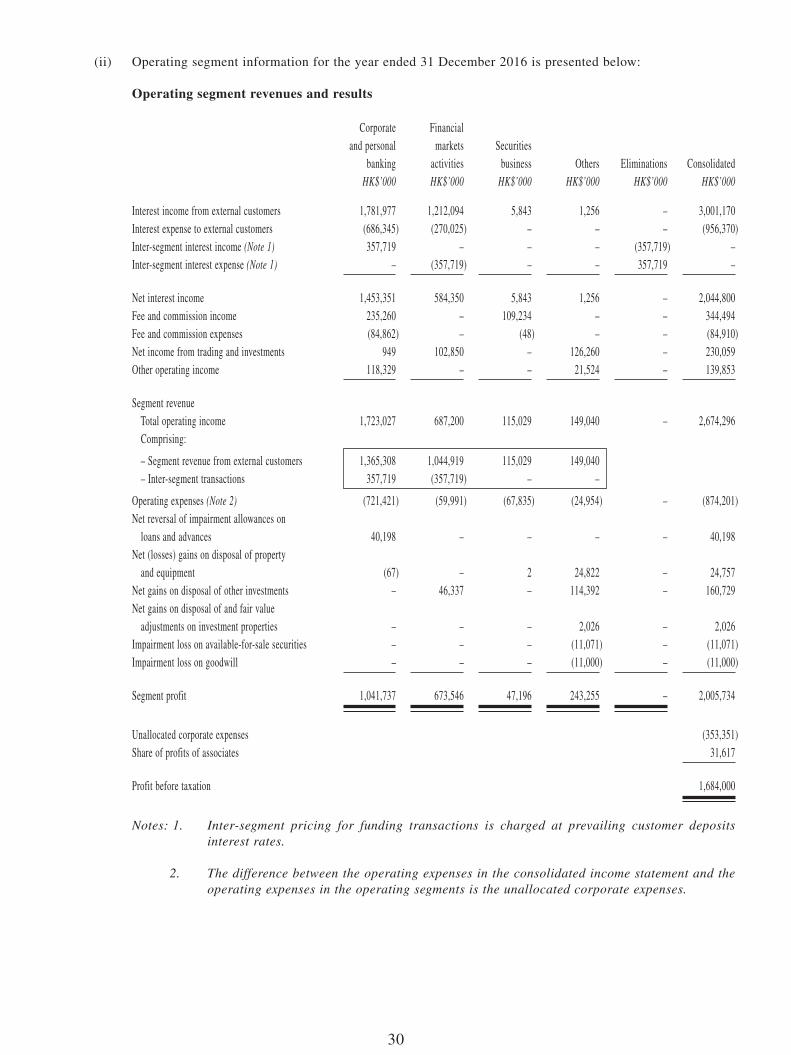
(ii) Operating segment information for the year ended 31 December 2016 is presented below:
Operating segment revenues and results
Corporate Financialand personal markets Securities
banking activities business Others Eliminations ConsolidatedHK$’000 HK$’000 HK$’000 HK$’000 HK$’000 HK$’000
Interest income from external customers 1,781,977 1,212,094 5,843 1,256 – 3,001,170Interest expense to external customers (686,345) (270,025) – – – (956,370)Inter-segment interest income (Note 1) 357,719 – – – (357,719) –Inter-segment interest expense (Note 1) – (357,719) – – 357,719 –
Net interest income 1,453,351 584,350 5,843 1,256 – 2,044,800Fee and commission income 235,260 – 109,234 – – 344,494Fee and commission expenses (84,862) – (48) – – (84,910)Net income from trading and investments 949 102,850 – 126,260 – 230,059Other operating income 118,329 – – 21,524 – 139,853
Segment revenue Total operating income 1,723,027 687,200 115,029 149,040 – 2,674,296 Comprising:
– Segment revenue from external customers 1,365,308 1,044,919 115,029 149,040 – Inter-segment transactions 357,719 (357,719) – –
Operating expenses (Note 2) (721,421) (59,991) (67,835) (24,954) – (874,201)Net reversal of impairment allowances on loans and advances 40,198 – – – – 40,198Net (losses) gains on disposal of property and equipment (67) – 2 24,822 – 24,757Net gains on disposal of other investments – 46,337 – 114,392 – 160,729Net gains on disposal of and fair value adjustments on investment properties – – – 2,026 – 2,026Impairment loss on available-for-sale securities – – – (11,071) – (11,071)Impairment loss on goodwill – – – (11,000) – (11,000)
Segment profit 1,041,737 673,546 47,196 243,255 – 2,005,734
Unallocated corporate expenses (353,351)Share of profits of associates 31,617
Profit before taxation 1,684,000
Notes: 1. Inter-segment pricing for funding transactions is charged at prevailing customer deposits interest rates.
2. The difference between the operating expenses in the consolidated income statement and the operating expenses in the operating segments is the unallocated corporate expenses.
31
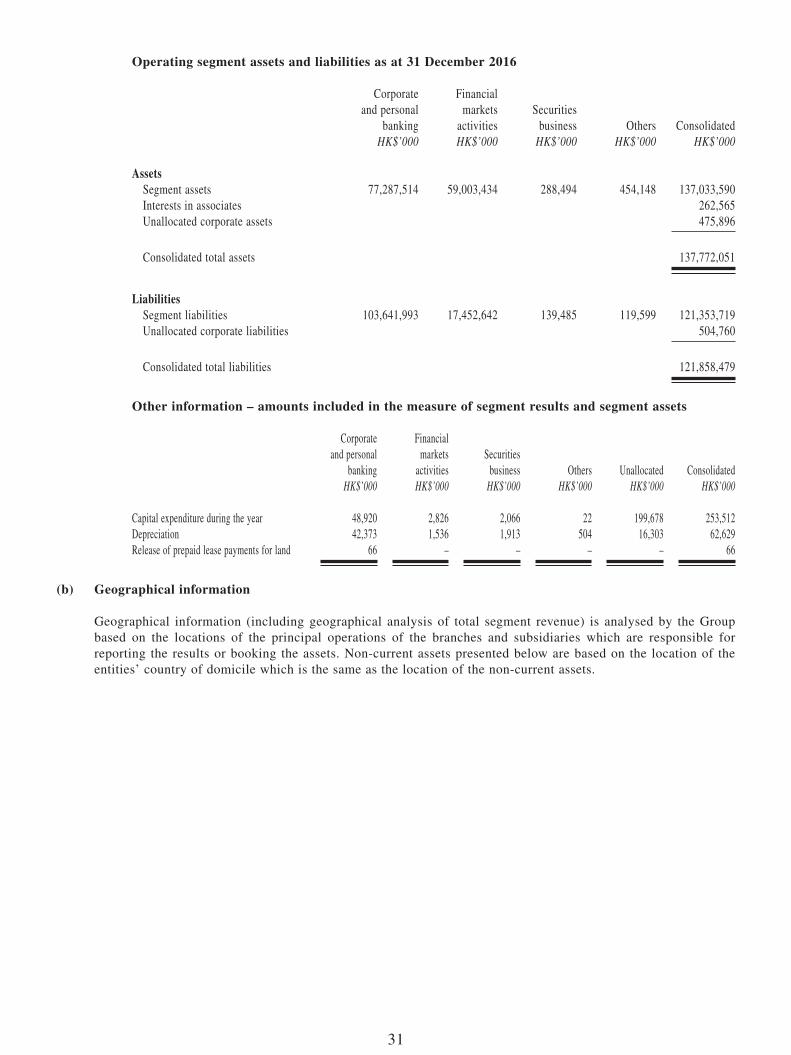
Operating segment assets and liabilities as at 31 December 2016
Corporate Financialand personal markets Securities
banking activities business Others ConsolidatedHK$’000 HK$’000 HK$’000 HK$’000 HK$’000
Assets Segment assets 77,287,514 59,003,434 288,494 454,148 137,033,590 Interests in associates 262,565 Unallocated corporate assets 475,896
Consolidated total assets 137,772,051
Liabilities Segment liabilities 103,641,993 17,452,642 139,485 119,599 121,353,719 Unallocated corporate liabilities 504,760
Consolidated total liabilities 121,858,479
Other information – amounts included in the measure of segment results and segment assets
Corporate Financialand personal markets Securities
banking activities business Others Unallocated ConsolidatedHK$’000 HK$’000 HK$’000 HK$’000 HK$’000 HK$’000
Capital expenditure during the year 48,920 2,826 2,066 22 199,678 253,512Depreciation 42,373 1,536 1,913 504 16,303 62,629Release of prepaid lease payments for land 66 – – – – 66
(b) geographical information
Geographical information (including geographical analysis of total segment revenue) is analysed by the Group based on the locations of the principal operations of the branches and subsidiaries which are responsible for reporting the results or booking the assets. Non-current assets presented below are based on the location of the entities’ country of domicile which is the same as the location of the non-current assets.
32
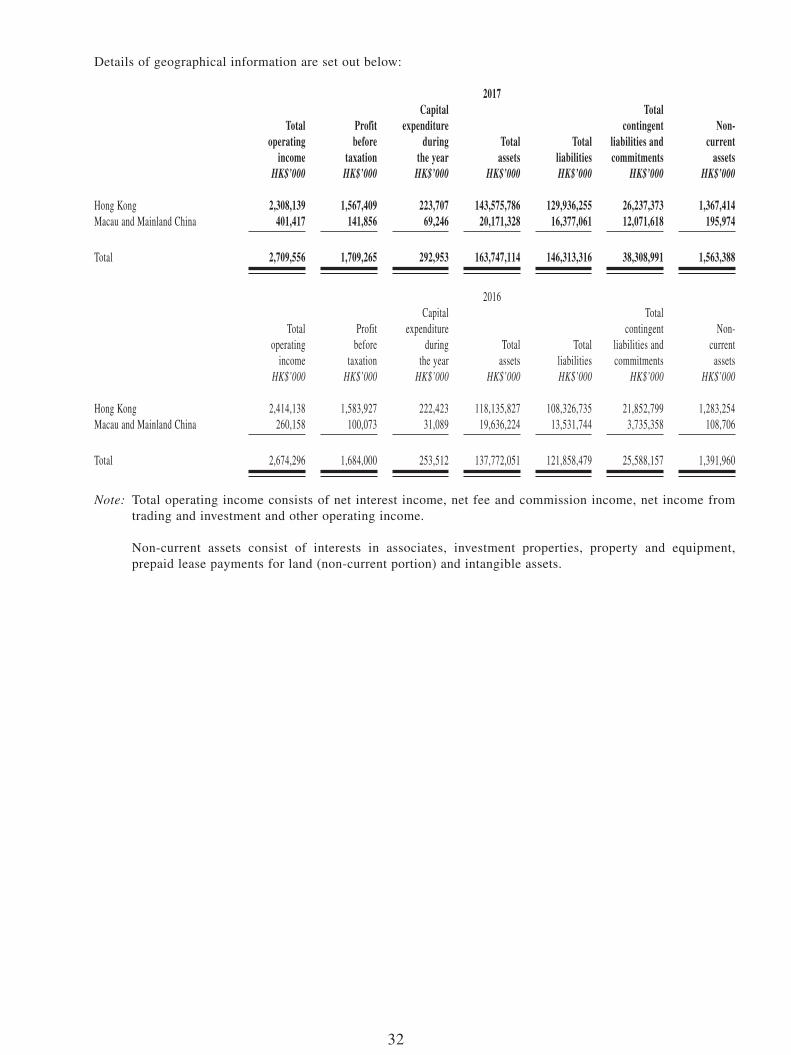
Details of geographical information are set out below:
2017
Totaloperating
income
Profitbefore
taxation
Capitalexpenditure
duringthe year
Totalassets
Totalliabilities
Totalcontingent
liabilities andcommitments
Non-current
assetsHK$’000 HK$’000 HK$’000 HK$’000 HK$’000 HK$’000 HK$’000
Hong Kong 2,308,139 1,567,409 223,707 143,575,786 129,936,255 26,237,373 1,367,414Macau and Mainland China 401,417 141,856 69,246 20,171,328 16,377,061 12,071,618 195,974
Total 2,709,556 1,709,265 292,953 163,747,114 146,313,316 38,308,991 1,563,388
2016
Totaloperating
income
Profitbefore
taxation
Capitalexpenditure
duringthe year
Totalassets
Totalliabilities
Totalcontingent
liabilities andcommitments
Non-current
assetsHK$’000 HK$’000 HK$’000 HK$’000 HK$’000 HK$’000 HK$’000
Hong Kong 2,414,138 1,583,927 222,423 118,135,827 108,326,735 21,852,799 1,283,254Macau and Mainland China 260,158 100,073 31,089 19,636,224 13,531,744 3,735,358 108,706
Total 2,674,296 1,684,000 253,512 137,772,051 121,858,479 25,588,157 1,391,960
Note: Total operating income consists of net interest income, net fee and commission income, net income from trading and investment and other operating income.
Non-current assets consist of interests in associates, investment properties, property and equipment, prepaid lease payments for land (non-current portion) and intangible assets.
33
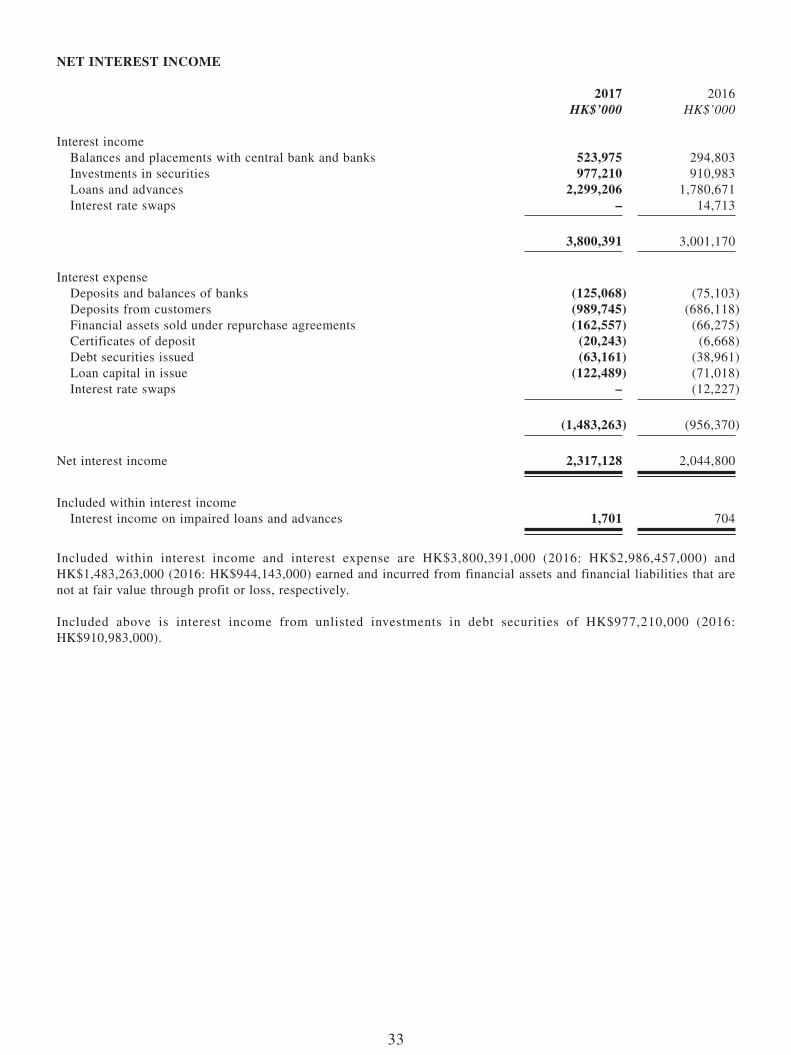
NET INTEREST INCOME
2017 2016HK$’000 HK$’000
Interest income Balances and placements with central bank and banks 523,975 294,803 Investments in securities 977,210 910,983 Loans and advances 2,299,206 1,780,671 Interest rate swaps – 14,713
3,800,391 3,001,170
Interest expense Deposits and balances of banks (125,068) (75,103) Deposits from customers (989,745) (686,118) Financial assets sold under repurchase agreements (162,557) (66,275) Certificates of deposit (20,243) (6,668) Debt securities issued (63,161) (38,961) Loan capital in issue (122,489) (71,018) Interest rate swaps – (12,227)
(1,483,263) (956,370)
Net interest income 2,317,128 2,044,800
Included within interest income Interest income on impaired loans and advances 1,701 704
Included within interest income and interest expense are HK$3,800,391,000 (2016: HK$2,986,457,000) and HK$1,483,263,000 (2016: HK$944,143,000) earned and incurred from financial assets and financial liabilities that are not at fair value through profit or loss, respectively.
Included above is interest income from unlisted investments in debt securities of HK$977,210,000 (2016: HK$910,983,000).
34
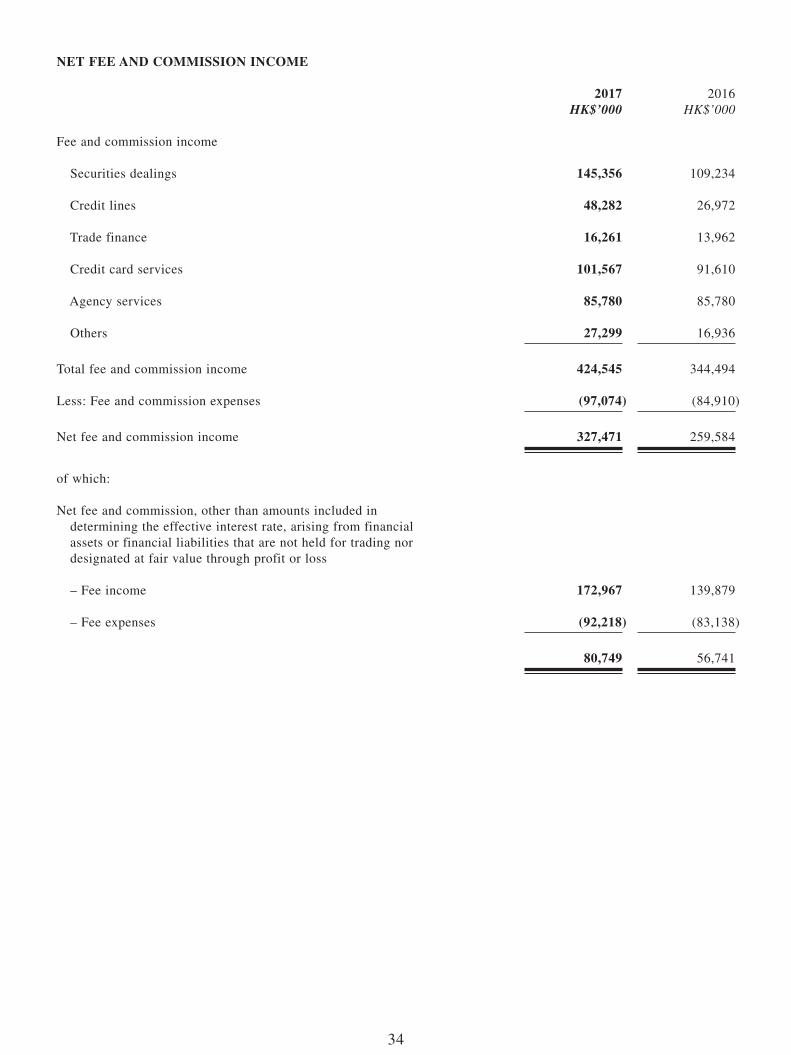
NET FEE AND COMMISSION INCOME
2017 2016HK$’000 HK$’000
Fee and commission income
Securities dealings 145,356 109,234
Credit lines 48,282 26,972
Trade finance 16,261 13,962
Credit card services 101,567 91,610
Agency services 85,780 85,780
Others 27,299 16,936
Total fee and commission income 424,545 344,494
Less: Fee and commission expenses (97,074) (84,910)
Net fee and commission income 327,471 259,584
of which:
Net fee and commission, other than amounts included in determining the effective interest rate, arising from financial assets or financial liabilities that are not held for trading nor designated at fair value through profit or loss
– Fee income 172,967 139,879
– Fee expenses (92,218) (83,138)
80,749 56,741
35
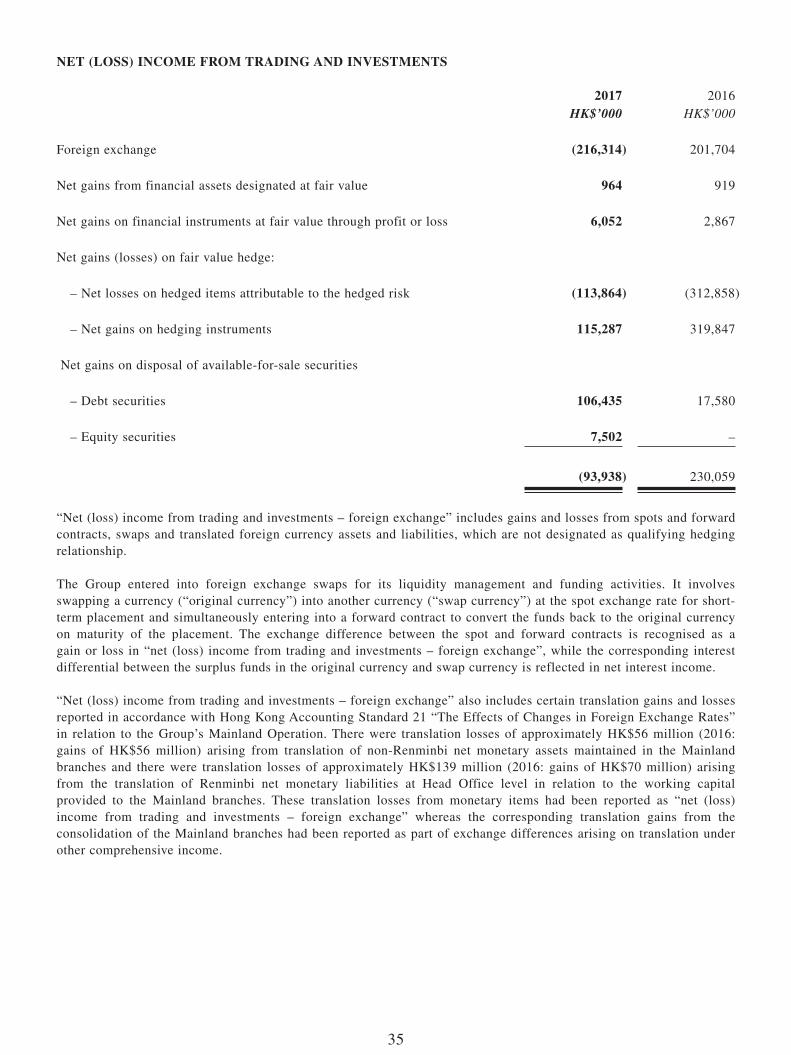
NET (LOSS) INCOME FROM TRADINg AND INvESTMENTS
2017 2016HK$’000 HK$’000
Foreign exchange (216,314) 201,704
Net gains from financial assets designated at fair value 964 919
Net gains on financial instruments at fair value through profit or loss 6,052 2,867
Net gains (losses) on fair value hedge:
– Net losses on hedged items attributable to the hedged risk (113,864) (312,858)
– Net gains on hedging instruments 115,287 319,847
Net gains on disposal of available-for-sale securities
– Debt securities 106,435 17,580
– Equity securities 7,502 –
(93,938) 230,059
“Net (loss) income from trading and investments – foreign exchange” includes gains and losses from spots and forward contracts, swaps and translated foreign currency assets and liabilities, which are not designated as qualifying hedging relationship.
The Group entered into foreign exchange swaps for its liquidity management and funding activities. It involves swapping a currency (“original currency”) into another currency (“swap currency”) at the spot exchange rate for short-term placement and simultaneously entering into a forward contract to convert the funds back to the original currency on maturity of the placement. The exchange difference between the spot and forward contracts is recognised as a gain or loss in “net (loss) income from trading and investments – foreign exchange”, while the corresponding interest differential between the surplus funds in the original currency and swap currency is reflected in net interest income.
“Net (loss) income from trading and investments – foreign exchange” also includes certain translation gains and losses reported in accordance with Hong Kong Accounting Standard 21 “The Effects of Changes in Foreign Exchange Rates” in relation to the Group’s Mainland Operation. There were translation losses of approximately HK$56 million (2016: gains of HK$56 million) arising from translation of non-Renminbi net monetary assets maintained in the Mainland branches and there were translation losses of approximately HK$139 million (2016: gains of HK$70 million) arising from the translation of Renminbi net monetary liabilities at Head Office level in relation to the working capital provided to the Mainland branches. These translation losses from monetary items had been reported as “net (loss) income from trading and investments – foreign exchange” whereas the corresponding translation gains from the consolidation of the Mainland branches had been reported as part of exchange differences arising on translation under other comprehensive income.
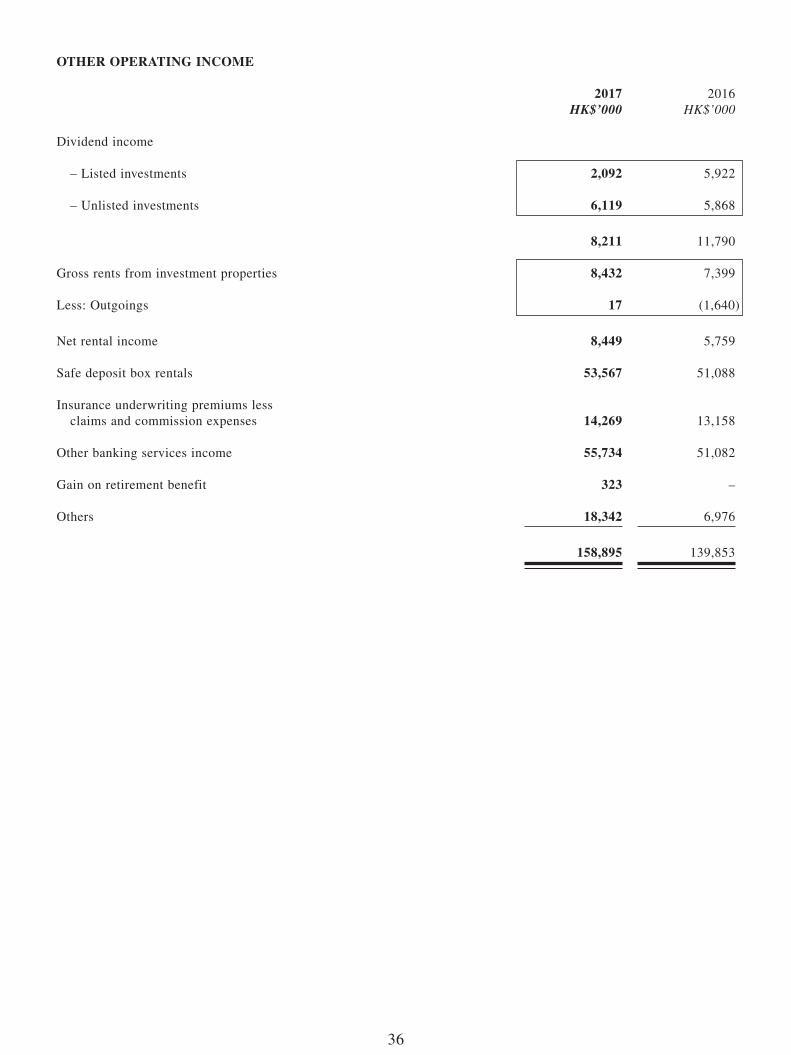
36
OTHER OPERATINg INCOME
2017 2016HK$’000 HK$’000
Dividend income
– Listed investments 2,092 5,922
– Unlisted investments 6,119 5,868
8,211 11,790
Gross rents from investment properties 8,432 7,399
Less: Outgoings 17 (1,640)
Net rental income 8,449 5,759
Safe deposit box rentals 53,567 51,088
Insurance underwriting premiums less claims and commission expenses 14,269 13,158
Other banking services income 55,734 51,082
Gain on retirement benefit 323 –
Others 18,342 6,976
158,895 139,853
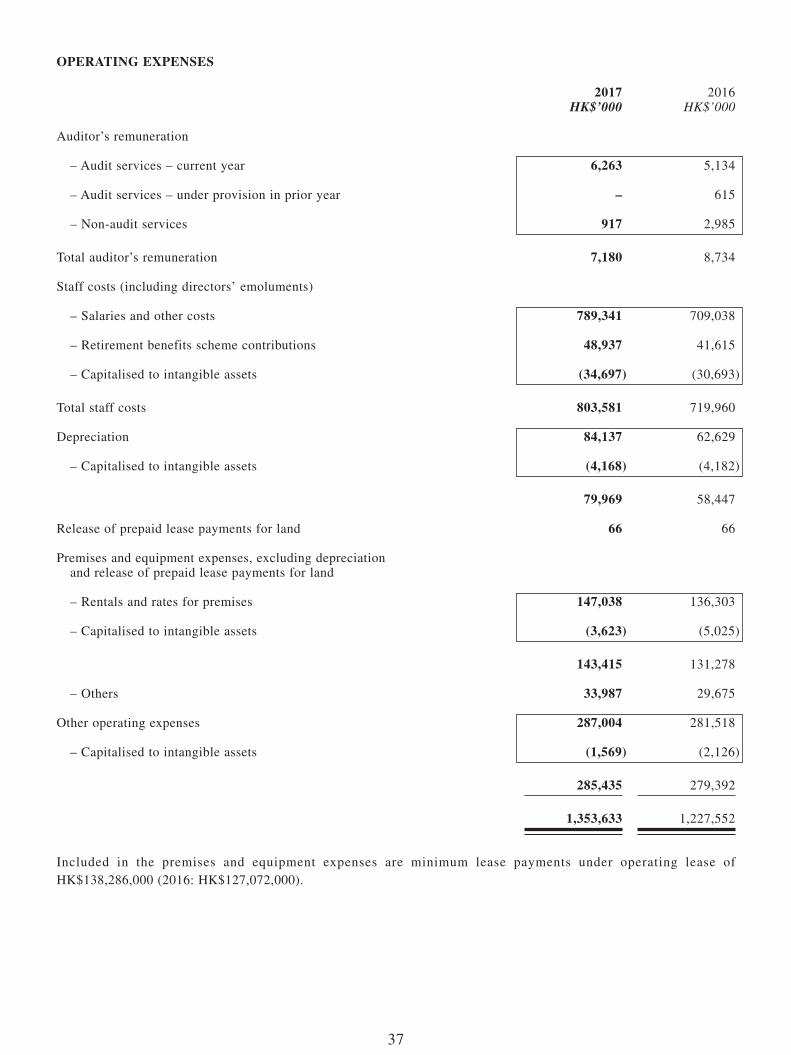
37
OPERATINg ExPENSES
2017 2016HK$’000 HK$’000
Auditor’s remuneration
– Audit services – current year 6,263 5,134
– Audit services – under provision in prior year – 615
– Non-audit services 917 2,985
Total auditor’s remuneration 7,180 8,734
Staff costs (including directors’ emoluments)
– Salaries and other costs 789,341 709,038
– Retirement benefits scheme contributions 48,937 41,615
– Capitalised to intangible assets (34,697) (30,693)
Total staff costs 803,581 719,960
Depreciation 84,137 62,629
– Capitalised to intangible assets (4,168) (4,182)
79,969 58,447
Release of prepaid lease payments for land 66 66
Premises and equipment expenses, excluding depreciation and release of prepaid lease payments for land
– Rentals and rates for premises 147,038 136,303
– Capitalised to intangible assets (3,623) (5,025)
143,415 131,278
– Others 33,987 29,675
Other operating expenses 287,004 281,518
– Capitalised to intangible assets (1,569) (2,126)
285,435 279,392
1,353,633 1,227,552
Included in the premises and equipment expenses are minimum lease payments under operating lease of HK$138,286,000 (2016: HK$127,072,000).
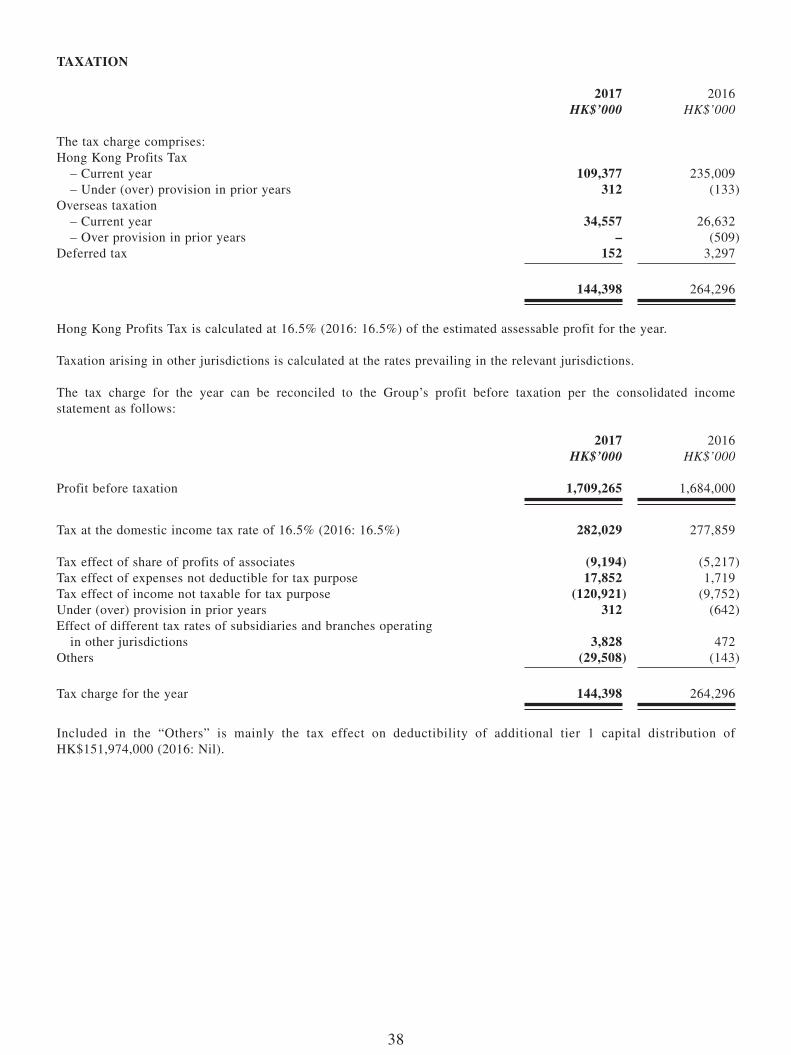
38
TAxATION
2017 2016HK$’000 HK$’000
The tax charge comprises:Hong Kong Profits Tax – Current year 109,377 235,009 – Under (over) provision in prior years 312 (133)Overseas taxation – Current year 34,557 26,632 – Over provision in prior years – (509)Deferred tax 152 3,297
144,398 264,296
Hong Kong Profits Tax is calculated at 16.5% (2016: 16.5%) of the estimated assessable profit for the year.
Taxation arising in other jurisdictions is calculated at the rates prevailing in the relevant jurisdictions.
The tax charge for the year can be reconciled to the Group’s profit before taxation per the consolidated income statement as follows:
2017 2016HK$’000 HK$’000
Profit before taxation 1,709,265 1,684,000
Tax at the domestic income tax rate of 16.5% (2016: 16.5%) 282,029 277,859
Tax effect of share of profits of associates (9,194) (5,217)Tax effect of expenses not deductible for tax purpose 17,852 1,719Tax effect of income not taxable for tax purpose (120,921) (9,752)Under (over) provision in prior years 312 (642)Effect of different tax rates of subsidiaries and branches operating in other jurisdictions 3,828 472Others (29,508) (143)
Tax charge for the year 144,398 264,296
Included in the “Others” is mainly the tax effect on deductibility of additional tier 1 capital distribution of HK$151,974,000 (2016: Nil).
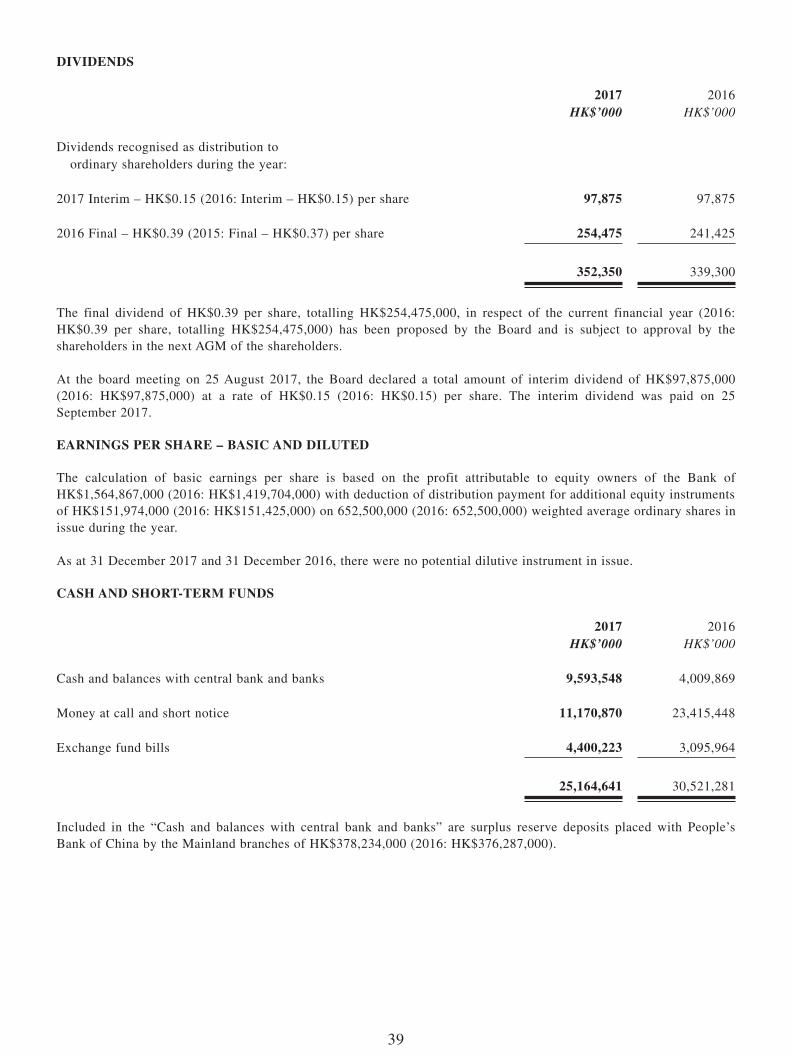
39
DIvIDENDS
2017 2016HK$’000 HK$’000
Dividends recognised as distribution to ordinary shareholders during the year:
2017 Interim – HK$0.15 (2016: Interim – HK$0.15) per share 97,875 97,875
2016 Final – HK$0.39 (2015: Final – HK$0.37) per share 254,475 241,425
352,350 339,300
The final dividend of HK$0.39 per share, totalling HK$254,475,000, in respect of the current financial year (2016: HK$0.39 per share, totalling HK$254,475,000) has been proposed by the Board and is subject to approval by the shareholders in the next AGM of the shareholders.
At the board meeting on 25 August 2017, the Board declared a total amount of interim dividend of HK$97,875,000 (2016: HK$97,875,000) at a rate of HK$0.15 (2016: HK$0.15) per share. The interim dividend was paid on 25 September 2017.
EARNINgS PER SHARE – BASIC AND DILUTED
The calculation of basic earnings per share is based on the profit attributable to equity owners of the Bank of HK$1,564,867,000 (2016: HK$1,419,704,000) with deduction of distribution payment for additional equity instruments of HK$151,974,000 (2016: HK$151,425,000) on 652,500,000 (2016: 652,500,000) weighted average ordinary shares in issue during the year.
As at 31 December 2017 and 31 December 2016, there were no potential dilutive instrument in issue.
CASH AND SHORT-TERM FUNDS
2017 2016HK$’000 HK$’000
Cash and balances with central bank and banks 9,593,548 4,009,869
Money at call and short notice 11,170,870 23,415,448
Exchange fund bills 4,400,223 3,095,964
25,164,641 30,521,281
Included in the “Cash and balances with central bank and banks” are surplus reserve deposits placed with People’s Bank of China by the Mainland branches of HK$378,234,000 (2016: HK$376,287,000).
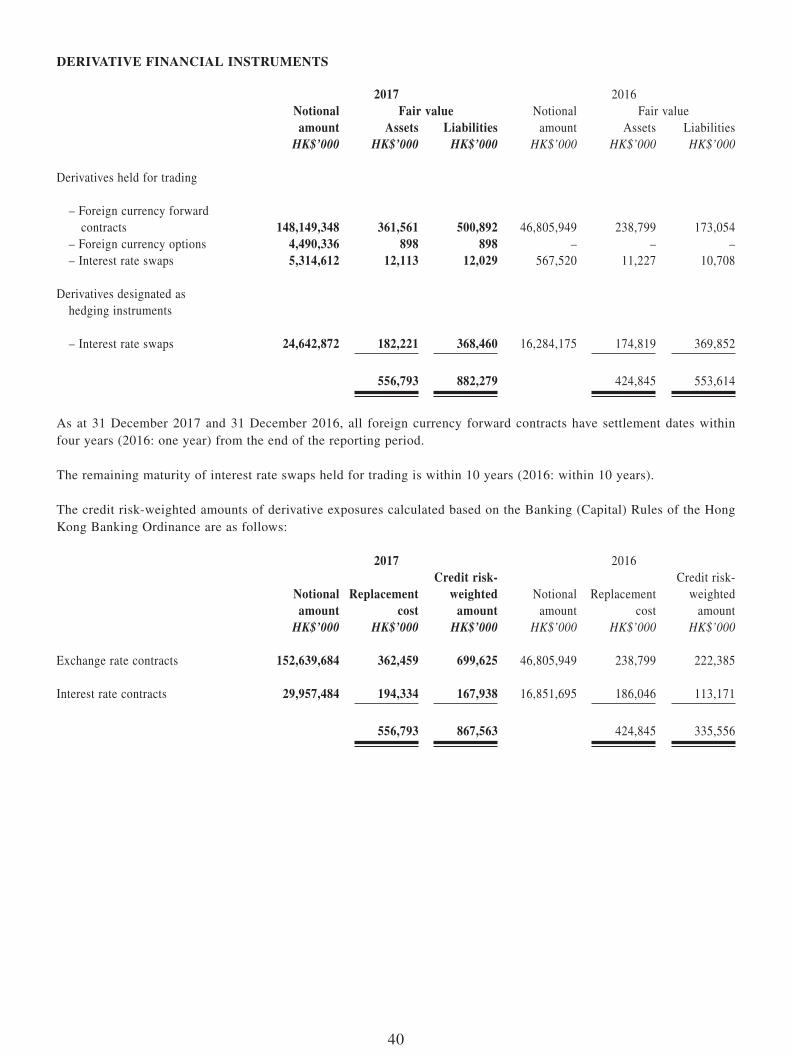
40
DERIvATIvE FINANCIAL INSTRUMENTS
2017 2016Notional amount
Fair value Notional amount
Fair valueAssets Liabilities Assets Liabilities
HK$’000 HK$’000 HK$’000 HK$’000 HK$’000 HK$’000
Derivatives held for trading
– Foreign currency forward contracts 148,149,348 361,561 500,892 46,805,949 238,799 173,054 – Foreign currency options 4,490,336 898 898 – – – – Interest rate swaps 5,314,612 12,113 12,029 567,520 11,227 10,708
Derivatives designated as hedging instruments
– Interest rate swaps 24,642,872 182,221 368,460 16,284,175 174,819 369,852
556,793 882,279 424,845 553,614
As at 31 December 2017 and 31 December 2016, all foreign currency forward contracts have settlement dates within four years (2016: one year) from the end of the reporting period.
The remaining maturity of interest rate swaps held for trading is within 10 years (2016: within 10 years).
The credit risk-weighted amounts of derivative exposures calculated based on the Banking (Capital) Rules of the Hong Kong Banking Ordinance are as follows:
2017 2016
Notional amount
Replacement cost
Credit risk-weighted
amountNotional
amountReplacement
cost
Credit risk-weighted
amountHK$’000 HK$’000 HK$’000 HK$’000 HK$’000 HK$’000
Exchange rate contracts 152,639,684 362,459 699,625 46,805,949 238,799 222,385
Interest rate contracts 29,957,484 194,334 167,938 16,851,695 186,046 113,171
556,793 867,563 424,845 335,556

41
Replacement cost is the cost which would be incurred by the Group if it was required to enter into another contract to replace the existing transaction or existing contract with another counterparty with substantially the same economic consequences for the Group and is calculated by marking-to-market the existing transaction or existing contract. If the resultant value is positive for the Group, the replacement cost shall be the resultant value of the existing transaction or existing contract. If the resultant value is negative for the Group, the replacement cost shall be zero. Replacement cost is a close approximation of the credit risk for these contracts at the end of the reporting period.
The derivative financial instruments including exchange rate contracts and interest rate contracts have been recognised in the statements of financial position at fair values.
The fair values of the derivative financial instruments do not take into account the effect of any bilateral netting agreements.
Fair value hedge of fixed-rate bonds
The Group designates certain interest rate swaps as fair value hedges of available-for-sale debt securities with carrying amount of HK$20,591,803,000 (2016: HK$15,011,658,000) as at 31 December 2017. The purpose is to minimise its exposure to fair value changes of its fixed-rate bonds by swapping these fixed-rate bonds from fixed rates to floating rates. The interest rate swaps and the corresponding fixed-rate bonds have the same terms. The management of the Group considers that the interest rate swaps are highly effective hedging instruments. The remaining maturity of these interest rate swaps and debt securities ranged from 3 months to 10 years (2016: 5 months to 9 years).
During the years ended 31 December 2017 and 31 December 2016, the above fair value hedges were effective in hedging the fair value exposures to interest rate movements and as a result, both the losses in fair value of the bonds of HK$184,159,000 (2016: losses of HK$342,602,000) and gains in fair value of the interest rate swaps of HK$183,949,000 (2016: gain of HK$346,203,000) were included in the consolidated income statement.
Fair value hedge of subordinated note issued
The Group designates an interest rate swap as fair value hedge of the interest rate movement of the US$587 million (2016: US$225 million) subordinated note issued. The purpose is to minimise its exposure to fair value changes of its fixed-rate note by swapping fixed-rate note from fixed rate to floating rate. The interest rate swap and the hedged subordinated note have the same terms and the management of the Group considers that the interest rate swap is a highly effective hedging instrument.
The hedge was effective in hedging the fair value exposure to interest rate movements and as a result, both the increase in fair value of the note of HK$70,295,000 (2016: decrease in fair value of HK$29,744,000) and gains in fair value of the interest rate swap of HK$68,662,000 (2016: losses of HK$26,356,000) were included in the consolidated income statement.
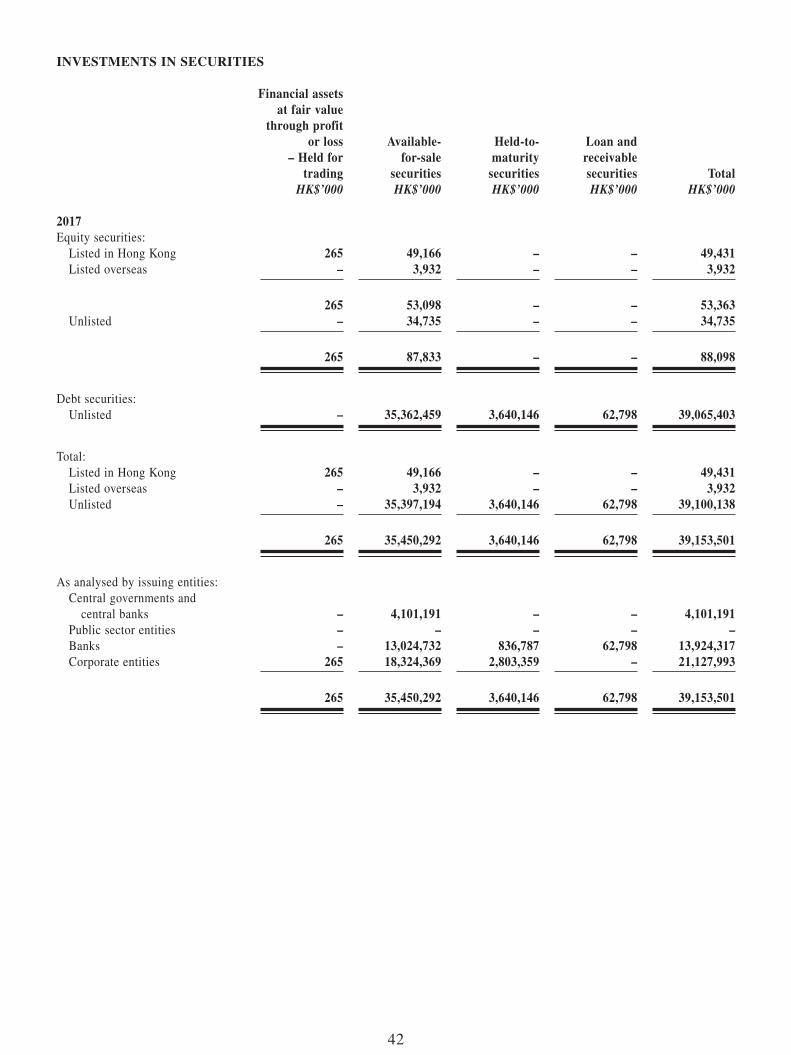
42
INvESTMENTS IN SECURITIES
Financial assets at fair value
through profitor loss
– Held for trading
Available-for-sale
securities
Held-to- maturity
securities
Loan and receivable securities Total
HK$’000 HK$’000 HK$’000 HK$’000 HK$’000
2017Equity securities: Listed in Hong Kong 265 49,166 – – 49,431 Listed overseas – 3,932 – – 3,932
265 53,098 – – 53,363 Unlisted – 34,735 – – 34,735
265 87,833 – – 88,098
Debt securities: Unlisted – 35,362,459 3,640,146 62,798 39,065,403
Total: Listed in Hong Kong 265 49,166 – – 49,431 Listed overseas – 3,932 – – 3,932 Unlisted – 35,397,194 3,640,146 62,798 39,100,138
265 35,450,292 3,640,146 62,798 39,153,501
As analysed by issuing entities: Central governments and central banks – 4,101,191 – – 4,101,191 Public sector entities – – – – – Banks – 13,024,732 836,787 62,798 13,924,317 Corporate entities 265 18,324,369 2,803,359 – 21,127,993
265 35,450,292 3,640,146 62,798 39,153,501
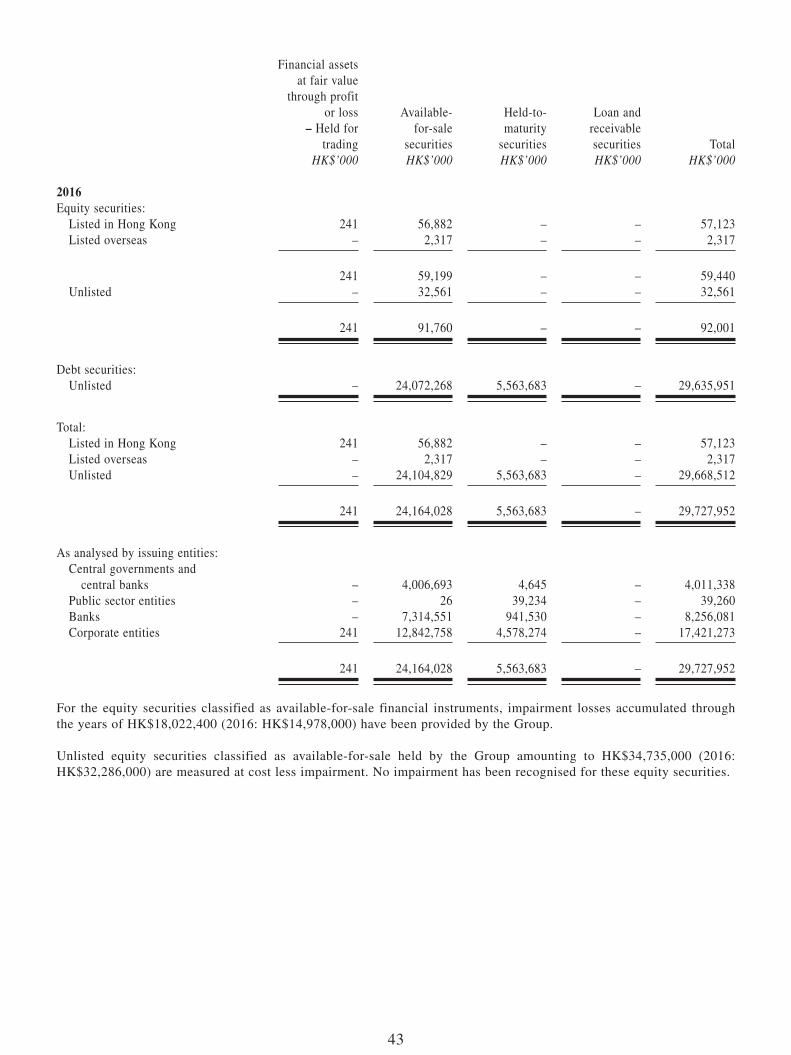
43
Financial assets at fair value
through profitor loss
– Held for trading
Available-for-sale
securities
Held-to- maturity
securities
Loan and receivable securities Total
HK$’000 HK$’000 HK$’000 HK$’000 HK$’000
2016Equity securities: Listed in Hong Kong 241 56,882 – – 57,123 Listed overseas – 2,317 – – 2,317
241 59,199 – – 59,440 Unlisted – 32,561 – – 32,561
241 91,760 – – 92,001
Debt securities: Unlisted – 24,072,268 5,563,683 – 29,635,951
Total: Listed in Hong Kong 241 56,882 – – 57,123 Listed overseas – 2,317 – – 2,317 Unlisted – 24,104,829 5,563,683 – 29,668,512
241 24,164,028 5,563,683 – 29,727,952
As analysed by issuing entities: Central governments and central banks – 4,006,693 4,645 – 4,011,338 Public sector entities – 26 39,234 – 39,260 Banks – 7,314,551 941,530 – 8,256,081 Corporate entities 241 12,842,758 4,578,274 – 17,421,273
241 24,164,028 5,563,683 – 29,727,952
For the equity securities classified as available-for-sale financial instruments, impairment losses accumulated through the years of HK$18,022,400 (2016: HK$14,978,000) have been provided by the Group.
Unlisted equity securities classified as available-for-sale held by the Group amounting to HK$34,735,000 (2016: HK$32,286,000) are measured at cost less impairment. No impairment has been recognised for these equity securities.
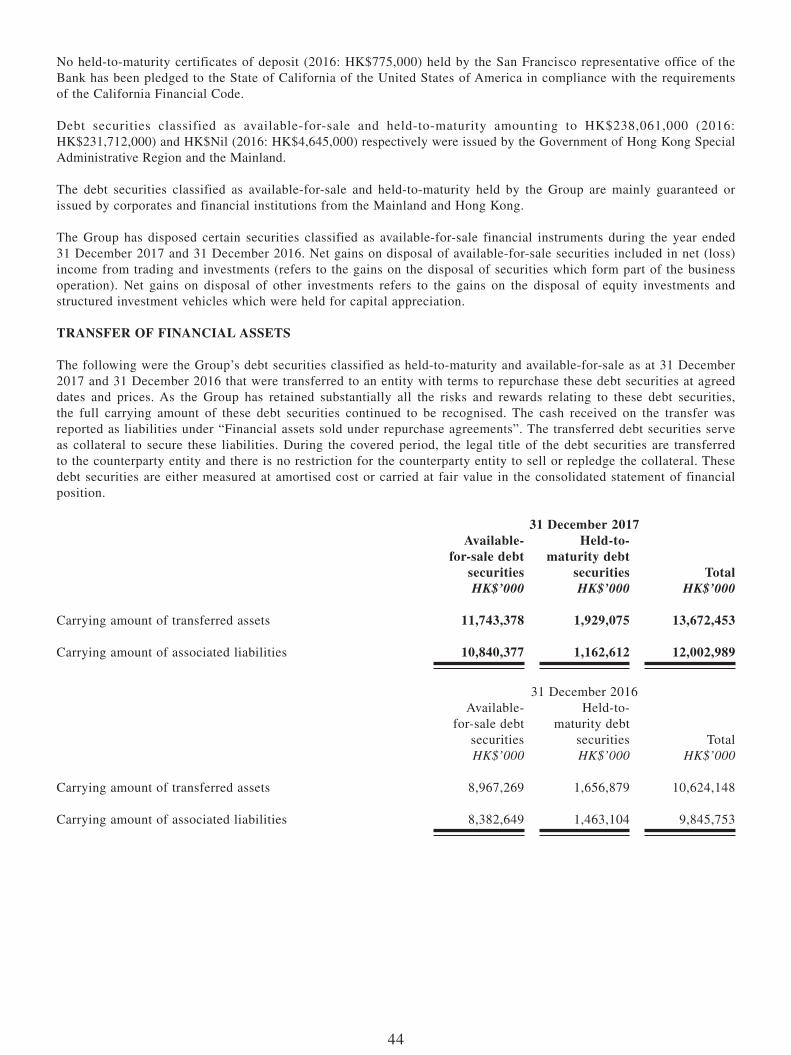
44
No held-to-maturity certificates of deposit (2016: HK$775,000) held by the San Francisco representative office of the Bank has been pledged to the State of California of the United States of America in compliance with the requirements of the California Financial Code.
Debt securities classified as available-for-sale and held-to-maturity amounting to HK$238,061,000 (2016: HK$231,712,000) and HK$Nil (2016: HK$4,645,000) respectively were issued by the Government of Hong Kong Special Administrative Region and the Mainland.
The debt securities classified as available-for-sale and held-to-maturity held by the Group are mainly guaranteed or issued by corporates and financial institutions from the Mainland and Hong Kong.
The Group has disposed certain securities classified as available-for-sale financial instruments during the year ended 31 December 2017 and 31 December 2016. Net gains on disposal of available-for-sale securities included in net (loss) income from trading and investments (refers to the gains on the disposal of securities which form part of the business operation). Net gains on disposal of other investments refers to the gains on the disposal of equity investments and structured investment vehicles which were held for capital appreciation.
TRANSFER OF FINANCIAL ASSETS
The following were the Group’s debt securities classified as held-to-maturity and available-for-sale as at 31 December 2017 and 31 December 2016 that were transferred to an entity with terms to repurchase these debt securities at agreed dates and prices. As the Group has retained substantially all the risks and rewards relating to these debt securities, the full carrying amount of these debt securities continued to be recognised. The cash received on the transfer was reported as liabilities under “Financial assets sold under repurchase agreements”. The transferred debt securities serve as collateral to secure these liabilities. During the covered period, the legal title of the debt securities are transferred to the counterparty entity and there is no restriction for the counterparty entity to sell or repledge the collateral. These debt securities are either measured at amortised cost or carried at fair value in the consolidated statement of financial position.
31 December 2017Available-
for-sale debt securities
Held-to-maturity debt
securities TotalHK$’000 HK$’000 HK$’000
Carrying amount of transferred assets 11,743,378 1,929,075 13,672,453
Carrying amount of associated liabilities 10,840,377 1,162,612 12,002,989
31 December 2016Available-
for-sale debt securities
Held-to-maturity debt
securities TotalHK$’000 HK$’000 HK$’000
Carrying amount of transferred assets 8,967,269 1,656,879 10,624,148
Carrying amount of associated liabilities 8,382,649 1,463,104 9,845,753
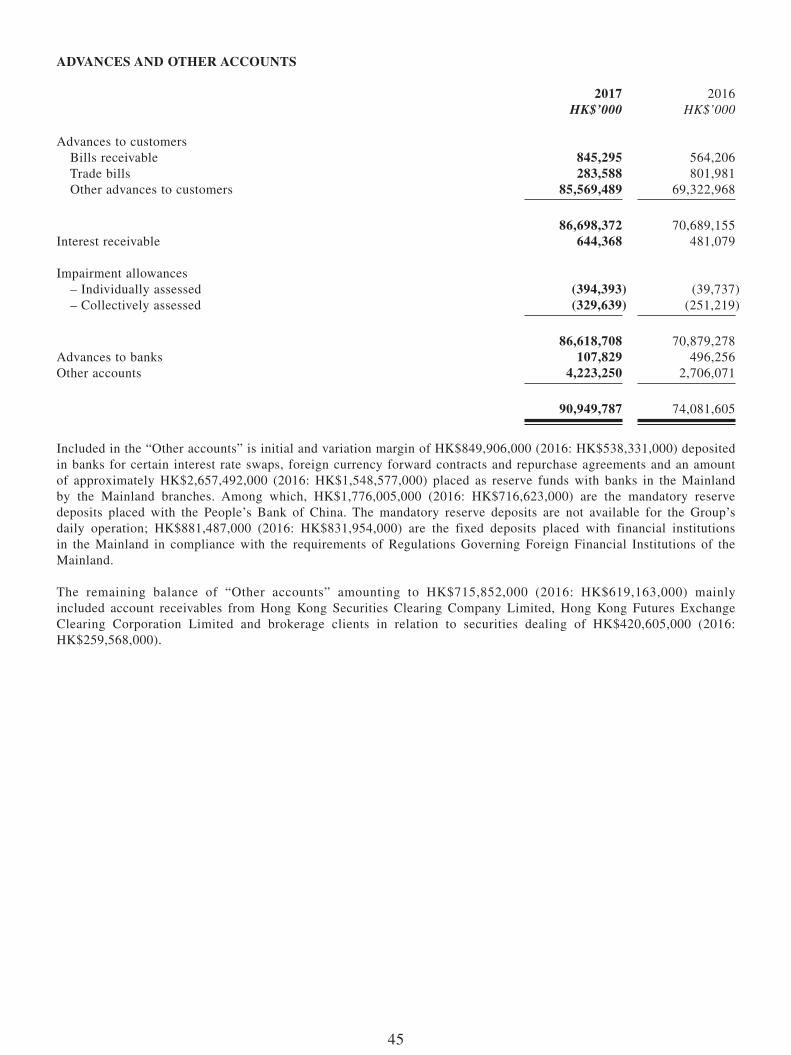
45
ADvANCES AND OTHER ACCOUNTS
2017 2016HK$’000 HK$’000
Advances to customers Bills receivable 845,295 564,206 Trade bills 283,588 801,981 Other advances to customers 85,569,489 69,322,968
86,698,372 70,689,155Interest receivable 644,368 481,079
Impairment allowances – Individually assessed (394,393) (39,737) – Collectively assessed (329,639) (251,219)
86,618,708 70,879,278Advances to banks 107,829 496,256Other accounts 4,223,250 2,706,071
90,949,787 74,081,605
Included in the “Other accounts” is initial and variation margin of HK$849,906,000 (2016: HK$538,331,000) deposited in banks for certain interest rate swaps, foreign currency forward contracts and repurchase agreements and an amount of approximately HK$2,657,492,000 (2016: HK$1,548,577,000) placed as reserve funds with banks in the Mainland by the Mainland branches. Among which, HK$1,776,005,000 (2016: HK$716,623,000) are the mandatory reserve deposits placed with the People’s Bank of China. The mandatory reserve deposits are not available for the Group’s daily operation; HK$881,487,000 (2016: HK$831,954,000) are the fixed deposits placed with financial institutions in the Mainland in compliance with the requirements of Regulations Governing Foreign Financial Institutions of the Mainland.
The remaining balance of “Other accounts” amounting to HK$715,852,000 (2016: HK$619,163,000) mainly included account receivables from Hong Kong Securities Clearing Company Limited, Hong Kong Futures Exchange Clearing Corporation Limited and brokerage clients in relation to securities dealing of HK$420,605,000 (2016: HK$259,568,000).

46
Impairment allowances on advances:
Individual assessment
Collective assessment Total
HK$’000 HK$’000 HK$’000
Balance 1 January 2017 39,737 251,219 290,956
– Increase in impairment allowances 366,022 74,543 440,565
– Amounts reversed (68,974) – (68,974)
Net charge of impairment allowances 297,048 74,543 371,591
Amounts written off (4,487) – (4,487)
Recoveries of advances written off in previous years 63,796 – 63,796
Unwinding effect of discount rate (1,701) – (1,701)
Exchange difference – 3,877 3,877
Balance 31 December 2017 394,393 329,639 724,032
Balance 1 January 2016 23,688 250,494 274,182
– Increase in impairment allowances 27,070 2,167 29,237
– Amounts reversed (69,435) – (69,435)
Net charge (reversal) of impairment allowances (42,365) 2,167 (40,198)
Amounts written off (5,758) – (5,758)
Recoveries of advances written off in previous years 64,876 – 64,876
Unwinding effect of discount rate (704) – (704)
Exchange difference – (1,442) (1,442)
Balance 31 December 2016 39,737 251,219 290,956

47
Details of the impaired loans are as follows:
2017 2016HK$’000 HK$’000
Gross impaired loans 398,100 48,253
Less: Impairment allowances under individual assessment (394,393) (39,737)
Net impaired loans 3,707 8,516
Gross impaired loans as a percentage of gross advances to customers 0.46% 0.07%
Market value of collateral pledged 3,873 9,150
Details of the non-performing loans are as follows:
2017 2016HK$’000 HK$’000
Gross non-performing loans (Note) 485,492 449,772
Less: Impairment allowances under individual assessment (394,393) (39,737)
Net non-performing loans 91,099 410,035
Gross non-performing loans as a percentage of gross advances to customers 0.56% 0.64%
Market value of collateral pledged 200,716 760,420
Note: Non-performing loans represent advances which are either classified as “substandard”, “doubtful” or “loss” under the Group’s classification of loan quality. The occurrence of loss event(s) may not necessarily result in impairment loss where the advances are fully collateralised. While such advances are of “substandard” or lower grades, they are regarded as not being impaired.
In accordance with HKAS 39, individual impairment allowances are assessed by a discounted cash flow method for loans and advances that are individually significant and have objective evidence of impairment. The increase in impairment allowances under individual allowances for the year ended 31 December 2017 was mainly due to one corporate credit relationship, which is engaged in various business segments including food production based in Mainland China, and is undergoing winding up proceedings. The exposure was fully provided for individual impairment allowances as at 31 December 2017.
In addition to the individually assessed loans impairment allowance, the Group has also provided collectively assessed loans impairment allowance for loans that are individually insignificant or advances where no impairment has been identified individually.
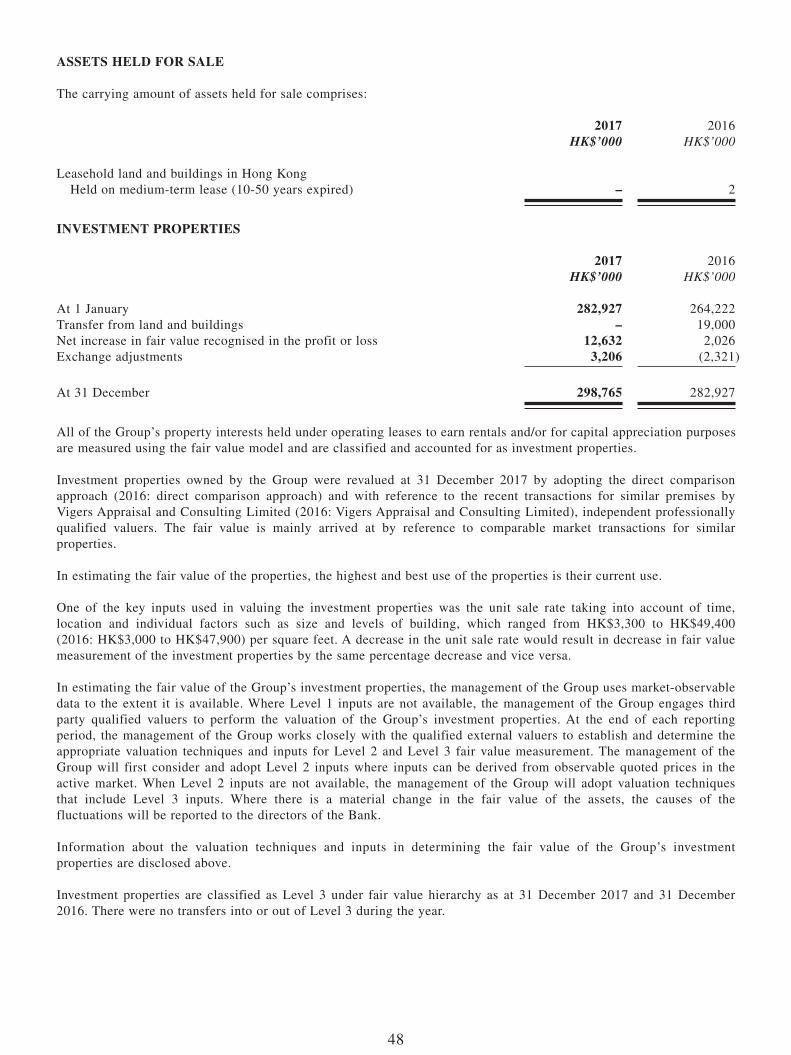
48
ASSETS HELD FOR SALE
The carrying amount of assets held for sale comprises:
2017 2016HK$’000 HK$’000
Leasehold land and buildings in Hong Kong Held on medium-term lease (10-50 years expired) – 2
INvESTMENT PROPERTIES
2017 2016HK$’000 HK$’000
At 1 January 282,927 264,222Transfer from land and buildings – 19,000Net increase in fair value recognised in the profit or loss 12,632 2,026Exchange adjustments 3,206 (2,321)
At 31 December 298,765 282,927
All of the Group’s property interests held under operating leases to earn rentals and/or for capital appreciation purposes are measured using the fair value model and are classified and accounted for as investment properties.
Investment properties owned by the Group were revalued at 31 December 2017 by adopting the direct comparison approach (2016: direct comparison approach) and with reference to the recent transactions for similar premises by Vigers Appraisal and Consulting Limited (2016: Vigers Appraisal and Consulting Limited), independent professionally qualified valuers. The fair value is mainly arrived at by reference to comparable market transactions for similar properties.
In estimating the fair value of the properties, the highest and best use of the properties is their current use.
One of the key inputs used in valuing the investment properties was the unit sale rate taking into account of time, location and individual factors such as size and levels of building, which ranged from HK$3,300 to HK$49,400 (2016: HK$3,000 to HK$47,900) per square feet. A decrease in the unit sale rate would result in decrease in fair value measurement of the investment properties by the same percentage decrease and vice versa.
In estimating the fair value of the Group’s investment properties, the management of the Group uses market-observable data to the extent it is available. Where Level 1 inputs are not available, the management of the Group engages third party qualified valuers to perform the valuation of the Group’s investment properties. At the end of each reporting period, the management of the Group works closely with the qualified external valuers to establish and determine the appropriate valuation techniques and inputs for Level 2 and Level 3 fair value measurement. The management of the Group will first consider and adopt Level 2 inputs where inputs can be derived from observable quoted prices in the active market. When Level 2 inputs are not available, the management of the Group will adopt valuation techniques that include Level 3 inputs. Where there is a material change in the fair value of the assets, the causes of the fluctuations will be reported to the directors of the Bank.
Information about the valuation techniques and inputs in determining the fair value of the Group’s investment properties are disclosed above.
Investment properties are classified as Level 3 under fair value hierarchy as at 31 December 2017 and 31 December 2016. There were no transfers into or out of Level 3 during the year.
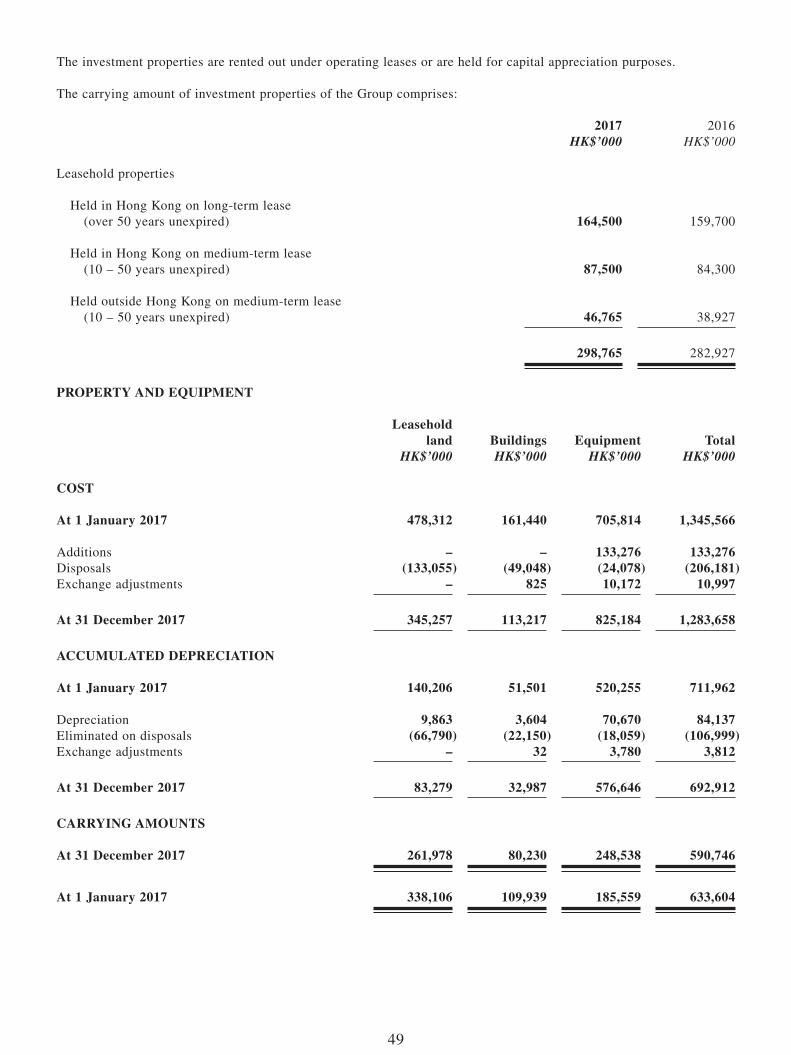
49
The investment properties are rented out under operating leases or are held for capital appreciation purposes.
The carrying amount of investment properties of the Group comprises:
2017 2016HK$’000 HK$’000
Leasehold properties
Held in Hong Kong on long-term lease (over 50 years unexpired) 164,500 159,700
Held in Hong Kong on medium-term lease (10 – 50 years unexpired) 87,500 84,300
Held outside Hong Kong on medium-term lease (10 – 50 years unexpired) 46,765 38,927
298,765 282,927
PROPERTY AND EQUIPMENT
Leasehold land Buildings Equipment Total
HK$’000 HK$’000 HK$’000 HK$’000
COST
At 1 January 2017 478,312 161,440 705,814 1,345,566
Additions – – 133,276 133,276Disposals (133,055) (49,048) (24,078) (206,181)Exchange adjustments – 825 10,172 10,997
At 31 December 2017 345,257 113,217 825,184 1,283,658
ACCUMULATED DEPRECIATION
At 1 January 2017 140,206 51,501 520,255 711,962
Depreciation 9,863 3,604 70,670 84,137Eliminated on disposals (66,790) (22,150) (18,059) (106,999)Exchange adjustments – 32 3,780 3,812
At 31 December 2017 83,279 32,987 576,646 692,912
CARRYINg AMOUNTS
At 31 December 2017 261,978 80,230 248,538 590,746
At 1 January 2017 338,106 109,939 185,559 633,604
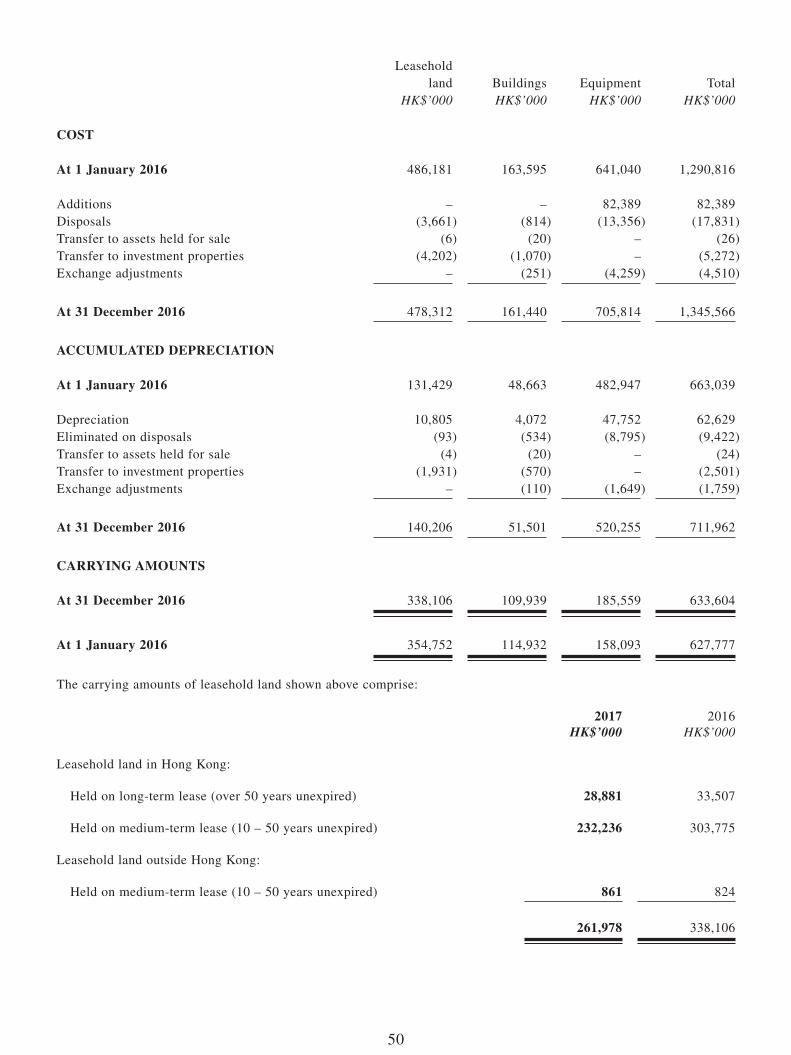
50
Leasehold land Buildings Equipment Total
HK$’000 HK$’000 HK$’000 HK$’000
COST
At 1 January 2016 486,181 163,595 641,040 1,290,816
Additions – – 82,389 82,389Disposals (3,661) (814) (13,356) (17,831)Transfer to assets held for sale (6) (20) – (26)Transfer to investment properties (4,202) (1,070) – (5,272)Exchange adjustments – (251) (4,259) (4,510)
At 31 December 2016 478,312 161,440 705,814 1,345,566
ACCUMULATED DEPRECIATION
At 1 January 2016 131,429 48,663 482,947 663,039
Depreciation 10,805 4,072 47,752 62,629Eliminated on disposals (93) (534) (8,795) (9,422)Transfer to assets held for sale (4) (20) – (24)Transfer to investment properties (1,931) (570) – (2,501)Exchange adjustments – (110) (1,649) (1,759)
At 31 December 2016 140,206 51,501 520,255 711,962
CARRYINg AMOUNTS
At 31 December 2016 338,106 109,939 185,559 633,604
At 1 January 2016 354,752 114,932 158,093 627,777
The carrying amounts of leasehold land shown above comprise:
2017 2016HK$’000 HK$’000
Leasehold land in Hong Kong:
Held on long-term lease (over 50 years unexpired) 28,881 33,507
Held on medium-term lease (10 – 50 years unexpired) 232,236 303,775
Leasehold land outside Hong Kong:
Held on medium-term lease (10 – 50 years unexpired) 861 824
261,978 338,106
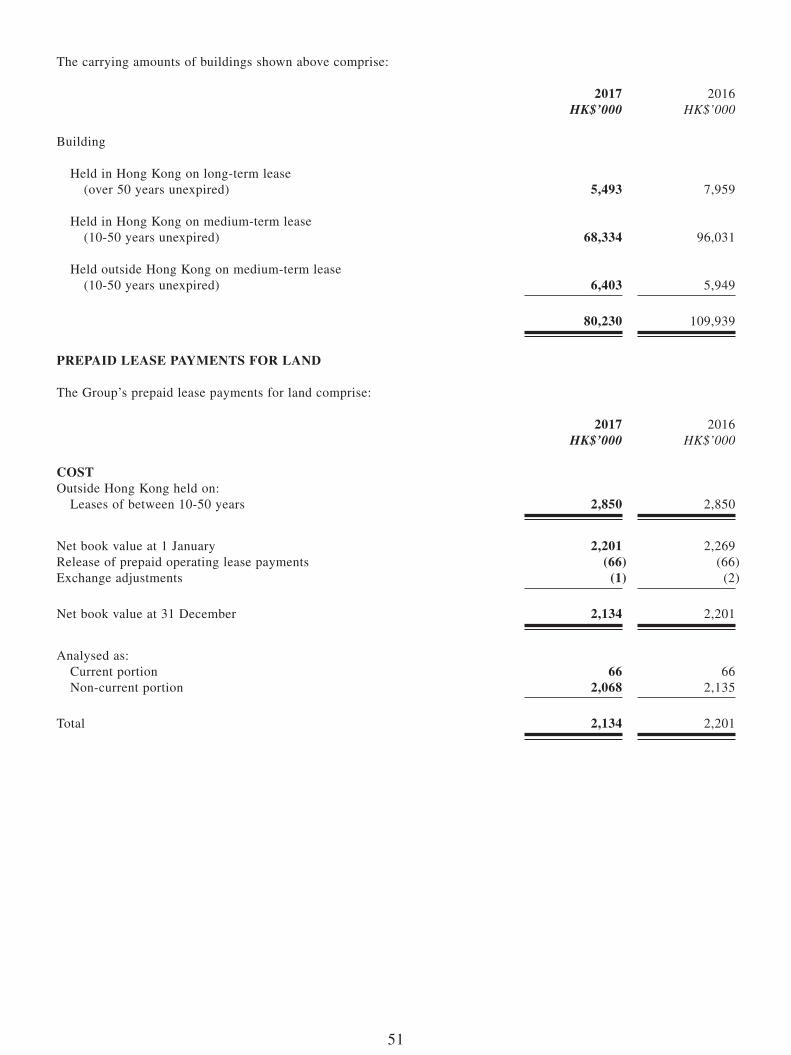
51
The carrying amounts of buildings shown above comprise:
2017 2016HK$’000 HK$’000
Building
Held in Hong Kong on long-term lease (over 50 years unexpired) 5,493 7,959
Held in Hong Kong on medium-term lease (10-50 years unexpired) 68,334 96,031
Held outside Hong Kong on medium-term lease (10-50 years unexpired) 6,403 5,949
80,230 109,939
PREPAID LEASE PAYMENTS FOR LAND
The Group’s prepaid lease payments for land comprise:
2017 2016HK$’000 HK$’000
COSTOutside Hong Kong held on: Leases of between 10-50 years 2,850 2,850
Net book value at 1 January 2,201 2,269Release of prepaid operating lease payments (66) (66)Exchange adjustments (1) (2)
Net book value at 31 December 2,134 2,201
Analysed as: Current portion 66 66 Non-current portion 2,068 2,135
Total 2,134 2,201
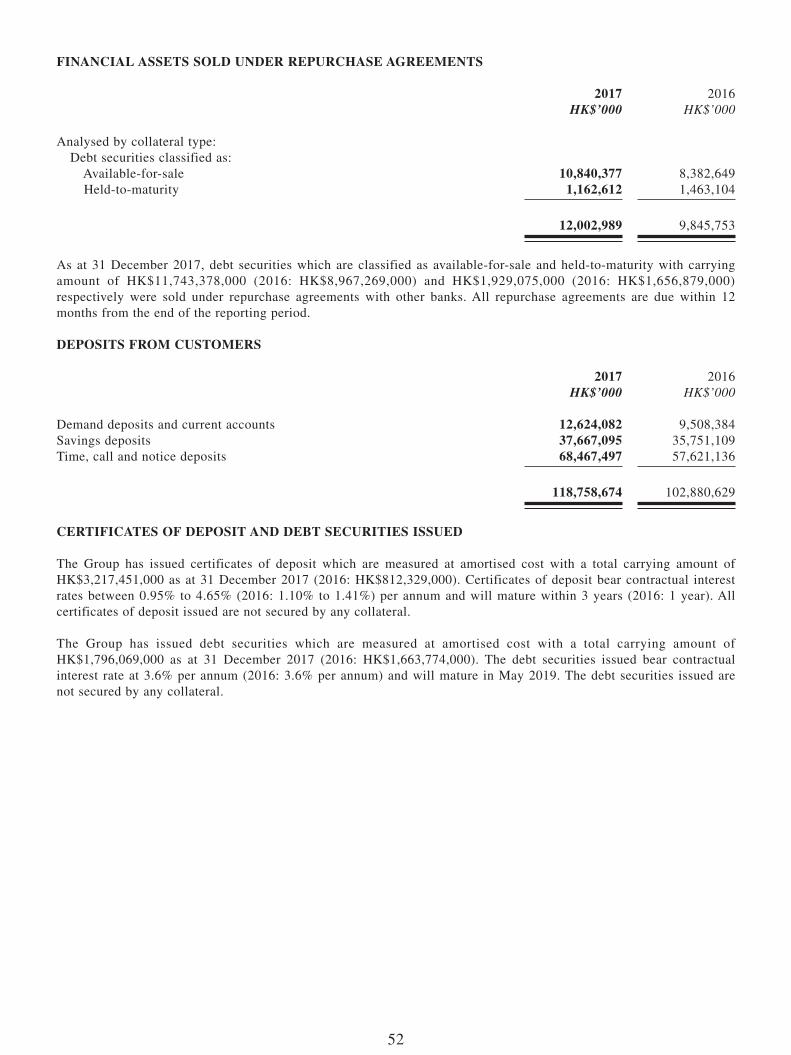
52
FINANCIAL ASSETS SOLD UNDER REPURCHASE AgREEMENTS
2017 2016HK$’000 HK$’000
Analysed by collateral type: Debt securities classified as: Available-for-sale 10,840,377 8,382,649 Held-to-maturity 1,162,612 1,463,104
12,002,989 9,845,753
As at 31 December 2017, debt securities which are classified as available-for-sale and held-to-maturity with carrying amount of HK$11,743,378,000 (2016: HK$8,967,269,000) and HK$1,929,075,000 (2016: HK$1,656,879,000) respectively were sold under repurchase agreements with other banks. All repurchase agreements are due within 12 months from the end of the reporting period.
DEPOSITS FROM CUSTOMERS
2017 2016HK$’000 HK$’000
Demand deposits and current accounts 12,624,082 9,508,384Savings deposits 37,667,095 35,751,109Time, call and notice deposits 68,467,497 57,621,136
118,758,674 102,880,629
CERTIFICATES OF DEPOSIT AND DEBT SECURITIES ISSUED
The Group has issued certificates of deposit which are measured at amortised cost with a total carrying amount of HK$3,217,451,000 as at 31 December 2017 (2016: HK$812,329,000). Certificates of deposit bear contractual interest rates between 0.95% to 4.65% (2016: 1.10% to 1.41%) per annum and will mature within 3 years (2016: 1 year). All certificates of deposit issued are not secured by any collateral.
The Group has issued debt securities which are measured at amortised cost with a total carrying amount of HK$1,796,069,000 as at 31 December 2017 (2016: HK$1,663,774,000). The debt securities issued bear contractual interest rate at 3.6% per annum (2016: 3.6% per annum) and will mature in May 2019. The debt securities issued are not secured by any collateral.
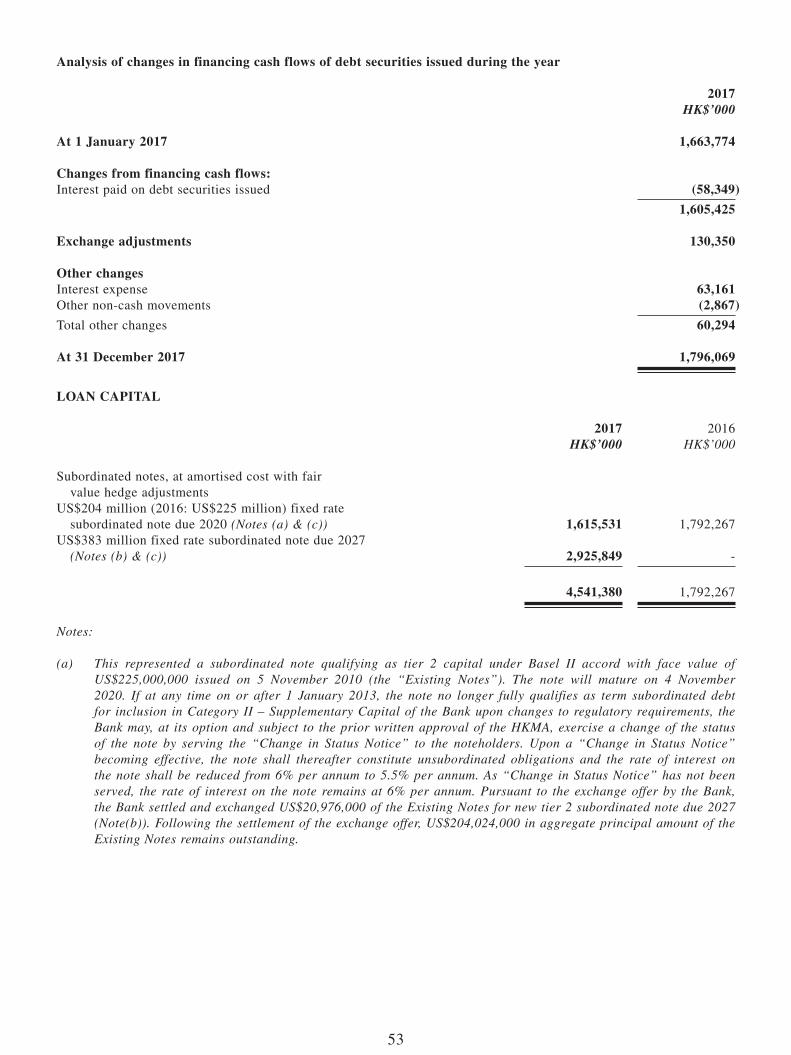
53
Analysis of changes in financing cash flows of debt securities issued during the year
2017HK$’000
At 1 January 2017 1,663,774
Changes from financing cash flows:Interest paid on debt securities issued (58,349)
1,605,425
Exchange adjustments 130,350
Other changesInterest expense 63,161Other non-cash movements (2,867)
Total other changes 60,294
At 31 December 2017 1,796,069
LOAN CAPITAL
2017 2016HK$’000 HK$’000
Subordinated notes, at amortised cost with fair value hedge adjustmentsUS$204 million (2016: US$225 million) fixed rate subordinated note due 2020 (Notes (a) & (c)) 1,615,531 1,792,267US$383 million fixed rate subordinated note due 2027 (Notes (b) & (c)) 2,925,849 -
4,541,380 1,792,267
Notes:
(a) This represented a subordinated note qualifying as tier 2 capital under Basel II accord with face value of US$225,000,000 issued on 5 November 2010 (the “Existing Notes”). The note will mature on 4 November 2020. If at any time on or after 1 January 2013, the note no longer fully qualifies as term subordinated debt for inclusion in Category II – Supplementary Capital of the Bank upon changes to regulatory requirements, the Bank may, at its option and subject to the prior written approval of the HKMA, exercise a change of the status of the note by serving the “Change in Status Notice” to the noteholders. Upon a “Change in Status Notice” becoming effective, the note shall thereafter constitute unsubordinated obligations and the rate of interest on the note shall be reduced from 6% per annum to 5.5% per annum. As “Change in Status Notice” has not been served, the rate of interest on the note remains at 6% per annum. Pursuant to the exchange offer by the Bank, the Bank settled and exchanged US$20,976,000 of the Existing Notes for new tier 2 subordinated note due 2027 (Note(b)). Following the settlement of the exchange offer, US$204,024,000 in aggregate principal amount of the Existing Notes remains outstanding.
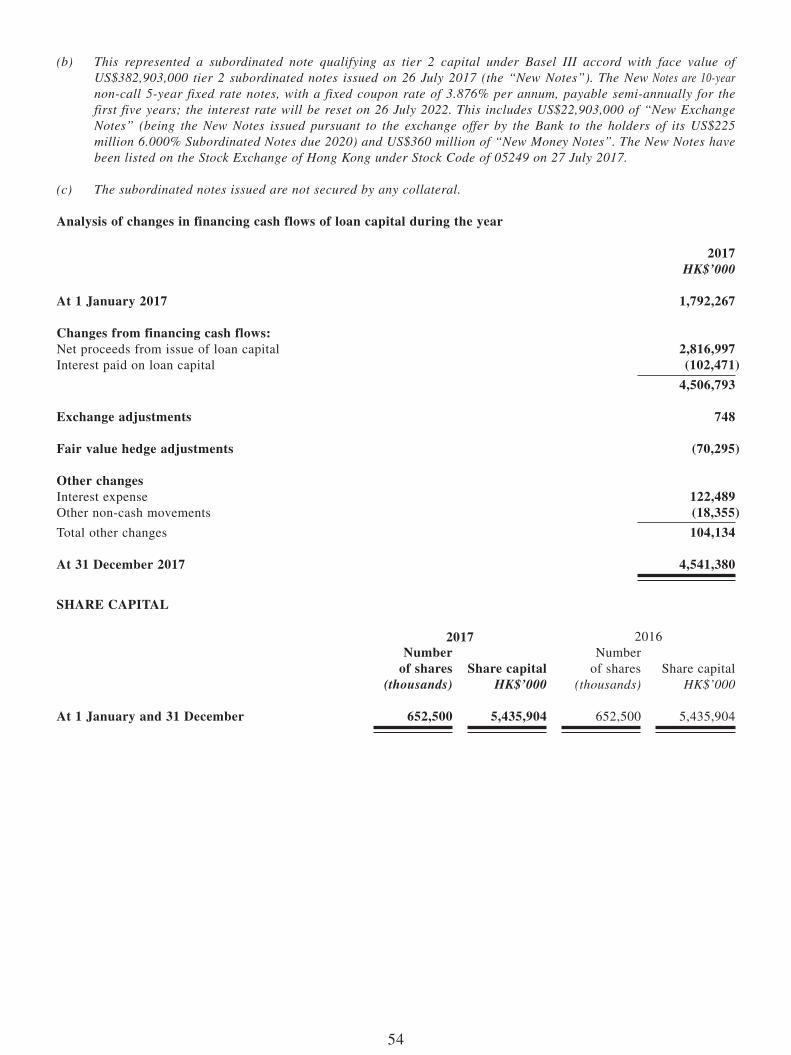
54
(b) This represented a subordinated note qualifying as tier 2 capital under Basel III accord with face value of US$382,903,000 tier 2 subordinated notes issued on 26 July 2017 (the “New Notes”). The New Notes are 10-year non-call 5-year fixed rate notes, with a fixed coupon rate of 3.876% per annum, payable semi-annually for the first five years; the interest rate will be reset on 26 July 2022. This includes US$22,903,000 of “New Exchange Notes” (being the New Notes issued pursuant to the exchange offer by the Bank to the holders of its US$225 million 6.000% Subordinated Notes due 2020) and US$360 million of “New Money Notes”. The New Notes have been listed on the Stock Exchange of Hong Kong under Stock Code of 05249 on 27 July 2017.
(c) The subordinated notes issued are not secured by any collateral.
Analysis of changes in financing cash flows of loan capital during the year
2017HK$’000
At 1 January 2017 1,792,267
Changes from financing cash flows:Net proceeds from issue of loan capital 2,816,997Interest paid on loan capital (102,471)
4,506,793
Exchange adjustments 748
Fair value hedge adjustments (70,295)
Other changesInterest expense 122,489Other non-cash movements (18,355)
Total other changes 104,134
At 31 December 2017 4,541,380
SHARE CAPITAL
2017 2016Number
of shares Share capitalNumber
of shares Share capital(thousands) HK$’000 (thousands) HK$’000
At 1 January and 31 December 652,500 5,435,904 652,500 5,435,904

55
ADDITIONAL EQUITY INSTRUMENTS
2017 2016HK$’000 HK$’000
US$300 million undated non-cumulative subordinated additional tier 1 capital securities 2,312,030 2,312,030
On 25 September 2014, the Bank issued undated non-cumulative subordinated additional tier 1 capital securities (“Additional Tier 1 Capital Securities”) with a face value of US$300 million (equivalent to HK$2,312,030,000 net of related issuance costs). The Additional Tier 1 Capital Securities are undated and bear a 6.50% coupon until the first call date on 25 September 2019. The coupon will be reset every five years if the Additional Tier 1 Capital Securities are not redeemed to a fixed rate equivalent to the then-prevailing five-year US Treasury rate plus 4.628% per annum.
The coupon shall be payable semi-annually. The Bank has the right to cancel coupon payment (subject to the requirement as set out in the terms and conditions of the Additional Tier 1 Capital Securities) and the coupon cancelled shall not be cumulative. However, the Bank is stopped from declaring dividend to its ordinary shareholders unless the next scheduled coupon payment is paid.
The principal of the Additional Tier 1 Capital Securities will be written off up to the amount as directed or agreed with the HKMA if the HKMA notifies the Bank that in the opinion of the HKMA, the Bank would become non-viable if there is no written off of the principal.
The Bank has a call option to redeem all the outstanding capital securities from 25 September 2019 or any subsequent coupon payment date, but subject to restriction as set out in the terms and conditions.
During the year, a distribution of US$19,500,000 (2016: US$19,500,000) (equivalent to HK$151,974,000 (2016: HK$151,425,000)) was paid to the securities holders.
DEFERRED TAxATION
For the purpose of presentation in the statements of financial position, certain deferred tax assets and liabilities have been offset. The following is the analysis of the deferred tax balances for financial reporting purposes:
2017 2016HK$’000 HK$’000
Deferred tax assets – 4,672Deferred tax liabilities (50,136) (13,245)
(50,136) (8,573)
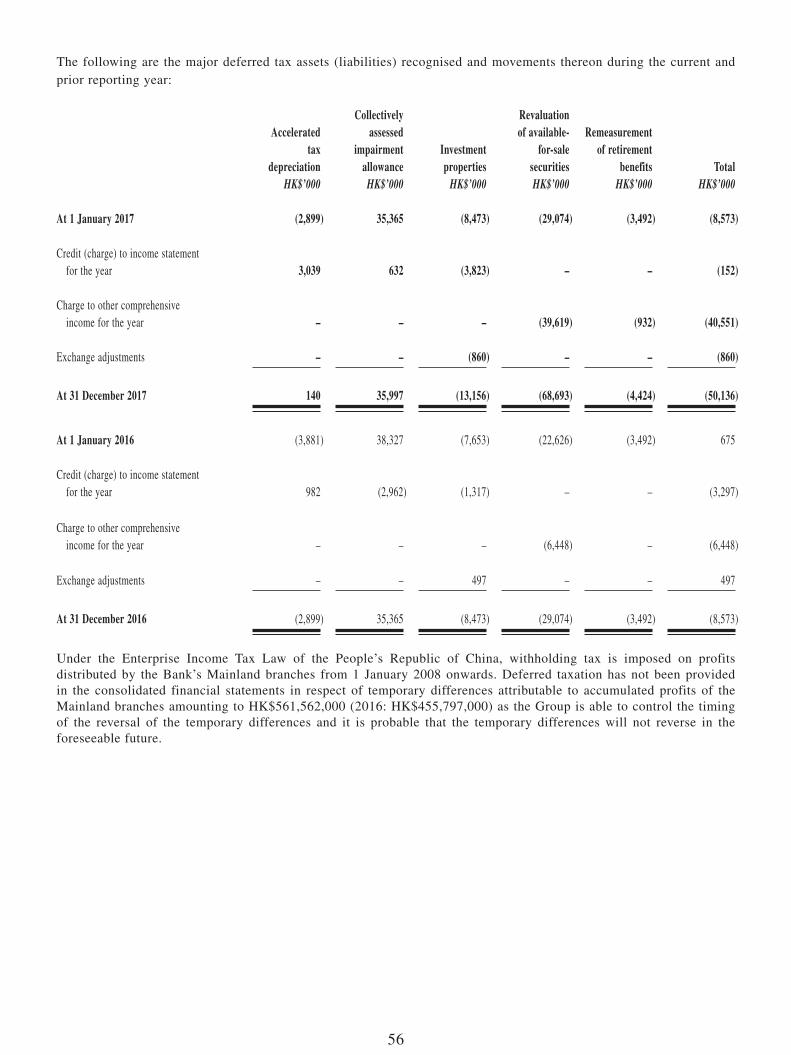
56
The following are the major deferred tax assets (liabilities) recognised and movements thereon during the current and prior reporting year:
Acceleratedtax
depreciation
Collectivelyassessed
impairmentallowance
Investmentproperties
Revaluationof available-
for-salesecurities
Remeasurementof retirement
benefits TotalHK$’000 HK$’000 HK$’000 HK$’000 HK$’000 HK$’000
At 1 January 2017 (2,899) 35,365 (8,473) (29,074) (3,492) (8,573)
Credit (charge) to income statement for the year 3,039 632 (3,823) – – (152)
Charge to other comprehensive income for the year – – – (39,619) (932) (40,551)
Exchange adjustments – – (860) – – (860)
At 31 December 2017 140 35,997 (13,156) (68,693) (4,424) (50,136)
At 1 January 2016 (3,881) 38,327 (7,653) (22,626) (3,492) 675
Credit (charge) to income statement for the year 982 (2,962) (1,317) – – (3,297)
Charge to other comprehensive income for the year – – – (6,448) – (6,448)
Exchange adjustments – – 497 – – 497
At 31 December 2016 (2,899) 35,365 (8,473) (29,074) (3,492) (8,573)
Under the Enterprise Income Tax Law of the People’s Republic of China, withholding tax is imposed on profits distributed by the Bank’s Mainland branches from 1 January 2008 onwards. Deferred taxation has not been provided in the consolidated financial statements in respect of temporary differences attributable to accumulated profits of the Mainland branches amounting to HK$561,562,000 (2016: HK$455,797,000) as the Group is able to control the timing of the reversal of the temporary differences and it is probable that the temporary differences will not reverse in the foreseeable future.
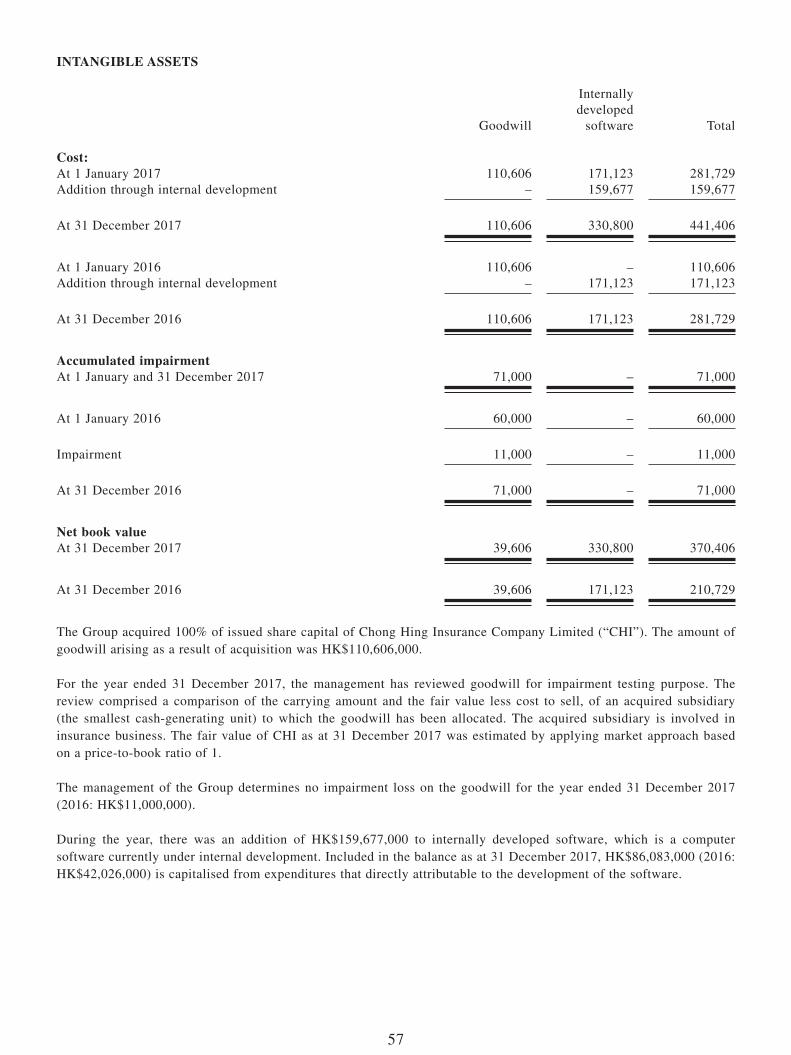
57
INTANgIBLE ASSETS
Goodwill
Internally developed
software Total
Cost:At 1 January 2017 110,606 171,123 281,729Addition through internal development – 159,677 159,677
At 31 December 2017 110,606 330,800 441,406
At 1 January 2016 110,606 – 110,606Addition through internal development – 171,123 171,123
At 31 December 2016 110,606 171,123 281,729
Accumulated impairmentAt 1 January and 31 December 2017 71,000 – 71,000
At 1 January 2016 60,000 – 60,000
Impairment 11,000 – 11,000
At 31 December 2016 71,000 – 71,000
Net book valueAt 31 December 2017 39,606 330,800 370,406
At 31 December 2016 39,606 171,123 210,729
The Group acquired 100% of issued share capital of Chong Hing Insurance Company Limited (“CHI”). The amount of goodwill arising as a result of acquisition was HK$110,606,000.
For the year ended 31 December 2017, the management has reviewed goodwill for impairment testing purpose. The review comprised a comparison of the carrying amount and the fair value less cost to sell, of an acquired subsidiary (the smallest cash-generating unit) to which the goodwill has been allocated. The acquired subsidiary is involved in insurance business. The fair value of CHI as at 31 December 2017 was estimated by applying market approach based on a price-to-book ratio of 1.
The management of the Group determines no impairment loss on the goodwill for the year ended 31 December 2017 (2016: HK$11,000,000).
During the year, there was an addition of HK$159,677,000 to internally developed software, which is a computer software currently under internal development. Included in the balance as at 31 December 2017, HK$86,083,000 (2016: HK$42,026,000) is capitalised from expenditures that directly attributable to the development of the software.
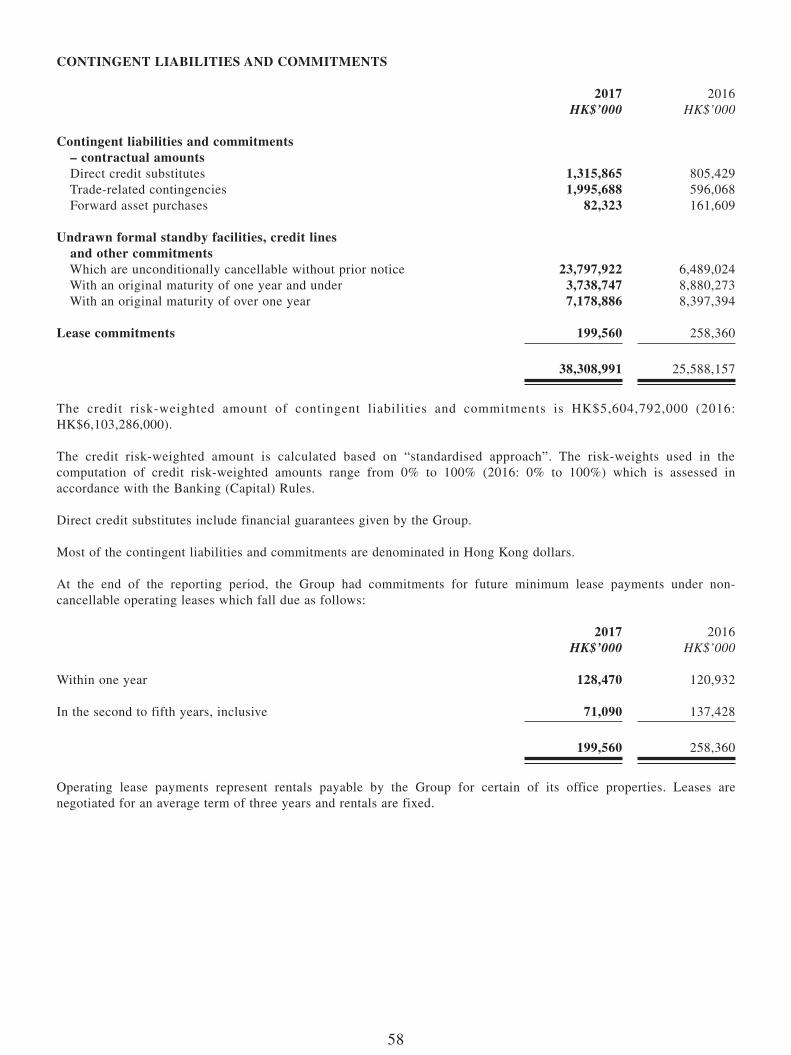
58
CONTINgENT LIABILITIES AND COMMITMENTS
2017 2016HK$’000 HK$’000
Contingent liabilities and commitments – contractual amounts Direct credit substitutes 1,315,865 805,429 Trade-related contingencies 1,995,688 596,068 Forward asset purchases 82,323 161,609
Undrawn formal standby facilities, credit lines and other commitments Which are unconditionally cancellable without prior notice 23,797,922 6,489,024 With an original maturity of one year and under 3,738,747 8,880,273 With an original maturity of over one year 7,178,886 8,397,394
Lease commitments 199,560 258,360
38,308,991 25,588,157
The credit risk-weighted amount of contingent liabilities and commitments is HK$5,604,792,000 (2016: HK$6,103,286,000).
The credit risk-weighted amount is calculated based on “standardised approach”. The risk-weights used in the computation of credit risk-weighted amounts range from 0% to 100% (2016: 0% to 100%) which is assessed in accordance with the Banking (Capital) Rules.
Direct credit substitutes include financial guarantees given by the Group.
Most of the contingent liabilities and commitments are denominated in Hong Kong dollars.
At the end of the reporting period, the Group had commitments for future minimum lease payments under non-cancellable operating leases which fall due as follows:
2017 2016HK$’000 HK$’000
Within one year 128,470 120,932
In the second to fifth years, inclusive 71,090 137,428
199,560 258,360
Operating lease payments represent rentals payable by the Group for certain of its office properties. Leases are negotiated for an average term of three years and rentals are fixed.
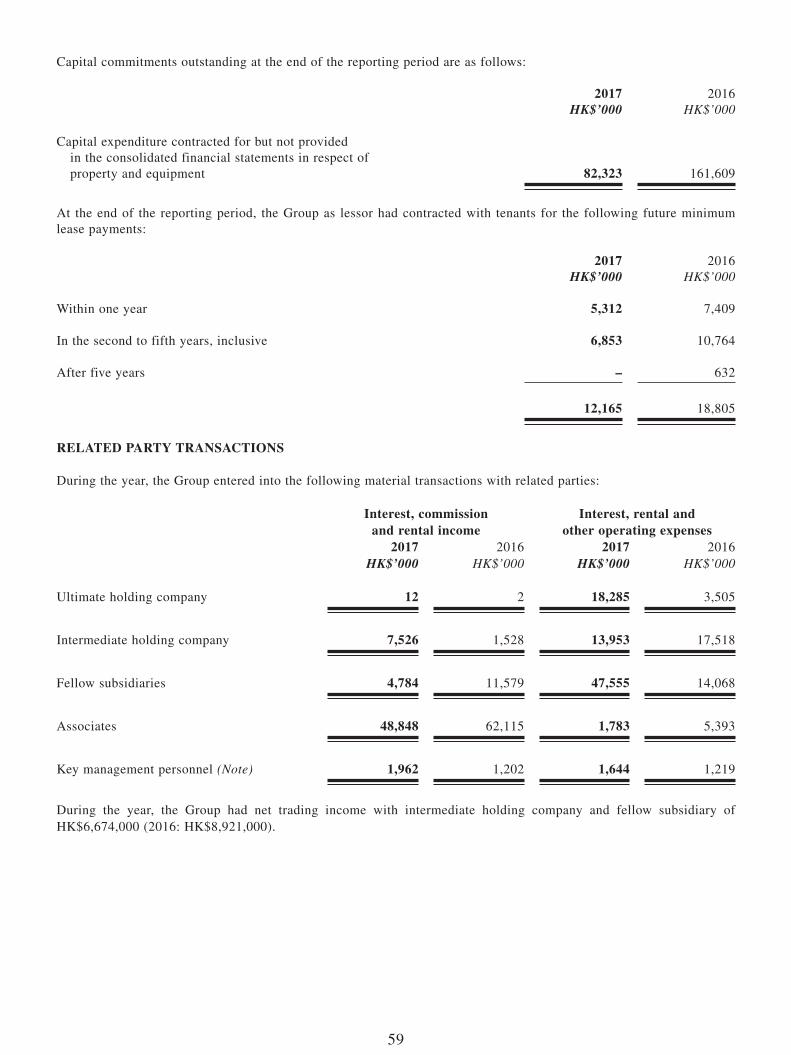
59
Capital commitments outstanding at the end of the reporting period are as follows:
2017 2016HK$’000 HK$’000
Capital expenditure contracted for but not provided in the consolidated financial statements in respect of property and equipment 82,323 161,609
At the end of the reporting period, the Group as lessor had contracted with tenants for the following future minimum lease payments:
2017 2016HK$’000 HK$’000
Within one year 5,312 7,409
In the second to fifth years, inclusive 6,853 10,764
After five years – 632
12,165 18,805
RELATED PARTY TRANSACTIONS
During the year, the Group entered into the following material transactions with related parties:
Interest, commission and rental income
Interest, rental and other operating expenses
2017 2016 2017 2016HK$’000 HK$’000 HK$’000 HK$’000
Ultimate holding company 12 2 18,285 3,505
Intermediate holding company 7,526 1,528 13,953 17,518
Fellow subsidiaries 4,784 11,579 47,555 14,068
Associates 48,848 62,115 1,783 5,393
Key management personnel (Note) 1,962 1,202 1,644 1,219
During the year, the Group had net trading income with intermediate holding company and fellow subsidiary of HK$6,674,000 (2016: HK$8,921,000).
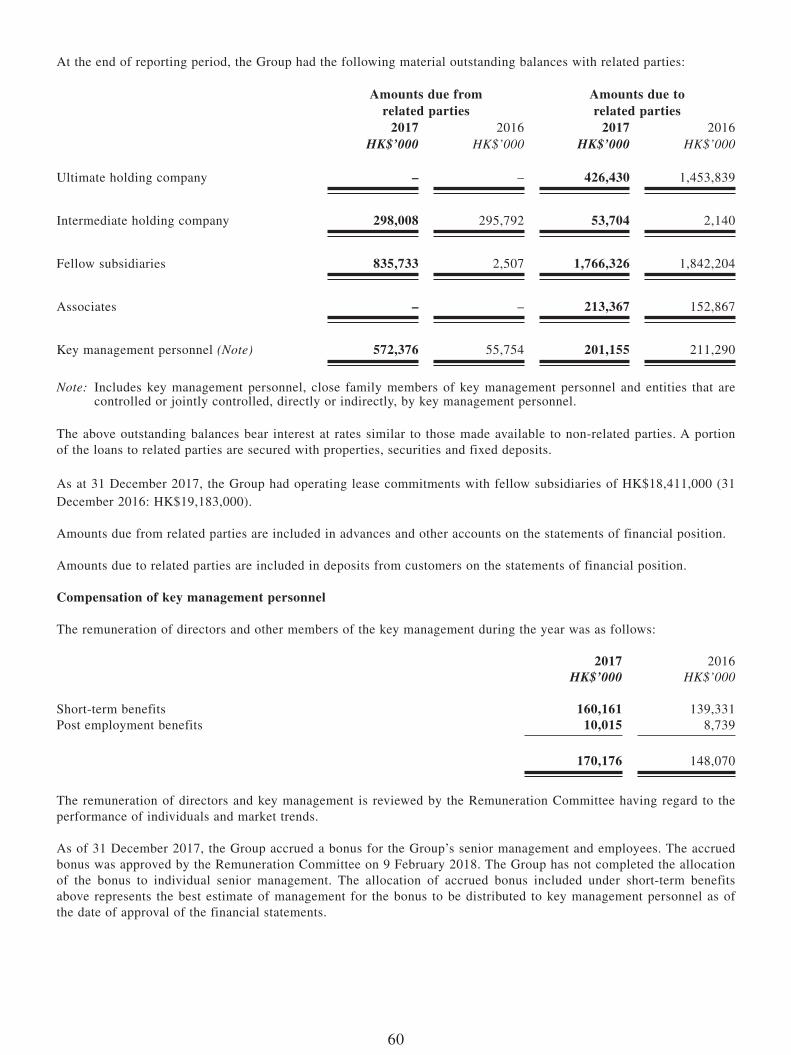
60
At the end of reporting period, the Group had the following material outstanding balances with related parties:
Amounts due from related parties
Amounts due to related parties
2017 2016 2017 2016HK$’000 HK$’000 HK$’000 HK$’000
Ultimate holding company – – 426,430 1,453,839
Intermediate holding company 298,008 295,792 53,704 2,140
Fellow subsidiaries 835,733 2,507 1,766,326 1,842,204
Associates – – 213,367 152,867
Key management personnel (Note) 572,376 55,754 201,155 211,290
Note: Includes key management personnel, close family members of key management personnel and entities that are controlled or jointly controlled, directly or indirectly, by key management personnel.
The above outstanding balances bear interest at rates similar to those made available to non-related parties. A portion of the loans to related parties are secured with properties, securities and fixed deposits.
As at 31 December 2017, the Group had operating lease commitments with fellow subsidiaries of HK$18,411,000 (31 December 2016: HK$19,183,000).
Amounts due from related parties are included in advances and other accounts on the statements of financial position.
Amounts due to related parties are included in deposits from customers on the statements of financial position.
Compensation of key management personnel
The remuneration of directors and other members of the key management during the year was as follows:
2017 2016HK$’000 HK$’000
Short-term benefits 160,161 139,331Post employment benefits 10,015 8,739
170,176 148,070
The remuneration of directors and key management is reviewed by the Remuneration Committee having regard to the performance of individuals and market trends.
As of 31 December 2017, the Group accrued a bonus for the Group’s senior management and employees. The accrued bonus was approved by the Remuneration Committee on 9 February 2018. The Group has not completed the allocation of the bonus to individual senior management. The allocation of accrued bonus included under short-term benefits above represents the best estimate of management for the bonus to be distributed to key management personnel as of the date of approval of the financial statements.
61
COMPLIANCE WITH CORPORATE gOvERNANCE CODE
The Bank is an authorised institution supervised by the HKMA under the Hong Kong Banking Ordinance. The Bank is committed to maintaining high standards of corporate governance, with a view to safeguarding the interests of shareholders, customers, employees and other stakeholders. The Bank has applied the principles in the Corporate Governance Code (the “Code”) set out in Appendix 14 to the Rules Governing the Listing of Securities on The Stock Exchange of Hong Kong Limited (the “Listing Rules”) and the module on “Corporate Governance of Locally Incorporated Authorised Institutions” under the Supervisory Policy Manual issued by the HKMA to its corporate governance structure and practices.
Pursuant to the Code, listed issuer must give considered reasons in its annual report for each deviation from any of the code provisions contained in the Code.
Throughout the year ended 31 December 2017, the Bank complied with all the applicable code provisions set out in the Code, except for deviations from the following code provisions:
1. Code Provision A.4.1 provides that non-executive directors should be appointed for a specific term, subject to re-election. None of the Non-executive Directors of the Bank was appointed for a specific term; however, all of them are subject to retirement by rotation and re-election at the annual general meeting (“AGM”) of the Bank in accordance with the Bank’s Articles of Association.
2. Rule 3.25 of the Listing Rules and Code Provision A.5.1 of the Code provide that the remuneration committee and the nomination committee should comprise a majority of independent non-executive directors. Following the passing away of Mr Chiranakhorn Wanchai, the then Independent Non-executive Director of the Bank, on 23 January 2017, only half of the members of both the Remuneration Committee and the Nomination Committee of the Bank were Independent Non-executive Directors. The Board conducted a holistic review and put in place the new composition of the Remuneration Committee and the Nomination Committee with effect from 16 February 2017 in order to comply with the respective requirements under Rule 3.25 of the Listing Rules and Code Provision A.5.1 of the Code.
COMPLIANCE WITH MODEL CODE
The Bank has adopted its own code for securities transactions by Directors on terms no less exacting than those set out in the Model Code for Securities Transactions by Directors of Listed Issuers (the “Model Code”) under Appendix 10 to the Listing Rules. All the Directors confirmed, following specific enquiry by the Bank, that they have complied with the required standards set out in the Model Code and the Bank’s own code for securities transactions by Directors throughout the year ended 31 December 2017.
62
FINAL DIvIDEND
The Board will recommend at the forthcoming AGM of the Bank to be held on Friday, 18 May 2018 the payment of the final cash dividend for 2017 of HK$0.39 per share (2016: HK$0.39 per share). This final cash dividend, if approved, will be paid on Tuesday, 5 June 2018 to the shareholders whose names appear on the register of members of the Bank on Tuesday, 29 May 2018.
CLOSURE OF REgISTER OF MEMBERS
For the purpose of ascertaining the shareholders who are entitled to attend and vote at the 2018 AGM, the register of members of the Bank will be closed from Monday, 14 May 2018 to Thursday, 17 May 2018 (both days inclusive), during which period no transfer of shares can be registered. In order to qualify for attending and voting at the 2018 AGM, all transfer documents, together with the relevant share certificates, must be lodged for registration with the Bank’s share registrar and transfer office, Computershare Hong Kong Investor Services Limited of Shops 1712-1716, 17th Floor, Hopewell Centre, 183 Queen’s Road East, Wanchai, Hong Kong, not later than 4:30 pm on Friday, 11 May 2018.
In addition, for the purpose of ascertaining the shareholders who are qualified to receive the final cash dividend, the register of members of the Bank will be closed from Friday, 25 May 2018 to Tuesday, 29 May 2018 (both days inclusive), during which period no transfer of shares can be registered. In order to qualify for receiving the 2017 final cash dividend, all transfer documents, together with the relevant share certificates, must be lodged for registration with the Bank’s share registrar and transfer office, Computershare Hong Kong Investor Services Limited of Shops 1712-1716, 17th Floor, Hopewell Centre, 183 Queen’s Road East, Wanchai, Hong Kong, not later than 4:30 pm on Thursday, 24 May 2018.
PURCHASE, SALE OR REDEMPTION OF THE BANK’S LISTED SECURITIES
On 26 July 2017, the Bank completed the issue of US$382,903,000 Tier 2 Subordinated Notes due 2027 (the “New Notes”), which are listed on The Stock Exchange of Hong Kong Limited (Stock Code: 05249). Pursuant to the exchange offer by the Bank to the holders of its US$225,000,000 6.000% Subordinated Notes due 2020 (Stock Code: 04327) (the “Existing Notes”) to exchange their Existing Notes for the New Notes (the “Exchange Offer”), US$22,903,000 out of US$382,903,000 in aggregate principal amount of the New Notes was issued in exchange for US$20,976,000 in aggregate principal amount of the Existing Notes. Following the settlement of the Exchange Offer, US$204,024,000 in aggregate principal amount of the Existing Notes remains outstanding.
Save for the Exchange Offer as disclosed above, neither the Bank nor any of its subsidiaries purchased, sold or redeemed any of the Bank’s listed securities during the year.
63
PUBLICATION OF 2017 FINAL RESULTS AND ANNUAL REPORT
This announcement is published on the websites of the Bank (www.chbank.com) and Hong Kong Exchanges and Clearing Limited (the “HKEX”) (www.hkexnews.hk). The 2017 Annual Report will be available on the websites of the Bank and the HKEX, and the printed copies will be despatched to the shareholders of the Bank, both in April 2018.
OTHER FINANCIAL INFORMATION
The Bank has set up a “Regulatory Disclosures” section on its website (www.chbank.com/en/regulatory-disclosures/index.shtml) to house the information relating to the disclosure of regulatory capital to comply with the Banking (Disclosure) Rules. The “Regulatory Disclosures”, together with the disclosures in the Bank’s Annual Report, contained all the disclosures required by the Banking (Disclosure) Rules issued by the HKMA. The “Regulatory Disclosures” together with the Annual Report for 2017 will be available in April 2018.
By Order of the BoardChong Hing Bank Limited
Lai Wing NgaCompany Secretary
Hong Kong, 29 March 2018
As at the date of this announcement, the Board of the Bank comprises:
• Executive DirectorsMrs Leung Ko May Yee Margaret (Deputy Chairman and Managing Director), Mr Zong Jianxin (Deputy Managing Director and Chief Executive) and Mr Lau Wai Man (Deputy Managing Director);
• Non-executive DirectorsMr Zhang Zhaoxing (Chairman), Mr Zhu Chunxiu, Mr Wang Shuhui, Mr Li Feng and Mr Chow Cheuk Yu Alfred; and
• Independent Non-executive DirectorsMr Cheng Yuk Wo, Mr Ma Chiu Cheung Andrew, Mr Lee Ka Lun and Mr Yu Lup Fat Joseph.