Embed Size (px)
Citation preview

Press Release 4Q 2017 February 22, 2018
Page 1
2017 FOURTH QUARTER AND FULL YEAR RESULTS Mexico City, February 22, 2018, Coca-Cola FEMSA, S.A.B. de C.V. (BMV: KOFL, NYSE: KOF) (“Coca-Cola FEMSA” or the
“Company”), the largest Coca-Cola franchise bottler in the world by sales volume, announces results for the fourth quarter of 2017.
Operational and Financial Highlights
Revenues grew 11.6%, while comparable revenues grew 5.7% for the quarter.
Operating income increased 5.8%, while comparable operating income grew 13.3% during the quarter.
Operating cash flow increased 4.6%, while comparable operating cash flow grew 12.5% for the quarter.
As of December 31, 2017, the Company changed the method for reporting Coca-Cola FEMSA de Venezuela to Fair
Value. Due to this change, a recorded foreign currency translation charge in equity has been reclassified as a non-
cash one-time item to the other non-operative expenses line of the Income Statement in accordance with IFRS. This
resulted in a majority net loss of Ps. 24,245 million and a loss per share of Ps. 11.54 for the quarter. On a comparable
basis, earnings per share were Ps. 1.85 vs. Ps. 1.39 in the same period of the previous year.
Coca-Cola FEMSA de Venezuela will continue operating in Venezuela and its Fair Value will be reported in the
investment in shares line of the Balance Sheet of the Company.
Results Summary
Message from the Chief Executive Officer
“During 2017, we navigated a complex environment to deliver positive results. Guided by our strategic framework, we delivered
revenue and operating income growth of 14.7% and 9.4% respectively. In addition, excluding items impacting comparability, our
majority net income increased 34.7%, resulting in earnings per share of Ps. 6.15.
In Mexico, despite unprecedented external challenges, our operation was able to keep its top-line growth on track, continuing the
digitization of its value chain, while protecting profitability. In Central America, we successfully implemented initiatives to regain volume
growth—positioning our operations for future revenue growth. Furthermore, we remain encouraged by the turnaround of our Brazilian
operation, highlighted by volume growth, profitability improvement, and our successful integration of Vonpar, capturing synergies ahead
of expectations. Finally, in the Philippines, we closed the year strongly, delivering double-digit volume and transaction growth for the
fourth quarter. We enter 2018 fully aware of our markets’ challenges and opportunities. By leveraging our operational and financial
discipline, executing the right strategies, and capitalizing on our transformed capabilities, we renew our commitment to deliver
sustainable profitable growth for years to come.” said John Santa Maria Otazua, Chief Executive Officer of the Company.
Comparable (1)
2017 D% D% 2017 D% D%
Total revenues 55,275 11.6% 5.7% 203,780 14.7% 3.6%
Gross profit 25,063 12.0% 9.2% 91,686 15.1% 6.1%
Operating income 7,584 5.8% 13.3% 26,175 9.4% 6.2%
Operating cash flow (2) 11,310 4.6% 12.5% 39,546 11.4% 5.9%
Net income attributable to equity holders of the company -24,245 (790.9%) 34.5% -12,802 (227.1%) 34.7%
Earnings per share (3) -11.54 32.7% -6.12 33.5%
Expressed in millions of Mexican pesos.
(2) Operating cash flow = operating income + depreciation + amortization & other operative non-cash charges.
(3) 4Q EPS calculated with 2,100.8 million shares outstanding as of December 31 2017. Full Year EPS calculated with 2,091.4 million shares, the weighted average of the Company’s
outstanding shares over the period.
(1) Comparable means, with respect to a year-over-year comparison, the change in a given measure excluding the effects of (i) mergers, acquisitions and divestitures, (ii) translation
effects resulting from exchange rate movements (iii) the results of hyperinflationary economies in both periods, and (iv) includes the results of Coca-Cola FEMSA Philippines Inc., as if the
consolidation had taken place at the beginning of first quarter 2016. From our operations, only Venezuela qualifies as a hyperinflationary economy.
Fourth Quarter Full Year
as Reported Comparable (1) as Reported

Press Release 4Q 2017 February 22, 2018
Page 2
Consolidated results for the fourth quarter Comparable means, with respect to a year-over-year comparison, the change in a given measure excluding the effects of: (i) mergers, acquisitions and divestitures, (ii)
translation effects resulting from exchange rate movements, (iii) the results of hyperinflationary economies in both periods; and (iv) includes the results of Coca-Cola FEMSA
Philippines, Inc., as if the consolidation had taken place at the beginning of first quarter 2016. From our operations, only Venezuela qualifies as a hyperinflationary economy. In
our “as reported” figures, our Venezuelan operation’s results were translated into Mexican pesos using an exchange rate of 22,793.3 bolivars per US dollar.
Comparable figures:
Revenues: Comparable total revenues grew 5.7% in the fourth quarter of 2017 as compared to the same period of 2016, driven by
average price per unit case growth in Mexico and Argentina, coupled with volume growth in Brazil, Central America, the Philippines,
and flat performance in Argentina, partially offset by volume declines in the rest of our operations.
Transactions: Comparable number of transactions increased 3.8%. Our sparkling beverage category grew 4.0%, driven by 4.2%
growth in brand Coca-Cola and its extensions and 3.3% growth in flavors. Our positive performance in brand Coca-Cola was driven
by growth in Central America, Argentina, Brazil, and the Philippines, partially offset by a decline in Mexico and flat performance in
Colombia. Our growth in flavors was driven by Argentina, Brazil, and the Philippines, partially offset by flat performance in Mexico
and declines in Central America and Colombia. Our still beverage category grew 3.0%, driven mainly by the positive performance of
the Philippines and Brazil. Finally, our water category’s transactions increased by 2.5%, driven by growth in Central America, Brazil
and the Philippines, partially offset by declines in the rest of our operations.
Volume: Comparable sales volume grew 1.8% in the fourth quarter of 2017 as compared to the same period in 2016. Our sparkling
beverage portfolio’s volume increased 1.8%, driven by 1.9% growth in brand Coca-Cola and 1.4% growth in flavors. Our growth in
brand Coca-Cola was driven mainly by the performance of Central America, Argentina, Brazil, and the Philippines, while our growth
in flavors was driven mainly by positive performance in the Philippines and even volumes in Mexico, Central America, and Brazil.
Our still beverage category’s volume increased 2.2%, driven by growth in most of our operations, partially offset by a decline in
Colombia. Our personal water portfolio’s volume grew 6.7% due to positive performance in most of our operations. Finally, our bulk
water portfolio’s volume declined 1.9%, driven by a decline in Mexico and Colombia, partially offset by growth in the rest of our
operations.
Gross profit: Comparable gross profit grew 9.2%. Our pricing initiatives, coupled with lower PET and sweetener prices in most of
our operations, offset an unfavorable currency hedging position, higher sweetener and concentrate prices in Mexico, and the
depreciation in the average exchange rate of the Argentine Peso and the Philippine Peso as applied to our U.S. dollar-denominated
raw material costs.
Operating Income: Comparable operating income grew 13.3% for the fourth quarter of 2017 as compared to the same period of
2016.
Operating cash flow: Comparable operating cash flow increased 12.5% in the fourth quarter of 2017.
As reported figures:
Revenues: Total revenues increased 11.6% to Ps. 55,275 million in the fourth quarter of 2017, including the acquisition of Vonpar
in Brazil, which was consolidated in December 2016, and the consolidation of our operation in the Philippines, combined with price
increase in line with or above inflation in key territories such as Mexico and Argentina and supported by volume growth in Central
America, Brazil, the Philippines, and flat performance in Argentina; all despite the negative translation effect resulting from the
depreciation of all of our operating currencies as compared to the Mexican Peso.
Transactions: Reported total number of transactions increased 39.6% to 6,958.3 million in the fourth quarter of 2017 as compared
to the same period in 2016.
Volume: Reported total sales volume increased 21.6% to 1,033.3 million unit cases in the fourth quarter of 2017 as compared to
the same period in 2016.
Gross profit: Gross profit grew 12.0% to Ps. 25,063 million, and gross margin expanded 10 basis points to 45.3%.
(Continued on next page)

Press Release 4Q 2017 February 22, 2018
Page 3
Equity method: The reported share of the profits of associates and joint ventures recorded a loss of Ps. 103 million in the fourth
quarter of 2017, compared to a loss of Ps. 275 million recorded in the fourth quarter of 2016. This is mainly due to: (i) a loss in our
dairy joint venture in Panama and a loss in the joint venture of Jugos del Valle; (ii) the consolidation of Coca-Cola FEMSA
Philippines, Inc., which is no longer included in the equity method as of February 2017; (iii) partially offset by gains in our joint
ventures in Brazil.
Operating Income: Operating income increased 5.8% to Ps. 7,584 million, and operating margin contracted 80 basis points to
13.7%, driven mainly by higher labor costs, higher freight costs, and higher diesel and gasoline prices. Due to the consolidation of
Coca-Cola FEMSA Philippines in February 2017, the results of this operation are not included in our share of the profit of
associates for 2017, as compared to 2016. These effects where partially mitigated by marketing expense efficiencies.
Other non-operative expenses, net: Other non-operative expenses, net, recorded an expense of Ps. 29,090 million, compared to
Ps. 346 million during the fourth quarter of 2016, due mainly to the change in the accounting method for our Venezuela operation to
a Fair Value approach. Due to this change, according to IFRS standards a Ps. 26,123 million non-cash one-time charge has been
reclassified from equity as part of the cumulative translation adjustment within the other comprehensive income to other non-
operative expenses of our income statement.
Comprehensive financing result: Comprehensive financing result in the fourth quarter of 2017 recorded an expense of Ps. 1,084
million, compared to an expense of Ps. 1,211 million in the same period of 2016.
During the fourth quarter of 2017, we recorded an interest expense of Ps. 2,001 million, compared to Ps. 2,095 million in the fourth
quarter of 2016. This decrease was driven by the decrease of short-term interest rates in Brazil; the average exchange rate
depreciation of the Brazilian Real compared to the Mexican Peso as applied to existing Brazilian Real-denominated interest
expense; and the reduction of debt in Argentina. However, these effects were partially offset by: (i) interest rate increase in Mexico;
(ii) additional debt related to the acquisition of Vonpar; and (iii) the interest rate increase from swapping U.S. dollar-denominated
debt to Brazilian Real and Mexican Peso-denominated debt, as part of our strategy to eliminate our U.S. dollar net debt exposure.
In addition, for the fourth quarter, we recorded a foreign exchange gain of Ps. 516 million as compared to a gain of Ps. 66 million in
2016, which was generated as a result of the quarterly depreciation of the Mexican peso as applied to our U.S. dollar-denominated
cash position.
During the fourth quarter of 2017, we recorded a gain on monetary position in inflationary subsidiaries of Ps. 460 million as
compared to Ps. 838 million during the same period of 2016, related to the impact of the devaluation of the Bolivar during the period
in our operation in Venezuela.
Market value on financial instruments recorded a loss of Ps. 310 million as compared to a loss of Ps. 213 million in the fourth
quarter of 2016 due to the quarterly increase in long-term interest rates in Brazil as applied to our floating rate cross-currency
swaps.
Income tax: During the fourth quarter of 2017, income tax paid was Ps. 1,314 million as compared to Ps. 1,929 million in the same
period of 2016. Income tax paid in 2016 was higher in relation to hyperinflationary accounting of our Venezuela operation.
Net income: Consolidated net controlling interest loss is Ps. 24,245 million in the fourth quarter of 2017, as a result of the change
in the accounting method for our Venezuela operation, which resulted in the reclassification of a recorded foreign currency
translation charge in equity as a non-cash one-time item to the other non-operative expenses line of the Income Statement in
accordance with IFRS standards. On a comparable basis, net controlling income grew 34.5% to Ps. 3,894 million for the fourth
quarter of 2017, resulting in comparable earnings per share (EPS) of Ps. 1.85 (Ps. 18.54 per ADS).
Operating cash flow: Operating cash flow grew 4.6% to Ps. 11,310 million, and operating cash flow margin contracted 130 basis
points to 20.5%.

Press Release 4Q 2017 February 22, 2018
Page 4
Balance Sheet (1)
As of December 31, 2017, we had a cash balance of Ps. 18,767 million, including US$307 million denominated in U.S. dollars, an increase of Ps. 8,291 million as compared to December 31, 2016. As of December 31, 2017, total short-term debt was Ps. 12,171 million, and long-term debt was Ps. 71,189 million. Total debt decreased by Ps. 5,549 million, compared to year-end 2016, due mainly to the positive translation effect resulting from the appreciation of the end-of-period exchange rate of the Mexican Peso as applied to our U.S. dollar-denominated debt position and our cash flow generation during the year. Net debt decreased by Ps. 13,840 million compared to year-end 2016.
The weighted average cost of debt for the quarter, including the effect of debt swapped to Brazilian Reals and Mexican Pesos at
floating and fixed rates, was 7.78%, a reduction as compared to the third quarter of 2017 due mainly to the reduction of interest rates in
Brazil. The following charts set forth the Company’s debt profile by currency and interest rate type and by maturity date as of December
31, 2017.
Currency % Total Debt(2) % Interest Rate Floating(2)(3)
Mexican pesos 43.9% 3.2% U.S. dollars 1.4% 0.0% Colombian pesos 3.1% 72.8% Brazilian reals 51.5% 61.6% Argentine pesos 0.1% 0.0%
Debt Maturity Profile
Maturity Date 2018 2019 2020 2021 2022+
% of Total Debt 14.6% 8.6% 12.3% 8.0% 56.5%
(1) See page 18 for detailed information. (2) After giving effect to cross currency swaps. (3) Calculated by weighting each year’s outstanding debt balance mix.
Selected Financial Ratios
FY 2017 FY 2016 D %
Net debt including effect of hedges (1)(3) 68,973 80,043 -13.8% Net debt including effect of hedges / Operating cash flow (1)(3) 1.74 2.26 Operating cash flow/ Interest expense, net (1) 4.99 5.25 Capitalization (2) 39.3% 41.3%
(1) Net debt = total debt - cash (2) Total debt / (long-term debt + shareholders' equity)
(3) After giving effect to cross currency swaps.

Press Release 4Q 2017 February 22, 2018
Page 5
Mexico & Central America Division
(Mexico, Guatemala, Nicaragua, Costa Rica, and Panama) Comparable means, with respect to a year-over-year comparison, the change in a given measure excluding the effects of: (i) mergers, acquisitions and divestitures, (ii)
translation effects resulting from exchange rate movements, (iii) the results of hyperinflationary economies in both periods; and (iv) includes the results of Coca-Cola FEMSA
Philippines, Inc., as if the consolidation had taken place at the beginning of first quarter 2016. From our operations, only Venezuela qualifies as a hyperinflationary economy. In
our “as reported” figures, our Venezuelan operation’s results were translated into Mexican pesos using an exchange rate of 22,793.3 bolivars per US dollar.
Comparable figures:
Revenues: Comparable total revenues from our Mexico and Central America division increased 4.5% in the fourth quarter of 2017,
compared to the same period in 2016, driven by an increase in average price per unit case in Mexico and volume growth in Central
America, partially offset by volume decline in Mexico.
Transactions: Total transactions in our Mexico and Central America division declined 1.8% in the fourth quarter of 2017. Our
sparkling beverage portfolio’s transactions contracted 1.5%, driven mainly by a 2.5% decline in brand Coca-Cola in Mexico, partially
offset by 4.8% growth in Central America. In flavors, our division’s flat performance was driven by even performance in Mexico,
partially offset by a decline in Central America. Our still beverage category’s transactions decreased 3.0% in the division, while our
water transactions, including bulk water, declined 4.3%, driven mainly by a decline in Mexico, partially offset by 3.2% growth in
Central America.
Volume: Total sales volume for the division decreased 1.4% in the fourth quarter of 2017, compared to the same period of 2016.
Our sparkling beverage category’s volume declined 1.3%, driven by a 1.6% decline in brand Coca-Cola and flat performance in
flavors. Our performance in brand Coca-Cola was driven mainly by a 2.5% decline in Mexico, partially offset by 6.8% growth in
Central America, while our performance in flavors was driven by both Mexico and Central America. Our still beverage category’s
volume remained flat, driven by growth in Central America, offset by a slight decline in Mexico. Our personal water portfolio’s
volume declined 1.4%, driven by a decline in Mexico, partially offset by positive performance in Central America. Our bulk water
portfolio’s volume declined 2.6% in the division due to a contraction in Mexico, partially offset by growth in Central America.
Gross profit: Comparable gross profit grew 1.6% in the fourth quarter of 2017 as compared to the same period in 2016. In Mexico,
our pricing initiatives, lower PET prices, and the appreciation of the average exchange rate of the Mexican Peso as applied to U.S.
dollar-denominated raw material costs were offset by the increase of concentrate cost, higher prices of sweeteners, and an
unfavorable currency hedging position. In Central America, lower sweetener and PET prices were offset by price-mix effect and the
depreciation of the average exchange rates of the Costa Rican Colon and the Nicaraguan Cordoba as applied to U.S. dollar-
denominated raw material costs.
Operating income: Comparable operating income in the division decreased 15.1% in the fourth quarter of 2017 as compared to
the same period in 2016.
Operating cash flow: Comparable operating cash flow decreased 3.7% in the fourth quarter of 2017 as compared to the same
period in 2016.
As reported figures:
Revenues: Reported total revenues increased 3.5% in the fourth quarter of 2017 as compared to the same period of 2016.
Gross profit: Reported gross profit increased 0.7% in the fourth quarter of 2017, and gross profit margin reached 47.9%, a gross
margin contraction of 130 basis points.
Operating income: Reported operating income decreased 10.6% in the fourth quarter of 2017, and operating income margin
reached 13.6%, contracting 220 basis points during the period, due mainly to an increase in freight expenses, higher diesel and
gasoline prices in Mexico, and higher labor costs and depreciation in Central America. In addition, due to the consolidation of Coca-
Cola FEMSA Philippines, the results of this operation are not included in the share of the profit of associates for 2017, as compared
to 2016.
Operating cash flow: Reported operating cash flow decreased 4.5% in the fourth quarter of 2017, resulting in a margin contraction
of 170 basis points, reaching 20.9%.
Press Release 4Q 2017 February 22, 2018
Page 6
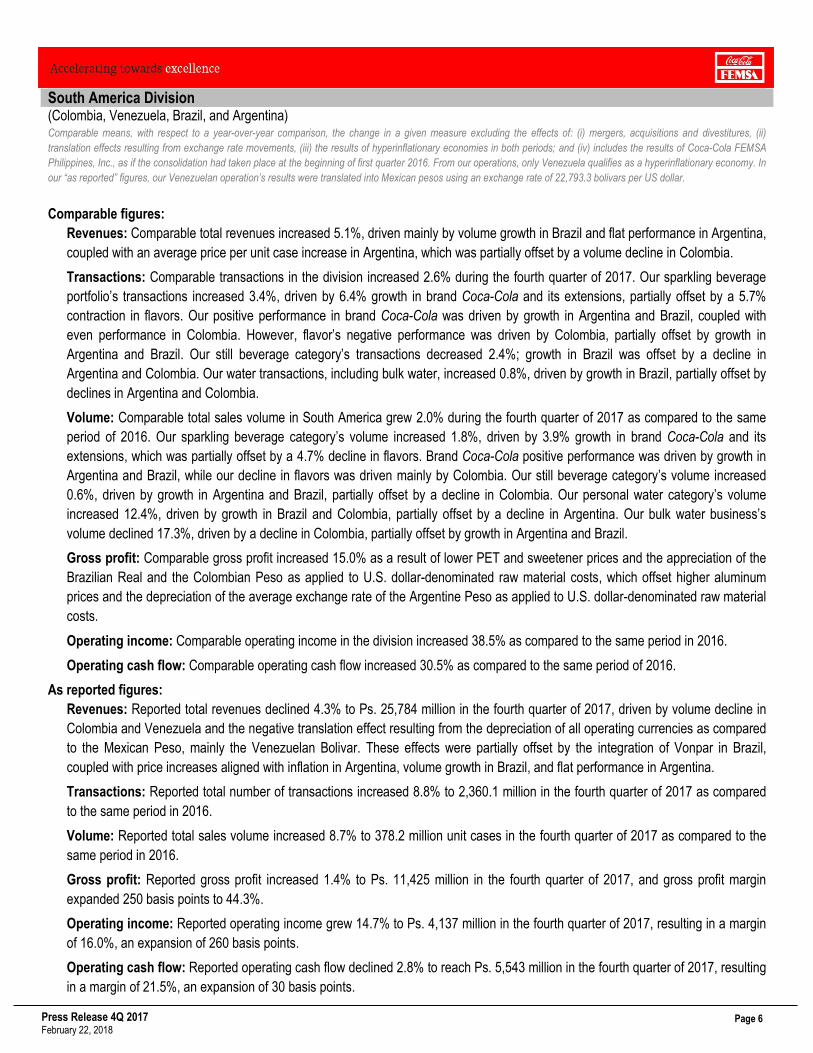
South America Division
(Colombia, Venezuela, Brazil, and Argentina) Comparable means, with respect to a year-over-year comparison, the change in a given measure excluding the effects of: (i) mergers, acquisitions and divestitures, (ii)
translation effects resulting from exchange rate movements, (iii) the results of hyperinflationary economies in both periods; and (iv) includes the results of Coca-Cola FEMSA
Philippines, Inc., as if the consolidation had taken place at the beginning of first quarter 2016. From our operations, only Venezuela qualifies as a hyperinflationary economy. In
our “as reported” figures, our Venezuelan operation’s results were translated into Mexican pesos using an exchange rate of 22,793.3 bolivars per US dollar.
Comparable figures:
Revenues: Comparable total revenues increased 5.1%, driven mainly by volume growth in Brazil and flat performance in Argentina,
coupled with an average price per unit case increase in Argentina, which was partially offset by a volume decline in Colombia.
Transactions: Comparable transactions in the division increased 2.6% during the fourth quarter of 2017. Our sparkling beverage
portfolio’s transactions increased 3.4%, driven by 6.4% growth in brand Coca-Cola and its extensions, partially offset by a 5.7%
contraction in flavors. Our positive performance in brand Coca-Cola was driven by growth in Argentina and Brazil, coupled with
even performance in Colombia. However, flavor’s negative performance was driven by Colombia, partially offset by growth in
Argentina and Brazil. Our still beverage category’s transactions decreased 2.4%; growth in Brazil was offset by a decline in
Argentina and Colombia. Our water transactions, including bulk water, increased 0.8%, driven by growth in Brazil, partially offset by
declines in Argentina and Colombia.
Volume: Comparable total sales volume in South America grew 2.0% during the fourth quarter of 2017 as compared to the same
period of 2016. Our sparkling beverage category’s volume increased 1.8%, driven by 3.9% growth in brand Coca-Cola and its
extensions, which was partially offset by a 4.7% decline in flavors. Brand Coca-Cola positive performance was driven by growth in
Argentina and Brazil, while our decline in flavors was driven mainly by Colombia. Our still beverage category’s volume increased
0.6%, driven by growth in Argentina and Brazil, partially offset by a decline in Colombia. Our personal water category’s volume
increased 12.4%, driven by growth in Brazil and Colombia, partially offset by a decline in Argentina. Our bulk water business’s
volume declined 17.3%, driven by a decline in Colombia, partially offset by growth in Argentina and Brazil.
Gross profit: Comparable gross profit increased 15.0% as a result of lower PET and sweetener prices and the appreciation of the
Brazilian Real and the Colombian Peso as applied to U.S. dollar-denominated raw material costs, which offset higher aluminum
prices and the depreciation of the average exchange rate of the Argentine Peso as applied to U.S. dollar-denominated raw material
costs.
Operating income: Comparable operating income in the division increased 38.5% as compared to the same period in 2016.
Operating cash flow: Comparable operating cash flow increased 30.5% as compared to the same period of 2016.
As reported figures:
Revenues: Reported total revenues declined 4.3% to Ps. 25,784 million in the fourth quarter of 2017, driven by volume decline in
Colombia and Venezuela and the negative translation effect resulting from the depreciation of all operating currencies as compared
to the Mexican Peso, mainly the Venezuelan Bolivar. These effects were partially offset by the integration of Vonpar in Brazil,
coupled with price increases aligned with inflation in Argentina, volume growth in Brazil, and flat performance in Argentina.
Transactions: Reported total number of transactions increased 8.8% to 2,360.1 million in the fourth quarter of 2017 as compared
to the same period in 2016.
Volume: Reported total sales volume increased 8.7% to 378.2 million unit cases in the fourth quarter of 2017 as compared to the
same period in 2016.
Gross profit: Reported gross profit increased 1.4% to Ps. 11,425 million in the fourth quarter of 2017, and gross profit margin
expanded 250 basis points to 44.3%.
Operating income: Reported operating income grew 14.7% to Ps. 4,137 million in the fourth quarter of 2017, resulting in a margin
of 16.0%, an expansion of 260 basis points.
Operating cash flow: Reported operating cash flow declined 2.8% to reach Ps. 5,543 million in the fourth quarter of 2017, resulting
in a margin of 21.5%, an expansion of 30 basis points.

Press Release 4Q 2017 February 22, 2018
Page 7
Asia Division
(The Philippines) Comparable means, with respect to a year-over-year comparison, the change in a given measure excluding the effects of: (i) mergers, acquisitions and divestitures, (ii)
translation effects resulting from exchange rate movements, (iii) the results of hyperinflationary economies in both periods; and (iv) includes the results of Coca-Cola FEMSA
Philippines, Inc., as if the consolidation had taken place at the beginning of first quarter 2016. From our operations, only Venezuela qualifies as a hyperinflationary economy. In
our “as reported” figures, our Venezuelan operation’s results were translated into Mexican pesos using an exchange rate of 22,793.3 bolivars per US dollar.
Comparable figures:
Revenues: Comparable total revenues increased 13.7% during the fourth quarter of 2017, driven by volume growth.
Transactions: Comparable transactions increased 15.3% in the fourth quarter of 2017. Our sparkling beverage portfolio’s
transactions increased 13.8%. Our still beverage category’s transactions increased by 26.9%. Our water transactions, including
bulk water, increased 28.8%.
Volume: Comparable total sales volume increased 12.6% in the fourth quarter of 2017. Our sparkling beverage category’s volume
grew 12.4%, driven by 10.9% growth in brand Coca-Cola and 15.2% growth in flavors. Our still beverage category’s volume,
excluding powders, increased 32.6%. Our personal water category’s volume increased 21.4%. Our bulk water business’s volume
grew 17.6%.
Gross profit: Comparable gross profit increased 25.0% as compared to the same period of 2016, driven mainly by lower prices of
sweeteners and PET resin, partially offset by the devaluation of the Philippine Peso as applied to our U.S. dollar-denominated raw
material costs.
Operating income: Comparable operating income increased to Ps. 265 million during the fourth quarter of 2017.
Operating cash flow: Comparable operating cash flow increased 35.4% as compared to the same period of 2016.
Press Release 4Q 2017 February 22, 2018
Page 8
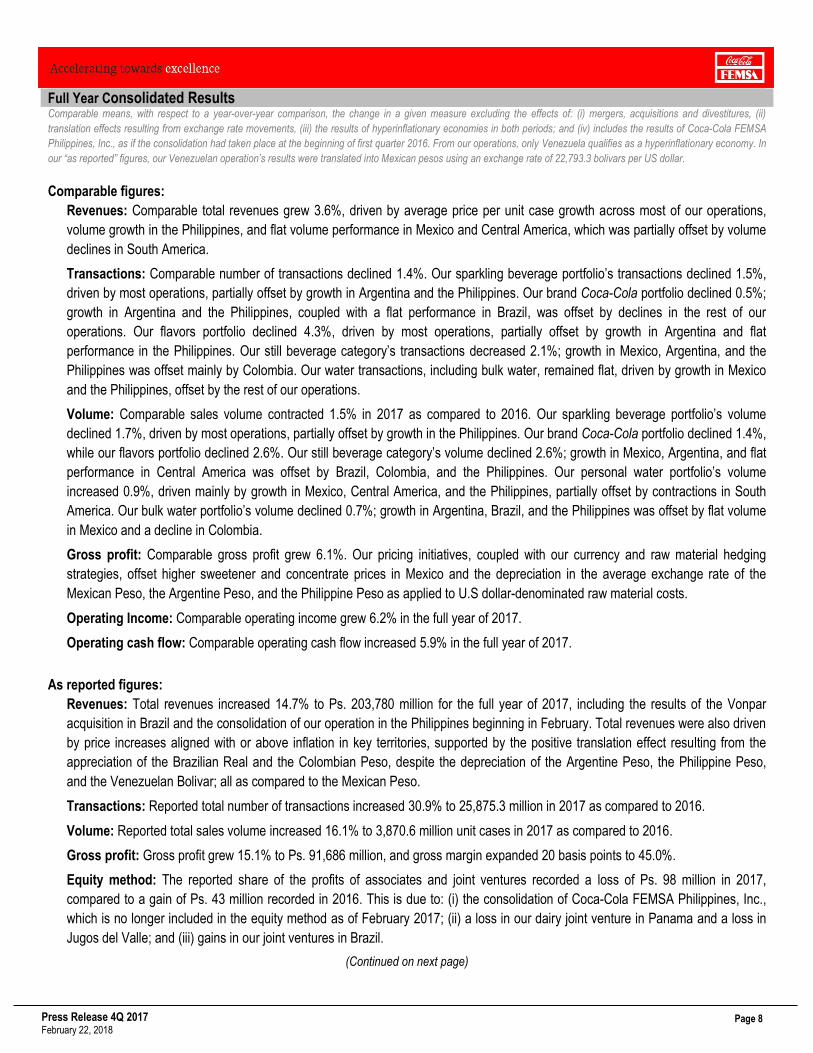
Full Year Consolidated Results Comparable means, with respect to a year-over-year comparison, the change in a given measure excluding the effects of: (i) mergers, acquisitions and divestitures, (ii)
translation effects resulting from exchange rate movements, (iii) the results of hyperinflationary economies in both periods; and (iv) includes the results of Coca-Cola FEMSA
Philippines, Inc., as if the consolidation had taken place at the beginning of first quarter 2016. From our operations, only Venezuela qualifies as a hyperinflationary economy. In
our “as reported” figures, our Venezuelan operation’s results were translated into Mexican pesos using an exchange rate of 22,793.3 bolivars per US dollar.
Comparable figures:
Revenues: Comparable total revenues grew 3.6%, driven by average price per unit case growth across most of our operations,
volume growth in the Philippines, and flat volume performance in Mexico and Central America, which was partially offset by volume
declines in South America.
Transactions: Comparable number of transactions declined 1.4%. Our sparkling beverage portfolio’s transactions declined 1.5%,
driven by most operations, partially offset by growth in Argentina and the Philippines. Our brand Coca-Cola portfolio declined 0.5%;
growth in Argentina and the Philippines, coupled with a flat performance in Brazil, was offset by declines in the rest of our
operations. Our flavors portfolio declined 4.3%, driven by most operations, partially offset by growth in Argentina and flat
performance in the Philippines. Our still beverage category’s transactions decreased 2.1%; growth in Mexico, Argentina, and the
Philippines was offset mainly by Colombia. Our water transactions, including bulk water, remained flat, driven by growth in Mexico
and the Philippines, offset by the rest of our operations.
Volume: Comparable sales volume contracted 1.5% in 2017 as compared to 2016. Our sparkling beverage portfolio’s volume
declined 1.7%, driven by most operations, partially offset by growth in the Philippines. Our brand Coca-Cola portfolio declined 1.4%,
while our flavors portfolio declined 2.6%. Our still beverage category’s volume declined 2.6%; growth in Mexico, Argentina, and flat
performance in Central America was offset by Brazil, Colombia, and the Philippines. Our personal water portfolio’s volume
increased 0.9%, driven mainly by growth in Mexico, Central America, and the Philippines, partially offset by contractions in South
America. Our bulk water portfolio’s volume declined 0.7%; growth in Argentina, Brazil, and the Philippines was offset by flat volume
in Mexico and a decline in Colombia.
Gross profit: Comparable gross profit grew 6.1%. Our pricing initiatives, coupled with our currency and raw material hedging
strategies, offset higher sweetener and concentrate prices in Mexico and the depreciation in the average exchange rate of the
Mexican Peso, the Argentine Peso, and the Philippine Peso as applied to U.S dollar-denominated raw material costs.
Operating Income: Comparable operating income grew 6.2% in the full year of 2017.
Operating cash flow: Comparable operating cash flow increased 5.9% in the full year of 2017.
As reported figures:
Revenues: Total revenues increased 14.7% to Ps. 203,780 million for the full year of 2017, including the results of the Vonpar
acquisition in Brazil and the consolidation of our operation in the Philippines beginning in February. Total revenues were also driven
by price increases aligned with or above inflation in key territories, supported by the positive translation effect resulting from the
appreciation of the Brazilian Real and the Colombian Peso, despite the depreciation of the Argentine Peso, the Philippine Peso,
and the Venezuelan Bolivar; all as compared to the Mexican Peso.
Transactions: Reported total number of transactions increased 30.9% to 25,875.3 million in 2017 as compared to 2016.
Volume: Reported total sales volume increased 16.1% to 3,870.6 million unit cases in 2017 as compared to 2016.
Gross profit: Gross profit grew 15.1% to Ps. 91,686 million, and gross margin expanded 20 basis points to 45.0%.
Equity method: The reported share of the profits of associates and joint ventures recorded a loss of Ps. 98 million in 2017,
compared to a gain of Ps. 43 million recorded in 2016. This is due to: (i) the consolidation of Coca-Cola FEMSA Philippines, Inc.,
which is no longer included in the equity method as of February 2017; (ii) a loss in our dairy joint venture in Panama and a loss in
Jugos del Valle; and (iii) gains in our joint ventures in Brazil.
(Continued on next page)

Press Release 4Q 2017 February 22, 2018
Page 9
Operating Income: Operating income increased 9.4% to Ps. 26,175 million, and operating margin contracted 70 basis points to
12.8%, due mainly to an increase in labor costs, freight, diesel and gasoline prices and other operative expenses, partially offset by
an operative foreign exchange gain.
Other non-operative expenses, net: Other non-operative expenses, net, recorded an expense of Ps. 28,158 million in 2017,
compared to expenses of Ps. 3,489 million during 2016, due mainly to the change in the accounting method for our Venezuela
operation to a Fair Value approach. Due to this change, according to IFRS standards a Ps. 26,123 million non-cash one-time
charge has been reclassified from equity as part of the cumulative translation adjustment within the other comprehensive income to
other non-operative expenses of our income statement. This effect was partially offset by income related to the consolidation of
Coca-Cola FEMSA Philippines.
Comprehensive financing result: Our comprehensive financing result in the full year of 2017 recorded an expense of Ps. 5,276
million, compared to an expense of Ps. 6,080 million in 2016.
During 2017, we recorded an interest expense of Ps. 8,809 million, compared to Ps. 7,471 million in 2016. This increase was driven
by: (i) the interest rate increase from swapping U.S. dollar-denominated debt to Brazilian Real and Mexican Peso-denominated
debt, as part of our strategy to eliminate our U.S, dollar net debt exposure; (ii) additional debt related to the acquisition of Vonpar;
(iii) the average exchange rate appreciation of the Brazilian Real compared to the Mexican Peso as applied to our existing Brazilian
Real-denominated interest expense; and (iv) the interest rate increase in Mexico. These effects were partially offset by the
decrease of interest rates in Brazil and the reduction of debt in Argentina.
In addition, in 2017, we recorded a foreign exchange gain of Ps. 810 million as compared to a loss of Ps. 1,792 million in 2016,
which resulted from the depreciation of the Mexican peso as applied to our U.S. dollar-denominated net debt position in 2016.
During 2017, we recorded a gain on monetary position in inflationary subsidiaries of Ps. 1,591 million as compared to Ps. 2,417
million during 2016 related to our operation in Venezuela.
Market value on financial instruments recorded a gain of Ps. 246 million due to the annual decrease of long-term interest rates in
Brazil as applied to our floating rate cross-currency swaps.
Income tax: During 2017, income tax paid was Ps. 4,554 as compared to Ps. 3,928 million in 2016.
Net income: Consolidated net controlling interest loss was Ps. 12,802 million during 2017, mainly as a result of the change in the
accounting method for our Venezuela operation, which resulted in the reclassification of an accumulated non-cash item as a one-
time charge to the other non-operative expenses line of the Income Statement in accordance with IFRS standards. On a
comparable basis, controlling net income grew 34.7% to Ps. 12,859 million during 2017, resulting in comparable earnings per share
(EPS) of Ps. 6.15 (Ps. 61.49 per ADS).
Operating cash flow: Operating cash flow grew 11.4% to Ps. 39,546 million, and operating cash flow margin contracted 60 basis
points to 19.4%.

Press Release 4Q 2017 February 22, 2018
Page 10
Recent Developments
On February 21, 2018, Coca-Cola FEMSA’s Board of Directors agreed to propose for approval at the annual Shareholders
meeting to be held on March 9, 2017, an ordinary dividend of Ps. 3.35 per share to be paid in two installments in May and
November of 2018.
Conference Call Information
Our fourth quarter 2017 conference call will be held on February 22, 2018, at 11:00 A.M. Eastern Time (10:00 A.M. Mexico City Time).
To participate in the conference call, please dial: Domestic U.S.: 888-318-7469 or International: 719-457-2695. Participant code:
6702196. We invite investors to listen to the live audio cast of the conference call on the Company’s website, www.coca-
colafemsa.com. If you are unable to participate live, the conference call audio will be available at www.coca-colafemsa.com.
Mexican Stock Exchange Quarterly Filing
Coca-Cola FEMSA encourages the reader to refer to our quarterly filing to the Mexican Stock Exchange (Bolsa Mexicana de Valores or
BMV) for more detailed information. This filing contains a detailed cash flow statement and selected notes to the financial statements,
including segment information. This filing is available at www.bmv.com.mx in the Información Financiera section for Coca-Cola FEMSA
(KOF) and on our corporate website at www.coca-colafemsa.com/inversionistas/registros-bmv.

Press Release 4Q 2017 February 22, 2018
Page 11
Additional Information
This news release may contain forward-looking statements concerning Coca-Cola FEMSA’s future performance, which should be
considered as good faith estimates by Coca-Cola FEMSA. These forward-looking statements reflect management’s expectations and
are based upon currently available data. Actual results are subject to future events and uncertainties, many of which are outside Coca-
Cola FEMSA’s control, which could materially impact the Company’s actual performance. References herein to “US$” are to United
States dollars. This news release contains translations of certain Mexican peso amounts into U.S. dollars for the convenience of the
reader. These translations should not be construed as representations that Mexican peso amounts actually represent such U.S. dollar
amounts or could be converted into U.S. dollars at the rate indicated.
All the financial information presented in this report was prepared under International Financial Reporting Standards (IFRS).
In an effort to provide our readers with a more useful representation of our company's underlying financial and operating performance,
we are including the term “Comparable.” This means, with respect to a year-over-year comparison, the change in a given measure
excluding the effects of: (i) mergers, acquisitions and divestitures, (ii) translation effects resulting from exchange rate movements, (iii)
the results of hyperinflationary economies in both periods, and (iv) includes the results of Coca-Cola FEMSA Philippines, Inc., as if the
consolidation had taken place at the beginning of the first quarter of 2016. Currently, the only operation that qualifies as a
hyperinflationary economy is Venezuela. In preparing this measure, management has used its best judgment, estimates, and
assumptions in order to maintain comparability.
As a result of additional KOF L shares issued in May 2017, full year earnings per share were computed based on 2,091.4 million
shares, the weighted average outstanding shares over the period. At the end of December 2017, total outstanding shares were 2,100.8
million shares (each ADS represents 10 local shares).
For reporting purposes, all corporate expenses, including the equity method recorded from our stake of the results of Coca-Cola
FEMSA Philippines, Inc., were included in the results of the Mexico and Central America division. Starting on February 2013 and
ending on January 2017, we incorporated our stake of the results of Coca-Cola FEMSA Philippines, Inc. through the equity method.
About the Company
Stock listing information: Mexican Stock Exchange, Ticker: KOFL | NYSE (ADR), Ticker: KOF | Ratio of KOF L to KOF = 10:1
Coca-Cola FEMSA, S.A.B. de C.V. is the largest Coca-Cola franchise bottler in the world by sales volume. The company produces and
distributes trademark beverages of The Coca-Cola Company, offering a wide portfolio of 154 brands to more than 375 million
consumers daily. With over 100 thousand employees, the company markets and sells approximately 4 billion unit cases through 2.8
million points of sale a year. Operating 66 manufacturing plants and 328 distribution centers, Coca-Cola FEMSA is committed to
generating economic, social, and environmental value for all of its stakeholders across the value chain. The company is a member of
the Dow Jones Sustainability Emerging Markets Index, FTSE4Good Emerging Index, and the Mexican Stock Exchange’s IPC and
Social Responsibility and Sustainability Indices, among other indexes. Its operations encompass franchise territories in Mexico, Brazil,
Colombia, Argentina, and Guatemala and, nationwide, in the Philippines, Venezuela, Nicaragua, Costa Rica, and Panama. For more
information, please visit www.coca-colafemsa.com.
For additional information or inquiries, contact the Investor Relations team:
Maria Dyla Castro | [email protected] | (5255) 1519-5186
Jorge Collazo | [email protected] | (5255) 1519-5218
Tania Ramírez | [email protected] | (5255) 1519-5013
(7 pages of tables to follow)

Press Release 4Q 2017 February 22, 2018
Page 12
Quarter - Consolidated Income StatementExpressed in millions of Mexican pesos
(1)
4Q 17 % Rev 4Q 16 % RevD %
Reported
D %
Comparable (8)
Transactions (million transactions) 6,958.3 4,982.9 39.6% 3.8%
Volume (million unit cases) (2) 1,033.3 849.9 21.6% 1.8%
Average price per unit case (2) 49.57 54.41 -8.9%
Net revenues 55,136 49,229 12.0%
Other operating revenues 139 304 -54.1%
Total revenues (3) 55,275 100.0% 49,533 100.0% 11.6% 5.7%
Cost of goods sold 30,212 54.7% 27,146 54.8% 11.3%
Gross profit 25,063 45.3% 22,388 45.2% 12.0% 9.2%
Operating expenses 16,865 30.5% 14,757 29.8% 14.3%
Other operative expenses, net 512 0.9% 188 0.4% 172.4%
Operative equity method (gain) loss in associates(4) 103 0.2% 275 0.6% -62.7%
Operating income (5) 7,584 13.7% 7,167 14.5% 5.8% 13.3%
Other non operative expenses, net 29,090 346 8300.6%
Non Operative equity method (gain) loss in associates(6) (92) (33) 178.1%
Interest expense 2,001 2,095 -4.5%
Interest income 251 192 30.8%
Interest expense, net 1,750 1,903 -8.0%
Foreign exchange loss (gain) (516) (66) 682.3%
Loss (gain) on monetary position in inflationary subsidiries (460) (838) -45.1%
Market value (gain) loss on financial instruments 310 213 45.9%
Comprehensive financing result 1,084 1,211 -10.5%
Income before taxes (22,498) 5,643 -498.7%
Income taxes 1,314 1,929 -31.9%
Consolidated net income (23,812) 3,714 -741.1%
Net income attributable to equity holders of the company (24,245) -43.9% 3,509 7.1% -790.9%
Non-controlling interest 434 205 111.8%
Operating income (5)
7,584 13.7% 7,167 14.5% 5.8%
Depreciation 2,791 2,072 34.7%
Amortization and other operative non-cash charges 934 1,573 -40.6%
Operating cash flow (5)(7)
11,310 20.5% 10,812 21.8% 4.6% 12.5%
CAPEX 4,853 5,164
(1) Except volume and average price per unit case figures.
(2) Sales volume and average price per unit case exclude beer results.
(4) Includes equity method in Jugos del Valle, Leao Alimentos, Estrella Azul, among others. For the 4Q16 includes Coca-Cola FEMSA Philippines, Inc.
(5) The operating income and operative cash flow lines are presented as non-gaap measures for the convenience of the reader.
(6) Includes equity method in PIASA, IEQSA, Beta San Miguel, IMER and KSP Participacoes among others.
(7) Operative cash flow = operating income + depreciation, amortization & other operative non-cash charges.
(8) Comparable means, with respect to a year-over-year comparison, the change in a given measure excluding the effects of (i) mergers, acquisitions and divestitures, (ii) translation effects resulting from exchange rate
movements (iii) the results of hyperinflationary economies in both periods, and (iv) includes the results of Coca-Cola FEMSA Philippines Inc, as if the consolidation had taken place at the beginning of first quarter 2016.
From our operations, only Venezuela qualifies as a hyperinflationary economy.
(3) Includes total revenues of Ps. 20,044 million from our Mexican operation, Ps. 17,017 million from our Brazilian operation, Ps. 3,708 million from our Colombian operation, Ps. 4,290 million from our
Argentine operation, and Ps. 6,107 million from our Philippines operation for the fourth quarter of 2017; and Ps. 19,076 million from our Mexican operation, Ps. 14,889 million from our Brazilian operation, Ps.
4,264 from our Colombian operation, and Ps. 4,128 million from our Argentine operation for the same period of the previous year. Total Revenues includes Beer revenues in Brazil of Ps. 3,913 million for the
fourth quarter of 2017 and Ps. 2,988 million for the same period of the previous year.

Press Release 4Q 2017 February 22, 2018
Page 13
YTD - Consolidated Income StatementExpressed in millions of Mexican pesos
(1)
2017 % Rev 2016 % RevD %
Reported
D %
Comparable (8)
Transactions (million transactions) 25,875.3 19,774.4 30.9% -1.4%
Volume (million unit cases) (2) 3,870.6 3,334.0 16.1% -1.5%
Average price per unit case (2) 49.29 50.75 -2.9%
Net revenues 203,374 177,082 14.8%
Other operating revenues 406 636 -36.2%
Total revenues (3) 203,780 100.0% 177,718 100.0% 14.7% 3.6%
Cost of goods sold 112,094 55.0% 98,056 55.2% 14.3%
Gross profit 91,686 45.0% 79,662 44.8% 15.1% 6.1%
Operating expenses 64,910 31.9% 55,462 31.2% 17.0%
Other operative expenses, net 503 0.2% 323 0.2% 55.9%
Operative equity method (gain) loss in associates(4) 98 0.0% (43) -0.0% -326.0%
Operating income (5) 26,175 12.8% 23,920 13.5% 9.4% 6.2%
Other non operative expenses, net 28,158 3,489 707.1%
Non Operative equity method (gain) loss in associates(6) (158) (104) 51.7%
Interest expense 8,809 7,471 17.9%
Interest income 887 715 24.1%
Interest expense, net 7,922 6,756 17.3%
Foreign exchange loss (gain) (810) 1,792 -145.2%
Loss (gain) on monetary position in inflationary subsidiries (1,591) (2,417) -34.2%
Market value (gain) loss on financial instruments (246) (51) 385.1%
Comprehensive financing result 5,276 6,080 -13.2%
Income before taxes (7,101) 14,455 -149.1%
Income taxes 4,554 3,928 15.9%
Consolidated net income (11,654) 10,527 -210.7%
Net income attributable to equity holders of the company (12,802) 6.3% 10,070 5.7% -227.1%
Non-controlling interest 1,148 457 151.3%
Operating income (5)
26,175 12.8% 23,920 13.5% 9.4%
Depreciation 10,216 7,579 34.8%
Amortization and other operative non-cash charges 3,155 3,996 -21.0%
Operating cash flow (5)(7)
39,546 19.4% 35,495 20.0% 11.4% 5.9%
CAPEX 14,612 12,391
(1) Except volume and average price per unit case figures.
(2) Sales volume and average price per unit case exclude beer results.
(4) Includes equity method in Jugos del Valle, Leao Alimentos, Estrella Azul, one month of 2017 and twelve months of 2016 from Coca-Cola FEMSA Philippines, Inc., among others.
(5) The operating income and operative cash flow lines are presented as non-gaap measures for the convenience of the reader.
(6) Includes equity method in PIASA, IEQSA, Beta San Miguel, IMER and KSP Participacoes among others.
(7) Operative cash flow = operating income + depreciation, amortization & other operative non-cash charges.
(3) Includes total revenues of Ps. 79,850 million from our Mexican operation, Ps. 58,518 million from our Brazilian operation, Ps. 14,222 million from our Colombian operation, and Ps. 13,869 million from our
Argentine operation for 2017 and Ps. 20,524 for our operation in the Philippines from February to December 2017; Ps. 74,413 million from our Mexican operation, Ps. 43,900 million from our Brazilian
operation, Ps. 15,120 from our Colombian operation, and Ps. 12,273 million from our Argentine operation for the same period of the previous year. Total Revenues includes Beer revenues in Brazil of Ps. 12,608
million for 2017 and Ps. 7,887 million for the previous year.
(8) Comparable means, with respect to a year-over-year comparison, the change in a given measure excluding the effects of (i) mergers, acquisitions and divestitures, (ii) translation effects resulting from exchange rate
movements (iii) the results of hyperinflationary economies in both periods, and (iv) includes the results of Coca-Cola FEMSA Philippines Inc, as if the consolidation had taken place at the beginning of first quarter 2016.
From our operations, only Venezuela qualifies as a hyperinflationary economy.

Press Release 4Q 2017 February 22, 2018
Page 14
Mexico & Central America DivisionExpressed in millions of Mexican pesos
(1)
Quarterly information
4Q 17 % Rev 4Q 16 % RevD %
Reported
D %
Comparable(6)
Transactions (million transactions) 2,763.9 2,815.2 -1.8% -1.8%
Volume (million unit cases) 495.1 502.2 -1.4% -1.4%
Average price per unit case 47.16 44.83 5.2%
Net revenues 23,347 22,511
Other operating revenues 37 81
Total revenues (2) 23,384 100.0% 22,593 100.0% 3.5% 4.5%
Cost of goods sold 12,181 52.1% 11,471 50.8%
Gross profit 11,203 47.9% 11,122 49.2% 0.7% 1.6%
Operating expenses 7,680 32.8% 7,175 31.8%
Other operative expenses, net 215 0.9% 140 0.6%
Operative equity method (gain) loss in associates (3)
126 0.5% 245 1.1%
Operating income (4) 3,182 13.6% 3,561 15.8% -10.6% -15.1%
Depreciation, amortization & other operative non-cash charges 1,695 7.3% 1,547 6.8%
Operating cash flow (4)(5) 4,877 20.9% 5,108 22.6% -4.5% -3.7%
Accumulated information
2017 % Rev 2016 % RevD %
Reported
D %
Comparable(6)
Transactions (million transactions) 11,231.7 11,382.1 -1.3% -1.3%
Volume (million unit cases) 2,017.9 2,025.6 -0.4% -0.4%
Average price per unit case 45.87 43.17 6.3%
Net revenues 92,565 87,438
Other operating revenues 77 120
Total revenues (2) 92,643 100.0% 87,558 100.0% 5.8% 5.8%
Cost of goods sold 47,537 51.3% 43,989 50.2%
Gross profit 45,106 48.7% 43,569 49.8% 3.5% 3.5%
Operating expenses 30,731 33.2% 28,569 32.6%
Other operative expenses, net 180 0.2% 330 0.4%
Operative equity method (gain) loss in associates (3) 221 0.2% (55) -0.1%
Operating income (4) 13,975 15.1% 14,725 16.8% -5.1% -4.7%
Depreciation, amortization & other operative non-cash charges 5,812 6.3% 5,174 5.9%
Operating cash flow (4)(5) 19,788 21.4% 19,899 22.7% -0.6% -0.6%
(1) Except volume and average price per unit case figures.
(2) For the quarter: Includes total revenues of Ps. 20,044 million from our Mexican operation for the fourth quarter of 2017 and 19,076 for the same period of the previous year
FY information: Includes total revenues of Ps. 79,850 million from our Mexican operation for 2017 and 74,413 for the same period of the previous year
(4) The operating income and operative cash flow lines are presented as non-gaap measures for the convenience of the reader.
(5) Operative cash flow = operating income + depreciation, amortization & other operative non-cash charges.
(6) Comparable means, with respect to a year-over-year comparison, the change in a given measure excluding the effects of (i) mergers, acquisitions and divestitures, (ii) translation effects
resulting from exchange rate movements (iii) the results of hyperinflationary economies in both periods, and (iv) includes the results of Coca-Cola FEMSA Philippines Inc, as if the
consolidation had taken place at the beginning of first quarter 2016. From our operations, only Venezuela qualifies as a hyperinflationary economy.
(3) For the quarter: Includes equity method in Jugos del Valle, Estrella Azul, among others.
FY information: Includes Jugos del Valle, Estrella Azul, one month of 2017 and twelve months of 2016 of Coca-Cola FEMSA Philippines, Inc., among others.

Press Release 4Q 2017 February 22, 2018
Page 15
South America DivisionExpressed in millions of Mexican pesos
(1)
Quarterly information
4Q 17 % Rev 4Q 16 % RevD %
Reported
D %
Comparable(7)
Transactions (million transactions) 2,360.1 2,167.7 8.8% 2.6%
Volume (million unit cases) (2) 378.2 347.7 8.7% 2.0%
Average price per unit case (2) 57.56 68.24 -15.6%
Net revenues 25,682 26,718
Other operating revenues 103 222
Total revenues (3) 25,784 100.0% 26,940 100.0% -4.3% 5.1%
Cost of goods sold 14,359 55.7% 15,675 58.2%
Gross profit 11,425 44.3% 11,266 41.8% 1.4% 15.0%
Operating expenses 7,098 27.5% 7,582 28.1%
Other operative expenses, net 214 0.8% 48 0.2%
Operative equity method (gain) loss in associates (4) (24) -0.1% 30 0.1%
Operating income (5) 4,137 16.0% 3,606 13.4% 14.7% 38.5%
Depreciation, amortization & other operative non-cash charges 1,407 5.5% 2,098 7.8%
Operating cash flow (5)(6) 5,543 21.5% 5,704 21.2% -2.8% 30.5%
Accumulated information
2017 % Rev 2016 % RevD %
Reported
D %
Comparable(7)
Transactions (million transactions) 8,365.1 8,392.3 -0.3% -6.2%
Volume (million unit cases) (2) 1,300.2 1,308.4 -0.7% -6.1%
Average price per unit case (2) 59.77 62.49 -4.4%
Net revenues 90,285 89,644
Other operating revenues 329 516
Total revenues (3) 90,613 100.0% 90,160 100.0% 0.5% 1.5%
Cost of goods sold 52,212 57.6% 54,067 60.0%
Gross profit 38,401 42.4% 36,093 40.0% 6.4% 9.2%
Operating expenses 27,315 30.1% 26,893 29.8%
Other operative expenses, net 189 0.2% (7) -0.0%
Operative equity method (gain) loss in associates (4) (123) -0.1% 12 0.0%
Operating income (5) 11,020 12.2% 9,196 10.2% 19.8% 17.9%
Depreciation, amortization & other operative non-cash charges 5,483 6.1% 6,401 7.1%
Operating cash flow (5)(6) 16,504 18.2% 15,596 17.3% 5.8% 13.7%
(1) Except volume and average price per unit case figures.
(2) Sales volume and average price per unit case exclude beer results.
(4) Includes equity method in Leao Alimentos, Verde Campo, among others.
(5) The operating income and operative cash flow lines are presented as non-gaap measures for the convenience of the reader.
(6) Operative cash flow = operating income + depreciation, amortization & other operative non-cash charges.
(7) Comparable means, with respect to a year-over-year comparison, the change in a given measure excluding the effects of (i) mergers, acquisitions and divestitures, (ii) translation effects
resulting from exchange rate movements (iii) the results of hyperinflationary economies in both periods, and (iv) includes the results of Coca-Cola FEMSA Philippines Inc, as if the
consolidation had taken place at the beginning of first quarter 2016. From our operations, only Venezuela qualifies as a hyperinflationary economy.
(3) Q uarter information: Includes total revenues of Ps. 17,017 million from our Brazilian operation, Ps. 3,708 million from our Colombian operation, and Ps. 4,290 million from our
Argentine operation for the fourth quarter of 2017; and Ps. 14,889 million from our Brazilian operation, Ps. 4,264 from our Colombian operation, and Ps. 4,128 million from our Argentine
operation for the same period of the previous year. Total Revenues includes Beer revenues in Brazil of Ps. 3,913 million for the fourth quarter of 2017 and Ps. 2,988 million for the same
period of the previous year.
(3) Full Year information: Includes total revenues of Ps. 58,518 million from our Brazilian operation, Ps. 14,222 million from our Colombian operation, and Ps. 13,869 million from our
Argentine operation for 2017; and Ps. 43,900 million from our Brazilian operation, Ps. 15,120 from our Colombian operation, and Ps. 12,273 million from our Argentine operation for the
previous year. Total Revenues includes Beer revenues in Brazil of Ps. 12,608 million for 2017 and Ps. 7,887 million for the previous year.

Press Release 4Q 2017 February 22, 2018
Page 16
Venezuela OperationExpressed in millions of Mexican pesos
(1)
Quarterly information
4Q 17 % Rev 4Q 16 % RevD %
Reported
Transactions (million transactions) 122.9 137.3 -10.5%
Volume (million unit cases) 19.5 23.6 -17.2%
Average price per unit case 39.42 155.29 -74.6%
Net revenues 769 3,660
Other operating revenues - -
Total revenues 769 100.0% 3,660 100.0% -79.0%
Cost of goods sold 771 100.2% 2,056 56.2%
Gross profit (1) -0.2% 1,603 43.8% -100.1%
Operating expenses 326 42.4% 991 27.1%
Other operative expenses, net 30 3.9% 58 1.6%
Operating income (357) -46.4% 554 15.1% -164.4%
Depreciation, amortization & other operative non-cash charges 461 59.9% 1,183 32.3%
Operating cash flow (2) 104 13.5% 1,737 47.5% -94.0%
Accumulated information
2017 % Rev 2016 % RevD %
Reported
Transactions (million transactions) 441.0 772.6 -42.9%
Volume (million unit cases) 64.2 143.1 -55.1%
Average price per unit case 62.34 131.82 -52.7%
Net revenues 4,005 18,868
Other operating revenues - -
Total revenues 4,005 100.0% 18,868 100.0% -78.8%
Cost of goods sold 3,360 83.9% 12,037 63.8%
Gross profit 645 16.1% 6,830 36.2% -90.6%
Operating expenses 1,890 47.2% 5,849 31.0%
Other operative expenses, net 18 0.5% 69 0.4%
Operating income (1,263) -31.5% 913 4.8% -238.4%
Depreciation, amortization & other operative non-cash charges 1,828 45.7% 3,262 17.3%
Operating cash flow (2) 566 14.1% 4,174 22.1% -86.5%
(1) Except volume and average price per unit case figures.
(2) Operative cash flow = operating income + depreciation, amortization & other operative non-cash charges.

Press Release 4Q 2017 February 22, 2018
Page 17
Asia DivisionExpressed in millions of Mexican pesos
(1)
Quarterly information
4Q 17 % RevD %
Comparable(4)
Transactions (million transactions) 1,834.3 15.3%
Volume (million unit cases) (2) 160.1 12.6%
Average price per unit case (2) 38.15
Net revenues 6,107
Other operating revenues -
Total revenues (3) 6,107 100.0% 13.7%
Cost of goods sold 3,672 60.1%
Gross profit 2,435 39.9% 25.0%
Operating expenses 2,087 34.2%
Other operative expenses, net 83 1.4%
Operating income (5) 265 4.3% 461.8%
Depreciation, amortization & other operative non-cash charges 624 10.2%
Operating cash flow (5)(6) 889 14.6% 35.4%
Accumulated information
2017(2) % RevD %
Comparable(4)
Transactions (million transactions) 6,278.5 4.0%
Volume (million unit cases) (2) 552.4 3.8%
Average price per unit case (2) 37.15
Net revenues 20,524
Other operating revenues -
Total revenues (3) 20,524 100.0% 1.9%
Cost of goods sold 12,346 60.2%
Gross profit 8,178 39.8% 8.3%
Operating expenses 6,865 33.4%
Other operative expenses, net 134 0.7%
Operating income (5) 1,179 5.7% 105.9%
Depreciation, amortization & other operative non-cash charges 2,075 10.1%
Operating cash flow (5)(6) 3,254 15.9% 18.8%
(1) Except volume and average price per unit case figures.
(2) Includes the results of February to December
(3) Operative cash flow = operating income + depreciation, amortization & other operative non-cash charges.
(4) Comparable means, with respect to a year-over-year comparison, the change in a given measure excluding the effects of (i) mergers, acquisitions and
divestitures, (ii) translation effects resulting from exchange rate movements (iii) the results of hyperinflationary economies in both periods, and (iv)
includes the results of Coca-Cola FEMSA Philippines Inc, as if the consolidation had taken place at the beginning of first quarter 2016. From our
operations, only Venezuela qualifies as a hyperinflationary economy.

Press Release 4Q 2017 February 22, 2018
Page 18
Consolidated Balance SheetExpressed in millions of Mexican pesos.
Dec-17 Dec-16
Assets
Current Assets
Cash, cash equivalents and marketable securities Ps. 18,767 Ps. 10,476
Total accounts receivable 17,576 15,005
Inventories 11,364 10,744
Other current assets 7,950 9,229
Total current assets 55,657 45,454
Property, plant and equipment
Property, plant and equipment 121,968 106,696
Accumulated depreciation (46,141) (41,408)
Total property, plant and equipment, net 75,827 65,288
Investment in shares 12,540 22,357
Intangibles assets and other assets 124,243 123,964
Other non-current assets 17,410 22,194
Total Assets Ps. 285,677 Ps. 279,256
Liabilities and Equity
Current Liabilities
Short-term bank loans and notes payable Ps. 12,171 Ps. 3,052
Suppliers 19,956 21,489
Other current liabilities 23,467 15,327
Total current liabilities 55,595 39,868
Long-term bank loans and notes payable 71,189 85,857
Other long-term liabilities 18,184 24,298
Total liabilities 144,968 150,023
Equity
Non-controlling interest 18,141 7,096
Total controlling interest 122,568 122,137
Total equity 140,710 129,233
Total Liabilities and Equity Ps. 285,677 Ps. 279,256

Press Release 4Q 2017 February 22, 2018
Page 19
Quarter - Volume & TransactionsFor the three months ended December 31, 2017 and 2016
Volume
Expressed in million unit cases
Sparkling Water (1)Bulk
Water (2)Still Total Sparkling Water (1)
Bulk
Water (2)Still Total
Mexico 333.4 22.7 65.5 26.4 448.0 340.4 23.5 67.4 26.5 457.7
Central America 39.5 2.8 0.2 4.6 47.1 37.3 2.3 0.2 4.6 44.4
Mexico & Central America 372.8 25.5 65.7 31.0 495.1 377.7 25.8 67.5 31.1 502.2
Colombia 54.5 9.0 2.9 4.9 71.3 58.5 6.3 4.8 6.8 76.5
Venezuela 16.2 2.4 0.2 0.7 19.5 18.6 3.3 0.2 1.4 23.6
Brazil 200.8 12.6 2.0 11.3 226.7 166.0 11.0 1.5 8.9 187.3
Argentina 49.4 5.4 1.3 4.5 60.7 48.8 6.3 0.9 4.3 60.4
South America 320.9 29.4 6.5 21.4 378.2 291.9 26.9 7.4 21.4 347.7
Philippines 127.4 6.5 9.9 16.3 160.1 - - - - -
Asia 127.4 6.5 9.9 16.3 160.1 - - - - -
Total 821.1 61.4 82.1 68.7 1,033.3 669.6 52.7 75.0 52.5 849.9
(1) Excludes water presentations larger than 5.0 Lt ; includes flavored water
(2) Bulk Water = Still bottled water in 5.0, 19.0 and 20.0 - liter packaging presentations; includes flavored water
Transactions
Expressed in million transactions
Sparkling Still Total Sparkling Still Total
Mexico 2,003.4 217.0 2,387.2 2,047.8 224.7 2,446.5
Central America 302.1 59.6 376.7 293.9 60.3 368.7
Mexico & Central America 2,305.5 276.6 2,763.9 2,341.7 285.0 2,815.2
Colombia 402.3 50.5 533.8 426.9 71.1 581.3
Venezuela 97.0 6.3 122.9 97.0 8.4 137.3
Brazil 1,176.3 125.5 1,410.9 978.4 93.9 1,165.4
Argentina 234.9 28.6 292.4 223.7 29.1 283.7
South America 1,910.5 210.8 2,360.1 1,725.9 202.6 2,167.7
Philippines 1,606.9 147.2 1,834.3 - - -
Asia 1,606.9 147.2 1,834.3 - - -
Total 5,822.9 634.7 6,958.3 4,067.6 487.6 4,982.9
4Q 2017 4Q 2016
4Q 2017 4Q 2016
Water Water
166.8 173.9
15.0 14.5
181.8 188.4
81.1 83.3
19.6 32.0
109.2 93.1
80.2 -
500.7 427.6
28.9 30.9
238.8 239.2
80.2 -

Press Release 4Q 2017 February 22, 2018
Page 20
YTD - Volume & TransactionsFor the twelve months ended December 31, 2017 and 2016
Volume
Expressed in million unit cases
Sparkling Water (1)Bulk
Water (2)Still Total Sparkling Water (1)
Bulk
Water (2)Still Total
Mexico 1,346.0 98.4 289.3 111.3 1,845.0 1,356.8 96.0 291.2 106.6 1,850.7
Central America 142.8 10.5 0.6 19.1 173.0 145.1 9.9 0.6 19.2 174.9
Mexico & Central America 1,488.8 108.8 289.9 130.4 2,017.9 1,501.9 105.9 291.9 125.9 2,025.6
Colombia 199.7 25.9 17.1 22.3 265.0 226.7 27.6 21.1 31.7 307.0
Venezuela 54.6 6.8 0.5 2.3 64.2 119.9 13.0 1.3 8.9 143.1
Brazil 680.4 40.8 6.6 37.3 765.1 572.1 38.8 5.5 32.8 649.2
Argentina 166.2 20.4 3.7 15.6 205.9 168.7 23.2 3.4 13.9 209.1
South America 1,100.9 93.9 28.0 77.5 1,300.2 1,087.3 102.6 31.3 87.2 1,308.4
Philippines (3) 438.6 24.8 34.2 54.8 552.4 - - - - -
Asia 438.6 24.8 34.2 54.8 552.4 - - - - -
Total 3,028.3 227.5 352.1 262.7 3,870.6 2,589.2 208.5 323.2 213.0 3,334.0
(1) Excludes water presentations larger than 5.0 Lt ; includes flavored water
(2) Bulk Water = Still bottled water in 5.0, 19.0 and 20.0 - liter packaging presentations; includes flavored water
Transactions
Expressed in million transactions
Sparkling Still Total Sparkling Still Total
Mexico 8,122.7 914.2 9,764.5 8,256.0 906.2 9,884.1
Central America 1,158.8 247.4 1,467.2 1,181.4 255.0 1,498.0
Mexico & Central America 9,281.5 1,161.5 11,231.7 9,437.5 1,161.2 11,382.1
Colombia 1,511.5 222.5 2,046.5 1,698.9 328.3 2,400.9
Venezuela 358.3 21.2 441.0 579.3 74.8 772.6
Brazil 4,079.6 419.7 4,857.6 3,516.5 359.2 4,206.1
Argentina 813.9 101.0 1,019.9 801.0 99.3 1,012.6
South America 6,763.2 764.4 8,365.1 6,595.7 861.7 8,392.3
Philippines (3) 5,526.9 457.3 6,278.5 - - - - -
Asia 5,526.9 457.3 6,278.5 - - -
Total 21,571.6 2,383.2 25,875.3 16,033.1 2,022.9 19,774.4
2017 2016
2017 2016
Water Water
727.6 721.9
61.0 61.5
788.6 783.5
312.5 373.7
61.5 118.5
358.4 330.4
105.0 112.3
837.5 934.9
294.3
(3) 2017 information for the Philippines includes February to December
294.3 -
1,920.5 1,718.3

Press Release 4Q 2017 February 22, 2018
Page 21
Macroeconomic Information Fourth quarter 2017
Inflation(1)
Full Year 4Q 17
Mexico 6.77% 2.41%
Colombia 4.09% 0.48%
Venezuela (2) 2055.50% 228.46%
Brazil 2.95% 1.11%
Argentina 25.04% 6.59%
Philippines 3.58% 1.20%(1)
Source: inflation estimated by the company based on historic publications from the Central Banks of each country .
(2) Inflation based on unofficial publications.
Average Exchange Rates for each Period (3)
4Q 17 4Q 16 D % FY 17 FY 16 D %
Mexico 18.93 19.83 -4.5% 18.93 18.66 1.5%
Guatemala 7.34 7.50 -2.2% 7.35 7.60 -3.3%
Nicaragua 30.60 29.15 5.0% 30.05 28.62 5.0%
Costa Rica 571.39 559.74 2.1% 572.17 551.05 3.8%
Panama 1.00 1.00 0.0% 1.00 1.00 0.0%
Colombia 2,987.44 3,015.49 -0.9% 2,951.06 3,054.62 -3.4%
Venezuela 9,827.77 663.74 1380.7% 3,713.38 493.81 652.0%
Brazil 3.25 3.29 -1.4% 3.19 3.49 -8.5%
Argentina 17.56 15.45 13.6% 16.56 14.78 12.1%
Philippines 50.93 49.11 3.7% 50.40 47.49 6.1%
End of Period Exchange Rates
Dec 2017 Dec 2016 D % Sep 2017 Sep 2016 D %
Mexico 19.74 20.66 -4.5% 18.20 19.50 -6.7%
Guatemala 7.34 7.52 -2.4% 7.34 7.52 -2.3%
Nicaragua 30.79 29.32 5.0% 30.41 28.97 5.0%
Costa Rica 572.56 561.10 2.0% 574.13 558.80 2.7%
Panama 1.00 1.00 0.0% 1.00 1.00 0.0%
Colombia 2,984.00 3,000.71 -0.6% 2,936.67 2,879.95 2.0%
Venezuela 22,793.30 673.76 3283.0% 3,345.00 658.89 407.7%
Brazil 3.31 3.26 1.5% 3.17 3.25 -2.4%
Argentina 18.65 15.89 17.4% 17.31 15.31 13.1%
Philippines 49.92 49.81 0.2% 51.07 48.26 5.8%(3)
Average exchange rate for each period computed with the average exchange rate of each month.
Quarterly Exchange Rate (local currency per USD) Accumulated Exchange Rate (local currency per USD)
Quarter Exchange Rate (local currency per USD) Previous Quarter Exchange Rate (local currency per USD)