Embed Size (px)
Citation preview
2017 FULL-YEAR RESULTS
MARCH 1st, 2018

DISCLAIMER
2017 Full-Year Results March 1st, 20182 I
This presentation contains estimates and/or forward-looking statements and information. These statements include financialprojections, synergies, estimates and their underlying assumptions, statements regarding plans, expectations and objectiveswith respect to future operations, products and services, and statements regarding future performance. Such statements donot constitute forecasts regarding SUEZ’s results or any other performance indicator, but rather trends or targets, as the casemay be. No guarantee can be given as to the achievement of such forward-looking statements and information.
Investors and holders of SUEZ securities are cautioned that forward-looking information and statements are subject to variousrisks and uncertainties, which are difficult to predict and generally beyond the control of SUEZ, and that such risks anduncertainties may entail results and developments that differ materially from those stated or implied in forward-lookinginformation and statements. These risks and uncertainties include, but are not limited to, those discussed or identified in thepublic documents filed with the Autorité des marchés financiers (AMF). Investors and holders of SUEZ securities shouldconsider that the occurrence of some or all of these risks may have a material adverse effect on SUEZ. SUEZ is under noobligation and does not undertake to provide updates of these forward-looking statements and information to reflect eventsthat occur or circumstances that arise after the date of this document.
More comprehensive information about SUEZ may be obtained on its website (www.suez.com).
This document does not constitute an offer to sell, or a solicitation of an offer to buy SUEZ securities in any jurisdiction.

Jean-Louis ChaussadeChief Executive Officer
3 I

2017 Full-Year Results March 1st, 2018
4 I
2017: A STRATEGIC MOVE, FINANCIAL RESULTS IN-LINE BUT DISAPPOINTMENT ON EBIT
FY17 numbers fully in-line with preliminary results
Top line growth: c. 4% at constant FX
Free Cash Flow of €1bn, in-line with guidance
Financial leverage of 3.2x
€45m of additional expenses in Q4 led to EBIT organic growth of -2% Higher expenses in Spain to defend PPP model in a more uncertain political context
Operational difficulties in two challenging contracts in AMEI
GE Water acquisition completed
Integration well on track
Confirmation of long-term value creation after positive first milestones
2017 Full-Year Results March 1st, 20185 I
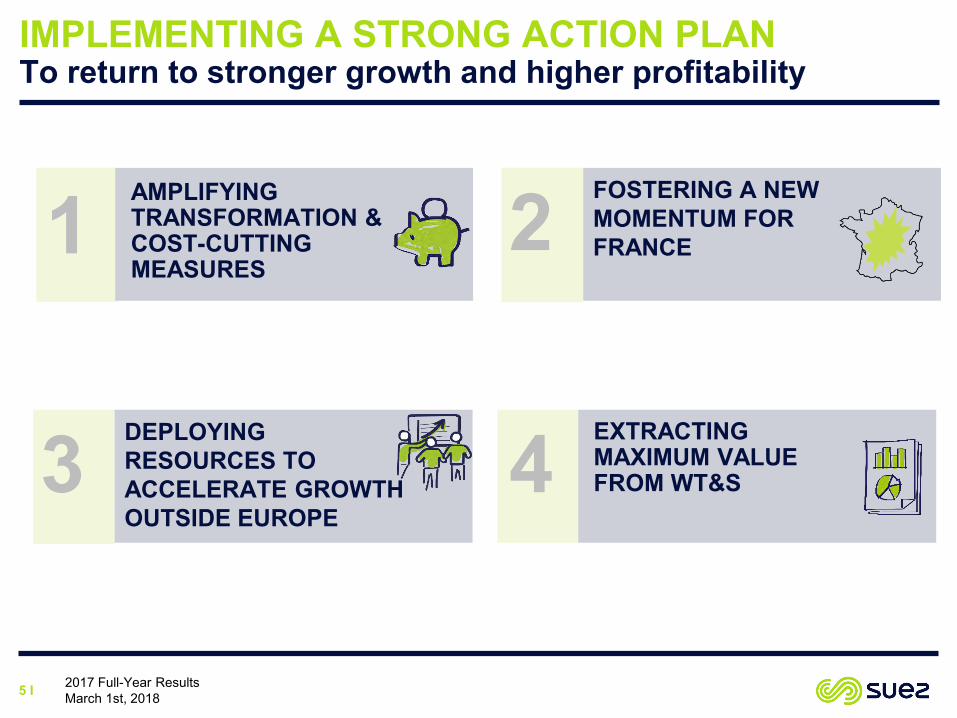
IMPLEMENTING A STRONG ACTION PLANTo return to stronger growth and higher profitability
AMPLIFYING TRANSFORMATION &COST-CUTTING MEASURES
FOSTERING A NEW MOMENTUM FOR FRANCE
EXTRACTING MAXIMUM VALUEFROM WT&S
1
4
2
DEPLOYING RESOURCES TO ACCELERATE GROWTH OUTSIDE EUROPE
3

2017 Full-Year Results March 1st, 20186 I
AMPLIFYING TRANSFORMATION & COST-CUTTING MEASURESFirst contribution expected as soon as 2018
AT GROUP LEVEL
Improve industrial performance
Accelerate transformation through innovation & digital
Reinforcement of group monitoring on procurement and IT
Further mutualize and implement cost cutting measures in France (HQ + BUs) as well as outside of France, notably in the US & Asia
A SPECIFIC ACTION PLAN FOR SPAIN
Launch a voluntary departure plan
Integrate transversal functions and improve shared services efficiency
Restructure Solutions & Technologies business unit
COMPASS TARGET: €200m p.a. in 2018-2020

2017 Full-Year Results March 1st, 20187 I
REBOOSTCOMMERCIAL DYNAMISM
&ENHANCE PROFITABILITY
Enhance commercial momentum to address clients new expectations
New offers: e-commerce and digital platforms, smart cities, smart metering and biogas production from both biowaste and sludge
Continue to lead technical and contractual innovation as in Thau with the first PPP, in Dole with the first SEMOP in Water, in Créteil with the first concession contract with partially merchant EfW facility
Both Water France and R&R France will be managed optimizing overall performance:
Further integrate transversal functions fully benefiting from the transformation of transversal functions including set up of shared services centers
Improve assets & operations efficiency
FOSTERING A NEW MOMENTUM FOR FRANCETo accelerate profitable growth
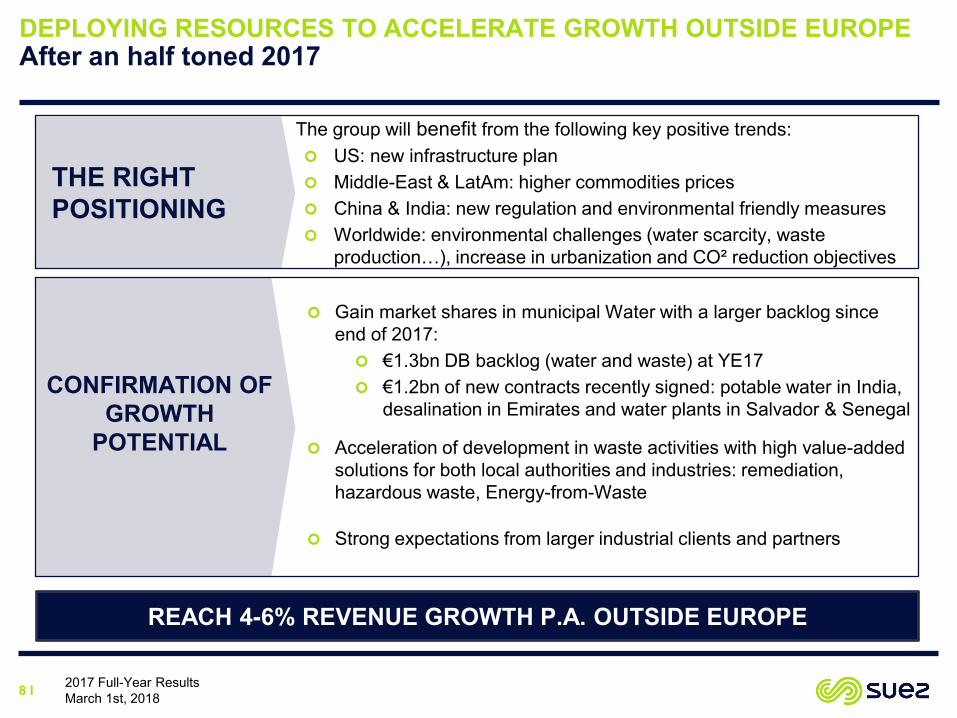
DEPLOYING RESOURCES TO ACCELERATE GROWTH OUTSIDE EUROPEAfter an half toned 2017
2017 Full-Year Results March 1st, 20188 I
CONFIRMATION OF GROWTH
POTENTIAL
Gain market shares in municipal Water with a larger backlog since end of 2017: €1.3bn DB backlog (water and waste) at YE17 €1.2bn of new contracts recently signed: potable water in India,
desalination in Emirates and water plants in Salvador & Senegal
Acceleration of development in waste activities with high value-added solutions for both local authorities and industries: remediation, hazardous waste, Energy-from-Waste
Strong expectations from larger industrial clients and partners
THE RIGHT POSITIONING
The group will benefit from the following key positive trends: US: new infrastructure plan Middle-East & LatAm: higher commodities prices China & India: new regulation and environmental friendly measures Worldwide: environmental challenges (water scarcity, waste
production…), increase in urbanization and CO² reduction objectives
REACH 4-6% REVENUE GROWTH P.A. OUTSIDE EUROPE
2017 Full-Year Results March 1st, 20189 I
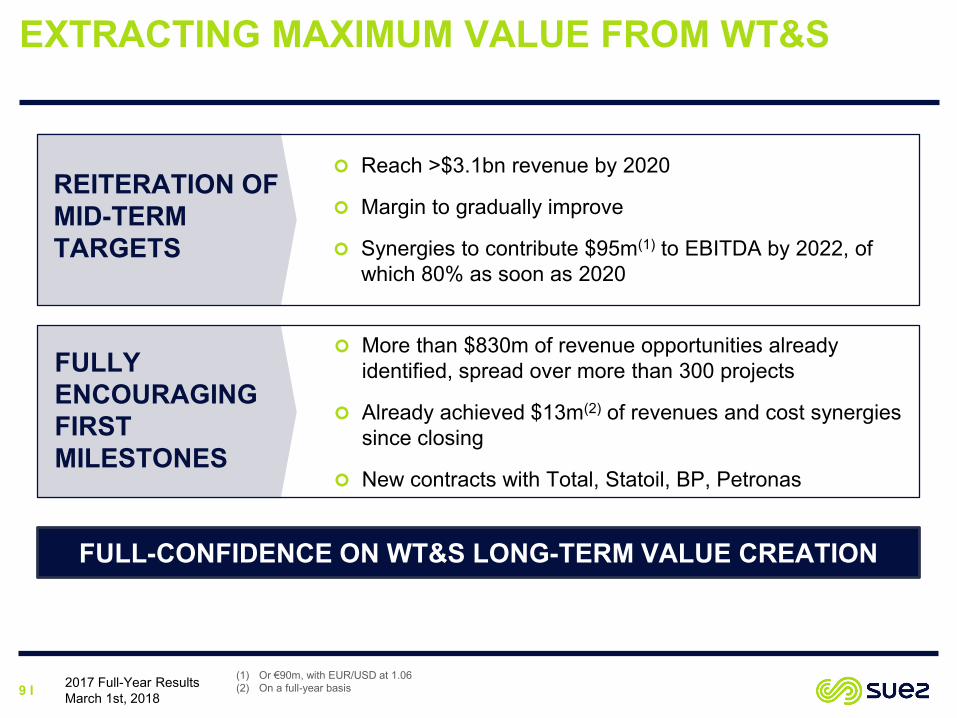
EXTRACTING MAXIMUM VALUE FROM WT&S
REITERATION OF MID-TERM TARGETS
Reach >$3.1bn revenue by 2020
Margin to gradually improve
Synergies to contribute $95m(1) to EBITDA by 2022, of which 80% as soon as 2020
FULLY ENCOURAGING FIRST MILESTONES
More than $830m of revenue opportunities already identified, spread over more than 300 projects
Already achieved $13m(2) of revenues and cost synergies since closing
New contracts with Total, Statoil, BP, Petronas
(1) Or €90m, with EUR/USD at 1.06(2) On a full-year basis
FULL-CONFIDENCE ON WT&S LONG-TERM VALUE CREATION

10 I
CONFIRMATION OF 2018 OUTLOOKConsolidated by action plan first contributions
Revenue: growth at constant FX of c. 9%
EBIT: growth at constant FX of c. 10%(1)
Free cash flow: c. €1bn(2)
Net financial debt/EBITDA: c. 3x
Dividend policy: ≥ €0.65 per share in relation to FY18 results(3)
(1) Excluding the impact of the GE Water purchase price allocation which will be determined in 2018; excluding the impact of the change in US tax law on regulated water activities, resulting in the transfer of €25 million in income from EBIT to taxable income, which is neutral to Net Result Group share
(2) Excluding payments associated with the voluntary departure plan in France and recognized in 2017 and excluding the GE Water integration costs(3) Subject to 2019 Annual General Meeting approval
Jean-Marc BoursierGroup Senior Executive Vice-President Finance and R&R Northern Europe
11 I 2017 Full-Year Results March 1st, 2018
2017 FINANCIAL RESULTS

2017 Full-Year Results March 1st, 201812 I
In €m FY 2016 FY 2017 Gross variation
Organicgrowth
REVENUE 15,322 15,871 +3.6% +1.5%
EBITDA 2,651 2,641 -0.4% -2.0%
EBIT 1,282 1,284 +0.2% -2.0%
NET RESULT group share
420 302 -28.2%
HIGHLIGHTS (1/2)2017 EBIT guidance affected by specific elements for €45m
Acceleration of organic growth of revenues in H2
Positive momentum of R&R Europe division with higher volumes and prices
International division growth hampered by phasing in construction activity and abnormal weather conditions in the US
Limited tariff increases in Water Europe
2% organic decrease in EBIT: 3 specific elements weighed on EBIT for €45m Performance of Water Europe still affected by
low inflation environment Progressive recovery of R&R Europe
Net result affected by €109m exceptional costs: Voluntary departure plan in France GE Water acquisition cost
Organic growth H1 H2 FY17
Revenue +0.9% +2.1% +1.5%

2017 Full-Year Results March 1st, 201813 I
In €m FY 2016 FY 2017 Gross variation
FREE CASH FLOW 1,005 1,004 0%
NET INVESTMENTS 705 3,646 N/R
NET DEBT 8,042 8,473 +5.4%
ND/EBITDA 3.0x 3.2x +0.2x
ROCE 7.0% 6.8% -20bps
HIGHLIGHTS (2/2)RESILIENT CASH FLOW GENERATION
Acquisition of GE Water €2,699m price paid(1)
€510m revenue and €52m EBIT contribution in Q4 2017
Limited increase in net debt Free cash flow objectives achieved Economic leverage of 3.0x, assuming
full-year contribution of GE Water
(1) Net of acquired cash & cash equivalents
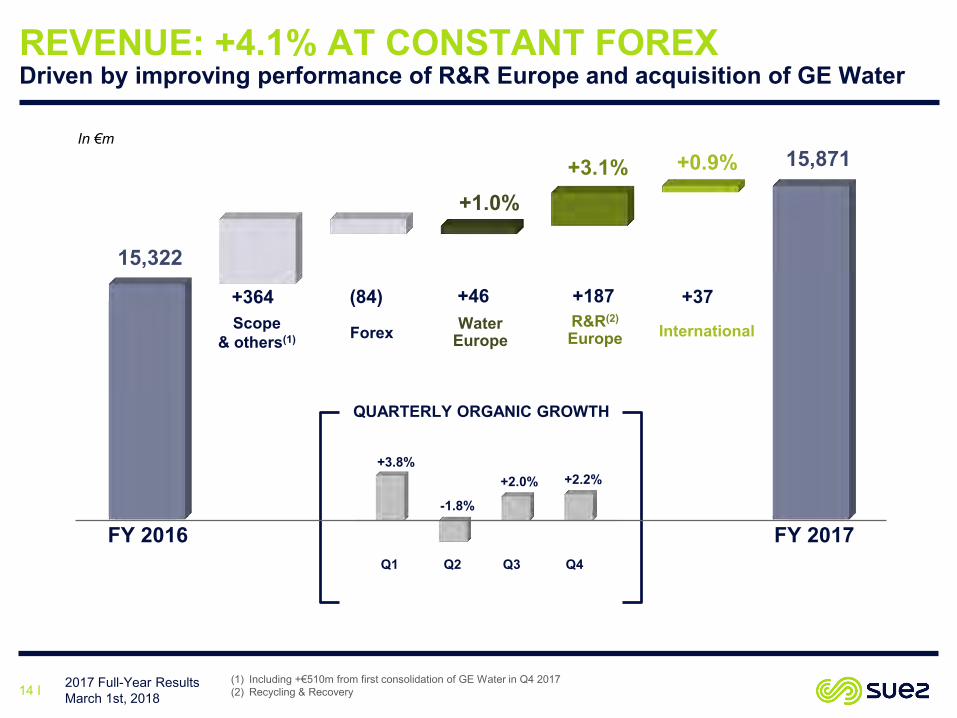
REVENUE: +4.1% AT CONSTANT FOREXDriven by improving performance of R&R Europe and acquisition of GE Water
2017 Full-Year Results March 1st, 201814 I
(1) Including +€510m from first consolidation of GE Water in Q4 2017(2) Recycling & Recovery
QUARTERLY ORGANIC GROWTH
Q1 Q2 Q3 Q4
+3.8%
-1.8%
+2.0% +2.2%
FY 2016 FY 2017
15,322
15,871+0.9%
+1.0%+3.1%
Scope& others(1) InternationalWater
EuropeR&R(2)
EuropeForex
+364 +37+46(84) +187
In €m

2017 Full-Year Results March 1st, 201815 I
1,282 1,284
Scope& others(2)
+19+32
EBIT Margin 8.1%(1)
EBIT Margin 8.1%
FY 2016 FY 2017
In €m
(6)
EBIT: +0.6% AT CONSTANT FOREXDespite specific one offs for €45m
(1) Adjusted for Derun +€36m provision release in 2016(2) Including +€52m from first consolidation of GE Water in Q4 2017
+1.0%-7.6% +6.4%
InternationalWaterEurope
R&REurope
(43) +6
HoldingForex(5)

WATER EUROPELack of inflation and additional expenses in Spain
2017 Full-Year Results March 1st, 201816 I
(1) At iso contracts(2) Escalation formula on Delegation of public services(3) Net balance between contracts gained / renewed / lost & amended
In €m
4,670
Scope&
Forex
Volume(1)Tariffs(2)
Net Cial.Activity(3)
4,680
Works
(18)
FY 2016Pro forma
FY 2017
(35) +22 +8 (13) +15
NewServices
Others
+33
REVENUE
Scope & Forex Spanish
expenses Lille provision reversal in
2016
Underlying perf.
565516
FY 2016Pro forma
FY 2017
12.1% 11.0%
EBIT% EBIT MARGIN
(4) Excluding upstream volumes
Volumes above long-term trends, although poorer weather conditions in H2
Minimum tariff increases as expected France: +0.4%(2) on DSP(4)
Spain: -0.3% average Chile: +0.9% averageCommercial activity reflects the loss of the Valladolid contract in Spain
Decrease in EBIT explained by: Additional expenses in Q4 related to increased
technical studies, communication and legal costs to defend PPP model in Spain
Provision released in 2016 as part of the settlement with Lille Métropole
Mm3 sold FY2017
∆ 17/16(1)
France 627 +0.6%
Spain 683(4) +1.2%
Chile 575 +1.1%
(6) (15) (12) (16)
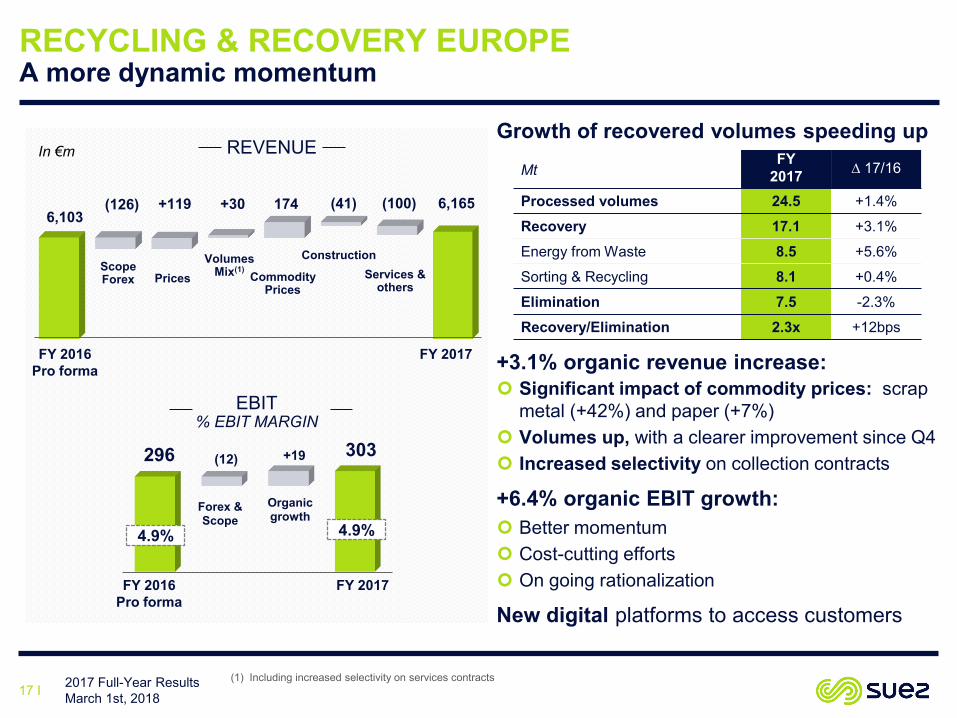
6,103+119 +30
Prices CommodityPrices
174
Construction
(41) 6,165(126)
RECYCLING & RECOVERY EUROPEA more dynamic momentum
2017 Full-Year Results March 1st, 201817 I
(1) Including increased selectivity on services contracts
In €m
ScopeForex
Volumes Mix(1)
FY 2016Pro forma
FY 2017
REVENUEGrowth of recovered volumes speeding up
+3.1% organic revenue increase: Significant impact of commodity prices: scrap
metal (+42%) and paper (+7%) Volumes up, with a clearer improvement since Q4 Increased selectivity on collection contracts
+6.4% organic EBIT growth: Better momentum Cost-cutting efforts On going rationalization
New digital platforms to access customers
MtFY
2017 ∆ 17/16
Processed volumes 24.5 +1.4%
Recovery 17.1 +3.1%
Energy from Waste 8.5 +5.6%
Sorting & Recycling 8.1 +0.4%
Elimination 7.5 -2.3%
Recovery/Elimination 2.3x +12bps
Forex & Scope
Organic growth
296 303
FY 2016Pro forma
FY 2017
4.9% 4.9%
EBIT% EBIT MARGIN
Services & others
(100)
(12) +19
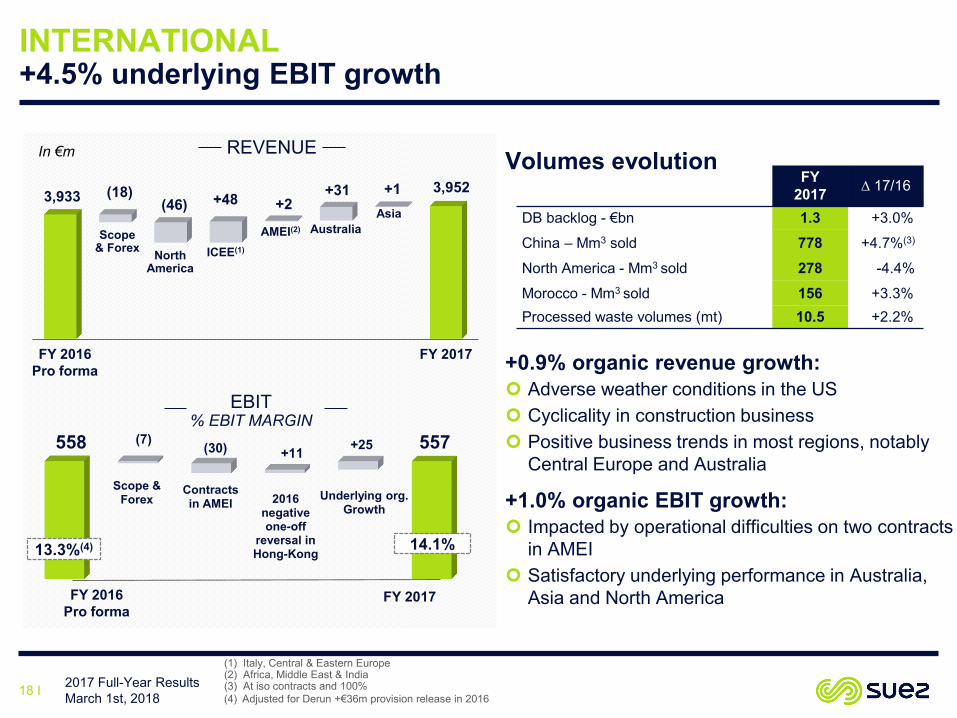
3,9523,933 (46) +48(18)
Scope& Forex North
AmericaICEE(1)
Asia+2
AMEI(2)
+31
Australia
+1
Scope & Forex
Contracts in AMEI 2016
negative one-off
reversal in Hong-Kong
Underlying org. Growth
INTERNATIONAL+4.5% underlying EBIT growth
2017 Full-Year Results March 1st, 201818 I
(1) Italy, Central & Eastern Europe(2) Africa, Middle East & India (3) At iso contracts and 100%(4) Adjusted for Derun +€36m provision release in 2016
In €m REVENUE
FY 2016Pro forma
FY 2017
Volumes evolution
+0.9% organic revenue growth: Adverse weather conditions in the US Cyclicality in construction business Positive business trends in most regions, notably
Central Europe and Australia
+1.0% organic EBIT growth: Impacted by operational difficulties on two contracts
in AMEI Satisfactory underlying performance in Australia,
Asia and North America
FY2017 ∆ 17/16
DB backlog - €bn 1.3 +3.0%
China – Mm3 sold 778 +4.7%(3)
North America - Mm3 sold 278 -4.4%
Morocco - Mm3 sold 156 +3.3%Processed waste volumes (mt) 10.5 +2.2%
FY 2017
EBIT% EBIT MARGIN
558 557
14.1%
FY 2016Pro forma
13.3%(4)
(7) (30) +11 +25
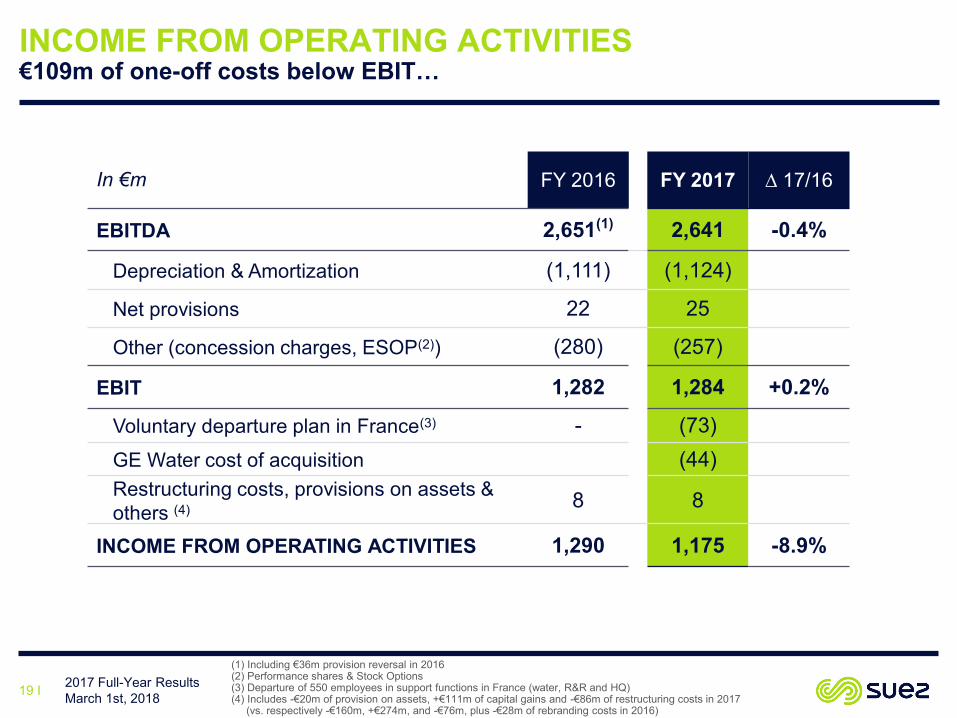
INCOME FROM OPERATING ACTIVITIES €109m of one-off costs below EBIT…
2017 Full-Year Results March 1st, 201819 I
(1) Including €36m provision reversal in 2016(2) Performance shares & Stock Options(3) Departure of 550 employees in support functions in France (water, R&R and HQ)(4) Includes -€20m of provision on assets, +€111m of capital gains and -€86m of restructuring costs in 2017
(vs. respectively -€160m, +€274m, and -€76m, plus -€28m of rebranding costs in 2016)
In €m FY 2016 FY 2017 ∆ 17/16
EBITDA 2,651(1) 2,641 -0.4%
Depreciation & Amortization (1,111) (1,124)
Net provisions 22 25
Other (concession charges, ESOP(2)) (280) (257)
EBIT 1,282 1,284 +0.2%
Voluntary departure plan in France(3) - (73)GE Water cost of acquisition (44)Restructuring costs, provisions on assets & others (4) 8 8
INCOME FROM OPERATING ACTIVITIES 1,290 1,175 -8.9%
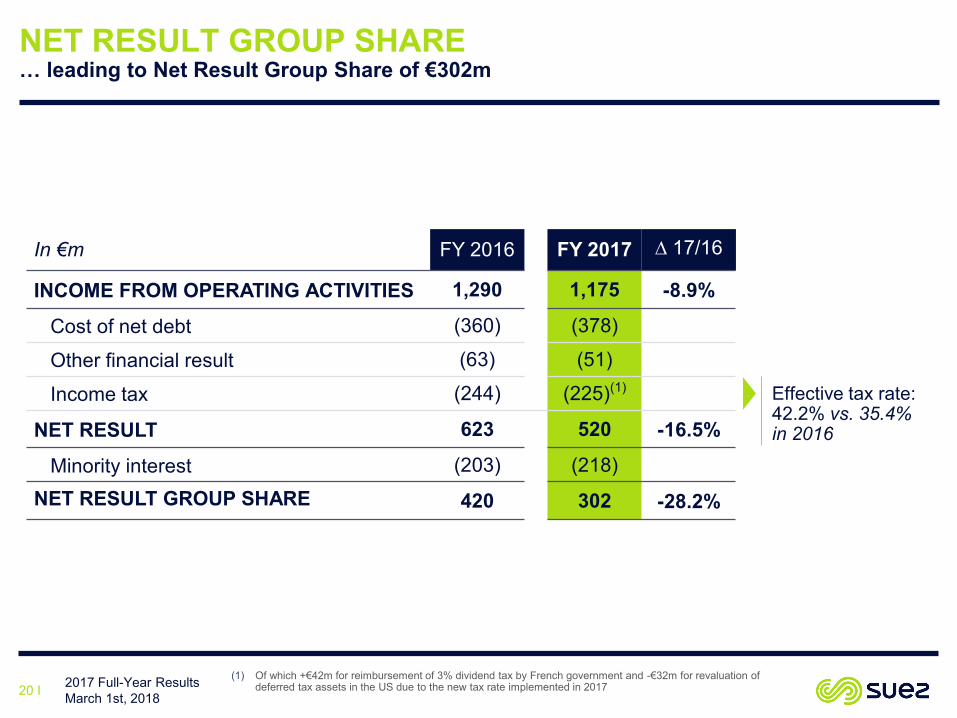
NET RESULT GROUP SHARE… leading to Net Result Group Share of €302m
2017 Full-Year Results March 1st, 201820 I
In €m FY 2016 FY 2017 ∆ 17/16
INCOME FROM OPERATING ACTIVITIES 1,290 1,175 -8.9%
Cost of net debt (360) (378)
Other financial result (63) (51)
Income tax (244) (225)(1)
NET RESULT 623 520 -16.5%
Minority interest (203) (218)
NET RESULT GROUP SHARE 420 302 -28.2%
Effective tax rate: 42.2% vs. 35.4% in 2016
(1) Of which +€42m for reimbursement of 3% dividend tax by French government and -€32m for revaluation of deferred tax assets in the US due to the new tax rate implemented in 2017

GE WATER ACQUISITIONTransaction structure set to preserve SUEZ financial flexibility
2017 Full-Year Results March 1st, 201821 I
(1) Price paid to GE as of 30th of September 2017, less treasury acquired(2) Or €90m with EURUSD at 1.06
€2,699m acquisition price(1)
€668m equity provided by CDPQ
€746m net capital increase
€598m net hybrid bond at 2.875%
Net debt impact of €687m
• Revenue: c. $2,800m, supported by 4% growth in orders in 2017
• EBITDA: c. $290m, including $20m of transitory costs
• EBIT: c. $200m before PPA allocation, including $20m of transitory costs
• c. $80m of integration costs (below EBIT)
Reiteration of WTS contribution in FY18
• Reach >$3,100m revenue by 2020• Margin to gradually improve• Synergies to contribute $95m(2) to EBITDA by 2022,
with c. 80% of cost synergies to be generated by 2020
Reiteration of mid-term targets

In €m INVESTMENTS
CAPEX ALLOCATION(1)
Net investment of c. €1bn in FY17
2017 Full-Year Results March 1st, 201822 I
36%
27%
34%3%
Water EuropeR&R EuropeInternationalWT&S
(486) (357)
104 126
492 551
595626
Maintenance CAPEX
Development CAPEX
Financial Investments
Disposals
FY 2016 FY 2017
705 947
(1) Excluding acquisition of GE Water
Maintenance CapEx kept at 3.9% of revenue
Development CapEx to fuel future growth of International Stable envelope in Europe at €325m Increase in International division to support our
growth ambition 40% of development CapEx to grow Regulated
Asset Base in the US and Chile
Disposals of non-core assets in good conditions: €111m capital gains Real estate assets (Spain, France & UK) 9.1% stake in Aquasure (Melbourne desal SPV) Water concession in Jakarta

SOLID FCF, IN-LINE WITH GUIDANCE€1bn achieved thanks to strong focus on Capex and tight working capital management
2017 Full-Year Results March 1st, 201823 I
1,004
2,641(212)
+60
(256)
EBITDA FY 2017
Concession charges
Other(1)
Maint.capex
Free Cash Flow2017
2,094
Operating Cash Flow
2017
(626)
Change in WCR
(193)
Tax expenses
(332)
Net Financial Expenses
Income of core
associated
(79)
In €m
(1) Including -€44m of acquisition costs of GE Water and -€102m of restructuring costs

LIMITED INCREASE IN NET DEBTLeverage equivalent at 3.0x with GE Water on a full-year basis
2017 Full-Year Results March 1st, 201824 I
31/12/16 31/12/17
(1,004)+551
8,042(231)
+687 (265) 123 8,473
3.0x ND/EBITDA
3.2x ND/EBITDA
Others(3)
Free Cash Flow
GE Water(2)
Dvpt. Investments
Forex
In €m
(1) Out of which €367m paid to shareholders, €219m to minority interests, -€42m of tax and €28m of hybrid coupon(2) C.f. details on page 21(3) Out of which capital increase reserved to employees for -€118m and +€207m for securitization and perimeter effect from GE Water acquisition(4) Excluding securitization cost and inflation-link cost in Chile
Net Fin. Investments
5,19% 5,08% 4,88%4,45% 4,19%
3,67% 3,84%4,36% 4,13% 4,05%
3,49% 3,41%2,97% 2,78%
2011 2012 2013 2014 2015 2016 2017
Cost of net debt
Cost ofgross debt
Ongoing decrease in cost of gross debt
Increased duration: 6.9 years (vs. 6.4 in 2016)
Slight increase in cost of net debt reflects strong liquidity increase
A3 Rating, negative outlook by Moody’s
COST OF DEBT(4)
Dividends paid(1)
+571
Net debt impact: (113)
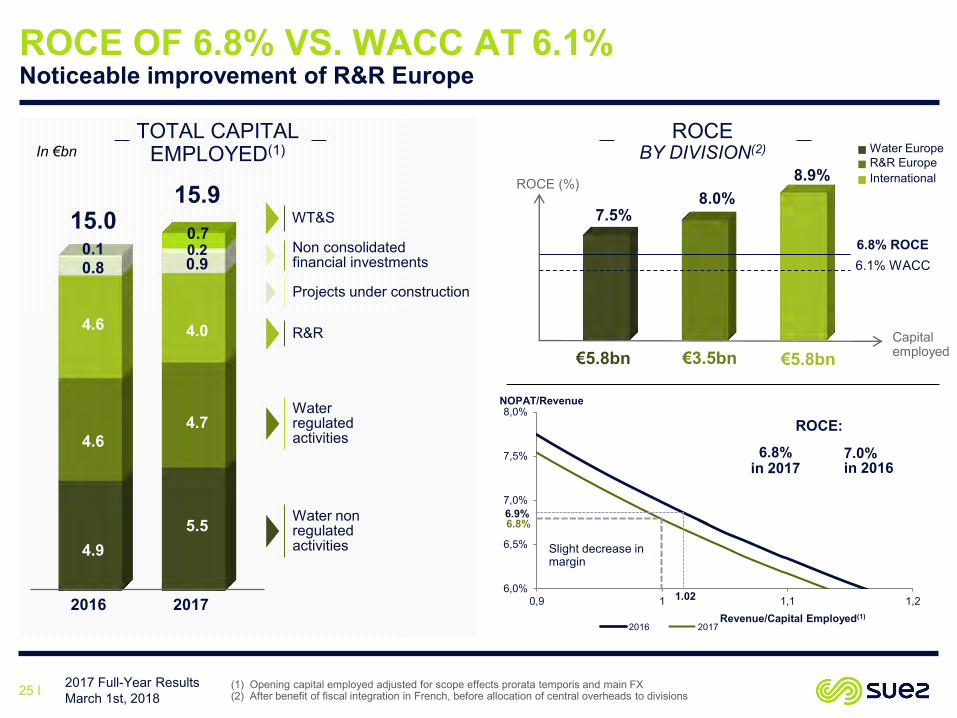
2017 Full-Year Results March 1st, 201825 I (1) Opening capital employed adjusted for scope effects prorata temporis and main FX
(2) After benefit of fiscal integration in French, before allocation of central overheads to divisions
In €bn
Water non regulated activities
Water regulated activities
R&R
Projects under construction
Non consolidated financial investments
2016 2017
4.9
4.6
4.6
0.80.1
15.015.9
5.5
4.7
4.0
0.90.2
TOTAL CAPITALEMPLOYED(1)
ROCE OF 6.8% VS. WACC AT 6.1% Noticeable improvement of R&R Europe
0.7
ROCEBY DIVISION(2)
6,0%
6,5%
7,0%
7,5%
8,0%
0,9 1 1,1 1,2
2016 2017Revenue/Capital Employed(1)
NOPAT/Revenue
6.8%
6.8%in 2017
Slight decrease in margin
1.02
6.9%
Water EuropeR&R EuropeInternationalROCE (%)
Capital employed
6.1% WACC
€5.8bn
8.9%
6.8% ROCE
€5.8bn
7.5%
€3.5bn
8.0%WT&S
7.0%in 2016
ROCE:

2017 Full-Year Results March 1st, 201826 I
MATERIALIZE ADDITIONAL ACTION PLAN AND COST CUTTING MEASURES
REINFORCE INVESTMENT SELECTIVITY TO OPTIMISE RETURNS AND CAPITAL INTENSITY2SUPPORT GROWTH AMBITIONS AND CONTRIBUTE TO ACCELERATE GROUP TRANSFORMATION3STRONG FOCUS ON EPS AND ROCE
1
FINANCIAL ROADMAP

27 I 2017 Full-Year Results March 1st, 2018
CONCLUSION
Jean-Louis ChaussadeChief Executive Officer

28 I 2017 Full-Year Results March 1st, 2018
APPENDICES

SIMPLIFIED FINANCIAL STATEMENTS 30
REGULATED ACTIVITIES 35
P&L 37
CASH FLOW STATEMENT 51
BALANCE SHEET 56
ACTIVITY OF DIVISIONS 63
SUSTAINABLE DEVELOPMENT 68
TABLE OF CONTENTS
2017 Full-Year Results March 1st, 201829 I
30 I 2017 Full-Year Results March 1st, 2018
APPENDICESSIMPLIFIED FINANCIAL STATEMENTS

SIMPLIFIED BALANCE SHEET
2017 Full-Year Results March 1st, 201831 I
ASSETS (€m) 31/12/2016 31/12/2017
NON CURRENT ASSETS 20,198 22,218
o/w net intangible assets 4,223 4,162
o/w goodwill 3,647 5,587
o/w net tangible assets 8,280 8,468
CURRENT ASSETS 8,954 10,153
o/w clients and other debtors 4,041 4,690
o/w cash and cash equivalents 2,925 3,058
TOTAL ASSETS 29,284 32,370
LIABILITIES (€m) 31/12/2016 31/12/2017
Equity, group share 5,496 6,562
Minority Interests 1,870 2,504
TOTAL EQUITY 7,366 9,066
Provisions 2,080 2,081
Financial Debt 11,165 11,765
Other Liabilities 8,673 9,459
TOTAL LIABILITIES 29,284 32,370
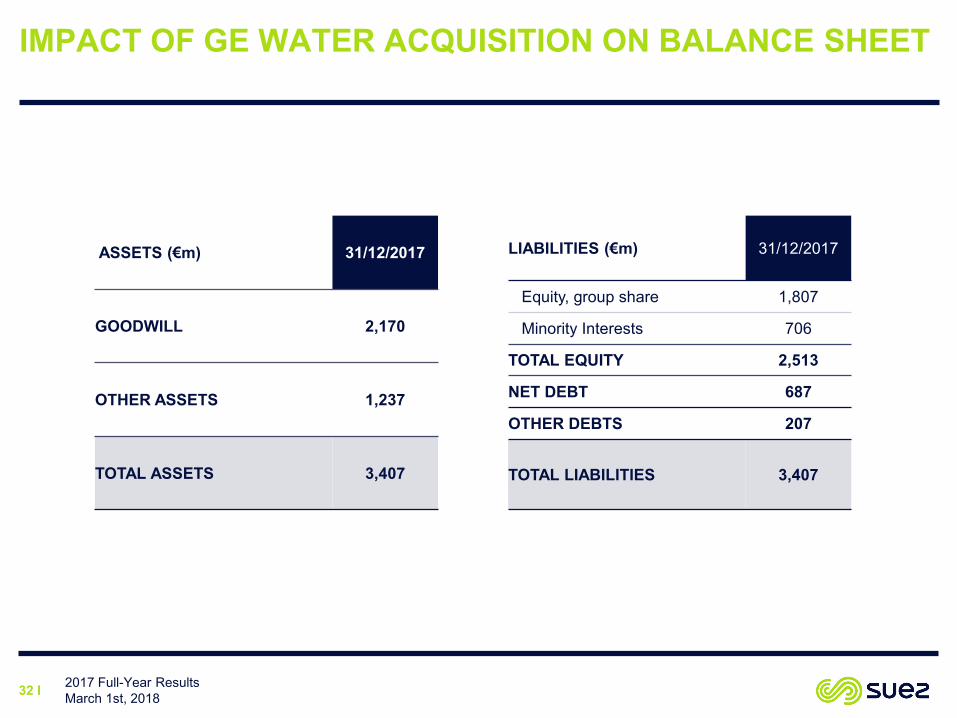
IMPACT OF GE WATER ACQUISITION ON BALANCE SHEET
2017 Full-Year Results March 1st, 201832 I
ASSETS (€m) 31/12/2017
GOODWILL 2,170
OTHER ASSETS 1,237
TOTAL ASSETS 3,407
LIABILITIES (€m) 31/12/2017
Equity, group share 1,807
Minority Interests 706
TOTAL EQUITY 2,513
NET DEBT 687
OTHER DEBTS 207
TOTAL LIABILITIES 3,407
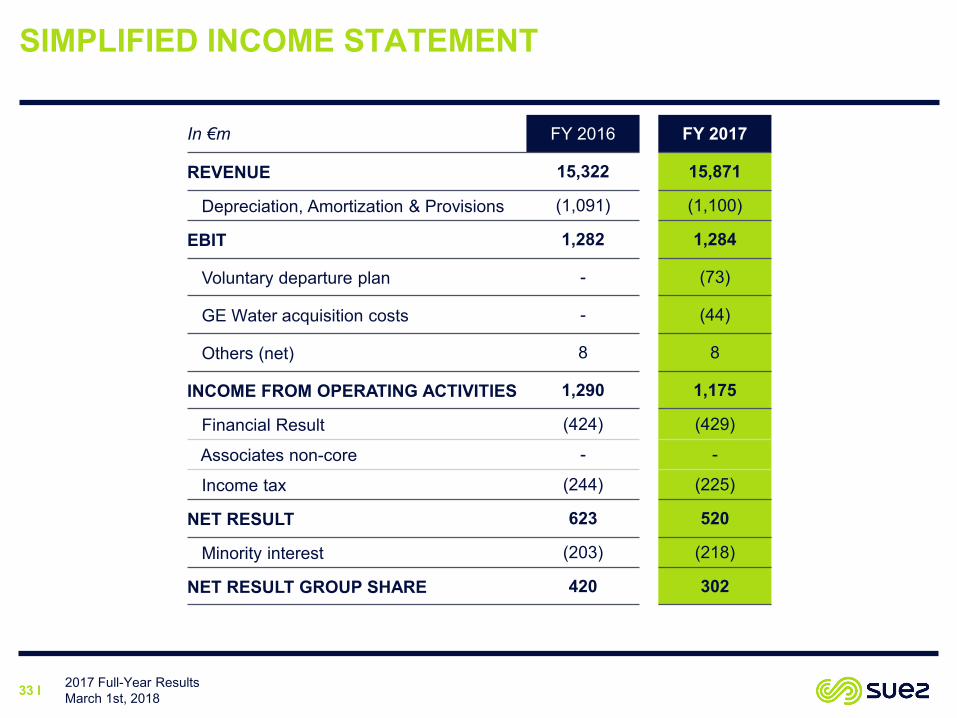
SIMPLIFIED INCOME STATEMENT
2017 Full-Year Results March 1st, 201833 I
In €m FY 2016 FY 2017
REVENUE 15,322 15,871
Depreciation, Amortization & Provisions (1,091) (1,100)
EBIT 1,282 1,284
Voluntary departure plan - (73)
GE Water acquisition costs - (44)
Others (net) 8 8
INCOME FROM OPERATING ACTIVITIES 1,290 1,175
Financial Result (424) (429)
Associates non-core - -
Income tax (244) (225)
NET RESULT 623 520
Minority interest (203) (218)
NET RESULT GROUP SHARE 420 302

SIMPLIFIED CASH FLOW STATEMENT
2017 Full-Year Results March 1st, 201834 I
In €m FY 2016 FY 2017
Operating cash flow 2,129 2,094Income tax paid (excl. income tax paid on disposals) (148) (193)Change in operating working capital (68) 61
CASH FLOW FROM OPERATING ACTIVITIES 1,913 1,962Net tangible and intangible investments (1,086) (1,177)Financial investments (195) (2,764)Disposals 488 357Other investment flows (39) (4)
CASH FLOW FROM INVESTMENT ACTIVITIES (833) (3,589)Dividends paid (602) (571)Balance of reimbursement of debt / new debt 572 531Interests paid / received on financial activities (318) (332)Capital increase 17 1,593Net new hybrid issuance - 598Change in share of interests in controlled entities 90 (61)Other cash flows (32) 55
CASH FLOW FROM FINANCIAL ACTIVITIES (273) 1,812Impact of currency, accounting practices and other 38 (52)
CASH AND CASH EQUIVALENT AT THE BEGINNING OF THE PERIOD 2,079 2,925Total cash flow for the period 846 134
CASH AND CASH EQUIVALENT AT THE END OF THE PERIOD 2,925 3,058
35 I 2017 Full-Year Results March 1st, 2018
APPENDICESREGULATED ACTIVITIES

REGULATED ACTIVITIES
2017 Full-Year Results March 1st, 201836 I
Chile US
In CLPbn FY 2016 FY 2017
REVENUE 489 509EBITDA 295 305EBIT 209 210
Net Debt 885 892Capex 97 131
In USDm FY 2016 FY 2017
REVENUE 563 571EBITDA 260 271EBIT 192 194
Net Debt 868 909Capex 163 237
Rate base 1,853 2,036

37 I 2017 Full-Year Results March 1st, 2018
APPENDICESP&L

REVENUE BY DIVISION
2017 Full-Year Results March 1st, 201838 I
In €m FY 2016Pro forma FY 2017 % total ∆ 17/16 Organic ∆ ∆ at
constant FX
WATER EUROPE 4,670 4,680 29.5% +0.2% +1.0% -0.1%France 2,273 2,253 14.2% -0.9% +1.0% -0.9%Spain 1,601 1,575 9.9% -1.6% -1.2% -1.6%Chile 796 852 5.4% +7.1% +5.3% +5.3%
RECYCLING & RECOVERY EUROPE 6,104 6,165 38.8% +1.0% +3.1% +2.2%France 2,960 3,116 19.6% +5.3% +5.3% +5.4%Benelux & Germany 1,445 1,482 9.3% +2.6% +2.5% +2.6%UK 1,003 906 5.7% -9.6% -3.1% -3.1%Industrial Waste Specialties 384 415 2.6% +8.1% +4.8% +8.1%Nordics 312 245 1.5% -21.4% +1.6% -20.0%
INTERNATIONAL 3,933 3,952 24.9% +0.5% +0.9% +1.0%Africa, Middle East & India 1,137 1,130 7.1% -0.6% +0.2% +0.2%Australia 980 1,036 6.5% +5.7% +3.2% +4.7%North America 996 940 5.9% -5.6% -4.6% -3.6%Asia 448 426 2.7% -5.1% +0.3% -2.9%Italy, Central and Eastern Europe 373 420 2.6% +12.7% +13.0% +10.9%
WATER TECHNOLOGIES & SOLUTIONS(1) 515 971 6.1% +88.7% -7.6% +89.3%
OTHER(2) 100 103 0.6% +2.7% +2.7% +2.7%
TOTAL 15,322 15,871 100.0% +3.6% +1.5% +4.1%
(1) WT&S is the new industrial water division, combining GE Water (consolidated in Q4 2017 and treated as a scope effect) and SUEZ Industrial Solutions (12 months contribution); hence, organic evolution only reflects SUEZ Industrial Solutions assets
(2) Mainly SUEZ Consulting

REVENUE BY GEOGRAPHIES
2017 Full-Year Results March 1st, 201839 I
In €m FY 2016 FY 2017 % in FY 2017 ∆ 17/16
FRANCE 5,023 5,091 32.1% +1.3%
Spain 1,753 1,783 11.2% +1.7%
Benelux 1,089 1,118 7.0% +2.7%
UK 1,071 983 6.2% -8.2%
Germany 572 602 3.8% +5.2%
Others Europe 827 888 5.6% +7.3%
EUROPE (excluding France) 5,312 5,374 33.9% +1.2%
North America 1,210 1,400 8.8% +15.6%
Oceania 1,083 1,153 7.3% +6.4%
South America 896 955 6.0% +6.6%
Africa 879 892 5.6% +1.5%
Asia 615 686 4.3% +11.6%
Others International 304 321 2.0% +5.7%
INTERNATIONAL (excluding Europe) 4,986 5,406 34.1% +8.4%
TOTAL 15,322 15,871 100.0% +3.6%

2017 REVENUE SCOPE EFFECT BY DIVISION
2017 Full-Year Results March 1st, 201840 I
In €mAcquisition/
first time consolidation
Disposal Total Scope
WATER EUROPE 6 (56)(1) (50)
R&R EUROPE 16 (67) (2) (51)
INTERNATIONAL 94(3) (91) (4) 3
WT&S 513(5) (15) 499
OTHER - - -
TOTAL 630 (229) 401
(1) Mainly OCEA Smart building(2) Mainly waste activities in Finland(3) Mainly change in consolidation method of Chinese activities, from equity method to full consolidation(4) Mainly Palyja, a water activity in Indonesia(5) Mainly GE Water first consolidation in Q4 2017

REVENUE GROWTH BY DIVISION
2017 Full-Year Results March 1st, 201841 I
In €m FY 2016Pro forma FY 2017 17/16 ∆ ∆ Organic ∆ Scope ∆ Forex
WATER EUROPE 4,670 4,680 +0.2% +1.0% -1.1% +0.3%
R&R EUROPE 6,104 6,165 +1.0% +3.1% -0.8% -1.2%
INTERNATIONAL 3,933 3,952 +0.5% +0.9% +0.1% -0.5%
WT&S 515 971 +88.7% -7.6% +96.9% -0.6%
OTHER 100 103 +2.7% +2.7% +0.0% +0.0%
TOTAL 15,322 15,871 +3.6% +1.5% +2.6% -0.5%

EBITDA BY DIVISION
2017 Full-Year Results March 1st, 201842 I
In €m FY 2016Pro forma FY 2017 17/16 ∆ ∆ Organic ∆ Scope ∆ Forex
WATER EUROPE 1,223 1,165 -4.7% -3.5% -1.9% +0.7%
R&R EUROPE 720 708 -1.7% +0.8% -1.4% -1.2%
INTERNATIONAL 814 801 -1.7% -1.8% +1.1% -1.0%
WT&S 13 92 +596.8% +18.0% +581.6% -2.8%
OTHER (119) (124) +4.2% +4.1% +0.0% +0.0%
TOTAL 2,651 2,641 -0.4% -2.0% +2.0% -0.3%

EBIT BY DIVISION
2017 Full-Year Results March 1st, 201843 I
In €m FY 2016Pro forma FY 2017 17/16 ∆ ∆ Organic ∆ Scope ∆ Forex
WATER EUROPE 565 516 -8.6% -7.6% -2.2% +1.1%
R&R EUROPE 296 303 +2.2% +6.4% -2.6% -1.6%
INTERNATIONAL 558 557 -0.3% +0.9% -0.1% -1.1%
WT&S 7 59 +793.6% -18.4% +815.4% -3.3%
OTHER (144) (151) +4.7% +4.7% +0.0% +0.0%
TOTAL 1,282 1,284 +0.2% -2.0% +2.6% -0.4%

INCOME FROM ASSOCIATES
2017 Full-Year Results March 1st, 201844 I
In €m FY 2016Pro forma FY 2017 17/16 ∆
WATER EUROPE 23 24 +5.8%
R&R EUROPE 13 17 +29.7%
INTERNATIONAL(1) 143 169 +18.4%
WT&S 0 1 N/A
OTHER 0 0 -
TOTAL 179 212 +18.3%
(1) Mainly 23.33% stake in ACEA for €49m in 2017 and Chinese JVs for €67m in 2017

70 74 81
90106
69
2017 Full-Year Results March 1st, 201845 I
ONGOING STRONG DISCIPLINE ON COST SAVINGS
40%
50%
10%Procurementsavings
Operational savings
G&A savings
1%
37%
35%
26%
Other
Water Europe
R&R Europe
International2015
160180
H2
H1
2016
FY 2017 BREAKDOWN BY NATURE
FY 2017 BREAKDOWN BY DIVISION
In €m
2017
150

IMPACT OF CURRENCIES EVOLUTION
2017 Full-Year Results March 1st, 201846 I
1 EUR = USD GBP AUD CLP
FY 2017 average rate 1,13 0,88 1,47 732
FY 2016 average rate 1,11 0,82 1,49 748
Closing rate at 31/12/2017 1,20 0,89 1,53 737
Closing rate at 31/12/2016 1,05 0,86 1,46 704
€m FY 2017 Foreximpact
Of which an impact in €m from:USD GBP AUD CLP
Revenue 15,871 -84 -22 -69 +10 +16
EBITDA 2,641 -8 -5 -8 +2 +9
EBIT 1,284 -5 -4 -4 +1 +7
Net Financial Debt 8,473 -265 -129 -20 -3 -51

FY 2017: FROM EBITDA TO EBIT BY DIVISION
2017 Full-Year Results March 1st, 201847 I
FY 2016 pro forma (in €m) Water Europe
R&R Europe
Inter-national WT&S Other TOTAL
FY 2016
EBITDA 1,223 720 814 13 (119) 2,651
Amortization (437) (419) (226) (11) (18) (1,111)
Net provisions & depreciation (43) 70 (12) 5 (2) 22
Net concession renewal expenses (178) (75) (19) - - (272)
Employees compensation plans in shares - - - - (9) (9)
EBIT 565 296 558 7 (144) 1,282
FY 2017 (in €m) Water Europe
R&R Europe
Inter-national WT&S Other TOTAL
FY 2017
EBITDA 1,165 708 801 92 (124) 2,641
Amortization (445) (379) (245) (35) (20) (1,124)Net provisions & depreciation (36) 45 18 2 (4) 25Net concession renewal expenses (168) (70) (18) - - (256)Employees compensation plans in shares - - - - (1) (1)
EBIT 516 303 557 59 (151) 1,284
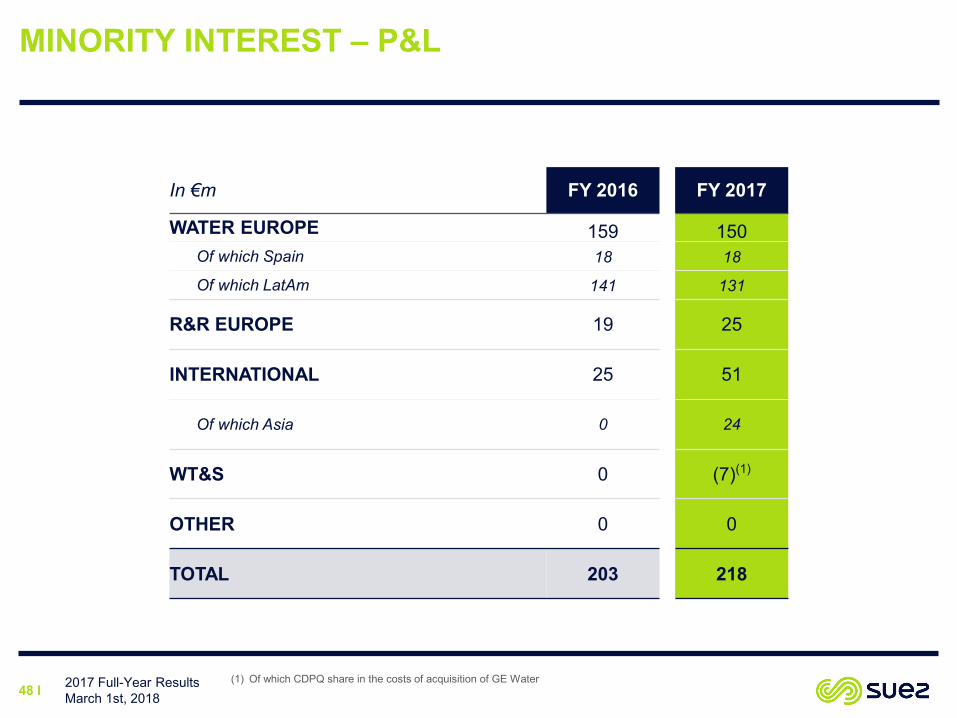
MINORITY INTEREST – P&L
2017 Full-Year Results March 1st, 201848 I
In €m FY 2016 FY 2017
WATER EUROPE 159 150Of which Spain 18 18
Of which LatAm 141 131
R&R EUROPE 19 25
INTERNATIONAL 25 51
Of which Asia 0 24
WT&S 0 (7)(1)
OTHER 0 0
TOTAL 203 218
(1) Of which CDPQ share in the costs of acquisition of GE Water

TAX POSITION
2017 Full-Year Results March 1st, 201849 I
In €m FY 2016 FY 2017
Income before tax & share in net income from Associates 687 534
Income Tax
o/w Current income tax
o/w Deferred income tax
(244)(200)(44)
(225)(126)(1)
(100) (2)
EFFECTIVE TAX RATE 35.4% 42.2%
(1) Of which +€42m for reimbursement of 3% dividend tax by French government(2) Of which -€32m for revaluation of deferred tax assets in the US due to the new tax rate implemented in 2017

EARNING PER SHARE
2017 Full-Year Results March 1st, 201850 I
In €m 31/12/2016 31/12/2017
Net Result Group Share 420 302+ coupon attributable to holders of undated deeply subordinated notes issued in June 2014 (15) (15)
+ coupon attributable to holders of undated deeply subordinated notes issued in June 2015 (13) (13)
Adjusted Net Result Group Share 393 274
In Millions
Weighted average number of outstanding shares 547.3 593.2(1)
Earnings per share (in euros)
Net income Group share per share 0.72 0.46
Net diluted income Group share per share 0.70 0.46
Total number of shares at year end 564 401 246 623 362 579(1)
of which treasury shares 1,914,796 5,067,913
(1) Including 47,468,354 of new shares issued in May 2017, part of the funding of the acquisition of GE Water

51 I 2017 Full-Year Results March 1st, 2018
APPENDICESCASH FLOW STATEMENT
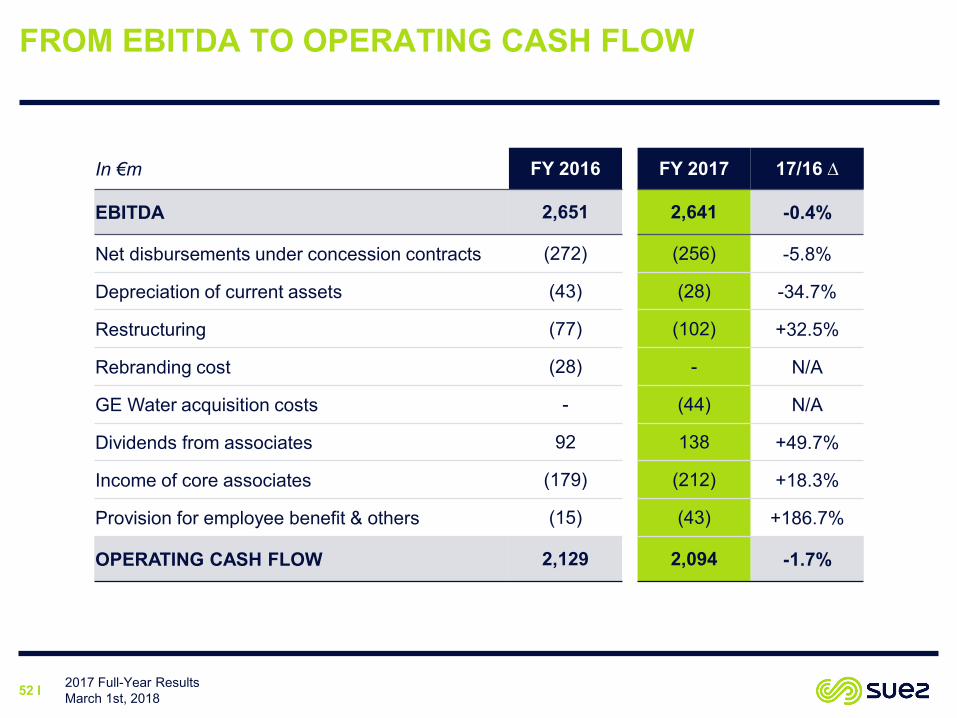
FROM EBITDA TO OPERATING CASH FLOW
2017 Full-Year Results March 1st, 201852 I
In €m FY 2016 FY 2017 17/16 ∆
EBITDA 2,651 2,641 -0.4%
Net disbursements under concession contracts (272) (256) -5.8%
Depreciation of current assets (43) (28) -34.7%
Restructuring (77) (102) +32.5%
Rebranding cost (28) - N/A
GE Water acquisition costs - (44) N/A
Dividends from associates 92 138 +49.7%
Income of core associates (179) (212) +18.3%
Provision for employee benefit & others (15) (43) +186.7%
OPERATING CASH FLOW 2,129 2,094 -1.7%

CASH FLOW GENERATION
2017 Full-Year Results March 1st, 201853 I
In €m Water R&R Europe
Inter-national WT&S Other FY 2017
Operating Cash Flow 887 505 611 19 72 2,094
Net interest paid on investment & financial activities (67) (44) (129) (17) (79) (336)
Income tax (120) (39) (31) (11) 12 (188)
Change in Working Capital (18) (18) 56 25 15 60
Maintenance Capex (206) (201) (191) (16) (13) (626)
FREE CASH FLOW 477 203 316 (0) 9 1,004
Development Investments (223) (102) (215) (12) 0 (551)
Financial Investments (64) (24) (33) (2,704) 0 (2,825)
Assets disposals 152 70 113 6 16 357
Dividends to minorities (164) (21) (31) (0) (3) (219)
TOTAL 179 125 151 (2,710) 21 (2,234)
Dividends to shareholders (352)(1)
Net new hybrid issuance 598
∆ perimeter and FX / MtMon net financial debt & other 2,419
CHANGE IN NET FINANCIAL DEBT 431
(1) Out of which €367m paid to shareholders, €42m of tax and €28m of hybrid coupon

INVESTMENTS BY NATURE AND DIVISION
2017 Full-Year Results March 1st, 201854 I
FY 2017 (in €m) Maintenancecapex
Development capex
Financial investments Disposal Total Net
investmentsWater Europe (206) (223) (64) 152 (340)
R&R Europe (201) (102) (24) 70 (258)
International (191) (215) (33) 113 (325)
WT&S (16) (12) (2,704) 6 (2,726)
Other (13) 0 0 16 3
TOTAL FY 2017 (626) (551) (2,825) 357 (3,646)
FY 2016 pro forma (in €m) Maintenancecapex
Development capex
Financial investments Disposal Total Net
investments
Water Europe (185) (237) (31) 248 (206)
R&R Europe (243) (100) (9) 156 (195)
International (136) (153) (34) 64 (259)
WT&S (11) (2) (29) 5 (37)
Other (20) (0) (1) 14 (7)
TOTAL FY 2016 (595) (492) (104) 486 (705)
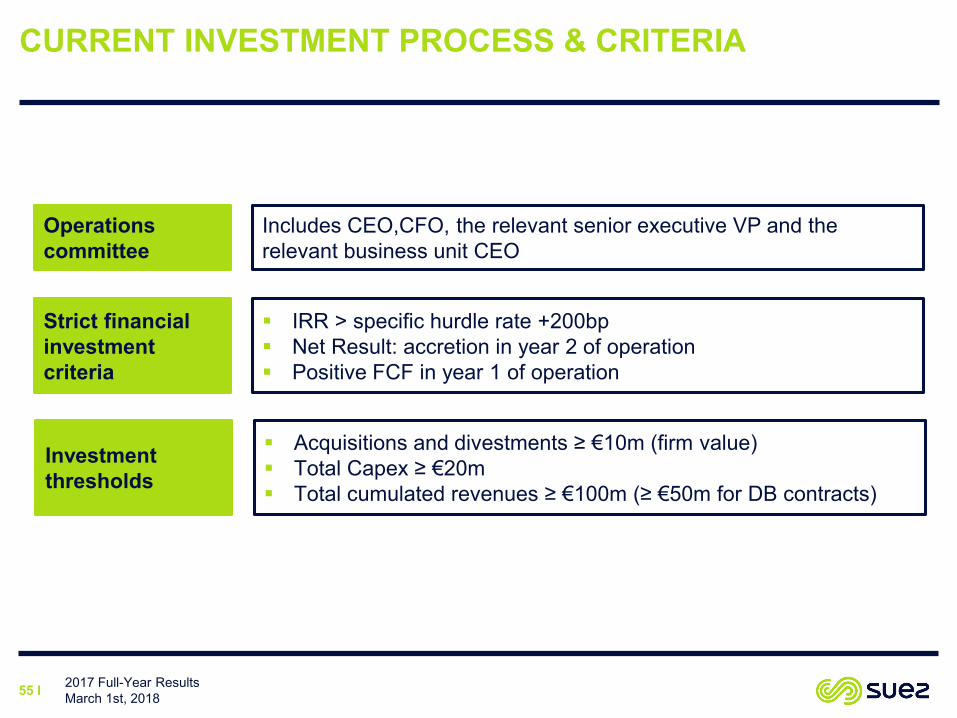
CURRENT INVESTMENT PROCESS & CRITERIA
2017 Full-Year Results March 1st, 201855 I
Operations committee
Includes CEO,CFO, the relevant senior executive VP and the relevant business unit CEO
Strict financial investment criteria
IRR > specific hurdle rate +200bp Net Result: accretion in year 2 of operation Positive FCF in year 1 of operation
Investment thresholds
Acquisitions and divestments ≥ €10m (firm value) Total Capex ≥ €20m Total cumulated revenues ≥ €100m (≥ €50m for DB contracts)

56 I 2017 Full-Year Results March 1st, 2018
APPENDICESBALANCE SHEET

SUEZ BONDS
2017 Full-Year Results March 1st, 201857 I
Pricing date Code ISIN Maturity date Duration Amount Issue Spread
Coupon Rate
16-June-14 FR0011993500 PERPETUAL N/A €500m 225 3.000%
23-mars-15 FR0012648590 PERPETUAL N/A €500m 217 2.500%10-Apr-17 FR0013252061 PERPETUAL N/A €600m 250 2.875%
Pricing date Code ISIN Maturity date Duration Amount Issue Spread
Coupon Rate
31-March-09 FR0010745976 08-Apr-19 10 years €800m 300 6.250%19-May-09 FR0010765859 08-juin-27 8 years €250m 180 1.904%08-juil-09 FR0010780528 22-juil-24 15 years €500m 160 5.500%15-juin-10 FR0010913780 24-juin-22 12 years €750m 160 4.125%12-May-11 FR0011048966 17-May-21 10 years €750m 86 4.078%22-nov-11 FR0011149962 22-nov-18 7 years €100m 90 3.080%02-Dec-11 FR0011158849 02-Dec-30 19 years £250m 260 5.375%19-mars-13 FR0011454818 25-March-33 20 years €100m 110 3.300%01-oct-13 FR0011585215 09-oct-23 10 years €500m 77 2.750%24-Feb-14 FR0011766120 27-Feb-20 6 years €350m 0.000%25-June-15 FR0012829406 01-July-30 15 years €50m 75 2.250%03-sept-15 FR0012949923 10-sept-25 10 years €500m 80 1.750%
19-May-2016 FR0013173432 19-May-28 12 years €500m 87 1.250%27-March-17 FR0013248507 03-Apr-25 8 years €500m 43 1.000%27-March-17 FR0013248523 03-Apr-29 12 years €700m 63 1.500%

FINANCIAL DEBT AND LIQUIDITY POSITION
2017 Full-Year Results March 1st, 201858 I
4.5bn
2017
6441 074
582
1 523869
578 5881 127
130 319 526
2 850
2018 2019 2020 2021 2022 2023 2024 2025 2026 2027 2028 >2028
2.3
2.2
Liquidity position Gross debt(3) maturity profileIn €m
(1) Excluding €400m of treasury bills(2) Cash net of current cash accounts(3) Gross debt net of bank overdraft and commercial paper
Cash(2)
Undrawn credit lines(1)
3.5bn
2016
2.1
1.3

FINANCIAL DEBT
2017 Full-Year Results March 1st, 201859 I
44%
27%
14%
8%5%2%
14%
79%
1%3%4%
Bank
Bond
Leasing
CommercialpaperOther
EUR
USD
OthersGBP
CLP76% 86%
11% 2%13% 12%
FY 2016 FY 2017
6,9 6,4 6,9
in years
FY 2015 FY 2016
Gross debt by type
FY 2017
HKD
Net debt by currency Net debt by rate type
Inflationlinked
Floating
Fixed
Net debt by average maturity

ASSETS & LIABILITIES OVERVIEW
2017 Full-Year Results March 1st, 201860 I
Minorities: €2,504m
309
777
706
438
274Others
AguasAndinas
127
2,024729
Non-consolidatedfinancial assets
FinancialReceivables(1)
Associates
76
788
543
749Other
provisions
Renewals(3)
Pensionliabilities
Landfills
(1) Including €413m on concessions (IFRIC12)(2) Including €76m of net renewals (accounted for in other debt)(3) These net provisions represent the gap between the expenses and the commitments on a linear basis of our
concession contracts
Provisions(2): €2,157m
Non current financial assets: €2,880m
WT&S
SUEZ NWS (China)
Spain

CAPITAL EMPLOYED
2017 Full-Year Results March 1st, 201861 I
In €m 31/12/2016 31/12/2017
Net goodwill 3,647 5,587
Tangible and intangible assets, net 12,503 12,629
Net financial assets 143 132
Investment in associates 1,900 2,098
Provisions (1,656) (1,665)
Others (850) (886)
CAPITAL EMPLOYED 15,687 17,895
In €m 31/12/2016Pro forma 31/12/2017
WATER EUROPE 5,903 5,758
R&R EUROPE 3,553 3,549
INTERNATIONAL 5,925 5,617
WT&S 230 2,996(1)
OTHERS 77 (26)
CAPITAL EMPLOYED 15,687 17,895
(1) Of which impact from GE Water consolidation for €2,895m
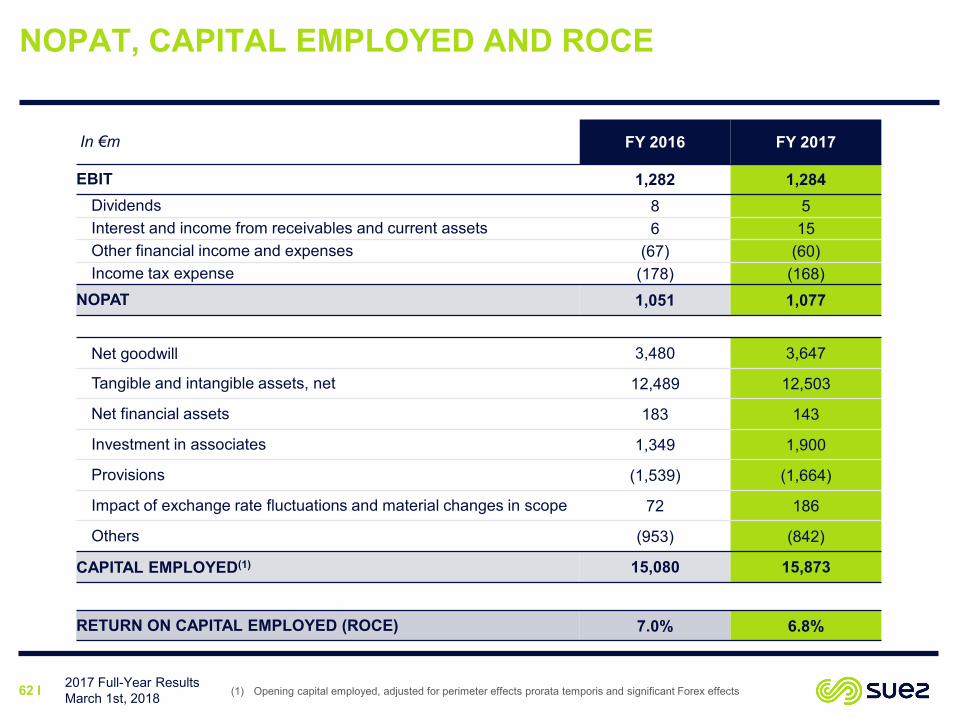
NOPAT, CAPITAL EMPLOYED AND ROCE
2017 Full-Year Results March 1st, 201862 I (1) Opening capital employed, adjusted for perimeter effects prorata temporis and significant Forex effects
In €m FY 2016 FY 2017
EBIT 1,282 1,284Dividends 8 5Interest and income from receivables and current assets 6 15Other financial income and expenses (67) (60)Income tax expense (178) (168)
NOPAT 1,051 1,077
Net goodwill 3,480 3,647
Tangible and intangible assets, net 12,489 12,503
Net financial assets 183 143
Investment in associates 1,349 1,900
Provisions (1,539) (1,664)
Impact of exchange rate fluctuations and material changes in scope 72 186
Others (953) (842)
CAPITAL EMPLOYED(1) 15,080 15,873
RETURN ON CAPITAL EMPLOYED (ROCE) 7.0% 6.8%

63 I 2017 Full-Year Results March 1st, 2018
APPENDICESACTIVITY OF DIVISIONS
32%
6%
5%5%4%8%
7%
6%
6%
11%
11%
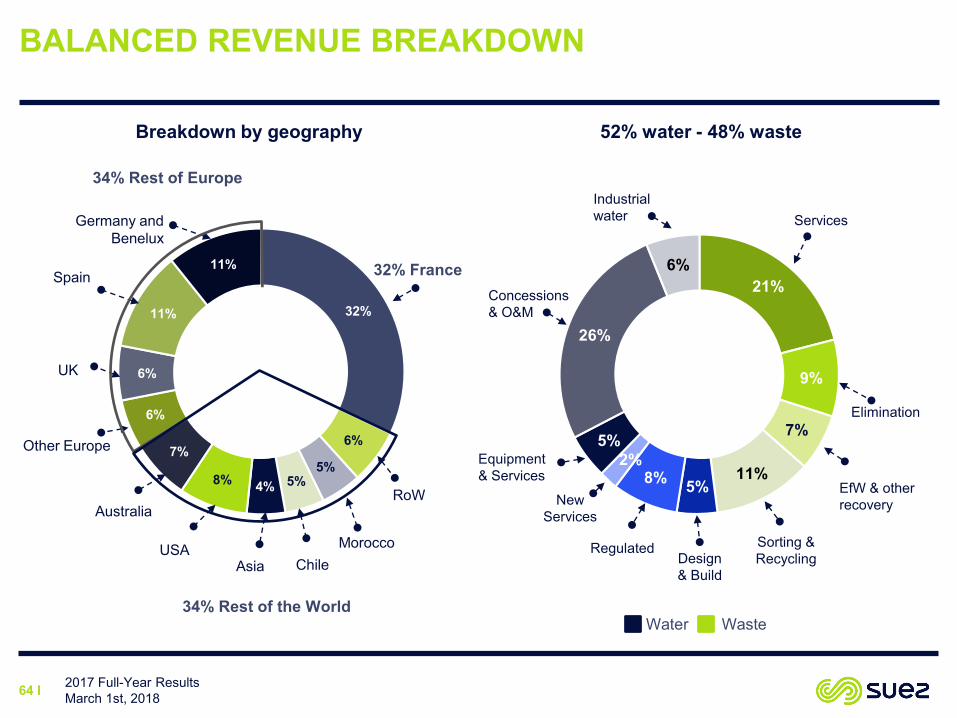
BALANCED REVENUE BREAKDOWN
2017 Full-Year Results March 1st, 201864 I
Breakdown by geography 52% water - 48% waste
34% Rest of the World
Other Europe
Chile
34% Rest of Europe
Morocco
32% France
RoWAustralia
USAAsia
UK
Spain
Germany and Benelux
21%
9%
7%
11%5%8%
2%5%
26%
6%
Services
Elimination
EfW & otherrecovery
Design & Build
Sorting & Recycling
Regulated
New Services
Equipment & Services
Concessions & O&M
Water Waste
Industrialwater
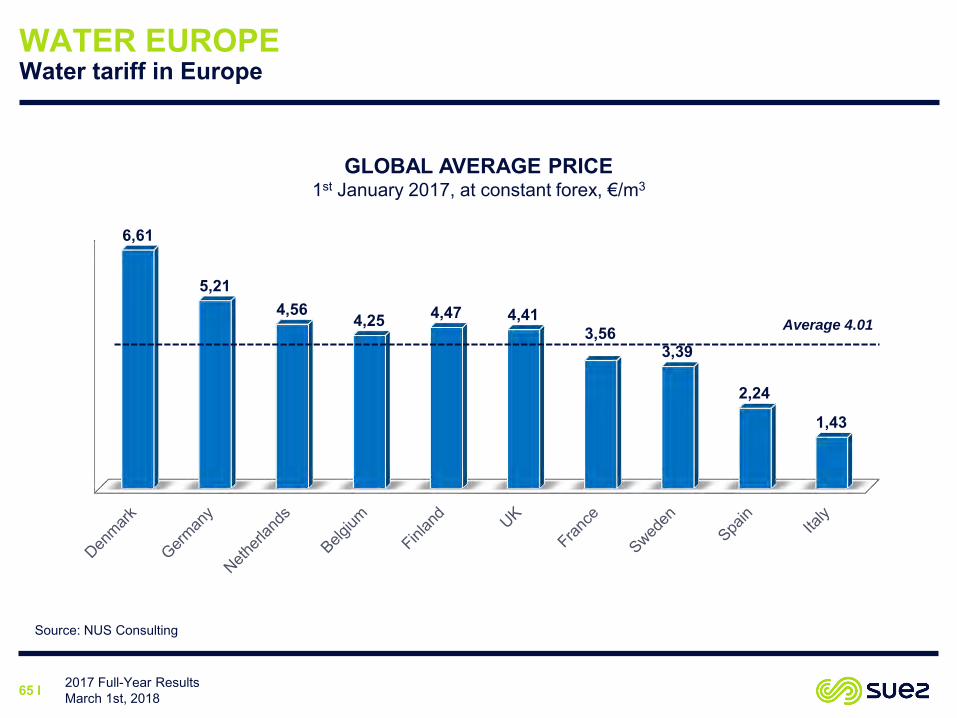
WATER EUROPEWater tariff in Europe
2017 Full-Year Results March 1st, 201865 I
GLOBAL AVERAGE PRICE1st January 2017, at constant forex, €/m3
6,61
5,214,56
4,25 4,47 4,413,56
3,39
2,24
1,43
Average 4.01
Source: NUS Consulting

RECYCLING & RECOVERY EUROPEMunicipal waste treatment mix in europe
2017 Full-Year Results March 1st, 201866 I
ANNUAL WASTE VOLUMES PER CAPITA & SPLIT OF TREATMENT MODE
Source: Eurostat - 2014 data
28%
1% 1% 1% 1% 2% 4%
17% 18%26% 28%
34%42%
49% 53%55% 56% 59%
81%27%
50%44%
54%
35%
48%38%
50%
35%
35% 27%21%
18%
21% 15% 12%18% 10%
0%
28%33%
34%
27%
47% 24%
26%
18%
28%22%
28% 28%
34% 16% 21%16%
23%25%
16%16% 16%
21% 17% 17%27%
32%
15% 19% 17% 17% 18%
6%14% 11%
17%
3% 6% 4%
Composting Recycled Incineration Landfill

800850900950
1 0001 0501 1001 1501 200
janv
-14
avr-
14
juil-
14
oct-1
4
janv
-15
avr-
15
juil-
15
oct-1
5
janv
-16
avr-
16
juil-
16
oct-1
6
janv
-17
avr-
17
juil-
17
oct-1
7
60708090
100110120130140150160
janv
-14
avr-
14
juil-
14
oct-1
4
janv
-15
avr-
15
juil-
15
oct-1
5
janv
-16
avr-
16
juil-
16
oct-1
6
janv
-17
avr-
17
juil-
17
oct-1
7
0,80
0,90
1,00
1,10
1,20
janv
-14
avr-
14
juil-
14
oct-1
4
janv
-15
avr-
15
juil-
15
oct-1
5
janv
-16
avr-
16
juil-
16
oct-1
6
janv
-17
avr-
17
juil-
17
oct-1
7
100120140160180200220240260
RECYCLING & RECOVERY EUROPECommodity prices evolution
2017 Full-Year Results March 1st, 201867 I
1.070.96
90
103
€/ton
€/literGASOIL (monthly average of the price at the pump)
1,080
951
€/tonPET (virgin material)
- Average 2014 - Average 2015 - Average 2016 - Average 2017
1.05 (paper, recycled material)BDSV Sorte 1 (ferrous metal, recycled) €/ton
219
172
155
240
114
112
871
1,030
0.92
1.07
217
126
1.03
1,027
68 I 2017 Full-Year Results March 1st, 2018
APPENDICESSUSTAINABLE DEVELOPMENT

2017 Full-Year Results March 1st, 201869 I
SUSTAINABLE DEVELOPMENTRoadmap 2017-2021: 2017 results
(a) Reference year of 2017-2021 roadmap : 2016(b) Reference year of 2015 climat commitments : 2014
Commitments & Goals
Adhere to the 2 degrees target by mitigating the causes of climate change
cum. 28Mt cum. 60Mt
6,7 TWh 10%
Adapt to the consequences of climate disruption on water1,7M
inhabitants
2M
inhabitants
Promote material recycling, recovery and reuse4,27Mt +20%
2017 vs.
Baseline (b)
Increase the production of secondary raw
2017Result
2021target
Help our customers to avoid more than 60
MtCO2e of GHG by 2021
Save the equivalent of the water
consumption of a city of more than 2 million
Increase the production of renewable
energy by more than 10%
Commitments & Goals
Promote diversity and wellbeing in the workplace
28,4% 33%
Act to ensure health and safety in the workplaceWater : 4,7
Waste : 12
Water<5
Waste<13In
progession
2017 vs.
Baseline (a)
2021target
2017Result
Achieve a level of 33% of management
positions filled by women Group-wide
Reduce the frequency rate for all Group
activities

2017 Full-Year Results March 1st, 201870 I
SUSTAINABLE DEVELOPMENTRoadmap 2017-2021: 2017 results
(a) Reference year of 2017-2021 roadmap : 2016
Commitments & Goals
Promote biodiversity and ecosystems services
15,3% 50%
Advance access to essential services4M€
34 projects
4M€ =
23,8 M
Allocate €4 Million a year to the Fonds SUEZ
Initiatives fund and, every year, support 30
projects in countries with the greatest need
Develop sustainable access to essential
services under the terms of our contracts in
developing countries
2017Result
2021target
2017 vs.
Baseline (a)
Roll out biodiversity action plans at 50% of
priority sites managed by the Group
Commitments & Goals
3,5M 20%
Innovate to develop decentralised or modular solutions for the territories of the planet
170
Accelerate the digital revolution in water & waste solutions for agriculture, industry, cities and citizens
Increase the number of connected objects
by 20%
Increase the number of decentralised or
modular solutions in Desalination, Water,
Sanitation and Waste
2017Result
2021target
2017 vs.
Baseline (a)

71 I
SUSTAINABLE DEVELOPMENTRatings: Improved results
All rating on 100 based unless otherwise indicated(1) Change in methodology(2) Change in methodology. A = maximum score
2017 Full-Year Results March 1st, 2018
Agencies Index SUEZ score
2010 2011 2012 2013 2014 2015 2016 2017
71 77 84 80* 80 79 82 82
B‟prime”
B‟prime”
B-‟prime”
B‟prime”
56 59 58 66
99 90 85
74 84 84 88 95 99 A** A
82,2 83
60 68

Sophie LombardE-mail: [email protected]
Julien DesmaretzE-mail: [email protected]
E-mail: [email protected]: + 33 (0)1 58 81 24 05
SUEZTour CB21 – 16, place de l'Iris92040 Paris La Défense Cedex
CONTACTSFINANCIAL COMMUNICATION