Embed Size (px)
Citation preview

2017HANDBOOK ON CARBON PRICING INSTRUMENTS
HANDBOOK ON CARBON PRICING INSTRUMENTS | 2
TABLE OF CONTENTS Page
FOREWORD ………...……………………………………………………………………………………4
INTRODUCTION ………...……………………………………….………………………………………5
DEVELOPMENT OF CARBON PRICING ..................................................................................... 7 Historical Perspectives ............................................................................................................ 7 The Paris Agreement ............................................................................................................... 9
CARBON PRICING INSTRUMENTS .......................................................................................... 12 Emissions Tax ....................................................................................................................... 14 Emissions Trading System (ETS) .......................................................................................... 14 Fuel Tax ................................................................................................................................. 15 Hybrid Instruments ................................................................................................................ 15
DESIGN CHOICES ..................................................................................................................... 16 First Design Choice—Scope ................................................................................................. 16 Second Design Choice—Rate or Cap ................................................................................... 17 Third Design Choice—Point of Regulation ............................................................................ 19 Fourth Design Choice—Reporting, Verification, and Enforcement ....................................... 19 Fifth Design Choice—Risk Mitigation Policies ....................................................................... 20 Sixth Design Choice—Cross-Border Linkage ........................................................................ 22
ADDITIONAL DESIGN CONSIDERATIONS ............................................................................... 24 Price Stability ....................................................................................................................................... 24 Flexibility ............................................................................................................................................... 24 Governance ......................................................................................................................................... 24 Offsets .................................................................................................................................................. 25 Complementary Policies .................................................................................................................... 25 Carbon Leakage ................................................................................................................................. 26 Stakeholder Engagement .................................................................................................................. 26 Revenue Distribution ............................................................................................................. 27 Summary of Additional Design Considerations ..................................................................... 28
DESIGN AND SOCIAL IMPACTS ............................................................................................... 30 Poverty and Impact on the Poor ............................................................................................ 30 Corruption .............................................................................................................................. 30
NONMARKET ALTERNATIVES .................................................................................................. 32 Production Tax Credit ............................................................................................................ 32 Election to Investment Tax Credit .......................................................................................... 33

HANDBOOK ON CARBON PRICING INSTRUMENTS | 3
Promoting Electric Cars ......................................................................................................... 33 PROGRAMMATIC PRECEDENT ................................................................................................ 35
ETS Programs ....................................................................................................................... 35 Alberta ................................................................................................................................... 35 California ............................................................................................................................... 35 Quebec .................................................................................................................................. 37 China Subnational ................................................................................................................. 37 RGGI ..................................................................................................................................... 39 Japan Subnational ................................................................................................................. 41 Republic of Korea .................................................................................................................. 42 Carbon Tax Programs ........................................................................................................... 42 Mexico ................................................................................................................................... 42 South Africa ........................................................................................................................... 42 British Columbia .................................................................................................................... 43 Norway .................................................................................................................................. 43 United Kingdom ..................................................................................................................... 43 France ................................................................................................................................... 44 Fuel Tax Programs ................................................................................................................ 44 India ....................................................................................................................................... 44
DESIGN PRINCIPLES SUMMARY ............................................................................................. 45

HANDBOOK ON CARBON PRICING INSTRUMENTS | 4
FOREWORD Today, you don’t have to look very far to see the reality of the climate crisis. On some days, most of us only have to look out our windows. As rising temperatures set new records year after year and extreme storms and floods, droughts and fires become more frequent and more destructive all around the world, forward-looking civic and business leaders and policymakers are asking, “What can we do? And how soon can we do it?” The single most important answer is simple: Put a meaningful price on carbon pollution. Every day, we’re dumping 110 million tons of carbon pollution into the atmosphere as if it was an open sewer, trapping heat, warming our planet and causing all kinds of impacts from tropical diseases spreading poleward to rising seas that now threaten to swallow the Florida coast. Carbon pricing harnesses the power of market forces to tackle this danger head-on, encouraging polluters to cut these dangerous emissions in a big way and accelerating the shift to a clean energy economy. Better yet, done right, carbon pricing also spurs innovation and helps create jobs with a future in wind and solar, energy storage and efficiency. We know carbon pricing works. China has already successfully launched several pilot carbon markets in key cities in preparation for a nationwide scheme. British Columbia introduced a revenue-neutral carbon pricing plan in 2008 – the first government in North America to do so – and has seen its economy flourish. Major Indian companies are voluntarily introducing internal carbon pricing in advance of government action. These are only the tip of a slow-moving, but very large iceberg. The handbook that follows outlines some of the basics of carbon pricing, including several proven approaches – and describes the advantages and challenges of each. There’s no single approach that’s right for every region and every country – but there’s an approach that’s right for every region and every country. The more policymakers – and the people who elect them – who see this, the more progress we make in solving this crisis. The French novelist Victor Hugo once wrote, “You can resist an invading army; you cannot resist an idea whose time has come.” Carbon pricing is an idea whose time has most certainly come. The handbook you hold is a tool to spread this vital idea far and wide. Please help. It's time for all of us to get to work. Al Gore Founder and Chairman The Climate Reality Project
HANDBOOK ON CARBON PRICING INSTRUMENTS| 5
INTRODUCTION The climate crisis presents the global community with an unprecedented challenge. We are living through the the longest period of above-average temperatures ever recorded.1 Sixteen of the 17 hottest years on record have come since 2001 and 2016 has just set a new record as the planet’s hottest year ever – beating the record set in 2015, which beat 2014 before it.
Evidence shows that rising temperatures are altering the Earth’s climate and destabilizing the global ecosystem. Countries around the globe are experiencing increasing extreme heat, drought, and precipitation, along with greater cyclone strength and activity and rising food insecurity. These threats in turn have been linked to political instability, war, and refugee crises.2 The climate crisis is, in the words of one commentator, a “super wicked problem,” one with “enormous interdependencies, uncertainties, circularities, and conflicting stakeholders implicated by any effort to develop a solution.”3
Carbon pricing instruments — most prominently, emissions taxes and emissions trading or cap-and-trade systems — use market mechanisms to drive down greenhouse gas (“GHG”) emissions, which are the primary catalysts of climate change. By incentivizing markets to reduce emissions through taxes or allowance trading systems, carbon pricing instruments have the potential to decarbonize the world’s economic activity and unleash technological innovation. All while generating revenues that can be put to productive use.
However, designing carbon pricing instruments carefully is essential. Without proper design, the costs of reducing carbon emissions can fluctuate unpredictably, meaning carbon emissions can migrate across borders to unregulated jurisdictions and carbon-intense emitters avoid paying their fair share altogether. Ultimately, poor design facilitates program collapse.4
This Handbook on Carbon Pricing Instruments (the “Handbook”) serves as a current best practices guide for designing and implementing carbon pricing instruments. The Handbook outlines the context for carbon pricing, highlights the trade-offs and choices in determining the optimal carbon pricing instrument for each context, and examines the political decisions and social welfare concerns faced in pricing carbon.
Carbon pricing instruments are receiving increasing market support and attention as the world grapples with how to reduce GHG emissions. At the UN’s COP 21 climate conference in Paris in 2015, more than 190 countries committed to a framework to hold global temperature rise to well below 2ºC and pursue efforts to stay below 1.5 ºC.5 As will be discussed below, carbon pricing instruments will play a large role in reducing emissions to meet this goal. Further, carbon pricing instruments cover an increasing proportion of the world’s emissions. In 2016, carbon pricing instruments covered approximately 13 percent of global emissions.6 With China’s carbon market expected to come online in 2017, analysts project that approximately 16 percent of global emissions will be covered by an ETS by the end of the year.7

HANDBOOK ON CARBON PRICING INSTRUMENTS| 6
Further, the number of carbon pricing instruments enacted by governments has expanded by 90 percent since 2012 and will grow quickly, in part because emerging economies are becoming an increasingly important part of the carbon price story. 8 Emerging economies with new infrastructure needs have the unique opportunity to set themselves on a clean energy path from the outset and avoid the costs of retrofitting existing carbon intensive infrastructure that more industrialized countries currently face. Designing appropriate carbon pricing instruments can create the policy framework and revenue sources for clean infrastructure development to occur.
Finally, the choice and design of a carbon pricing instrument should always be driven by national circumstances and political context. Political challenges – such as the recent election of a US president hostile to climate action – can threaten any nascent (or even established) program, and the political challenges facing carbon pricing instruments often cut across multiple jurisdictions and face resistance from stakeholders and entrenched interests. Even so, there is reason to hope as a truly global transformation is already under way. Even in the private sector, businesses are increasingly supporting carbon pricing — recently, 100 investors signed a “Put a Price on Carbon” statement.
This Handbook attempts to answer the above challenges. It is written not as an academic primer or policy product but instead as a practical guide and template for legislators, policymakers, regulators, and advocates to use in thinking carefully about the successful design of a carbon pricing instrument.
We hope it proves useful.
The Climate Reality Project
May 17, 2017
HANDBOOK ON CARBON PRICING INSTRUMENTS | 7
DEVELOPMENT OF CARBON PRICING Historical Perspectives. The use of market forces to address environmental harm has a long pedigree. In 1968, in a 111-page volume entitled Pollution, Property & Prices, a Canadian economist named John H. Dales proposed the first use of market-based caps and tradable allowances to address emissions.9 The use of taxes to address environmental harm goes even farther back. Environmental taxes, including carbon taxes, are based on the concept of a Pigovian tax, named after early twentieth-century British economist Arthur Pigou. 10 Pigou identified and developed the concept of economic externalities, or a cost or benefit that affects a person who did not choose to incur that cost or benefit.11 In the case of a negative externality, or cost, taxing such cost provides a means to internalize it.
One of the first forays of the United States into environmental emissions trading was a 1982 Environmental Protection Agency (EPA) program to address a leaded gasoline phasedown. The EPA’s program relied on historical levels of lead production to calculate and assign implicit property rights to producers (a type of credit) that could be sold and give rise to a trading market.12 The EPA’s Acid Rain Program (often referenced as the first cap-and-trade program) was codified as Title IV in the 1990 Amendments to the Clean Air Act. The Acid Rain Program addressed sulfur dioxide emissions from coal-fired power plants. Initially generating controversy among industry and environmental groups, the “acid rain program” resulted in a resounding success: a 36 percent reduction in fossil fuel emissions causing acid rain from 1994–2000,13 with 100 percent industry compliance.14
For greenhouse gas emissions, the first set of carbon pricing instruments were taxes in Scandinavia in the early 1990s. Finland adopted a carbon tax in 1990; Sweden and Norway followed suit in 1991; and Denmark enacted its carbon tax in 1992.15 But emissions trading followed. In 2005, in the United States, a memorandum of understanding (MOU) between governors of a block of northeastern states created the Regional Greenhouse Gas Initiative (“RGGI”), the first mandatory market-based effort to reduce GHG emissions in the US.16 These developments reflected a traditional split between Europe, which favored using a tax, and the US and regional blocks, which were energized by the use of cap-and-trade.17
Likewise, in 2006, the California State Legislature passed the Global Warming Solutions Act. This legislation required the state of California to reduce greenhouse gas emissions to 1990 levels by 2020, an expected 15 percent reduction from the “business as usual” scenario.18 A key component of California’s emissions reduction strategy was (and remains to date) a cap-and-trade program that implements a declining statewide limit on sources responsible for 85 percent of California’s GHG emissions.19 This was the first program in the US to attempt to cover emissions sources comprehensively.

HANDBOOK ON CARBON PRICING INSTRUMENTS | 8
International incentives have also begun to gather steam. In 2005, pursuant to targets in the Kyoto Protocol, nations continued to explore environmental markets as a means of emissions reduction. Importantly, under the Kyoto Protocol, there was no requirement to use a carbon market as the only tool to reduce emissions domestically.20 For example, in 2005, when the Kyoto Protocol came into force, Europe and Norway instituted domestic ETSs and Japan enacted a voluntary trading system to implement its commitments.21
The pace of ETS implementation worldwide has quickened; now, almost 40 percent of global GDP is produced by jurisdictions with an emissions trading system.22 At last count, 40 nations and 20 US states, provinces or cities have adopted emissions trading systems. 23 Carbon markets are now the largest class of environmental markets by wide margins.24 After the launch of China’s national ETS in 2017, early estimates indicated that nearly half of global GHG emissions will originate in jurisdictions putting a price on carbon.25 China’s national ETS will expand seven pilot programs already in existence into a national market covering major carbon-emitting sectors of Chinese industry, including power generation, with over 8,000 companies initially covered by the system.26 Provincial governments can expand the scope of the ETS to cover additional sectors of the economy.27
This accelerating pace of change represents a broadening consensus on action amongst governments, the private sector, and civil society. As noted above, the threat of increasing extreme and unpredictable weather events — hurricanes, flooding, snowstorms and the like — has mobilized everyone from residents of coastal communities to ranchers to skiers. These threats are increasingly well-documented in the scientific and policy literature and in the press. Geographical concerns are at play as well. Island and low-lying coastal nations’ concern focus on rising sea levels, storm surges, and salinization of ground-water supplies. And in the realm of the seas, ocean acidification remains a concern of scientists, fisheries managers, and those that make their living from or survive off the sea.
Meanwhile, governments and their militaries’ concerns focus on national security and stability impacts. With unpredictable weather and rising temperatures, famine, disease burden, and climate refugees will create a pressing crisis that requires attention. On the national security front, the climate crisis acts as “an accelerant of instability around the world, exacerbating tensions related to water scarcity and food shortages, natural resource competition, underdevelopment, and overpopulation,” leading to conflict, political volatility, war, and increasing the conditions for terrorism.28
As a result, a climate refugee crisis has begun and been well recognized. As one example, the residents of Pacific Islands like Tuvalu, have been forced from their homelands by rising sea levels.29 Then there is the Uru-Murato community of Bolivia, whose economy relied on Lake Poopó, now gone dry, and whose members have been forced to find jobs in salt mines.30 In the US, members of the Biloxi-Chitimacha-Choctaw Indian tribe living on Isle de Jean Charles, in

HANDBOOK ON CARBON PRICING INSTRUMENTS | 9
southern Louisiana, were awarded federal funding—$48 million—to relocate en masse.31 These examples are only a few of a growing number.
Subnational jurisdictions also belong to this growing list of affected stakeholders. Cities, states, provinces, and private markets and businesses are increasingly feeling the reality of the climate crisis and becoming interested in being part of the solution.
Beyond the scale and importance of the challenge, what explains the trend of increasing use of environmental markets to address carbon pollution? For one, countries’ confidence in implementing and running efficient carbon pricing systems has increased, bolstered by the development of core principles and lessons learned to address political challenges like competitiveness, corruption, price stability, programmatic impact on the poor, and productive use of revenues.32 Additionally, the private sector is moving beyond “business as usual” to develop internal carbon pricing systems. In 2015, there was a three-fold increase in the number of global companies placing an internal price on carbon, with the largest growth in Asia, in part due to the adoption of ETSs in China and Korea.33
Perhaps the foremost driver is the global agreement inked at COP 21 and the country commitments submitted for its implementation. Countries are responding to this diplomatic success and are attempting to implement policies to achieve the Paris Agreement’s goals.
The Paris Agreement. No other recent development in the effort to address the climate crisis has received as much attention as the Paris Agreement. This triumph of international diplomacy represents a key step forward in creating a global market for carbon pricing instruments. Notably, the legal text of the Paris Agreement does not contain the word “market.”34 The phrase “carbon pricing” is also absent.35 But contrary to the expectations of initial observers, who thought that markets would play a diminished role in the final text, including some experts who anticipated total omission, the agreement actually sets the framework for market creation.36 Moreover, the international community commended the Paris Agreement’s strong support for market-based carbon pricing instruments; one observer even called it an international “Carbon Markets 2.0” framework.37
The Paris Agreement contains three policy mechanisms that encourage the development of international carbon pricing and markets. The first is voluntary cooperation through “internationally transferred mitigation outcomes” (ITMOs). The second is support for results-based payments to implement policy approaches.38 The third is United Nations Framework Convention on Climate Change (UNFCCC)-governed mechanisms to support mitigation and sustainable development.39
These policy mechanisms are captured in two key paragraphs that discuss how carbon markets would prove useful to meet climate stabilization goals.

HANDBOOK ON CARBON PRICING INSTRUMENTS | 10
Paragraph 6.2 outlines a process by which countries are to engage on a “voluntary basis in cooperative approaches that involve the use of internationally transferred mitigation outcomes towards nationally determined contributions.” 40 ITMOs can be used to meet a country’s Nationally Determined Contribution (NDC). NDCs are the individual mitigation goals that each country may set for itself based on its unique internal circumstances.41 Paragraph 6.3 notes that “The use of internationally transferred mitigation outcomes to achieve nationally determined contributions under this Agreement shall be voluntary and authorized by participating Parties.”42
These paragraphs do not create carbon markets in practice. But they do grant wide latitude for countries to create an international market. They also neither restrict or qualify the units that are part of the transfer of ITMOs or which mechanisms, procedures or protocols generate the them. Therefore, any cooperative approach, such as JCM, REDD+, EUAs, or the like, would be covered by Paragraphs 6.2 and 6.3.43 Indeed, indications exist that countries are using this flexibility to form regional carbon markets.
Ratification by a country of the Paris Agreement proceeds in accordance with the ratification procedures for international treaties of each of the signatories. The agreement opened for signature on April 22, 2016 and was written to enter into force 30 days after at least 55 parties representing at least 55 percent of global greenhouse gas emissions have deposited instruments of ratification.44 On the first day the Paris Agreement opened for ratification, 90 percent of the parties to the UNFCCC became signatories, and 15 parties deposited instruments of ratification.45 With more and more parties depositing their own instruments of ratification in the months that followed, the agreement entered into force on November 4, 2016, less than a year after its signing.46 The speed at which this happened is unprecedented in recent experience of international agreements, offering a powerful confirmation of the importance nations attach to combating the climate crisis and realizing the agreement’s many inherent opportunities.47 Another encouraging sign for international cooperation around the agreement was the concurrent formal approval by the United States and China, reflecting a rare cooperation between the countries, which together represent almost 40 percent of global carbon emissions.48 As of November 6, 2016, 100 parties had ratified the agreement.49 As the Paris Agreement entered into force, implementation became the focus. The agreement’s governing body held the first Conference of the Parties serving as the Meeting of the Parties to the Paris Agreement (the “CMA”) in Marrakech, Morocco in conjunction with COP 22 from November 7-18, 2016.50 Going forward, the parties need to complete an implementation rule book, which requires negotiating the requirements to report and account for their actions.51 Individual parties must also take action to implement the agreement and follow through with their intended nationally determined contributions (“INDCs”).

HANDBOOK ON CARBON PRICING INSTRUMENTS | 11
As of May 1, 2017, 165 INDCs representing 191 parties had been submitted to the UNFCCC. Ninety of the submitted INDCs included proposals for ETS, carbon taxes, and other carbon pricing initiatives. 52 The previously submitted INDCs transformed into NDCs once the agreement entered into force.53 The NDCs can now be resubmitted at any time to set more ambitious goals, but the plans cannot be weakened.54 Some countries have already taken steps to meet their NDCs. In October 2016, Canada announced a national carbon price of 10 Canadian dollars per ton in 2018, increasing to 50 Canadian dollars in 2022.55 In August 2016, Mexico announced a year-long ETS pilot program slated to begin in November 2016, followed by a national ETS starting in 2018.56 Provinces and territories will have the choice of implementing a carbon tax or ETS to meet the national price.57
Finally, the Paris Agreement, while not explicit about a framework for carbon pricing instruments or adoption, does in Paragraphs 37-39 of the COP decision text contain a commitment that countries will adopt various rules and modalities for Articles 6.2 and 6.4. Article 6.4 in particular establishes an emissions mitigation mechanism (EMM), which provides for GHG reductions against NDCs and simultaneously encourage sustainable development.
In summary, the idea of using market forces to mitigate environmental harms has a deep history. In a recent survey of governments, private actors, and public sector organizations, the International Emissions Trading Association (IETA) found that 82 percent of survey respondents believe that existing carbon markets will expand in scale as a result of the Paris Agreement. This figure is up from 58 percent in 2015.58 The use of market forces, like carbon pricing instruments, to address environmental problems has been applied on an increasingly aggressive global scale to address climate change and GHG emissions and this trend should continue under the Paris Agreement.

HANDBOOK ON CARBON PRICING INSTRUMENTS | 12
CARBON PRICING INSTRUMENTS The Four Pricing Instruments. Broadly, four market-based carbon pricing instruments underlie efforts to reduce carbon globally: (A) emissions taxes, (B) emissions trading systems, commonly abbreviated as ETSs, (C) fuel or input taxes, and (D) hybrid instruments. ETSs are becoming the most common choice, with nearly 35 international jurisdictions adopting ETS programs to date.59 The following map shows the growth of the two main types of carbon pricing instruments, emissions taxes, and ETSs through 2016:

HANDBOOK ON CARBON PRICING INSTRUMENTS | 13
Source: World Bank, 2016: State and Trends of Carbon Pricing.

HANDBOOK ON CARBON PRICING INSTRUMENTS | 14
Emissions Taxes are taxes levied on emissions, typically carbon, and applied either upstream or downstream. Emissions taxes therefore are explicitly linked to the carbon content of fuels but do not guarantee a standard level of reduction. Taxes are generally set by modeling the cost of reducing emissions to a specific target.60 Any inaccuracies in the model will result in actual emissions reductions that differ from the target.61
An emissions tax is generally easier to implement than other carbon-pricing instruments, because it’s relatively simple to administer.62 However, an administrative burden can arise from the dynamic approach frequently needed to set tax rates in response to changing circumstances.63 And as a “tax,” emissions taxes traditionally have faced much greater political opposition from conservative and business communities.
Emissions Trading System (ETS). An emissions trading system, often referred to as “cap and trade,” involves setting up a market for tradable emissions allowances and then capping the amount of emissions allowed. The cap functions as an absolute limit on emissions to create scarcity and a price incentive. Trading, i.e., the buying and selling of allowances to emit carbon (or a mix of greenhouse gases), allows a regulated entity to cut emissions in the most cost-effective way possible.64 Emissions trading systems seek to reduce the production of GHGs through economic incentives that progressively increase the cost of emitting GHGs and foster the economic competitiveness of low carbon footprint alternatives.65 Theoretically, these market-based instruments are more efficient than “command-and-control” approaches for cutting GHG emissions,66 because actors can deal with their unique emission reduction challenges with limited government intervention and minimal regulatory disruption.67
There are two basic types of emissions trading: compliance schemes and voluntary programs. Markets in a compliance scheme are created and controlled by national, regional, or international GHG reduction regulatory frameworks. They operate on the basis of pre-determined annual limits for the emissions of certain greenhouse gases, and they create economic constraints for GHG production by economic actors — e.g., factories, power-production facilities, and other installations. Depending on the GHG volume emitted each year, actors obtain emission allowances that they can sell when they emit GHGs below the permitted “cap” or that they can buy from other actors in the marketplace when they are in need. Each year, actors failing to purchase or surrender sufficient allowances to cover their emissions face fines, while those that reduce emissions can either keep spare allowances to cover future needs or profit from their sale to other actors that have exceeded their respective annual quotas or that wish to bank allowances for future excess. Conversely, actors operating in the context of voluntary programs deal outside compliance markets.68
Voluntary schemes enable businesses, governments, NGOs, and individuals to offset the GHG emissions to voluntary buyers — i.e. corporations, institutions, and individuals. While this handbook is not focused on voluntary markets, their presence may impact mandatory schemes. Voluntary transactions are often employed to test new procedures, methodologies, and

HANDBOOK ON CARBON PRICING INSTRUMENTS | 15
technologies, as they can be implemented with fewer transaction costs than those taking place in the context of mandatory markets.69
Fuel Tax is the direct taxation of a fuel — in this case fossil fuels — that aims to discourage its purchase and eventual use. Fuel taxes differ from emissions taxes by their focus on the fuel input instead of the emissions output. That is, an emissions tax often does not take into account the carbon content of the fuel. Due to differences in tax rates and in the carbon content between fuels, the implicit carbon taxes created by excise taxes can vary greatly among fuels.70 Many countries have fuel taxes already, but in many cases these taxes are low and uneven, especially for coal. Aligning existing fuel tax levels with other energy policies crucially complements an economy-wide carbon price signal.71 Hybrid Instruments are a mix of an emissions tax and an ETS and are an increasingly popular option. Recent research has found that, in the presence of cost uncertainty, the hybrid system enjoys efficiency advantages when it combines features of price-setting (tax) and quantity-based (ETS) instruments.72 The flexibility of hybrid instruments, such as hybrid options combining quantity objectives and price caps or quantity objectives indexed on some economic variable, may be more palatable than fixed quotas to governments wary of possible additional costs.73 Hybrid instruments therefore could help engage a broader set of countries in a cost-effective strategy for combating the climate crisis. 74 Generally, economists believe that emissions prices set outside the regulatory framework are superior. When a hybrid system uses a price floor or a price ceiling, it attains a measure of exogeneity to its pricing.75
The range of hybrid designs is unlimited, and many carbon pricing instruments are actually hybrids. Most of the advantages of an ETS are also present in a hybrid system, and indeed, many policies that are ETS in name are hybrid in practice. 76 For example, any ETS instrument that operates with a price floor or price ceiling to stabilize the market price of tradable allowances adds a price-setting element to a quantity-based system.
One hybrid form uses emissions taxes as transitional mechanisms towards an ETS. For example, until it was repealed in 2014, Australia’s system was actually a hybrid: a “phased” carbon instrument that began as a permit system with a fixed, annually-increasing government-determined price and acting like an emissions tax, but also using the institutional architecture of a cap-and-trade scheme. Under Australia’s scheme, emitters were under a permit liability, and the government sold an unlimited number of permits at a predetermined price with a transition to actual permit trading after several years.77
Another hybrid option involves a jurisdiction differentiating by sector, that is, an ETS could be applied to a subset of carbon-producing activity, and a carbon tax can be applied to other sectors. Another hybrid option is to use the concept of offsets within the context of a carbon tax, thereby combining the elements of each system.

HANDBOOK ON CARBON PRICING INSTRUMENTS | 16
DESIGN CHOICES A jurisdiction enacting a carbon pricing policy, whether an emissions tax, an ETS, or a hybrid, faces six principle design choices: (1) scope; (2) setting a price or cap; (3) setting a point of regulation; (4) reporting and verification; (5) risk mitigation policies; and (6) cross-border linkages. Perhaps the two most important design choices faced are scope (i.e., the entities or sectors of the economy and the greenhouse gases covered by the carbon pricing instrument) and the price or cap set (i.e., the tax rate that explicitly determines the price of carbon or the emissions cap, which implicitly determines the price of carbon once trading of emissions allowances go into effect).
First Design Choice—Scope, which involves determining the program sectors covered under the program. Various scopes have been enacted. California’s ETS and British Columbia’s emissions tax are broad in scope, covering sectors of the economy ranging from transportation to industrial sources to residential use of natural gas. Other programs are targeted. Beijing’s pilot ETS covers only a subset of its power sector, and Norway’s emissions tax contains exceptions and reduced rates for fishing, domestic aviation, and the shipping industry. Exemptions generally can undercut the effectiveness of any carbon pricing policy, be it a tax or an ETS. For example, South Africa’s carbon tax exempts the agriculture, forestry, land use and waste sectors in the first five-year period.78 The political bargaining process can lead to explicit exemptions and limitations of scope.
Tax Base (Tax): Scope in the context of an emissions tax concerns the tax base. It is important to include those sources of emissions with low marginal abatement costs in the tax base, even if the overall source of the emissions is low from a volume standpoint; marginal abatement costs, or how much it costs to achieve an additional unit of abatement, matter more than total size of emissions.79
Sectors / Regulated Entities (ETS): The crucial scope decision in an ETS program is what sectors to cover (e.g., utility, transportation, industrial, commercial, agricultural or residential).80 Typically, a program will cover at least the power and industrial sections.81 The design trade-off is one between inclusion and monitoring and enforcement costs. Too many small entities and administrative costs might be prohibitive, though if small firm sectors like transportation are not included, the program will lose the ability for low-cost reductions.82
Covered Gases (ETS & Tax): The third scope choice to be made concerns which GHGs to regulate, and usually boils down to whether the program covers only CO2 or other greenhouse gases as well.83 This decision is usually dependent on the structure of the economy. For example, though CO2 makes up by far the largest share of GHGs globally, methane is often also added as a significant portion of emissions in jurisdictions where landfill or agricultural emissions dominate.84 Regardless of which gases are covered, if

HANDBOOK ON CARBON PRICING INSTRUMENTS | 17
gases other than CO2 are covered they need to be measured in CO2e, or CO2 equivalent, which the Intergovernmental Panel on Climate Change (IPCC) expresses as a gas’ global warming potential (GWP). California’s AB 32, for example, covers all six major GHGs, while by contrast Kazakhstan’s ETS only covers CO2.
Second Design Choice—Rate or Cap. Setting the tax rate under an emissions tax policy or the cap under an ETS policy represents a second crucial design step.
Tax Rate (Tax): Theoretically, the tax rate should be set to equal the marginal harm from emissions. In practice this is difficult as great uncertainty exists in terms of the harms and costs of carbon emissions, and the tax rate will change over time as new information becomes available.85 That is, the tax rate should be set at the intersection of the marginal cost of abatement. For example, the cost of reducing another unit of carbon, and the marginal abatement benefit curve, i.e., the benefit to society and the environment of an additional unit reduction in carbon.86 This calculation requires many assumptions about firm behavior and environmental damage.87
An alternative approach, and one adopted by many jurisdictions, is to set a series of rates that increase over time and thereby result in a particular reduction in emissions.88 To cope with uncertainty, delegate or partially delegate rate setting authority to an expert agency. For example, in the US, an interagency working group was convened by the Council of Economic Advisers and the Office of Management and Budget to design a social cost of carbon modeling exercise and develop estimates of the social cost of carbon. Although in this case the estimates were not used to set a carbon tax rate (instead they were used to analyze the impact of various rulemakings by, for example, the Environmental Protection Agency and the Department of Transportation), an interagency workgroup or governmental entity could attempt to determine the social cost of carbon and set carbon tax rates accordingly.89
Another approach with a carbon tax is to start with a low level and expand coverage and price level progressively to ease the transition.90 An alternative approach is to estimate a staircase of tax rates designed over time to meet an ex ante determined level of emissions.91 This requires forecasting the effect of the tax on environmental outcomes, which can be difficult. Many emissions taxes, however, use this approach, envisioning a schedule of rates that increases over time like a schedule of caps for an ETS that falls over time.92
Cap Setting (ETS): The setting of the cap is crucial to the success of any ETS program. ETS programs operate almost universally on a stepwise cap, whereby an initial compliance period is mandated with an initial cap, and over time the cap is adjusted downward to create stringency but also to allow regulated entities time to adjust their behavior to comply. This time lag also allows for the creation of the often-complex

HANDBOOK ON CARBON PRICING INSTRUMENTS | 18
regulatory apparatus that must be enacted to allow the ETS market to function and minimize the disruptive economic effects of new regulation.93
In an ideal world for environmental protection, a cost-blind approach to cap setting would dominate. The cost of compliance would not be considered, and the cap in each compliance period would be set to achieve a certain emissions reduction outcome. Emissions reductions would be set at what is environmentally acceptable, rather than what is politically affordable.94 Ultimately, however, costs are usually considered. And the consideration of costs often also mandates the consideration of technology existing that firms would use to achieve emissions reductions.95
Even in a world where compliance costs are considered, the optimal economic approach still produces beneficial outcomes because it sets the cap at a level maximizing social welfare without taking into account political bargaining.96 That is, the cap should be determined via optimization of a schedule of the social costs and benefits of avoiding climate damages, discounted to present value.97
Yet political bargaining always impacts the design process, and a cap may need to be revisited and revised. The California Air Resources Board (CARB) recently faced allowance oversupply concerns and policy uncertainty issues that resulted in unsold allowances worth almost $940 million and secondary market prices falling below the auction price floor.98 To deal with these issues, CARB recently issued a draft proposal to extend the state’s cap-and-trade program beyond 2020,
Allocation. Lastly, related to the cap is the process of allowance allocation. There are three methods of allocating permits in an ETS: free allocation, an allowance auction, or a hybrid.
With free allocation, the government distributes allowances to entities at no cost.99 In this scenario, the determination of how many allowances each entity receives in the initial allocation becomes a complicated issue. One allocation method is grandfathering, where allowance allocations are determined by a historic emissions level for industry participants. 100 Another method of distribution in a free allocation system is benchmarking. With benchmarking, allowances are distributed according to an industry baseline, which is often set based on a chosen or calculated emissions rate.101 The baseline may also be set based on industry production output.102 Participants whose emissions fall below the benchmark are rewarded with proportionally more allowances than participants who emit more than the benchmark.103
A concern with free allocation is that it reduces the incentive to reduce emissions, but this might not be a practical concern. Each additional unit of emissions faces an opportunity cost, that is, an additional unit of pollution either reduces the number of

HANDBOOK ON CARBON PRICING INSTRUMENTS | 19
allowances the covered firm can sell, because it must use these allowances to cover its own pollution, or raises the number of units the firm must buy to be in compliance.104 Free allocation in the power sector can also have distributional consequences. In deregulated power markets, competitive pressures lead power prices to reflect the price placed on carbon content, and the ratepayers ultimately pay the compliance costs.105 The opposite is true in a regulated power market, where regulators would not allow utilities to count free allowances as a “cost” to pass along when the utilities set electricity prices.106
With an auction, allowances are sold for a price through a government regulated auction mechanism. The primary benefit of an auction is it generates revenues for the government that can be used for other programs. But there are also downsides to auctions. An auction can face stiff political opposition from carbon-intensive industries like coal because these entities must buy a comparatively high number of allowances to be in compliance.107
With a hybrid, some share of the allowances is given away for free and others are auctioned, with a ratio of free-to-auctioned that could change over time.108
Third Design Choice—Point of Regulation, i.e. the third major decision that must be made in policy design. A cap and trade system or a carbon tax can either be regulated upstream or downstream. Upstream regulation typically means regulating entities at the point of supply, that is, where the entities that must pay the tax or submit the allowances are at or near the point of supply of carbon-based fuels.109 In downstream regulation the regulated entities are typically at the point of combustion, that is, the entities that must submit allowances are regulated at the point where the carbon is released into the atmosphere.110 Lastly, there is midstream regulation, which involves GHG regulation at the point of refinement. This could involve regulating the carbon content of oil refineries and natural gas processing plants, for example.111
An upstream based program involves far fewer entities, typically, and thus might be less costly to regulate.112 Upstream regulation captures a large fraction of energy CO2 emissions to be covered while regulating relatively few entities.113 Downstream regulation captures emissions at the source and is straightforward to implement for power plants and manufacturing facilities, but is far more difficult to implement for individual buildings, cars, and trucks.114 This is because it is difficult to verify and measure emissions in the transportation sector, for example, or with small manufacturers. One design solution to this problem is a downstream emissions threshold, where potentially liable entities will not be regulated.115
Fourth Design Choice—Reporting, Verification, and Enforcement. What volume of GHGs does any given liable entity emit? Reporting and monitoring GHG emissions, verification of self-reporting and enforcement are essential policy design issues. There are many

HANDBOOK ON CARBON PRICING INSTRUMENTS | 20
approaches, from independent third-party verification to self-certification with strong penalties. 116
Early experiences generated mixed results for the claim that verification and enforcement under market-based regulation is easier and more efficient than traditional command-and-control regulation. Under the seminal Acid Rain Program, the US EPA mandated installation of sophisticated monitoring equipment, known as continuous emissions monitoring systems (CEMS), thereby reducing the need for field tests.117 CEMS electronically monitored emissions from inside the smokestack and transmitted the data to the EPA where it was analyzed on a quarterly basis.118 At the end of the year, if an entity did not have sufficient allowances to cover its emissions, it was assessed a penalty of $2,000 per ton of SO2, indexed to inflation. The program was a remarkable success; only 23 entities were ever threatened with a compliance action.119
Contrast this with the California’s Regional Clean Air Incentives Market (RECLAIM) program, which regulated SOx and NOx. The program operated with individual audits at the end of each compliance that were labor and resource intensive.120 RECLAIM officials ultimately concluded that the diversity of sources, requiring varying data collection methods, resulted in a scattershot approach that was costly and prevented the development of an all-encompassing emissions calculation tool.121
With these early non-GHG examples in mind, carbon pricing programs have developed a number of enforcement strategies. One key enforcement practice is using existing data gathering processes as a locus for reporting instead of creating an entirely new data gathering regime. For example, if the carbon pricing instrument takes an upstream approach, it will regulate the production and import of fossil fuels, thereby utilizing data that often is already available for other purposes, and it will translate the fuel report data into equivalent emissions. 122 Another best practice is to implement an initial pilot reporting and data-gathering period or compliance phase more generally before implementing a full-scale policy.123
Administrative costs must also be minimized. In comparison to an emissions tax, an ETS will impose additional administrative costs, because the regulator must not only monitor emissions but it must also establish a registry for allowances and track trading and associated allowance changes. In effect, it must create and monitor the architecture of an entirely new market.124 Increased regulation of financial markets also has brought closer scrutiny to carbon markets.
Fifth Design Choice—Risk Mitigation Policies, which mitigate risks highlighted elsewhere in the Handbook. Such policies can also be viewed as “risk mitigation best practices,” highlighting those lessons learned from the past years of carbon pricing instrument operation. No list of risk mitigation policies could be complete, as bespoke policies may be needed for any given set of regulations. Here we highlight standard policies in any regulatory design:

HANDBOOK ON CARBON PRICING INSTRUMENTS | 21
Price Ceiling (ETS). A price ceiling is one cost-management mechanism to reduce price volatility in an ETS market. A price ceiling allows emitters to purchase unlimited allowances directly from the government at a ceiling price, effectively capping the trading price.125 Usually this ceiling price is set at the price of the allowance itself.126 Another method of imposing a ceiling is for the regulatory scheme to introduce additional allowances into circulation whenever the stipulated ceiling price is reached so as to prevent allowance prices from rising further.127 But employing a price ceiling has costs. Once the ceiling is reached, overall emissions no longer are constrained to the level of the original cap because new allowances are being introduced to maintain the ceiling prices.128 This dynamic means trading certainty about the level of emissions reduction for less uncertainty about allowance prices (i.e. the tradeoff is market stability for environmental outcomes).129
Price Floor (ETS). A price floor is another cost-management mechanism. Price floors prevent market prices from falling below a certain level and generally are auction price floors or auction reserve prices, where allowances are kept out of circulation unless purchasers pay a minimum price.130 To enforce a price floor, the regulator may also “buy up” (remove from circulation) allowances whenever the floor price is reached, thereby preventing prices from falling further. The regulator may set a fee that purchasers must pay in addition to the allowance price when allowance prices drop below the stipulated floor level.131 But timing is also critical when price floors are enacted because of the potential to create windfall profits and distortions if timing and execution are inappropriate.132
Price Collar (ETS). A price ceiling and a price floor used together are often referred to as a price collar. If administratively feasible, a price collar is generally considered best practice. California’s AB 32 market uses an auction reserve price and a soft price ceiling to generate a price collar and to provide a measure of price certainty to both liable entities and investors.133
Relaxed Constraints Trigger (ETS): Another example of a cost-management mechanism is adaptation of non-price ETS program constraints. The costs of ETS implementation can be reduced without price caps by relaxing other program constraints.
Banking and Borrowing (ETS). Banking and borrowing have been recognized as crucial tools in controlling price volatility and provide the temporal flexibility necessary for regulated entities to lower costs through optimizing investments over time. Banking and borrowing introduce self-correcting dynamics to the market, i.e., they allow firms to buy or hold allowances when prices are low, and to sell or defer allowance purchases if prices are high. 134 Also importantly, these self-correcting dynamics can smooth transitions to higher caps, especially if regulated entities view the future trajectory of a tightening cap as credible and anticipated.135

HANDBOOK ON CARBON PRICING INSTRUMENTS | 22
Sixth Design Choice—Cross-Border Linkage. Linking carbon markets allows a regulated entity in one jurisdiction to buy or sell allowances or credits from another jurisdiction to achieve compliance. Linking can follow numerous scenarios, and a vast literature exists describing linking. Broadly, linking programs in the compliance marketplace allows an entity to meet compliance obligations by investing in other jurisdictions. Linking can also embrace the voluntary markets, with some compliance markets accepting voluntary credits.
The linking of two or more jurisdictions’ ETS policies into a common market can create efficiencies even in the absence of an internal emissions trading framework. The benefits of linking are many, and including a linked market should equalize carbon prices faced by firms in each jurisdiction and thus would serve to alleviate issues of economic competitiveness.136 However, linking is not without some drawbacks as well. One potential disadvantage is a loss of environmental integrity, if one jurisdiction has lax standards or poorly policed measurement.137 Another potential problem is a loss of control of domestic prices and market liquidity. Furthermore, linking can actually cause the price of carbon to rise in some jurisdictions with low domestic prices, leading to a regressive outcome in less affluent nations where the impact of higher carbon prices falls disproportionately on the poor. 138 These challenges must be addressed in any successful linking.
There is precedent for cross border linked ETS programs. The Western Climate Initiative, a sub-national carbon market system created by the US and Canadian provinces, currently includes some of the most populous sub-national jurisdictions in North America — California, Ontario, and Quebec. 139 New York has also expressed interest in creating a linkage between the Western Climate Initiative and the Regional Greenhouse Gas Initiative, a power-sector focused emissions trading system based in the Northeastern United States.140 Further, the EU ETS and Australia considered linking before Australia repealed its ETS program.
Linking can even benefit from policy synergies with REDD+ and other voluntary carbon market programs by allowing forestry offsets to be sold into a compliance market. Again, this route is being explored, as California is considering linking AB 32 to subnational forestry offset programs in provinces of Brazil, Indonesia, and Mexico.141
And there are even intra-country linkages. In those countries with a federal or layered system of governance, the linking of subnational and national programs can occur. Recently, the California Air Resources Board proposed a linkage with the federal Clean Power Plan (currently stayed under litigation), harmonizing emissions requirements with the federal program, implementing a federal “backstop” emissions level, and aligning compliance periods with the Clean Power Plan’s schedule, with a “bridge period” for transitioning.142

HANDBOOK ON CARBON PRICING INSTRUMENTS | 23
Summary of Six Principal Design Choices Design Choice ETS Emissions Tax
Scope Both types of policies involve trade-offs between choices of gases to regulate, which sectors to regulate, whether to allow relatively small emitters to remain unregulated, and whether the regulation occurs downstream or upstream. In both cases, these choices can be as much political as economic.
Rate or Cap A function of regulatory choice; allowance allocation also matters.
A function of tax rate setting; should be set at marginal abatement cost but in practice subject to political capture.
Point of Regulation
Can be upstream, downstream, or midstream.
Verification and Enforcement
Complex: • Must report emissions and surrender allowances based on those emissions • Obtain allowances by direct allocation, through purchase at auction, or in the secondary market • Participate in secondary market as buyer or seller of allowances • Bank allowances for future use or borrow for current use (if permitted)
Easier: regulated entities must report emissions or a proxy for emissions such as fuel quantities and pay a tax based on those emissions.
Risk Mitigation Policies
• Price ceilings • Price floors • Banking and borrowing
• Subsidies • Generally less price risk
Cross-Border Linkages
Easier to link with the use of tradable emissions units but still complex; must account for political barriers and regulatory coherence in treatment of emissions units
More difficult; but can link through a policy that allows the use of offsets to meet tax liability.

HANDBOOK ON CARBON PRICING INSTRUMENTS | 24
ADDITIONAL DESIGN CONSIDERATIONS In addition to the six principal design choices outlined above, a number of additional design choices and considerations exist. Below are several, and the accompanying chart summarizes several key points of comparison:
Price Stability. Carbon taxes usually result in a more stable price environment because the price of emissions is set ex ante. Price stability is achieved under a carbon tax scheme by setting a price directly through the tax rate and allowing the tax rate to increase predictably over time, thereby leading to (a) predictable revenues for the government to invest or offset other tax rates and (b) investor certainty about long-term price trends, allows for efficient investment.143 By contrast, an ETS policy does not set a price directly but rather achieves price stability through a firm cap on emissions and structured control of tradable units.144
Flexibility. Design is critical for any carbon pricing instrument, and poor design can cripple market-based environmental programs. For example, in RECLAIM, an environmental market program for oxides, nitrogen, and sulfur enacted in 1993, the market experienced extreme price volatility during the California Power Crisis of 2000–2001.145 In particular, when demand for power during the crisis increased, the lack of a cost containment mechanism caused prices to rise from less than $2,000 per ton to over $60,000 per ton.146 RECLAIM also lacked a bankable allowances mechanism. Such mechanisms allow for cost-containment in years where unanticipated circumstances lead to greater than expected emissions (in this case, due to a surge in demand).147
Another example of problematic design to the carbon realm is with the largest ETS, the European Union ETS (the “EU ETS”). The EU ETS famously experienced significant price volatility in its early phased compliance periods — in 2005, the market priced allowances at approximately 8€ per ton of CO2, but an overly generous initial allocation of allowances led to a halving of the price per ton in one week, a rebound to 8€, then a precipitous fall to zero in 2007.148 Again, poor design choices led to the collapse: a lack of robust data to set the initial cap and allowance allocations, and a failure to implement allowance banking and allowance borrowing between compliance periods allowed price collapses when the program moved from one banking period to the next.149
Governance. Another important consideration is the government institutions responsible for planning and implementing the tax. For example, the EU chose to implement an ETS rather than an emissions tax because the EU legislative mandate does not cover fiscal policies like taxes.150

HANDBOOK ON CARBON PRICING INSTRUMENTS | 25
Offsets. The use of offsets allows regulated entities to pursue or finance mitigation activities outside the jurisdiction covered by the carbon pricing instrument in order to count against its requirements. 151 Offsets, especially those generated in emerging countries, provide a cost-effective way to reduce emissions because often the offset project and reduction is cheaper than reducing emissions locally.152 But offsets also raise important efficiency and distributional concerns. Offset credits should only be given to projects that would not have occurred without the offset credit program.153 This concern is also called “additionality,” which is covered by a vast literature beyond the scope of the Handbook. Forestry offsets provide a particularly difficult case — some jurisdictions, like California, allow offsets for forestry projects, while others, like the EU ETS, do not.154 Offsets can also be used in a carbon tax program with relative ease. Mexico, for example, allows liable entities to use CDM Certified Emissions Reduction (CER) credits as an offset to their carbon tax liability equivalent to the market value of the CERs at the time the tax is paid.155
Complementary Policies. Complementary policy design must also be examined. The wrong set of policy interactions can cripple a fledgling carbon market. For example, in a recent survey, almost 70 percent of respondents stated that existing ETSs are being undermined by disharmonious overlap with other climate policies.156 Under both an ETS and an emissions tax, complementary policies are usually conceived of as policies that have the effect of requiring emitters to reduce their emissions in a directed or proscribed manner.157 In the industrial and energy sectors, these policies are typically renewable portfolio standards (RPS) and, together with the consumer sector, energy efficiency mandates. 158 Another popular set of complementary policies that target the transportation sector are low carbon fuel standards (LCFS).
These complementary policies are numerous, and all require a careful analysis concerning whether they should be enacted. That is not to say that there are not alternative reasons for enacting these policies apart from climate concerns — an RPS may spur innovation and create jobs, for example. But in analyzing their interaction with a carbon pricing instrument a key question to ask is: is the complementary policy worth enacting if it generates a less flexible carbon market? Put differently, does a market failure result that prevents cost-effective emissions reduction from occurring under the carbon pricing instrument?159

HANDBOOK ON CARBON PRICING INSTRUMENTS | 26
Carbon Leakage. Carbon leakage is a concern where differentials in policy across jurisdictions result in migration of emissions activity. Carbon leakage can take the form of output channel, or short-term changes in production quotas at existing facilities, or through the investment channel, or long-term decisions about new investment decisions.160 Concerns over carbon leakage have not been fully realized as of yet, but a number of potential solutions present themselves. These solutions essentially center around competitiveness. Competitiveness concerns in particular affect energy-intensive trade exposed (EITI) industries, like the cement sector in the EU ETS and California AB 32 market, and under the British Columbia carbon tax.161 Policies used to address these concerns could take the form of targeted market-based incentives—like production or investment tax credits, research and development (R&D) tax credits, accelerated depreciation, feed-in tariffs and business support services and loans. 162 Conversely, a jurisdiction could adopt complementary policies that ease transition, especially for businesses that compete internationally. An example of this policy might be the EU ETS awarding free allocation of allowances to the top 10 percent of businesses in sectors exposed to carbon leakage (thereby easing the transition and also providing an incentive for these businesses to become more efficient).163
Stakeholder Engagement, which is a crucial design consideration to solidify legitimacy. The range of stakeholders that must be engaged in any design process begins to take shape through stakeholder mapping. Stakeholder mapping should focus on a deeper understanding of the profiles of stakeholders to clarify their priorities and why their engagement is important.164 Early and regular communication focused on the design, rationale, shared benefits, and outcomes builds critical public support. 165 It is also important to clarify what role each stakeholder will play. These roles can involve everything from informing (i.e., providing the public with balanced and objective information) to involving and consulting (i.e., broadly soliciting public feedback and working directly with the public) to empowering (i.e., holding referenda and ensuring any proposed carbon pricing policy clearly lies on the public docket for discussion).166
Some of the most important stakeholders are government stakeholders. It is crucial to engage decision-makers in government early and examine the conflicting bureaucratic missions of the various agencies, departments or ministries that will be involved in the creation of the carbon pricing policy. It is also important to streamline decision-making. To take one example, New Zealand streamlined decision-making by creating an Emissions Trading Group made up of representatives from key departments like the Ministry of the Environment and the Treasury, allocating decision-making to a nimble group of individuals but in such a way that ensured support from a variety of government agencies with potentially divergent interests.167
Non-government actors prove equally crucial to the successful enactment of carbon pricing policy. Engaging regulated entities can result in more effective design for the

HANDBOOK ON CARBON PRICING INSTRUMENTS | 27
ultimate carbon instrument. For example, Ireland successfully introduced a carbon tax in 2010 in the midst of an economic recession. 168 Key lessons learned included understanding priorities within the agricultural sector, which resulted in the inclusion of fuel use in agriculture.169 Other entities to engage include market service providers (e.g., banks, exchanges and trading houses), civil society organizations (e.g., environmental, social justice and labor NGOs and consumer groups), media, the general public, and academics and researchers.170
Revenue Distribution. A carbon tax has the potential to raise substantial revenue. For example, the British Columbia carbon tax raises more than a $1 billion annually despite a provincial population of under 5 million.171 An important policy consideration in designing a carbon tax, then, is the treatment and distribution of the funds raised.
A government has many options for using carbon tax revenues. The use of revenues from a carbon tax does not necessarily need to differ from the use of revenues raised through other means. A government could increase spending for public programs or reduce borrowing to the extent of revenue raised, for example. It may be difficult, however, to garner public support for a carbon tax when the use of the revenues is left unspecified.172 Instead of leaving the use of revenues unspecified, a government could direct carbon tax revenues toward other efforts to further reduce emissions. For example, the government could provide subsidies for wind or solar projects or energy efficiency measures. Or the government could direct funds toward more politically popular spending, which would garner wider support for the carbon tax.
However, any perceived increase in the size or role of government may be politically unsalable. For this reason, many would prefer that a carbon tax be revenue neutral. A popular suggestion for instituting a revenue neutral carbon tax is to use the revenues to reduce other taxes. This is known as a tax shift or tax swap. Studies have found that taxes on corporate income have high distortionary effects and are economically inefficient.173 A carbon tax could be used to offset the corporate income tax, reducing the economic inefficiency attributable to that tax. 174 While economically efficient and revenue neutral, such a design would be regressive (i.e., it would have a disproportionate impact on the poor relative to the rich) because reducing the corporate income tax would most benefit those with high incomes.
Rather than reducing corporate taxes, reductions also could be made to individual income tax rates. While less efficient than cutting corporate rates, this could be revenue neutral, politically popular, and target lower income individuals so as to combat the regressivity of the carbon tax. A government could institute a combination of business tax cuts and individual income tax cuts. For example, the proceeds from British Columbia’s carbon tax reduce individual and business taxes, and a tax credit is given to low-income households.175 Other taxes potentially offset include payroll taxes and sales taxes, both of which tend to have regressive effects.176

HANDBOOK ON CARBON PRICING INSTRUMENTS | 28
Finally, carbon tax revenue can be returned to individuals in the form of a rebate, or a dividend. This approach has the advantage of relative simplicity and potential political popularity. Additionally, some studies have found that a per capita dividend would most benefit those with lower incomes, offsetting the regressivity of the carbon tax.177 The dividend could be an equal amount for all recipients, or could vary based on metrics like household income.
Carbon tax revenues can be used in any combination of the above options.
Summary of Additional Design Considerations178
Consideration ETS Carbon Tax Fuel Tax Hybrid
Price Stability
Less stable; price determined by the market as carbon price is established through the market price of emissions
More stable (s.t. regulatory risk); Carbon price is established through the tax level set by the taxing authority
More stable; though price is determined by the market, price floors and ceilings stabilize price
Delivery of Reduction
More certain; emissions cap usually tied explicitly to CO2 volume
Less certain; not tied explicitly to CO2 volume
More certain; emissions cap usually tied explicitly to CO2 volume
Flexibility Adjust the supply of emissions
Adjust the tax rate Adjust the supply of emissions; adjust price collar
Administrative Complexity
Complex; must create new commodity (emissions trading unit), allocate the unit, and create a market for trading
Generally easier; can be built on existing tax policy but administrative burden setting iterative tax rates
Complex; must create new commodity (emissions trading unit), allocate the unit, and create a market for trading
Cost of Compliance
Difficult to estimate; Estimated based on emissions and future allowance prices
Easier to estimate; can estimate based on tax rate and emissions profiles because does not depend on future allowance prices
Difficult to estimate; Estimated based on emissions and future allowance prices
Governance Usually only environmental agencies or specially-created climate agencies; may increase risk of lobbying and capture
Typically enacted through and administered by general financial agencies, like a fiscal authority or department of treasury
Use of Offsets Either an ETS or a carbon tax could use offsets to lower the cost of compliance by allowing regulated entities to purchase emissions offsets; offsets are more commonly part of cap-and-trade programs

HANDBOOK ON CARBON PRICING INSTRUMENTS | 29
National Characteristics
Usually requires a well-developed regulatory and financial system and a level of centralized control
Usually, easier to implement so a good starting point for emerging countries
Variable, but depends on the relative mix of price and quantity characteristics
Business Perception
Well-perceived; translates carbon reductions into business relevant terms
Less well perceived; translates as a tax Depends on the relative mix of price and quantity characteristics
Role of Markets Needs creation of a new market for auctioning allowances and a secondary market for oversight and to send a transparent price signal
A carbon tax does not create a new market that needs to be regulated but functions as an additional economic driver in existing markets
Emissions Reductions
Set ex ante by maximum emissions cap built into the program; the level of reduction can be known with certainty
Function of firm response to the change in prices ex post; can be estimated but may change with firm response to tax
Revenue
Revenues could be used under either program for a wide-range of programs, including reduced taxes, deficit reduction, climate infrastructure investment, or consumer lump sum payouts. Revenues are often significant, and a point of significant political tension. Note however that revenues are more predictable under a carbon tax regime.
Moreover, the goals for using revenue vary. Some jurisdictions use revenue to reduce inequities created by the market, by funneling it to complementary policies to benefit the instrument-impacted sectors. Another use of revenue is for social benefits, as subsidy on other tax schemes or a return to the populace as a payout.
Other uses are more for further reduction of emissions, by funneling revenues into R&D for climate mitigation or adaption.

HANDBOOK ON CARBON PRICING INSTRUMENTS | 30
DESIGN AND SOCIAL IMPACTS Poverty and Impact on the Poor. Without certain design interventions, a carbon pricing instrument is likely to have a disproportionate impact on the poor relative to the rich, i.e., carbon pricing instruments tend to be regressive. 179 This is because the poor spend a greater percentage of their income on items whose cost would increase as a result of an increase in the price of carbon. These items include fuels (e.g., gasoline and electricity) and common goods that take fuel inputs in their production. While the degree of regressivity can be debated and depends on the assumptions of the researcher, opponents of carbon pricing can and have used distributional concerns to attack carbon pricing proposals.180
However, a properly designed carbon pricing instrument could eliminate regressivity, and, if desired could even become progressive. Two possibilities exist. The first is through lump-sum transfers or rebates. In a lump-sum transfer, the government would take the revenues generated from the carbon tax or the auctioning off of emissions permits and return those revenues in a lump-sum manner to households based on their income.181 The second method is through a tax shift or swap. In a tax shift, revenue collected through one means (e.g., a carbon tax or the auctioning off of emissions permits) would replace revenue otherwise collected through the tax system. This can be done in a revenue neutral way, such that the total amount of money raised remains constant. For example, after the institution of a carbon tax, the government reduces the income tax rate for the lowest income earners in the society in such a way to offset the regressive nature of the carbon tax.
Given the relative simplicity with which the problem of regressivity can be handled, and the regressive impact of the climate crisis more generally, not instituting carbon pricing will have a significantly greater negative impact on the poor than instituting carbon pricing.
Corruption. According to the latest bulletin from the United Nations Environmental Program (UNEP), corruption can pose a threat to climate control mechanisms, including cap-and-trade systems.182 If unchecked, corruption in climate finance may reduce the overall reliability and effectiveness of GHG markets and may raise broader questions about the impact of corruption in environmental governance.183 Corruption in this sector has taken novel forms, such as the manipulation of GHG price markets, exploitation of “bad science and profit uncertainty, and anti-systemic speculation.184 According to UNEP, corruption is generally understood as “the abuse of public roles or resources for private benefit.” 185 At the United Nations Conference on Sustainable Development (“Rio+20 Conference”) in 2012, participants highlighted the correlation between transparency and accountability and the quality of sustainable development.186
Proactive steps can be taken to defend ETS mechanisms from the threat of corruption. The EU ETS seeks to minimize and eradicate the potential adverse impact of corruption on climate

HANDBOOK ON CARBON PRICING INSTRUMENTS | 31
finance. Fifteen original member states of the EU launched the EU ETS in 2005 and to date, it is the largest operational mandatory cap-and-trade scheme. 187 In 2010, European authorities uncovered several cases of “carousel fraud” in emissions trading, totaling an estimated US $6.45 billion in lost revenues across 11 countries.188 Carousel fraud is a form of “missing trader fraud,” characterized by the trader facilitating the carbon credit exchange but keeping the value-added tax (VAT), rather than paying it to the government. This fraud occurs in cross-national trading, which is not subject to VAT. Therefore, emission credits were initially purchased without adding the VAT, but then re-sold with the VAT added. While the discovery of fraudulent activities catalyzed the European Commission’s rapid closing of loopholes in the tax law and implementation of improvements in the security of the trading system, it also resulted in the deflation of the European carbon market by approximately 90 percent and forced the temporary suspensions of credit-trading activities.189
As the climate governance sector grows in size, geographic scope and regulatory complexity, the issue of corruption is often raised to question the overall validity of ETS. Critics challenge the reliance of climate policy on market solution, saying that “[corruption] raises key questions about whether a market approach, in which relatively unregulated, complex, and difficult to trace transactions are the bulk of the activity, is really the best route to a solution to climate change.” 190 Others emphasize the potential of emissions trading to create permanent improvement through reform and adjustments.191
Transparency International (TI), a global corruption watchdog, stresses that mainstreaming anti-corruption tools into climate governance systems can help ensure the overall effectiveness of ETS. This call to routinely implement anti-corruption measures in policy decisions echoes the sentiment of participants of the Rio+20 conference, who emphasized the need to:
• Strengthen the science-policy interface;
• Enhance evidence-based decision-making at all levels; and
• Increase capacity building for data collection and analysis in developing countries.192
New rules aimed at improving the transparency and integrity of trading operations, such as the changes adopted by European authorities, will help increase market effectiveness.193 Concerted action taken by governments, major environmental initiatives, civil society, and the private sector will be necessary to incorporate provisions to close loopholes and to prevent corruption.194
HANDBOOK ON CARBON PRICING INSTRUMENTS | 32
NONMARKET ALTERNATIVES Enacting a market-based pricing instrument like an ETS or emissions tax is not the only way to mitigate carbon emissions. Alternative approaches also exist. The most common alternative is the traditional command-and-control regulatory response. A regulatory approach could take the form of an emissions standard, a technology-mandate or portfolio standards, among others. The basic idea behind regulatory approaches is to draft regulation to permit or prohibit and punish carbon emitters. Though a nonmarket approach, a regulatory response sets an implicit price on carbon, as emitters face a cost to comply with the regulation.195
One example of a regulatory response is the Clean Power Plan (CPP) in the US. While the CPP’s future remains uncertain following the Trump Administration’s efforts to roll back the plan, its dynamic federalism structure presents a pathway for flexible regulatory reduction of carbon. Under the CPP, the US EPA was called on to set guidelines for states to reduce carbon dioxide pollution from two types of units—fossil fuel-fired electric utility steam generating units and stationary combustion turbines. 196 The plan’s original goal was reducing emissions by 32 percent of 2005 levels by 2030 through a framework of environmental federalism, with each state having an individual target and all states having the flexibility to choose their own compliance mechanisms, including emissions trading within a state or between states.197
Other alternatives include straight incentives, like tax cuts or “green banking.” There is also the placement of climate considerations that can be placed within existing environmental review frameworks.
Fiscal Incentive Programs. The following programs do not constitute an exhaustive list but rather serve to highlight various fiscal incentive programs aimed at promoting clean energy. Such fiscal incentives are particularly successful when costs to support renewable industries are a barrier to progress and development.
Production Tax Credit. In December 2015, US lawmakers extended the federal Production Tax Credit (PTC) program to the end of 2019 for qualifying wind projects, and to the end of 2016 for other eligible renewable technologies.198 The PTC program “is an inflation-adjusted per-kilowatt-hour tax credit for electricity generated by qualified energy resources and sold by the taxpayer to an unrelated person during the taxable year.”199 As a production-based incentive, the PTCs vary based on capacity and energy technology. The PTC has been renewed and expanded many times since 1992; as clean energy technology has progressed, renewable projects have become cheaper to develop, and lawmakers have in turn caused the PTC tax credit rate and tax reduction to regress. The PTCs are valued at about $25 billion over five years, and are expected to drive $38 billion in solar investment and $25 billion in wind investment through 2021.200

HANDBOOK ON CARBON PRICING INSTRUMENTS | 33
Election to Investment Tax Credit. By way of the same legislation that renewed the PTC program in 2015, the Investment Tax Credit (ITC) program was also extended to encourage investment in clean energy. Whereas the PTC reduces the federal income tax of the tax-paying owners (or their designees) of renewable projects based on electrical output, the ITC reduces federal income tax based on the actual capital investment made for the project itself.201 A taxpayer cannot claim both PTC and ITC for the same project or investment. As a result, a taxpayer would perhaps elect for an ITC over a PTC when the capital investment is particularly high, or when the electrical output is uncertain or low. It is worth noting that as the legislation currently stands, the benefits of the PTC and ITC are expected to be phased out over the next five years.
Promoting Electric Cars. A number of European countries have taken steps towards eliminating the domestic sale of gas-powered vehicles. In early 2016, the Dutch government discussed the possibility of only allowing the sale of electric vehicles by 2025.202 In August 2016, this policy proposal passed in the lower house of the Netherlands parliament, and many believe that this initiative will likely become law. 203 The actual plan for this policy has yet to be determined, however supporters believe that the Dutch government can move towards eliminating gas-powered vehicles by either creating an outright ban on the use of gas as fuel for cars, passing a zero-emissions mandate that any gas-powered car would be unable to meet, or by drafting a “punitive measure on automakers with electric vehicles representing less than 100 percent of their sales in the market by 2025.”204 Similarly, Norway, a country where electric vehicles compose 24 percent of its new car fleet, has adopted a congruent approach to eliminating the sale of gas-powered cars by 2025.205 Norway produces more than 90 percent of its local energy from renewable hydropower, making this automotive policy quite “green.” 206 Norwegian lawmakers plan to use a multi-faceted approach to meeting the country’s 2025 goal, including tax penalties for the sale of gas-powered vehicles, tax benefits for the purchase and sale of electric vehicles, subsidies for electric car manufacturing and for consumer purchases, and government-supported charging stations, hydrogen infrastructure, and differentiated rush-hour taxes.207
Nonmarket alternatives do not necessarily displace the market mechanisms detailed in the Handbook. Indeed, nonmarket alternatives like traditional command-and-control regulation can act as complementary policies to achieve climate goals. The trade-off is one of cost and flexibility. Under a market mechanism like carbon pricing, regulated entities have flexibility of response to choose the least-cost option to mitigate their emissions, thus reflecting the potential to reduce emissions at lower cost than under mandated technology or performance standards.208 That is, covered firms cost-minimize and will reduce emissions up to the point where the marginal cost of emissions abatement equals the emissions price. The ability to bring marginal abatement costs to equality is an advantage of market-based approaches over direct regulation. 209 However, there are additional costs that may make direct regulation more attractive, even from a cost standpoint. Where emissions are difficult to monitor it may be less costly to reduce emissions by requiring the installation of technology and thereby avoiding the cost and burden of monitoring emissions or the carbon content of fuels directly.210 Non-market

HANDBOOK ON CARBON PRICING INSTRUMENTS | 34
regulation in the form of technology or performance standards can limit the total emissions reduction. When regulated entities have a set standard to reach, they can cap emissions reductions at the level needed to achieve the standard. Conversely, carbon pricing instruments will reward continued emissions reductions beyond the level required by a command-and-control regulation – and in the process, encourage further gains in emissions reduction technology.211

HANDBOOK ON CARBON PRICING INSTRUMENTS | 35
PROGRAMMATIC PRECEDENT
ETS Programs. The following programs do not constitute an exhaustive list but rather serve to highlight different programs of different ambition and scope.
Alberta. Alberta became the first province in Canada to pass legislation regulating greenhouse gas emissions when it enacted the Specified Gas Emitters Regulation in 2007.212 This required facilities that emit 1,000 tCO2e or more of greenhouse gases a year to reduce baseline emissions intensity by 12 percent with respect to average emissions intensity from 2003–2005.213 Alberta’s unique carbon pricing system is based on greenhouse gas emissions rates and features intensity targets, tradable compliance units measured in tCo2e, and a first-of-its kind technology fund.214 Covered facilities have four compliance options:
• Reduce emissions through improving facility operations and efficiency.215 • Pay a fixed-price fee for each tCO2e emitted over the baseline to Alberta’s
technology fund, the Climate Change and Emissions Management Fund. For each payment to the fund, a facility obtains one fund credit equal to one tCO2e reduction. This innovative fund creates resources to further invest in reducing emissions.216
• Purchase an emissions offset from non-covered facilities in Alberta. A one tCO2e reduction from a non-covered facility is equivalent to one emissions offset.217
• Purchase Emissions Performance Credits (EPCs) from covered facilities that have reduced their emissions intensity below their target and can sell their extra reductions.218
Due to the fixed-price of offsets ($15/tC02e when the legislation was first enacted) and unlimited nature of possible contributions to Alberta’s technology fund, Alberta’s program essentially creates a price ceiling, with trading and offsets allowed. Alberta amended its legislation in June 2015 to extend the scheme to 2017.219 However, many view this as an interim measure to be replaced by a comprehensive national plan in Canada.220
California. The passage of California House Bill AB 32, the California Global Warming Solutions Act of 2006, marked a watershed moment in California’s climate policy by mandating sharp reductions of GHG emissions.221 California, the world’s sixth-largest economy, adopted the first program in United States to take a comprehensive, long-term strategy for emissions reduction.222 AB 32 requires California to reduce its GHG emissions to 1990 levels by 2020 — a reduction approximately 15-20 percent below predicted emissions in the absence of corrective measures.223
In order to meet the requirements of AB 32, the California Air Resources Board (ARB) has designed an enforceable California cap-and-trade program.224 Notably, development of this

HANDBOOK ON CARBON PRICING INSTRUMENTS | 36
program included a multi-year stakeholder process and consideration of potential impacts on disproportionately impacted communities.225
California’s ETS program was initiated in 2012 with an enforceable compliance obligation that began on January 1, 2013.226 As a member of the Western Climate Initiative (WCI) since 2007, California formally linked its system with Quebec’s on January 1, 2014.227
The WCI is an initiative of American State and Canadian Province governments aimed at developing a joint strategy to curb greenhouse gas emissions via a regional cap-and-trade program. Currently, the members working to implement harmonized cap-and-trade programs are: California, British Columbia, Manitoba, Ontario, and Quebec.228
AB 32 is a critical part of California’s climate and energy policy, and will help meet its goals of reducing GHG emissions to 1990 levels by 2020 and achieving an 80 percent reduction from 1990 levels by 2050.229
AB 32 Reduction Targets230
Year Overall GHG Reduction Target By 2020 Return to 1990 GHG levels By 2040 40 percent reduction from 1990 GHG levels By 2050 80 percent reduction from 1990 GHG levels
Since January 2015, the program’s coverage includes sources responsible for approximately 85 percent of California’s GHG emissions.231 These include the areas of electricity generation, large industrial sources, transportation fuels, and residential and commercial use of natural gas. 232 From commencement of the second trading period (2015-2017), known as a “compliance period,” and beyond, approximately 450 liable entities in California have been and will be covered. The general inclusion threshold for compliance is 25,000 tCO2e per data year.233
In this compliance period, allowances are allocated and subsequently auctioned, according to calendar year vintages and by benchmarks in each sector.234 While some allowances from future vintages are offered for sale at each auction and may be traded, they may not be used for compliance until the compliance date for the corresponding vintage year. 235 Provisions governing new entrants adhere to established methodologies determined by leakage risk, as derived by emissions intensity and trade exposure. 236 Both publicly-owned and regulated investor-owned electric utilities receive allowances on behalf of their ratepayers.237 For industrial facilities, allowances are allocated by benchmarks in each sector.238 Any remaining allowances are auctioned. In the first compliance period, these remaining allowances constituted about 10 percent of total allowances, with this number increasing in subsequent compliance periods.239
California’s ETS expires in 2020, and to meet the deeper emissions cuts that the state has committed to, a drastically updated system will be necessary. SB 775 has been introduced in
HANDBOOK ON CARBON PRICING INSTRUMENTS | 37
the State Senate to establish a cap and trade system that would have a “price collar”, with both a floor and ceiling price, elimination of offsets, and 90 percent of revenues returned directly to taxpayers on a per capita basis. To maintain competitiveness, the bill also establishes a border adjustment tax on goods from states and nations that enter California.240
Quebec. Quebec’s ETS was introduced in 2012 with a transition year during which emitters could familiarize themselves with the program. 241 Following this period, an enforceable compliance obligation began on January 1, 2013.242 Quebec also helped found the WCI.243 Membership in WCI requires member states to establish a climate action plan detailing their strategy to help achieve the overall WCI target.244
On January 1, 2014, Quebec linked its system to California’s ETS.245 Together, the programs create the largest carbon market in North America and the first ETS operated by subnational jurisdictions within different countries.246All compliance units are fully tradable for compliance across either jurisdiction.247 The first joint auction was held in November 2014, and the second join auction, held in February 2015, was the first since the second compliance period coverage expanded to include fuels —notably including fuel for the transportation, building, and small business sectors.248
Linking with California creates unique challenges and opportunities, particularly with conducting joint allowance auctions. 249 For example, setting consistent price collars in two different currencies over time (including price floors and trigger prices for reserve sales) is a necessary aspect of a successful linkage.250 However, Quebec has strategically developed its program while considering the potential future harmony of its regulations with California and other WCI partners.251 Future linkage has been the goal of the Quebec cap-and-trade project under WCI from the beginning, and future development of the province’s system will depend on the government’s ability to find new linkage partners.252 Beyond other member organizations of the WCI, the Quebec and the Regional Greenhouse Gases Initiatives have discussed potential linkages of their cap-and-trades systems.253 In order to achieve this, the two partners would need to match their institutional designs to ensure compatibility between the systems.254
China Subnational. Collectively, China’s seven pilot ETSs form the largest national carbon pricing initiative in the world in terms of volume, capping a total of 1.3 GtCO2e.255 But these pilots still only cover 7 percent of China’s emissions.256 China’s pilots include: Beijing, Shanghai, Guangdong, Tianjin, Shenzhen, Hubei, and Chongqing. Shenzhen ETS was the first market to begin operating in June 2013, followed by Shanghai and Beijing in November, then Guangdong and Tianjin in December, Hubei in April 2014, and lastly Chongqing in June 2014.257 Initially, the seven Chinese pilot ETSs were scheduled to end after three compliance years and be replaced by the national ETS in 2016. However, as the national ETS is not expected to be implemented until sometime in 2017, the pilots have been extended.
While in the design phase, each pilot was mandated to: compile an implementation plan, define key objectives and tasks, establish safeguards and project schedules, study and create

HANDBOOK ON CARBON PRICING INSTRUMENTS | 38
regulations, and create emissions targets as well as plans for distributing them.258 Each of the pilots has unique characteristics. Analysis of the way in which these carbon markets played out revealed lessons to apply in the national context.259 Some notable features of the pilot schemes included:
• Shenzhen was the first of the Chinese ETS pilots to be operating. Shenzhen’s industrial base includes light manufacturing, so to create a market with enough emissions to enable liquidity in the market, Shenzhen covers 635 enterprises.260 As the only pilot with Special Economic Zone status, Shenzhen had the political ability to pass legislation supporting ETS implementation.261
• Shanghai is China’s financial center and operates with both heavy and light industry.262 To accommodate both industries, Shanghai announced plans to explore innovative financial tools to boost liquidity in the scheme, with a scheme covering a broad array of sectors, including aviation and ports.263 Many multinational companies who do business in Shanghai are familiar with ETS compliance in other parts of the world, a characteristic that can bolster engagement.264
• Beijing has a high profile that lends itself to feeding directly into the national scheme.265 Prior to the 2008 Olympic Games, heavy industries (e.g. power, steel, cement, etc.) were moved out of the city.266 The result was to increase the energy use and emissions of neighboring regions (Tianjin and Hebei).267 As a result, Beijing’s ETS only covers a reduced power sector, and not all sectors that service the city.268
• Guangdong is an industrial powerhouse in southern China and has the largest volume of emissions covered in an ETS.269 Guangdong is the first Chinese pilot ETS to incorporate auctioning into the design of its scheme.270
• Tianjin is a Chinese port city with a strong industrial base.271 It is also part of the Beijing-Tianjin-Hebei area suffering from severe air pollution.272 To reduce emissions, Tianjin’s ETS covers a large number of key industries, which raises concerns over competitiveness.273
• Hubei is a transport hub situated in central China. Hubei has a faster than average economic growth rate, and its ETS covers 12 sectors—including pharmaceuticals and the food and beverage industry, which other pilots do not cover.274

HANDBOOK ON CARBON PRICING INSTRUMENTS | 39
• Chongqing is the latest Chinese region to start its pilot ETS. The system covers enterprises from seven sectors, which collectively account for around 40 percent of the city’s total emissions.275
China National. Building on its 10 years of experience with seven subnational pilot markets, China is planning to launch a national carbon market in 2017.276 The national ETS will cover key industry sectors including iron and steel, power generation, chemicals, building materials, paper-making, nonferrous metals, and aviation, with around 8,000 companies covered. 277 Provincial governments can include more emitters under the system than are required by the national regulations.278 These industry sectors account for a large portion of China’s carbon emissions. In 2012 power generation accounted for 32 percent of China’s carbon emissions and manufacturing, which includes many of the industries covered by the national ETS, and contributed 47 percent of Chinese carbon emissions.279 The national ETS will set an overall cap on carbon emissions for all covered industry sectors with individual targets for each of the 31 covered provinces and regions.280 China’s National Development and Reform Commission largely will rely on industrial benchmarks to determine the allocation of carbon allowances among companies. 281 The commission will also use some historical emissions data.282 Carbon prices are estimated to be between 30-100 yuan ($4.43-14.76) in the first three years.283 A Chinese think tank estimated that the carbon price needs to be at least 100 yuan in order for China to meet its Paris Agreement goal.284 Ahead of the national launch, China’s Fujian province began a provincial ETS in 2016 that will join with the national market in 2017.285 The Fujian ETS will cover ceramics in addition to the national ETS sectors in order to cover a larger portion of provincial emitters.286 China is likely to face challenges in areas critical for the functioning of ETSs, including: compliance; standardization of rules on monitoring, reporting and verification across a large geographic span; reduction of overall emissions below the target set as a contribution to the Paris Agreement; and low liquidity avoidance in trading.287 Over-allocation of emissions permits could also seriously limit the effectiveness of the system.288 Most of the regional pilots initially over-allocated permits to compensate emitters for initial participation and a similar start to the national system would not be surprising.289 Despite these challenges, the presence of a national carbon market in the country that is the world’s leading emitter of greenhouse gases and a major actor in world trade has the potential to encourage further carbon market cooperation and upscaling.
RGGI. The Regional Greenhouse Gas Initiative (RGGI) is a cooperative effort among nine Northeastern and Mid-Atlantic States, marking the first mandatory market-based program in the US.290 RGGI seeks to reduce emissions from the electric power sector though cap-and-trade programs coordinated between states.291 The nine states currently participating in RGGI are: Connecticut, Delaware, Massachusetts, Maryland, Maine, New Hampshire, New York, Rhode Island, and Vermont.292

HANDBOOK ON CARBON PRICING INSTRUMENTS | 40
RGGI began development in late 2003. Then in 2005, nine RGGI states issued a MOU that explained the overarching purpose of RGGI: to create a cap-and-trade program with the goal of reducing emissions within participating states while simultaneously fostering economic growth and the maintenance of a safe, reliable electricity supply. 293 RGGI commenced its first auctioning of CO2 allowances in 2008, and the first compliance period took effect on January 1, 2009.294
Over the years, states have joined and withdrawn from RGGI. Maryland joined RGGI in 2007 after an amendment to RGGI’s MOU.295 Conversely, New Jersey withdrew from RGGI on May 26, 2011.296
RGGI is comprised of individually run, state-level programs that allow allowance trading between one another. In order to assist states in establishing uniformity among their programs, RGGI states published a Model Rule in 2006.297 Under this Model Rule, each state established its own cap-and-trade program that: (1) set limits on in-state carbon emissions from electric power plants, (2) issued carbon allowances, and (3) established statewide participation in regional carbon allowance auctions.298
As outlined in the MOU, a comprehensive review of the RGGI program was conducted in 2012.299 The review addressed: the environmental impact of RGGI; the effect of RGGI on electricity price and system reliability; the consideration of additional reductions, and the evaluation of offsets including price and availability.300
Subsequent to this program review, RGGI released an updated model rule on February 7, 2013.301 Each of the nine RGGI member states adopted the rule’s amendments — seven through regulatory updates and two through required legislation.302
As a coordinated effort among individual, state-level programs, RGGI faces a unique set of challenges. First, participation in RGGI is non-binding. Therefore, states have the option to exit the program, at which point the cap is adjusted to reflect their departure.303 On the other hand, there is also the opportunity for growth if more states choose to join the program in future years.304 Another challenge is the over-allocation resulting from business-as-usual emissions for covered electric facilities being below the cap. 305 This has occurred due to the economic stagnation that has decreased both output and RGGI’s success at reducing emissions (both through pricing carbon and using resultant auction proceeds to invest into energy efficiency and renewable energy).306 However, the updated model rule seeks to fix this over-allocation issue.307 Finally, as the RGGI cap is lowered, emissions leakage will need to be considered.308 The updated 2012 program review explicitly calls for consideration of this issue and other pressing challenges.309
RGGI has proven to be a success. Recent modeling has shown that emissions would have been 24 percent higher in the absence of an ETS.310 Moreover, between 2005 and 2013, RGGI states reduced CO2 emissions from the power sector by more than 40 percent, and the regional economy grew by 8 percent, thereby creating over 16,000 new job years.311
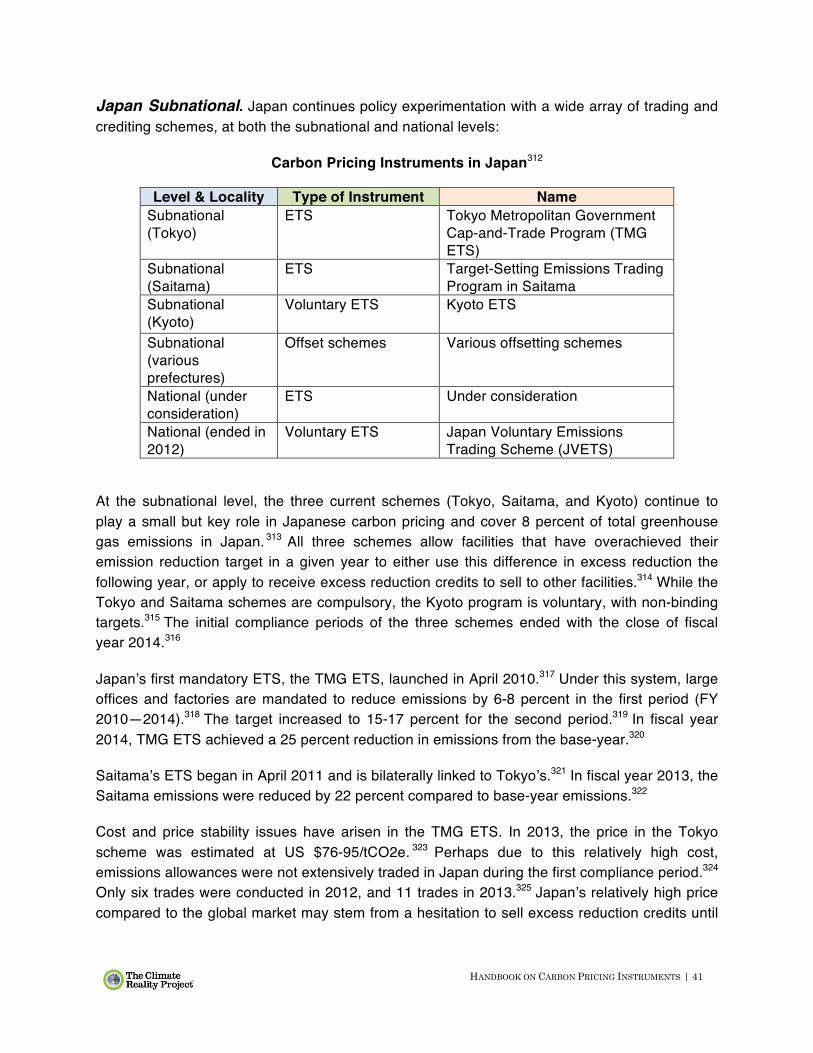
HANDBOOK ON CARBON PRICING INSTRUMENTS | 41
Japan Subnational. Japan continues policy experimentation with a wide array of trading and crediting schemes, at both the subnational and national levels:
Carbon Pricing Instruments in Japan312
Level & Locality Type of Instrument Name Subnational (Tokyo)
ETS Tokyo Metropolitan Government Cap-and-Trade Program (TMG ETS)
Subnational (Saitama)
ETS Target-Setting Emissions Trading Program in Saitama
Subnational (Kyoto)
Voluntary ETS Kyoto ETS
Subnational (various prefectures)
Offset schemes Various offsetting schemes
National (under consideration)
ETS Under consideration
National (ended in 2012)
Voluntary ETS Japan Voluntary Emissions Trading Scheme (JVETS)
At the subnational level, the three current schemes (Tokyo, Saitama, and Kyoto) continue to play a small but key role in Japanese carbon pricing and cover 8 percent of total greenhouse gas emissions in Japan. 313 All three schemes allow facilities that have overachieved their emission reduction target in a given year to either use this difference in excess reduction the following year, or apply to receive excess reduction credits to sell to other facilities.314 While the Tokyo and Saitama schemes are compulsory, the Kyoto program is voluntary, with non-binding targets.315 The initial compliance periods of the three schemes ended with the close of fiscal year 2014.316
Japan’s first mandatory ETS, the TMG ETS, launched in April 2010.317 Under this system, large offices and factories are mandated to reduce emissions by 6-8 percent in the first period (FY 2010—2014).318 The target increased to 15-17 percent for the second period.319 In fiscal year 2014, TMG ETS achieved a 25 percent reduction in emissions from the base-year.320
Saitama’s ETS began in April 2011 and is bilaterally linked to Tokyo’s.321 In fiscal year 2013, the Saitama emissions were reduced by 22 percent compared to base-year emissions.322
Cost and price stability issues have arisen in the TMG ETS. In 2013, the price in the Tokyo scheme was estimated at US $76-95/tCO2e. 323 Perhaps due to this relatively high cost, emissions allowances were not extensively traded in Japan during the first compliance period.324 Only six trades were conducted in 2012, and 11 trades in 2013.325 Japan’s relatively high price compared to the global market may stem from a hesitation to sell excess reduction credits until

HANDBOOK ON CARBON PRICING INSTRUMENTS | 42
the second compliance period.326 During the second compliance period, trading of credits from the first period is possible between the Tokyo and Saitama schemes.327
Republic of Korea. On January 1, 2015, the Republic of Korea launched its national ETS (KETS). KETS is the first national cap-and-trade program in operation in East Asia, and covers approximately 525 of the country’s largest emitters, including five domestic airlines.328 These emitters account for around 68 percent of national GHG emissions.329 The Republic of Korea intends to reduce its GHG emissions by 37 percent below “business as usual” emissions by 2030. The KETS will play a crucial part in meeting this target.330 This level is equivalent to a 22 percent reduction from the 2012 emissions levels.331 The KETS covers both direct emissions of the six Kyoto Protocol gases and indirect emission from electricity consumption.332
While trade in its first year of operation was limited, 2015 saw a steady flow of credits from national offset projects.333 Going forward, part of the reduction goal (11 percent or close to 100 MtCOe2) may be achieved through international market mechanisms — meaning international offsets allowed into the KETS.334
Carbon Tax Programs:
Mexico. On January 1, 2014, Mexico’s carbon tax went into effect.335 The tax covers fossil fuel sales and imports by manufacturers, producers, and importers.336 The approximate price is US $3.50 per tonne of CO2 equivalent (tCO2e). This is a modest tax, well below the levels instituted in the European Union (approximately US $6.70/tCO2e) and United Kingdom (approximately US $15.75/tCO2e).337 This is also considerably below the levels that scenario analyses indicate would lead to a reduction in emissions consistent with limiting global warming to 2 degrees Celsius, which levels are estimated to be between US $80/tCO2e and $120/tCO2e.338
In addition to the relatively low level of taxation, the Mexican carbon tax is not levied on the full carbon content, but on the difference between the carbon content of the fuel being taxed and the carbon content of natural gas. Natural gas provides the baseline, and is therefore itself exempt from any taxation under the carbon tax.339 The tax is also capped at 3 percent of the sales price of the fuel.340
South Africa. A carbon tax was first suggested by the South African government in 2010, and in May 2013 the government published a carbon tax policy paper for public comment.341 The proposed start date for the carbon tax has been pushed back, although draft legislation has been proposed.342 The current expected start date is later in 2017.343
Under the draft legislation, the initial rate of taxation will be 120 rand, or approximately US $8, per tonne of CO2.344 However, because of various exemptions and phase-ins, the effective rate of taxation will be between 6 and 48 rand (US $0.40 to $3.20).345 During the first phase of the carbon tax, from implementation through 2020, there is a 60 percent tax-free threshold, with additional tax free allowances for certain industries for the use of carbon offsets. For firms that

HANDBOOK ON CARBON PRICING INSTRUMENTS | 43
take early action or institute carbon budgeting policies, the cap of tax free allowances rises to 95 percent.346
The measure is intended to be revenue neutral for the first five years. Revenue raised by the tax is to be used in part to provide free electricity to certain low income households, for public transportation and to provide credits and other tax relief for clean energy.347
British Columbia. The British Columbia carbon tax is a sub-national tax instituted in 2008. The tax applies to almost all fossil fuel use in British Columbia, and covers approximately 70 percent of all greenhouse gas emissions from residential, commercial, and industrial sources.348 Initially set at $10/tCO2e (CAD), it was designed to rise by $5/tCO2e until reaching $30/tCO2e in 2012.349 The carbon tax is required to be revenue neutral, which has been achieved by cuts to income taxes (both personal and corporate) and targeted tax relief for vulnerable communities and households.350
The British Columbia carbon tax is viewed by many as a success. Consumption of impacted fuels per person has dropped 16 percent while, in the same period, consumption of fuels per person in Canada generally has risen slightly.351 Meanwhile, GDP growth in British Columbia has kept pace with the rest of Canada.352
Norway. Norway has had a carbon tax since 1991. By 1999, the average price per tonne of CO2 was US $18. However, the Norwegian carbon tax has different tax rates for different sources and contains various exceptions.353 For example, starting in 2013 the tax rate on Norway’s North Sea oil industry is over US $70/tCO2e.354 However, there is no imposition of tax on emissions from most industrial processes, which made up 18 percent of total Norwegian emissions in 2006.355 Reduced rates are in place for the fishing, domestic aviation, and shipping industries.356,357 As of 2006, the carbon tax in Norway covers approximately 68 percent of total CO2 emissions.358
An optimal tax, in contrast, requires uniform taxation across sectors and sources.359 As a result of these exemptions and differentiated rates, the efficacy of the Norwegian carbon tax has been questioned.360
United Kingdom. On April 1, 2013, the UK instituted a carbon floor price (CFP). Under the EU ETS, there is already a price on carbon in the UK. A CFP puts a floor on the price of carbon when the price of permits under the EU ETS drops. When the price of the permits drops below the floor price of the UK CFP, companies pay the difference to the UK Treasury.361 The permit price has been frozen at approximately £18 through at least 2020.362
The CFP has been criticized for shifting emissions throughout the EU rather than reducing them, for being regressive, and for its revenues being used to bolster the UK Treasury rather than being reinvested into either clean energy initiatives or to reduce regressive impacts.363

HANDBOOK ON CARBON PRICING INSTRUMENTS | 44
France. In 2014, France imposed a carbon tax on natural gas, coal, and heating oil.364 The rate began at €7/tCO2e in 2014, increasing to €14.5/tCO2e in 2015 and €22/tCO2e in 2016.365 Industrial companies that are part of the EU ETS, as well as transport and fishing sectors, are exempted from the carbon tax.366 In 2015, prior to COP21, France adopted a bill intended to raise the carbon tax rate to €56/tCO2e by 2020, and €100/tCO2e by 2030.367
Fuel Tax Programs:
India. India taxes its coal through the Clean Energy Cess program. The tax covers both imported and domestically-produced coal, lignite, and peat first at a rate of 50 rupees per tonne (US $1.08) in 2010, which was first doubled to 100 rupees in 2014 and has since been increased to 400 rupees per tonne (US $5.88) in 2015.368,369 Proceeds go into the National Clean Energy Fund, which finances “research and innovative projects in clean technologies.”370 The tax is collected at the point of removal from the mine or entry through customs. Failure to pay the tax results in a fine of up to 10,000 rupees and confiscation of the goods in question.371 India also has similar taxes on diesel and petrol.372 It is important to note that India’s Clean Energy Cess is impartial to the carbon content of the fuel, and therefore does not create an outright tax on carbon. Rather, it is an implicit tax as its results can be translated into reduced carbon emissions.
HANDBOOK ON CARBON PRICING INSTRUMENTS | 45
DESIGN PRINCIPLES SUMMARY As detailed in this Handbook, the literature and analysis of market-based carbon pricing
instruments is vast. To aid policymakers and legislators, several key design principles provide a summary list for consultation when designing carbon pricing policies.
Design for Price Volatility. Perhaps the greatest difficulty, and the foremost outcome that can reduce confidence and cause the collapse of carbon markets, is price volatility. The use of price floors, ceilings, and other stabilizing policies have proven to be key design elements to increase programmatic stability. A good example to start with when designing price volatility controls is California’s use of a price floor, or auction reserve price, in its AB 32 regulations. The mechanics of such an price can be seen in § 95911(b)-(c) of the current regulations for AB 32, accessible online through the following link: https://www.arb.ca.gov/cc/capandtrade/capandtrade/unofficial_ct_030116.pdf
Design for Local Conditions. Carefully tailor a carbon pricing policy to reflect local conditions — e.g. the economy, legal system, geography, and government institutions. The pathway to developing carbon pricing depends on a jurisdiction’s characteristics, including its level and structure of gross domestic product; endowment in natural resources; physical and institutional infrastructure; openness and trade policy; geographic location; inequality levels and industrial organization.373 In emerging countries in particular, the question of energy affordability presents a key issue.374 A good example of designing for local conditions would be to examine the use of stakeholder engagement in British Columbia’s updating of it carbon tax regulation.
Design for Linking. Linking carbon markets transnationally is a trend that is only bound to continue. At a minimum, regional linkages will serve to harmonize and stabilize carbon prices across the planet. Linking of compliance markets to voluntary markets is also an important paradigm. A good example of designing for linking directly, instead of just allowing the sale of offsets from one program into another, would be the California–Quebec linkage. The initial agreement for such linkage can be found at: https://www.arb.ca.gov/cc/capandtrade/linkage/ca_quebec_linking_agreement_english.pdf
Design for Political Adoption. Also carefully consider the need for political support. Make a point of determining who your stakeholders will be and reach out to them early and regularly to ensure their support. Carefully work to build and maintain consensus across broad political spectrums. A good example of technical stakeholder engagement comes from Alberta, Canada, and is available here: http://www.alberta.ca/documents/climate/cld-technical-engagement-summary.pdf
Add Banking and Borrowing. A number of ETS programs, including the seminal EU ETS program, suffered debilitating price instability from a lack of (a) mechanisms to borrow from future compliance periods or (b) bank allowances for future compliance periods. Any robust ETS should have a banking or borrowing mechanism to help smooth uneven periods.
HANDBOOK ON CARBON PRICING INSTRUMENTS | 46
Phase in Over Time. Almost every successful carbon pricing instrument has been phased in or ramped up over time. Such phase-ins minimize economic disruption and allow market participants to adjust their behavior. They also minimize political pushback. The World Bank and OECD together provide a strong summary of how the phasing-in of policies, along with many of the other recommendations provided in this summary and Handbook, can promote stability in programmatic development, which can be found here: https://www.oecd.org/environment/tools-evaluation/FASTER-carbon-pricing.pdf
c l imatereal i typroject .org
1 Global Analysis – June 2016, National Centers for Environmental Information,
https://www.ncdc.noaa.gov/sotc/global/201606. 2 Justin Gillis, Short Answers to Hard Questions About Climate Change, N.Y. Times (Nov. 28, 2015),
http://www.nytimes.com/interactive/2015/11/28/science/what-is-climate-change.html?_r=0. 3 Richard J. Lazarus, Super Wicked Problems and Climate Change: Restraining the Present to Liberate the
Future, 40 Envtl. L. Rep. 10749, 10750 (2009). 4 See for example, the concerns raised in the recent lead up to Ontario’s emissions trading market. 5 Jean-Yves Benois & Marc Allessie, Foreword, Emissions Trading Worldwide: International Carbon Action
Partnership (“ICAP”), Status Report 2016 3, https://icapcarbonaction.com/images/StatusReport2016/ICAP_Status_Report_2016_Online.pdf.
6 State and Trends of Carbon Pricing, World Bank Group & Ecofys (Oct. 2016), ß https://openknowledge.worldbank.org/bitstream/handle/10986/25160/9781464810015.pdf
7 Jean-Yves Benois & Marc Allessie, At a Glance, Emissions Trading Worldwide: ICAP, Status Report 2016 25-26.
8 State and Trends of Carbon Pricing, World Bank Group & Ecofys 20 (Sept. 2015). 9 John Fialka, Carbon Markets: The Epic Journey of a Modest Proposal, E&E News (May 11, 2016),
http://www.eenews.net/stories/1060037009. 10 T.C., Some more thoughts on a carbon tax, Economist (June 18, 2010),
http://www.economist.com/blogs/freeexchange/2010/06/taxing_carbon. 11 James M. Buchanan & Wm. Craig Stubblebine, Externality (1962), http://www.jstor.org/stable/2551386. 12 Richard Schmalensee & Robert N. Stavins, Lessons Learned from Three Decades of Experience with Cap-and-
Trade, Resources for the Future 3 (Nov. 2015). 13 Noah Kaufman, Michael Obeiter, & Eleanor Krause, Putting a Price on Carbon: Reducing Emissions, Issue
Brief, World Resources Institute 14, http://www.wri.org/sites/default/files/Putting_a_Price_on_Carbon_Emissions.pdf.
14 John Fialka, Carbon Markets: The Epic Journey of a Modest Proposal, E&E News (May 11, 2016).

HANDBOOK ON CARBON PRICING INSTRUMENTS | 47
15 Kevin Kennedy, Michael Obeiter, & Noah Kaufman, Putting a Price on Carbon: A Handbook for U.S.
Policymakers, World Resources Institute Working Paper 11 (Apr. 2015), http://www.wri.org/sites/default/files/carbonpricing_april_2015.pdf.
16 Christina M. Carroll et. al., Climate Change and Insurance 60 (2012). 17 John Fialka, Carbon Markets: The Epic Journey of a Modest Proposal, E&E News (May 11, 2016). 18 California Air Resources Board, Assembly Bill 32 Overview, (https://www.arb.ca.gov/cc/ab32/ab32.htm). 19 California Air Resources Board, ARB Emissions Trading Program,
(https://www.arb.ca.gov/cc/capandtrade/guidance/cap_trade_overview.pdf). 20 Richard G. Newell, William A Pizer, & Daniel Raimi, Carbon Markets 15 Years after Kyoto: Lessons Learned,
New Challenges, 27 J. Econ. Persp. 123, 142 (2003). 21 Emissions Trading in Practice: A Handbook on Design and Implementation, World Bank Group, PMR, &
ICAP 17, https://icapcarbonaction.com/en/?option=com_attach&task=download&id=364. 22 Carbon Pricing: The Paris Agreement’s Key Ingredient, Envtl. Defense Fund and Int’l Emissions Trading
Ass’n 2 (Apr. 2016), http://www.ieta.org/resources/Resources/Reports/Carbon_Pricing_The_Paris_Agreements_Key_Ingredient.pdf.
23 John Fialka, What will it take to build a global emissions trading system?, E&E News (May 18, 2016), http://www.eenews.net/stories/1060037414.
24 Richard G. Newell, William A. Pizer, & Daniel Raimi, Carbon Markets 15 Years after Kyoto: Lessons Learned, New Challenges, 27 J. Econ. Persp. 123, 124 (2013).
25 Carbon Pricing Watch 2016, World Bank Group & Ecofys 2, https://openknowledge.worldbank.org/bitstream/handle/10986/24288/CarbonPricingWatch2016.pdf?sequence=4&isAllowed=y.
26 China finalises allowance allocation plan for world’s biggest carbon market, Carbon Pulse (Oct. 20, 2016, 5:52 PM), http://carbon-pulse.com/25649/.
27 China’s Fujian eyes early ETS start, widens scope, Carbon Pulse, (Oct. 10, 2016, 12:54 PM), http://carbon-pulse.com/25165/.
28 Findings from Select Federal Reports: the National Security Implications of A Changing Climate, The White House (May 2015), https://www.whitehouse.gov/sites/default/files/docs/National_Security_Implications_of_Changing_Climate_Final_051915.pdf.
29 What Happens When Your Country Drowns?, Mother Jones (Nov./Dec. 2009)http://www.motherjones.com/environment/2009/11/tuvalu-climate-refugees.
30 Nicholas Casey, Climate Change Claims a Lake, and an Identity, N.Y. Times: World (July 7, 2016), http://www.nytimes.com/interactive/2016/07/07/world/americas/bolivia-climate-change-lake-poopo.html.
31 Thomas Beller, The Age of Humans: Living in the Anthropocene, Smithsonian Magazine (June 29, 2016), http://www.smithsonianmag.com/science-nature/residents-louisiana-island-americas-first-climate-refugees-180959585/?no-ist.
32 Tom Kerr, Putting a Price on Carbon, One Jurisdiction at a Time, Making Waves: The Next Wave, IETA Greenhouse Gas Market 1, http://www.ieta.org/resources/Resources/GHG_Report/2015/Articles/Putting_a_price_on_carbon_one_jurisdiction_at_a_time_TKerr.pdf.
33 Tom Kerr, Putting a Price on Carbon, One Jurisdiction at a Time, Making Waves: The Next Wave, IETA Greenhouse Gas Market 1.
34 Steve Zwick, The Road From Paris: Green Lights, Speed Bumps, and the Future of Carbon Markets, Ecosystem Marketplace, http://www.ecosystemmarketplace.com/articles/green-lights-and-speed-bumps-on-road-to-markets-under-paris-agreement/.
35 Andrei Marcu, Carbon Market Provisions in the Paris Agreement (Article 6), CEPS Special Report No. 128 6, https://www.ceps.eu/system/files/SR%20No%20128%20ACM%20Post%20COP21%20Analysis%20of%20Article%206.pdf.
36 Andrei Marcu, Carbon Market Provisions in the Paris Agreement (Article 6), CEPS Special Report No. 128 1 (Jan. 2016).
37 Vikram Widge, Carbon Markets in the Paris Agreement – an early holiday gift, Development in a Changing Climate 21 (Dec. 17, 2015), http://blogs.worldbank.org/climatechange/print/carbon-markets-paris-agreement-early-holiday-gift.
38 Vikram Widge, Carbon Markets in the Paris Agreement – an early holiday gift, Development in a Changing Climate 21 (Dec. 17, 2015).

HANDBOOK ON CARBON PRICING INSTRUMENTS | 48
39 Jean-Yves Benois & Marc Allessie, At a Glance, Emissions Trading Worldwide: ICAP, Status Report 2016 25. 40 Paris Agreement, Framework Convention on Climate Change 24, art. 6.2 (Dec. 12, 2015),
https://unfccc.int/resource/docs/2015/cop21/eng/l09r01.pdf. 41 NDC Registry, United Nations Framework Convention on Climate Change,
http://unfccc.int/focus/ndc_registry/items/9433.php. 42 Paris Agreement, Framework Convention on Climate Change 24, art. 6.3 (Dec. 12, 2015). 43 Andrei Marcu, Carbon Market Provisions in the Paris Agreement (Article 6), CEPS Special Report No. 128 1,
6-7 (Jan. 2016). 44 The Paris Agreement: Putting the first universal climate change treaty in context, Baker & McKenzie 14 (Jan.
2016). 45 Carbon Pricing Watch 2016, World Bank Group & Ecofys 1. 46 Paris Agreement - Status of Ratification, United Nations Framework Convention on Climate Change,
http://unfccc.int/paris_agreement/items/9444.php. 47 Landmark Climate Change Agreement to Enter into Force, UN Climate Change Newsroom (Oct. 5, 2016),
http://newsroom.unfccc.int/unfccc-newsroom/landmark-climate-change-agreement-to-enter-into-force/. 48 Mark Landler & Jane Perlez, Rare Harmony as China and U.S. Commit to Climate Deal, N.Y. Times (Sept. 3,
2016), http://www.nytimes.com/2016/09/04/world/asia/obama-xi-jinping-china-climate-accord.html. 49 Paris Agreement - Status of Ratification, United Nations Framework Convention on Climate Change. 50 Paris Agreement - Status of Ratification, United Nations Framework Convention on Climate Change. 51 Landmark Climate Change Agreement to Enter into Force, UN Climate Change Newsroom (Oct. 5, 2016). 52 GHG Market Sentiment Survey 2016, PwC & IETA 5,
http://www.ieta.org/resources/Resources/GHG_Market_Sentiment_Survey/IETA%20GHG%20Sentiment%20Survey%202016.pdf.
53 Landmark Climate Change Agreement to Enter into Force, UN Climate Change Newsroom (Oct. 5, 2016). 54 Landmark Climate Change Agreement to Enter into Force, UN Climate Change Newsroom (Oct. 5, 2016). 55 Gwynne Taraska & Howard Marano, How Carbon Pricing Could Span the United States and North America,
Center for American Progress 2 (Nov. 3, 2016), https://cdn.americanprogress.org/content/uploads/2016/11/02130220/CarbonPricing-brief.pdf.
56 Gwynne Taraska & Howard Marano, How Carbon Pricing Could Span the United States and North America, Center for American Progress 2 (Nov. 3, 2016).
57 Gwynne Taraska & Howard Marano, How Carbon Pricing Could Span the United States and North America, Center for American Progress 2 (Nov. 3, 2016).
58 GHG Market Sentiment Survey 2016, PwC & IETA 2. 59 Hyungsup Lee, The Korean Emissions Trading Scheme: Implementation of the Korean Emissions Trading
Scheme and the Road Ahead, Emissions Trading Worldwide: ICAP, Status Report 2016 18. 60 State and Trends of Carbon Pricing, World Bank Group & Ecofys (Sept. 2015). 61 State and Trends of Carbon Pricing, World Bank Group & Ecofys (Sept. 2015). 62 State and Trends of Carbon Pricing, World Bank Group & Ecofys (Sept. 2015). 63 State and Trends of Carbon Pricing, World Bank Group & Ecofys (Sept. 2015). 64 Harm van de Wetering & Suzanne Beurskens, A Simple ETS is a More Future Proof ETS, Emissions Trading
Worldwide: ICAP, Status Report 2016 10. 65 The Impact of Corruption on Climate Change: Threatening Emissions Trading Mechanisms?, UNEP Global
Envtl. Alert Service (GEAS) 4 (Mar. 2013), http://www.unep.org/pdf/UNEP-GEAS_MARCH_2013.pdf. 66 The Impact of Corruption on Climate Change: Threatening Emissions Trading Mechanisms?, UNEP Global
Envtl. Alert Service (GEAS) 4 (Mar. 2013). 67 The Impact of Corruption on Climate Change: Threatening Emissions Trading Mechanisms?, UNEP Global
Envtl. Alert Service (GEAS) 4 (Mar. 2013). 68 The Impact of Corruption on Climate Change: Threatening Emissions Trading Mechanisms?, UNEP Global
Envtl. Alert Service (GEAS) 4 (Mar. 2013). 69 The Impact of Corruption on Climate Change: Threatening Emissions Trading Mechanisms?, UNEP Global
Envtl. Alert Service (GEAS) 4 (Mar. 2013). 70 The FASTER Principles for Successful Carbon Pricing: An approach based on initial experience, OECD &
World Bank Group 2 (Sept. 2015), https://www.oecd.org/environment/tools-evaluation/FASTER-carbon-pricing.pdf.
71 The FASTER Principles for Successful Carbon Pricing: An approach based on initial experience, OECD & World Bank Group 2 (Sept. 2015).

HANDBOOK ON CARBON PRICING INSTRUMENTS | 49
72 Richard Schmalensee & Robert N. Stavins, Lessons Learned from Three Decades of Experience with Cap-and-
Trade, 18 World Resources Inst. (Nov. 2015). 73 Cédric Philibert, Certainty versus Ambition: Economic Efficiency in Mitigating Climate Change, Int'l Energy
Agency Working Paper Series (Oct. 2006), https://www.iea.org/publications/freepublications/publication/certainty_ambition.pdf.
74 Cédric Philibert, Certainty versus Ambition: Economic Efficiency in Mitigating Climate Change, Int'l Energy Agency Working Paper Series (Oct. 2006).
75 Lawrence H. Goulder & Andrew R. Schein, Carbon Taxes Versus Cap and Trade: A Critical Review, 4 Climate Change Econ. 1350010-1, 13500-3 (2013).
76 Lawrence H. Goulder & Andrew R. Schein, Carbon Taxes Versus Cap and Trade: A Critical Review, 4 Climate Change Econ. 1350010-1, 13500-4 (2013).
77 Frank Jotzo, A Carbon Price for Australia: From Tax to Trading, Resources for the Future (Apr. 4, 2011), http://www.rff.org/blog/2011/carbon-price-australia-tax-trading.
78 South Africa: An Emissions Trading Case Study, EDF, CDC Climat Research, IETA 4 (May 2015), https://ieta.wildapricot.org/resources/Resources/Case_Studies_Worlds_Carbon_Markets/south_africa_case_study_may2015.pdf.
79 Gilbert E. Metcalf & David Weisbach, The Design of a Carbon Tax, 33 Harv. Envtl. L. Rev. 499, 507-08 (2009). 80 Tim Profeta & Brigham Daniels, Design Principles of a Cap and Trade System for Greenhouse Gases, Nicholas
Inst. for Envtl. Policy Solutions Duke U. 5, https://nicholasinstitute.duke.edu/sites/default/files/publications/design-principles-of-a-cap-and-trade-system-for-greenhouse-gases-paper.pdf.
81 Emissions Trading in Practice: A Handbook on Design and Implementation, World Bank Group, PMR, & ICAP 32 (2016).
82 Emissions Trading in Practice: A Handbook on Design and Implementation, World Bank Group, PMR, & ICAP 36 (2016).
83 Kevin Kennedy, Michael Obeiter, & Noah Kaufman, Putting a Price on Carbon: A Handbook for U.S. Policymakers, World Resources Institute Working Paper 4 (Apr. 2015).
84 Emissions Trading in Practice: A Handbook on Design and Implementation, World Bank Group, PMR, & ICAP 33 (2016).
85 Gilbert E. Metcalf & David Weisbach, The Design of a Carbon Tax, 33 Harv. Envtl. L. Rev. 499, 500-01 (2009). 86 Gilbert E. Metcalf & David Weisbach, The Design of a Carbon Tax, 33 Harv. Envtl. L. Rev. 499, 511 (2009). 87 Gilbert E. Metcalf & David Weisbach, The Design of a Carbon Tax, 33 Harv. Envtl. L. Rev. 499, 511 (2009). 88 Gilbert E. Metcalf & David Weisbach, The Design of a Carbon Tax, 33 Harv. Envtl. L. Rev. 499, 512 (2009). 89 Social Cost of Carbon, EPA Fact Sheet (Dec. 2015),
https://www3.epa.gov/climatechange/Downloads/EPAactivities/social-cost-carbon.pdf. 90 The FASTER Principles for Successful Carbon Pricing: An approach based on initial experience, OECD &
World Bank Group 19 (Sept. 2015). 91 Gilbert E. Metcalf & David Weisbach, The Design of a Carbon Tax, 33 Harv. Envtl. L. Rev. 499, 512 (2009). 92 Michael Wara, Instrument Choice, Carbon Emissions, and Information, 4 Mich. Envtl. & Admin. L. 261, 266
n.90 (2015). 93 Michael Wara, Instrument Choice, Carbon Emissions, and Information, 4 Mich. Envtl. & Admin. L. 261, 266
(2015). 94 Michael Wara, Instrument Choice, Carbon Emissions, and Information, 4 Mich. Envtl. & Admin. L. 261, 267
(2015). 95 David M. Driesen, Capping Carbon. 40 Envtl. L. 1, 32 (2010). 96 Wara, Michael. Instrument Choice, Carbon Emissions, and Information, 4 Mich. Envtl. & Admin. L. 261, 267
(2015) 97 Michael Wara, Instrument Choice, Carbon Emissions, and Information, 4 Mich. Envtl. & Admin. L. 261, 285
(2015). 98 Danny Cullenward & Andy Coghlan, Structural Oversupply and Credibility in California’s Carbon Market, 29
The Electricity J. 11, 13 (2016). 99 Congressional Policy Brief, Greenhouse Gas Allowance Allocations 3 (2008). 100 Andrew J. O’Connell, A Critical Analysis of Allowance Allocation in Cap-and-Trade and its Effect on Linked
Carbon Markets, 44 Tex. Envtl. L. J. 339, 347 (2014). 101 Andrew J. O’Connell, A Critical Analysis of Allowance Allocation in Cap-and-Trade and its Effect on Linked
Carbon Markets, 44 Tex. Envtl. L. J. 351-52 (2014)

HANDBOOK ON CARBON PRICING INSTRUMENTS | 50
102 Andrew J. O’Connell, A Critical Analysis of Allowance Allocation in Cap-and-Trade and its Effect on Linked
Carbon Markets, 44 Tex. Envtl. L. J. 351-52 (2014) 103 Andrew J. O’Connell, A Critical Analysis of Allowance Allocation in Cap-and-Trade and its Effect on Linked
Carbon Markets, 44 Tex. Envtl. L. J. 353 (2014) 104 Lawrence H. Goulder & Andrew R. Schein, Carbon Taxes Versus Cap and Trade: A Critical Review, 4
Climate Change Econ. 1350010-1, 13500-4 (2013). 105 Richard G. Newell, William A. Pizer, & Daniel Raimi, Carbon Markets 15 Years after Kyoto: Lessons Learned,
New Challenges, 27 J. Econ. Persp. 123, 132 (2003). 106 Congressional Policy Brief, Greenhouse Gas Allowance Allocations 4 (2008). 107 Andrew J. O’Connell, A Critical Analysis of Allowance Allocation in Cap-and-Trade and its Effect on Linked
Carbon Markets, 44 Tex. Envtl. L. J. 339, 347 (2014). 108 Congressional Policy Brief, Greenhouse Gas Allowance Allocations 3 (2008). 109 Lawrence H. Goulder & Andrew R. Schein, Carbon Taxes Versus Cap and Trade: A Critical Review, 4
Climate Change Econ. 1350010-1, 13500-8 (2013). 110 Lawrence H. Goulder & Andrew R. Schein, Carbon Taxes Versus Cap and Trade: A Critical Review, 4
Climate Change Econ. 1350010-1, 13500-8 (2013). 111 Kevin Kennedy, Michael Obeiter, & Noah Kaufman, Putting a Price on Carbon: A Handbook for U.S.
Policymakers, World Resources Institute Working Paper 4 (Apr. 2015). 112 Lawrence H. Goulder & Andrew R. Schein, Carbon Taxes Versus Cap and Trade: A Critical Review, 4
Climate Change Econ. 1350010-1, 13500-10 (2013). 113 Kevin Kennedy, Michael Obeiter, & Noah Kaufman, Putting a Price on Carbon: A Handbook for U.S.
Policymakers, World Resources Institute Working Paper 4 (Apr. 2015). 114 Kevin Kennedy, Michael Obeiter, & Noah Kaufman, Putting a Price on Carbon: A Handbook for U.S.
Policymakers, World Resources Institute Working Paper 4 (Apr. 2015). 115 Kevin Kennedy, Michael Obeiter, & Noah Kaufman, Putting a Price on Carbon: A Handbook for U.S.
Policymakers, World Resources Institute Working Paper 20 (Apr. 2015). 116 Kevin Kennedy, Michael Obeiter, & Noah Kaufman, Putting a Price on Carbon: A Handbook for U.S.
Policymakers, World Resources Institute Working Paper 4 (Apr. 2015). 117 Lesley K. Mcallister, Enforcing Cap-and-Trade: A Tale of Two Programs, 2 San Diego J. Climate & Energy L.
1, 4–5 (2010). 118 Lesley K. Mcallister, Enforcing Cap-and-Trade: A Tale of Two Programs, 2 San Diego J. Climate & Energy L.
1, 5–6 (2010). 119 Lesley K. Mcallister, Enforcing Cap-and-Trade: A Tale of Two Programs, 2 San Diego J. Climate & Energy L.
1, 8 (2010). 120 Lesley K. Mcallister, Enforcing Cap-and-Trade: A Tale of Two Programs, 2 San Diego J. Climate & Energy L.
1, 9–11 (2010). 121 Lesley K. Mcallister, Enforcing Cap-and-Trade: A Tale of Two Programs, 2 San Diego J. Climate & Energy L.
1, 12 (2010). 122 Kevin Kennedy, Michael Obeiter, & Noah Kaufman, Putting a Price on Carbon: A Handbook for U.S.
Policymakers, World Resources Institute Working Paper 23 (Apr. 2015). 123 Emissions Trading in Practice: A Handbook on Design and Implementation, World Bank Group, PMR, &
ICAP 10. 124 Lawrence H. Goulder & Andrew R. Schein, Carbon Taxes Versus Cap and Trade: A Critical Review, 4
Climate Change Econ. 1350010-1, 13500-11 (2013). 125 Richard G. Newell, William A Pizer, & Daniel Raimi, Carbon Markets 15 Years after Kyoto: Lessons Learned,
New Challenges, 27 J. Econ. Persp. 123, 134 (2003). 126 Lawrence H. Goulder & Andrew R. Schein, Carbon Taxes Versus Cap and Trade: A Critical Review, 4
Climate Change Econ. 1350010-1, 13500-13 (2013). 127 Lawrence H. Goulder & Andrew R. Schein, Carbon Taxes Versus Cap and Trade: A Critical Review, 4
Climate Change Econ. 1350010-1, 13500-14 (2013). 128 Lawrence H. Goulder, Markets for Pollution Allowances: What are the (New) Lessons?, 27 J. Econ. Persp. 87,
95 (2003). 129 Lawrence H. Goulder, Markets for Pollution Allowances: What are the (New) Lessons?, 27 J. Econ. Persp. 87,
95 (2003). 130 Richard G. Newell, William A Pizer, & Daniel Raimi, Carbon Markets 15 Years after Kyoto: Lessons Learned,
New Challenges, 27 J. Econ. Persp. 123, 135 (2003).
HANDBOOK ON CARBON PRICING INSTRUMENTS | 51
131 Lawrence H. Goulder & Andrew R. Schein, Carbon Taxes Versus Cap and Trade: A Critical Review, 4
Climate Change Econ. 1350010-1, 13500-14 (2013). 132 GHG Market Sentiment Survey 2016, PwC & IETA 12. 133 State and Trends of Carbon Pricing, World Bank Group & Ecofys 28 (Sept. 2015). 134 Alexander Eden et. al., Benefits of Emissions Trading, ICAP 97 (July 2016),
https://icapcarbonaction.com/en/?option=com_attach&task=download&id=389. 135 Alexander Eden et. al., Benefits of Emissions Trading, ICAP 97 n.91 (July 2016). 136 Anthony Mansell, What role for carbon markets in the 2015 climate agreement? Center for Climate and
Energy Solutions (Feb. 2015). 137 State and Trends of Carbon Pricing, World Bank Group & Ecofys 89 (Oct. 2016). 138 Id. at 92. 139 Allison Martell & Mike De Souza, Ontario Confirms it will join Quebec, California in Carbon Market,
Reuters (Apr. 13, 2015, 2:00 PM), http://www.reuters.com/article/us-climatechange-canada-idUSKBN0N41X220150413; Bill 172, 41st Legislature of Ontario, An Act Respecting Greenhouse Gas (Feb. 24, 2016), http://www.ontla.on.ca/bills/bills-files/41_Parliament/Session1/b172.pdf.
140 Governor Cuomo, Joined By Vice President Gore, Announces New Actions to Reduce Greenhouse Gas Emissions and Lead Nation on Climate Change, NY.gov, https://www.governor.ny.gov/news/governor-cuomo-joined-vice-president-gore-announces-new-actions-reduce-greenhouse-gas-emissions.
141 Anthony Mansell, What role for carbon markets in the 2015 climate agreement? Center for Climate and Energy Solutions (Feb. 2015).
142 No. 1394 CALIFORNIA ENERGY MARKETS, 9-10 (July 15, 2016). 143 The FASTER Principles for Successful Carbon Pricing: An approach based on initial experience, OECD &
World Bank Group 18 (Sept. 2015). 144 The FASTER Principles for Successful Carbon Pricing: An approach based on initial experience, OECD &
World Bank Group 18 (Sept. 2015). 145 Jean-Philippe Brisson, White Paper: Outstanding Design Flaws in California’s Cap-and-Trade Program,
Client Alert 1751, Latham & Watkins LLP 1 (Oct. 16, 2014). 146 Jean-Philippe Brisson, White Paper: Outstanding Design Flaws in California’s Cap-and-Trade Program,
Client Alert 1751, Latham & Watkins LLP 2 (Oct. 16, 2014). 147 Richard Schmalensee & Robert N. Stavins, Lessons Learned from Three Decades of Experience with Cap-and-
Trade, Resources for the Future 8 (Nov. 2015), http://www.rff.org/files/document/file/RFF-DP-15-51.pdf. 148 Richard Schmalensee & Robert N. Stavins, Lessons Learned from Three Decades of Experience with Cap-and-
Trade, Resources for the Future 14 (Nov. 2015). 149 Richard Schmalensee & Robert N. Stavins, Lessons Learned from Three Decades of Experience with Cap-and-
Trade, Resources for the Future 15 (Nov. 2015). 150 State and Trends of Carbon Pricing, World Bank Group & Ecofys 28 (Sept. 2015). 151 Richard G. Newell, William A Pizer, & Daniel Raimi, Carbon Markets 15 Years after Kyoto: Lessons Learned,
New Challenges, 27 J. Econ. Persp. 123, 136 (2003). 152 Richard G. Newell, William A Pizer, & Daniel Raimi, Carbon Markets 15 Years after Kyoto: Lessons Learned,
New Challenges, 27 J. Econ. Persp. 123, 136 (2003). 153 Richard G. Newell, William A Pizer, & Daniel Raimi, Carbon Markets 15 Years after Kyoto: Lessons Learned,
New Challenges, 27 J. Econ. Persp. 123, 137 (2003). 154 Richard G. Newell, William A Pizer, & Daniel Raimi, Carbon Markets 15 Years after Kyoto: Lessons Learned,
New Challenges, 27 J. Econ. Persp. 123, 137 (2003). 155 Introduction to Carbon Markets in Mexico, Climate Action Reserve 3 (Dec. 15, 2015),
https://www.google.com/url?sa=t&rct=j&q=&esrc=s&source=web&cd=2&ved=0ahUKEwivmL7Z37nOAhVRzWMKHWQ-CdwQFggoMAE&url=http%3A%2F%2Fwww.climateactionreserve.org%2Fwp-content%2Fuploads%2F2015%2F12%2FClimate-Action-Reserve_Mexico-Carbon-Markets-Memo-ENGLISH.pdf&usg=AFQjCNFdtF7ksZ5hEx3l1Wo2icNFatRpsg&cad=rja.
156 GHG Market Sentiment Survey 2016, PwC & IETA 2. 157 Ann E. Carlson, Designing Effective Climate Policy: Cap-and-Trade and Complementary Policies, 49 Harv. J.
on Legis. 207, 226-27 (2012). 158 Ann E. Carlson, Designing Effective Climate Policy: Cap-and-Trade and Complementary Policies, 49 Harv. J.
on Legis. 207, 231, 241 (2012). 159 Ann E. Carlson, Designing Effective Climate Policy: Cap-and-Trade and Complementary Policies, 49 Harv. J.
on Legis. 207, 224, 226 (2012).

HANDBOOK ON CARBON PRICING INSTRUMENTS | 52
160 The FASTER Principles for Successful Carbon Pricing: An approach based on initial experience, OECD &
World Bank Group 5 (Sept. 2015). 161 What is the Impact of Carbon Pricing on Competiveness?, Carbon Pricing Leadership Coalition 2 (June 2016),
http://pubdocs.worldbank.org/en/759561467228928508/CPLC-Competitiveness-print2.pdf. 162 What is the Impact of Carbon Pricing on Competiveness?, Carbon Pricing Leadership Coalition 3 (June 2016). 163 What is the Impact of Carbon Pricing on Competiveness?, Carbon Pricing Leadership Coalition 3 (June 2016). 164 Emissions Trading in Practice: A Handbook on Design and Implementation, ICAP & PMR 136 (2016),
https://icapcarbonaction.com/en/?option=com_attach&task=download&id=364. 165 The FASTER Principles for Successful Carbon Pricing: An approach based on initial experience, OECD &
World Bank Group 24 (Sept. 2015). 166 Emissions Trading in Practice: A Handbook on Design and Implementation, ICAP & PMR 140 (2016). 167 Emissions Trading in Practice: A Handbook on Design and Implementation, ICAP & PMR 140 (2016). 168 The FASTER Principles for Successful Carbon Pricing: An approach based on initial experience, OECD &
World Bank Group 5 (Sept. 2015). 169 The FASTER Principles for Successful Carbon Pricing: An approach based on initial experience, OECD &
World Bank Group 5 (Sept. 2015). 170 Emissions Trading in Practice: A Handbook on Design and Implementation, ICAP & PMR 138 (2016). 171 Charles Komanoff & Matthew Gordon, British Columbia’s Carbon Tax: By the Numbers, Carbon Tax Center
6 (Dec. 2015), https://www.carbontax.org/wp-content/uploads/CTC_British_Columbia's_Carbon_Tax_By_The_Numbers.pdf
172 David Amdur, Barry G. Rabe, & Christopher Borick, Public Views on a Carbon Tax Depend on the Proposed Use of Revenue, Issues in Energy & Envtl. Policy (July 2014), http://closup.umich.edu/files/ieep-nsee-2014-spring-carbon-tax.pdf.
173 Asa Johansson, Christopher Heady, Jens Arnold, Bert Brys, & Laura Vartia, Tax and Economic Growth, Organization for Economic Cooperation and Development, Economics Department Working Paper No. 620 (Paris 2008).
174 Jared Carbone et. al., Getting to an Efficient Carbon Tax: How the Revenue is Used Matters, Resources for the Future (Jan. 13, 2014), http://www.rff.org/research/publications/getting-efficient-carbon-tax-how-revenue-used-matters.
175 Charles Komanoff & Matthew Gordon, British Columbia’s Carbon Tax: By the Numbers, Carbon Tax Center 6 (Dec. 2015).
176 Gilbert E. Metcalf, A Proposal for a U.S. Carbon Tax Swap, The Hamilton Project: Discussion Paper 2007-12 (Oct. 2007), http://www.hamiltonproject.org/assets/legacy/files/downloads_and_links/An_Equitable_Tax_Reform_to_Address_Global_Climate_Change.pdf.
177 Financial Impact on Households of Carbon Fee and Dividend, Citizens’ Climate Lobby, https://citizensclimatelobby.org/household-impact-study/.
178 Kevin Kennedy, Michael Obeiter, & Noah Kaufman, Putting a Price on Carbon: A Handbook for U.S. Policymakers, World Resources Institute Working Paper 11-12 (Apr. 2015).
179 See, e.g., Kevin A. Hassett, Aparna Mathur, Gilbert E. Metcalf, The Incidence of a U.S. Carbon Tax: A Lifetime and Regional Analysis, Working Paper 13554, National Bureau of Economic Research 2 (Oct. 2007), http://www.nber.org/papers/w13554.pdf; Dallas Burtraw, Richard Sweeney, & Margaret Walls, The Incidence of U.S. Climate Policy: Alternative Uses of Revenues from a Cap-and-Trade Auction, Resources for the Future 2 (Apr. 2009, revised June 2009), http://www.rff.org/files/sharepoint/WorkImages/Download/RFF-DP-09-17-REV.pdf.
180 See, e.g., Michael Bastasch, Liberal Think Tank Admits A Carbon Tax Is ‘Regressive,’ The Daily Caller (Dec. 10, 2015), http://dailycaller.com/2015/12/10/liberal-think-tank-admits-a-carbon-tax-is-regressive/.
181 For an example of a study which analyzes the impact of a lump-sum transfer in the context of a cap-and-trade regime, see Burtraw, Sweeney, and Walls (supra).
182 The Impact of Corruption on Climate Change: Threatening Emissions Trading Mechanisms?, UNEP Global Envtl. Alert Service (GEAS) 2 (Mar. 2013), http://na.unep.net/geas/archive/pdfs/GEAS_Mar2013_EnvCorruption.pdf.
183 The Impact of Corruption on Climate Change: Threatening Emissions Trading Mechanisms?, UNEP Global Envtl. Alert Service (GEAS) 2 (Mar. 2013).
184 The Impact of Corruption on Climate Change: Threatening Emissions Trading Mechanisms?, UNEP Global Envtl. Alert Service (GEAS) 2 (Mar. 2013) (citing Lohmann, 2007; TI, 2012a; Wara, 2007).

HANDBOOK ON CARBON PRICING INSTRUMENTS | 53
185 The Impact of Corruption on Climate Change: Threatening Emissions Trading Mechanisms?, UNEP Global
Envtl. Alert Service (GEAS) 3 (Mar. 2013) (citing Johnston, 1997; Klitgaard, 1988). 186 The Impact of Corruption on Climate Change: Threatening Emissions Trading Mechanisms?, UNEP Global
Envtl. Alert Service (GEAS) 2 (Mar. 2013) (citing UN, 2012, pp. 50). 187 The Impact of Corruption on Climate Change: Threatening Emissions Trading Mechanisms?, UNEP Global
Envtl. Alert Service (GEAS) 5 (Mar. 2013). 188 The Impact of Corruption on Climate Change: Threatening Emissions Trading Mechanisms?, UNEP Global
Envtl. Alert Service (GEAS) 5 (Mar. 2013) (citing Gilbertson, 2010). 189 The Impact of Corruption on Climate Change: Threatening Emissions Trading Mechanisms?, UNEP Global
Envtl. Alert Service (GEAS) 5 (Mar. 2013) (citing Corporate Watch, 2010; Kossoy and Guignon, 2012). 190 Corporate Watch, The Carbon Counsel: VAT Tax Fraud, Press Release (2010),
http://www.corporatewatch.org/?lid=3676. 191 The Impact of Corruption on Climate Change: Threatening Emissions Trading Mechanisms?, UNEP Global
Envtl. Alert Service (GEAS) 9 (Mar. 2013) (citing Najam et al., 2006; Thorpe and Ogle, 2011; TI, 2012a; UNODC, 2012).
192 The Impact of Corruption on Climate Change: Threatening Emissions Trading Mechanisms?, UNEP Global Envtl. Alert Service (GEAS) 9 (Mar. 2013) (citing UN, 2012).
193 The Impact of Corruption on Climate Change: Threatening Emissions Trading Mechanisms?, UNEP Global Envtl. Alert Service (GEAS) 9 (Mar. 2013).
194 The Impact of Corruption on Climate Change: Threatening Emissions Trading Mechanisms?, UNEP Global Envtl. Alert Service (GEAS) 9 (Mar. 2013).
195 Constanze Haug, Michel Frerk, & Marissa Santikarn, Towards a Global Price on Carbon: Pathways for Linking Carbon Pricing Instruments, 7 Adelphi (2015).
196 Carbon Pollution Emission Guidelines for Existing Stationary Sources: Electric Utility Generating Units, 80 Fed. Reg. 64,662, 64,662 (Oct. 23, 2015), https://www.gpo.gov/fdsys/pkg/FR-2015-10-23/pdf/2015-22842.pdf.
197 State and Trends of Carbon Pricing, World Bank Group & Ecofys 51 (Oct. 2016), https://openknowledge.worldbank.org/bitstream/handle/10986/25160/9781464810015.pdf?sequence=3&isAllowed=y.
198 Renewable Electricity Production Tax Credit (PTC), Energy.Gov, http://energy.gov/savings/renewable-electricity-production-tax-credit-ptc.
199 Renewable Electricity Production Tax Credit (PTC), Energy.Gov. 200 Tom Randall, What Just Happened in Solar is a Bigger Deal Than Oil Exports, Bloomberg (Dec. 17, 2015,
8:21 AM), http://www.bloomberg.com/news/articles/2015-12-17/what-just-happened-to-solar-and-wind-is-a-really-big-deal.
201 Jenna Goodward & Mariana Gonzalez, Bottom Line on Renewable Energy Tax Credits, World Resources Institute (Oct. 2010), http://www.wri.org/publication/bottom-line-renewable-energy-tax-credits.
202 Fred Lambert, Dutch government is discussing the possibility to only allow electric vehicle sales starting in 2025, Electrek (Mar. 31, 2016), https://electrek.co/2016/03/31/netherlands-ev-sales-2025/.
203 Fred Lambert, The Netherlands' ban on gas-powered cars 'likely to become law', all new cars electric by 2025, Electrek (Aug. 14, 2016),https://electrek.co/2016/08/14/netherlands-ban-gas-powered-cars-likely-law-all-new-cars-electric-2025/.
204 Fred Lambert, The Netherlands' ban on gas-powered cars 'likely to become law', all new cars electric by 2025, Electrek (Aug. 14, 2016).
205 Jess Staufenberg, Norway to 'completely ban petrol powered cars by 2025', Independent (June 4, 2016), http://www.independent.co.uk/environment/climate-change/norway-to-ban-the-sale-of-all-fossil-fuel-based-cars-by-2025-and-replace-with-electric-vehicles-a7065616.html.
206 David Z. Morris, Norway Moves Towards Banning Gas-Burning Cars by 2025, Fortune (June 4, 2016, 12:14 PM), http://fortune.com/2016/06/04/norway-banning-gas-cars-2025/.
207 Craig Morris, Norway Will Not Ban Gas & Diesel Car Sales, Clean Technica (June 9, 2016), https://cleantechnica.com/2016/06/09/norway-will-not-ban-gas-diesel-car-sales/.
208 Lawrence H. Goulder & Andrew R. Schein, Carbon Taxes Versus Cap and Trade: A Critical Review, 4 Climate Change Econ. 1350010-1, 13500-2 (2013).
209 Lawrence H. Goulder & Andrew R. Schein, Carbon Taxes Versus Cap and Trade: A Critical Review, 4 Climate Change Econ. 1350010-1, 13500-4 (2013).
210 Lawrence H. Goulder & Andrew R. Schein, Carbon Taxes Versus Cap and Trade: A Critical Review, 4 Climate Change Econ. 1350010-1, 13500-4 n.6 (2013).

HANDBOOK ON CARBON PRICING INSTRUMENTS | 54
211 Noah Kaufman, Michael Obeiter, & Eleanor Krause, Putting a Price on Carbon: Reducing Emissions, Issue
Brief, World Resources Institute 17. 212 Welcome to the Alberta Carbon Registries, CSA Group,
http://www.csaregistries.ca/albertacarbonregistries/home.cfm. 213 Welcome to the Alberta Carbon Registries, CSA Group. 214 Peter Sopher & Anthony Mansall, The World’s Carbon Markets: A Case Study Guide to Emissions Trading,
EDF & IETA (May 2013), http://www.edf.org/sites/default/files/EDF_IETA_Alberta_Case_Study_May_2013.pdf.
215 Peter Sopher & Anthony Mansall, The World’s Carbon Markets: A Case Study Guide to Emissions Trading, EDF & IETA (May 2013).
216 Peter Sopher & Anthony Mansall, The World’s Carbon Markets: A Case Study Guide to Emissions Trading, EDF & IETA (May 2013).
217 Peter Sopher & Anthony Mansall, The World’s Carbon Markets: A Case Study Guide to Emissions Trading, EDF & IETA (May 2013).
218 Peter Sopher & Anthony Mansall, The World’s Carbon Markets: A Case Study Guide to Emissions Trading, EDF & IETA (May 2013).
219 Mike Szabo, Alberta renews, updated CO2 levy but warns economy-wide scheme could replace, Carbon Pulse (June 25, 2015, 19:00), http://carbon-pulse.com/5491/.
220 Mike Szabo, Alberta renews, updated CO2 levy but warns economy-wide scheme could replace, Carbon Pulse (June 25, 2015, 19:00).
221 Assembly Bill 32 Overview, Cal. Envtl. Protection Agency (“EPA”) Air Resources Board (Aug. 5, 2014), http://www.arb.ca.gov/cc/ab32/ab32.htm.
222 G. Miller & Scott Spoolman, Envtl. Science: Problems, Connections and Solutions, Cengage Learning 374 (Sept. 28, 2007).
223 Assembly Bill 32 Overview, Cal. EPA Air Resources Board (Aug. 5, 2014). 224 Cap-and-Trade Program, Cal. EPA Air Resources Board (June 17, 2016),
http://www.arb.ca.gov/cc/capandtrade/capandtrade.htm. 225 Cap-and-Trade Program, Cal. EPA Air Resources Board (June 17, 2016). 226 USA-California Cap-and-Trade Program, International Carbon Action Partnership (“ICAP”) 1 (Apr. 12,
2016), https://icapcarbonaction.com/en/?option=com_etsmap&task=export&format=pdf&layout=list&systems[]=45.
227 USA-California Cap-and-Trade Program, ICAP 1 (Apr. 12, 2016). 228 USA-California Cap-and-Trade Program, ICAP 1 (Apr. 12, 2016). 229 USA-California Cap-and-Trade Program, ICAP 1 (Apr. 12, 2016). 230 USA-California Cap-and-Trade Program, ICAP 1 (Apr. 12, 2016). 231 USA-California Cap-and-Trade Program, ICAP 1 (Apr. 12, 2016). 232 California’s Climate Plan, Cal. EPA Air Resources Board,
http://www.arb.ca.gov/cc/cleanenergy/clean_fs2.htm. 233 USA-California Cap-and-Trade Program, ICAP 2 (Apr. 12, 2016). 234 USA-California Cap-and-Trade Program, ICAP 2-3 (Apr. 12, 2016). 235 USA-California Cap-and-Trade Program, ICAP 3 (Apr. 12, 2016). 236 USA-California Cap-and-Trade Program, ICAP 3 (Apr. 12, 2016). 237 USA-California Cap-and-Trade Program, ICAP 3 (Apr. 12, 2016). 238 USA-California Cap-and-Trade Program, ICAP 3 (Apr. 12, 2016). 239 USA-California Cap-and-Trade Program, ICAP 3 (Apr. 12, 2016). 240 SB-775 California Global Warming Solutions Act of 2006: market-based compliance mechanisms, California Legislative Information (May 2017), https://leginfo.legislature.ca.gov/faces/billTextClient.xhtml?bill_id=201720180SB775 241 ICAP, Canada – Québec Cap-and-Trade System (Sept. 26, 2016),
https://icapcarbonaction.com/en/?option=com_etsmap&task=export&format=pdf&layout=list&systems[]=73 242 ICAP, ETS Map, https://icapcarbonaction.com/en/ets-map. 243 Lara Dahan et. al., Québec : An Emissions Trading Case Study, EDF, CDC Climat Research, & IETA (Apr.
2015), http://www.ieta.org/resources/Resources/Case_Studies_Worlds_Carbon_Markets/quebec_case_study-may2015.pdf.
244 Lara Dahan et. al., Québec : An Emissions Trading Case Study, EDF, CDC Climat Research, & IETA (Apr. 2015).
245 State and Trends of Carbon Pricing, World Bank Group & Ecofys 40 (Sept. 2015).
HANDBOOK ON CARBON PRICING INSTRUMENTS | 55
246 Lara Dahan et. al., Québec : An Emissions Trading Case Study, EDF, CDC Climat Research, & IETA (Apr.
2015). 247 Lara Dahan et. al., Québec : An Emissions Trading Case Study, EDF, CDC Climat Research, & IETA (Apr.
2015). 248 Lara Dahan et. al., Québec : An Emissions Trading Case Study, EDF, CDC Climat Research, & IETA (Apr.
2015). 249 Lara Dahan et. al., Québec : An Emissions Trading Case Study, EDF, CDC Climat Research, & IETA (Apr.
2015). 250 Lara Dahan et. al., Québec : An Emissions Trading Case Study, EDF, CDC Climat Research, & IETA (Apr.
2015). 251 Lara Dahan et. al., Québec : An Emissions Trading Case Study, EDF, CDC Climat Research, & IETA (Apr.
2015). 252 Lara Dahan et. al., Québec : An Emissions Trading Case Study, EDF, CDC Climat Research, & IETA (Apr.
2015). 253 Lara Dahan et. al., Québec : An Emissions Trading Case Study, EDF, CDC Climat Research, & IETA (Apr.
2015). 254 Lara Dahan et. al., Québec : An Emissions Trading Case Study, EDF, CDC Climat Research, & IETA (Apr.
2015). 255 State and Trends of Carbon Pricing, World Bank Group & Ecofys (Sept. 2015). 256 Stephen Zhao, Chinese Carbon Trading Pilots – Progress and Current Status, China Perspectives,
http://globalsummitryproject.com.s197331.gridserver.com/chinaperspectives/research-memos/chinese-carbon-trading-pilots-progress-and-current-status/.
257 Stephen Zhao, Chinese Carbon Trading Pilots – Progress and Current Status 2. 258 Stephen Zhao, Chinese Carbon Trading Pilots – Progress and Current Status 2. 259 China Emissions Trading Schemes, Extract from World Bank Report 2014, IAMC,
http://www.industrialairmonitoring.com/wp-content/uploads/2014/06/Factsheet-IAMC-ET-FS-06.pdf. 260 State and Trend of Carbon Pricing, World Bank Group & Ecofys 65 (May 2014), http://www-
wds.worldbank.org/external/default/WDSContentServer/WDSP/IB/2015/06/01/090224b0828bcd9e/1_0/Rendered/PDF/State0and0trends0of0carbon0pricing02014.pdf.
261 State and Trends of Carbon Pricing, World Bank Group & Ecofys 65 (May 2014). 262 State and Trends of Carbon Pricing, World Bank Group & Ecofys 65 (May 2014). 263 State and Trends of Carbon Pricing, World Bank Group & Ecofys 65 (May 2014). 264 State and Trends of Carbon Pricing, World Bank Group & Ecofys 65 (May 2014). 265 State and Trends of Carbon Pricing, World Bank Group & Ecofys 65 (May 2014). 266 State and Trends of Carbon Pricing, World Bank Group & Ecofys 65 (May 2014). 267 State and Trends of Carbon Pricing, World Bank Group & Ecofys 65 (May 2014). 268 State and Trends of Carbon Pricing, World Bank Group & Ecofys 65 (May 2014). 269 State and Trends of Carbon Pricing, World Bank Group & Ecofys 65 (May 2014). 270 State and Trends of Carbon Pricing, World Bank Group & Ecofys 65 (May 2014). 271 State and Trends of Carbon Pricing, World Bank Group & Ecofys 65 (May 2014). 272 State and Trends of Carbon Pricing, World Bank Group & Ecofys 65 (May 2014). 273 State and Trends of Carbon Pricing, World Bank Group & Ecofys 65 (May 2014). 274 State and Trends of Carbon Pricing, World Bank Group & Ecofys 65 (May 2014). 275 China - Chongqing pilot system, ICAP (Sept. 26, 2016),
https://icapcarbonaction.com/en/?option=com_etsmap&task=export&format=pdf&layout=list&systems%5B%5D=56.
276 Jeff Swartz, China’s National Emissions Trading System, Global Economic Policy & Institutions vii, ICTSD Issue Paper No. 6 (Mar. 2016), http://www.ieta.org/resources/China/Chinas_National_ETS_Implications_for_Carbon_Markets_and_Trade_ICTSD_March2016_Jeff_Swartz.pdf.
277 Office of the Press Secretary, U.S-China Joint Presidential Statement on Climate Change, The White House (Sept. 25, 2015), https://www.whitehouse.gov/the-press-office/2015/09/25/us-china-joint-presidential-statement-climate-change; China finalises allowance allocation plan for world’s biggest carbon market, Carbon Pulse (Oct. 20, 2016, 5:52 PM), http://carbon-pulse.com/25649/.
278 China’s Fujian eyes early ETS start, widens scope, Carbon Pulse (Oct. 10, 2016, 12:54 PM), http://carbon-pulse.com/25165/.

HANDBOOK ON CARBON PRICING INSTRUMENTS | 56
279Zhu Liu, China’s Carbon Emissions Report 2015, Harvard Kennedy School Belfer Center 3 (May 2015),
http://belfercenter.ksg.harvard.edu/files/carbon-emissions-report-2015-final.pdf. 280 China finalises allowance allocation plan for world’s biggest carbon market, Carbon Pulse (Oct. 20, 2016, 5:52
PM). 281 China finalises allowance allocation plan for world’s biggest carbon market, Carbon Pulse (Oct. 20, 2016, 5:52
PM). 282 Jeff Swartz, China’s National Emissions Trading System, Global Economic Policy & Institutions 17, ICTSD
Issue Paper No. 6, (Mar. 2016). 283 China expects initial ETS carbon price in $5-15 range –official, Carbon Pulse (Oct. 25, 2016), https://carbon-
pulse.com/25867/. 284 China expects initial ETS carbon price in $5-15 range –official, Carbon Pulse (Oct. 25, 2016). 285 China’s Fujian eyes early ETS start, widens scope, Carbon Pulse (Oct. 10, 2016, 12:54 PM). 286 China’s Fujian eyes early ETS start, widens scope, Carbon Pulse (Oct. 10, 2016, 12:54 PM). 287 Jeff Swartz, China’s National Emissions Trading System, Global Economic Policy & Institutions vii, ICTSD
Issue Paper No. 6, (Mar. 2016). 288 Jeff Swartz, China’s National Emissions Trading System, Global Economic Policy & Institutions 18, ICTSD
Issue Paper No. 6, (Mar. 2016). 289 Jeff Swartz, China’s National Emissions Trading System, Global Economic Policy & Institutions 18, ICTSD
Issue Paper No. 6, (Mar. 2016). 290 Welcome, Regional Greenhouse Gas Initiative, https://www.rggi.org/. 291 Peter Sopher, Anthony Mansell, & Clayton Munnings, Regional Greenhouse Gas Initiative, The World's
Carbon Markets: A Case Study Guide to Emissions Trading, EDF & IETA (Mar. 2014), https://www.edf.org/sites/default/files/RGGI-Case-Study-March-2014.pdf.
292 Peter Sopher, Anthony Mansell, & Clayton Munnings, Regional Greenhouse Gas Initiative, The World's Carbon Markets: A Case Study Guide to Emissions Trading, EDF & IETA (Mar. 2014)
293 Peter Sopher, Anthony Mansell, & Clayton Munnings, Regional Greenhouse Gas Initiative, The World's Carbon Markets: A Case Study Guide to Emissions Trading, EDF & IETA (Mar. 2014)
294 Peter Sopher, Anthony Mansell, & Clayton Munnings, Regional Greenhouse Gas Initiative, The World's Carbon Markets: A Case Study Guide to Emissions Trading, EDF & IETA (Mar. 2014)f
295 Second Amendment to the Memorandum of Understanding, Regional Greenhouse Gas Initiative (2007), http://rggi.org/docs/mou_second_amend.pdf.
296 Christopher Baxter, Gov. Christie Announces N.J. Pulling Out of Regional Environmental Initiative, NJ Star-Ledger (May 28, 2011, 4:24 PM), http://www.nj.com/politics/index.ssf/2011/05/gov_christie_to_announce_nj_pu.html.
297 Model Rule, Regional Greenhouse Gas Initiative (Aug. 15, 2006), http://www.rggi.org/docs/Model%20Rule%20Corrected%208.15.06.pdf (Published by RGGI in 2006, Corrected in 2007 and Revised in 2008).
298 See Program Design, Regional Greenhouse Gas Initiative, www.rggi.org/design. 299 See Program Design, Regional Greenhouse Gas Initiative. 300 See Program Design, Regional Greenhouse Gas Initiative. 301 See Model Rule, Regional Greenhouse Gas Initiative (2012),
http://rggi.org/docs/ProgramReview/_FinalProgramReviewMaterials/Model_Rule_FINAL.pdf. 302 RGGI States Propose Lowering Regional CO2 Emissions Cap 45%, Implementing a More Flexible Cost-
Control Mechanism, RGGI Inc. (Feb. 2013), http://www.rggi.org/docs/PressReleases/PR130207_ModelRule.pdf.
303 Peter Sopher, Anthony Mansell, & Clayton Munnings, Regional Greenhouse Gas Initiative, The World's Carbon Markets: A Case Study Guide to Emissions Trading, EDF & IETA (Mar. 2014).
304 Peter Sopher, Anthony Mansell, & Clayton Munnings, Regional Greenhouse Gas Initiative, The World's Carbon Markets: A Case Study Guide to Emissions Trading, EDF & IETA (Mar. 2014).
305 Peter Sopher, Anthony Mansell, & Clayton Munnings, Regional Greenhouse Gas Initiative, The World's Carbon Markets: A Case Study Guide to Emissions Trading, EDF & IETA (Mar. 2014).
306 Peter Sopher, Anthony Mansell, & Clayton Munnings, Regional Greenhouse Gas Initiative, The World's Carbon Markets: A Case Study Guide to Emissions Trading, EDF & IETA (Mar. 2014).
307 Peter Sopher, Anthony Mansell, & Clayton Munnings, Regional Greenhouse Gas Initiative, The World's Carbon Markets: A Case Study Guide to Emissions Trading, EDF & IETA (Mar. 2014).
308 Peter Sopher, Anthony Mansell, & Clayton Munnings, Regional Greenhouse Gas Initiative, The World's Carbon Markets: A Case Study Guide to Emissions Trading, EDF & IETA (Mar. 2014).
HANDBOOK ON CARBON PRICING INSTRUMENTS | 57
309 Peter Sopher, Anthony Mansell, & Clayton Munnings, Regional Greenhouse Gas Initiative, The World's
Carbon Markets: A Case Study Guide to Emissions Trading, EDF & IETA (Mar. 2014). 310 Alexander Eden et. al., Benefits of Emissions Trading, ICAP 4 (July 2016). 311 Alexander Eden et. al., Benefits of Emissions Trading, ICAP 5 (July 2016). 312 State and Trends of Carbon Pricing, World Bank Group & Ecofys 63 (May 2014), http://www-
wds.worldbank.org/external/default/WDSContentServer/WDSP/IB/2015/06/01/090224b0828bcd9e/1_0/Rendered/PDF/State0and0trends0of0carbon0pricing02014.pdf.
313 State and Trends of Carbon Pricing, World Bank Group & Ecofys 63 (May 2014). 314 State and Trends of Carbon Pricing, World Bank Group & Ecofys 63 (May 2014). 315 State and Trends of Carbon Pricing, World Bank Group & Ecofys 63 (May 2014). 316 State and Trends of Carbon Pricing, World Bank Group & Ecofys 63 (May 2014). 317 Japan – Tokyo Cap-and-Trade Program, International Carbon Action Partnership (“ICAP”) 1 (Apr. 12, 2016),
https://icapcarbonaction.com/en/?option=com_etsmap&task=export&format=pdf&layout=list&systems[]=51. 318 Japan – Tokyo Cap-and-Trade Program, ICAP 1 (Apr. 12, 2016). 319 Japan – Tokyo Cap-and-Trade Program, ICAP 1 (Apr. 12, 2016). 320 Japan – Tokyo Cap-and-Trade Program, ICAP 1 (Apr. 12, 2016). 321 Japan – Saitama Target Setting Emissions Trading System, International Carbon Action Partnership
(“ICAP”) 1 (Apr. 12, 2016) https://icapcarbonaction.com/en/?option=com_etsmap&task=export&format=pdf&layout=list&systems[]=84.
322 Japan – Saitama Target Setting Emissions Trading System, ICAP 1 (Apr. 12, 2016). 323 State and Trends of Carbon Pricing, World Bank Group & Ecofys 63 (May 2014). 324 Tokyo Cap-and-Trade Program: Japan’s first mandatory emissions trading scheme, Tokyo Metropolitan Gov’t
Bureau of the Env’t 24 (Mar. 2010), https://www.kankyo.metro.tokyo.jp/en/attachement/Tokyo-cap_and_trade_program-march_2010_TMG.pdf.
325 State and Trends of Carbon Pricing, World Bank Group & Ecofys 63 (May 2014). 326 State and Trends of Carbon Pricing, World Bank Group & Ecofys 63 (May 2014). 327 State and Trends of Carbon Pricing, World Bank Group & Ecofys 63 (May 2014). 328 Korea Emissions Trading Scheme, International Carbon Action Partnership (“ICAP”) 1 (Apr. 12, 2016),
https://icapcarbonaction.com/en/?option=com_etsmap&task=export&format=pdf&layout=list&systems[]=47. 329 Korea Emissions Trading Scheme, ICAP 1 (Apr. 12, 2016). 330 Korea Emissions Trading Scheme, ICAP 1 (Apr. 12, 2016). 331 Korea Emissions Trading Scheme, ICAP 1 (Apr. 12, 2016). 332 Korea Emissions Trading Scheme, ICAP 1 (Apr. 12, 2016). 333 Korea Emissions Trading Scheme, ICAP 1 (Apr. 12, 2016). 334 Korea Emissions Trading Scheme, ICAP 1 (Apr. 12, 2016). 335 State and Trends of Carbon Pricing, World Bank Group & Ecofys 45 (Sept. 2015). 336 World Bank, Putting a Price on Carbon with a Tax 3,
http://www.worldbank.org/content/dam/Worldbank/document/SDN/background-note_carbon-tax.pdf. 337 Eddy Waty, Is Mexico the Emerging Leader of Latin America in Post-Carbon Politics?, 8 Pepperdine Policy
Review 1, 3 (2015), http://digitalcommons.pepperdine.edu/ppr/vol8/iss1/6. 338 State and Trends of Carbon Pricing, World Bank Group & Ecofys 45 (Sept. 2015). 339 World Bank, Putting a Price on Carbon with a Tax 3. 340 World Bank, Putting a Price on Carbon with a Tax 3. 341 Dep’t of Nat’l Treasury, Republic of S. Afr., Carbon Tax Policy Paper: Reducing Greenhouse Gas Emissions
and Facilitating the Transition to a Green Economy (May 2013), http://www.treasury.gov.za/public%20comments/Carbon%20Tax%20Policy%20Paper%202013.pdf.
342 Republic of S. Afr., Draft Carbon Tax Bill (As Introduced in the National Assembly (proposed section 77)), http://www.treasury.gov.za/public%20comments/CarbonTaxBill2015/Carbon%20Tax%20Bill%20final%20for%20release%20for%20comment.pdf.
343 Mike Szabo, South African Government to Revise Carbon Tax Bill Following Consultation, Carbon Pulse (Feb. 25, 2016, 10:28 PM), http://carbon-pulse.com/16167/.
344 Ben Garside, South Africa Proposes Wide Exemptions for Carbon Tax, Leaves Start Date Open, Carbon Pulse (Nov. 2, 2015, 7:04 PM), http://carbon-pulse.com/11354/.
345 Press Release, Deloitte, Draft Carbon Tax Bill Released: South Africa Moves to Reduce Greenhouse Gas Emissions, http://www2.deloitte.com/za/en/footerlinks/pressreleasespage/carbon-tax-bill.html.
346 Republic of S. Afr., Treasury Publishes Draft Carbon Tax Bill for Public Comment (Nov. 2, 2015), http://www.gov.za/speeches/treasury-publishes-draft-carbon-tax-bill-public-comment-2-nov-2015-0000.

HANDBOOK ON CARBON PRICING INSTRUMENTS | 58
347 Republic of S. Afr., Treasury Publishes Draft Carbon Tax Bill for Public Comment (Nov. 2, 2015),
http://www.gov.za/speeches/treasury-publishes-draft-carbon-tax-bill-public-comment-2-nov-2015-0000. 348 Ministry of Finance, Province of B.C., Myths and Facts About the Carbon Tax,
http://www.fin.gov.bc.ca/tbs/tp/climate/A6.htm. 349 Carbon Tax Act, S.C. 2008, c 40 (Can.), sched. 2,
http://www.bclaws.ca/Recon/document/ID/freeside/00_08040_01. 350 Ministry of Finance, B.C., Budget and Fiscal Plan 2010/11-2012/13, at 105 (Mar. 2, 2010),
http://www.bcbudget.gov.bc.ca/2010/bfp/2010_Budget_Fiscal_Plan.pdf#tax. 351 P.F., British Columbia’s Carbon Tax: The Evidence Mounts, The Economist (July 31, 2014, 12:55 PM),
http://www.economist.com/blogs/americasview/2014/07/british-columbias-carbon-tax. 352 Stewart Elgie & Jessica McClay, BC’s Carbon Tax Shift After Five Years: Results, An Environmental (and
Economic) Success Story 6 (2013), http://www.energyindependentvt.org/wp-content/uploads/2014/11/BC_Carbon-Tax-success-story.pdf.
353 Annegrete Bruvoll & Bodil Merethe Larsen, Greenhouse Gas Emissions – Do Carbon Taxes Work?, at 5 (2004), http://econweb.ucsd.edu/~carsonvs/papers/632.pdf.
354 Severin Carrell, Norway to Double Carbon Tax Oil on Industry, The Guardian (Oct. 11, 2012, 8:52 AM), https://www.theguardian.com/environment/2012/oct/11/norway-carbon-tax-oil?intcmp=122.
355 Annegrete Bruvoll & Hanne Marit Dalen, Pricing of CO2 Emissions in Norway: Documentation of Data and Methods Used in Estimations of Average CO2 Tax Rates in Norwegian Sectors in 2006 at 10, Statistics Norway (2009), https://www.ssb.no/a/english/publikasjoner/pdf/doc_200916_en/doc_200916_en.pdf.
356 UNFCCC, Report of the Centralized In-Depth Review of the Fourth National Communication of Norway 6 (2006), https://unfccc.int/files/kyoto_protocol/compliance/plenary/application/pdf/cc-ert-2006-8_report_of_centralized_idr_of_nc4_of_norway.pdf.
357 Press Release, Ministry of the Environment, Government of Nor., The Government Is Following Up on the Climate Agreement (Oct. 8, 2012), https://www.regjeringen.no/en/aktuelt/the-government-is-following-up-on-the-cl/id704137/.
358 UNFCCC, Report of the Centralized In-Depth Review of the Fourth National Communication of Norway 6 (2006), https://unfccc.int/files/kyoto_protocol/compliance/plenary/application/pdf/cc-ert-2006-8_report_of_centralized_idr_of_nc4_of_norway.pdf.
359 Michael M. Hoel, Should a carbon tax be differentiated across sectors?, 59 J. Pub. Econ. 17-32 (1996). 360 Annegrete Bruvoll & Bodil Merethe Larsen, Greenhouse Gas Emissions – Do Carbon Taxes Work? (2004),
http://econweb.ucsd.edu/~carsonvs/papers/632.pdf. 361 Unpopular but tenacious: A guide to the UK carbon price floor, Carbon Brief (Nov. 19, 2013, 12:15 PM),
http://www.carbonbrief.org/unpopular-but-tenacious-a-guide-to-the-uk-carbon-price-floor. 362 Mike Szabo, UK Treasury mulling next move for divisive carbon price floor, Carbon Pulse (Jan. 25, 2016, 6:14
PM), http://carbon-pulse.com/14664/. 363 Emily Gosden, Osborne expected to freeze controversial carbon tax in Budget, The Telegraph (Mar. 16, 2014,
10:45 PM GMT), http://www.telegraph.co.uk/finance/newsbysector/energy/10701886/Osborne-expected-to-freeze-controversial-carbon-tax-in-Budget.html; Unpopular but tenacious: A guide to the UK carbon price floor, Carbon Brief (Nov. 19, 2013, 12:15 PM).
364 Carbon Tax Goes Into Effect in France, Sustainable Business (May 6, 2014, 4:47 PM), http://www.sustainablebusiness.com/index.cfm/go/news.display/id/25694.
365 France introduces carbon tax as of 1 April 2014, Enerdata (Apr. 2, 2014), http://www.enerdata.net/enerdatauk/press-and-publication/energy-news-001/france-introduces-carbon-tax-1-april-2014_26983.html.
366 Tara Patel, France Passes New Energy Law Quadruples Carbon Price, Bloomberg (July 23, 2015, 7:25 AM EDT), http://www.bloomberg.com/news/articles/2015-07-23/france-passes-new-energy-law-quadruples-carbon-price.
367 Tara Patel, France Passes New Energy Law Quadruples Carbon Price, Bloomberg (July 23, 2015, 7:25 AM EDT).
368 Anand Upadhyay, India Doubles Coal Tax, Yet Again, Clean Technica (Mar. 3, 2015), http://cleantechnica.com/2015/03/03/india-doubles-coal-tax-yet/.
369 Clean Energy Cess - Carbon Tax of India, Arthapedia (Apr. 19, 2016), http://www.arthapedia.in/index.php?title=Clean_Energy_Cess_-_Carbon_Tax_of_India (note that this source appears open source but is in fact edited by Indian government economists).
370 Damandeep Singh, India Commits to Low-Carbon Development by Imposing Coal, Revolt (Apr. 1, 2010), http://blogs.worldwatch.org/revolt/india-coal-tax/.

HANDBOOK ON CARBON PRICING INSTRUMENTS | 59
371 Clean Energy Cess Rules, 2010, Notification No. 06/2010-Clean Energy Cess (June 22, 2010), as amended by
Notification No. 07/2010-Clean Energy Cess (Sept. 8, 2010), Notification No. 01/2012-Clean Energy Cess (Mar. 17, 2012), http://www.cbec.gov.in/resources//htdocs-cbec/excise/cxrules/cx-cec-rules2010.pdf;jsessionid=CBE96B97FA728733AC3C4CD296386BD2.
372 From Carbon Subsidy to Carbon Tax: India's Green Actions, Economic Survey 2014-15, http://indiabudget.nic.in/es2014-15/echapvol1-09.pdf.
373 Aligning Policies for a Low-carbon Economy, OECD Publishing 28, OECD/IEA/NEA/ITF (2015), https://www.oecd.org/environment/Aligning-Policies-for-a-Low-carbon-Economy.pdf.
374 Aligning Policies for a Low-carbon Economy, OECD Publishing 29, OECD/IEA/NEA/ITF (2015).

Founded and chaired by former US Vice President and Nobel Laureate Al Gore, The Climate Reality Project is dedicated to catalyzing a global solution to the climate crisis by making urgent action a necessity across every level of society.
Today, climate change is standing in the way of a healthy tomorrow for all of us. But we know that practical solutions are right in front of us. We can create a healthy, sustainable, and prosperous future by making a planet-wide shift from dirty fossil fuels to clean, reliable, and affordable renewable energy. At Climate Reality, we combine digital media initiatives, global organizing events, and peer-to-peer outreach programs to share this good news with citizens everywhere and build overwhelming popular support for policies that accelerate the global transition to a clean energy economy.
climaterealityproject.org
ABOUT THE CLIMATE REALITY PROJECT