Embed Size (px)
Citation preview
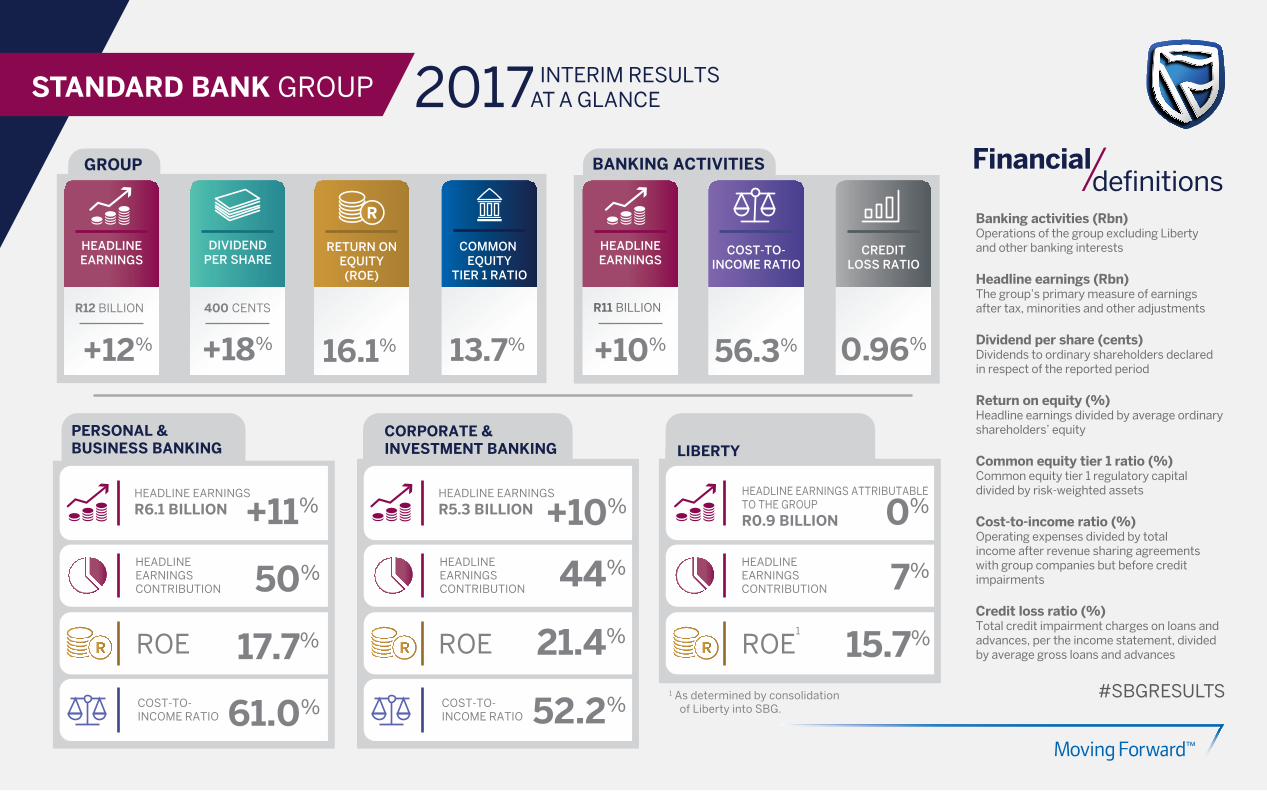
INTERIM RESULTS AT A GLANCE
LIBERTYCORPORATE & INVESTMENT BANKING
BANKING ACTIVITIES
STANDARD BANK GROUP 2017
HEADLINEEARNINGS
HEADLINEEARNINGS
R12 BILLION
+12%
DIVIDENDPER SHARE
RETURN ONEQUITY(ROE)
COMMON EQUITY
TIER 1 RATIO
13.7%16.1%+18%
400 CENTS
GROUP
0.96%56.3%+10%
CREDITLOSS RATIO
COST-TO-INCOME RATIO
R11 BILLION
HEADLINE EARNINGS
R6.1 BILLION
HEADLINE EARNINGSCONTRIBUTION
COST-TO-INCOME RATIO
+11%
50%
61.0%
17.7%ROE
PERSONAL & BUSINESS BANKING
HEADLINE EARNINGS
R5.3 BILLION
HEADLINE EARNINGSCONTRIBUTION
COST-TO-INCOME RATIO
HEADLINE EARNINGS ATTRIBUTABLE TO THE GROUP
R0.9 BILLION
HEADLINE EARNINGSCONTRIBUTION
+10%
44%
52.2%
21.4%
0%
7%
15.7%
#SBGRESULTS
Financial definitions
Banking activities (Rbn)Operations of the group excluding Liberty and other banking interests
Headline earnings (Rbn)The group’s primary measure of earnings after tax, minorities and other adjustments Dividend per share (cents)Dividends to ordinary shareholders declared in respect of the reported period Return on equity (%)Headline earnings divided by average ordinary shareholders’ equity Common equity tier 1 ratio (%)Common equity tier 1 regulatory capital divided by risk-weighted assets Cost-to-income ratio (%)Operating expenses divided by totalincome after revenue sharing agreements with group companies but before credit impairments Credit loss ratio (%)Total credit impairment charges on loans and advances, per the income statement, divided by average gross loans and advancesROE ROE
1
1 As determined by consolidation of Liberty into SBG.
![From: STANDARD BANK Date ... Africa... · From: ibsupport@ [mailto:standardbank.co.za information@standardbank.co.za] Sent: 02 March 2015 11:48](https://img.pdfslide.net/doc/110x75/5eb7e7069e76e136bd6a0ef2/from-standard-bank-date-africa-from-ibsupport-mailtostandardbankcoza.jpg)


![Comercial _1º Semestre_ - Revisado [RBN]](https://img.pdfslide.net/doc/110x75/549110d8b47959763e8b51ee/comercial-1o-semestre-revisado-rbn.jpg)