Embed Size (px)
Citation preview

2017 Investor Presentation

Growth Outpacing a Growing Industry
$331
$741
'99 '00 '01 '02 '03 '04 '05 '06 '07 '08 '09 '10 '11 '12 '13 '14 '15
Food Away From Home
Note: U.S. Department of Commerce for Food Away from Home; Technomic for U.S. Foodservice Market Size; excluding alcohol.
CAGR 5.2%
$10.1 $10.6 $11.5 $12.8 $13.7 $15.3 $16.1
FY10 FY11 FY12 FY13 FY14 FY15 FY16
PFG Net Sales
$193 $220 $241 $271 $286 $329
$367
FY10 FY11 FY12 FY13 FY14 FY15 FY16
PFG Adjusted EBITDA(1)
CAGR 8.2%
CAGR 11.3%
$225 $228 $239 $247
$256 $268
'10 '11 '12 '13 '14 '15
CAGR 3.6%
1
U.S. Foodservice Market Size
$B
$B
$B
$MM
(1) For reconciliation of non-GAAP to GAAP measures see the Appendix.
Foodservice Industry Customer Verticals
2
Independent
Regional / National Chains
Retail / Hospitality
Education
Healthcare
Other
PFG Total
Independent
Regional / National Chains
Retail / Hospitality
Education
Healthcare
Other
Industry Total
Note: Technomic and company filings for Sysco, PFG, and US Foods. U.S. Sales only, where available; PFG estimates.
• Continue to improve mix of independents customers
• Focus on growth of Performance Brands
• Increase geographic scope and scale through acquisitions

U.S. Foodservice Industry Structure
2015 Market Size = ~ $268
Note: Technomic and company filings for Sysco, PFG, and US Foods. U.S. Sales only, where available; PFG estimates.
11-15,000+All Other
4-10Regional
Broadliners
Top 3SYY $43
USFD $23
PFG $16 $82
$23
$163
$B
3
PFG Overview
• Third largest foodservice distributor in the U.S. and a leading distributor to a wide variety of channels
• Operates primarily in three segments: − Performance Foodservice
− Vistar
− PFG Customized
2016 Net Sales = $16.1BN
Note: EBITDA percentages presented for segments exclude corporate overhead and other. 4
17%
26% 34%
23%
Performance Foodservice
Other Channels
Vistar PFG Customized
Performance Foodservice
Street
EBITDA Profit Margins
4.2%
3.2%
0.9%
Vistar
Performance Foodservice
PFG Customized
Others 69%
Sysco 16%
US Foods 9%
PFGC 6%

Note: Company filings. Definitions of Adj. EBITDA and items included as adjustments may differ between companies; all figures as reported.
Top 3 Distributors’ Growth Rates
5
90%100%110%120%130%140%150%160%170%
CY2010 CY2011 CY2012 CY2013 CY2014 CY2015 CY2016
158%
138%
122%
90%100%110%120%130%140%150%160%170%
CY2010 CY2011 CY2012 CY2013 CY2014 CY2015 CY2016
171%
128%
132%
Net Sales
Adjusted EBITDA

Performance Foodservice
6
• Customers First
• Improve Mix through Street and Brands
• Increase geographic scope and scale through acquisitions
Growth Strategy
$5.6 $6.1 $6.7 $7.5 $8.1 $9.1 $9.6
FY10 FY11 FY12 FY13 FY14 FY15 FY16
Net Sales
EBITDA
$146 $166 $178 $174 $208
$254 $307
FY10 FY11 FY12 FY13 FY14 FY15 FY16
CAGR 9.5%
CAGR 13.2%
Selected Customers
Note: PFG company reports
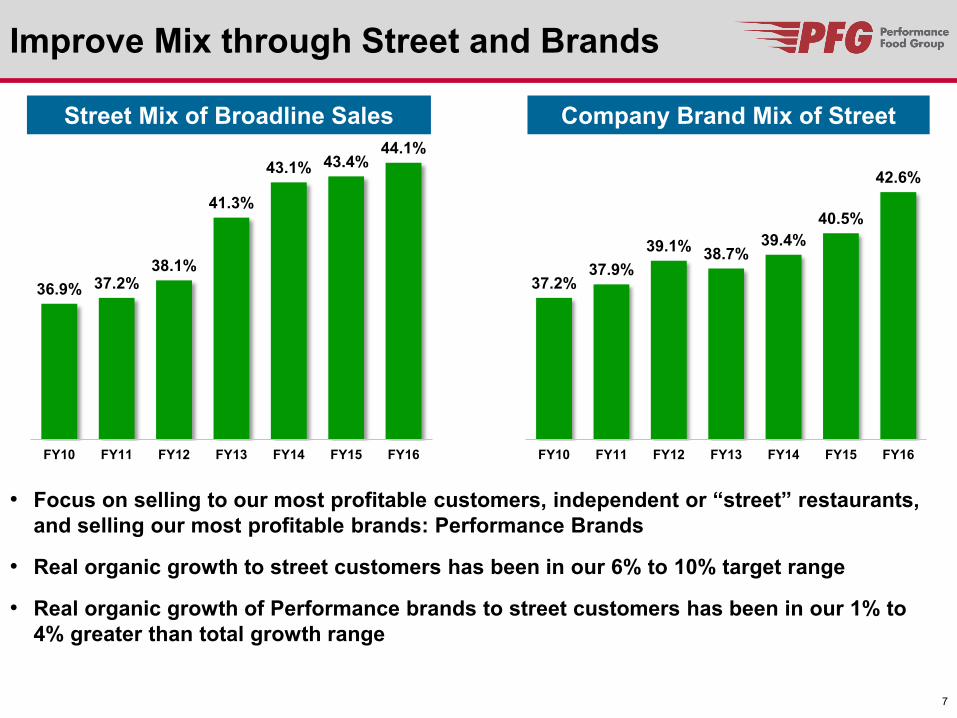
Improve Mix through Street and Brands
Street Mix of Broadline Sales
36.9% 37.2% 38.1%
41.3%
43.1% 43.4% 44.1%
FY10 FY11 FY12 FY13 FY14 FY15 FY16
37.2% 37.9%
39.1% 38.7% 39.4%
40.5%
42.6%
FY10 FY11 FY12 FY13 FY14 FY15 FY16
Company Brand Mix of Street
7
• Focus on selling to our most profitable customers, independent or “street” restaurants, and selling our most profitable brands: Performance Brands
• Real organic growth to street customers has been in our 6% to 10% target range
• Real organic growth of Performance brands to street customers has been in our 1% to 4% greater than total growth range

Performance Brands: a $2B+ Business • Proprietary brands are a key competitive advantage in the industry; growing
double-digit
• Only the largest players in the foodservice industry have the scale to carry a broad line of differentiated brands
• Chefs embrace PFG’s portfolio of Performance Brand SKUs and recognize the quality and specifications they bring to the table
Broadline Roma
Umbrella Brands – Tiered Strategy Strategic Brands
8
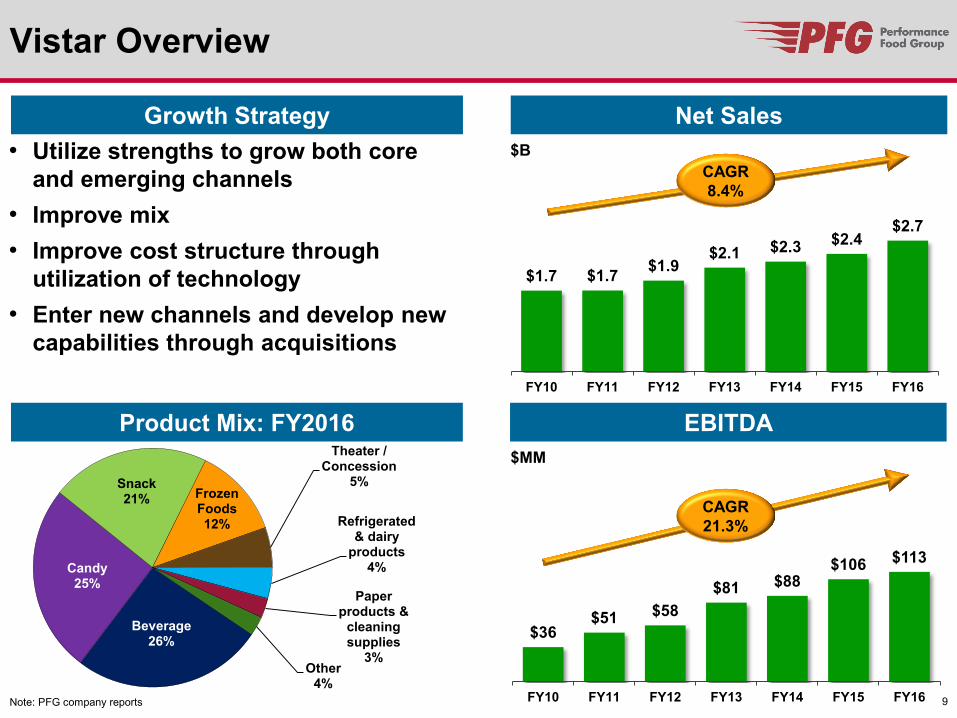
Vistar Overview
9
Growth Strategy
Product Mix: FY2016
Beverage 26%
Candy 25%
Snack 21% Frozen
Foods 12%
Theater / Concession
5%
Refrigerated & dairy
products 4%
Paper products &
cleaning supplies
3% Other
4%
• Utilize strengths to grow both core and emerging channels
• Improve mix • Improve cost structure through
utilization of technology • Enter new channels and develop new
capabilities through acquisitions
$1.7 $1.7 $1.9 $2.1 $2.3 $2.4
$2.7
FY10 FY11 FY12 FY13 FY14 FY15 FY16
Net Sales
$36 $51 $58
$81 $88 $106 $113
FY10 FY11 FY12 FY13 FY14 FY15 FY16
EBITDA
CAGR 8.4%
CAGR 21.3%
Note: PFG company reports
$B
$MM
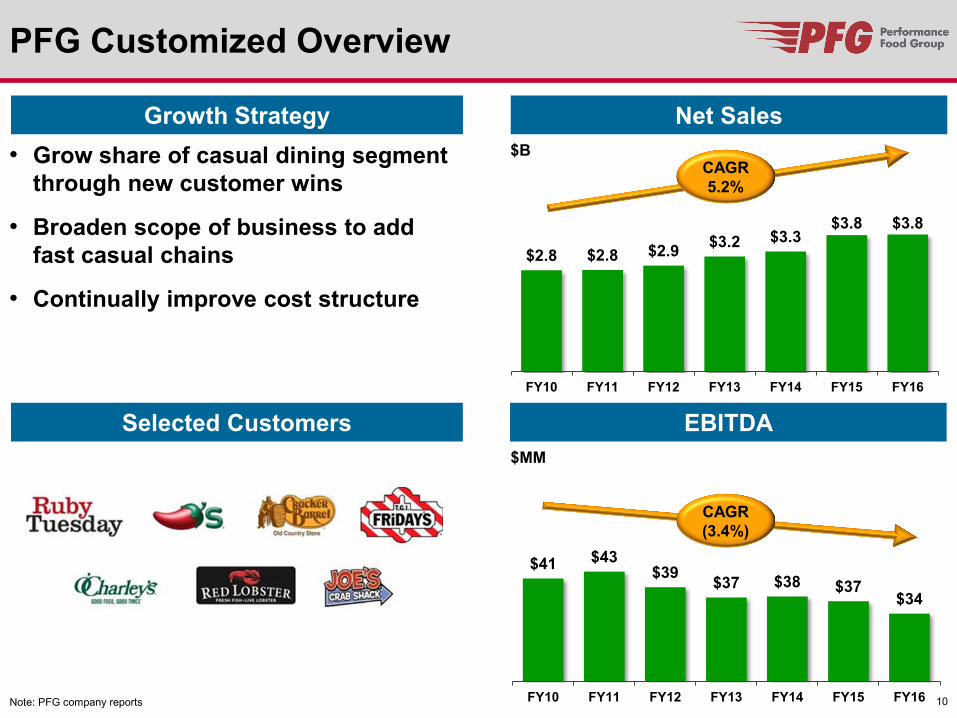
PFG Customized Overview
• Grow share of casual dining segment through new customer wins
• Broaden scope of business to add fast casual chains
• Continually improve cost structure
$2.8 $2.8 $2.9 $3.2 $3.3 $3.8 $3.8
FY10 FY11 FY12 FY13 FY14 FY15 FY16
$41 $43 $39 $37 $38 $37
$34
FY10 FY11 FY12 FY13 FY14 FY15 FY16
Growth Strategy
Selected Customers
Net Sales
EBITDA
CAGR 5.2%
CAGR (3.4%)
Note: PFG company reports
$B
$MM
10
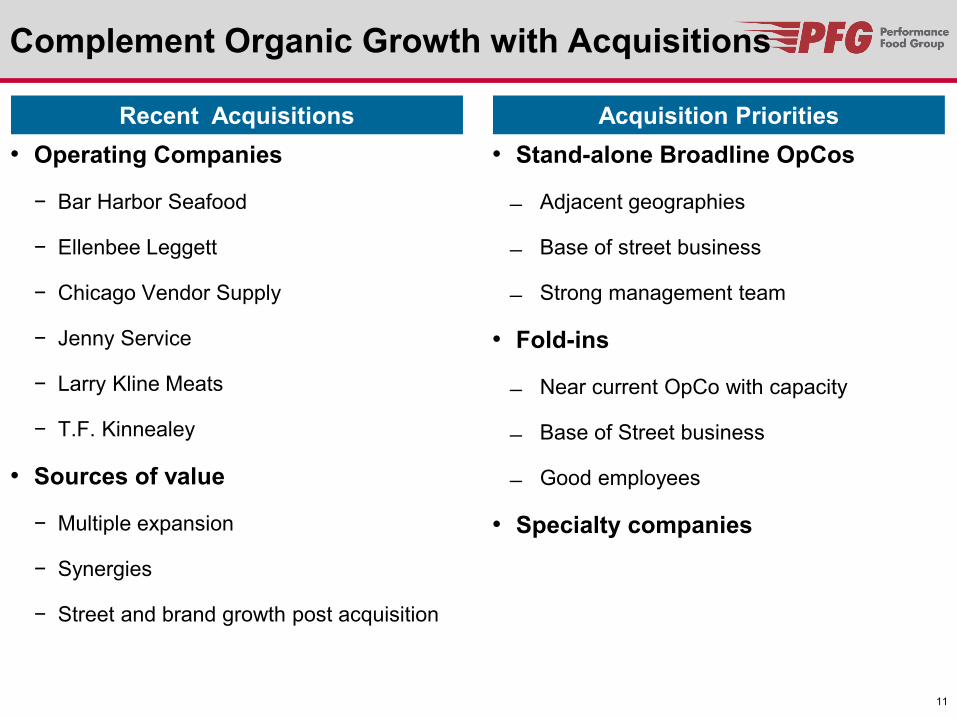
Complement Organic Growth with Acquisitions
• Operating Companies
− Bar Harbor Seafood
− Ellenbee Leggett
− Chicago Vendor Supply
− Jenny Service
− Larry Kline Meats
− T.F. Kinnealey
• Sources of value
− Multiple expansion
− Synergies
− Street and brand growth post acquisition
Recent Acquisitions • Stand-alone Broadline OpCos
Adjacent geographies
Base of street business
Strong management team
• Fold-ins
Near current OpCo with capacity
Base of Street business
Good employees
• Specialty companies
Acquisition Priorities
11
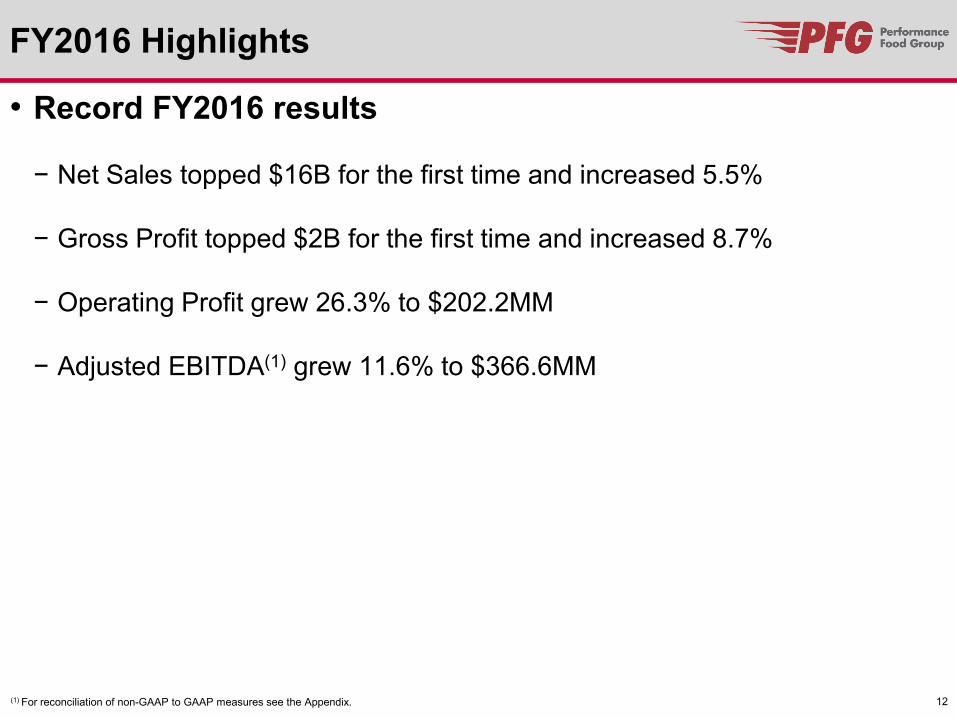
FY2016 Highlights
• Record FY2016 results
− Net Sales topped $16B for the first time and increased 5.5%
− Gross Profit topped $2B for the first time and increased 8.7%
− Operating Profit grew 26.3% to $202.2MM
− Adjusted EBITDA(1) grew 11.6% to $366.6MM
12 (1) For reconciliation of non-GAAP to GAAP measures see the Appendix.
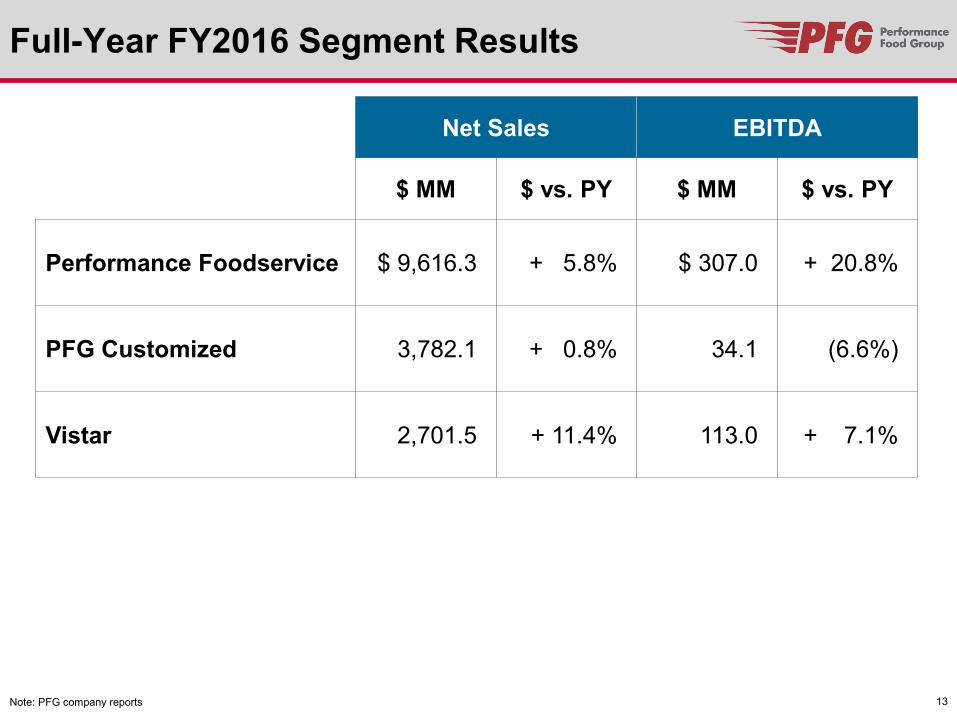
Full-Year FY2016 Segment Results
Net Sales EBITDA
$ MM $ vs. PY $ MM $ vs. PY
Performance Foodservice $ 9,616.3 + 5.8% $ 307.0 + 20.8%
PFG Customized 3,782.1 + 0.8% 34.1 (6.6%)
Vistar 2,701.5 + 11.4% 113.0 + 7.1%
Note: PFG company reports 13

FY2016 Cash Flow and Balance Sheet
• YTD Cash Flow highlights
− Operating Cash Flow of $234.9MM vs. $127.4MM PY
− CapEx of $119.7MM vs. $98.6MM PY
− Acquisitions of $39MM vs. $0.4MM PY
• Net Debt
− FY2015 year-end: $ 1,413.4MM
− FY2016 year-end: $ 1,134.6MM
− Improvement vs. PY: $ 278.8MM
14 Note: PFG company reports
Appendix
15

16
Non-GAAP Financial Measures This presentation and the accompanying financial statement tables include several financial measures that are not calculated in accordance with GAAP, including EBITDA, Adjusted EBITDA, and Adjusted Diluted Earnings per Share. Such measures are not recognized terms under GAAP, should not be considered in isolation or as a substitute for measures prepared in accordance with GAAP, and are not indicative of net income (loss) as determined under GAAP. EBITDA, Adjusted EBITDA, Adjusted Diluted Earnings per Share, and other non-GAAP financial measures have limitations that should be considered before using these measures to evaluate the Company’s liquidity or financial performance. EBITDA, Adjusted EBITDA, and Adjusted Diluted Earnings per Share, as presented, may not be comparable to similarly titled measures of other companies because of varying methods of calculation. Management measures operating performance based on PFG’s EBITDA, defined as net income (loss) before interest expense (net of interest income), income taxes, and depreciation and amortization. PFG believe that the presentation of EBITDA enhances an investor’s understanding of PFG’s performance. PFG believes this measure is a useful metric to assess PFG’s operating performance from period to period by excluding certain items that PFG believes are not representative of PFG’s core business. PFG uses this measure to evaluate the performance of its segments and for business planning purposes. In addition, management uses Adjusted EBITDA, defined as net income (loss) before interest expense (net of interest income), income and franchise taxes, and depreciation and amortization, further adjusted to exclude certain items we do not consider part of our core operating results. Such adjustments include certain unusual, non-cash, non-recurring, cost reduction, and other adjustment items permitted in calculating covenant compliance under the company’s credit and indenture agreements (other than certain pro forma adjustments permitted under our credit agreement and indenture relating to the Adjusted EBITDA contribution of acquired entities or businesses prior to the acquisition date). Under PFG’s credit agreement and indenture, the Company’s ability to engage in certain activities such as incurring certain additional indebtedness, making certain investments, and making restricted payments is tied to ratios based on Adjusted EBITDA (as defined in the credit agreement and indenture). Management also uses Adjusted Diluted Earnings per Share, which is calculated by adjusting the most directly comparable GAAP financial measure by excluding the same items excluded in PFG’s calculation of Adjusted EBITDA to the extent that each such item was included in the applicable GAAP financial measure. PFG believes that the presentation of Adjusted EBITDA and Adjusted Diluted Earnings per Share is useful to investors because these metrics are frequently used by securities analysts, investors, and other interested parties in their evaluation of the operating performance of companies in PFG’s industry.
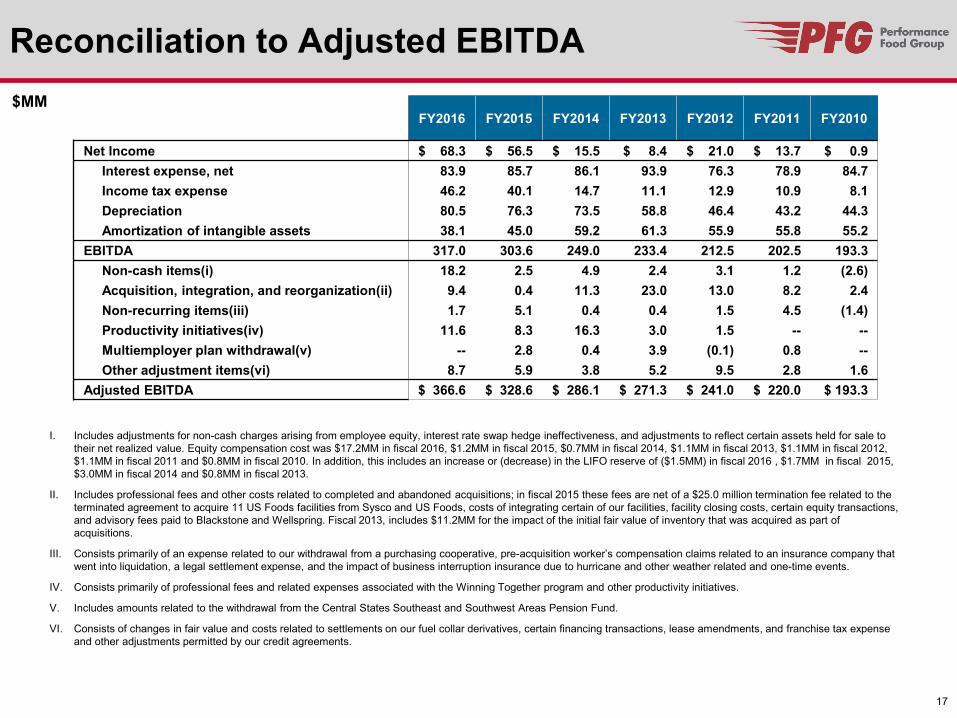
Reconciliation to Adjusted EBITDA $MM
FY2016 FY2015 FY2014 FY2013 FY2012 FY2011 FY2010
Net Income $ 68.3 $ 56.5 $ 15.5 $ 8.4 $ 21.0 $ 13.7 $ 0.9 Interest expense, net 83.9 85.7 86.1 93.9 76.3 78.9 84.7 Income tax expense 46.2 40.1 14.7 11.1 12.9 10.9 8.1 Depreciation 80.5 76.3 73.5 58.8 46.4 43.2 44.3 Amortization of intangible assets 38.1 45.0 59.2 61.3 55.9 55.8 55.2 EBITDA 317.0 303.6 249.0 233.4 212.5 202.5 193.3 Non-cash items(i) 18.2 2.5 4.9 2.4 3.1 1.2 (2.6) Acquisition, integration, and reorganization(ii) 9.4 0.4 11.3 23.0 13.0 8.2 2.4 Non-recurring items(iii) 1.7 5.1 0.4 0.4 1.5 4.5 (1.4) Productivity initiatives(iv) 11.6 8.3 16.3 3.0 1.5 -- -- Multiemployer plan withdrawal(v) -- 2.8 0.4 3.9 (0.1) 0.8 -- Other adjustment items(vi) 8.7 5.9 3.8 5.2 9.5 2.8 1.6 Adjusted EBITDA $ 366.6 $ 328.6 $ 286.1 $ 271.3 $ 241.0 $ 220.0 $ 193.3
I. Includes adjustments for non-cash charges arising from employee equity, interest rate swap hedge ineffectiveness, and adjustments to reflect certain assets held for sale to their net realized value. Equity compensation cost was $17.2MM in fiscal 2016, $1.2MM in fiscal 2015, $0.7MM in fiscal 2014, $1.1MM in fiscal 2013, $1.1MM in fiscal 2012, $1.1MM in fiscal 2011 and $0.8MM in fiscal 2010. In addition, this includes an increase or (decrease) in the LIFO reserve of ($1.5MM) in fiscal 2016 , $1.7MM in fiscal 2015, $3.0MM in fiscal 2014 and $0.8MM in fiscal 2013.
II. Includes professional fees and other costs related to completed and abandoned acquisitions; in fiscal 2015 these fees are net of a $25.0 million termination fee related to the terminated agreement to acquire 11 US Foods facilities from Sysco and US Foods, costs of integrating certain of our facilities, facility closing costs, certain equity transactions, and advisory fees paid to Blackstone and Wellspring. Fiscal 2013, includes $11.2MM for the impact of the initial fair value of inventory that was acquired as part of acquisitions.
III. Consists primarily of an expense related to our withdrawal from a purchasing cooperative, pre-acquisition worker’s compensation claims related to an insurance company that went into liquidation, a legal settlement expense, and the impact of business interruption insurance due to hurricane and other weather related and one-time events.
IV. Consists primarily of professional fees and related expenses associated with the Winning Together program and other productivity initiatives.
V. Includes amounts related to the withdrawal from the Central States Southeast and Southwest Areas Pension Fund.
VI. Consists of changes in fair value and costs related to settlements on our fuel collar derivatives, certain financing transactions, lease amendments, and franchise tax expense and other adjustments permitted by our credit agreements.
17