Embed Size (px)
Citation preview

2017 National Runner Survey

Introduction
Table of Contents
A product of Running USA - Any publication, distribution, or disclosure of the contents of this report must properly reference the 2017 National Runner Survey and Running USA 2
Introduction and Methodology….
Executive Summary……………..
Demographics…………………..
Runner Profile……………………
Event Preferences……………….
Technology Use………………….
Running Preferences……………
Running Injuries………………….
3
4-8
9-10
11-19
20-29
30-34
35-36
37-38

Introduction and Methodology
The National Runner Survey is a comprehensive study designed to assess
the demographics, lifestyle, attitudes, habits and product preferences of the running population nationwide.
Initially launched in 2007, the National Runner Survey is distributed electronically
on an annual basis to race directors, media, running stores, brands and vendors, running clubs and others who frequent the running industry.
The National Runner Survey measures the following areas:
• Demographics • Sports Participation
• Technology • Runner Profiles • Running Preferences
• Event Preferences • Social Media Use • Sports & Fitness Products
• Training and Injuries
Field Dates: March 2017 - June 2017
6,800+ runners responded
Sample: Reflective of a convenience random sample.
Results reflective of core runners: • Active adult participants who tend
to enter running events and train year-round
• First-time runners invited to participate but the majority of responses came from core runners
Disclaimer: Results not reflective of the running industry as a whole A product of Running USA - Any publication, distribution, or disclosure of the contents of this report must properly reference the 2017 National Runner Survey and Running USA 3

Executive Summary: Runners
They skew female - 63%
U.S. runners represent an affluent, healthy target
3 in 4 supplement their running with other exercise
Half prefer to run alone
Average 21 miles a week and tend to run year-round
A product of Running USA - Any publication, distribution, or disclosure of the contents of this report must properly reference the 2017 National Runner Survey and Running USA 4

Executive Summary: Events
A product of Running USA - Any publication, distribution, or disclosure of the contents of this report must properly reference the 2017 National Runner Survey and Running USA 5
Runners attend events as both fun runners and competitors
Half are traditionalists and like participating in the same events every year, while an equal number are always looking for a new event experience
The half marathon continues to be the most popular event in terms of participation and favored distance
U.S. runners average 8 events in the past year, up from 7 events in 2015, and are planning on participating in 8 over the next year
While we have seen a decline in participation, 1/3 of runners actually plan to run in more events than in the past. Half plan to run in the same number
The top 5 factors impacting participation are: • Preferred distance • Date • Convenient location • Have time to train • Being healthy / injury

Executive Summary: Race Fees
A product of Running USA - Any publication, distribution, or disclosure of the contents of this report must properly reference the 2017 National Runner Survey and Running USA 6
Runners are divided on race entry fees:
• Half feel race fees are too expensive
• Cost/Entry is among the top 10 factors on the decision to register
• 6 in 10 would participate in more events if entry fees were lower
• Half believe they receive good value for their race entry fee
• Half would run in a lower cost no frills / less swag race, while about half would run in a higher cost fuller race experience / more swag

Executive Summary: Social Media
A product of Running USA - Any publication, distribution, or disclosure of the contents of this report must properly reference the 2017 National Runner Survey and Running USA 7
8 in 10 follow something running related on social media
About 4 in 10 like to share their running / race experience via social media
Facebook is the primary social media channel • 6 in 10 follow events
Over 4 in 10 on Facebook are: • Discussing running-related activities • Recruiting others to join them at an upcoming race • Tracking friends / family in a race • Posting running / race results, photos, and/or videos • Posting race results • Looking for running motivation and training advice

Executive Summary: Technology
A product of Running USA - Any publication, distribution, or disclosure of the contents of this report must properly reference the 2017 National Runner Survey and Running USA 8
About half of runners are connected. They run with a: • Smartphone • Sports watch • GPS item
More than 90% of runners wear a tracking device or watch
82% of runners like to use running apps to track their training

Demographics - Overview
A product of Running USA - Any publication, distribution, or disclosure of the contents of this report must properly reference the 2017 National Runner Survey and Running USA 9
37%
63%
Age
18 to 24 25 to 34 35 to 44 45 to 54 55 to 64 65 to 74 75+
1%5%
17%
27%28%
19%
4%
Gender
Marital Status
Married Single, Never Married
Divorced Domestic Partner
Widowed Separated
1%1%3%8%
20%
68%

Demographics - Overview
A product of Running USA - Any publication, distribution, or disclosure of the contents of this report must properly reference the 2017 National Runner Survey and Running USA 10
Household Composition %Number in Household1 142 323 164 235 or more 14Number of Children Under 19 in Household0 521 162 223 84 or more 3
Education %Currently full time student and under 19 4
Attended college 1-3 years 8Associate's Degree 6Technical or Trade Degree 2Graduated from 4-year college 36Post-graduate study without degree 6
Master’s degree 29Doctoral degree 8
EmploymentEmployed full-time 87Student 3Retired 3Homemaker 6Unemployed 2
Ethnicity %White/Caucasian 84Black/African-American 7Asian/Pacific Islander 6Hispanic 4American Indian 1Other 2
Annual Income (Employed)Less than $15,000 3$15,000-$24,999 3$25,000-$34,999 4$35,000-$49,999 12$50,000-$74,999 24$75,000-$99,999 15$100,000-$124,999 10$125,000-$149,999 4$150,000-$174,999 3$175,000-$199,999 1$200,000 or more 4Don't know/Refused 17

How Runners Classify Themselves
A product of Running USA - Any publication, distribution, or disclosure of the contents of this report must properly reference the 2017 National Runner Survey and Running USA 11
62%21% 15%
Frequent / Fitness Runner
Jogger / Recreational Runner
Serious / Competitive Runner
Runners primarily describe themselves as frequent / fitness runners, although that number decreased by 3% from 2015

Running Habits
A product of Running USA - Any publication, distribution, or disclosure of the contents of this report must properly reference the 2017 National Runner Survey and Running USA 12
13Years Running
21Miles per Week
The majority run throughout the year and at least 4 times a week
Run 12 months / year76%
Run at least 4 days per week
56%
The average number of miles per week run grew from 20 to 21 from 2016 to 2017

Running Motivators
A product of Running USA - Any publication, distribution, or disclosure of the contents of this report must properly reference the 2017 National Runner Survey and Running USA 13
Primary Motivation to Start Running %
For exercise 24Weight concerns 14Family / Friend encouragement 9To enter a race 8Competed in school and never stopped 8Because I enjoy it 6Needed a new challenge 6To relieve stress 6Health concerns besides weight 5To get in shape for another sport 3
Primary Motivation to Continue to Run %
Staying healthy 77
Staying in shape 73
Relieving stress 62
To enter / train for a race 62
Having fun 55
Achieving a goal 54
Meeting a personal challenge 53
Improving my state of mind 53
Controlling my weight 53
Improving speed or endurance 46
Socializing with friends/family/others 41
Appreciating nature, scenery 39
Being by myself for awhile 39
Getting into the natural environment 31
Competing against others 22
Stay injury free 13
Runners are motivated by a desire to stay healthy, stay in shape, relieve stress, and enter / train for a
race - consistent themes from year-to-year
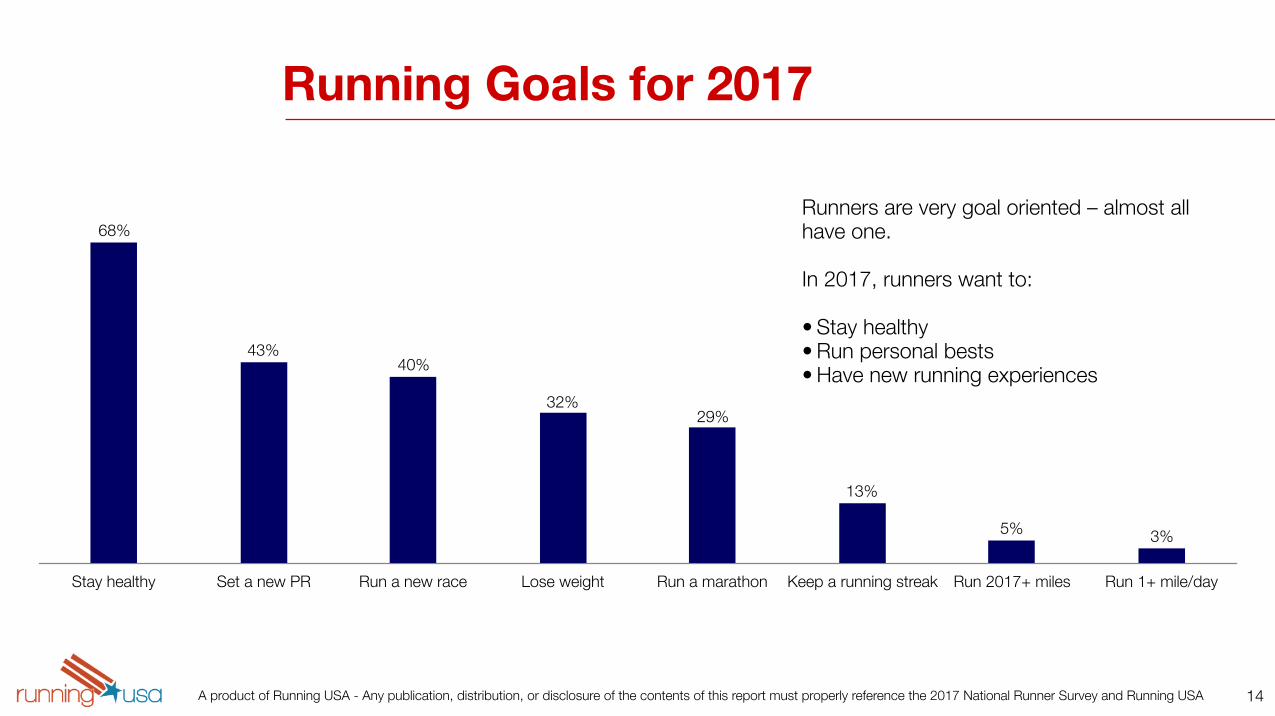
Running Goals for 2017
A product of Running USA - Any publication, distribution, or disclosure of the contents of this report must properly reference the 2017 National Runner Survey and Running USA 14
Stay healthy Set a new PR Run a new race Lose weight Run a marathon Keep a running streak Run 2017+ miles Run 1+ mile/day
3%5%
13%
29%32%
40%43%
68%Runners are very goal oriented – almost all have one.
In 2017, runners want to:
• Stay healthy • Run personal bests • Have new running experiences

Regular Activities as Part of Running
A product of Running USA - Any publication, distribution, or disclosure of the contents of this report must properly reference the 2017 National Runner Survey and Running USA 15
Warm up/stretch
Use machines/weights
Walk Bike Yoga/Pilates
Hike HIITTraining
Spin Swim Aerobics Crossfit FormDrills
9%10%11%14%
18%21%21%
26%27%
47%49%
55%

Running Preferences
A product of Running USA - Any publication, distribution, or disclosure of the contents of this report must properly reference the 2017 National Runner Survey and Running USA 16
Preferred Time of Day to Run
Early AM 64% Mid-Morning 25% Noon 6% Early Afternoon 6% Mid-Afternoon 11% Early Evening 39% Late Evening 9%
Regular Running Workouts
Easy Runs (aerobic) 86% Long Runs (> 1 hour) 79% Hill Training 44% Pace Workouts 44% Tempo Runs 38% Recovery Runs 31% Fartlek 17% Pickups 8%
By Self 55% With one other person 16% In a group 14% No preference 16%
Paved Path 67% Urban Road 54% Park 47% Rural Road 44% Dirt Trail 40% Outdoor track 20% Mountains 16% Treadmill 14% Beach 12%
Regular Running Workouts
How Prefer to Run
Favorite Running Venues/Surfaces

Favorite Season to Run
A product of Running USA - Any publication, distribution, or disclosure of the contents of this report must properly reference the 2017 National Runner Survey and Running USA 17
Fall is runners’ favorite season to run – followed by spring.
Summer and winter are by far the least preferred seasons.
What Prevents Running Outside?
7% run outside no matter the conditions.
Ice is the biggest running hazard, followed by not feeling safe and
windchill.
TooIcy
Don't Feel Safe
Windchill Too Low
Too Rainy
Too Dark
TooCold
TooHot
Nothing
7%
31%31%34%35%
44%48%
69%
10% 34% 11% 46%

Running Group Involvement
A product of Running USA - Any publication, distribution, or disclosure of the contents of this report must properly reference the 2017 National Runner Survey and Running USA 18
LocalRunning Club
Social Groups /Informal Groups
Running Store Group Runs
Virtual Running Club /Challenge Group
MeetUpRunning Group
RRCA USA Track & Field
None
40%
4%6%6%
11%
18%
29%
34%6 in 10 runners
are part of a group
1 in 3 are involved in a local running club or social
group / informal group
1 in 10 are part of a virtual
running club / challenge group

What Runners Carry
A product of Running USA - Any publication, distribution, or disclosure of the contents of this report must properly reference the 2017 National Runner Survey and Running USA 19
Smart Phone 59%
GPS Item 44%
Sports Watch 51%
Sunglasses 44%
Keys 43%
Hat / Visor 40%
Items Regularly Run with… %Personal ID 34%Fitness tracker (i.e. FitBit) 30%Water bottle 28%Energy bars/gel 24%Portable audio system/ipod/MP3 23%Hydration accessories (belt, backpack) 21%SpiBelt (or similar waist belt) 21%Sunscreen 20%Reflective Gear 19%Heart rate monitor 18%Cash/Credit Card 17%Chapstick/Lipgloss 16%Compression Gear 15%Sports Drink 9%Sweatband 8%Dog 7%Pepper Spray 7%Sleeves 4%Toilet Paper 4%Inhaler 4%

Attending Running Events As…
A product of Running USA - Any publication, distribution, or disclosure of the contents of this report must properly reference the 2017 National Runner Survey and Running USA 20
Competitor Fun Runner Outdoor EnthusiastFitness Participant
15%37%56% 52%

Favorite Race Distance
A product of Running USA - Any publication, distribution, or disclosure of the contents of this report must properly reference the 2017 National Runner Survey and Running USA 21
10K
Half Marathon
Marathon12K, 15K & 10 Mile
14%5K
13.1 Continues to be the favored distance, growing 3% overall from 2015 to 2016
18%6%
43%
10%

Event Participation
A product of Running USA - Any publication, distribution, or disclosure of the contents of this report must properly reference the 2017 National Runner Survey and Running USA 22
Distance % Entered Last 2 Years % Most Interested in Entering in 2017
5K (3.1 mile) 82 56
Half Marathon (13.1 miles) 80 75
10K (6.2 mile) 67 56Marathon (26.2 miles) 43 41
12K, 15K or 10 mile 37 30
4 mile, 8K or 5 mile 33 21
Fun Run or Untimed Run 24 8
Trail Race 23 23
Road Running Relay 13 12
Triathlon/Duathlon 12 13
Mud/Obstacle 10 10
Color 8 5
1 mile or 2 mile 11 6
Glow / Night 8 7
20K, 25K or 30K 7 8
Ultra Distance (more than 26.2 miles) 8 10
Untimed walk event 6 2
Cross-Country Race 5 5
Average Number of Events Finished Past
12 Months
8
Average Number of Events Plan to
Enter Next Year
8

Holiday Event Participation
A product of Running USA - Any publication, distribution, or disclosure of the contents of this report must properly reference the 2017 National Runner Survey and Running USA 23
Thanksgiving Fourth of July St. Patrick's Day54% 26% 20%
New Years Christmas Halloween Valentine's Day18% 15% 13% 8%

Event Participation
A product of Running USA - Any publication, distribution, or disclosure of the contents of this report must properly reference the 2017 National Runner Survey and Running USA 24
Decrease Same Increase
Last Year 20% 50% 30%
Next Year 8% 56% 36%
Last year, 20% decreased and 30% increased their race participation
This is likely to change in the coming year – only 8% plan to decrease and 36% will increase
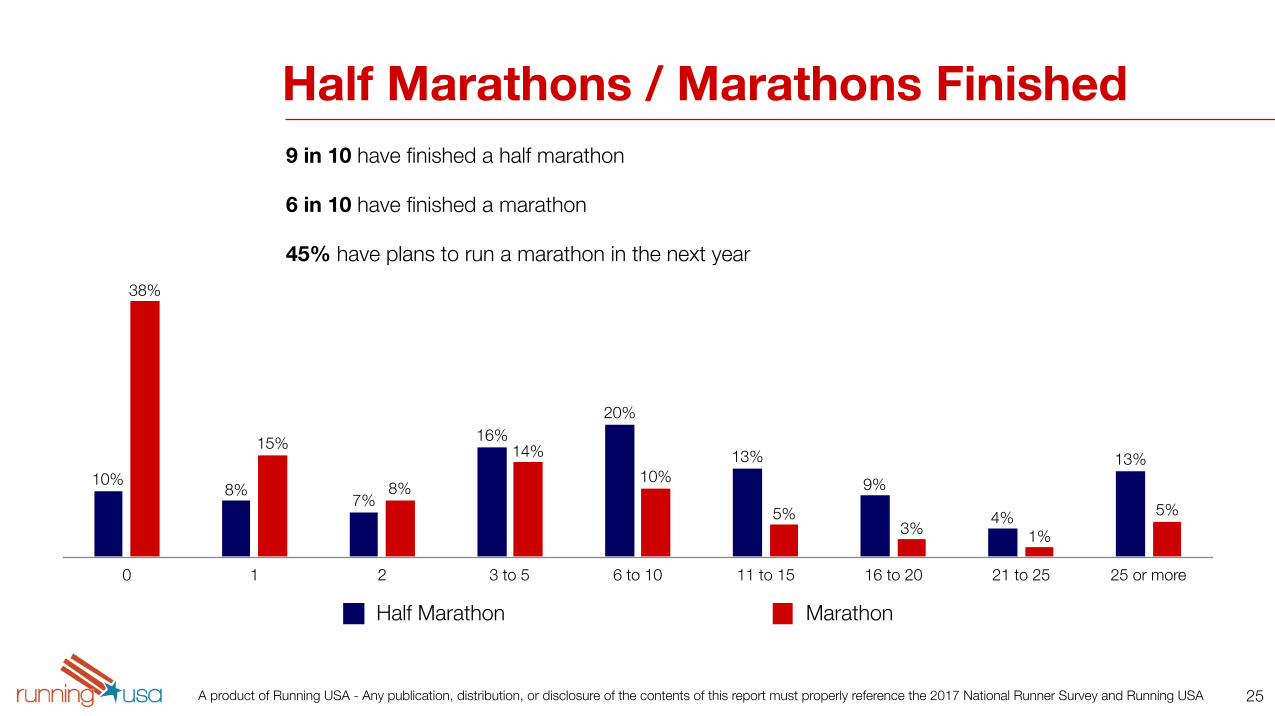
Half Marathons / Marathons Finished
A product of Running USA - Any publication, distribution, or disclosure of the contents of this report must properly reference the 2017 National Runner Survey and Running USA 25
0 1 2 3 to 5 6 to 10 11 to 15 16 to 20 21 to 25 25 or more
5%1%3%
5%
10%14%
8%
15%
38%
13%
4%
9%13%
20%16%
7%8%10%
Half Marathon Marathon
9 in 10 have finished a half marathon
6 in 10 have finished a marathon
45% have plans to run a marathon in the next year

Top Factors Effecting Race Participation
A product of Running USA - Any publication, distribution, or disclosure of the contents of this report must properly reference the 2017 National Runner Survey and Running USA 26
81% Preferred Distance
78% Date of Event
70% Location is Convenient
67% Have Time to Train
67% Health / Injury
66% Sounds Fun
65% Chip Timed
61% Scenic Course
59% Cost / Entry Fee
58% Reputation of Event Organizers

Other Factors Affecting Race Participation
A product of Running USA - Any publication, distribution, or disclosure of the contents of this report must properly reference the 2017 National Runner Survey and Running USA 27
Importance of Factors in Determining Event Participation %
Accurate, certified course 52%
Medal or other momento for finishers 49%
Quality t-shirt 44%
Fun post race experience 38%
It benefits an important cause 35%
No crowds/traffic/hassles expected 34%
My friends are doing it 34%
Promise of a unique event 31%
It is an event I participated in before 29%
Fast course 26%
Free race photos or videos 24%
Entertainment on course or finish 24%
Importance of Factors in Determining Event Participation %
Good age group awards 19%
Sustainable event / has an environment initiative 18%
There is an expo 15%
Qualifier 15%
Recycled/Sustainable race t-shirt 12%
Something offered for other family members 11%
It is a new event 10%
Has a social media app / site for sharing experience 10%
Random participant awards 10%
Appropriate training group is available 6%
Race is part of a local grand prix 5%
Elite runners in the field 5%
Expo has guest speakers I am interested in meeting 4%
Women only event 4%

Primary Source of Race Information
A product of Running USA - Any publication, distribution, or disclosure of the contents of this report must properly reference the 2017 National Runner Survey and Running USA 28
Word of Mouth
Individual race website
Registration website
Running store
Local club / city website
Race calendar apps
National website
Expos
Regional / state website
National magazine
Local publication
State or regional publication
GroupOn / Living Social / Rush49 2%
4%
4%
5%
9%
9%
10%
11%
15%
18%
18%
23%
27%
35%
37%
43%
Facebook, referrals, and individual race
websites are key channels for race
information, followed by registration websites.
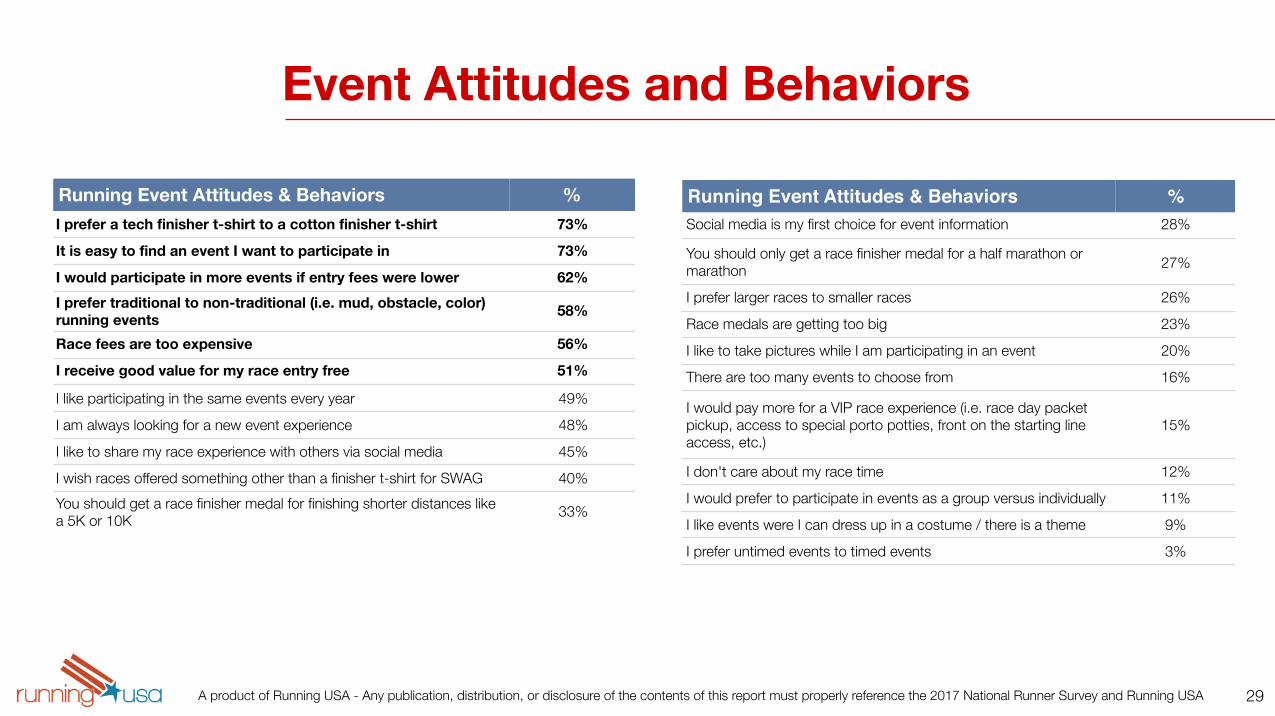
Event Attitudes and Behaviors
A product of Running USA - Any publication, distribution, or disclosure of the contents of this report must properly reference the 2017 National Runner Survey and Running USA 29
Running Event Attitudes & Behaviors %Social media is my first choice for event information 28%
You should only get a race finisher medal for a half marathon or marathon 27%
I prefer larger races to smaller races 26%Race medals are getting too big 23%I like to take pictures while I am participating in an event 20%There are too many events to choose from 16%
I would pay more for a VIP race experience (i.e. race day packet pickup, access to special porto potties, front on the starting line access, etc.)
15%
I don't care about my race time 12%I would prefer to participate in events as a group versus individually 11%I like events were I can dress up in a costume / there is a theme 9%I prefer untimed events to timed events 3%
Running Event Attitudes & Behaviors %I prefer a tech finisher t-shirt to a cotton finisher t-shirt 73%
It is easy to find an event I want to participate in 73%
I would participate in more events if entry fees were lower 62%I prefer traditional to non-traditional (i.e. mud, obstacle, color) running events 58%
Race fees are too expensive 56%
I receive good value for my race entry free 51%
I like participating in the same events every year 49%I am always looking for a new event experience 48%I like to share my race experience with others via social media 45%I wish races offered something other than a finisher t-shirt for SWAG 40%You should get a race finisher medal for finishing shorter distances like a 5K or 10K 33%

Follow on Social Media
A product of Running USA - Any publication, distribution, or disclosure of the contents of this report must properly reference the 2017 National Runner Survey and Running USA 30
RunningStores
RunningBrands
LocalRunners
EliteRunners
Bloggers Celebrities None ofThese
I don't follow any running-related
accounts
21%
16%
5%
19%
29%32%
37%40%
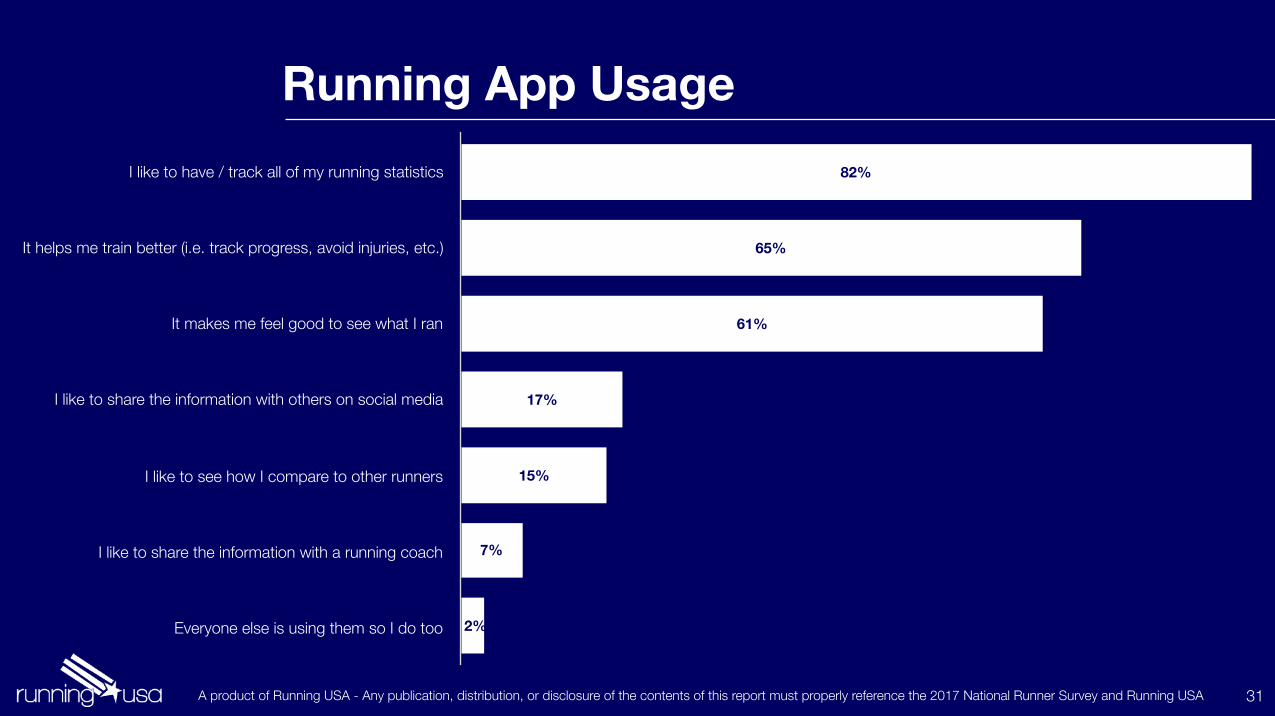
Running App Usage
A product of Running USA - Any publication, distribution, or disclosure of the contents of this report must properly reference the 2017 National Runner Survey and Running USA 31
I like to have / track all of my running statistics
It helps me train better (i.e. track progress, avoid injuries, etc.)
It makes me feel good to see what I ran
I like to share the information with others on social media
I like to see how I compare to other runners
I like to share the information with a running coach
Everyone else is using them so I do too 2%
7%
15%
17%
61%
65%
82%

Technology and Running
A product of Running USA - Any publication, distribution, or disclosure of the contents of this report must properly reference the 2017 National Runner Survey and Running USA 32
Activities Phone / App on Phone Watch Wearable Tracking
Device Online Website
Track mileage 45% 48% 23% 12%
GPS 36% 52% 16% 4%
Track nutrition / calories 29% 7% 5% 6%
Track steps 21% 28% 26% 2%
Map routes 38% 17% 8% 24%
Play music 55% 4% 4% 1%
Training programs 22% 8% 4% 18%
Tracking workouts 40% 34% 17% 12%
Interval training 17% 27% 9% 4%
Virtual coach 11% 4% 2% 4%
None of these 8% 8% 11% 9%

Social Media Use
A product of Running USA - Any publication, distribution, or disclosure of the contents of this report must properly reference the 2017 National Runner Survey and Running USA 33
Activities % Who Do Activity Facebook Twitter Instagram PinterestFundraise for a charity event 62% 7% 26% 1% 7%
Discuss running-related activities 62% 11% 16% 1% 7%
Look for running motivation 49% 6% 21% 1% 9%Recruit others to join me at an
upcoming race 49% 6% 16% 0% 11%
Share your current training 47% 6% 10% 1% 11%
Communicate with training partners 43% 8% 20% 13% 10%
Recruit others to train with you 42% 4% 7% 0% 13%
Post your race results 42% 9% 20% 1% 11%
Follow events 40% 5% 7% 1% 14%Post general running photos and
videos 38% 6% 9% 8% 13%
Look for running training advice 37% 3% 6% 0% 15%
Track friends / family in a race 33% 5% 12% 0% 15%Follow other runners (non-
professional) 31% 2% 5% 0% 17%
Follow professional runners 29% 4% 10% 0% 16%
Post your mileage / running routes 29% 4% 6% 0% 17%
Post race photos and videos 26% 11% 18% 1% 15%
None of these 15% 22% 20% 24% 12%

Tracking Mileage, Goals and Time
A product of Running USA - Any publication, distribution, or disclosure of the contents of this report must properly reference the 2017 National Runner Survey and Running USA 34
App on my phone
Hard copy log or journal
Computer software (i.e. XL or Word)
Online software (i.e. coach gives a program)
None, do no track at all 9%
14%
15%
23%
63%
The vast majority of runners track their mileage,
goals, and times, with nearly two-thirds using their
phone as the primary tracking
tool.

Running Preferences
A product of Running USA - Any publication, distribution, or disclosure of the contents of this report must properly reference the 2017 National Runner Survey and Running USA 35
Run in a lower-cost, no frills, less swag race 55%
Run in a higher-cost, fuller experience, more swag race 45%
Run outside during harsher weather 57%
Run inside during harsher weather 43%
Only run as exercise 23%
Supplement running with other exercise 77%
Stretch 71%
Not stretch 29%
Run on trails 37%
Run on the roads 64%
Run with a watch or tracking device 93%
Run without a watch or tracking device 7%
Run with music 60%
Run without music 40%
Share your running with others on social media 35%
Keep my running to myself and close friends 65%

Runners Want to Learn About…
A product of Running USA - Any publication, distribution, or disclosure of the contents of this report must properly reference the 2017 National Runner Survey and Running USA 36
Best places to run when on vacation
Best places to run in your area
How to avoid injuries
How to cross train to supplement your running
Easy way to find races to participate in
What to eat before a big race
How to select the best running shoes
What pace you should run when racing
How to be safe when running
How to run in inclement weather
How to find a good running coach
How to run at night 12%
14%
20%
26%
31%
34%
35%
38%
42%
46%
47%
49%

Running Injuries (Past 12 Months)
A product of Running USA - Any publication, distribution, or disclosure of the contents of this report must properly reference the 2017 National Runner Survey and Running USA 37
Blisters Knee Hips Plantar Fasciitis
Foot IT Band Syndrome
LowerBack
Shin Splints
Hamstring Calf Ankle Achilles Tendon
Stress Fracture
Quadriceps None
23%
2%3%
7%8%9%
10%11%11%
12%13%14%14%
22%
29%
75% have had a running-related injury in the past 12 months
50% have had their training curtailed for more than 4 days due to a running-related injury
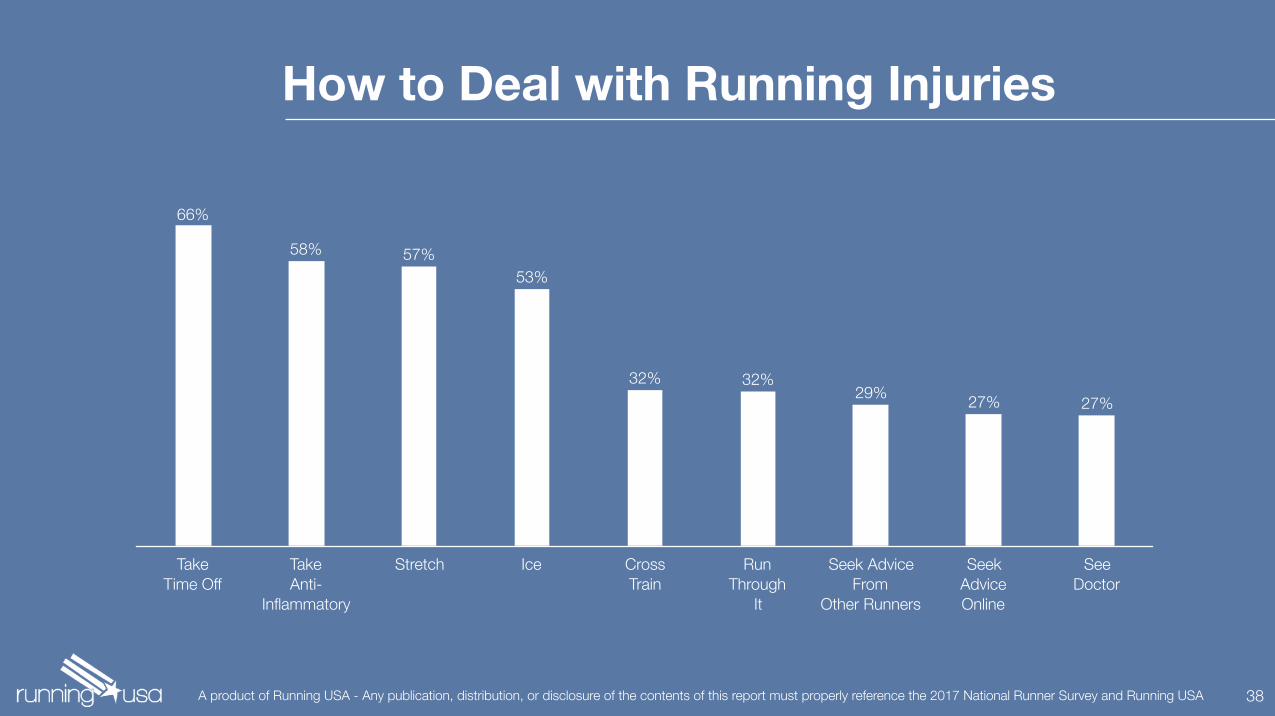
How to Deal with Running Injuries
A product of Running USA - Any publication, distribution, or disclosure of the contents of this report must properly reference the 2017 National Runner Survey and Running USA 38
TakeTime Off
TakeAnti-
Inflammatory
Stretch Ice CrossTrain
RunThrough
It
Seek Advice From
Other Runners
SeekAdviceOnline
SeeDoctor
27%27%29%32%32%
53%57%58%
66%

2017 National Runner Survey
To learn more and stay up-to-date on all the most recent Running USA research, please visit
www.runningusa.org
A product of Running USA - Any publication, distribution, or disclosure of the contents of this report must properly reference the 2017 National Runner Survey and Running USA 39