Embed Size (px)
Citation preview

www.pwc.com/us/forensics
2017 Patent Litigation Study Change on the horizon?
May 2017
Trends
• $2.5B Largest patent infringement award in US history granted to Idenix (Merck)
• 9% fewer patent cases filed in 2016 v. 2015
• 33% Patentee success rate steady
• 80/20 Jury versus bench proportion continues to rise (up from 75/25)
• 15x Median jury award over 15x greater than median bench award in last 5 years
• 52% of appealed decisions were modified in some regard
Despite Idenix mega-award,
median damages down 40%
relative to last year
PwC | 2017 Patent Litigation Study 2
Trends
SCOTUS: Significant developments
• A shift in pleading standards. The Supreme Court abolished Rule 84—effectively making it harder for smaller entities to bring patent suits
• Halo v. Pulse and Stryker v. Zimmer decisions address the tests for willfulness, easing the way to obtain punitive damages (p. 10)
• Apple v. Samsung levels the playing field between design patents and other types of patents, by imposing apportionment concept to design patent damages (p. 12)
• TC Heartland v. Kraft Foods could significantly restrict venue choice and further reduce patent litigation (p. 23)
Nonpracticing entities (NPEs) vs. practicing entities (PEs)
• NPE/Practicing Entities = 3.8x Damages awards for NPEs in the last five years continue to widen relative to practicing entities (last year was 2.7x)
• Still, NPEs face lower success rates at trial and in summary judgments
• NPE cases concentrated: five of 94 district courts account for nearly half (46%) of all identified NPE decisions—Texas Eastern is favorite district for NPEs
Industries and districts
• Medical devices industry edges biotech/pharma industry in top median damages while consumer products still leads in number of cases
• Distribution of cases continues to be skewed: filings grow in tech-rich California Northern and corporate-rich Delaware
PwC | 2017 Patent Litigation Study 3
Table of contents
Overview: What are the trends to watch?
4
Damages: Which way is up?
9
Success rates: How are jury and bench trials faring?
14
Practicing entities and NPEs: Where’s the gap?
16
Industries: Which ones are leading the pack?
18
Across districts: Results may vary?
22
What becomes of patent cases after appeal?
25
Methodology and authors
29
PwC | 2017 Patent Litigation Study
PwC | 2017 Patent Litigation Study 4
’91 ’92
Cas
e Fi
lings G
rants
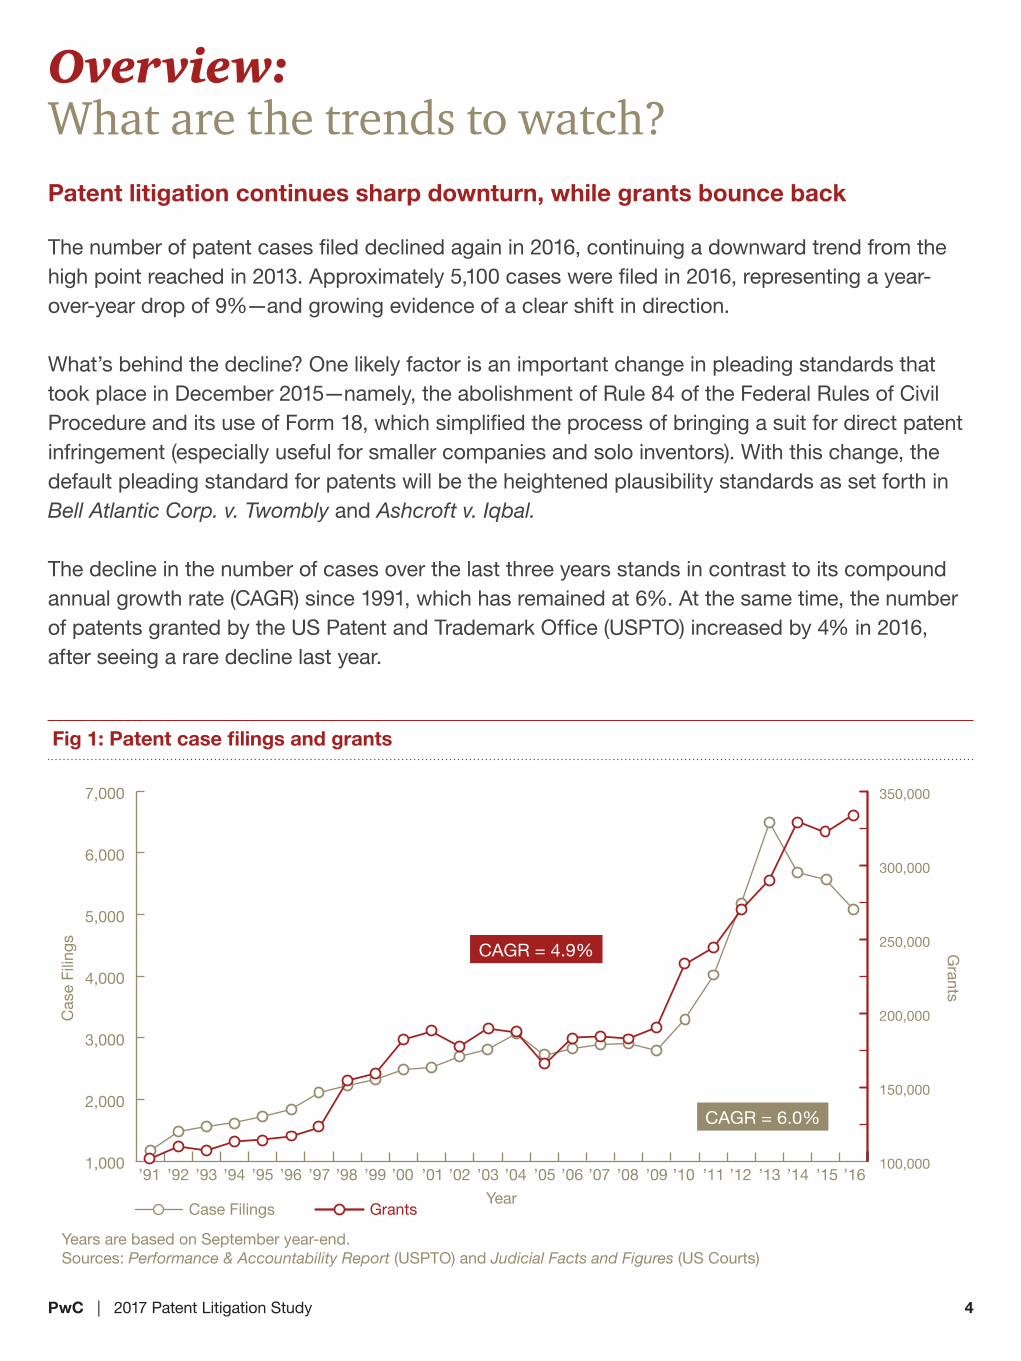
CAGR = 6.0%
CAGR = 4.9%
Year
Years are based on September year-end.Sources: Performance & Accountability Report (USPTO) and Judicial Facts and Figures (US Courts)
’93 ’94 ’95 ’96 ’97 ’98 ’99 ’00 ’01 ’02 ’03 ’04 ’05 ’06 ’07 ’08 ’09 ’10 ’11 ’12 ’13 ’14 ’15 ’16
GrantsCase Filings
100,000
150,000
200,000
250,000
300,000
350,000
1,000
2,000
3,000
4,000
5,000
6,000
7,000
Patent litigation continues sharp downturn, while grants bounce back
The number of patent cases filed declined again in 2016, continuing a downward trend from the high point reached in 2013. Approximately 5,100 cases were filed in 2016, representing a year-over-year drop of 9%—and growing evidence of a clear shift in direction.
What’s behind the decline? One likely factor is an important change in pleading standards that took place in December 2015—namely, the abolishment of Rule 84 of the Federal Rules of Civil Procedure and its use of Form 18, which simplified the process of bringing a suit for direct patent infringement (especially useful for smaller companies and solo inventors). With this change, the default pleading standard for patents will be the heightened plausibility standards as set forth in Bell Atlantic Corp. v. Twombly and Ashcroft v. Iqbal.
The decline in the number of cases over the last three years stands in contrast to its compound annual growth rate (CAGR) since 1991, which has remained at 6%. At the same time, the number of patents granted by the US Patent and Trademark Office (USPTO) increased by 4% in 2016, after seeing a rare decline last year.
Overview: What are the trends to watch?
Fig 1: Patent case filings and grants
PwC | 2017 Patent Litigation Study 5
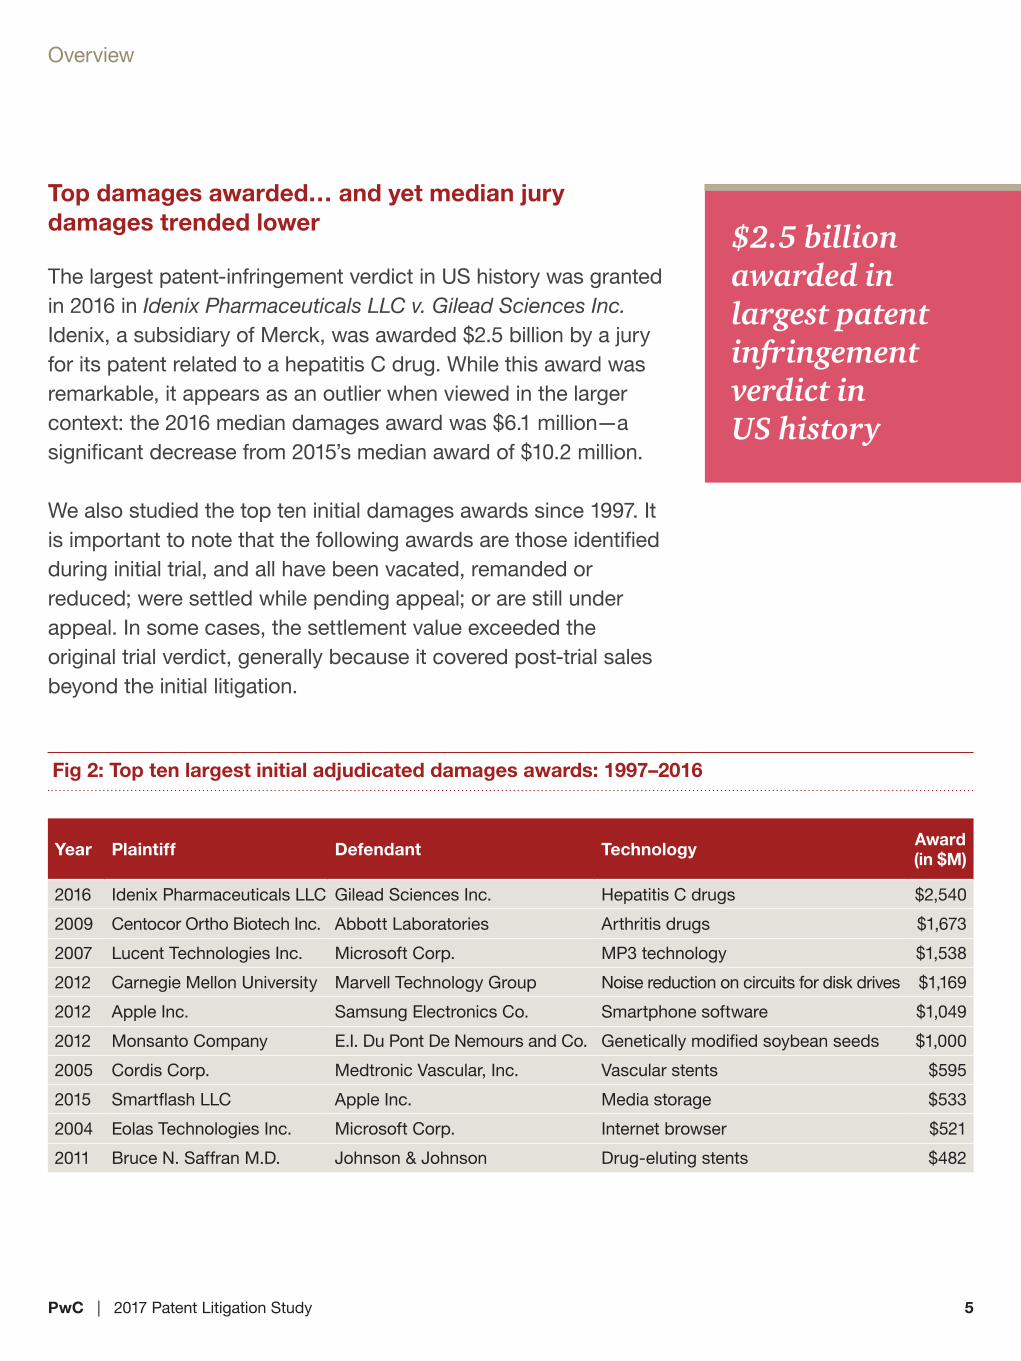
Top damages awarded… and yet median jury damages trended lower
The largest patent-infringement verdict in US history was granted in 2016 in Idenix Pharmaceuticals LLC v. Gilead Sciences Inc. Idenix, a subsidiary of Merck, was awarded $2.5 billion by a jury for its patent related to a hepatitis C drug. While this award was remarkable, it appears as an outlier when viewed in the larger context: the 2016 median damages award was $6.1 million—a significant decrease from 2015’s median award of $10.2 million.
We also studied the top ten initial damages awards since 1997. It is important to note that the following awards are those identified during initial trial, and all have been vacated, remanded or reduced; were settled while pending appeal; or are still under appeal. In some cases, the settlement value exceeded the original trial verdict, generally because it covered post-trial sales beyond the initial litigation.
Year Plaintiff Defendant Technology Award (in $M)
2016 Idenix Pharmaceuticals LLC Gilead Sciences Inc. Hepatitis C drugs $2,540
2009 Centocor Ortho Biotech Inc. Abbott Laboratories Arthritis drugs $1,673
2007 Lucent Technologies Inc. Microsoft Corp. MP3 technology $1,538
2012 Carnegie Mellon University Marvell Technology Group Noise reduction on circuits for disk drives $1,169
2012 Apple Inc. Samsung Electronics Co. Smartphone software $1,049
2012 Monsanto Company E.I. Du Pont De Nemours and Co. Genetically modified soybean seeds $1,000
2005 Cordis Corp. Medtronic Vascular, Inc. Vascular stents $595
2015 Smartflash LLC Apple Inc. Media storage $533
2004 Eolas Technologies Inc. Microsoft Corp. Internet browser $521
2011 Bruce N. Saffran M.D. Johnson & Johnson Drug-eluting stents $482
Fig 2: Top ten largest initial adjudicated damages awards: 1997–2016
Overview
$2.5 billion awarded in largest patent infringement verdict in US history

PwC | 2017 Patent Litigation Study 6
2012−20162007−20112002−20061997−2001
80%
70%61%
32%
Fig 3: Percent of cases decided by juries (excluding ANDA cases)
Trier of fact: Will the shift to jury trials ever reach a ceiling?
We have witnessed a dramatic shift in the trier of fact in patent cases over the last 15 years.
Where previously bench trials were more common, since the turn of the century, jury trials have predominated: in the last five years, the percentage of cases decided by a jury—excluding Abbreviated New Drug Application (ANDA)-related cases1—reached 80%, from last year’s Study’s most recent five-year share.
The reason for the strong pull to jury trials is fairly straightforward: juries have historically tended to award patentees with higher success rates and median damages awards.
1 These cases are, with rare exceptions, tried by the bench, and their increasing prevalence in recent years would otherwise skew this measure.
Overview
6
PwC | 2017 Patent Litigation Study 7
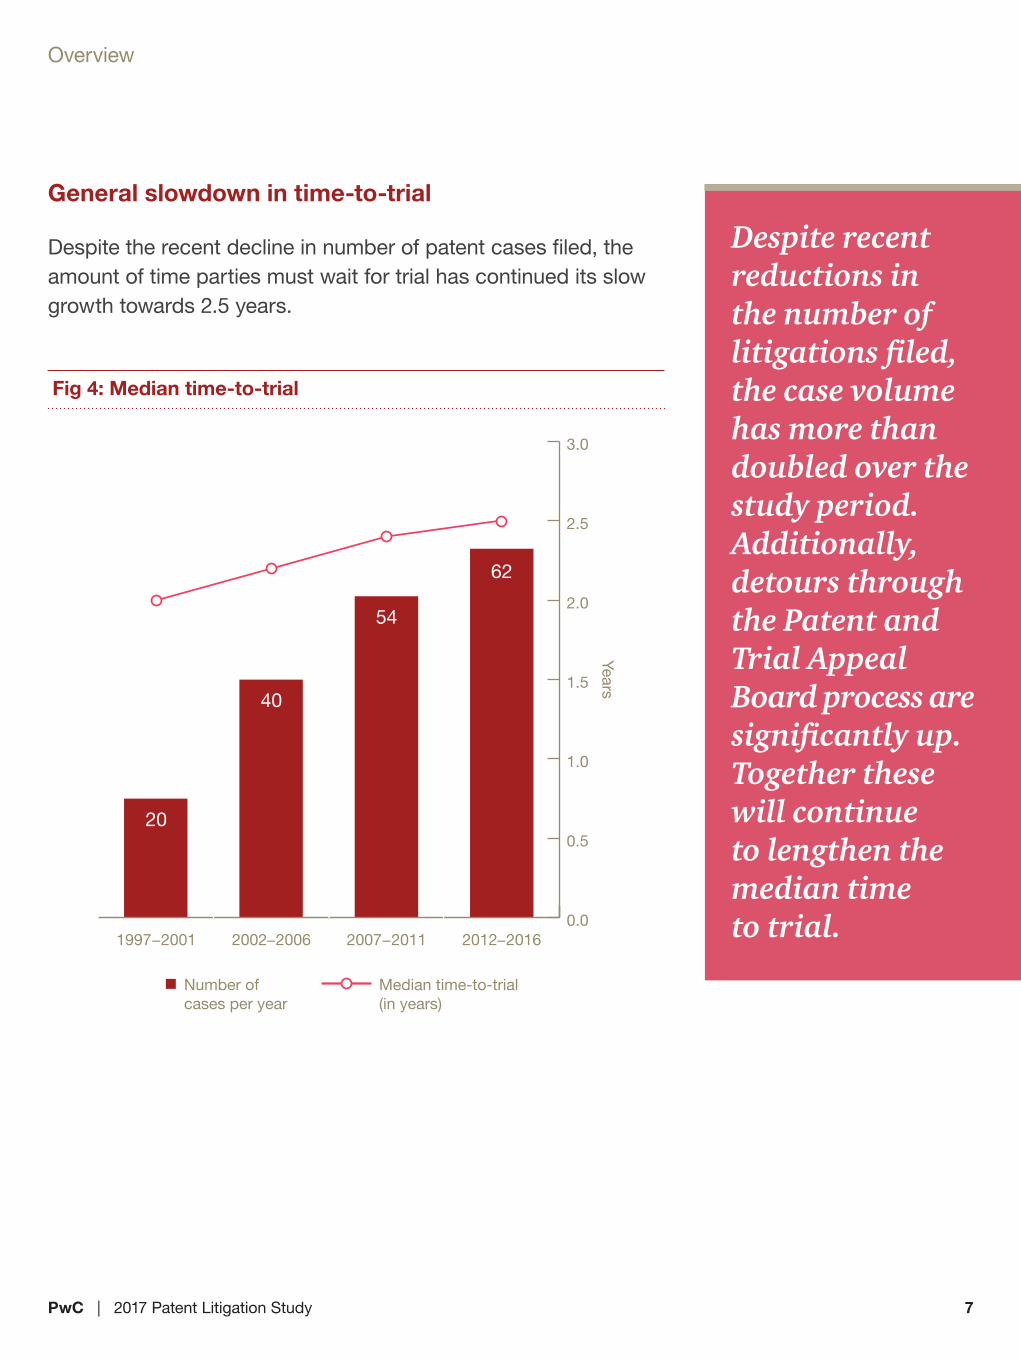
General slowdown in time-to-trial
Despite the recent decline in number of patent cases filed, the amount of time parties must wait for trial has continued its slow growth towards 2.5 years.
Years
1997−2001 2007−20112002−2006 2012−2016
20
54
40
62
0.0
0.5
1.0
1.5
2.0
2.5
3.0
Number of cases per year
Median time-to-trial (in years)
Fig 4: Median time-to-trial
Overview
Despite recent reductions in the number of litigations filed, the case volume has more than doubled over the study period. Additionally, detours through the Patent and Trial Appeal Board process are significantly up. Together these will continue to lengthen the median time to trial.

PwC | 2017 Patent Litigation Study 8
Expert witnesses: When business opportunities expose you to disputes
Business leaders are constantly making big decisions to drive growth and profitability: an acquisition, a new strategic alliance, outsourcing or other transaction. And any one of these opportunities can lead to a dispute.
Naturally, you want to minimize the chance of a dispute happening. But if it does, you want the right result for your company. And for that, chances are you’ll need help with:
• Protecting the value of your intellectual property (IP), brand and business assets during a dispute
• Understanding the merits and potential magnitude of the dispute • Gathering guidance on crucial industry, economics, finance and
accounting issues
In complex business disputes, the outcome of your case (and even of your company) can rest on the quality and expertise of the professionals you turn to, in areas such as:
• Valuation (including IP and licensing matters)• Advanced data analytics• Quantification of damages• Expert witness testimony• Arbitration, mediation or special masters• Forensic accounting
Whether your case centers on complex accounting issues, breach of contract, intellectual property infringement, business valuation, international arbitration or a range of other disputes, the right expert can help steer you through the controversy, present the facts to withstand vigorous cross-examination—and strengthen your chances of prevailing.
Overview
PwC | 2017 Patent Litigation Study 9
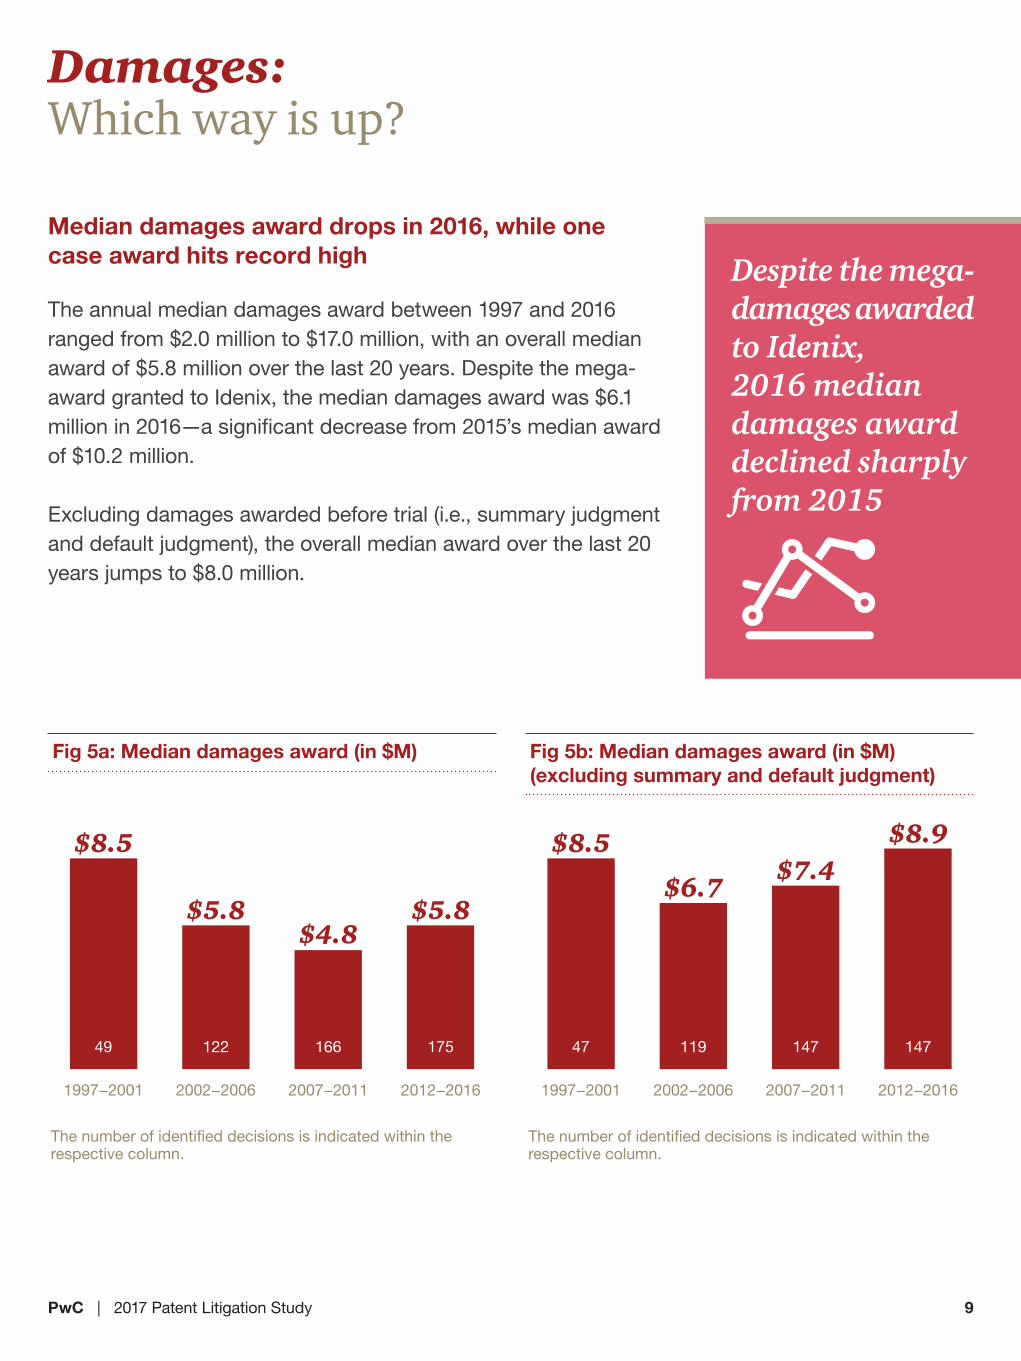
Median damages award drops in 2016, while one case award hits record high
The annual median damages award between 1997 and 2016 ranged from $2.0 million to $17.0 million, with an overall median award of $5.8 million over the last 20 years. Despite the mega-award granted to Idenix, the median damages award was $6.1 million in 2016—a significant decrease from 2015’s median award of $10.2 million.
Excluding damages awarded before trial (i.e., summary judgment and default judgment), the overall median award over the last 20 years jumps to $8.0 million.
Damages: Which way is up?
Fig 5a: Median damages award (in $M)
1997−2001
49
2002−2006
122
2007−2011
166
2012−2016
175
The number of identified decisions is indicated within the respective column.
$5.8$4.8
$5.8
$8.5
Fig 5b: Median damages award (in $M) (excluding summary and default judgment)
47 119 147 147
$6.7$7.4
$8.9$8.5
1997−2001 2002−2006 2007−2011 2012−2016
The number of identified decisions is indicated within the respective column.
Despite the mega-damages awarded to Idenix, 2016 median damages award declined sharply from 2015
PwC | 2017 Patent Litigation Study 10
Damages
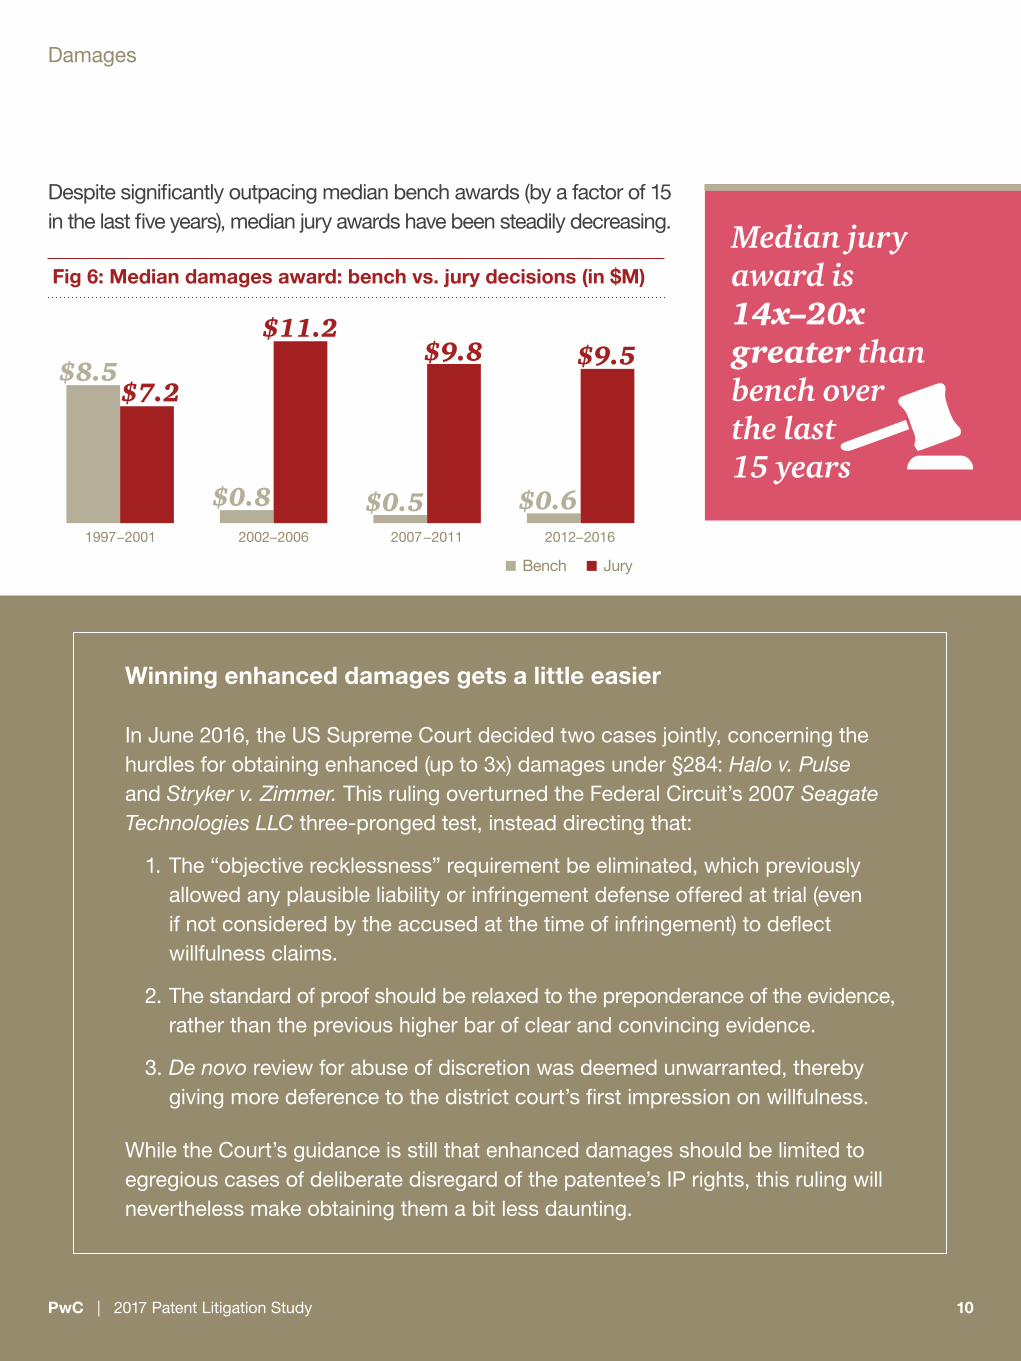
Despite significantly outpacing median bench awards (by a factor of 15 in the last five years), median jury awards have been steadily decreasing.
Fig 6: Median damages award: bench vs. jury decisions (in $M)
Bench Jury
1997−2001 2002−2006 2007 −2011 2012−2016
$8.5
$0.8 $0.5 $0.6
$7.2
$11.2$9.8 $9.5
Winning enhanced damages gets a little easier
In June 2016, the US Supreme Court decided two cases jointly, concerning the hurdles for obtaining enhanced (up to 3x) damages under §284: Halo v. Pulse and Stryker v. Zimmer. This ruling overturned the Federal Circuit’s 2007 Seagate Technologies LLC three-pronged test, instead directing that:
1. The “objective recklessness” requirement be eliminated, which previously allowed any plausible liability or infringement defense offered at trial (even if not considered by the accused at the time of infringement) to deflect willfulness claims.
2. The standard of proof should be relaxed to the preponderance of the evidence, rather than the previous higher bar of clear and convincing evidence.
3. De novo review for abuse of discretion was deemed unwarranted, thereby giving more deference to the district court’s first impression on willfulness.
While the Court’s guidance is still that enhanced damages should be limited to egregious cases of deliberate disregard of the patentee’s IP rights, this ruling will nevertheless make obtaining them a bit less daunting.
Median jury award is 14x–20x greater than bench over the last 15 years

PwC | 2017 Patent Litigation Study 11
Reasonable royalties vs. lost profits How are patent holders most often compensated for infringement?
Among practicing entities, reasonable-royalty-only awards are still the type of damages most frequently awarded in patent cases—almost three times as often as lost-profits-only awards. Hybrid awards, where both lost profits and reasonable royalties are awarded together, are less often awarded.
So why the strong preference for reasonable royalties over lost profits? The main reasons:
• 21% of our identified cases involve NPEs, which are ineligible for lost profits damages.
• Even patentees eligible for lost profits awards might eschew lost profits claims—they may not want to risk disclosing the proprietary cost and profit information necessary for the calculation of lost profits.
• Lost profits entitlement can be more difficult to establish. As the proliferation of competition and specialized distribution channels disrupts many industries (pharmaceutical, consumer products), there is greater access to substitute products. Therefore, even without an alleged infringer’s products on the market, consumers may not have purchased the patentee’s covered product.
26%
60%
14%
1997−2006
21%
61%
19%
2007−2016
Lost profits onlyReasonable royalties onlyLost profits and reasonable royalties
Fig 7: Composition of damages awards (practicing entities only)
Damages
PwC | 2017 Patent Litigation Study 12
Apple v. Samsung: Supreme Court Weighs in on Design Patents
Design patent damages have been a hot topic of discussion since August 2012, when a California jury awarded Apple significant damages in its lawsuit against Samsung—with a large portion of the damages based on Samsung’s entire profits on accused smartphones. At issue is the difference between damages law for infringement of design patents (35 U.S. Code § 289) versus other patents (35 U.S. Code § 284).
In a unanimous 8-0 decision, the Supreme Court reversed the Federal Circuit and threw out Apple’s nearly $400 million in damages. The case went back to District Court, after the Federal Circuit remanded it for further consideration of what damages are appropriate in light of the Supreme Court’s decision. This will likely necessitate a third trial in the ongoing Apple v. Samsung saga.
Design patents and available damagesAccording to the US Patent and Trademark Office (USPTO), the claimed subject matter of a design patent is the design embodied in or applied to an article of manufacture (or portion thereof)—and not the article itself. The design consists of the visual characteristics embodied in or applied to an article.
A patentee claiming infringement of a design patent can recover damages under § 284 or § 289. Traditionally better known, § 284 calls for actual damages suffered by the patent holder (e.g., lost profits, price erosion) but not less than a reasonable royalty to compensate for infringement. Critically, damages under § 284 require an apportionment between the patented invention and other components, unless the patented element drives the sale of the entire apparatus—including unpatented components—and hence qualifies for the “entire market value rule”.
In contrast, § 289 allows for a design patent holder to claim the infringer’s entire profits as damages. Prior to the Supreme Court’s ruling, District Court and Federal Circuit decisions interpreted the language under § 289 to include the entirety of an infringer’s profits, even if the design patent only relates to one component among many others.
Damages
PwC | 2017 Patent Litigation Study 13PwC | 2017 Patent Litigation Study 13
Damages
What did the Court say? Apportionment is likely on its wayThe Supreme Court held that for “a multicomponent product, the relevant ‘article of manufacture’ for arriving at a § 289 damages award need not be the end product sold to the consumer but may be only a component of that product.” This seemingly aligns § 284 and § 289 damages, suggesting the requirement of apportionment of damages to the relevant patented and unpatented components.
The question in the Apple v. Samsung matter remains, however: what is the “article of manufacture” in the context of the design patents involved? These issues still need to be resolved and will be taken up by the District Court on remand.
Design patent growth and the road aheadInterestingly, USPTO data shows that since the first Apple v. Samsung jury award in 2012, both design patent applications and design patents issued are growing at a faster rate than other patents. Between October 2012 and September 2016, design patent applications grew by a compound annual growth rate of 7.4% (compared to 4.6% for other patents). Similarly, issuances of design patents outpaced other patents (4.8% for design patents versus 2.5% for other patents) over the same time period.
Is the recent uptick in design patent activity related to the Apple v. Samsung litigation, in that it brought attention to the broader design patent remedies available? Will we continue to see similar trends? Or will the effect of the Supreme Court decision to align damages be to cool off design patent filings? We shall see…

PwC | 2017 Patent Litigation Study 14
Success rates decline modestly, while gap remains large
Over the last 20 years, patent holders have enjoyed 22–33% higher trial success rates with juries than with the bench. However, success rates for both the bench and juries have declined slightly over the most recent 15 years.
Success rates: How are jury and bench trials faring?
Patentees’ success rates with juries are substantially higher than with the bench. This success gap is even more pronounced for non-practicing entities (NPEs).41%
77% 76%
52%
74%74%
53%55%
Bench Jury
1997−2001 2007−20112002−2006 2012−2016
Fig 8: Trial success rates: bench vs. jury
PwC | 2017 Patent Litigation Study 15
Success rates
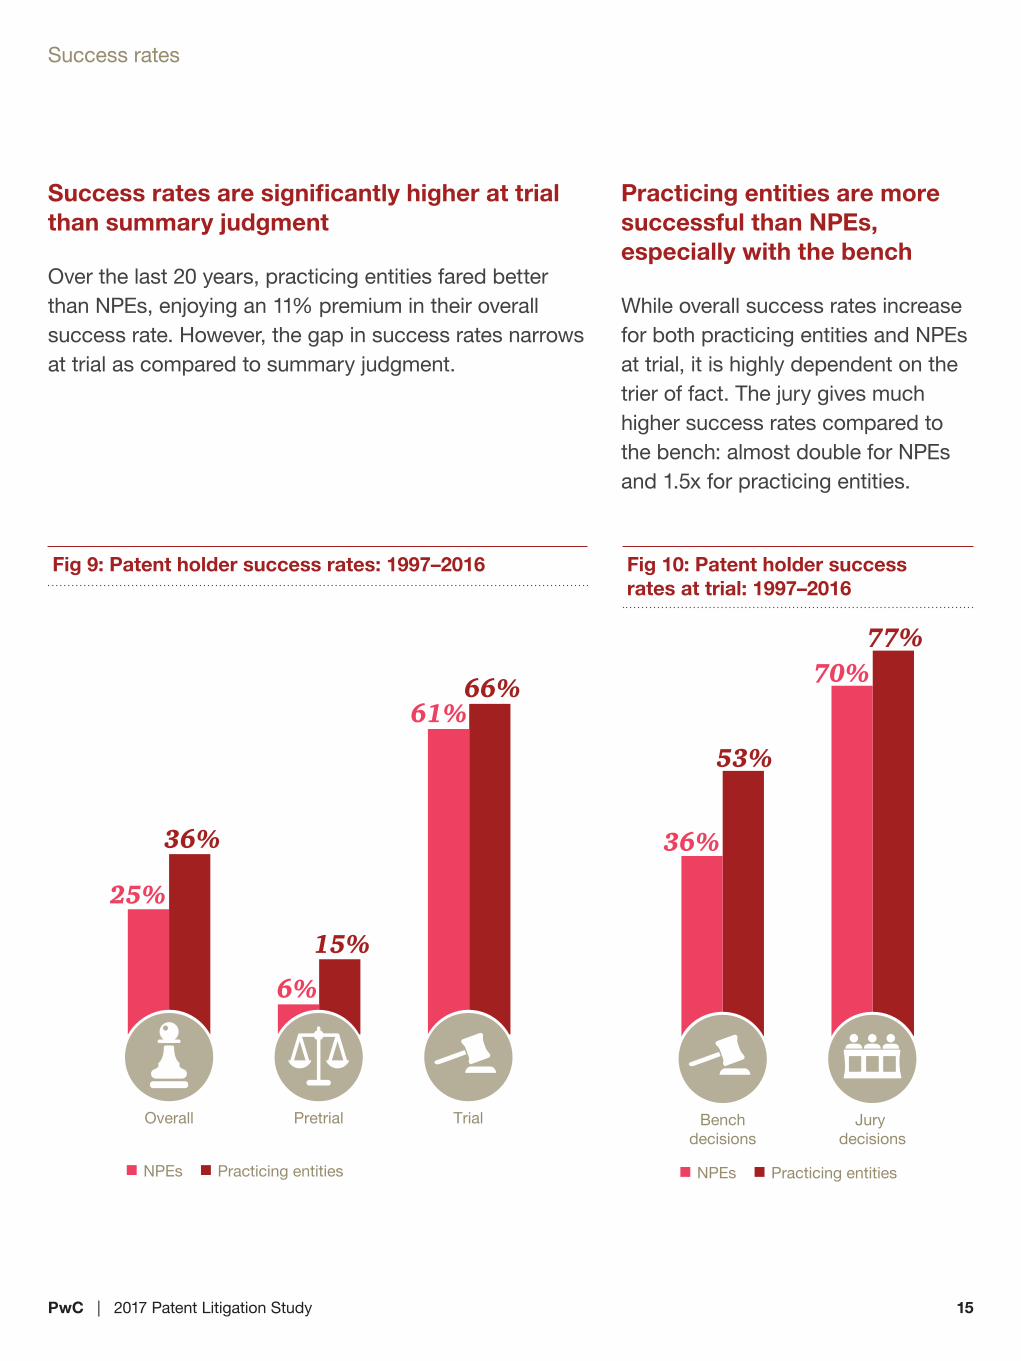
Fig 9: Patent holder success rates: 1997–2016
66%61%
Trial
15%
6%
Pretrial
36%
25%
Overall
NPEs Practicing entities
Fig 10: Patent holder success rates at trial: 1997–2016
77%70%
Jury decisions
53%
36%
Benchdecisions
NPEs Practicing entities
Success rates are significantly higher at trial than summary judgment
Over the last 20 years, practicing entities fared better than NPEs, enjoying an 11% premium in their overall success rate. However, the gap in success rates narrows at trial as compared to summary judgment.
Practicing entities are more successful than NPEs, especially with the bench
While overall success rates increase for both practicing entities and NPEs at trial, it is highly dependent on the trier of fact. The jury gives much higher success rates compared to the bench: almost double for NPEs and 1.5x for practicing entities.
PwC | 2017 Patent Litigation Study 16
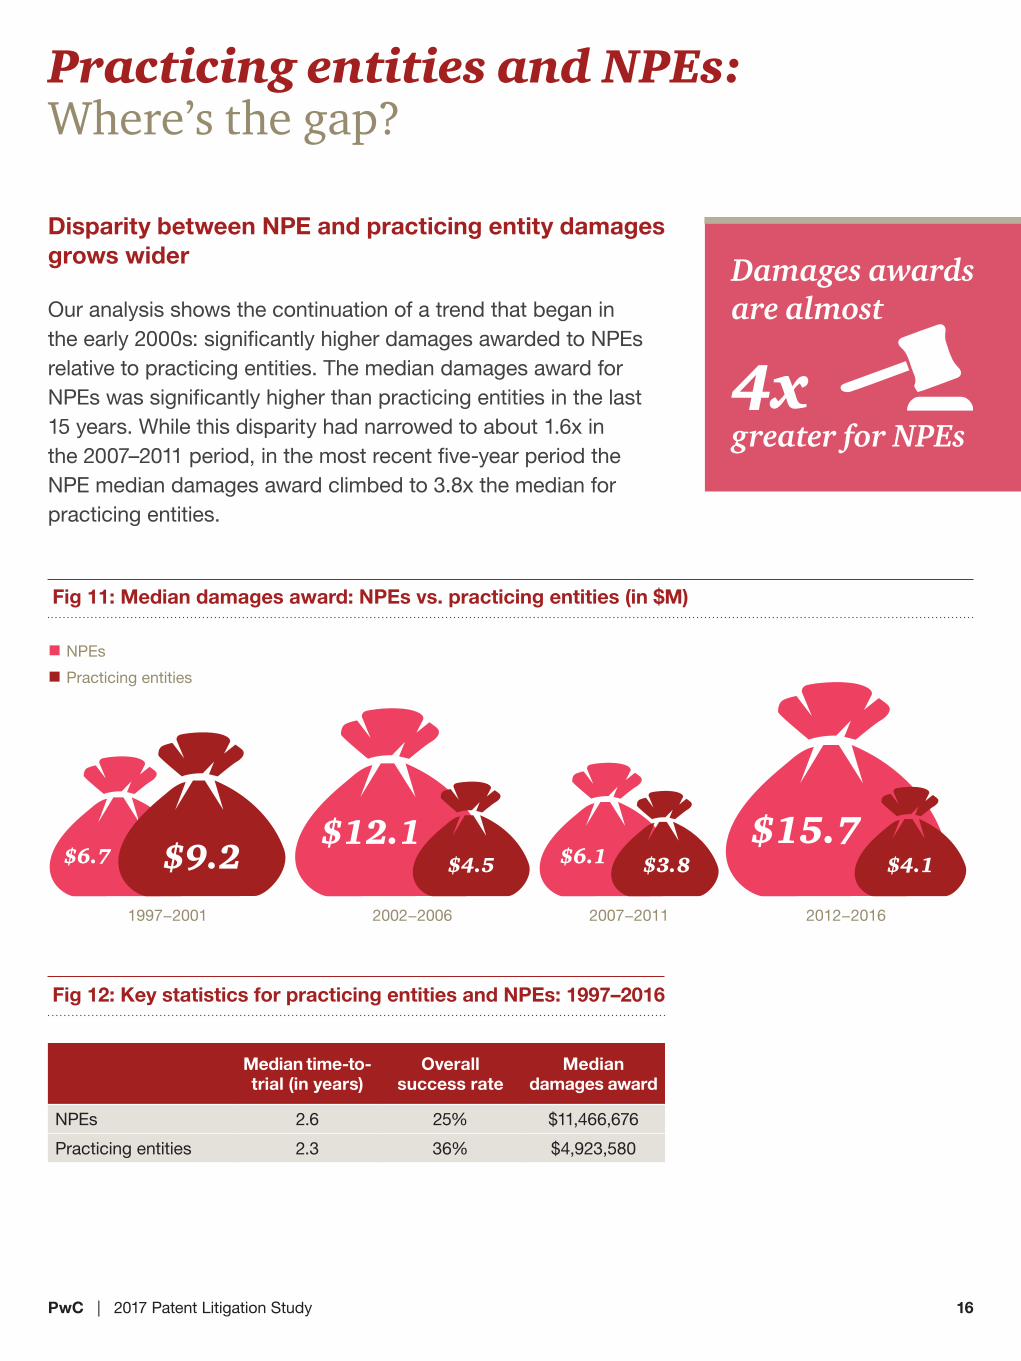
Disparity between NPE and practicing entity damages grows wider
Our analysis shows the continuation of a trend that began in the early 2000s: significantly higher damages awarded to NPEs relative to practicing entities. The median damages award for NPEs was significantly higher than practicing entities in the last 15 years. While this disparity had narrowed to about 1.6x in the 2007–2011 period, in the most recent five-year period the NPE median damages award climbed to 3.8x the median for practicing entities.
Practicing entities and NPEs: Where’s the gap?
Fig 12: Key statistics for practicing entities and NPEs: 1997–2016
Median time-to-trial (in years)
Overall success rate
Median damages award
NPEs 2.6 25% $11,466,676
Practicing entities 2.3 36% $4,923,580
Damages awards are almost
4x greater for NPEs
Fig 11: Median damages award: NPEs vs. practicing entities (in $M)
NPEs
Practicing entities
1997−2001 2002−2006 2007−2011 2012−2016
$9.2$6.7$12.1
$4.5 $6.1 $3.8$15.7
$4.1
PwC | 2017 Patent Litigation Study 17
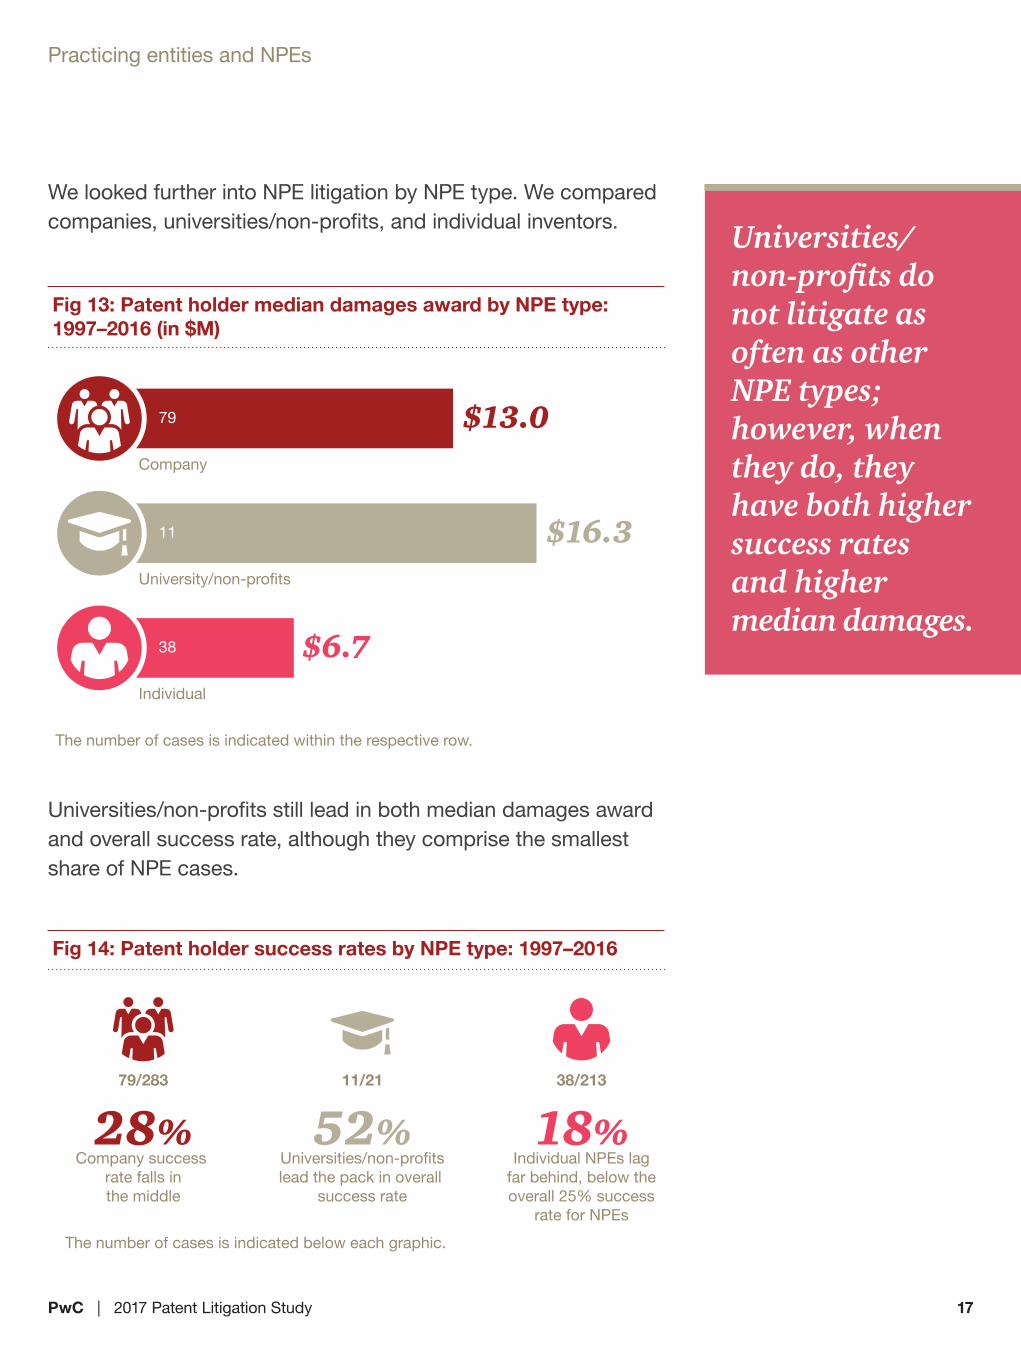
We looked further into NPE litigation by NPE type. We compared companies, universities/non-profits, and individual inventors.
Practicing entities and NPEs
The number of cases is indicated within the respective row.
Company
University/non-profits
Individual
79
11
38
$13.0
$16.3
$6.7
Fig 13: Patent holder median damages award by NPE type: 1997–2016 (in $M)
Universities/non-profits still lead in both median damages award and overall success rate, although they comprise the smallest share of NPE cases.
11/21
52%Universities/non-profitslead the pack in overall
success rate
79/283
28%Company success
rate falls inthe middle
38/213
18%Individual NPEs lag
far behind, below theoverall 25% success
rate for NPEs
The number of cases is indicated below each graphic.
Fig 14: Patent holder success rates by NPE type: 1997–2016
Universities/non-profits do not litigate as often as other NPE types; however, when they do, they have both higher success rates and higher median damages.
PwC | 2017 Patent Litigation Study 18
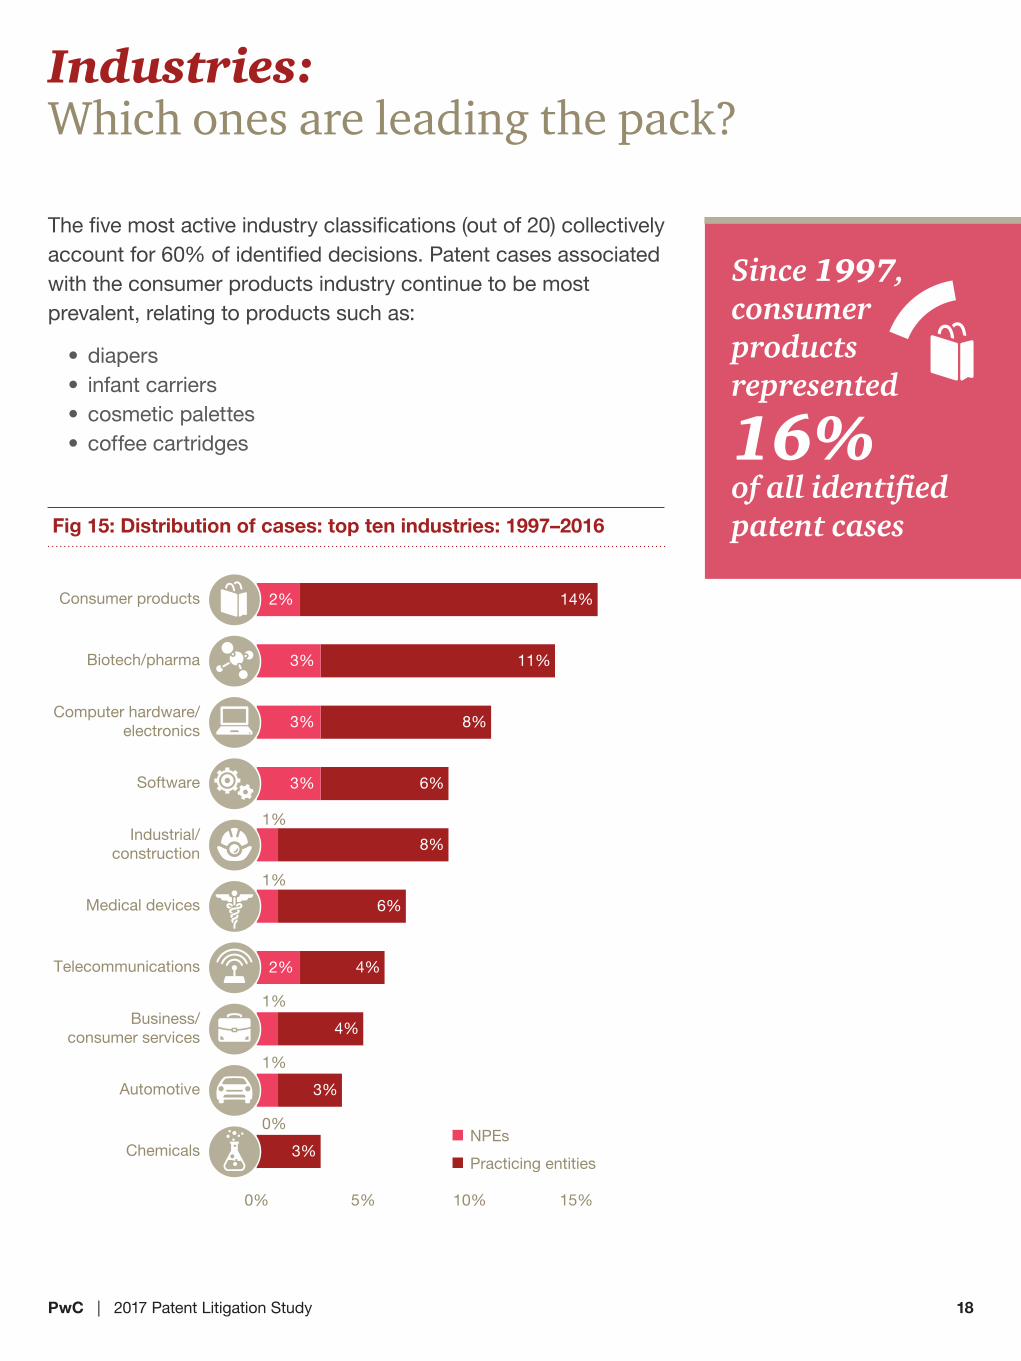
The five most active industry classifications (out of 20) collectively account for 60% of identified decisions. Patent cases associated with the consumer products industry continue to be most prevalent, relating to products such as:
• diapers• infant carriers• cosmetic palettes• coffee cartridges
Industries: Which ones are leading the pack?
0% 5% 10% 15% 20%
Chemicals
Automotive
Business/consumer services
Telecommunications
Medical devices
Industrial/construction
Software
Computer hardware/electronics
Biotech/pharma
Consumer products
4%
4%
6%
3%
8%
11%
14%
8%
6%
3%
1%
2%
1%
1%
3%
3%
2%
1%
3%
0%NPEs
Practicing entities
Fig 15: Distribution of cases: top ten industries: 1997–2016
Since 1997, consumer products represented
16% of all identified patent cases

PwC | 2017 Patent Litigation Study 19
Although patents associated with the consumer products industry represented the largest percentage of identified decisions, their median damages award was among the lowest of all industries.
In a change, the medical device industry surpassed biotech/pharma (the longtime leader) for highest median damages. Along with telecommunications, these industries continue to experience significantly higher median damages awards than other industries. These industries tend to include capital-intensive businesses that require significant research and development or technology infrastructure. They also entail generally higher sales and margins, which translates to larger damages.
Industries
$0 $5 $10 $15 $20
Chemicals
Automotive
Business/consumer services
Telecommunications
Medical devices
Industrial/construction
Software
Computer hardware/electronics
Biotech/pharma
Consumer products
20
39
58
20
88
27
87
50
44
16
The number of identified decisions is indicated within the respective row.
Median damages awarded (in $M)
Median damages for allindustries is about $5.8M
Fig 16: Median damages award: top ten industries: 1997–2016
The number of identified decisions with damages is indicated within the respective row.
Medical devices take the #1 spot for highest median damages award
PwC | 2017 Patent Litigation Study 20
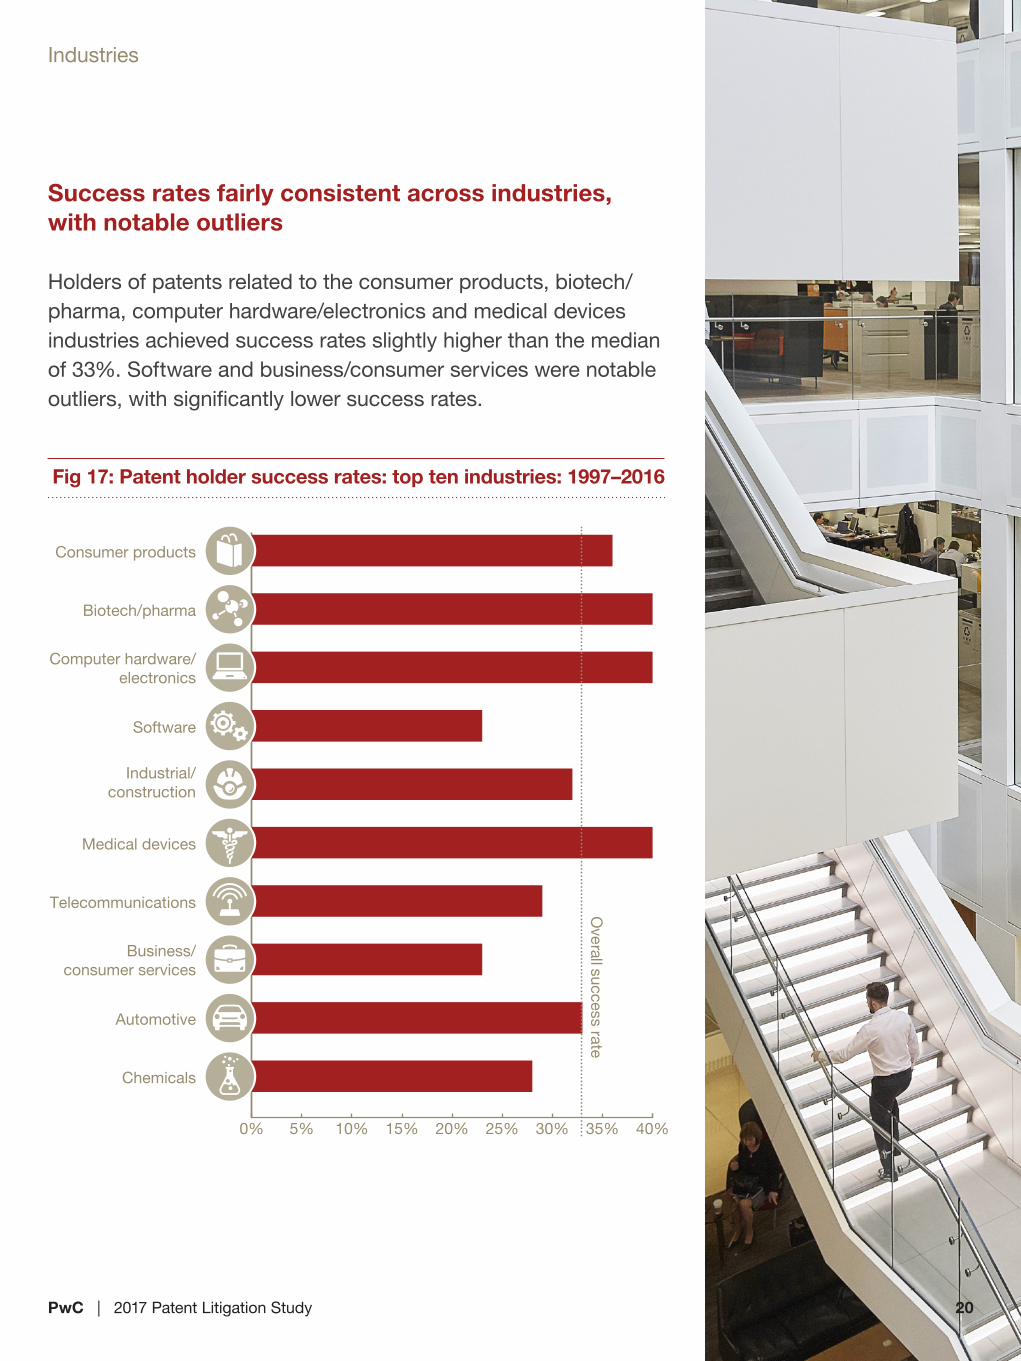
0% 5% 10% 15% 20% 25% 30% 35% 40%
Chemicals
Automotive
Business/consumer services
Telecommunications
Medical devices
Industrial/construction
Software
Computer hardware/electronics
Biotech/pharma
Consumer products
Overall success rate
Fig 17: Patent holder success rates: top ten industries: 1997–2016
Success rates fairly consistent across industries, with notable outliers
Holders of patents related to the consumer products, biotech/pharma, computer hardware/electronics and medical devices industries achieved success rates slightly higher than the median of 33%. Software and business/consumer services were notable outliers, with significantly lower success rates.
Industries
20

PwC | 2017 Patent Litigation Study 21
Industries
How well are you protecting your IP, brand and reputation?
The conditions that surround your intellectual property, your brand and your reputation are increasingly treacherous. Counterfeit and pirated goods are entering countries from air, land and sea, infiltrating legitimate supply chains and exceeding the ability of brands to deal with them adequately. Cyber attacks—threatening both your IP and your reputation—are a threat that seems to grow by the day. Online media is a game-changer as a major conduit for collecting and disseminating information—be it accurate, inaccurate or malicious.
And economic crime continues unabated. Thirty-eight percent of US companies say they’ve been victimized by fraud over the last 24 months—with 64% saying that the primary impact of the crime was on the strength of their brand and reputation. What’s more, one in four expect to experience intellectual property infringement in the next two years.2
In the face of this complex of threats, how do you protect your brand and IP?
Many leading companies are turning to global intelligence to monitor risks, opportunities and dangers emerging via social media, online communities, news sites and dark webs. They’re also using these tools to assess public sentiment and brand perception to uncover potential blind spots. Global intelligence can help you answer critical questions such as:
• What are your customers and competitors saying about you?
• Who are key influencers and drivers of the conversation around your brand integrity?
• How should you flag adverse posts such as potential risks and threats to your reputation?
• How is the public responding to your brand, and how can you react?
• What threat actors are going undetected?
• How will foreign political risk affect your organization?
To learn how PwC can help you leverage global intelligence to protect your reputation and safeguard your assets, click here.
2 Source: PwC’s Global Economic Crime Survey 2016. PwC, 2016.

PwC | 2017 Patent Litigation Study 22
Certain jurisdictions (Delaware, Texas Eastern and Virginia Eastern) continue to be more favorable venues for patent holders, with shorter time-to-trial, higher success rates and/or greater median damages awards. Delaware and Texas Eastern are also two of the most popular venues for patent infringement litigation based on the number of identified decisions.
Venue for patent infringement matters has become a hot topic, as the Supreme Court granted certiorari in TC Heartland v. Kraft Foods in late 2016 [see sidebar]. The significant differences between districts certainly adds another facet to the venue debate.
The table below shows the 15 most active districts and their categorical rankings for the number of identified decisions, overall success rate, median damages award, and median time-to-trial.
Fig 18: District Court rankings: 1997–2016
Overall rank District Case
Count RankOverall
success rate
RankMedian
damages award
RankMedian
time-to-trial (in years)
Rank
1 Delaware 285 1 41% 4 $16,162,113 4 2.1 5
2 Texas Eastern 195 3 54% 1 $9,948,569 5 2.2 8
3 Virginia Eastern 59 9 29% 11 $32,684,334 2 1.0 1
4 Wisconsin Western 44 12 39% 5 $8,005,377 6 1.2 2
5 New Jersey 110 6 38% 6 $16,164,179 3 2.7 13
6 Florida Middle 46 11 50% 2 $497,782 15 1.9 3
7 Texas Southern 56 10 23% 14 $58,075,564 1 2.1 7
8 California Northern 216 2 27% 12 $5,402,099 9 2.6 12
9 Texas Northern 43 13 47% 3 $4,793,384 10 2.4 10
10 Massachusetts 82 8 33% 7 $7,268,728 7 3.5 14
11 Florida Southern 43 13 30% 8 $3,084,469 11 2.1 6
12 New York Southern 140 5 29% 9 $2,217,004 13 2.5 11
13 California Central 110 6 26% 13 $3,066,008 12 2.3 9
14 Illinois Northern 154 4 21% 15 $6,086,198 8 3.7 15
15 California Southern 41 15 29% 10 $1,953,464 14 1.9 4
Overall (all decisions identified)
2,446 33% $5,783,407 2.4
The overall ranks for these courts are based on their relative ranking for each of the four measures, equally weighted.
Across districts: Results may vary?
Will venue shopping for patent infringement suits become so yesterday?
The days of venue shopping may be over—or not—as the Supreme Court granted TC Heartland’s petition for certiorari on December 14, 2016.
In January 2014, Kraft Foods Group accused Indiana-based TC Heartland, of infringing Kraft’s patents for low-calorie sweeteners. Kraft filed the suit in Delaware, but Heartland filed a motion to either dismiss the action or transfer venue to the Southern District of Indiana (where it is headquartered). Heartland argued that it had no local presence in Delaware, and it does not actively seek business in Delaware. However, evidence established that Heartland shipped orders of the accused products into Delaware under contracts with two national accounts.
Both the district court and the Federal Circuit rejected Heartland’s theory that it did not “reside” in Delaware for venue purposes. They also rejected the contention that the court in Delaware lacked specific personal jurisdiction, essentially affirming the current interpretations of 28 U.S.C. §§ 1391 and 1400(b), which hinge on the defendant’s residence in the district and/or that the defendant has committed acts of infringement in the district (e.g., sold the alleged infringing product in the district).
Given that many defendants sell their products nationally, the current interpretation of 28 U.S.C. §§ 1391 and 1400(b) has allowed plaintiffs to “venue shop,” selecting a venue that provides an advantage to the plaintiff.
Our data supports that venue shopping is going strong, with districts such as Texas Eastern continuing to be favored by NPEs (likely due to higher-than-average success rates) and “rocket dockets” like Virginia Eastern continuing to be popular with plaintiffs. Delaware also continues to be popular, but it is unclear if its popularity derives from its experienced judges, shorter-than-average time-to-trial, and higher-than-average success rates and damages—or from the fact that many companies are incorporated in Delaware.
How will the Court rule? What impact will their decision have on venue shopping? If the Court shifts to a stricter interpretation to determine whether the defendant “resides in the district,” will this resolve the disproportionate spread of cases across districts? Or will a new district, perhaps DE, SD-NY or ND-CA, become the new hot venue? The decision could come very soon.
PwC | 2017 Patent Litigation Study 23
Across districts

PwC | 2017 Patent Litigation Study 24
Across districts
Cases with NPEs as patent holders are concentrated in a few districts. Out of 94 total districts, the five with the most identified decisions involving NPEs accounted for 46% of all such decisions—and the top ten districts accounted for 60%. The most active NPE districts remained consistent, indicating steady concentration of NPE cases in certain courts.
But the data does not point to a clear correlation between number of identified NPE decisions in a district and relative NPE success rates. Texas Eastern, with the most identified NPE cases by far, also has one of the highest success rates—almost double the NPE average. Delaware, with the second-most identified NPE cases, has success rates in line with the NPE average. However, the next three districts in NPE case counts yielded significantly lower success rates than the NPE average.
NPEs continue to strongly favor the Eastern District of Texas, where NPE success rates almost double the NPE average.
Includes districts with at least 10 identified decisions involving an NPE as the patent holder.
District Decisions involving NPEs
Total identified decisions
NPE % of total decisions
NPE success rate
Texas Eastern 74 195 38% 49%
Delaware 45 285 16% 27%
California Northern 44 216 20% 14%
Illinois Northern 42 154 27% 12%
New York Southern 31 140 22% 16%
California Central 24 110 22% 29%
Massachusetts 14 82 17% 36%
Texas Northern 13 43 30% 69%
Texas Southern 12 56 21% 8%
Virginia Eastern 12 59 20% 17%
Florida Southern 11 43 26% 9%
Florida Middle 11 46 24% 55%
New Jersey 10 110 9% 30%
All identified decisions 517 2,446 21% 25%
Fig 19: District courts with most identified decisions with NPE as patent holder: 1997–2016
PwC | 2017 Patent Litigation Study 25
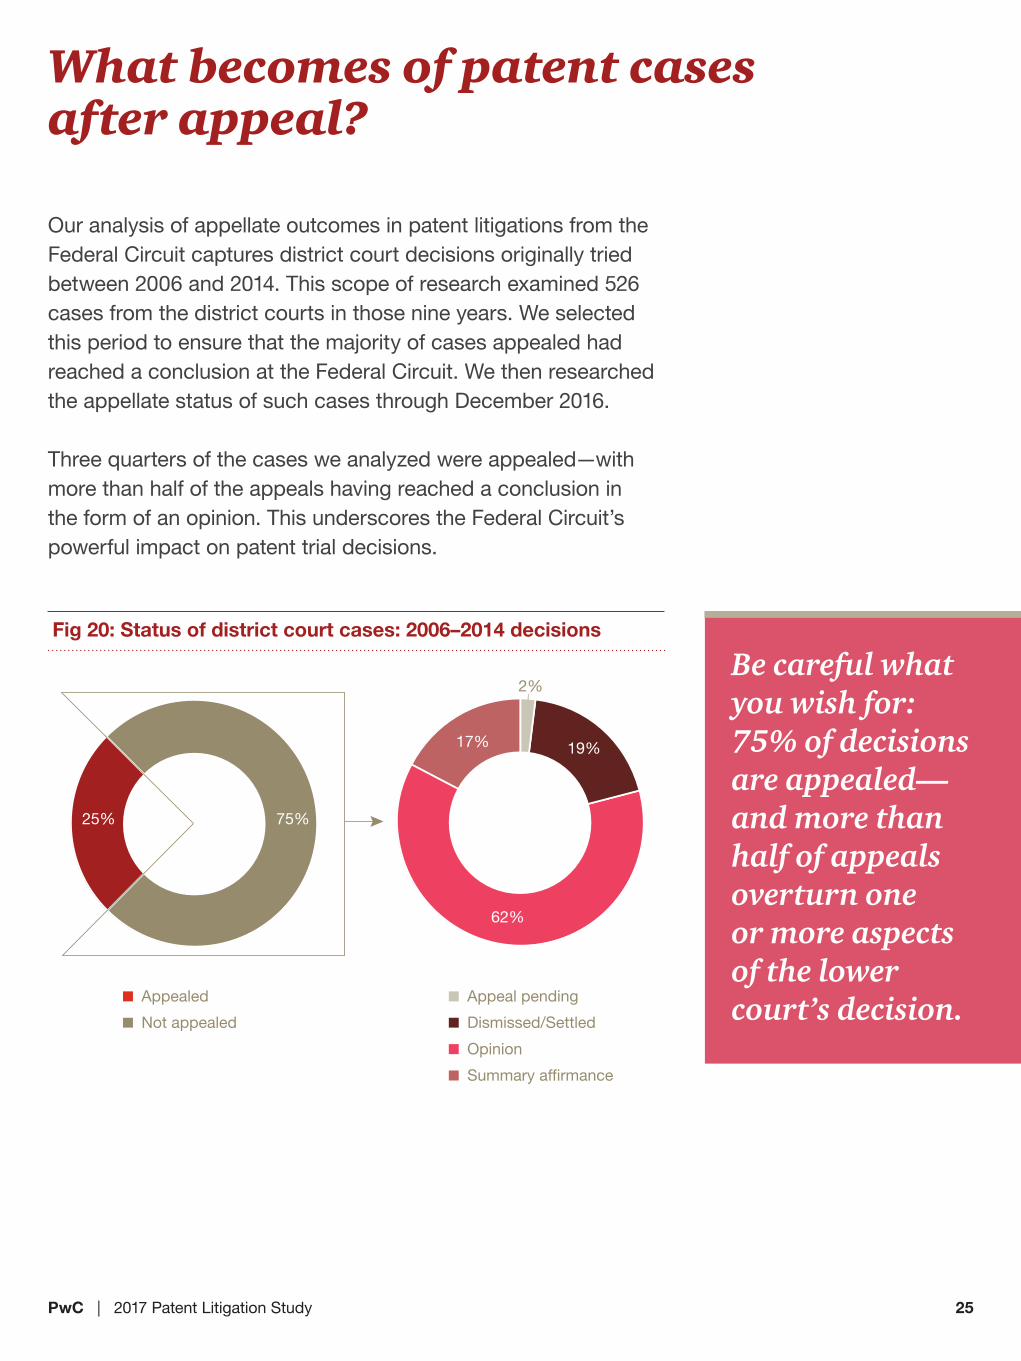
Our analysis of appellate outcomes in patent litigations from the Federal Circuit captures district court decisions originally tried between 2006 and 2014. This scope of research examined 526 cases from the district courts in those nine years. We selected this period to ensure that the majority of cases appealed had reached a conclusion at the Federal Circuit. We then researched the appellate status of such cases through December 2016.
Three quarters of the cases we analyzed were appealed—with more than half of the appeals having reached a conclusion in the form of an opinion. This underscores the Federal Circuit’s powerful impact on patent trial decisions.
What becomes of patent cases after appeal?
17%
2%
19%
25% 75%
Appealed
Not appealed
Appeal pending
Dismissed/Settled
Opinion
Summary affirmance
62%
Fig 20: Status of district court cases: 2006–2014 decisions
Be careful what you wish for: 75% of decisions are appealed—and more than half of appeals overturn one or more aspects of the lower court’s decision.

PwC | 2017 Patent Litigation Study 26
What becomes of patent cases after appeal?
Both winners and losers continue to appeal to the Federal Circuit
Our study found that post-trial, the alleged infringer appeals more often overall (29% individually) than the patent holder (21% individually). Patent holders win more often at trial (66% trial win rate in 2006–2016), and thus have less reason to appeal than the losing party.
The perspective of who won and who lost at trial gives a more nuanced view of frequency of appeals by side.
• “Losers” Based on our data, losing patent holders appeal more often (43% individually) than losing alleged infringers (39% individually).
• “Winners” Ten percent of successful patent holders and eight percent of successful alleged infringers appeal individually. This demonstrates that even a favorable outcome at the district court can leave a party not fully satisfied—whether on issues involving the patent claims, product and territory coverage, damages awarded, pre-/post-judgment interest, enhanced damages, or permanent injunction.
Overall, 26% of district court cases were appealed by both parties.
Patent holder successat district court
Patent holder lossat district court
Overall
27% 21% 8% 43%
25% 26% 29% 21%
23% 28% 39% 10%
Not appealedBoth parties appealedAlleged infringer appealedPatent holder appealed
Fig 21: Appeals after district court decisions: 2006–2014
PwC | 2017 Patent Litigation Study 27
What becomes of patent cases after appeal?
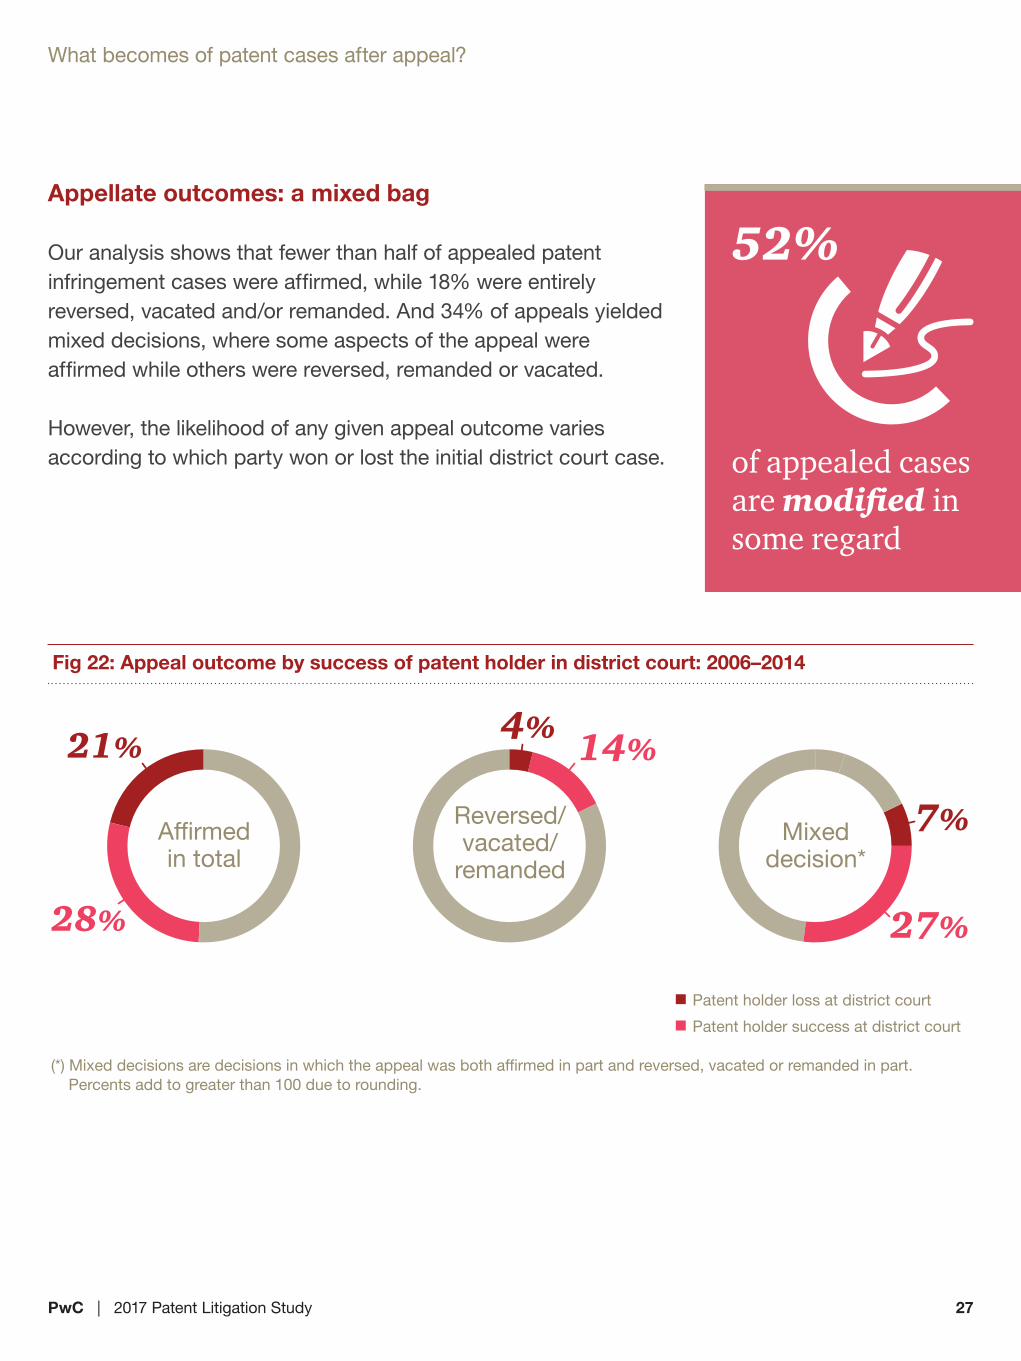
Appellate outcomes: a mixed bag
Our analysis shows that fewer than half of appealed patent infringement cases were affirmed, while 18% were entirely reversed, vacated and/or remanded. And 34% of appeals yielded mixed decisions, where some aspects of the appeal were affirmed while others were reversed, remanded or vacated.
However, the likelihood of any given appeal outcome varies according to which party won or lost the initial district court case.
52%
of appealed cases are modified in some regard
Affirmedin total
28%
21%
Reversed/vacated/
remanded
14%4%
Mixeddecision*
27%
7%
Patent holder loss at district court
Patent holder success at district court
(*) Mixed decisions are decisions in which the appeal was both affirmed in part and reversed, vacated or remanded in part. Percents add to greater than 100 due to rounding.
Fig 22: Appeal outcome by success of patent holder in district court: 2006–2014

PwC | 2017 Patent Litigation Study 28
What becomes of patent cases after appeal?
Forensic Technology Solutions: Enabling faster, more efficient, more strategic case review
For this year’s report, we departed from our traditional manual review method and used our technology team for help in redesigning our process. As a direct outcome, we have enhanced our research methodologies and workflows, which has proved to be significantly faster and more efficient.
A successful patent litigation case requires significant research legwork in case retrieval, review and analysis, as is the case with this study. Broadly speaking, that workload can be divided into two segments:
• Structured data. Reviewing all patent litigation decisions, and extracting and filtering the basic data—judge, court, year, type, industry, subject matter—for relevant data points.
• Unstructured data. Zeroing in on and analyzing more nuanced information needed to inform a legal strategy.
Traditionally for this study, both layers of review have had to be accomplished manually—not only a time-consuming task, but one prone to errors requiring many layers of review. This year we leveraged robust new technology tools that simplified and improved the quality, speed and accuracy of the review, saving time and money in the process.
PwC’s document processing tools and techniques helped us extract metadata from judgments, index their content and categorize the judgments to streamline review, stratify them into multi-level review teams, and even create a custom content-extraction program to collect additional document metadata as needed.
This technology also helped us to manage the review process—from first capture to comments from subsequent readers and reviewers—creating an audit trail, while enabling greater efficiency and transparency.
Learn more about PwC’s Forensics Technology Solutions by visiting www.pwc.com/us/forensics
PwC | 2017 Patent Litigation Study 29
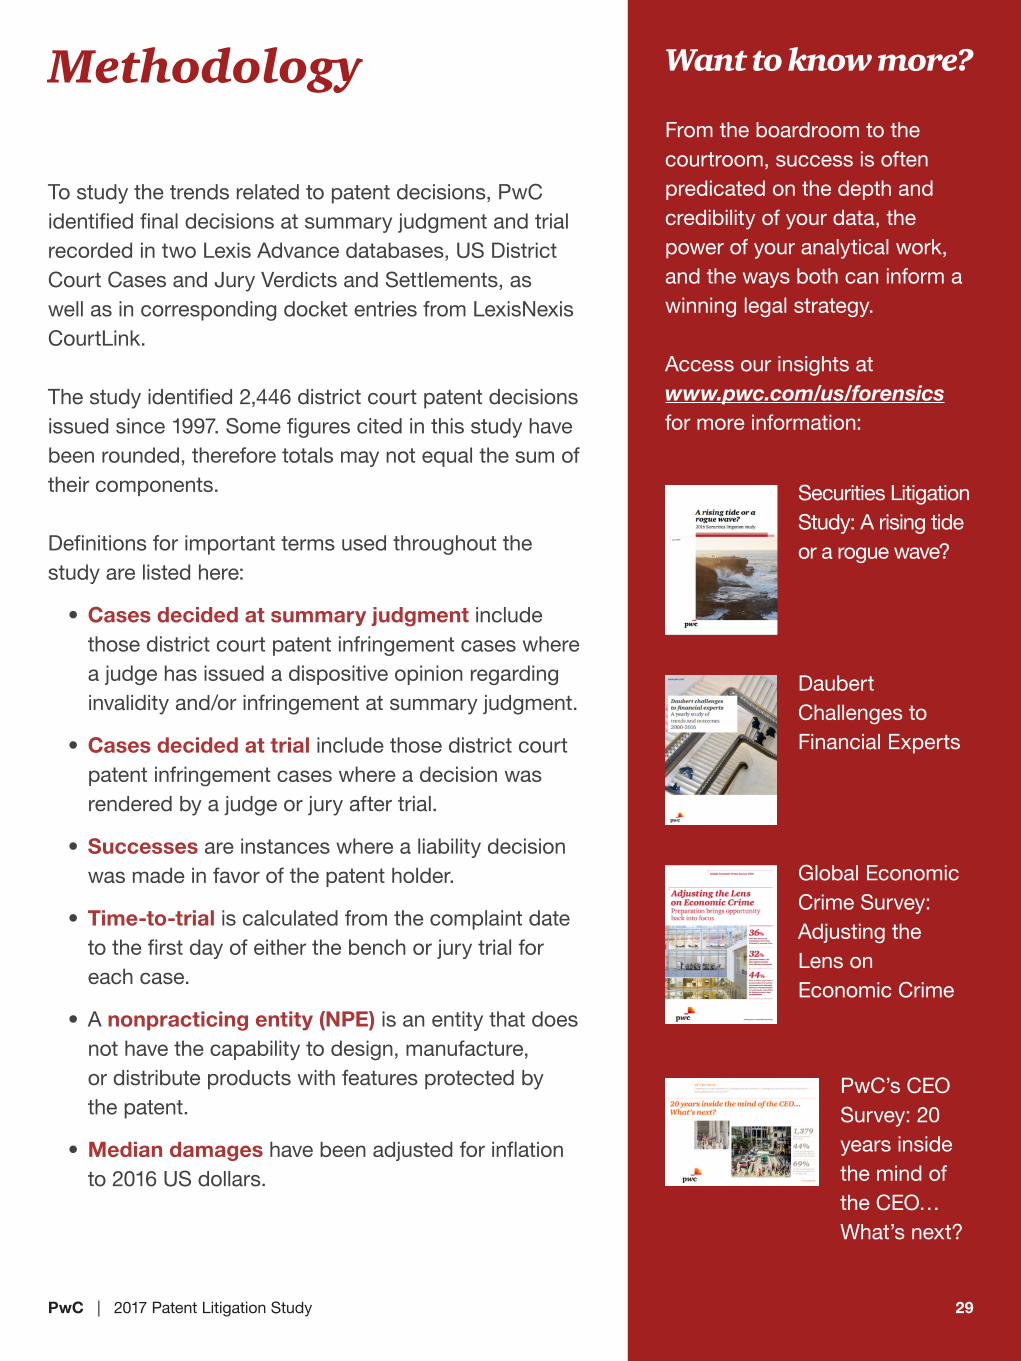
To study the trends related to patent decisions, PwC identified final decisions at summary judgment and trial recorded in two Lexis Advance databases, US District Court Cases and Jury Verdicts and Settlements, as well as in corresponding docket entries from LexisNexis CourtLink.
The study identified 2,446 district court patent decisions issued since 1997. Some figures cited in this study have been rounded, therefore totals may not equal the sum of their components.
Definitions for important terms used throughout the study are listed here:
• Cases decided at summary judgment include those district court patent infringement cases where a judge has issued a dispositive opinion regarding invalidity and/or infringement at summary judgment.
• Cases decided at trial include those district court patent infringement cases where a decision was rendered by a judge or jury after trial.
• Successes are instances where a liability decision was made in favor of the patent holder.
• Time-to-trial is calculated from the complaint date to the first day of either the bench or jury trial for each case.
• A nonpracticing entity (NPE) is an entity that does not have the capability to design, manufacture, or distribute products with features protected by the patent.
• Median damages have been adjusted for inflation to 2016 US dollars.
Methodology Want to know more?
From the boardroom to the courtroom, success is often predicated on the depth and credibility of your data, the power of your analytical work, and the ways both can inform a winning legal strategy.
Access our insights at www.pwc.com/us/forensics for more information:
Securities Litigation Study: A rising tide or a rogue wave?
PwC’s CEO Survey: 20 years inside the mind of the CEO… What’s next?
29
Daubert Challenges to Financial Experts
Global Economic Crime Survey: Adjusting the Lens on Economic Crime

PwC | 2017 Patent Litigation Study 30
Authors
Ronen Arad is a Director in PwC’s Forensic Services practice. Mr. Arad has been involved in many aspects of complex financial analyses and forensic assessments, both in the normal course of business and in the context of litigation. He has worked extensively in the intellectual property field, including quantifying damages in infringement and misappropriation actions, performing royalty inspections for licensors in a range of industries, and valuing intellectual property. Mr. Arad is a Chartered Financial Analyst (CFA) charter-holder and holds a BS degree in commerce, with concentrations in finance and accounting, from the University of Virginia.
Landan Ansell is a Manager in PwC’s Forensic Services practice. He provides financial, economic, and accounting advice and often consults with clients involved in disputes, investigations and other complex matters. Mr. Ansell has over ten years of experience assisting clients by providing financial and economic analysis and forensic accounting services, both in the normal course of business and in the context of litigation and regulatory investigations. Mr. Ansell is a CPA and holds a BBA with a concentration in accounting from Emory University. He also holds a JD from Georgia State University’s College of Law.
Chris Barry is a partner with 33 years of experience in PwC’s Forensic Services practice. Mr. Barry has worked extensively in the intellectual property field, including damage quantification and testimony in infringement actions, determining reasonable royalty rates, valuing IP for transaction and financial reporting purposes, and performing royalty inspections for licensors with running rate agreements. Mr. Barry has testified at trial more than 65 times as an expert witness. He is a Certified Public Accountant (CPA), holding the AICPA credential of Certified in Financial Forensics. He earned a BA in accounting from Franklin & Marshall College and an MBA from the University of California at Berkeley.

PwC | 2017 Patent Litigation Study 31
Authors
HyeYun Lee is a Manager in PwC’s Forensic Services practice. Ms. Lee has six years of experience helping clients prevent, confront and remediate regulatory, legal and commercial challenges. Ms. Lee is a Chartered Financial Analyst (CFA) and holds a BBA with a concentration in finance and accounting from Emory University.
Meredith Cartier is a Manager in PwC’s Forensic Services practice. Ms. Cartier has six years of experience in PwC’s Forensic Services practice, assisting clients with complex financial analyses—ranging from quantifying damages related to alleged infringement or misappropriation, to royalty compliance inspections and internal investigations. Ms. Cartier is a CPA and holds a BSBA degree in finance and accounting from Boston University.
The Patent Litigation Study team would like to thank Chris Barry for his leadership in making this report a success. We are thankful for your 33 years of dedication to PwC. Best of luck to you on your future endeavors.
Additionally, the following individuals contributed significantly to this study:
Erica Berry, Julia Chura, Lauren Coleman, Wyllesha Curry, Michelle Daniels, Alexandra Del Valle Betancourt, Samantha Donovan, Adrian Fowler, Heather Fugate, Stephanie Garrison, Valarie Jeffries, Hanbi Lee, Haiyan Lin, Jelena Majkic, Adil Pasha, Matthew Rao, Paul Robinson, Sarah Stanley, Chris Vatti, Jimmy Wang, Nicole Wang, Fareed Yousif, and Iris Zheng.
www.pwc.com/us/forensics
PwC’s Forensic Services’ team of experienced professionals is dedicated to helping clients meet the challenges related to fraud allegations, financial crimes and other irregularities. Our portfolio of services includes: financial crime examinations, forensic technology solutions, regulatory compliance reviews, fraud risk management and fraud prevention, and dispute analysis and litigation support.
Contacts
Chris BarryPartner(617) [email protected]
Ronen AradDirector(678) [email protected]
© 2017 PwC. All rights reserved. PwC refers to the PwC network and/or one or more of its member firms, each of which is a separate legal entity. Please see www.pwc.com/structure for further details. This content is for general information purposes only, and should not be used as a substitute for consultation with professional advisors. At PwC, our purpose is to build trust in society and solve important problems. We’re a network of firms in 157 countries with more than 223,000 people who are committed to delivering quality in assurance, advisory and tax services. Find out more and tell us what matters to you by visiting us at www.pwc.com. 310200-2017 DvL