Embed Size (px)
Citation preview

2017 Predictive Analytics Symposium
Session 29, Predictive Analytics for Inforce Management
Moderator: Rohan Noel Alahakone, ASA, MAAA
Presenters:
Jenny Jin, FSA, MAAA Assaf Mizan
Martin Snow, FSA, MAAA
SOA Antitrust Compliance Guidelines SOA Presentation Disclaimer
SOA Predictive Analytics SeminarSession 29: Predictive Modeling for Inforce Management
Jenny Jin, FSA, MAAA
15, Sept. 2017

Society of Actuaries Predictive Analytics Seminar 2
Agenda
Motivation for Predictive Models in Inforce Management
Examples
Society of Actuaries Predictive Analytics Seminar 3
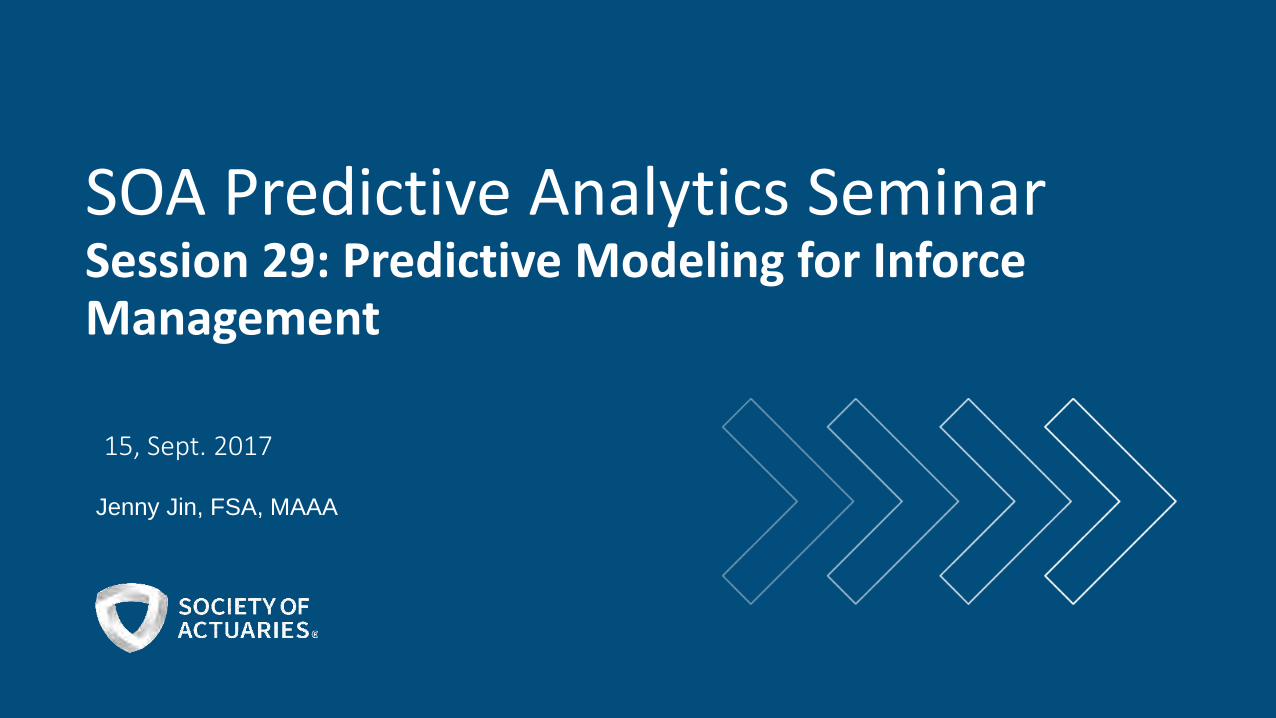
My team
Actuaries
Technology specialists
Business strategists
Data managers
Statisticians
Data scientists
I work with …
My role is …
Society of Actuaries Predictive Analytics Seminar 4
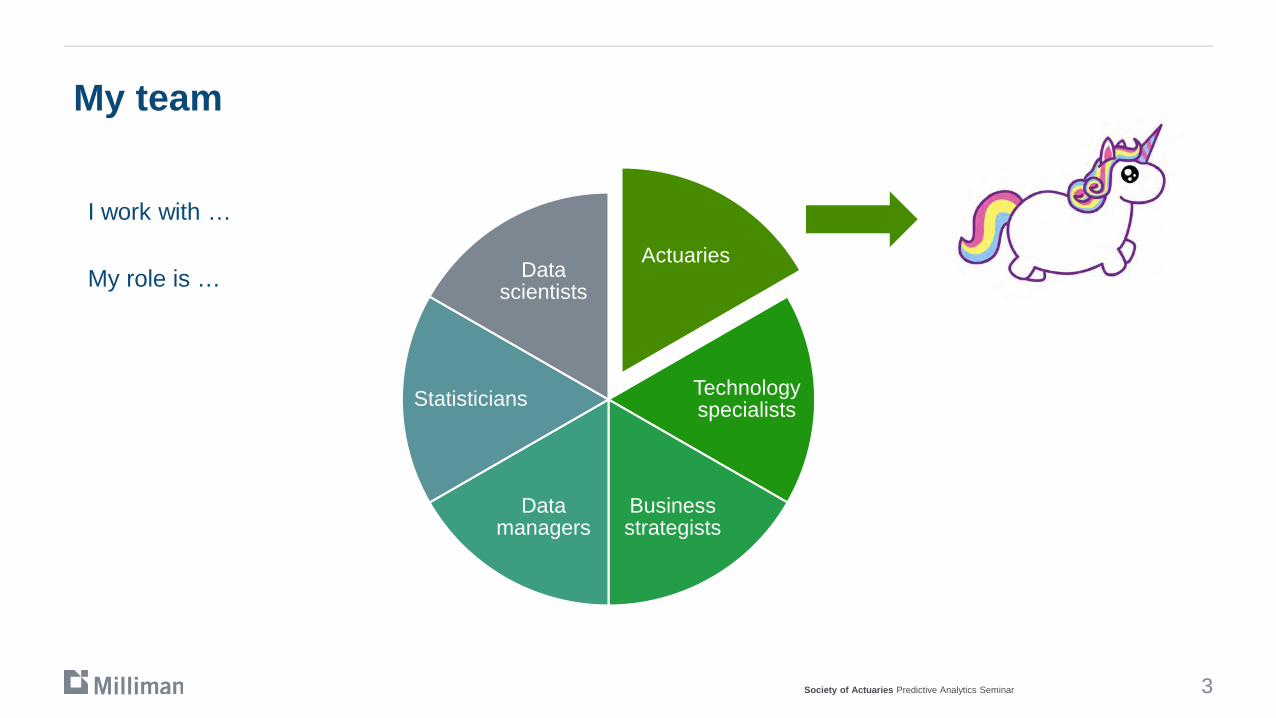
Industry Recognition of the Problem
Moody’s Investors Service Unpredictable Policyholder Behavior Challenges US Life Insurers’ Variable Annuity Business
“Though equity-market declines are generally seen as the biggest risk in VA contracts, most insurers effectively hedge that risk via derivatives. That leaves the less-easily hedged and more unpredictable policyholder behavior, and particularly lapses, as a key driver of the profitability of these popular products.”
“Companies selling VAs misestimated and underpriced lapse risk. Retention by policyholders of these guaranteed products was much greater than expected, causing insurers to take significant, unexpected earnings charges and write-downs over the past year and a half.”
“Recent experience for these guarantees provides [the takeaway that] … Companies tend to retain customers that cost them the most and lose those that cost them the least.”
Society of Actuaries Predictive Analytics Seminar 5
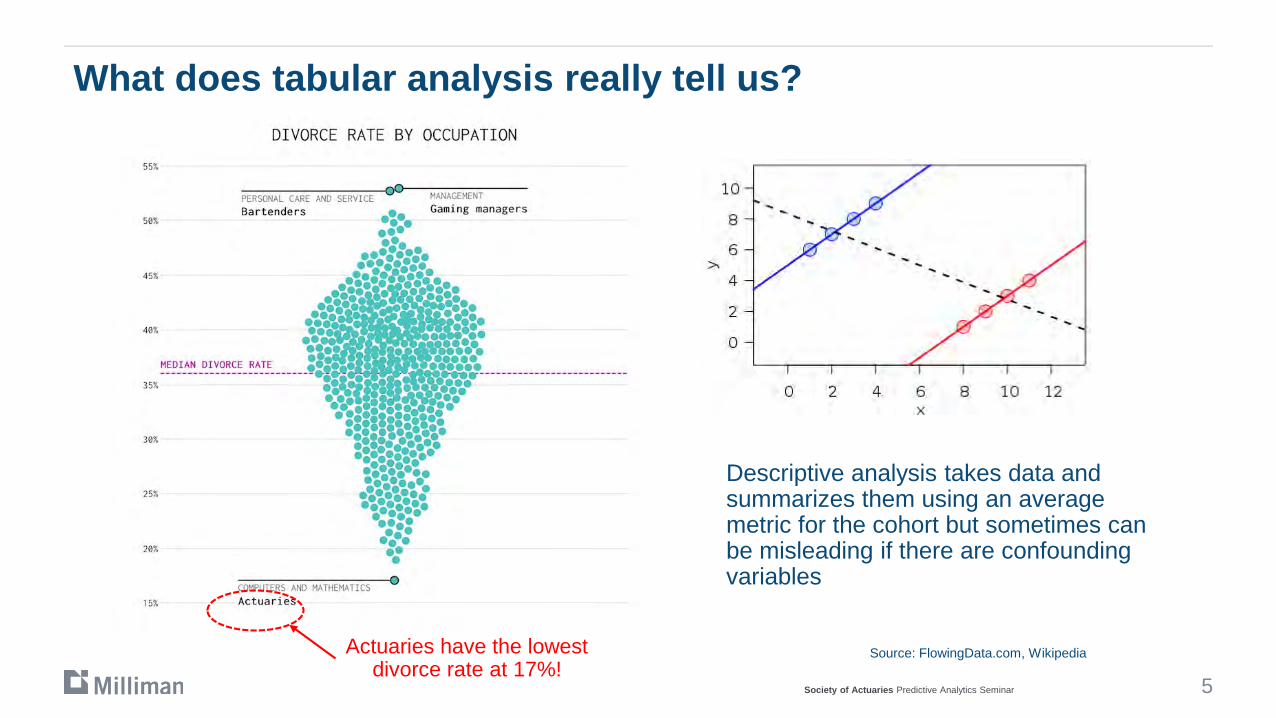
What does tabular analysis really tell us?
Source: FlowingData.com, Wikipedia
Descriptive analysis takes data and summarizes them using an average metric for the cohort but sometimes can be misleading if there are confounding variables
Actuaries have the lowest divorce rate at 17%!

Society of Actuaries Predictive Analytics Seminar 6
Milliman VALUES Industry Study Data Set
VALUES Industry Lapse Study covered 117 million quarterly observations, $500bn AV VALUES GLWB
Utilization Study, 2 million policies, $200bn AV
70% training set
30% holdout set
Society of Actuaries Predictive Analytics Seminar 7
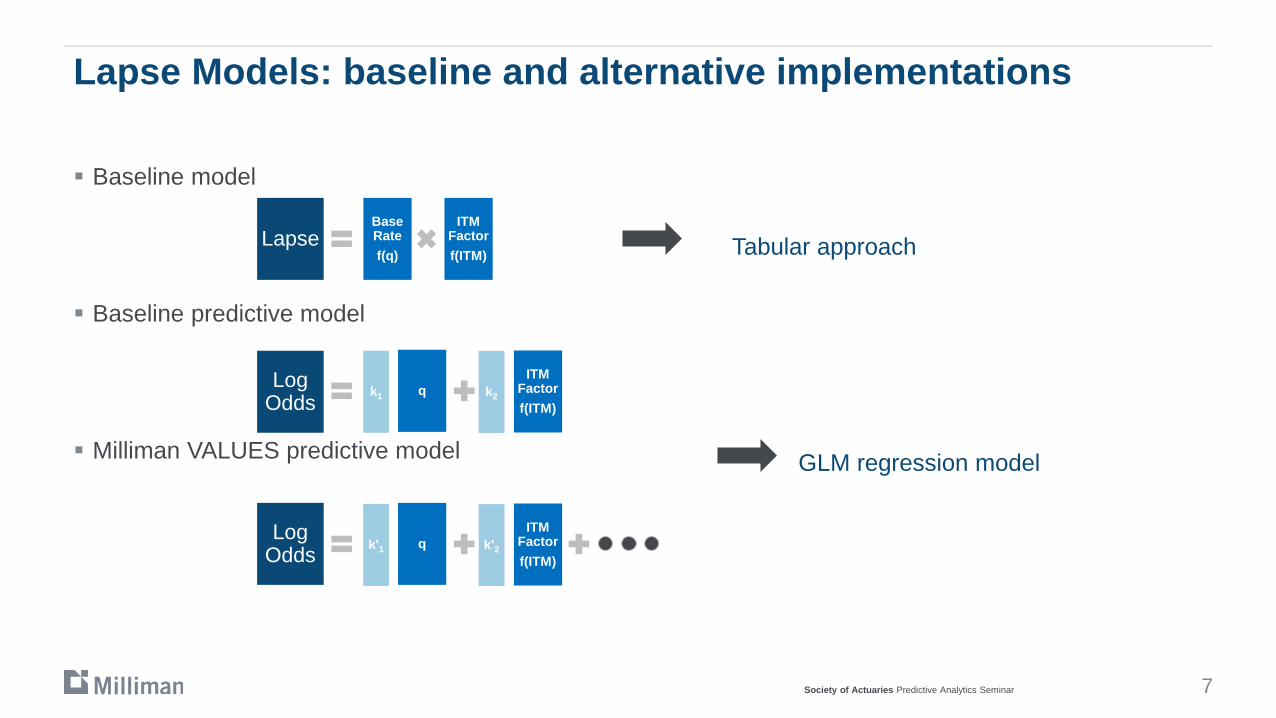
Lapse Models: baseline and alternative implementations
Baseline model
Baseline predictive model
Milliman VALUES predictive model
LapseBase Ratef(q)
ITM Factorf(ITM)
Log Odds
qITM
Factorf(ITM)
k1 k2
Log Odds q
ITM Factorf(ITM)
k'1 k'2
Tabular approach
GLM regression model
Society of Actuaries Predictive Analytics Seminar 8
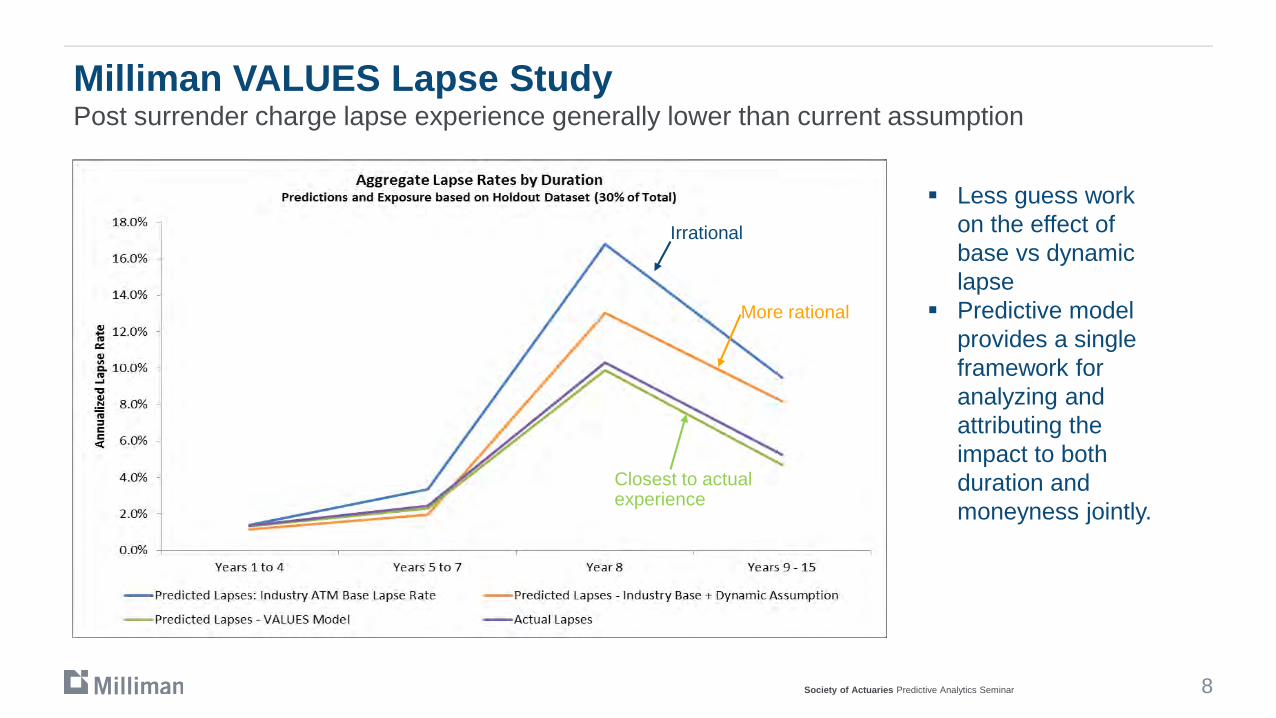
Milliman VALUES Lapse StudyPost surrender charge lapse experience generally lower than current assumption
Less guess work on the effect of base vs dynamic lapse
Predictive model provides a single framework for analyzing and attributing the impact to both duration and moneyness jointly.
Irrational
More rational
Closest to actual experience

Society of Actuaries Predictive Analytics Seminar 9
Algorithms can help accelerate variable selection
-4.5 -4.0 -3.5 -3.0 -2.5 -2.0 -1.5 -1.0 -0.5 0.0 0.5 1.0 1.5Multiplicative impact to lapse rates
Relative importance of new predictors
CategoryBehaviorDemographicDistributionPolicy sizePolicy state
When faced with hundreds of potential variables, computers algorithms are much faster at selecting important variables based on their influence on the behavior
Society of Actuaries Predictive Analytics Seminar 10
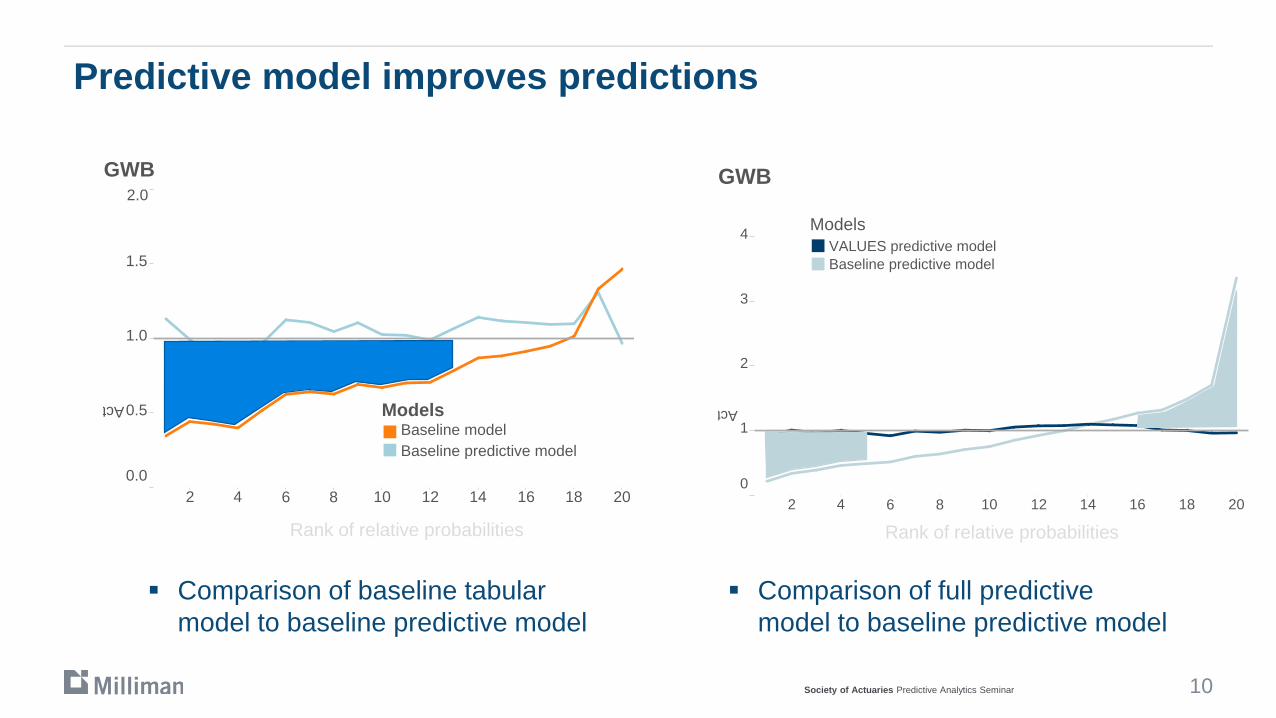
2 4 6 8 10 12 14 16 18 200.0
0.5
1.0
1.5
2.0
Act
GWB
ModelsBaseline modelBaseline predictive model
Predictive model improves predictions
Comparison of baseline tabular model to baseline predictive model
Rank of relative probabilities2 4 6 8 10 12 14 16 18 20
0
1
2
3
4
Act
.
GWB
ModelsVALUES predictive model Baseline predictive model
Rank of relative probabilities
Comparison of full predictive model to baseline predictive model
Society of Actuaries Predictive Analytics Seminar 11
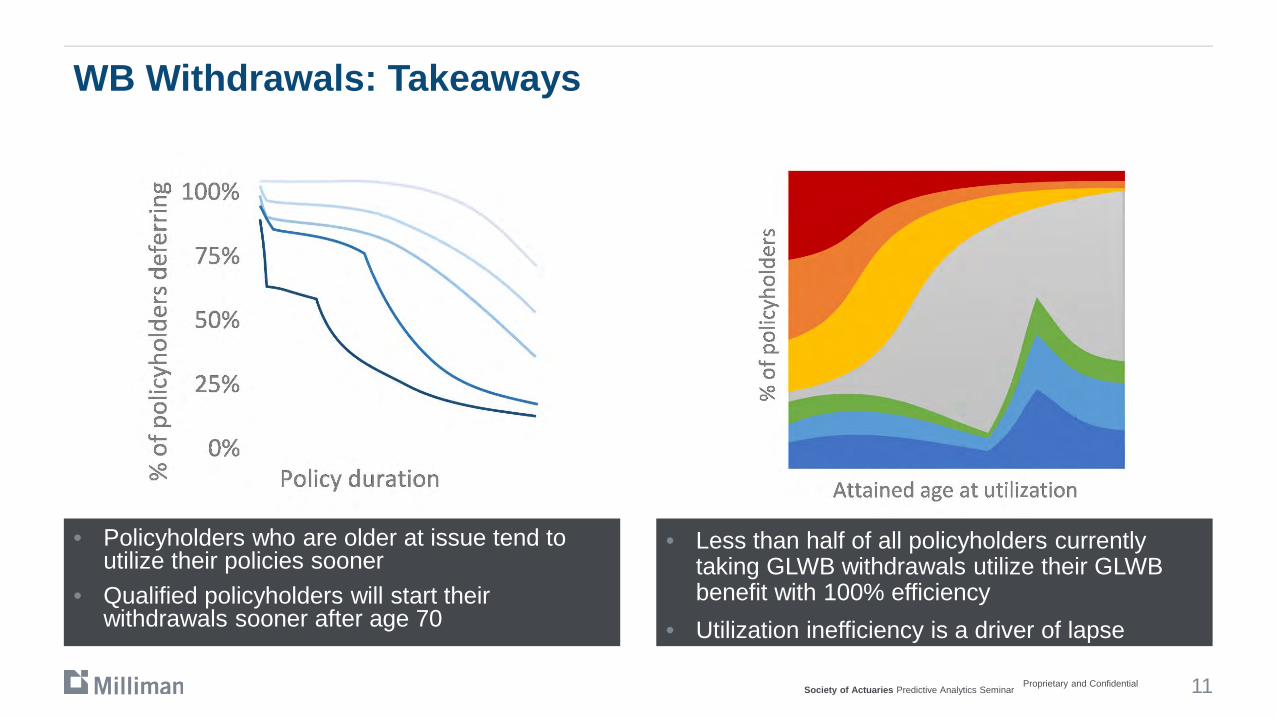
WB Withdrawals: Takeaways
• Policyholders who are older at issue tend to utilize their policies sooner
• Qualified policyholders will start their withdrawals sooner after age 70
• Less than half of all policyholders currently taking GLWB withdrawals utilize their GLWB benefit with 100% efficiency
• Utilization inefficiency is a driver of lapse
Proprietary and Confidential
Society of Actuaries Predictive Analytics Seminar 12
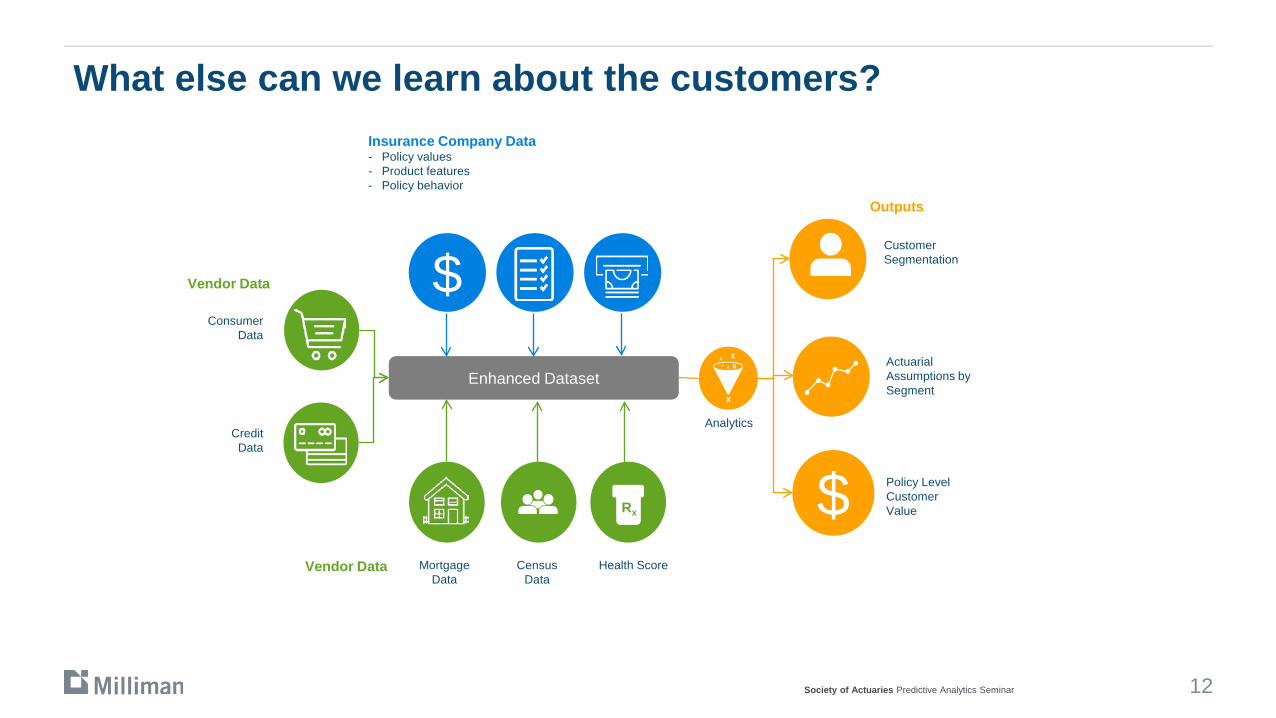
What else can we learn about the customers?
Enhanced Dataset
Vendor Data
$
$Analytics
Actuarial Assumptions by Segment
Customer Segmentation
Policy Level Customer Value
Insurance Company Data- Policy values- Product features- Policy behavior
ConsumerData
Credit Data
Vendor Data
Outputs
Mortgage Data
Census Data
Health Score
Rx

Society of Actuaries Predictive Analytics Seminar 13
Annuity behavior modeling: progression of states
DescriptiveWhat happened in the past
DiagnosticWhy did it happen?
PredictiveWhat may happen?
PrescriptiveWhat can be done?
Business Value
Com
plex
ity
HighLow
High
Hindsight
Foresight
Insight
Companies are evolving on the analytics spectrum from descriptive and diagnostic analysis to predictive and prescriptive analysis.
Next-generation experience studies will use much wider set of explanatory variables and more sophisticated analysis techniques to find non-linear, multivariate effects, complex interactions
Insights from experience studies can be used to develop individual policyholder profiles and to drive product development and create positive engagement with customers
Society of Actuaries Predictive Analytics Seminar 14
Key Takeaways
Predictive models are well suited to investigating policyholder experience data
Reduced cost of storage and computing has largely lifted constraints around predictive modelling methods and applications
Actuarial judgement is still required, in particular to avoid creating models that are hard to interpret or implement.
A multidisciplinary team is necessary to successfully advance in this new area: Subject matter expertise in the products, policyholder use of products, and the financial implications to insurers. Data managers Data scientists Technology developers IT infrastructure
Start with the low hanging fruits such as maintaining high quality data and collecting supplementary data sources and grow from there.

Thank You!Jenny JinLife/FRM – Consulting Actuary – Chicago [email protected] 499 5722

© Copyright by SOA
Predictive Analytics Symposium
Predictive Analytics for In Force Management Session 29 – Some Practical ExamplesSeptember 15, 2017
Assaf Mizan, FIA, FILAA
1© Copyright by SOA
© Copyright by SOA
Why predictive analytics
• Predictive Analytics in insurance:
Use of advance modelling and data mining tools to predict
behavior in the insurance space
• Contrasted to traditional actuarial methods, these tools have important advantages in the insurance field, in particular:
• Few constraints on the volume of data and features used in the analysis
• Lower requirement for clean data
• Capture complex interactions
• Require significant processing power and data storage, but these are now much cheaper
2
© Copyright by SOA 3
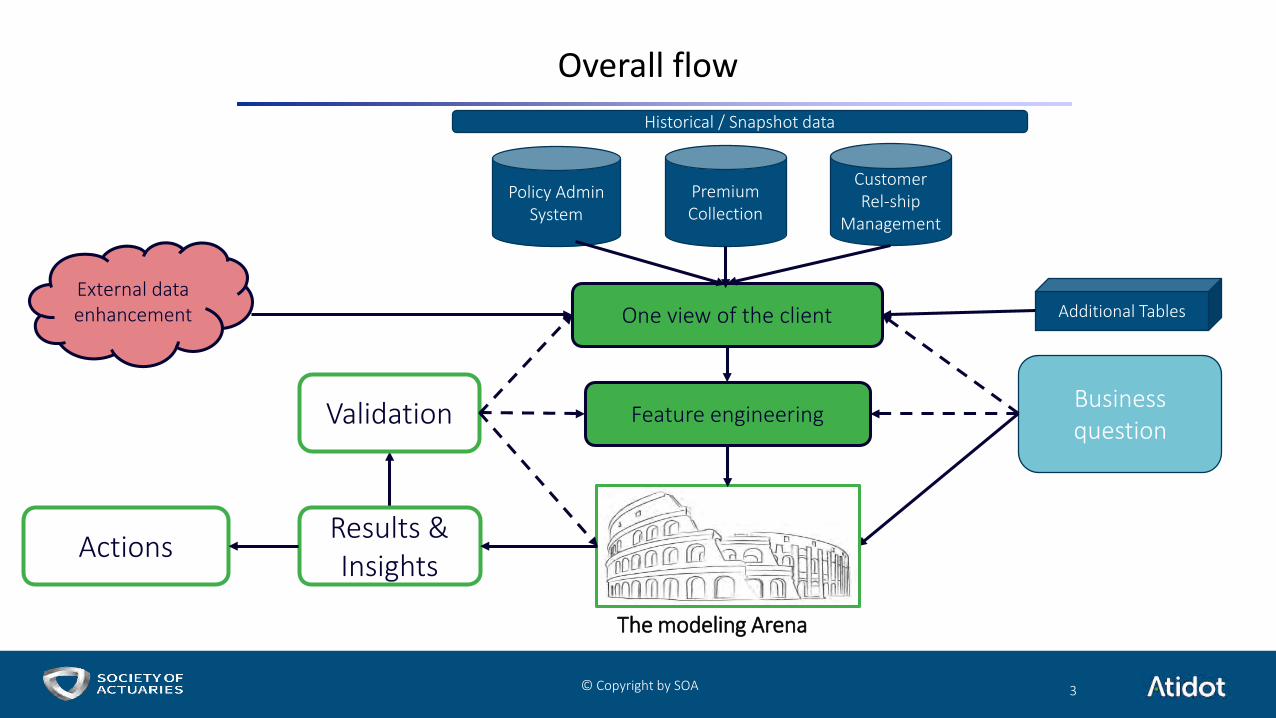
Overall flow
Additional TablesOne view of the client
Policy Admin System
Premium Collection
Customer Rel-ship
Management
Business question
Historical / Snapshot data
Feature engineering
External data enhancement
The modeling Arena
Results & Insights Actions
Validation
© Copyright by SOA
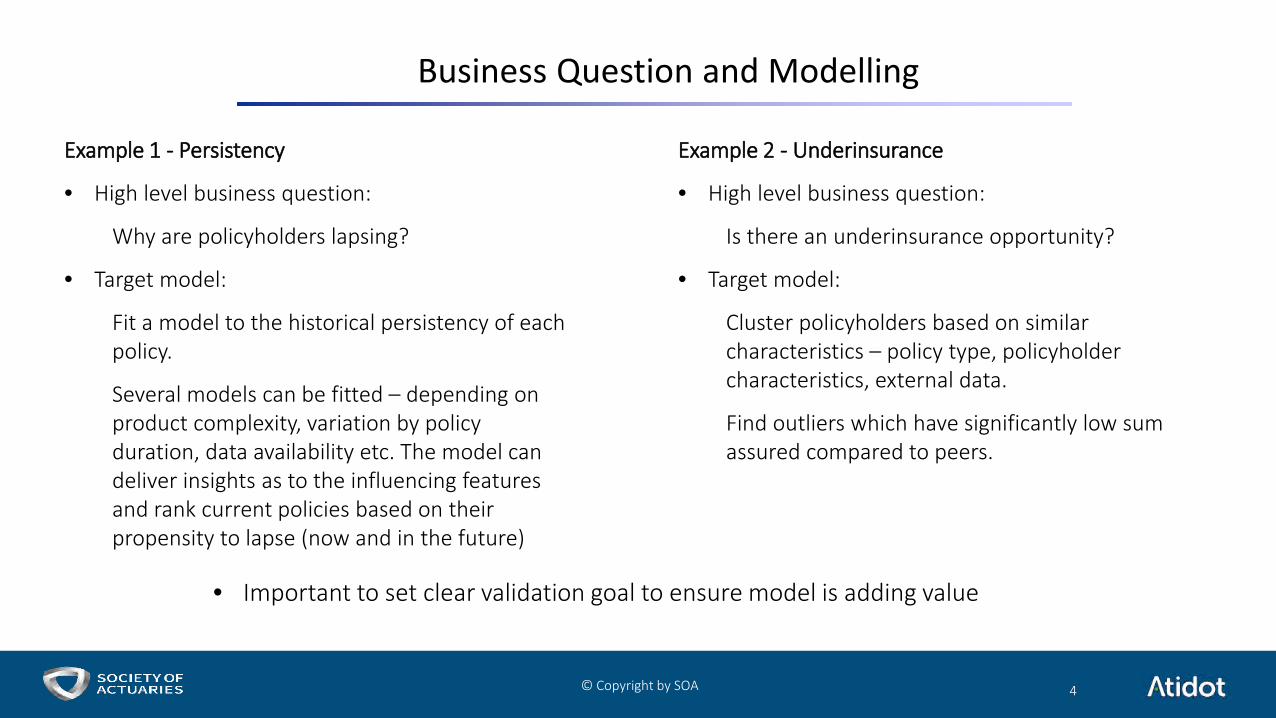
Business Question and Modelling
Example 1 - Persistency
• High level business question:
Why are policyholders lapsing?
• Target model:
Fit a model to the historical persistency of each policy.
Several models can be fitted – depending on product complexity, variation by policy duration, data availability etc. The model can deliver insights as to the influencing features and rank current policies based on their propensity to lapse (now and in the future)
4
Example 2 - Underinsurance
• High level business question:
Is there an underinsurance opportunity?
• Target model:
Cluster policyholders based on similar characteristics – policy type, policyholder characteristics, external data.
Find outliers which have significantly low sum assured compared to peers.
• Important to set clear validation goal to ensure model is adding value
© Copyright by SOA
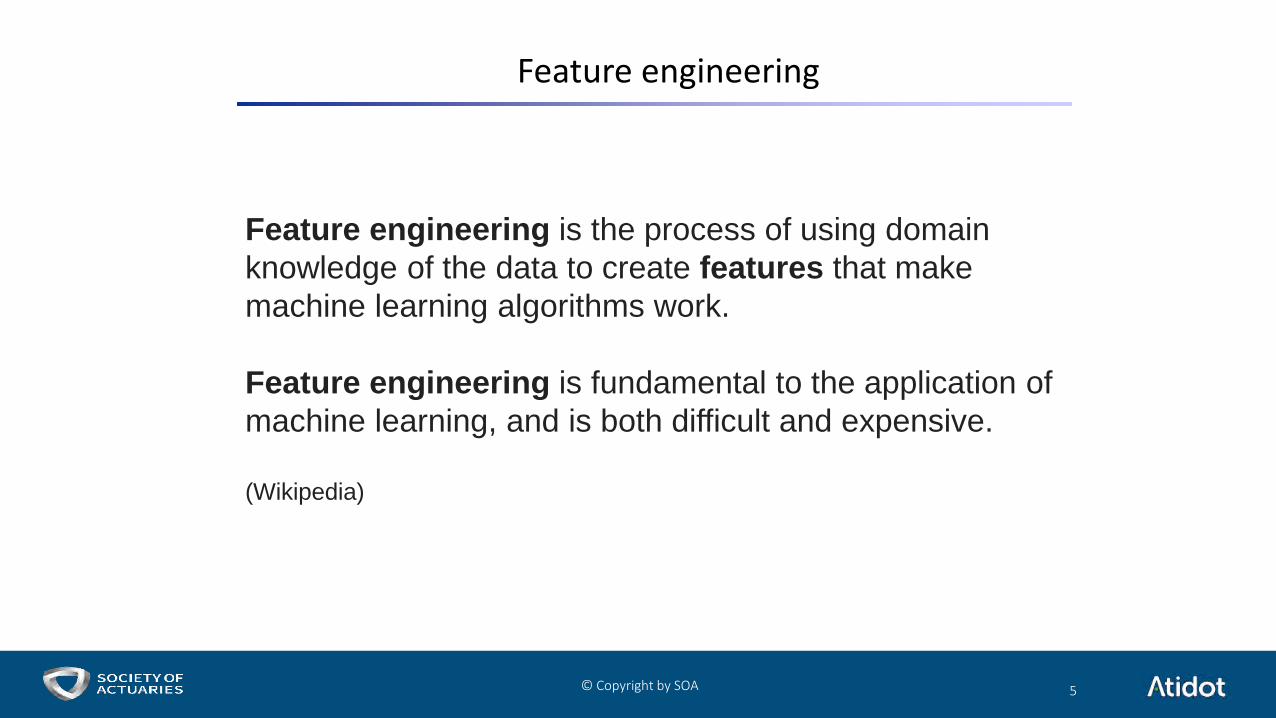
Feature engineering
5
Feature engineering is the process of using domain knowledge of the data to create features that make machine learning algorithms work.
Feature engineering is fundamental to the application of machine learning, and is both difficult and expensive.
(Wikipedia)
© Copyright by SOA
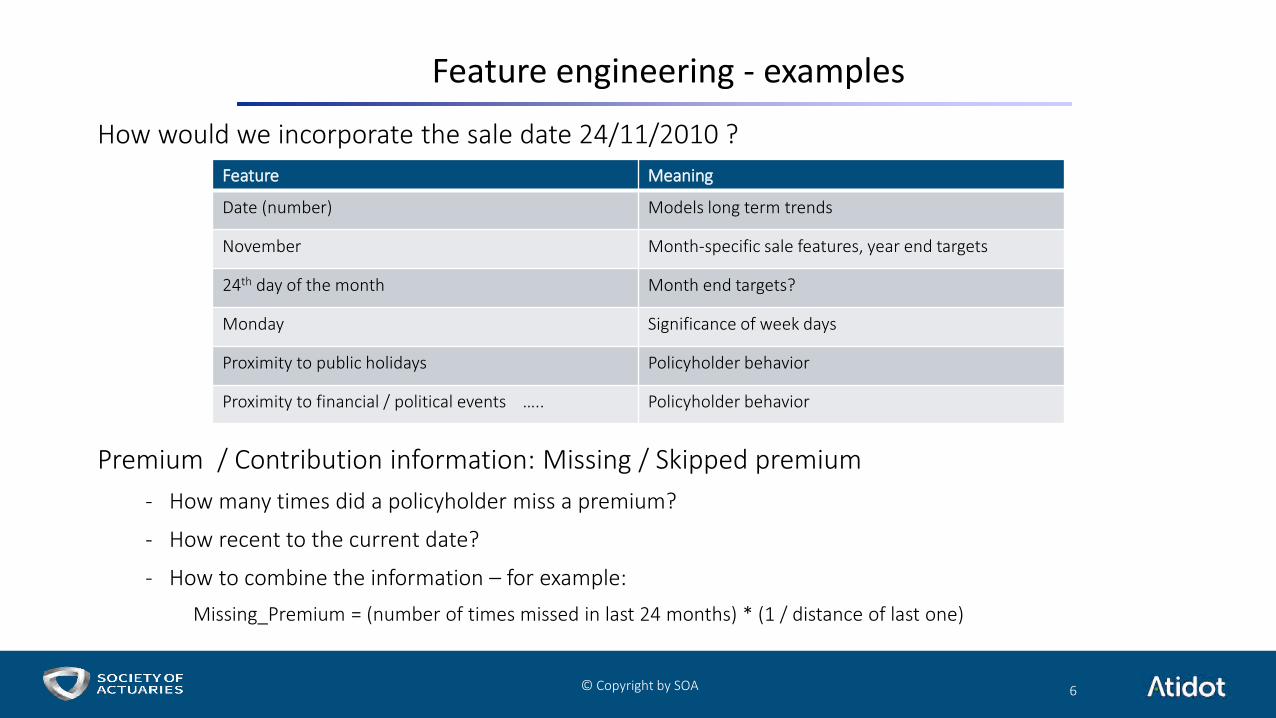
Feature engineering - examples
6
How would we incorporate the sale date 24/11/2010 ?Feature Meaning
Date (number) Models long term trends
November Month-specific sale features, year end targets
24th day of the month Month end targets?
Monday Significance of week days
Proximity to public holidays Policyholder behavior
Proximity to financial / political events ….. Policyholder behavior
Premium / Contribution information: Missing / Skipped premium - How many times did a policyholder miss a premium?
- How recent to the current date?
- How to combine the information – for example:Missing_Premium = (number of times missed in last 24 months) * (1 / distance of last one)
© Copyright by SOA
Feature engineering - examples
7
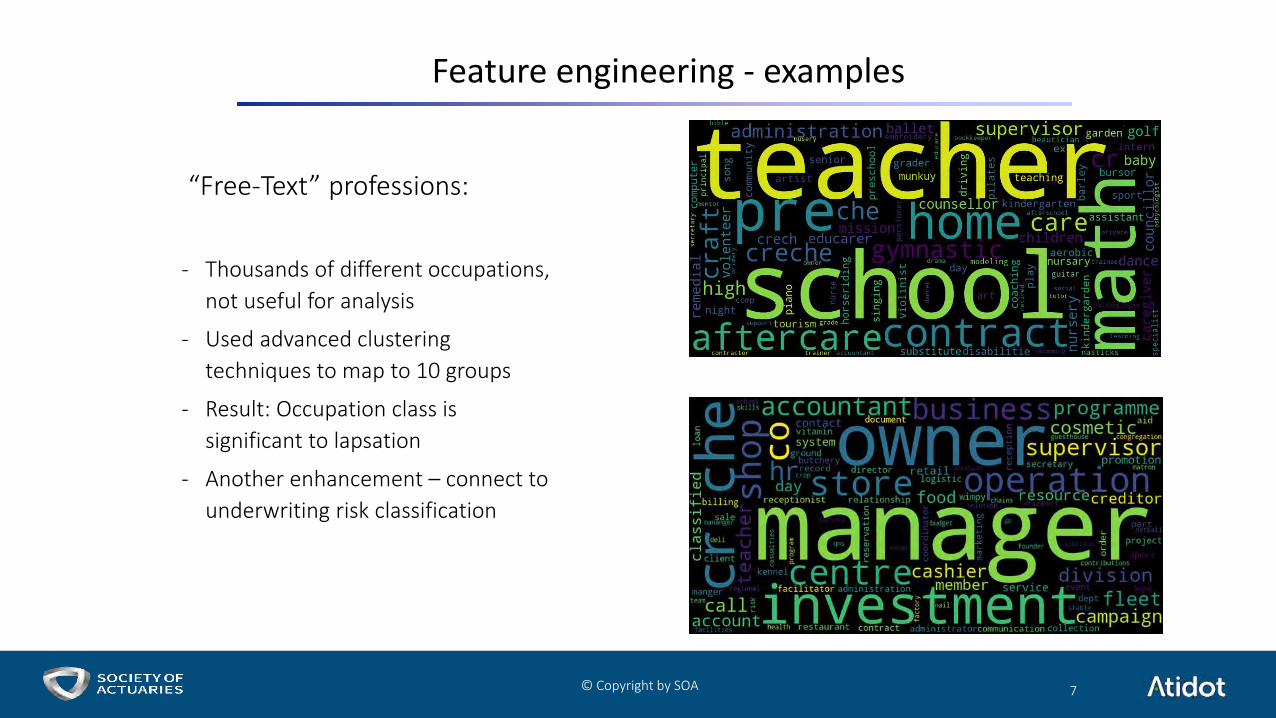
“Free-Text” professions:
- Thousands of different occupations, not useful for analysis
- Used advanced clustering techniques to map to 10 groups
- Result: Occupation class is significant to lapsation
- Another enhancement – connect to underwriting risk classification

© Copyright by SOA
External Data
• Most common – Demographic data based on address, for example: Median earnings ,average household, homeowner vacancy ,median age
• Lifestyle type data (subscriptions etc)
• Depending on product, financial data can also be useful
• Lifetime events, from external sources, can be useful also triggers, for example:
• house purchase
• Job change
• New family member
• Company data which is “external” to the book analyzed – for example from other operations (health, P&C?)
8
All data and (engineered) features can be useful and may lead to powerful insights –
Time spent here is usually well rewarded!
© Copyright by SOA
Validation (lapse example)
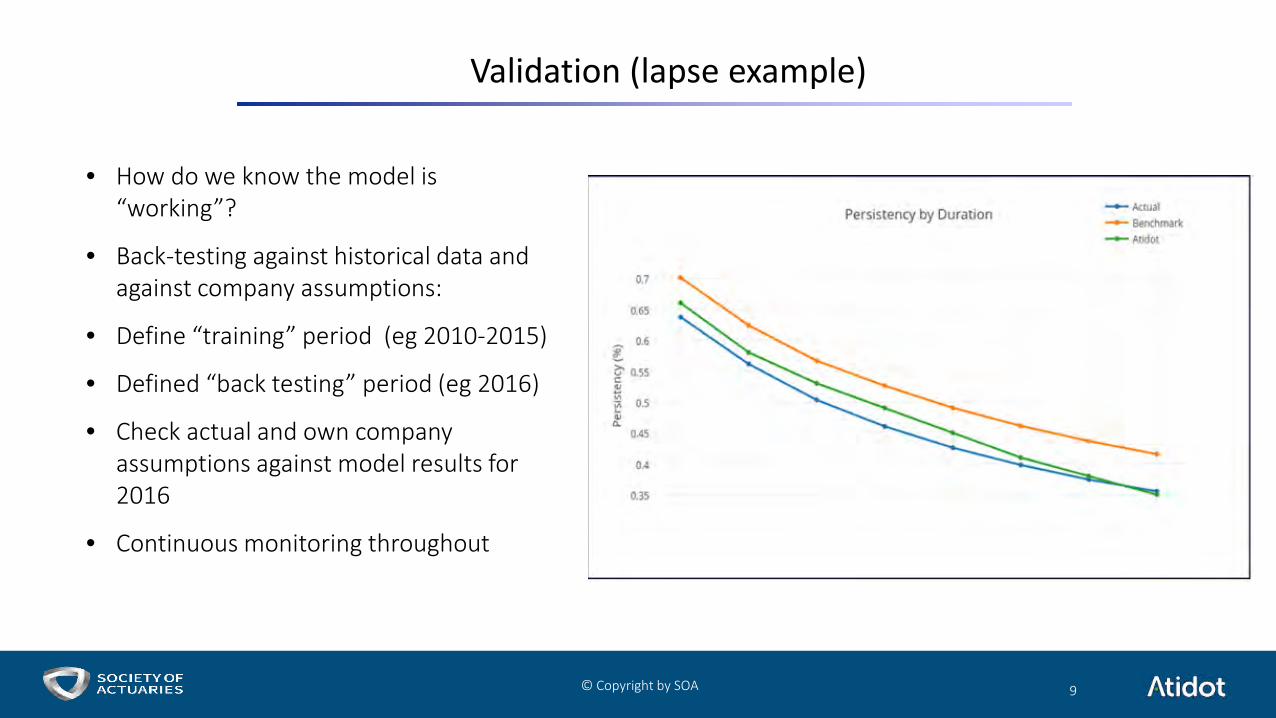
• How do we know the model is “working”?
• Back-testing against historical data and against company assumptions:
• Define “training” period (eg 2010-2015)
• Defined “back testing” period (eg 2016)
• Check actual and own company assumptions against model results for 2016
• Continuous monitoring throughout
9

© Copyright by SOA
Insights – Example - Persistency by features
10
Pensioner Clerk Housewife Teacher Manager
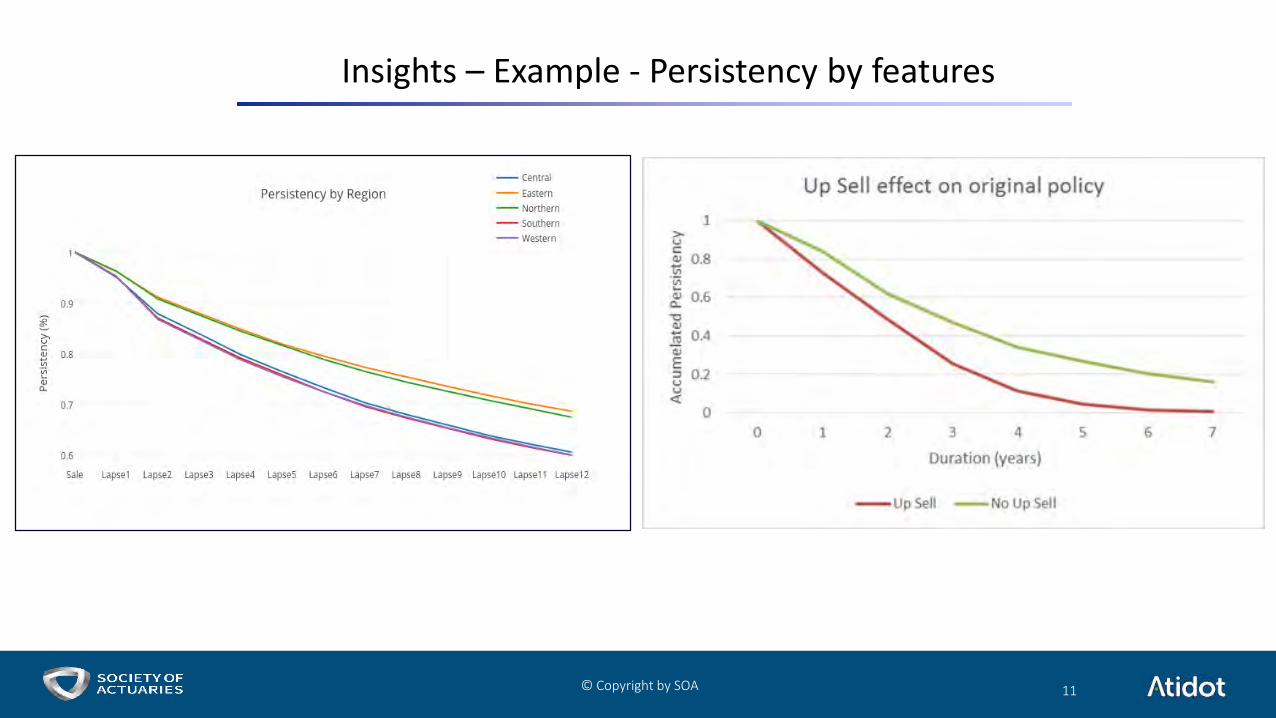
• Once model is validated, we get three useful outcomes:
• Feature importance
• Predictions on a per policy level
• Ability to predict target based on simulated input
• Features can be grouped to three categories:
• External
• Indirect
• Direct
© Copyright by SOA
Insights – Example - Persistency by features
11

© Copyright by SOA
Insights into actions and simulations
• For a lapse / underinsurance model, results are probabilities per policy. The model can assist in prioritizing policies for conservation or upsale:
• Either when the client approaches the company
• Or as a selective pro-active approach
• By adding an additional layer of per-policy profitability, insights turn from inforce projections to value projections
• In addition, model can be used to simulate business under various scenarios.
• Optimization techniques can be applied to select the preferred outcome
12
© Copyright by SOA
Some closing thoughts
• Predictive analytics can be a powerful tool in managing inforce business
• Results depend on availability of data. Frequency of client contact impact results. Use of external event data can substitute lacking internal data, but is more difficult / expensive to obtain.
• Feature engineering and augmentation are critical.
• We have not discussed feature correlation and masking but these are important issues which are tricky to handle
• Additional layers (eg profit) can be incorporated for simulations to help with strategic decisions
• Best results are achieved when predictive analytics are integrated to the business process
13
© Copyright by SOA
Contact details
Assaf Mizan FIA, FILAA
VP Product and Actuary
Atidot Ltd
14
© Copyright by SOA
Predictive Analytics Symposium
Predictive Analytics for In Force Management Session 29September 15, 2017
Martin Snow, FSA, MAAA
1© Copyright by SOA
© Copyright by SOA
SOCIETY OF ACTUARIESAntitrust Notice for Meetings
Active participation in the Society of Actuaries is an important aspect of membership. However, any Society activity that arguably could be perceived as a restraint of trade exposes the SOA and its members to antitrust risk. Accordingly, meeting participants should refrain from any discussion which may provide the basis for an inference that they agreed to take any action relating to prices, services, production, allocation of markets or any other matter having a market effect. These discussions should be avoided both at official SOA meetings and informal gatherings and activities. In addition, meeting participants should be sensitive to other matters that may raise particular antitrust concern: membership restrictions, codes of ethics or other forms of self-regulation, product standardization or certification. The following are guidelines that should be followed at all SOA meetings, informal gatherings and activities:
• DON’T discuss your own, your firm’s, or others’ prices or fees for service, or anything that might affect prices or fees, such as costs, discounts, terms of sale, or profit margins.
• DON’T stay at a meeting where any such price talk occurs.
• DON’T make public announcements or statements about your own or your firm’s prices or fees, or those of competitors, at any SOA meeting or activity.
• DON’T talk about what other entities or their members or employees plan to do in particular geographic or product markets or with particular customers.
• DON’T speak or act on behalf of the SOA or any of its committees unless specifically authorized to do so.
• DO alert SOA staff or legal counsel about any concerns regarding proposed statements to be made by the association on behalf of a committee or section.
• DO consult with your own legal counsel or the SOA before raising any matter or making any statement that you think may involve competitively sensitive information.
• DO be alert to improper activities, and don’t participate if you think something is improper.
• If you have specific questions, seek guidance from your own legal counsel or from the SOA’s Executive Director or legal counsel.
2
© Copyright by SOA
Presentation Disclaimer
Presentations are intended for educational purposes only and do not replace independent professional judgment. Statements of fact and opinions expressed are those of the participants individually and, unless expressly stated to the contrary, are not the opinion or position of the Society of Actuaries, its cosponsors or its committees. The Society of Actuaries does not endorse or approve, and assumes no responsibility for, the content, accuracy or completeness of the information presented. Attendees should note that the sessions are audio-recorded and may be published in various media, including print, audio and video formats without further notice.
3
© Copyright by SOA
Predictive Analytics for In Force Management - Introduction
• Interest in Predictive Analytics (PA) for In Force Management is increasing
• Yet, significantly more can be done:
• More companies can become engaged
• Engaged companies can do more use cases
• Projects can move from the pilot phase to implementation
• Types of in force management use cases today
• Envisioning future projects
• Who is doing the work? How can actuaries do more?
• How is success defined for a PA project?
• How to integrate multiple PA initiatives one with another
• What are the top obstacles to success and what can be done about them?
4

© Copyright by SOA
Predictive Analytics for In Force Management
How Insurers Use PA Today
• Increase market penetration
• Expand customer relationships
• Develop accelerated underwriting programs
• Set mortality and policyholder behavior assumptions
• In force management
5
© Copyright by SOA
Predictive Analytics for In Force Management
Prevalence of Insurer Use of PA for In Force Management
https://www.soa.org/Files/Research/Exp-Study/predictive-analytics-underwriting-report.pdf
6

© Copyright by SOA
Predictive Analytics for In Force Management
In Force Management Use Cases Today• Targeted conversion
• Post-level premium term conservation management
• In force management – pre-lapse
• In force management – post-lapse
• In force management – other customer interaction
• Agent monitoring/management
• Up-sell
• Buy-outs on non-profitable customers
• Other
7
© Copyright by SOA
Predictive Analytics for In Force Management
Who does PA Work for Inforce Management?
Who leads the work?
• Internal vs. External
• Marketing, Data Science / Statistics, Actuary
8

© Copyright by SOA
Predictive Analytics for In Force Management
How is Success Defined?
• SOA Report does not define success
• What criteria can be used to define success?
• What criteria are companies using?
9

© Copyright by SOA
Predictive Analytics for In Force Management
Integration of Multiple PA Initiatives
• Rationalize
• Obtain
• Identify
• Vision
• Core Competency
• Milestones
https://www.linkedin.com/feed/update/urn:li:activity:6285162336839888897
10

© Copyright by SOA
Predictive Analytics for In Force Management
Top Obstacles to Success
• Human behavior
• Legacy Infrastructure
• Buy-in
• Competing Priorities
• Cost-benefit
• Data sources, implementation, designing and building the model
11

© Copyright by SOA
Predictive Analytics for In Force Management
Overcoming the Obstacles to Success
• Compelling Business Case
• Expert Opinions
• Carefully designed policyholder surveys
• Learn from products with similar characteristics
• Bayesian models
12

© Copyright by SOA
Presenter Contact Information
Martin Snow, FSA, [email protected](732) 336-1130
13