Embed Size (px)
Citation preview
2017 Study on Mobile and IoT Application Security Independently conducted by Ponemon Institute LLC
Sponsored by IBM & Arxan | January 2017
2017 Study on Mobile IoT Application Security
www.arxan.com | email: [email protected] | Tel: 301.968.4290
Part 1. Introduction
Ponemon Institute is pleased to present the findings of the 2017 Study on Mobile and Internet
of Things Application Security sponsored by IBM and Arxan Technologies. The purpose of this
research is to understand how companies are reducing the risk of mobile apps and Internet of
Things (IoT) in the workplace. The risks created by mobile apps have been well researched and
documented. This study reveals how companies are unprepared for risks created by vulnerabili-
ties in IoT apps.
We surveyed 593 IT and IT security practitioners who are involved in the security of mobile and
IoT application security and familiar with their organization’s security practices during the devel-
opment of these applications and devices. Organizations participating in this study are users of
mobile apps and IoT devices (44 percent and 48 percent, respectively), developers/manufactur-
ers of mobile apps and IoT devices (27 percent and 21 percent, respectively) or both users and
developers of mobile apps and IoT devices (29 percent and 31 percent, respectively).
2017 Study on Mobile and IoT Application Security Independently conducted by Ponemon Institute LLC
www.arxan.com
2017 Study on Mobile IoT Application Security
Ponemon Institute© Research Report
Part 1. Introduction (continued) The risk of unsecured IoT apps is growing. Respondents acknowledge the risk of security vulnerabilities in both mobile and IoT apps. However, as shown in Figure 1, more respondents are likely to say
IoT apps are harder to secure (84 percent) versus mobile apps (69 percent). Additionally, 55 percent of respondents say there is a lack of quality assurance
and testing procedures for IoT apps.
Following are key findings from this research:
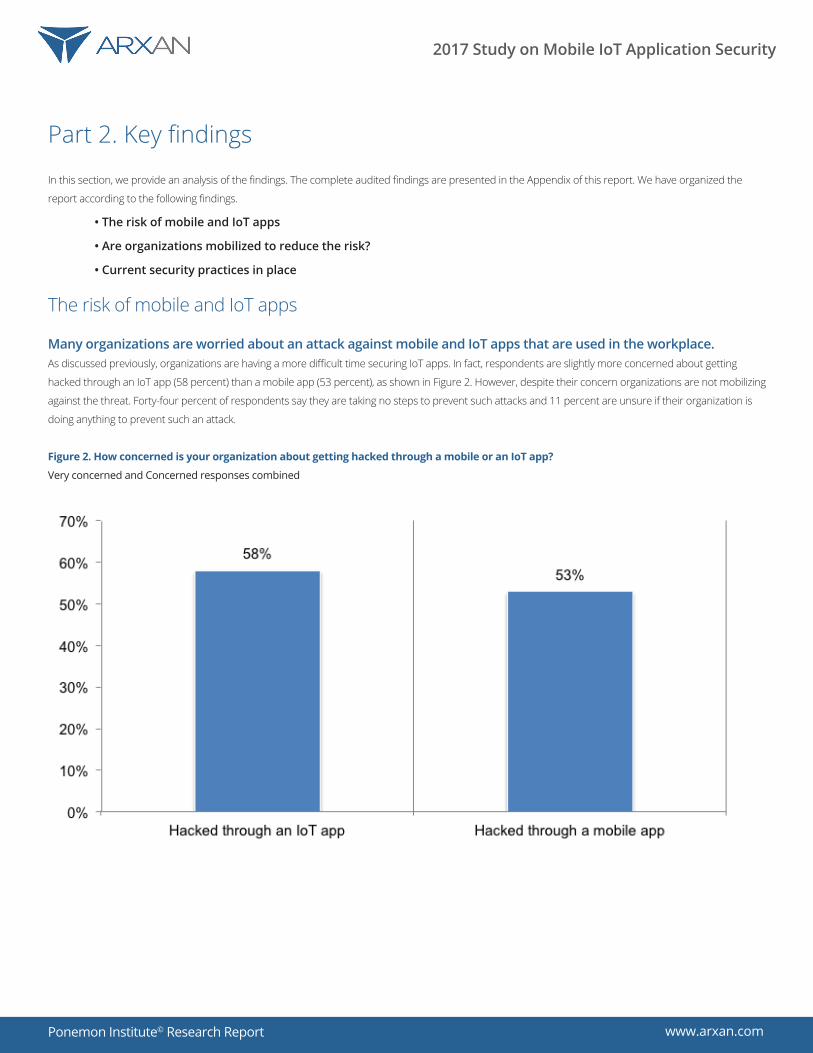
Many organizations are worried about an attack against mobile and IoT apps that are used in the workplace. As discussed previously, organizations are having a more difficult time securing IoT apps. In fact, respondents are slightly more concerned about getting
hacked through an IoT app (58 percent) than a mobile app (53 percent). However, despite their concern organizations are not mobilizing against the threat.
Forty-four percent of respondents say they are taking no steps and 11 percent are unsure if their organization is doing anything to prevent such an attack.
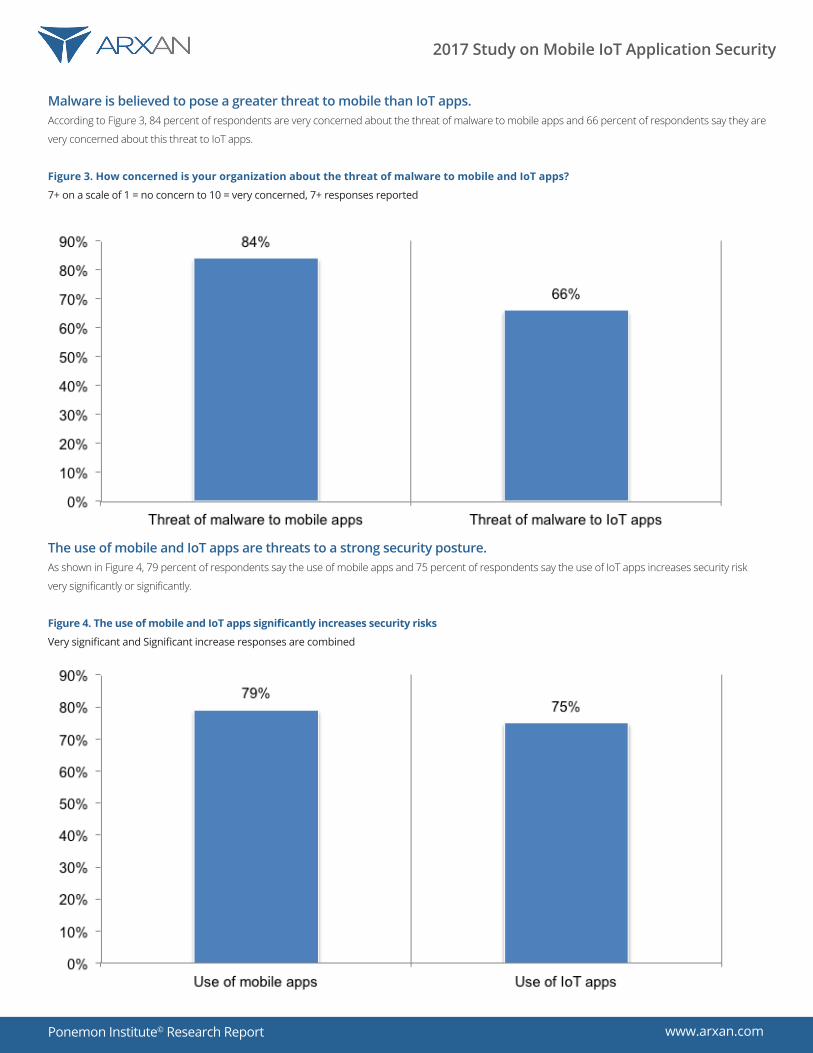
Malware is believed to pose a greater threat to mobile than IoT apps. Eighty-four percent of respondents are very concerned about the threat of malware to mobile apps and 66 percent of respondents say they are very con-
cerned about this threat to IoT apps.
The use of mobile and IoT apps are threats to a strong security posture. Seventy-nine percent of respondents say the use of mobile apps and 75 percent of respondents say the use of IoT apps increase security risk very significant-
ly or significantly.
Organizations have no confidence or are not confident they know all mobile and IoT apps in the workplace. Sixty-three
percent of respondents are not confident (30 percent) or have no confidence (33 percent) their organizations know all of the mobile applications used by
employees. An even larger percentage of respondents (75 percent) are not confident (38 percent) or have no confidence (37 percent) they know all of the IoT
apps in the workplace. However, respondents estimate that the average number of mobile apps in their organizations is 472 and the average number of IoT
apps is 241.
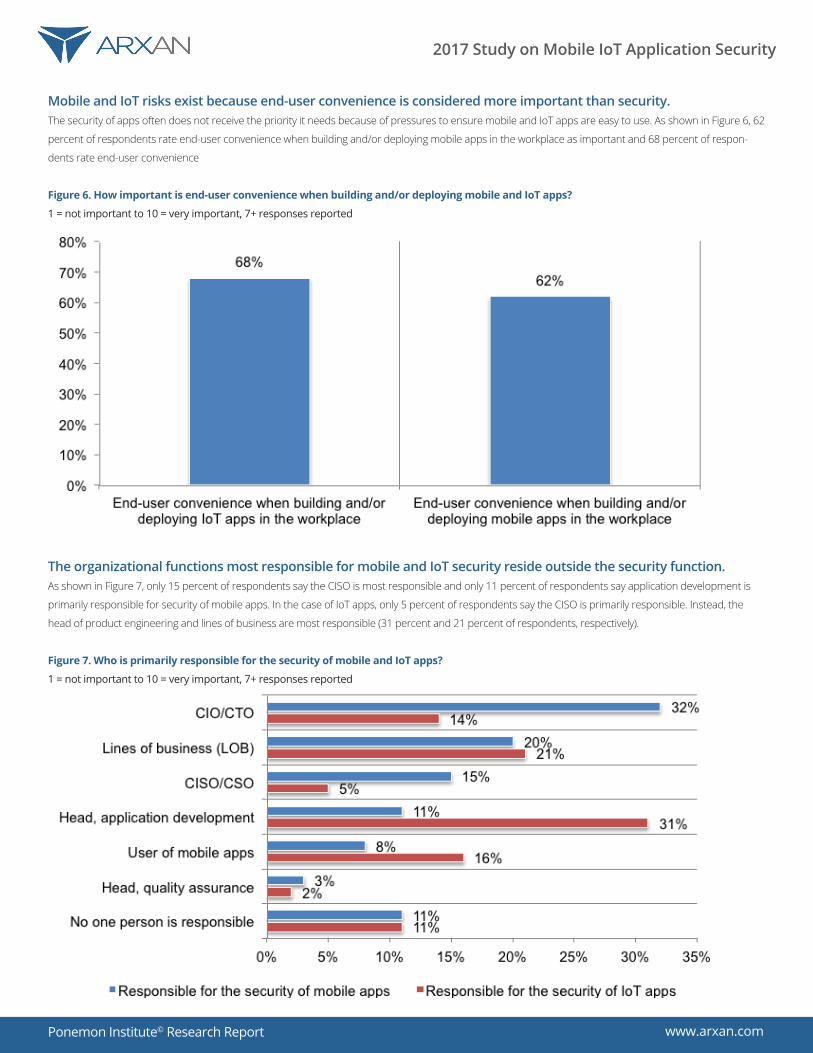
Mobile and IoT risks exist because end-user convenience is considered more important than security. The security of apps often does not receive the priority it needs because of the pressure to ensure mobile and IoT apps are easy to use. Sixty-two percent
of respondents rate end-user convenience when building and/or deploying mobile apps in the workplace as important and 68 percent of respondents rate
end-user convenience when building and/or deploying IoT apps in the workplace as important considerations.
The functions most responsible for mobile and IoT security are outside the security function. Only 15 percent of respondents say the CISO is most responsible and only 11 percent of respondents say application development is primarily responsible
for security of apps. In the case of IoT apps, only 5 percent of respondents say the CISO is primarily responsible. Instead, the head of product engineering and
lines of business are most responsible (31 percent and 21 percent of respondents, respectively).
Hacking incidents and regulations drive growth in budgets. Only 30 percent of respondents say their organization allocates sufficient budget to protect mobile apps and IoT devices. If they had a serious hacking
incident, their organizations would consider increasing the budget (54 percent of respondents). Other reasons to increase the budget are if new regulations
were issued (46 percent of respondents) or if they were exposed to media coverage of a serious hacking incident affecting another company (25 percent of
respondents).
www.arxan.com
2017 Study on Mobile IoT Application Security
Ponemon Institute© Research Report
Despite the risk, there is a lack urgency to address the threat. Only 32 percent of respondents say their organization urgently wants to secure mobile apps and 42 percent of respondents say it is urgent to secure IoT
apps. Factors revealed in this study that might explain the lack of urgency include the following: not enough budget being allocated to the security of these
apps and the individuals most often responsible for stopping attacks are not in the security function. Rather, they reside in the lines of business, development
or engineering.
Material data breach or cyber attacks have occurred and are reasons for concern. Respondents report they know with certainty (11 percent), or most likely (15 percent) or likely (34 percent) that their organization had a security incident
because of an insecure mobile app. Respondents report they are less certain whether their organization had a material data breach or cyber attack due to an
insecure IoT app. Forty-six percent of respondents say with certainty (4 percent), most likely (11 percent) or likely (31 percent).
There is a high level of concern for insecure mobile and IoT apps. Seventy percent of respondents are very concerned about the use of insecure IoT apps and 64 percent are very concerned about the use of insecure mobile
applications in the workplace.
Testing of mobile and IoT apps is ad hoc, if done at all. As discussed above, organizations may recognize the risk but a sense of urgency to mitigate the risk does not exist. This lack of urgency is reflected in mobile
and IoT app security practices. Thirty-five percent of respondents say testing is not pre-scheduled or does not occur at all (26 percent of respondents). Almost
half (48 percent of respondents) say testing of IoT apps does not occur. On average only 29 percent of mobile apps and 20 percent of IoT apps are tested
for vulnerabilities. An average of 30 percent of mobile apps tested contain vulnerabilities and an average of 38 percent of IoT apps tested contain significant
vulnerabilities.
Testing of mobile and IoT apps often does not occur until production. Fifty-eight percent of respondents say their organization waits until production to test their mobile apps and 39 percent of respondents say mobile apps are
tested in production.
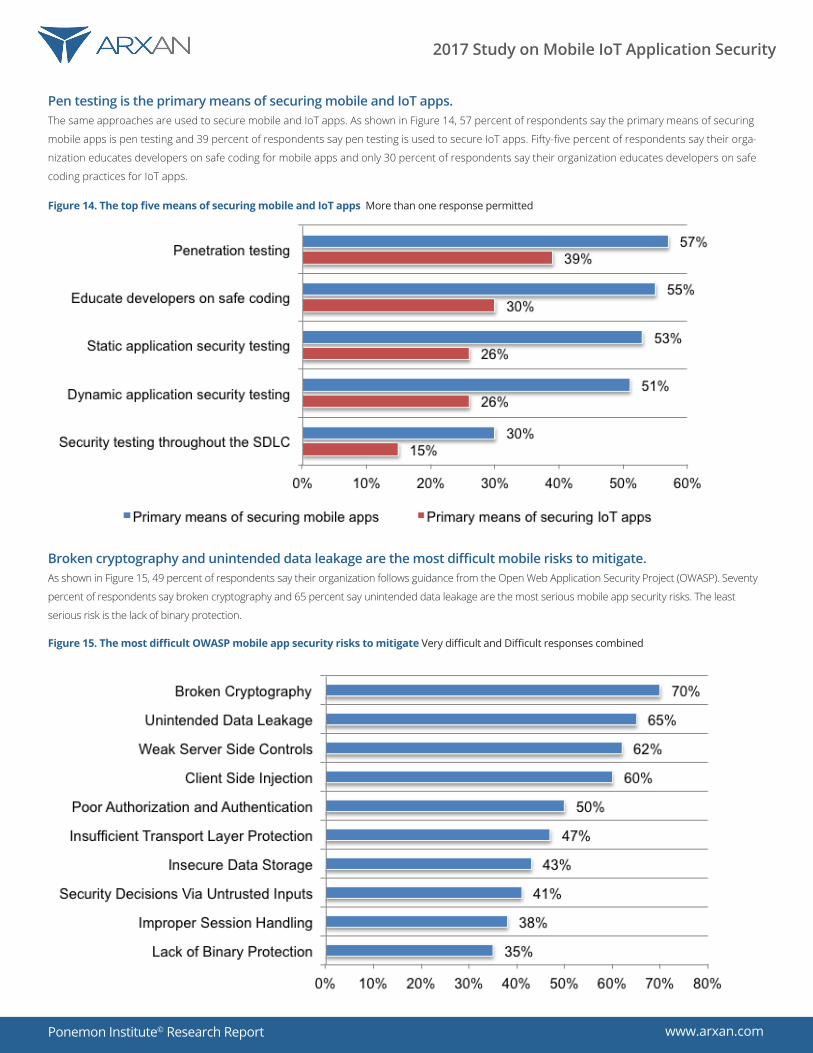
Pen testing is the primary means of securing mobile and IoT apps. The same approaches are used to secure mobile and IoT apps. Fifty-seven percent of respondents say the primary means of securing mobile apps is pen
testing and 39 percent of respondents say pen testing is used to secure IoT apps. Fifty-five percent of respondents say their organization educates develop-
ers on safe coding for mobile apps and only 30 percent of respondents say their organization educates developers on safe coding practices for IoT apps.
Broken cryptography and unintended data leakage are the most difficult mobile risks to mitigate. Forty-nine percent of respondents say their organization follows guidance from the Open Web Application Security Project (OWASP). Seventy percent of
respondents say broken cryptography and 65 percent say unintended data leakage are the most serious mobile app security risks. The least serious risk is
the lack of binary protection.
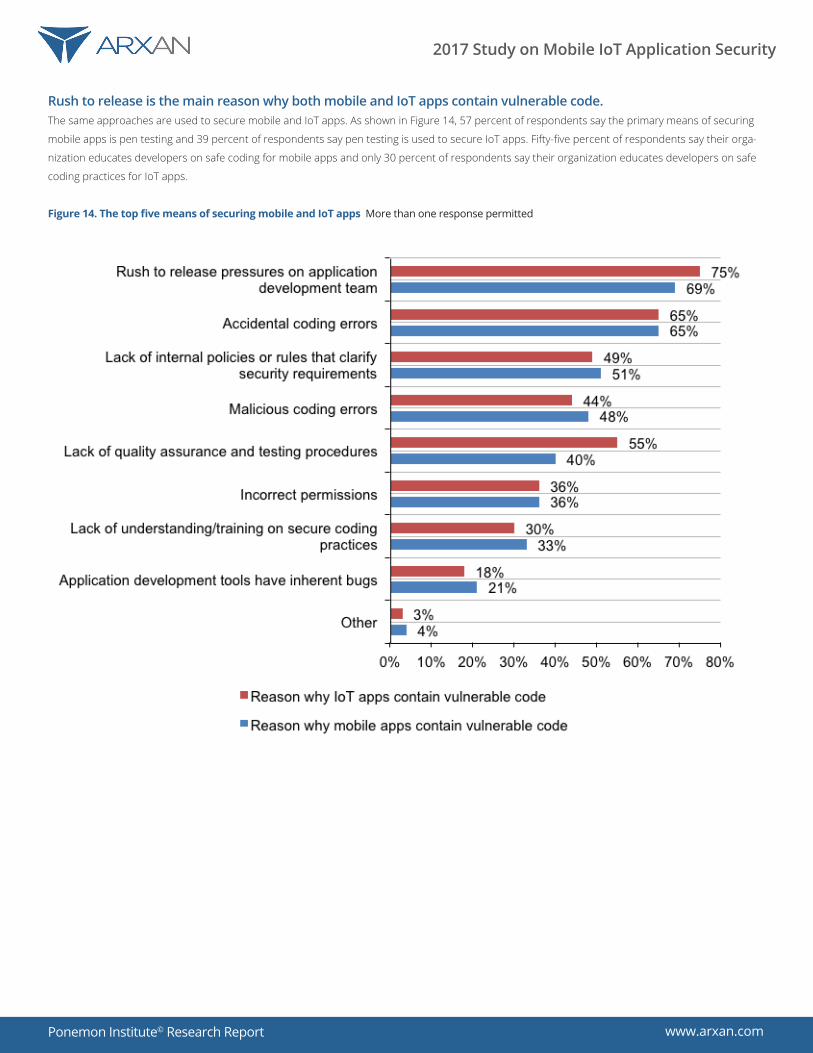
Rush to release is the main reason why both mobile and IoT apps contain vulnerable code. Sixty-nine percent of respondents say pressure on the development team is why mobile apps contain vulnerable code and 75 percent of respondents say the
same reason contributes to vulnerable code in IoT apps. Accidental coding errors in mobile and IoT apps are another primary reason for vulnerable code (65
percent of respondents). An additional issue affecting the security of apps is the lack of internal policies or rules that clarify security requirements.
www.arxan.com
2017 Study on Mobile IoT Application Security
Ponemon Institute© Research Report
Part 2. Key findings In this section, we provide an analysis of the findings. The complete audited findings are presented in the Appendix of this report. We have organized the
report according to the following findings.
• The risk of mobile and IoT apps
• Are organizations mobilized to reduce the risk?
• Current security practices in place
The risk of mobile and IoT apps
Many organizations are worried about an attack against mobile and IoT apps that are used in the workplace. As discussed previously, organizations are having a more difficult time securing IoT apps. In fact, respondents are slightly more concerned about getting
hacked through an IoT app (58 percent) than a mobile app (53 percent), as shown in Figure 2. However, despite their concern organizations are not mobilizing
against the threat. Forty-four percent of respondents say they are taking no steps to prevent such attacks and 11 percent are unsure if their organization is
doing anything to prevent such an attack.
Figure 2. How concerned is your organization about getting hacked through a mobile or an IoT app?
Very concerned and Concerned responses combined
www.arxan.com
2017 Study on Mobile IoT Application Security
Ponemon Institute© Research Report
Malware is believed to pose a greater threat to mobile than IoT apps. According to Figure 3, 84 percent of respondents are very concerned about the threat of malware to mobile apps and 66 percent of respondents say they are
very concerned about this threat to IoT apps.
Figure 3. How concerned is your organization about the threat of malware to mobile and IoT apps?
7+ on a scale of 1 = no concern to 10 = very concerned, 7+ responses reported
The use of mobile and IoT apps are threats to a strong security posture. As shown in Figure 4, 79 percent of respondents say the use of mobile apps and 75 percent of respondents say the use of IoT apps increases security risk
very significantly or significantly.
Figure 4. The use of mobile and IoT apps significantly increases security risks
Very significant and Significant increase responses are combined

www.arxan.com
2017 Study on Mobile IoT Application Security
Ponemon Institute© Research Report
Organizations have no confidence or are not confident they know all of the mobile and IoT apps in the workplace. As shown in Figure 5, 63 percent of respondents are not confident (30 percent) or have no confidence (33 percent) their organizations know all of the
mobile applications used by employees.
An even larger percentage of respondents (75 percent) are not confident (38 percent) or have no confidence (37 percent) that they know all of the IoT
apps in the workplace. However, respondents estimate that the average number of mobile apps in their organizations is 472 and the average number
of IoT apps is 241.
Figure 5. How confident are you that your organization knows all of the mobile and IoT apps in the workplace?
Not confident or No confidence responses are combined
www.arxan.com
2017 Study on Mobile IoT Application Security
Ponemon Institute© Research Report
Mobile and IoT risks exist because end-user convenience is considered more important than security. The security of apps often does not receive the priority it needs because of pressures to ensure mobile and IoT apps are easy to use. As shown in Figure 6, 62
percent of respondents rate end-user convenience when building and/or deploying mobile apps in the workplace as important and 68 percent of respon-
dents rate end-user convenience
Figure 6. How important is end-user convenience when building and/or deploying mobile and IoT apps?
1 = not important to 10 = very important, 7+ responses reported
The organizational functions most responsible for mobile and IoT security reside outside the security function. As shown in Figure 7, only 15 percent of respondents say the CISO is most responsible and only 11 percent of respondents say application development is
primarily responsible for security of mobile apps. In the case of IoT apps, only 5 percent of respondents say the CISO is primarily responsible. Instead, the
head of product engineering and lines of business are most responsible (31 percent and 21 percent of respondents, respectively).
Figure 7. Who is primarily responsible for the security of mobile and IoT apps?
1 = not important to 10 = very important, 7+ responses reported
www.arxan.com
2017 Study on Mobile IoT Application Security
Ponemon Institute© Research Report
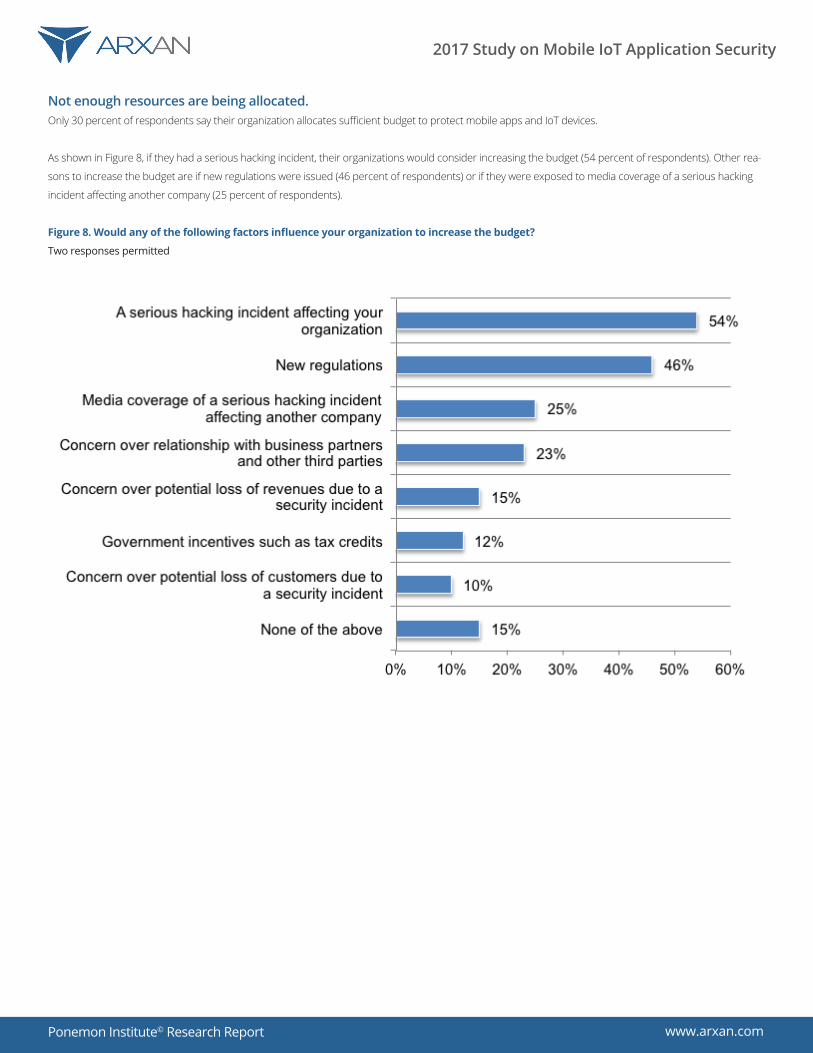
Not enough resources are being allocated. Only 30 percent of respondents say their organization allocates sufficient budget to protect mobile apps and IoT devices.
As shown in Figure 8, if they had a serious hacking incident, their organizations would consider increasing the budget (54 percent of respondents). Other rea-
sons to increase the budget are if new regulations were issued (46 percent of respondents) or if they were exposed to media coverage of a serious hacking
incident affecting another company (25 percent of respondents).
Figure 8. Would any of the following factors influence your organization to increase the budget?
Two responses permitted
www.arxan.com
2017 Study on Mobile IoT Application Security
Ponemon Institute© Research Report
Are organizations mobilized to reduce the risk?
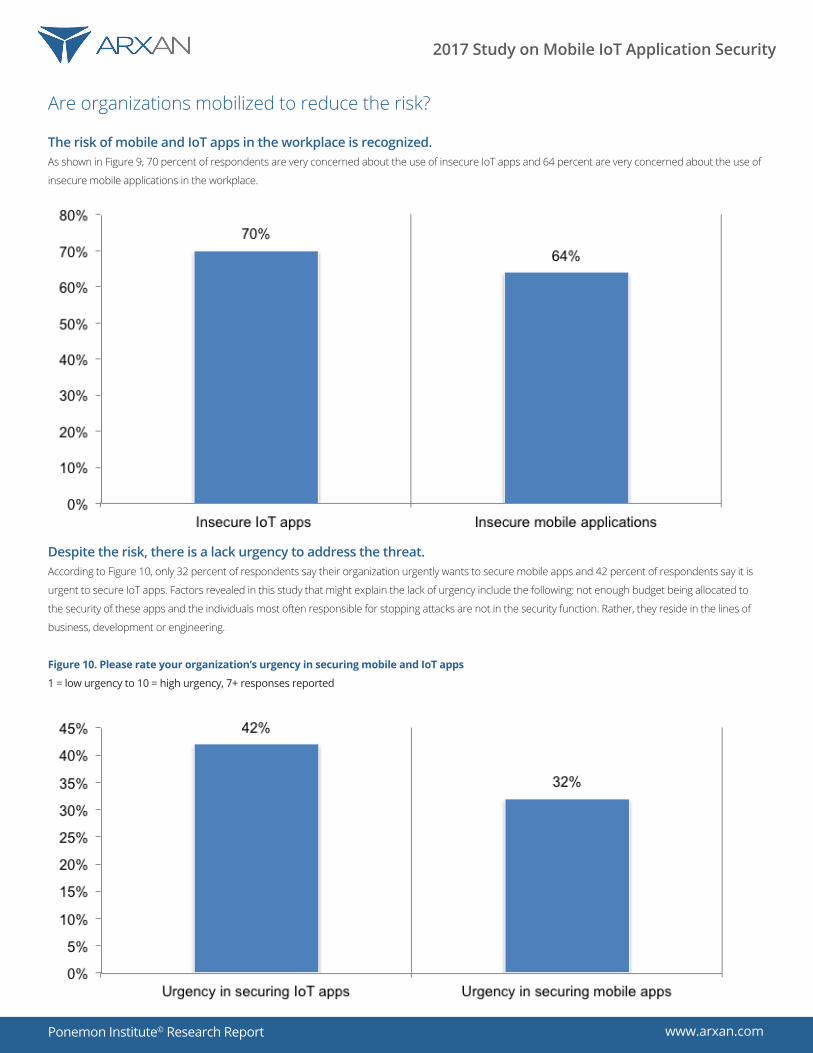
The risk of mobile and IoT apps in the workplace is recognized. As shown in Figure 9, 70 percent of respondents are very concerned about the use of insecure IoT apps and 64 percent are very concerned about the use of
insecure mobile applications in the workplace.
Figure 9. How concerned are you about the use of insecure mobile and IoT apps in the workplace?
1 = not concerned to 10 = very concerned, 7+ responses reported
Despite the risk, there is a lack urgency to address the threat. According to Figure 10, only 32 percent of respondents say their organization urgently wants to secure mobile apps and 42 percent of respondents say it is
urgent to secure IoT apps. Factors revealed in this study that might explain the lack of urgency include the following: not enough budget being allocated to
the security of these apps and the individuals most often responsible for stopping attacks are not in the security function. Rather, they reside in the lines of
business, development or engineering.
Figure 10. Please rate your organization’s urgency in securing mobile and IoT apps
1 = low urgency to 10 = high urgency, 7+ responses reported
www.arxan.com
2017 Study on Mobile IoT Application Security
Ponemon Institute© Research Report
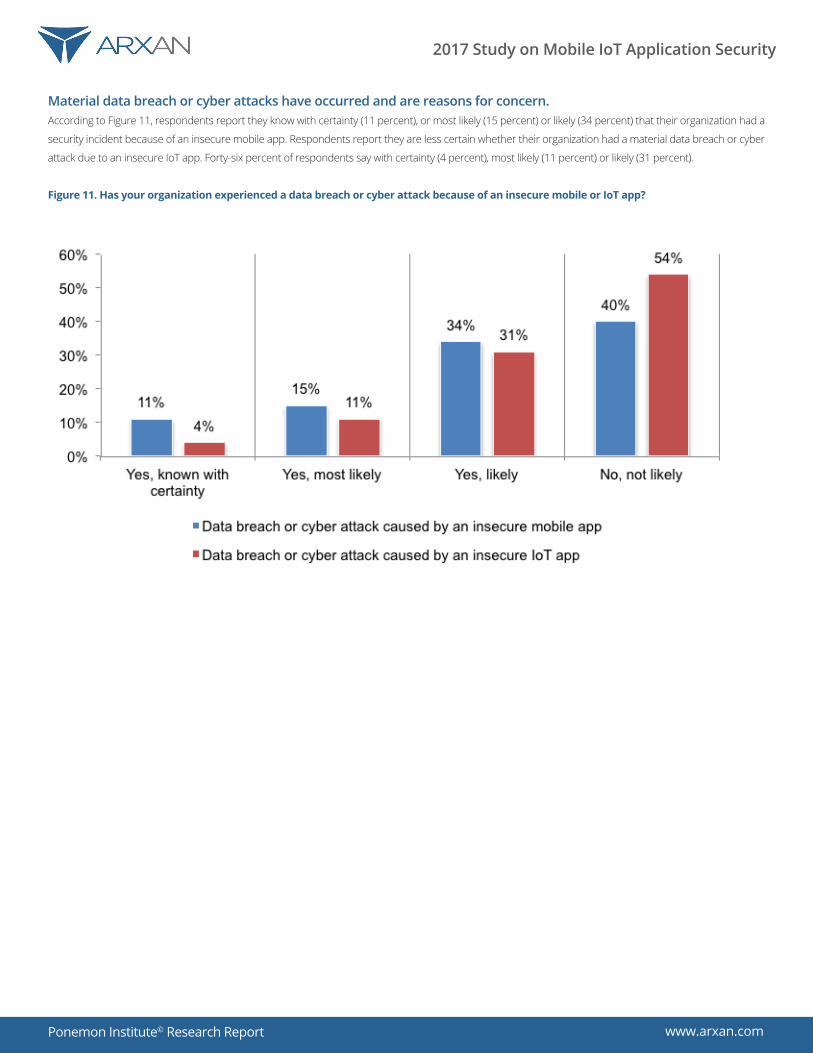
Material data breach or cyber attacks have occurred and are reasons for concern. According to Figure 11, respondents report they know with certainty (11 percent), or most likely (15 percent) or likely (34 percent) that their organization had a
security incident because of an insecure mobile app. Respondents report they are less certain whether their organization had a material data breach or cyber
attack due to an insecure IoT app. Forty-six percent of respondents say with certainty (4 percent), most likely (11 percent) or likely (31 percent).
Figure 11. Has your organization experienced a data breach or cyber attack because of an insecure mobile or IoT app?
www.arxan.com
2017 Study on Mobile IoT Application Security
Ponemon Institute© Research Report
Current security practices in place
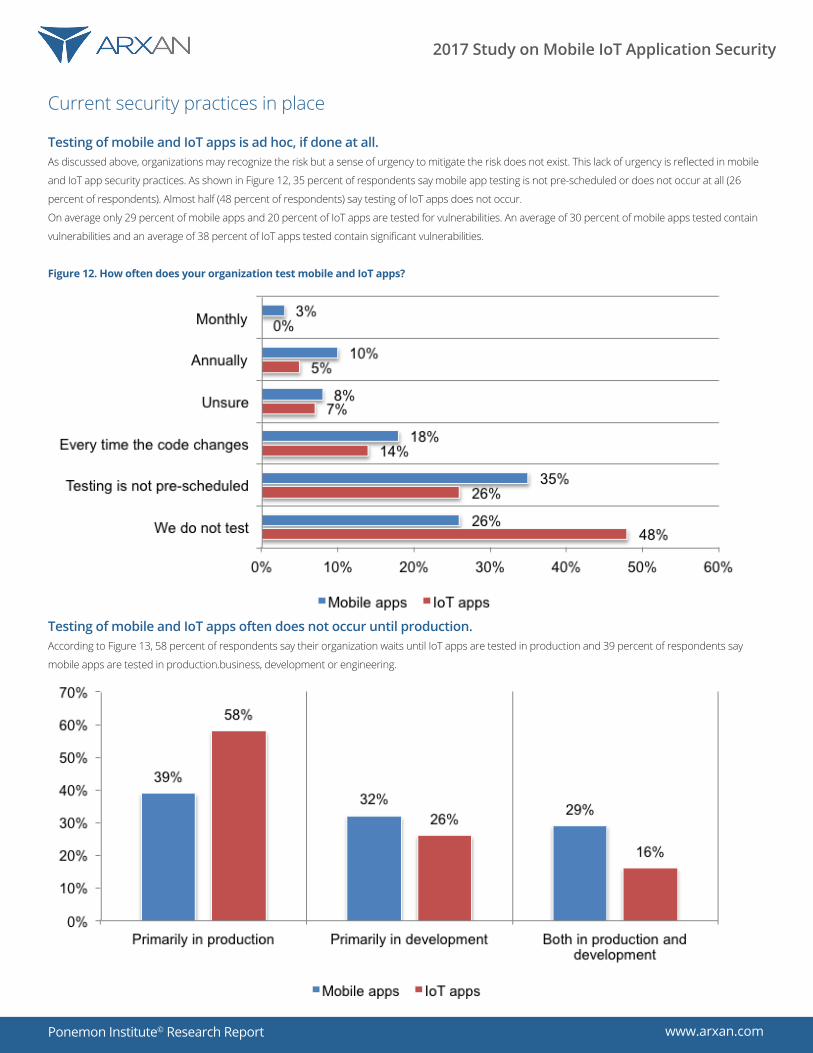
Testing of mobile and IoT apps is ad hoc, if done at all. As discussed above, organizations may recognize the risk but a sense of urgency to mitigate the risk does not exist. This lack of urgency is reflected in mobile
and IoT app security practices. As shown in Figure 12, 35 percent of respondents say mobile app testing is not pre-scheduled or does not occur at all (26
percent of respondents). Almost half (48 percent of respondents) say testing of IoT apps does not occur.
On average only 29 percent of mobile apps and 20 percent of IoT apps are tested for vulnerabilities. An average of 30 percent of mobile apps tested contain
vulnerabilities and an average of 38 percent of IoT apps tested contain significant vulnerabilities.
Figure 12. How often does your organization test mobile and IoT apps?
Testing of mobile and IoT apps often does not occur until production. According to Figure 13, 58 percent of respondents say their organization waits until IoT apps are tested in production and 39 percent of respondents say
mobile apps are tested in production.business, development or engineering.
Figure 13. Where are mobile and IoT apps tested?
www.arxan.com
2017 Study on Mobile IoT Application Security
Ponemon Institute© Research Report
Pen testing is the primary means of securing mobile and IoT apps. The same approaches are used to secure mobile and IoT apps. As shown in Figure 14, 57 percent of respondents say the primary means of securing
mobile apps is pen testing and 39 percent of respondents say pen testing is used to secure IoT apps. Fifty-five percent of respondents say their orga-
nization educates developers on safe coding for mobile apps and only 30 percent of respondents say their organization educates developers on safe
coding practices for IoT apps.
Figure 14. The top five means of securing mobile and IoT apps More than one response permitted
Broken cryptography and unintended data leakage are the most difficult mobile risks to mitigate. As shown in Figure 15, 49 percent of respondents say their organization follows guidance from the Open Web Application Security Project (OWASP). Seventy
percent of respondents say broken cryptography and 65 percent say unintended data leakage are the most serious mobile app security risks. The least
serious risk is the lack of binary protection.
Figure 15. The most difficult OWASP mobile app security risks to mitigate Very difficult and Difficult responses combined
www.arxan.com
2017 Study on Mobile IoT Application Security
Ponemon Institute© Research Report
Rush to release is the main reason why both mobile and IoT apps contain vulnerable code. The same approaches are used to secure mobile and IoT apps. As shown in Figure 14, 57 percent of respondents say the primary means of securing
mobile apps is pen testing and 39 percent of respondents say pen testing is used to secure IoT apps. Fifty-five percent of respondents say their orga-
nization educates developers on safe coding for mobile apps and only 30 percent of respondents say their organization educates developers on safe
coding practices for IoT apps.
Figure 14. The top five means of securing mobile and IoT apps More than one response permitted
www.arxan.com
2017 Study on Mobile IoT Application Security
Ponemon Institute© Research Report
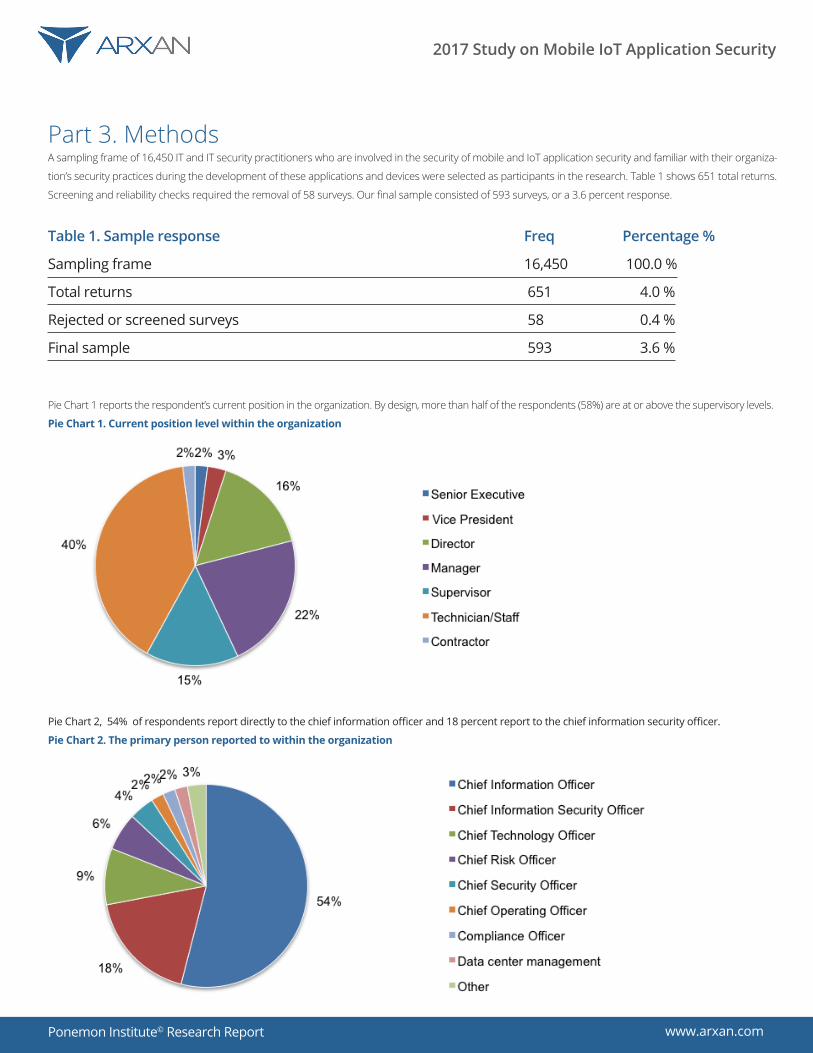
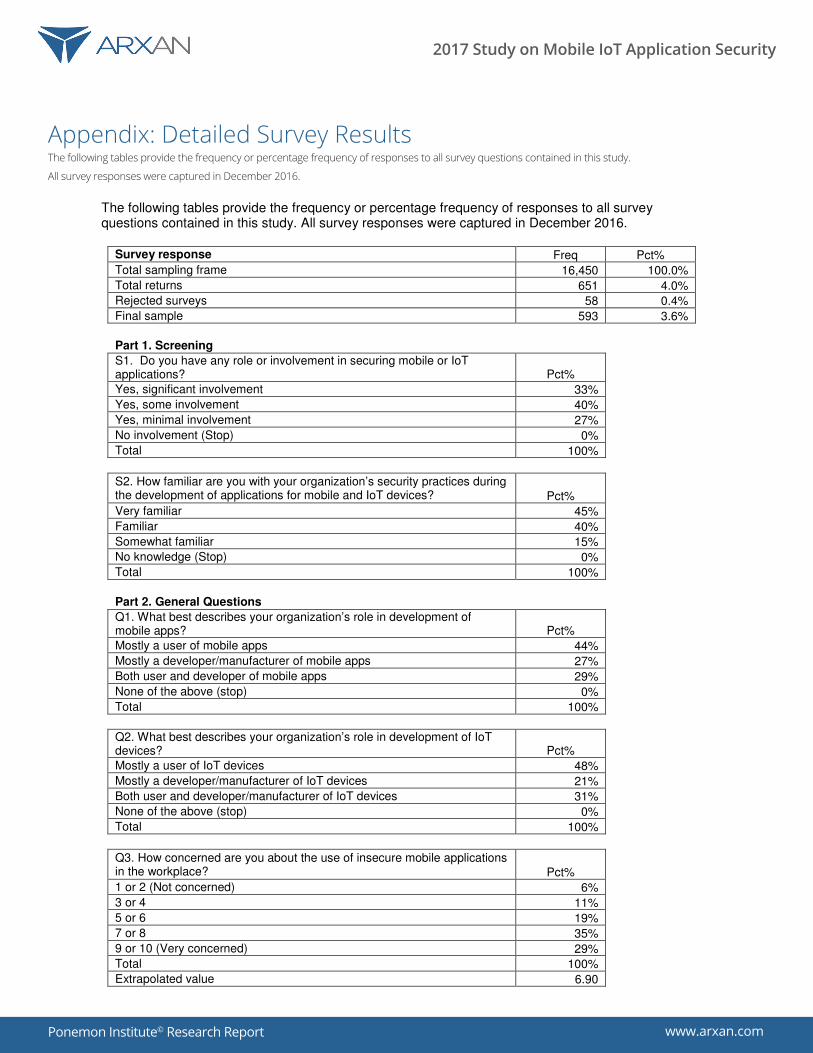
Part 3. Methods A sampling frame of 16,450 IT and IT security practitioners who are involved in the security of mobile and IoT application security and familiar with their organiza-
tion’s security practices during the development of these applications and devices were selected as participants in the research. Table 1 shows 651 total returns.
Screening and reliability checks required the removal of 58 surveys. Our final sample consisted of 593 surveys, or a 3.6 percent response.
Table 1. Sample response Freq Percentage %
Sampling frame 16,450 100.0 %
Total returns 651 4.0 %
Rejected or screened surveys 58 0.4 %
Final sample 593 3.6 %
Pie Chart 1 reports the respondent’s current position in the organization. By design, more than half of the respondents (58%) are at or above the supervisory levels.
Pie Chart 1. Current position level within the organization
Pie Chart 2, 54% of respondents report directly to the chief information officer and 18 percent report to the chief information security officer.
Pie Chart 2. The primary person reported to within the organization
www.arxan.com
2017 Study on Mobile IoT Application Security
Ponemon Institute© Research Report
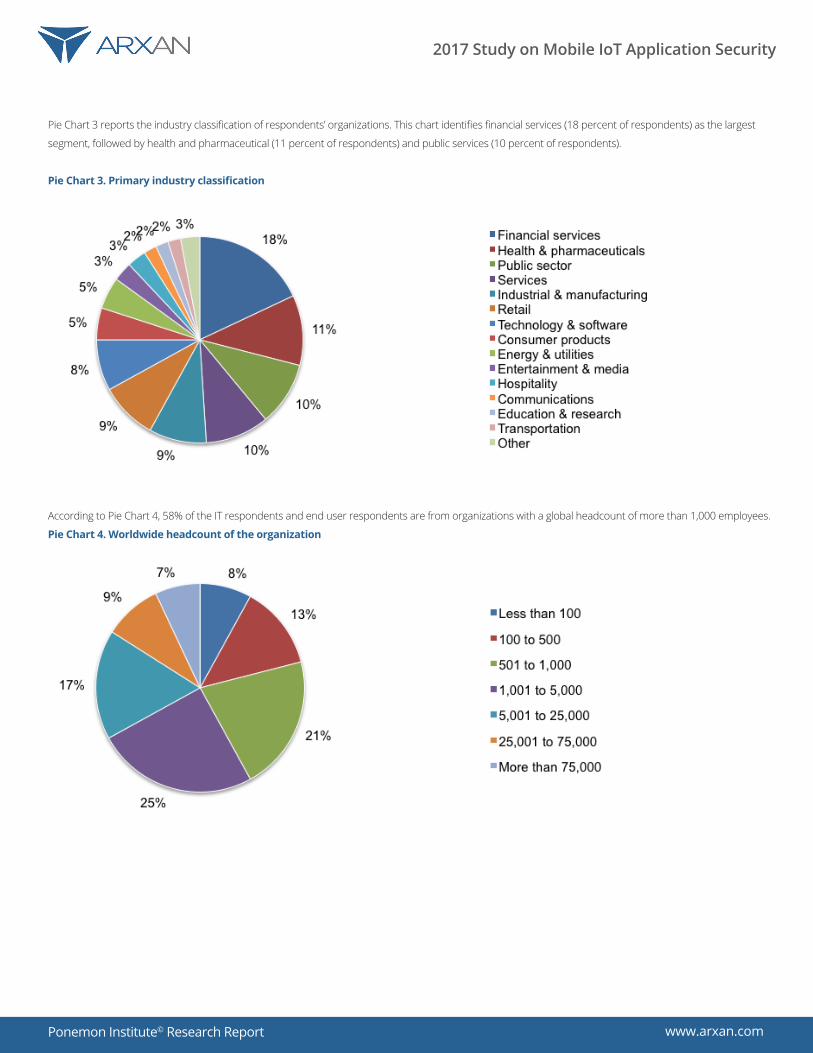
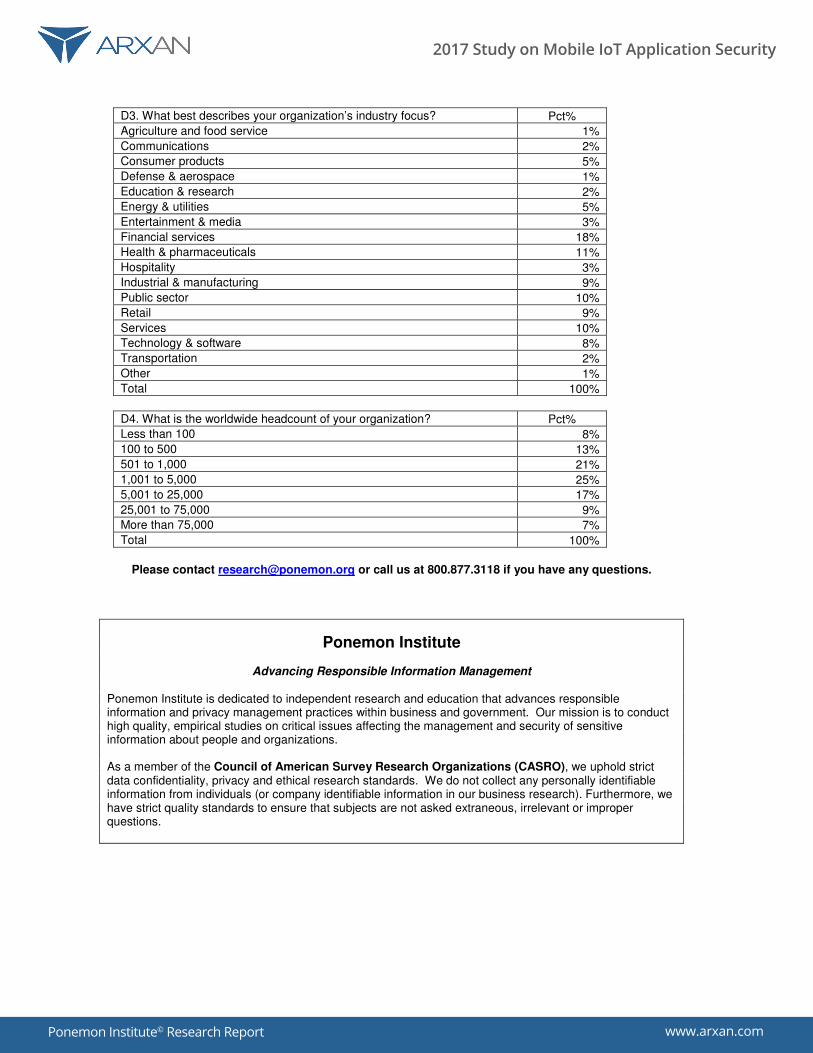
Pie Chart 3 reports the industry classification of respondents’ organizations. This chart identifies financial services (18 percent of respondents) as the largest
segment, followed by health and pharmaceutical (11 percent of respondents) and public services (10 percent of respondents).
Pie Chart 3. Primary industry classification
According to Pie Chart 4, 58% of the IT respondents and end user respondents are from organizations with a global headcount of more than 1,000 employees.
Pie Chart 4. Worldwide headcount of the organization
www.arxan.com
2017 Study on Mobile IoT Application Security
Ponemon Institute© Research Report
Part 4. Caveats to this study There are inherent limitations to survey research that need to be carefully considered before drawing inferences from findings.
The following items are specific limitations that are germane to most Web-based surveys.
• Non-response bias: The current findings are based on a sample of survey returns. We sent surveys to a representative sample of individuals,
resulting in a large number of usable returned responses. Despite non-response tests, it is always possible that individuals who did not
participate are substantially different in terms of underlying beliefs from those who completed the instrument.
• Sampling-frame bias: The accuracy is based on contact information and the degree to which the list is representative of individuals who are
involved in the security of mobile and IoT application security in their organizations. We also acknowledge that the results may be biased by e
xternal events such as media coverage. Finally, because we used a Web-based collection method, it is possible that non-Web responses
by mailed survey or telephone call would result in a different pattern of findings.
• Self-reported results: The quality of survey research is based on the integrity of confidential responses received from subjects.
While certain checks and balances can be incorporated into the survey process, there is always the possibility that a subject did
not provide accurate responses.
www.arxan.com
2017 Study on Mobile IoT Application Security
Ponemon Institute© Research Report
Appendix: Detailed Survey Results The following tables provide the frequency or percentage frequency of responses to all survey questions contained in this study.
All survey responses were captured in December 2016.
Ponemon Institute© Research Report Page 19
Appendix: Detailed Survey Results
The following tables provide the frequency or percentage frequency of responses to all survey questions contained in this study. All survey responses were captured in December 2016.
Survey response Freq Pct%
Total sampling frame 16,450 100.0%
Total returns 651 4.0%
Rejected surveys 58 0.4%
Final sample 593 3.6%
Part 1. Screening S1. Do you have any role or involvement in securing mobile or IoT applications? Pct% Yes, significant involvement 33% Yes, some involvement 40% Yes, minimal involvement 27% No involvement (Stop) 0% Total 100%
S2. How familiar are you with your organization’s security practices during the development of applications for mobile and IoT devices? Pct% Very familiar 45% Familiar 40% Somewhat familiar 15% No knowledge (Stop) 0% Total 100%
Part 2. General Questions Q1. What best describes your organization’s role in development of mobile apps? Pct% Mostly a user of mobile apps 44% Mostly a developer/manufacturer of mobile apps 27% Both user and developer of mobile apps 29% None of the above (stop) 0% Total 100%
Q2. What best describes your organization’s role in development of IoT devices? Pct% Mostly a user of IoT devices 48% Mostly a developer/manufacturer of IoT devices 21% Both user and developer/manufacturer of IoT devices 31% None of the above (stop) 0% Total 100%
Q3. How concerned are you about the use of insecure mobile applications in the workplace? Pct% 1 or 2 (Not concerned) 6% 3 or 4 11% 5 or 6 19% 7 or 8 35% 9 or 10 (Very concerned) 29% Total 100% Extrapolated value 6.90
www.arxan.com
2017 Study on Mobile IoT Application Security
Ponemon Institute© Research Report
Ponemon Institute© Research Report Page 20
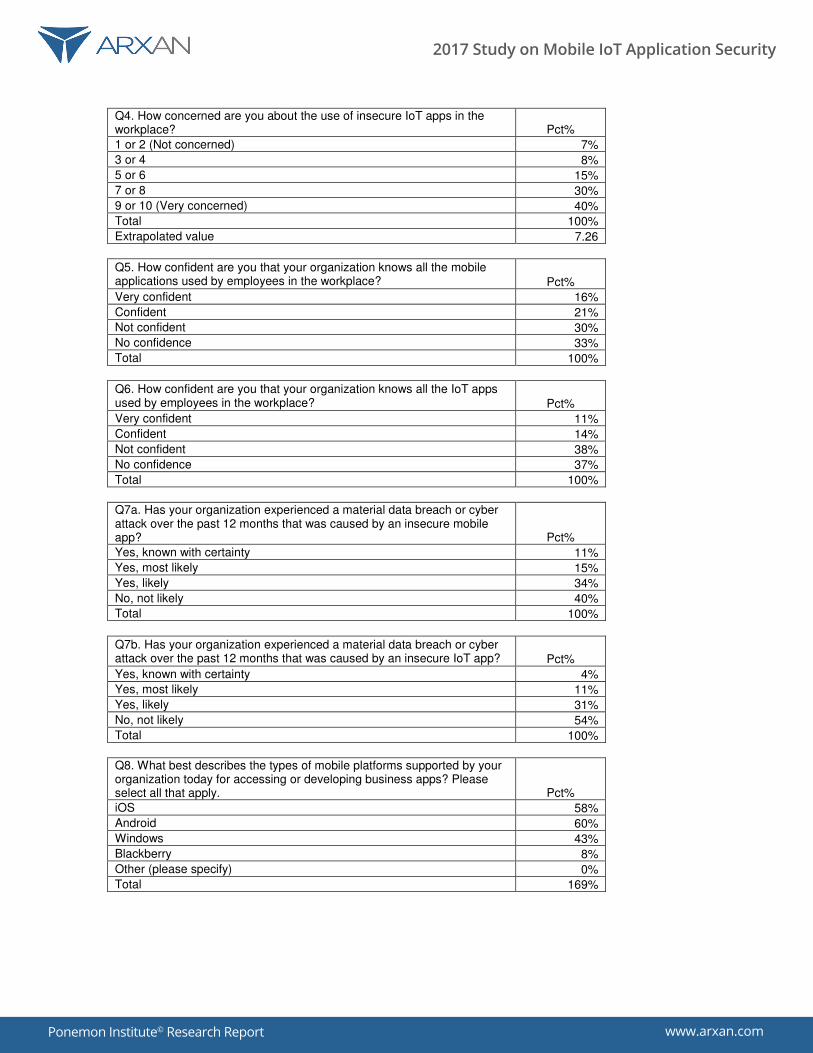
Q4. How concerned are you about the use of insecure IoT apps in the workplace? Pct% 1 or 2 (Not concerned) 7% 3 or 4 8% 5 or 6 15% 7 or 8 30% 9 or 10 (Very concerned) 40% Total 100% Extrapolated value 7.26
Q5. How confident are you that your organization knows all the mobile applications used by employees in the workplace? Pct% Very confident 16% Confident 21% Not confident 30% No confidence 33% Total 100%
Q6. How confident are you that your organization knows all the IoT apps used by employees in the workplace? Pct% Very confident 11% Confident 14% Not confident 38% No confidence 37% Total 100%
Q7a. Has your organization experienced a material data breach or cyber attack over the past 12 months that was caused by an insecure mobile app? Pct% Yes, known with certainty 11% Yes, most likely 15% Yes, likely 34% No, not likely 40% Total 100%
Q7b. Has your organization experienced a material data breach or cyber attack over the past 12 months that was caused by an insecure IoT app? Pct% Yes, known with certainty 4% Yes, most likely 11% Yes, likely 31% No, not likely 54% Total 100%
Q8. What best describes the types of mobile platforms supported by your organization today for accessing or developing business apps? Please select all that apply. Pct% iOS 58% Android 60% Windows 43% Blackberry 8% Other (please specify) 0% Total 169%
www.arxan.com
2017 Study on Mobile IoT Application Security
Ponemon Institute© Research Report
Ponemon Institute© Research Report Page 21
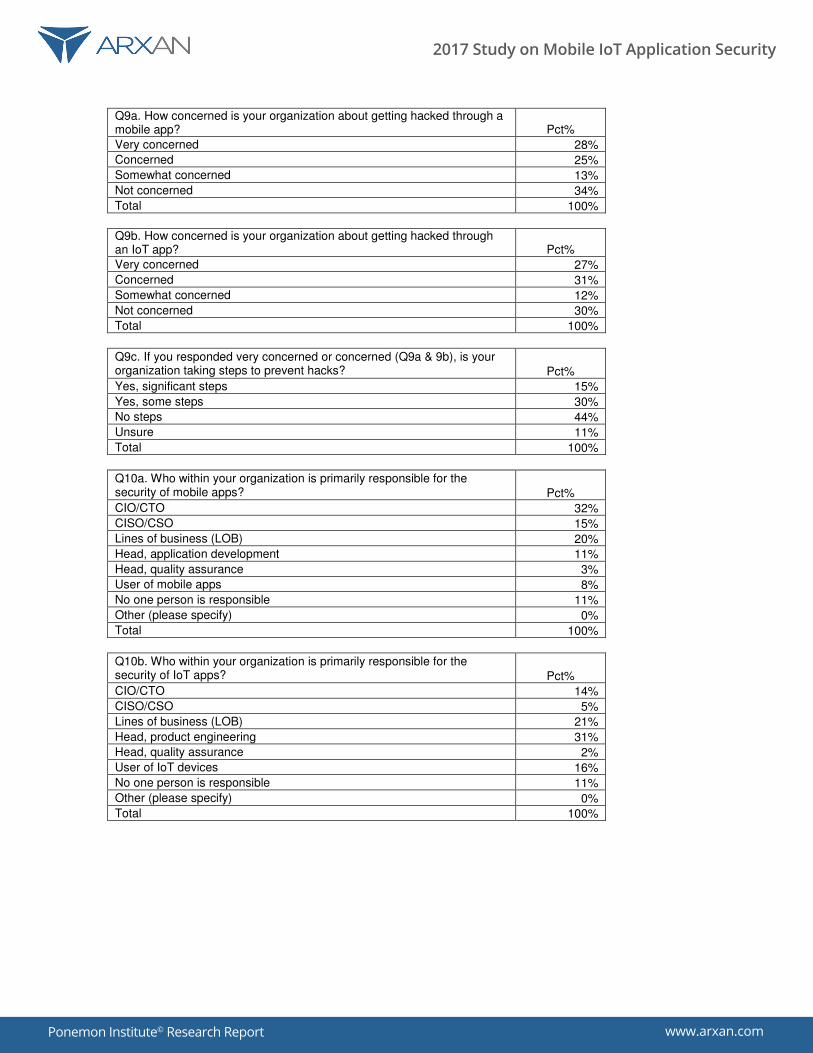
Q9a. How concerned is your organization about getting hacked through a mobile app? Pct% Very concerned 28% Concerned 25% Somewhat concerned 13% Not concerned 34% Total 100%
Q9b. How concerned is your organization about getting hacked through an IoT app? Pct% Very concerned 27% Concerned 31% Somewhat concerned 12% Not concerned 30% Total 100%
Q9c. If you responded very concerned or concerned (Q9a & 9b), is your organization taking steps to prevent hacks? Pct% Yes, significant steps 15% Yes, some steps 30% No steps 44% Unsure 11% Total 100%
Q10a. Who within your organization is primarily responsible for the security of mobile apps? Pct% CIO/CTO 32% CISO/CSO 15% Lines of business (LOB) 20% Head, application development 11% Head, quality assurance 3% User of mobile apps 8% No one person is responsible 11% Other (please specify) 0% Total 100%
Q10b. Who within your organization is primarily responsible for the security of IoT apps? Pct% CIO/CTO 14% CISO/CSO 5% Lines of business (LOB) 21% Head, product engineering 31% Head, quality assurance 2% User of IoT devices 16% No one person is responsible 11% Other (please specify) 0% Total 100%
www.arxan.com
2017 Study on Mobile IoT Application Security
Ponemon Institute© Research Report
Ponemon Institute© Research Report Page 22
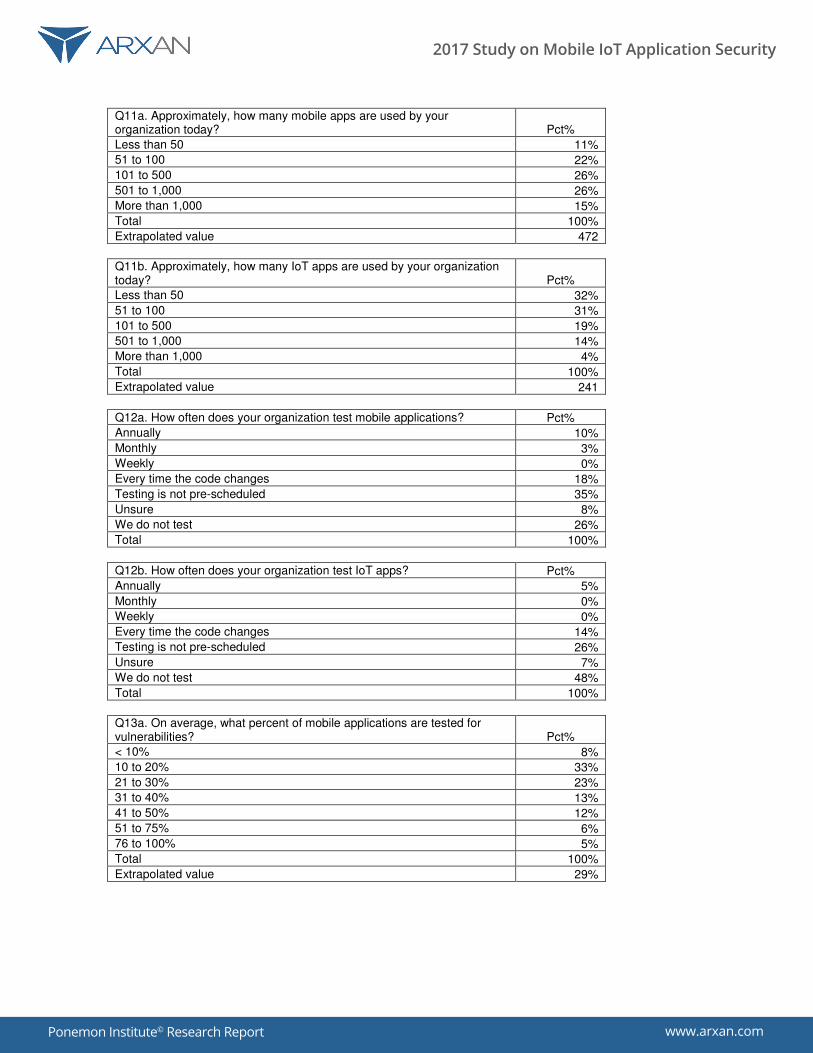
Q11a. Approximately, how many mobile apps are used by your organization today? Pct% Less than 50 11% 51 to 100 22% 101 to 500 26% 501 to 1,000 26% More than 1,000 15% Total 100% Extrapolated value 472
Q11b. Approximately, how many IoT apps are used by your organization today? Pct% Less than 50 32% 51 to 100 31% 101 to 500 19% 501 to 1,000 14% More than 1,000 4% Total 100% Extrapolated value 241
Q12a. How often does your organization test mobile applications? Pct% Annually 10% Monthly 3% Weekly 0% Every time the code changes 18% Testing is not pre-scheduled 35% Unsure 8% We do not test 26% Total 100%
Q12b. How often does your organization test IoT apps? Pct% Annually 5% Monthly 0% Weekly 0% Every time the code changes 14% Testing is not pre-scheduled 26% Unsure 7% We do not test 48% Total 100%
Q13a. On average, what percent of mobile applications are tested for vulnerabilities? Pct% < 10% 8% 10 to 20% 33% 21 to 30% 23% 31 to 40% 13% 41 to 50% 12% 51 to 75% 6% 76 to 100% 5% Total 100% Extrapolated value 29%
www.arxan.com
2017 Study on Mobile IoT Application Security
Ponemon Institute© Research Report
Ponemon Institute© Research Report Page 23
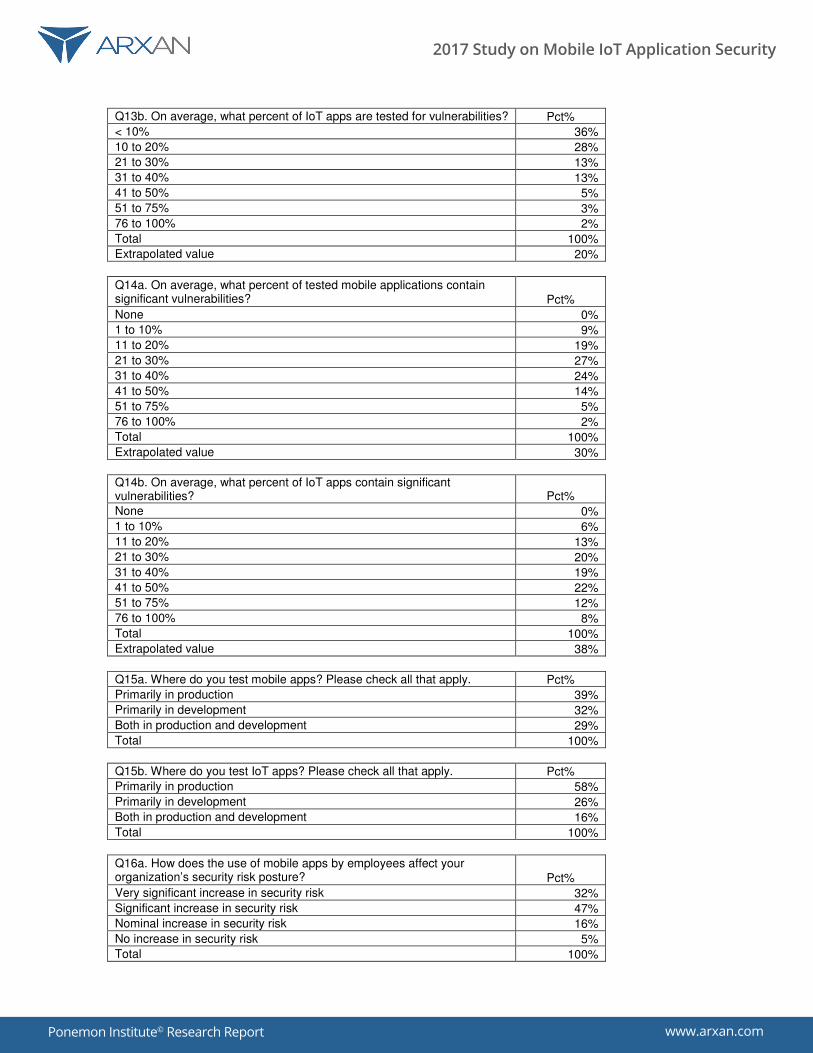
Q13b. On average, what percent of IoT apps are tested for vulnerabilities? Pct% < 10% 36% 10 to 20% 28% 21 to 30% 13% 31 to 40% 13% 41 to 50% 5% 51 to 75% 3% 76 to 100% 2% Total 100% Extrapolated value 20%
Q14a. On average, what percent of tested mobile applications contain significant vulnerabilities? Pct% None 0% 1 to 10% 9% 11 to 20% 19% 21 to 30% 27% 31 to 40% 24% 41 to 50% 14% 51 to 75% 5% 76 to 100% 2% Total 100% Extrapolated value 30%
Q14b. On average, what percent of IoT apps contain significant vulnerabilities? Pct% None 0% 1 to 10% 6% 11 to 20% 13% 21 to 30% 20% 31 to 40% 19% 41 to 50% 22% 51 to 75% 12% 76 to 100% 8% Total 100% Extrapolated value 38%
Q15a. Where do you test mobile apps? Please check all that apply. Pct% Primarily in production 39% Primarily in development 32% Both in production and development 29% Total 100%
Q15b. Where do you test IoT apps? Please check all that apply. Pct% Primarily in production 58% Primarily in development 26% Both in production and development 16% Total 100%
Q16a. How does the use of mobile apps by employees affect your organization’s security risk posture? Pct% Very significant increase in security risk 32% Significant increase in security risk 47% Nominal increase in security risk 16% No increase in security risk 5% Total 100%
www.arxan.com
2017 Study on Mobile IoT Application Security
Ponemon Institute© Research Report
Ponemon Institute© Research Report Page 24
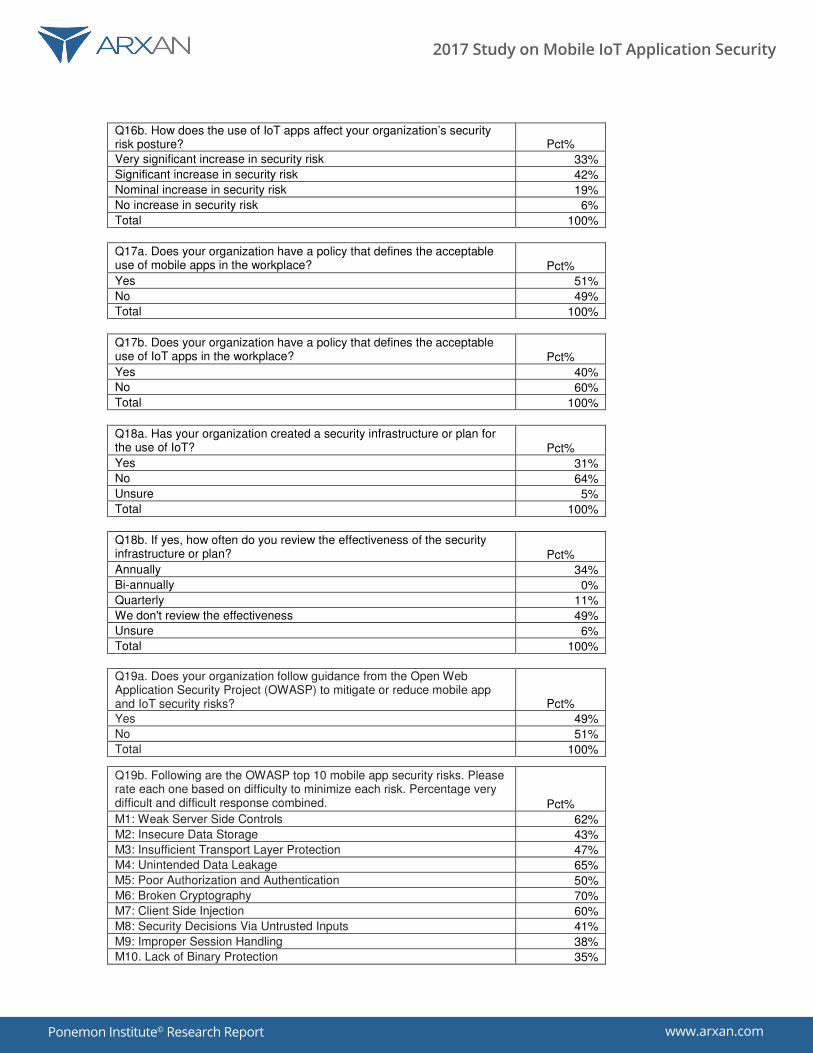
Q16b. How does the use of IoT apps affect your organization’s security risk posture? Pct% Very significant increase in security risk 33% Significant increase in security risk 42% Nominal increase in security risk 19% No increase in security risk 6% Total 100%
Q17a. Does your organization have a policy that defines the acceptable use of mobile apps in the workplace? Pct% Yes 51% No 49% Total 100%
Q17b. Does your organization have a policy that defines the acceptable use of IoT apps in the workplace? Pct% Yes 40% No 60% Total 100%
Q18a. Has your organization created a security infrastructure or plan for the use of IoT? Pct% Yes 31% No 64% Unsure 5% Total 100%
Q18b. If yes, how often do you review the effectiveness of the security infrastructure or plan? Pct% Annually 34% Bi-annually 0% Quarterly 11% We don't review the effectiveness 49% Unsure 6% Total 100%
Q19a. Does your organization follow guidance from the Open Web Application Security Project (OWASP) to mitigate or reduce mobile app and IoT security risks? Pct% Yes 49% No 51% Total 100% Q19b. Following are the OWASP top 10 mobile app security risks. Please rate each one based on difficulty to minimize each risk. Percentage very difficult and difficult response combined. Pct% M1: Weak Server Side Controls 62% M2: Insecure Data Storage 43% M3: Insufficient Transport Layer Protection 47% M4: Unintended Data Leakage 65% M5: Poor Authorization and Authentication 50% M6: Broken Cryptography 70% M7: Client Side Injection 60% M8: Security Decisions Via Untrusted Inputs 41% M9: Improper Session Handling 38% M10. Lack of Binary Protection 35%
www.arxan.com
2017 Study on Mobile IoT Application Security
Ponemon Institute© Research Report
Ponemon Institute© Research Report Page 25
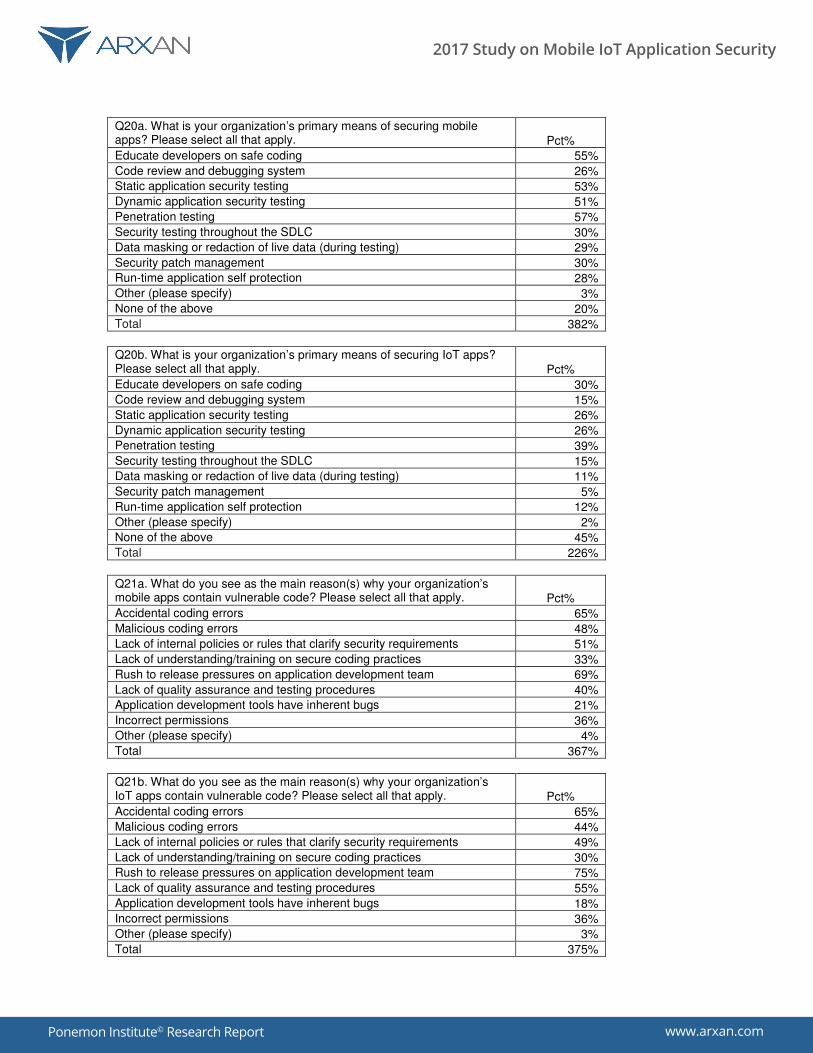
Q20a. What is your organization’s primary means of securing mobile apps? Please select all that apply. Pct% Educate developers on safe coding 55% Code review and debugging system 26% Static application security testing 53% Dynamic application security testing 51% Penetration testing 57% Security testing throughout the SDLC 30% Data masking or redaction of live data (during testing) 29% Security patch management 30% Run-time application self protection 28% Other (please specify) 3% None of the above 20% Total 382%
Q20b. What is your organization’s primary means of securing IoT apps? Please select all that apply. Pct% Educate developers on safe coding 30% Code review and debugging system 15% Static application security testing 26% Dynamic application security testing 26% Penetration testing 39% Security testing throughout the SDLC 15% Data masking or redaction of live data (during testing) 11% Security patch management 5% Run-time application self protection 12% Other (please specify) 2% None of the above 45% Total 226%
Q21a. What do you see as the main reason(s) why your organization’s mobile apps contain vulnerable code? Please select all that apply. Pct% Accidental coding errors 65% Malicious coding errors 48% Lack of internal policies or rules that clarify security requirements 51% Lack of understanding/training on secure coding practices 33% Rush to release pressures on application development team 69% Lack of quality assurance and testing procedures 40% Application development tools have inherent bugs 21% Incorrect permissions 36% Other (please specify) 4% Total 367%
Q21b. What do you see as the main reason(s) why your organization’s IoT apps contain vulnerable code? Please select all that apply. Pct% Accidental coding errors 65% Malicious coding errors 44% Lack of internal policies or rules that clarify security requirements 49% Lack of understanding/training on secure coding practices 30% Rush to release pressures on application development team 75% Lack of quality assurance and testing procedures 55% Application development tools have inherent bugs 18% Incorrect permissions 36% Other (please specify) 3% Total 375%
www.arxan.com
2017 Study on Mobile IoT Application Security
Ponemon Institute© Research Report
Ponemon Institute© Research Report Page 27
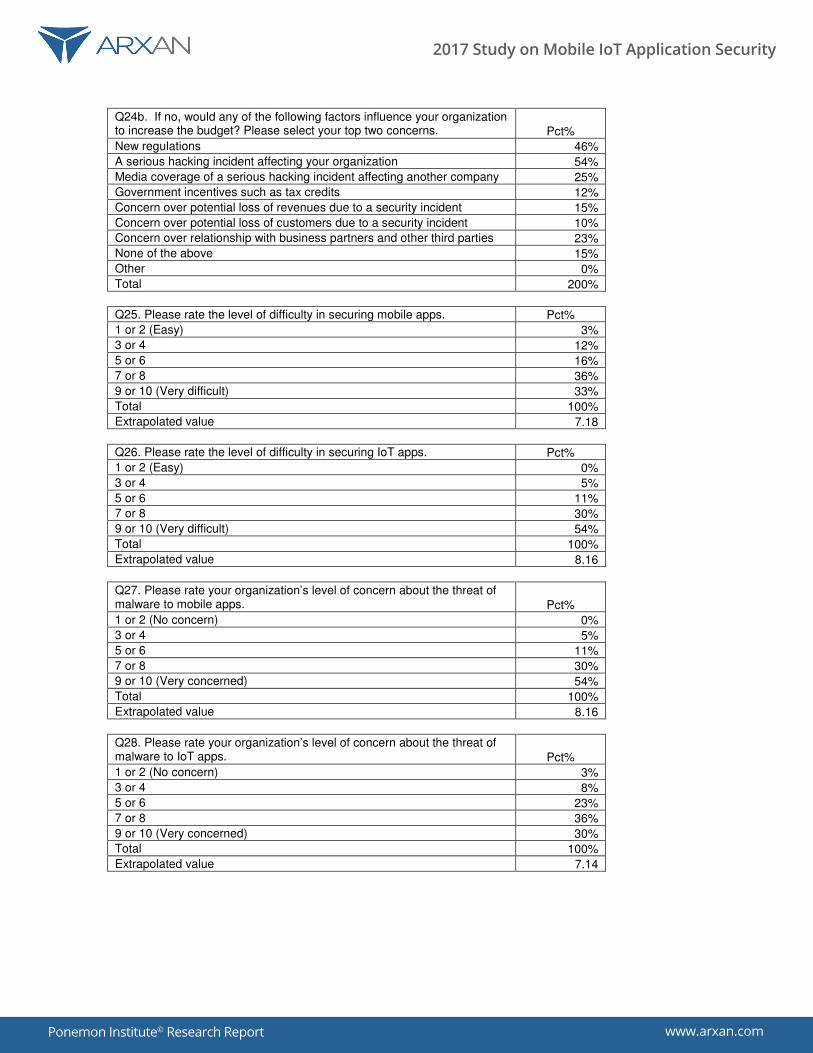
Q24b. If no, would any of the following factors influence your organization to increase the budget? Please select your top two concerns. Pct% New regulations 46% A serious hacking incident affecting your organization 54% Media coverage of a serious hacking incident affecting another company 25% Government incentives such as tax credits 12% Concern over potential loss of revenues due to a security incident 15% Concern over potential loss of customers due to a security incident 10% Concern over relationship with business partners and other third parties 23% None of the above 15% Other 0% Total 200%
Q25. Please rate the level of difficulty in securing mobile apps. Pct% 1 or 2 (Easy) 3% 3 or 4 12% 5 or 6 16% 7 or 8 36% 9 or 10 (Very difficult) 33% Total 100% Extrapolated value 7.18
Q26. Please rate the level of difficulty in securing IoT apps. Pct% 1 or 2 (Easy) 0% 3 or 4 5% 5 or 6 11% 7 or 8 30% 9 or 10 (Very difficult) 54% Total 100% Extrapolated value 8.16
Q27. Please rate your organization’s level of concern about the threat of malware to mobile apps. Pct% 1 or 2 (No concern) 0% 3 or 4 5% 5 or 6 11% 7 or 8 30% 9 or 10 (Very concerned) 54% Total 100% Extrapolated value 8.16
Q28. Please rate your organization’s level of concern about the threat of malware to IoT apps. Pct% 1 or 2 (No concern) 3% 3 or 4 8% 5 or 6 23% 7 or 8 36% 9 or 10 (Very concerned) 30% Total 100% Extrapolated value 7.14
www.arxan.com
2017 Study on Mobile IoT Application Security
Ponemon Institute© Research Report
Ponemon Institute© Research Report Page 28
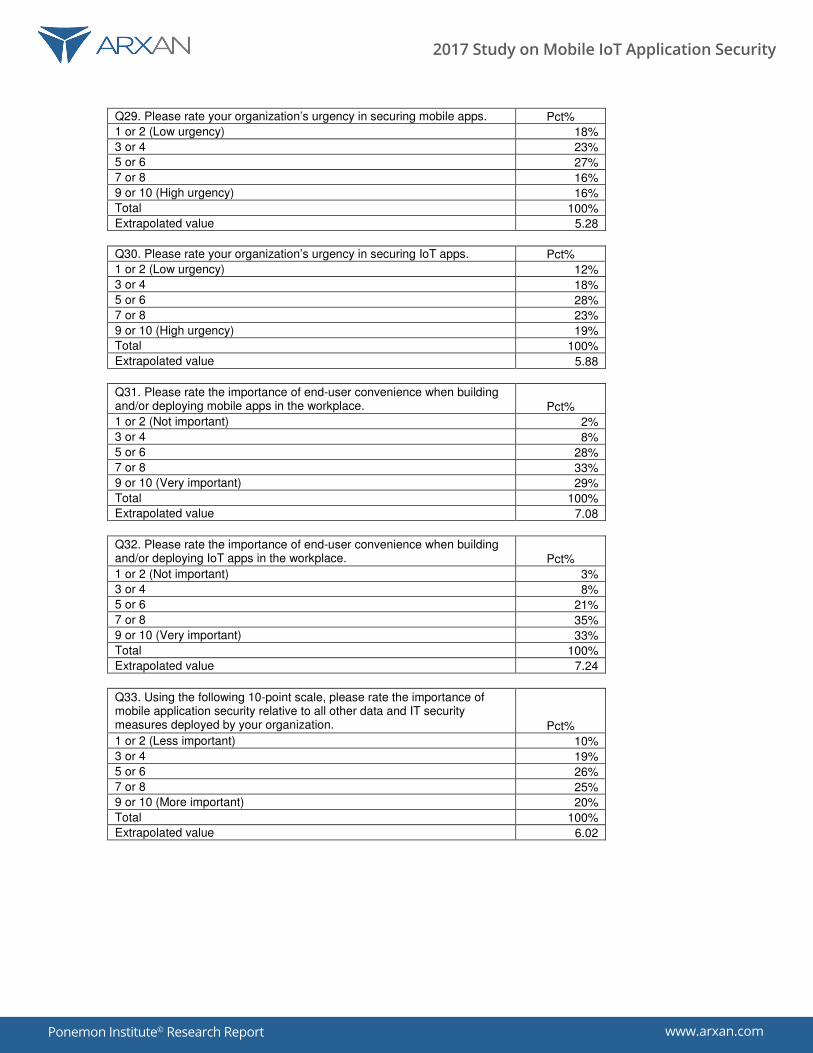
Q29. Please rate your organization’s urgency in securing mobile apps. Pct% 1 or 2 (Low urgency) 18% 3 or 4 23% 5 or 6 27% 7 or 8 16% 9 or 10 (High urgency) 16% Total 100% Extrapolated value 5.28
Q30. Please rate your organization’s urgency in securing IoT apps. Pct% 1 or 2 (Low urgency) 12% 3 or 4 18% 5 or 6 28% 7 or 8 23% 9 or 10 (High urgency) 19% Total 100% Extrapolated value 5.88
Q31. Please rate the importance of end-user convenience when building and/or deploying mobile apps in the workplace. Pct% 1 or 2 (Not important) 2% 3 or 4 8% 5 or 6 28% 7 or 8 33% 9 or 10 (Very important) 29% Total 100% Extrapolated value 7.08
Q32. Please rate the importance of end-user convenience when building and/or deploying IoT apps in the workplace. Pct% 1 or 2 (Not important) 3% 3 or 4 8% 5 or 6 21% 7 or 8 35% 9 or 10 (Very important) 33% Total 100% Extrapolated value 7.24
Q33. Using the following 10-point scale, please rate the importance of mobile application security relative to all other data and IT security measures deployed by your organization. Pct% 1 or 2 (Less important) 10% 3 or 4 19% 5 or 6 26% 7 or 8 25% 9 or 10 (More important) 20% Total 100% Extrapolated value 6.02
www.arxan.com
2017 Study on Mobile IoT Application Security
Ponemon Institute© Research Report
Ponemon Institute© Research Report Page 29
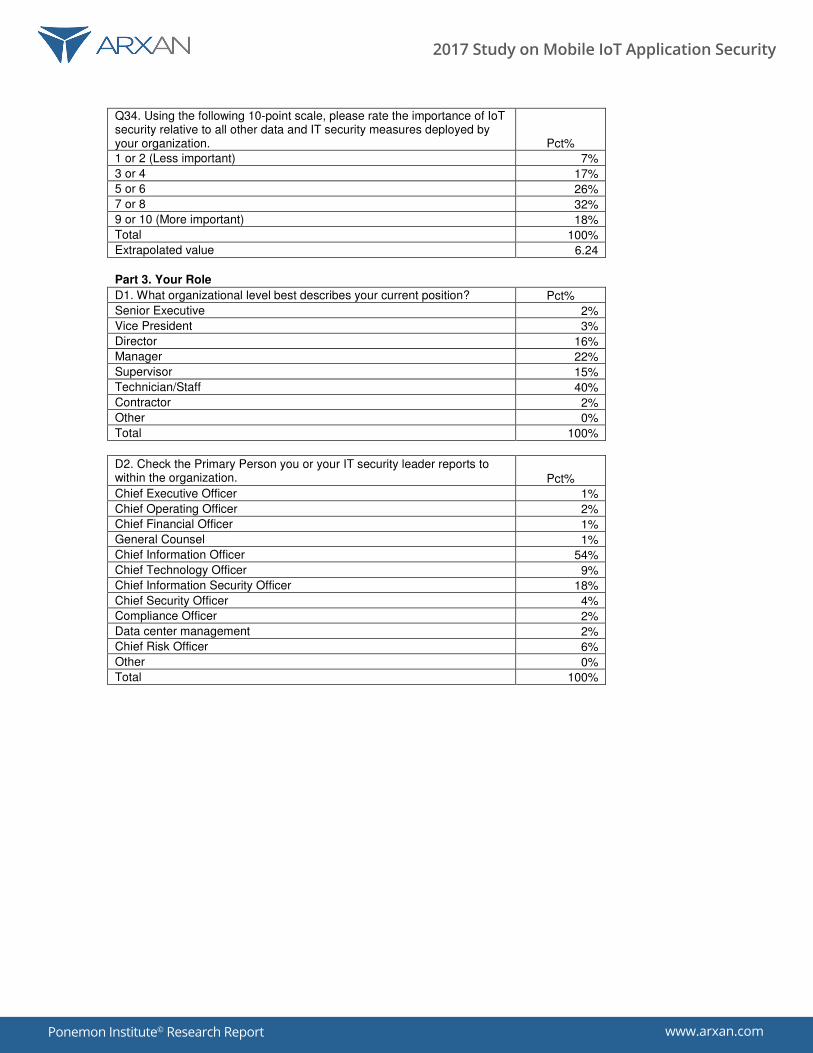
Q34. Using the following 10-point scale, please rate the importance of IoT security relative to all other data and IT security measures deployed by your organization. Pct% 1 or 2 (Less important) 7% 3 or 4 17% 5 or 6 26% 7 or 8 32% 9 or 10 (More important) 18% Total 100% Extrapolated value 6.24
Part 3. Your Role D1. What organizational level best describes your current position? Pct% Senior Executive 2% Vice President 3% Director 16% Manager 22% Supervisor 15% Technician/Staff 40% Contractor 2% Other 0% Total 100%
D2. Check the Primary Person you or your IT security leader reports to within the organization. Pct% Chief Executive Officer 1% Chief Operating Officer 2% Chief Financial Officer 1% General Counsel 1% Chief Information Officer 54% Chief Technology Officer 9% Chief Information Security Officer 18% Chief Security Officer 4% Compliance Officer 2% Data center management 2% Chief Risk Officer 6% Other 0% Total 100%
www.arxan.com
2017 Study on Mobile IoT Application Security
Ponemon Institute© Research Report
Ponemon Institute© Research Report Page 30
D3. What best describes your organization’s industry focus? Pct% Agriculture and food service 1% Communications 2% Consumer products 5% Defense & aerospace 1% Education & research 2% Energy & utilities 5% Entertainment & media 3% Financial services 18% Health & pharmaceuticals 11% Hospitality 3% Industrial & manufacturing 9% Public sector 10% Retail 9% Services 10% Technology & software 8% Transportation 2% Other 1% Total 100%
D4. What is the worldwide headcount of your organization? Pct% Less than 100 8% 100 to 500 13% 501 to 1,000 21% 1,001 to 5,000 25% 5,001 to 25,000 17% 25,001 to 75,000 9% More than 75,000 7% Total 100%
Please contact [email protected] or call us at 800.877.3118 if you have any questions.
Ponemon Institute
Advancing Responsible Information Management Ponemon Institute is dedicated to independent research and education that advances responsible information and privacy management practices within business and government. Our mission is to conduct high quality, empirical studies on critical issues affecting the management and security of sensitive information about people and organizations. As a member of the Council of American Survey Research Organizations (CASRO), we uphold strict data confidentiality, privacy and ethical research standards. We do not collect any personally identifiable information from individuals (or company identifiable information in our business research). Furthermore, we have strict quality standards to ensure that subjects are not asked extraneous, irrelevant or improper questions.