Embed Size (px)
Citation preview

2017 THIRD QUARTER RESULTSEnded September 30, 2017

Forward Looking Statements Disclaimer
This presentation contains statements, including statements about future plans and expectations, which constitute forward-
looking statements within the meaning of the Private Securities Litigation Reform Act of 1995. Such forward looking statements
are generally stated in terms of the Company’s plans, expectations and intentions. These statements are based on the current
beliefs, expectations and assumptions of the Company’s management and the current economic environment. Forward looking
statements are inherently subject to significant economic, competitive and other uncertainties and contingencies, many of which
are beyond the control of management. The Company cautions that these statements are not guarantees of future
performance. There are or will be important known and unknown factors and uncertainties that could cause actual results to
differ materially from those expressed or implied in the forward looking statements. These factors, include, but are not limited
to, risks associated with the global economic environment on the Company’s customer base (particularly financial services
firms) potentially impacting our business and financial condition; competition; changes in technology and market requirements;
decline in demand for the Company's products; inability to timely develop and introduce new technologies, products and
applications; difficulties or delays in absorbing and integrating acquired operations, products, technologies and personnel; loss
of market share; an inability to maintain certain marketing and distribution arrangements; and the effect of newly enacted or
modified laws, regulation or standards on the Company and its products; and other factors and uncertainties discussed in our
filings with the U.S. Securities and Exchange Commission (the “SEC”). You are encouraged to carefully review the section
entitled “Risk Factors” in our latest Annual Report on Form 20-F and in our other relevant filings with the SEC for additional
information regarding these and other factors and uncertainties that could affect our future performance, and undue reliance
should not be placed upon these statements. The forward-looking statements contained in this presentation are made as of the
date hereof, and the Company undertakes no obligation to update or revise them, except as required by law.
2

Explanation of Non-GAAP measures
Non-GAAP financial measures consist of GAAP financial measures adjusted to exclude: amortization of acquired intangible
assets, re-organization expenses, share-based compensation, and certain business combination accounting entries, settlement,
amortization of discount on long term debt and tax adjustment re non-GAAP adjustments. The purpose of such adjustments is to
give an indication of our performance exclusive of non-cash charges and other items that are considered by management to be
outside of our core operating results. Our non-GAAP financial measures are not meant to be considered in isolation or as a
substitute for comparable GAAP measures, and should be read only in conjunction with our consolidated financial statements
prepared in accordance with GAAP. Our management regularly uses our supplemental non-GAAP financial measures internally
to understand, manage and evaluate our business and make operating decisions. These non-GAAP measures are among the
primary factors management uses in planning for and forecasting future periods. Business combination accounting rules requires
us to recognize a legal performance obligation related to a revenue arrangement of an acquired entity. The amount assigned to
that liability should be based on its fair value at the date of acquisition. The non-GAAP adjustment is intended to reflect the full
amount of such revenue. We believe this adjustment is useful to investors as a measure of the ongoing performance of our
business. We believe these non-GAAP financial measures provide consistent and comparable measures to help investors
understand our current and future operating cash flow performance. These non-GAAP financial measures may differ materially
from the non-GAAP financial measures used by other companies. Reconciliation between results on a GAAP and non-GAAP
basis is provided in a table immediately following the Consolidated Statements of Income.
3

Q3 2017 Highlights
Income Statement
Balance Sheet and Cash Flow Analysis
Outlook

Q3 2017 Highlights*
* All numbers are Non-GAAP
Revenue of $327M,
growth of 36% YoY
Cloud revenue grew
15% sequentially
Operating income
increased to $78M,
growth of 22% YoY
EPS growth of 14%
YoY to $0.95,
compared to $0.83
last year
Guidance ranges
for FY17 revenue
and EPS were
narrowed; guidance
midpoints increased
Analytics
represented 60% of
new bookings in Q3
Recurring revenue
accounted for 69%
of total revenue,
compared to 51%
last year
Strong operating
cash flow of $106M,
compared to $41M
last year
5

Q3 2017 Highlights
Income Statement
Balance Sheet and Cash Flow Analysis
Outlook

Strong Growth and Execution
REVENUES (Non-GAAP, $M)
240
327
Q3 16 Q3 17
36%
0,830,95
Q3 16 Q3 17
14%
EARININGS PER SHARE (Non-GAAP, $)
• Strong revenue growth driven by continued
momentum in cloud and analytics coupled with
expansion of total addressable market
• Cloud accounted for 30% of total revenue,
compared to 6% in Q3 2016
• Recurring revenue accounted for 69% of total
revenue compared to 51% last year
• Excellent operating leverage results in double
digit EPS growth
7

GAAP and Non-GAAP Income Statement$M (except EPS) Q3 2017 Q3 2016
GAAP revenue 322.8 237.2
Valuation adjustment on acquired deferred product revenue 0.0 0.1
Valuation adjustment on acquired deferred service revenue 0.8 1.6
Valuation adjustment on acquired deferred cloud revenue 3.1 1.4
Non-GAAP revenues 326.8 240.3
GAAP Cost of revenue 115.4 78.0
Amortization of acquired intangible assets on cost of product (6.1) (6.3)
Amortization of acquired intangible assets on cost of services (1.0) (3.2)
Amortization of acquired intangible assets on cost of cloud (11.8) -
Valuation adjustments on acquired deferred cost of service 0.4 -
Cost of product revenue adjustment (0.2) (0.1)
Cost of services revenue adjustment (1.9) (1.6)
Cost of cloud revenue adjustment (0.6) (0.1)
Non-GAAP cost of revenue 94.2 66.7
GAAP gross profit 207.4 159.1
Gross profit adjustments 25.1 14.4
Non-GAAP gross profit 232.5 173.5
GAAP operating expenses 174.3 123.1
Research and development (2.2) (1.4)
Sales and marketing (5.7) (4.1)
General and administrative (1.6) (5.1)
Amortization of acquired intangible assets (10.6) (3.2)
Non-GAAP operating expenses 154.2 109.3
8

GAAP and Non-GAAP Income Statement (cont.)$M (except EPS) Q3 2017 Q3 2016
GAAP finance & other income (4.3) 5.0
Amortization of discount on long term debt 2.1 -
Realized gain from substantial liquidation of marketable securities - (2.7)
Non-GAAP finance & other income (2.2) 2.3
GAAP taxes on income 2.6 8.6
Tax adjustment re non-GAAP adjustments 14.6 7.2
Non-GAAP taxes on income 17.2 15.8
GAAP net income (loss) from continuing operations 26.2 32.4
Valuation adjustment on acquired deferred revenue 4.0 3.1
Valuation adjustment on acquired deferred cost of service of revenue (0.4) -
Amortization of acquired intangible assets 29.4 12.6
Share-based compensation 14.0 9.5
Re-organization expenses (3.1) 1.5
Acquisition related expenses 1.3 1.5
Amortization of discount on long term debt 2.1 -
Realized gain from substantial liquidation of marketable securities - (2.7)
Tax adjustments re non-GAAP adjustments (14.6) (7.2)
Non-GAAP net income from continuing operations 58.9 50.7
GAAP diluted earnings (loss) per share from continuing operations 0.42 0.53
Non-GAAP diluted earnings per share from continuing operations 0.95 0.83
9
Revenue Breakdown by Region (Non-GAAP)
Q3 2017
EMEA $50M, +3% YoY
15%
APAC$26M, -7% YoY
8%
77%AMERICAS
$251M, +53% YoY
10
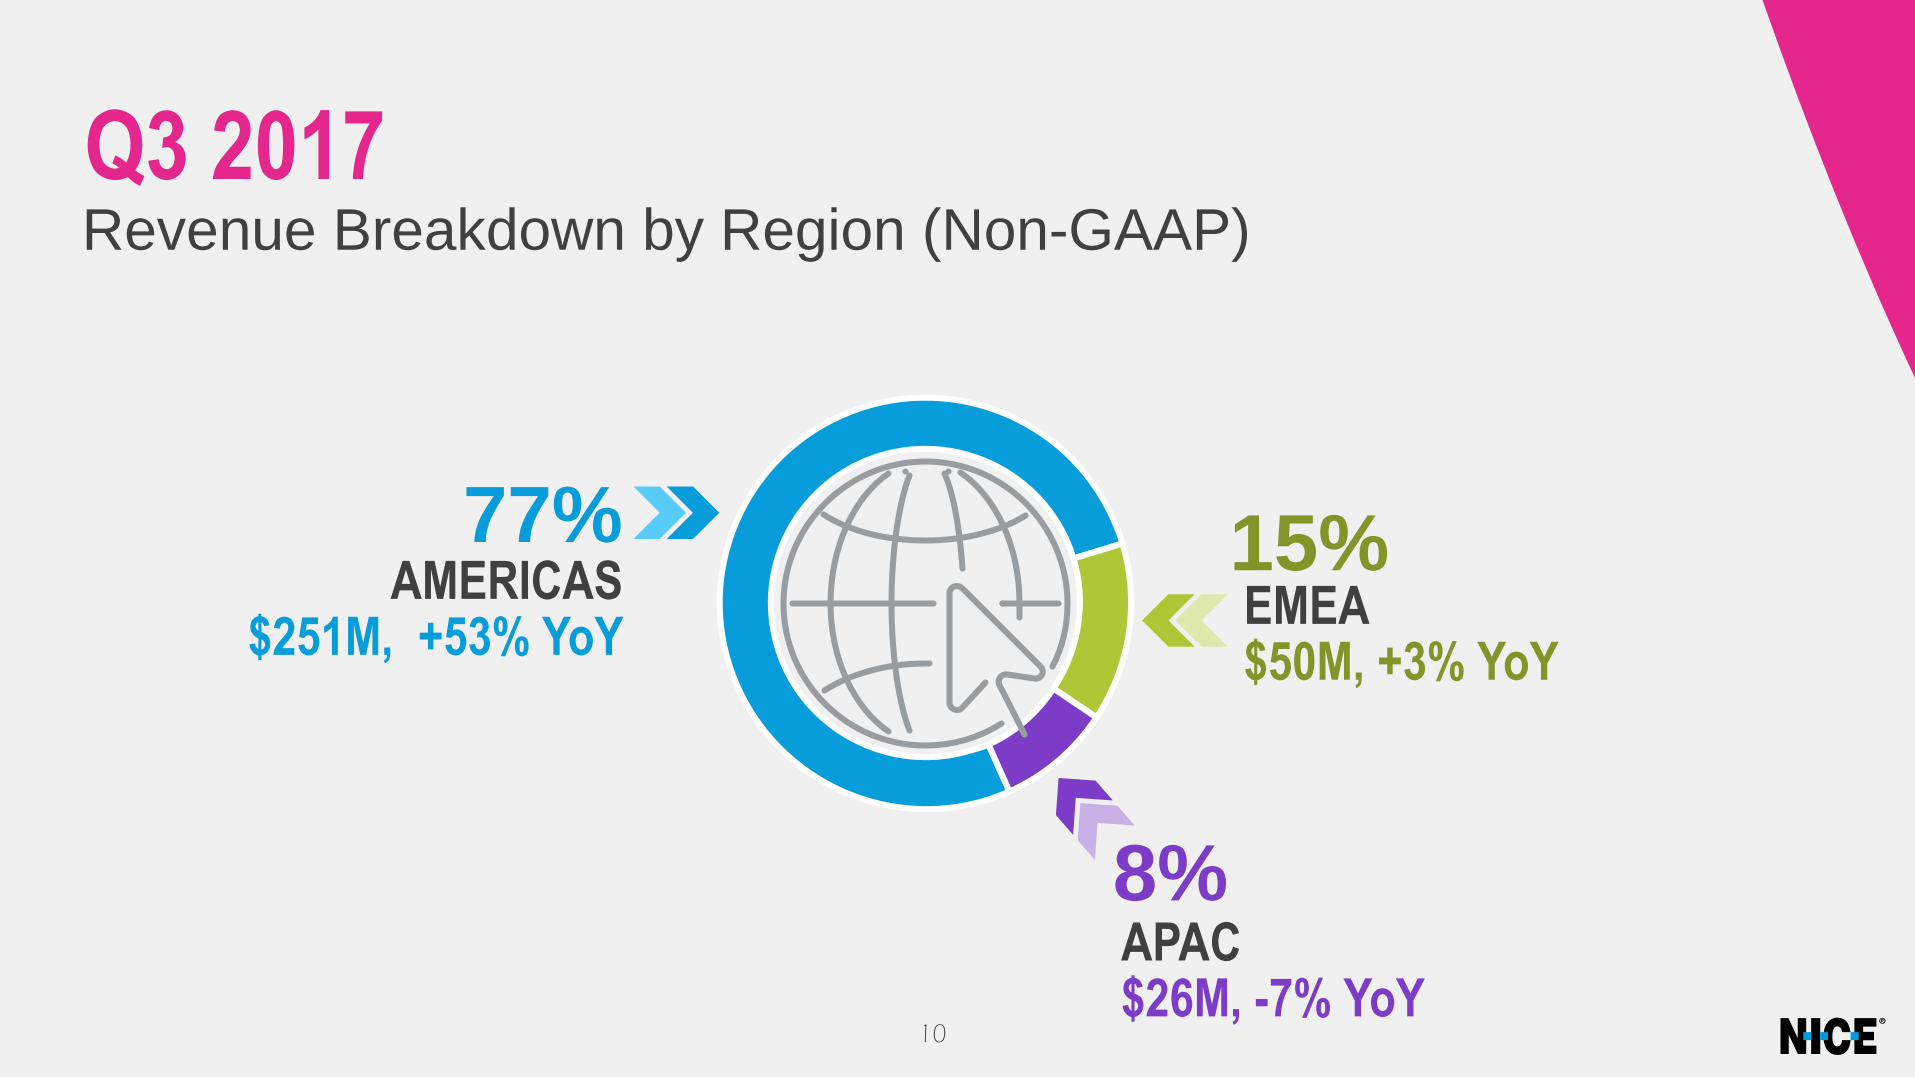
Revenue Breakdown by Business Unit (Non-GAAP)Q3 2017
81%CUSTOMER
ENGAGEMENT$265M, +44% YoY
FINANCIAL CRIME & COMPLIANCE$62M, +10% YoY
19%
11

Gross Margin Q3 2017 (Non-GAAP)
72,2%71,2%
Q3 16 Q3 17
• Gross margin slightly decreased as a result of the consolidation of inContact, which has a lower gross
margin, and offset by continued improvement in overall operational efficiency following the acquisition
as Q3 2017 gross margin increased compared to Q2 2017 (70.5%) and Q1 2017 (69.9%).
12

Product GM92,1% Product GM
90,0%
Q3 16 Q3 17
Gross Margin Q3 2017 (Non-GAAP)
PRODUCT MARGIN90.0%| -210bp
CLOUD MARGIN62.4%| -300bp
Cloud GM
65,4% Cloud GM
62,4%
Q3 16 Q3 17
Service GM 64,2%
Service GM 68,7%
Q3 16 Q3 17
SERVICES MARGIN68.7%| +450bp
• Continued expansion in the services gross margin as a result of continued efficient utilization of the services organization
• The decrease in the product margin is the result of product mix
• The decrease in the cloud margin is the result of the consolidation of inContact and offset by continued improvement in overall
operational efficiency following the acquisition as Q3 2017 cloud margin increased compared to Q2 2017 (60.4%) and Q1 2017 (60.3%)13

Operating Income and Margin (Non-GAAP)
Operating income increased 22%. The decrease in the operating margin is the result of
an increase in OPEX due to the consolidation of inContact
64
78
26,7%
24,0%
Q3 2016 Q3 201720,0%
22,0%
24,0%
26,0%
28,0%
30,0%
32,0%
0
10
20
30
40
50
60
70
80
90
Operating Income Operating Margin
14

Cost Ratio Q3 2017 (Non-GAAP)
R&D
As % of revenue
R&D13,4% R&D
13,1%
Q3 16 Q3 17
S&M24,1%
S&M25,0%
Q3 16 Q3 17
S&M
As % of revenue
G&A8,0%
G&A9,0%
Q3 16 Q3 16
G&A
As % of revenue
• R&D expenses increased YoY but decreased as a percentage of revenue
• Increases in S&M and G&A are the result of the consolidation of inContact
15

Analytic Applications As % of new bookings
49% 49%
55%
61%60%
Q3 13 Q3 14 Q3 15 Q3 16 Q3 17
Analytics continue to drive growth, and in Q3 2017 represented 60% of new bookings
16
Q3 2017 Highlights
Income Statement
Balance Sheet and Cash Flow Analysis
Outlook

Balance Sheet September 30, 2017
Assets ($M) 09/30/2017 12/31/2016
Cash and cash equivalents 320.9 157.0
Short term investments 53.7 30.3
Trade receivables 195.3 260.2
Prepaid expenses and other
current assets75.2 58.0
Current assets of discontinued
operation2.0 3.7
Total current assets 647.1 509.2
Long term Investments 119.5 98.7
Property and equipment 114.6 87.7
Deferred tax assets 15.7 14.1
Other Intangible assets 557.4 618.7
Goodwill 1,302.8 1,284.7
Other long term assets 18.8 18.7
Total Assets 2,775.9 2,631.9
Equity & Liabilities ($M) 09/30/2017 12/31/2016
Current maturities of long term loan - 21.2
Trade payables 27.2 25.6
Current portion of deferred revenue and advances
from customers201.9 149.8
Accrued expenses and other liabilities 275.9 273.1
Current liabilities of discontinued operation 0.2 3.1
Current liabilities 505.2 472.8
Deferred revenue and advance from customers 42.9 22.7
Deferred tax liabilities 98.4 146.9
Long term debt 445.6 444.0
Other long term liabilities 28.6 34.1
Total long term liabilities 615.5 647.7
Equity 1,655.3 1,511.3
Equity & Liabilities 2,775.9 2,631.9
18

Cash Flow From Operations **
$M Q3 2017 Q3 2016 %∆
Cash flow from operations 105.8 41.4 155%
- Capital expenditure 7.9 7.0 13%
- Capitalization of software development 7.7 1.9 305%
Cash flow from operations after capex and software capitalization 90.2 32.5 177%
Cash flow from operation after capex and software capitalization as % of
non-GAAP revenue27.6% 13.5% 14.1pp
Cash conversion rate * 1.53 0.64 139%
Days sales outstanding (DSO) 55 55 -
* Cash Conversion Rate = (Cash Flow from Operations after CAPEX and software capitalization / Non-GAAP Net Income)
** Cash flow numbers include divested Intelligence and Physical Security divisions
19

Cash Movement and LiquiditySeptember 30, 2017
* Total Liquidity = Cash and Cash Equivalents + Current Investments + Long Term Investments
Liquidity 31/12/16*$286
Liquidity 30/09/17*$494
Dividend-$10
Operating CF$307
Convertibles$261
Debt-$260
Acquisition-$38
Proceeds from options exercise
$17
Other$3
CAPEX**-$52
Buyback-$20M
20** CAPEX movement includes R&D capitalization
Q3 2017 Highlights
Income Statement
Balance Sheet and Cash Flow Analysis
Outlook

Outlook (Non-GAAP)
FY 2017
Revenue ($M) 1,338-1,350
EPS ($) 4.00-4.10
The outlook is provided as of November 2, 2017. There is no guarantee that the Company will change or update these figures in this presentation should a need
arise in the future to update the outlook. This is in addition to the forward-looking statements disclaimer at the beginning of the presentation.
22

23


![Bruker Corporation (NASDAQ: BRKR) · 2018-04-05 · H1 2015 Reconciliation of GAAP and Non-GAAP Results [$ m, except EPS] H1 2015 H1 2014 GAAP Operating Income 46.8 56.0 Restructuring](https://img.pdfslide.net/doc/110x75/5f53054c058f60170d05afee/bruker-corporation-nasdaq-brkr-2018-04-05-h1-2015-reconciliation-of-gaap-and.jpg)