Embed Size (px)
Citation preview
2018-19 Budget Paper No. 3 287 Financial asset and liability management
CHAPTER 8
FINANCIAL ASSET AND LIABILITY MANAGEMENT
Chapter Page
8.1 Overview 289
8.2 Net debt and net financial liabilities 291
8.3 Unfunded superannuation liability 295
8.4 Management of financial assets and liabilities 303
2018-19 Budget Paper No. 3 288 Financial asset and liability management
2018-19 Budget Paper No. 3 289 Overview
8.1 OVERVIEW
By delivering on our commitment to return the Budget to balance in 2018-19, the Government continues to strengthen the Territory’s financial position. Maintaining a balanced position across the forward estimates will enable the Government to invest in services and infrastructure to support Canberra’s growth while keeping the ACT’s borrowing and debt at sustainable levels.
The 2018-19 Budget strategy maintains debt at sustainable levels while providing the flexibility to deal with emerging pressures and make the necessary long-term investments in infrastructure. The Government is carefully managing the Territory’s debt metrics even as we invest in a record infrastructure and capital program with net debt as a portion of Gross State Product decreasing in every year compared to the estimates provided in the 2017-18 Budget.
The Government continues to focus on our important financial objective of extinguishing the Territory’s unfunded superannuation liability by 2030. This is the largest liability on the Government’s balance sheet, but our strategy remains on target to fully fund this over time.
The Government has well-developed access to domestic and international capital markets as shown by our successful debt issuance program, reflecting market confidence in the Government’s fiscal and debt management strategies.
The Government has maintained a AAA credit rating for 24 successive years and is now one of only 26 jurisdictions around the world to hold this rating. The long-term AAA credit rating reflects the ACT’s very strong economy and financial management, budgetary flexibility, exceptional liquidity and moderate debt burden. The 2018-19 Budget has been developed with a clear focus on the fiscal metrics consistent with maintaining this rating.
2018-19 Budget Paper No. 3 290 Overview
2018-19 Budget Paper No. 3 291 Net debt and net financial liabilities
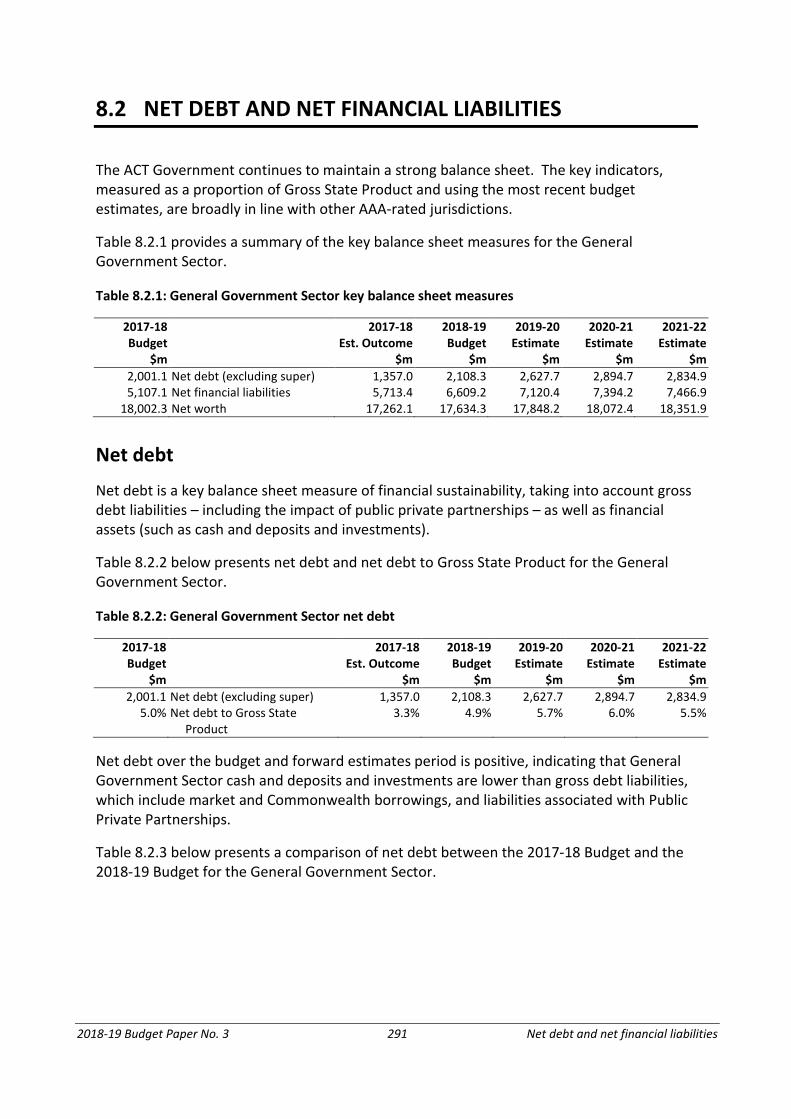
8.2 NET DEBT AND NET FINANCIAL LIABILITIES
The ACT Government continues to maintain a strong balance sheet. The key indicators, measured as a proportion of Gross State Product and using the most recent budget estimates, are broadly in line with other AAA-rated jurisdictions.
Table 8.2.1 provides a summary of the key balance sheet measures for the General Government Sector.
Table 8.2.1: General Government Sector key balance sheet measures
2017-18 Budget
2017-18 Est. Outcome
2018-19 Budget
2019-20 Estimate
2020-21 Estimate
2021-22 Estimate
$m $m $m $m $m $m 2,001.1 Net debt (excluding super) 1,357.0 2,108.3 2,627.7 2,894.7 2,834.9 5,107.1 Net financial liabilities 5,713.4 6,609.2 7,120.4 7,394.2 7,466.9
18,002.3 Net worth 17,262.1 17,634.3 17,848.2 18,072.4 18,351.9
Net debt
Net debt is a key balance sheet measure of financial sustainability, taking into account gross debt liabilities – including the impact of public private partnerships – as well as financial assets (such as cash and deposits and investments).
Table 8.2.2 below presents net debt and net debt to Gross State Product for the General Government Sector.
Table 8.2.2: General Government Sector net debt
2017-18 Budget
2017-18 Est. Outcome
2018-19 Budget
2019-20 Estimate
2020-21 Estimate
2021-22 Estimate
$m $m $m $m $m $m 2,001.1 Net debt (excluding super) 1,357.0 2,108.3 2,627.7 2,894.7 2,834.9
5.0% Net debt to Gross State Product
3.3% 4.9% 5.7% 6.0% 5.5%
Net debt over the budget and forward estimates period is positive, indicating that General Government Sector cash and deposits and investments are lower than gross debt liabilities, which include market and Commonwealth borrowings, and liabilities associated with Public Private Partnerships.
Table 8.2.3 below presents a comparison of net debt between the 2017-18 Budget and the 2018-19 Budget for the General Government Sector.
2018-19 Budget Paper No. 3 292 Net debt and net financial liabilities
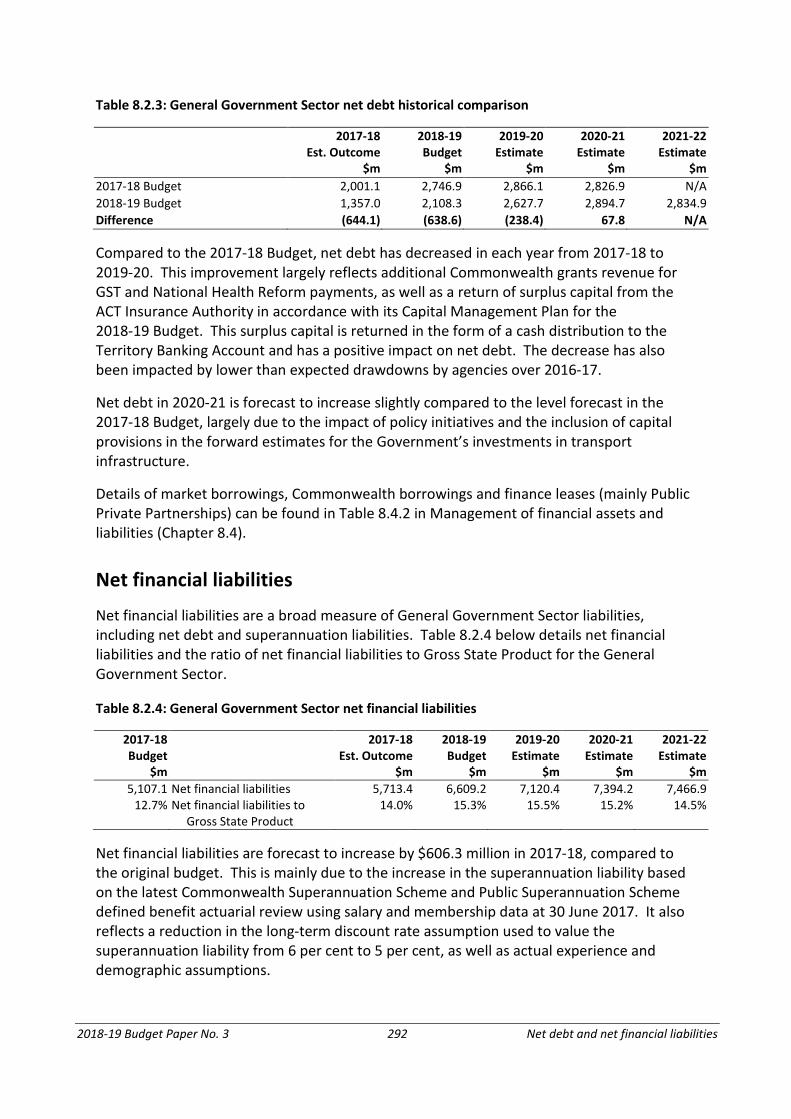
Table 8.2.3: General Government Sector net debt historical comparison
2017-18 Est. Outcome
2018-19 Budget
2019-20 Estimate
2020-21 Estimate
2021-22 Estimate
$m $m $m $m $m 2017-18 Budget 2,001.1 2,746.9 2,866.1 2,826.9 N/A 2018-19 Budget 1,357.0 2,108.3 2,627.7 2,894.7 2,834.9 Difference (644.1) (638.6) (238.4) 67.8 N/A
Compared to the 2017-18 Budget, net debt has decreased in each year from 2017-18 to 2019-20. This improvement largely reflects additional Commonwealth grants revenue for GST and National Health Reform payments, as well as a return of surplus capital from the ACT Insurance Authority in accordance with its Capital Management Plan for the 2018-19 Budget. This surplus capital is returned in the form of a cash distribution to the Territory Banking Account and has a positive impact on net debt. The decrease has also been impacted by lower than expected drawdowns by agencies over 2016-17.
Net debt in 2020-21 is forecast to increase slightly compared to the level forecast in the 2017-18 Budget, largely due to the impact of policy initiatives and the inclusion of capital provisions in the forward estimates for the Government’s investments in transport infrastructure.
Details of market borrowings, Commonwealth borrowings and finance leases (mainly Public Private Partnerships) can be found in Table 8.4.2 in Management of financial assets and liabilities (Chapter 8.4).
Net financial liabilities
Net financial liabilities are a broad measure of General Government Sector liabilities, including net debt and superannuation liabilities. Table 8.2.4 below details net financial liabilities and the ratio of net financial liabilities to Gross State Product for the General Government Sector.
Table 8.2.4: General Government Sector net financial liabilities
2017-18 Budget
2017-18 Est. Outcome
2018-19 Budget
2019-20 Estimate
2020-21 Estimate
2021-22 Estimate
$m $m $m $m $m $m 5,107.1 Net financial liabilities 5,713.4 6,609.2 7,120.4 7,394.2 7,466.9
12.7% Net financial liabilities to Gross State Product
14.0% 15.3% 15.5% 15.2% 14.5%
Net financial liabilities are forecast to increase by $606.3 million in 2017-18, compared to the original budget. This is mainly due to the increase in the superannuation liability based on the latest Commonwealth Superannuation Scheme and Public Superannuation Scheme defined benefit actuarial review using salary and membership data at 30 June 2017. It also reflects a reduction in the long-term discount rate assumption used to value the superannuation liability from 6 per cent to 5 per cent, as well as actual experience and demographic assumptions.
2018-19 Budget Paper No. 3 293 Net debt and net financial liabilities
In 2018-19, net financial liabilities is forecast to increase by $895.8 million. This largely reflects forecast growth in the superannuation liability and the inclusion of lease liabilities associated with Public Private Partnerships.
The ratio of net financial liabilities to Gross State Product provides an indicator of the sustainability of a jurisdiction’s debt. The ACT’s ratio is broadly in line with other AAA-rated jurisdictions. While this ratio is subject to volatility, it is desirable that it remains broadly stable over time.
Net worth
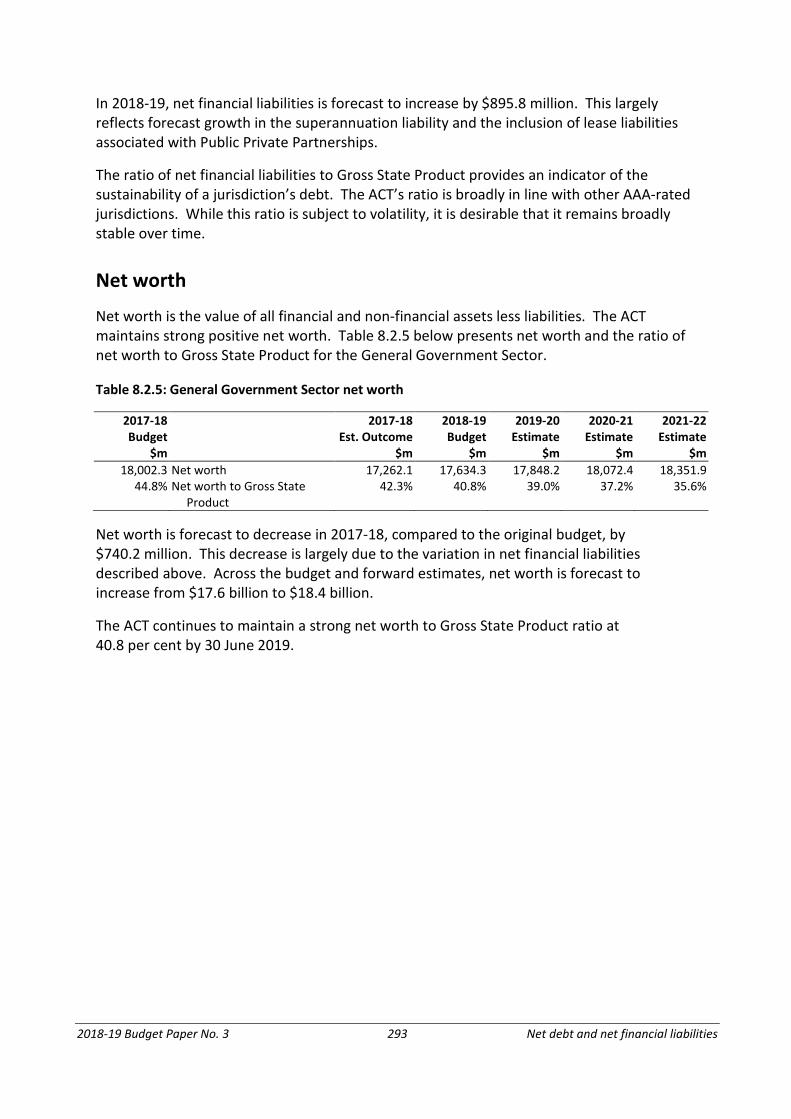
Net worth is the value of all financial and non-financial assets less liabilities. The ACT maintains strong positive net worth. Table 8.2.5 below presents net worth and the ratio of net worth to Gross State Product for the General Government Sector.
Table 8.2.5: General Government Sector net worth
2017-18 Budget
2017-18 Est. Outcome
2018-19 Budget
2019-20 Estimate
2020-21 Estimate
2021-22 Estimate
$m $m $m $m $m $m 18,002.3 Net worth 17,262.1 17,634.3 17,848.2 18,072.4 18,351.9
44.8% Net worth to Gross State Product
42.3% 40.8% 39.0% 37.2% 35.6%
Net worth is forecast to decrease in 2017-18, compared to the original budget, by $740.2 million. This decrease is largely due to the variation in net financial liabilities described above. Across the budget and forward estimates, net worth is forecast to increase from $17.6 billion to $18.4 billion.
The ACT continues to maintain a strong net worth to Gross State Product ratio at 40.8 per cent by 30 June 2019.

2018-19 Budget Paper No. 3 294 Net debt and net financial liabilities
2018-19 Budget Paper No. 3 295 Unfunded superannuation liability
8.3 UNFUNDED SUPERANNUATION LIABILITY
Introduction
Superannuation arrangements for ACT Government employees differ depending on the superannuation schemes available to the employee at the time of commencing employment. Unlike other jurisdictions, the Government does not operate a superannuation scheme for employees. The relevant superannuation arrangements for employees are as follows:
• Prior to 1 July 1990, the Commonwealth Superannuation Scheme;
• Between 1 July 1990 and 30 June 2005, the Public Sector Superannuation Scheme;
• From 1 July 2005 to 5 October 2006, the Public Sector Superannuation Accumulation Plan; and
• From 6 October 2006, superannuation choice of fund.
ACT Government employee superannuation arrangements
The superannuation arrangements available to employees under each of the different arrangements are outlined below.
Defined benefit superannuation schemes
For defined benefit superannuation schemes, benefits payable to members are defined in advance according to a set of formulas which are linked to factors such as years of service, final average salary and level of member contribution. With the exception of employer productivity contributions, the employer financed component of member entitlements is unfunded and is not required to be paid until a member is entitled to receive a benefit.
The Commonwealth Superannuation Scheme and the Public Sector Superannuation Scheme are both Commonwealth Government defined benefit superannuation schemes.
From 1 July 1989, the ACT Government became a separate body politic. At that time an agreement was reached with the Commonwealth Government that employees could continue to access the Commonwealth Superannuation Scheme. The scheme was closed to new members from 1 July 1990.
The Public Sector Superannuation Scheme was opened on 1 July 1990 and was compulsory for eligible employees. The scheme was closed to new members from 1 July 2005.
2018-19 Budget Paper No. 3 296 Unfunded superannuation liability
The administration of these superannuation schemes is undertaken by the Commonwealth Superannuation Corporation. Under the agreed arrangements the ACT Government reimburses the Commonwealth Superannuation Corporation for the employer financed portion of superannuation benefits paid in respect of employees and former employees who are or were members of these schemes. This requirement applies to benefits relating to employment with the ACT Government after 1 July 1989.
As a result of these arrangements, the ACT Government currently has an unfunded defined benefit superannuation liability. The Government maintains, as a key financial objective, a funding plan to extinguish the Territory’s unfunded defined benefit superannuation liability by 2030.
Defined contribution superannuation schemes
For defined contribution superannuation schemes the ACT Government is required to make ongoing superannuation contributions directly to an employee’s superannuation fund which extinguishes the Government’s superannuation liability.
Defined contribution superannuation schemes include the Public Sector Superannuation Scheme Accumulation Plan and funds chosen by employees.
From 1 July 2005, all new ACT employees were required to become members of the Public Sector Superannuation Accumulation Plan. Existing Commonwealth Superannuation Scheme and Public Sector Superannuation Scheme members were not able to transfer to the new superannuation scheme. The ACT Government is required to contribute 15.4 per cent of an eligible employee’s salary to this scheme. The Public Sector Superannuation Accumulation Plan closed to new ACT employees on 6 October 2006.
From 6 October 2006, the Government introduced superannuation choice of fund arrangements with all new employees having the ability to choose their preferred superannuation fund. If an employee does not elect a fund they become a member of the Government’s nominated default superannuation fund.
Under the choice of fund arrangements, employees must join a defined contribution (accumulation) fund. The ACT Government is required to contribute, at a minimum, the prevailing superannuation guarantee percentage rate as set by Commonwealth Government legislation. The Government may pay a higher contribution rate if it chooses. The Government contributes an additional 1 per cent for employees who contribute 3 per cent or more of their salary to their chosen fund.
Members of the Legislative Assembly
There are two superannuation arrangements for Members of the ACT Legislative Assembly (MLAs). MLAs who were elected before the 2008 general election, and have a relevant period of service with no discontinuance, are members of an unfunded defined benefit superannuation arrangement, prescribed under the Legislative Assembly (Members’ Superannuation) Act 1991.
2018-19 Budget Paper No. 3 297 Unfunded superannuation liability
Those MLAs elected at, or after, the 2008 general election, and who were not an existing member of the Defined Benefit Scheme prior to the election, assume membership of a choice of fund accumulation scheme. The ACT Government is required to contribute the equivalent of 14 per cent of the Member’s eligible salary. The Government contributes an additional 1 per cent for MLAs who contribute 3 per cent or more of their salary to their chosen fund.
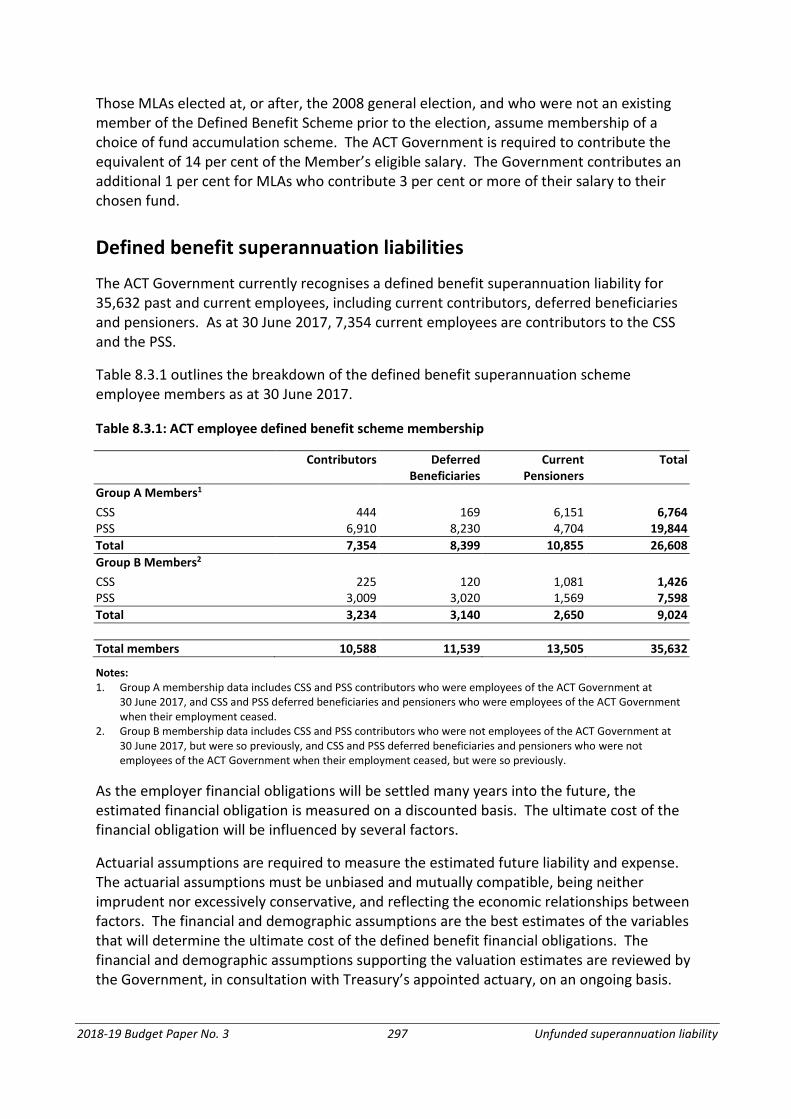
Defined benefit superannuation liabilities
The ACT Government currently recognises a defined benefit superannuation liability for 35,632 past and current employees, including current contributors, deferred beneficiaries and pensioners. As at 30 June 2017, 7,354 current employees are contributors to the CSS and the PSS.
Table 8.3.1 outlines the breakdown of the defined benefit superannuation scheme employee members as at 30 June 2017.
Table 8.3.1: ACT employee defined benefit scheme membership
Contributors
Deferred Beneficiaries
Current Pensioners
Total
Group A Members1
CSS 444 169 6,151 6,764 PSS 6,910 8,230 4,704 19,844 Total 7,354 8,399 10,855 26,608 Group B Members2 CSS 225 120 1,081 1,426 PSS 3,009 3,020 1,569 7,598 Total 3,234 3,140 2,650 9,024 Total members 10,588 11,539 13,505 35,632
Notes: 1. Group A membership data includes CSS and PSS contributors who were employees of the ACT Government at
30 June 2017, and CSS and PSS deferred beneficiaries and pensioners who were employees of the ACT Government when their employment ceased.
2. Group B membership data includes CSS and PSS contributors who were not employees of the ACT Government at 30 June 2017, but were so previously, and CSS and PSS deferred beneficiaries and pensioners who were not employees of the ACT Government when their employment ceased, but were so previously.
As the employer financial obligations will be settled many years into the future, the estimated financial obligation is measured on a discounted basis. The ultimate cost of the financial obligation will be influenced by several factors.
Actuarial assumptions are required to measure the estimated future liability and expense. The actuarial assumptions must be unbiased and mutually compatible, being neither imprudent nor excessively conservative, and reflecting the economic relationships between factors. The financial and demographic assumptions are the best estimates of the variables that will determine the ultimate cost of the defined benefit financial obligations. The financial and demographic assumptions supporting the valuation estimates are reviewed by the Government, in consultation with Treasury’s appointed actuary, on an ongoing basis.
2018-19 Budget Paper No. 3 298 Unfunded superannuation liability
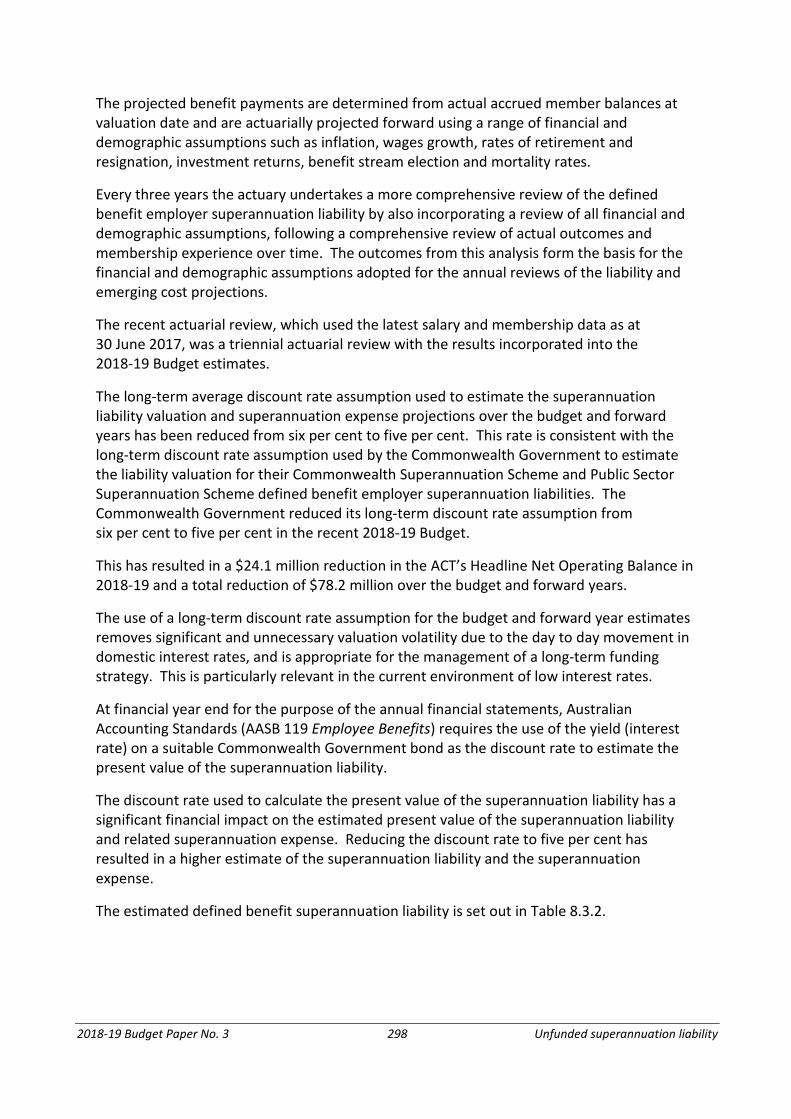
The projected benefit payments are determined from actual accrued member balances at valuation date and are actuarially projected forward using a range of financial and demographic assumptions such as inflation, wages growth, rates of retirement and resignation, investment returns, benefit stream election and mortality rates.
Every three years the actuary undertakes a more comprehensive review of the defined benefit employer superannuation liability by also incorporating a review of all financial and demographic assumptions, following a comprehensive review of actual outcomes and membership experience over time. The outcomes from this analysis form the basis for the financial and demographic assumptions adopted for the annual reviews of the liability and emerging cost projections.
The recent actuarial review, which used the latest salary and membership data as at 30 June 2017, was a triennial actuarial review with the results incorporated into the 2018-19 Budget estimates.
The long-term average discount rate assumption used to estimate the superannuation liability valuation and superannuation expense projections over the budget and forward years has been reduced from six per cent to five per cent. This rate is consistent with the long-term discount rate assumption used by the Commonwealth Government to estimate the liability valuation for their Commonwealth Superannuation Scheme and Public Sector Superannuation Scheme defined benefit employer superannuation liabilities. The Commonwealth Government reduced its long-term discount rate assumption from six per cent to five per cent in the recent 2018-19 Budget.
This has resulted in a $24.1 million reduction in the ACT’s Headline Net Operating Balance in 2018-19 and a total reduction of $78.2 million over the budget and forward years.
The use of a long-term discount rate assumption for the budget and forward year estimates removes significant and unnecessary valuation volatility due to the day to day movement in domestic interest rates, and is appropriate for the management of a long-term funding strategy. This is particularly relevant in the current environment of low interest rates.
At financial year end for the purpose of the annual financial statements, Australian Accounting Standards (AASB 119 Employee Benefits) requires the use of the yield (interest rate) on a suitable Commonwealth Government bond as the discount rate to estimate the present value of the superannuation liability.
The discount rate used to calculate the present value of the superannuation liability has a significant financial impact on the estimated present value of the superannuation liability and related superannuation expense. Reducing the discount rate to five per cent has resulted in a higher estimate of the superannuation liability and the superannuation expense.
The estimated defined benefit superannuation liability is set out in Table 8.3.2.
2018-19 Budget Paper No. 3 299 Unfunded superannuation liability
Table 8.3.2: Defined benefit superannuation liability
2017-18 Est. Outcome
$’000
2018-19 Budget
$’000
2019-20 Estimate
$’000
2020-21 Estimate
$’000
2021-22 Estimate
$’000 Opening liability 8,571,724 7,539,369 7,801,570 8,048,716 8,281,360 Service cost 204,606 153,205 145,675 138,940 132,827 Interest cost 303,750 378,066 390,317 401,867 412,667 Benefit payments -242,076 -269,070 -288,846 -308,163 -329,869 Actuarial (Gain)/Loss1 -1,298,635 0 0 0 0 Closing liability 7,539,369 7,801,570 8,048,716 8,281,360 8,496,985
Notes: Numbers may not add due to rounding. 1. The actuarial (gain)/loss is the change in the present value of the superannuation liability resulting from a change in
the discount rate assumption. The liability valuation at 30 June 2017 utilised a discount rate assumption of 3.51 per cent. The liability valuations from 30 June 2018 utilise a long-term discount rate assumption of 5 per cent. A lower discount rate leads to a higher liability valuation estimate.
The defined benefit superannuation liability is estimated to grow to approximately $8.5 billion by 30 June 2022. The service cost associated with the accrual of employee superannuation benefits is forecast to decrease over time as employee members leave the schemes through resignation or retirement. The interest cost is forecast to increase due to past benefits accrued by employee members moving one year closer to payment.
The 2018-19 Budget estimates for the liability have increased mainly due to the reduction in the long-term discount rate assumption, with small impacts as a result of changes in demographic assumptions such as increases in pension election rates, mortality improvements, benefit retention and resignation rates.
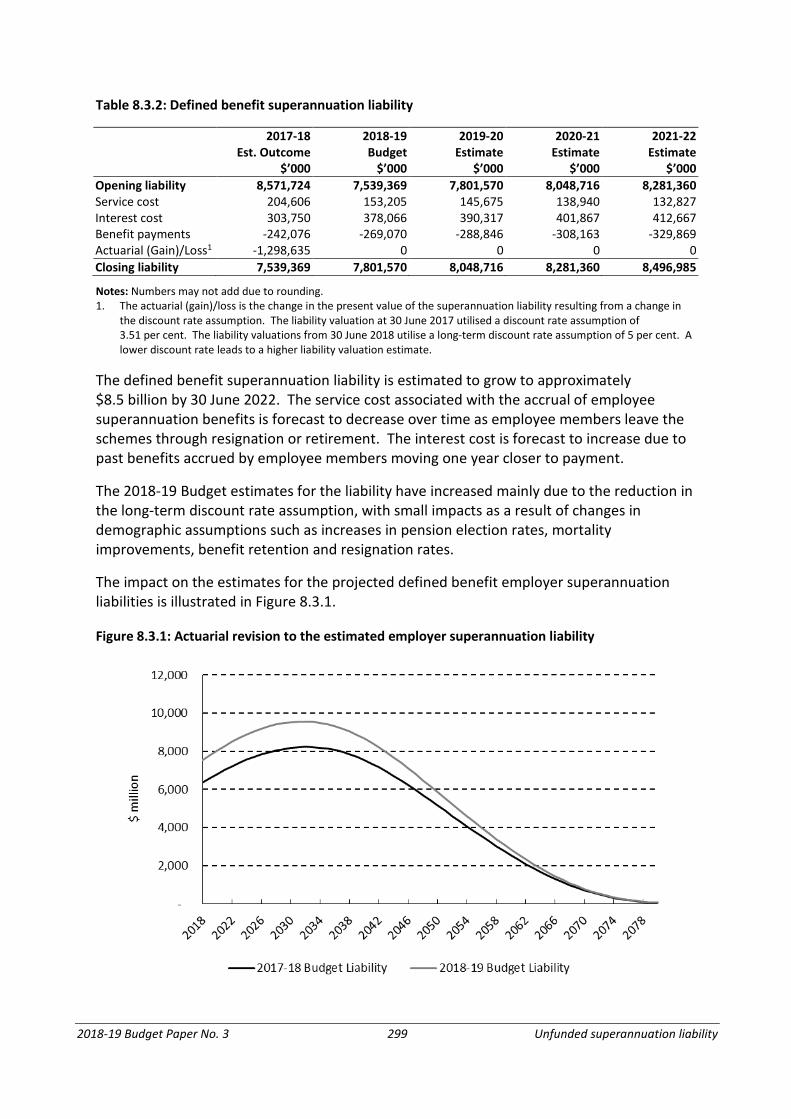
The impact on the estimates for the projected defined benefit employer superannuation liabilities is illustrated in Figure 8.3.1.
Figure 8.3.1: Actuarial revision to the estimated employer superannuation liability
2018-19 Budget Paper No. 3 300 Unfunded superannuation liability
The defined benefit superannuation liability is projected to peak, in nominal terms, at approximately $9.6 billion by 30 June 2032.
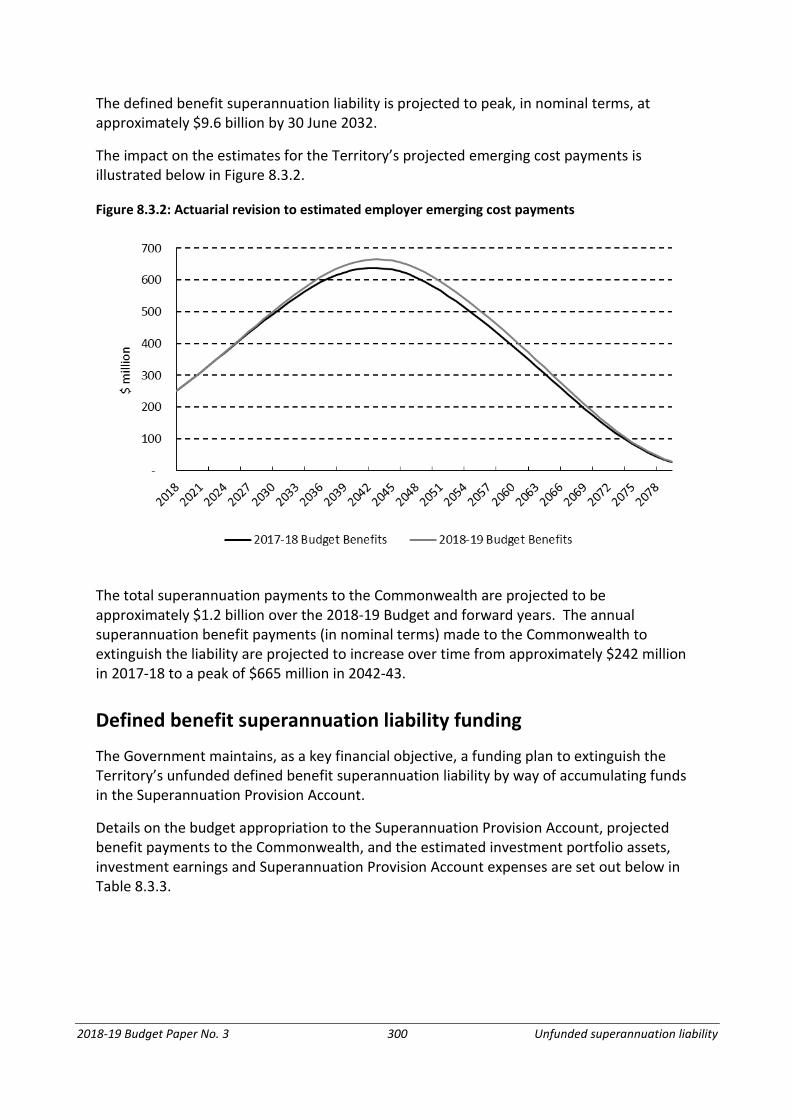
The impact on the estimates for the Territory’s projected emerging cost payments is illustrated below in Figure 8.3.2.
Figure 8.3.2: Actuarial revision to estimated employer emerging cost payments
The total superannuation payments to the Commonwealth are projected to be approximately $1.2 billion over the 2018-19 Budget and forward years. The annual superannuation benefit payments (in nominal terms) made to the Commonwealth to extinguish the liability are projected to increase over time from approximately $242 million in 2017-18 to a peak of $665 million in 2042-43.
Defined benefit superannuation liability funding
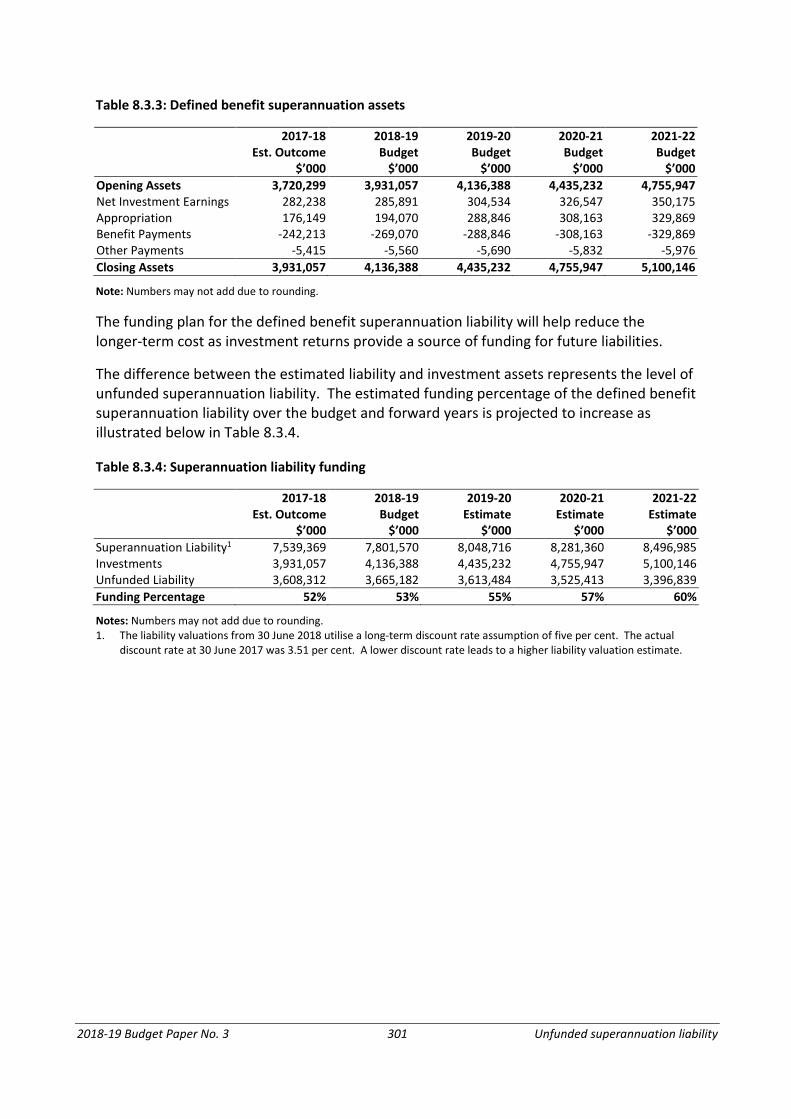
The Government maintains, as a key financial objective, a funding plan to extinguish the Territory’s unfunded defined benefit superannuation liability by way of accumulating funds in the Superannuation Provision Account.
Details on the budget appropriation to the Superannuation Provision Account, projected benefit payments to the Commonwealth, and the estimated investment portfolio assets, investment earnings and Superannuation Provision Account expenses are set out below in Table 8.3.3.
2018-19 Budget Paper No. 3 301 Unfunded superannuation liability
Table 8.3.3: Defined benefit superannuation assets
2017-18 Est. Outcome
$’000
2018-19 Budget
$’000
2019-20 Budget
$’000
2020-21 Budget
$’000
2021-22 Budget
$’000 Opening Assets 3,720,299 3,931,057 4,136,388 4,435,232 4,755,947 Net Investment Earnings 282,238 285,891 304,534 326,547 350,175 Appropriation 176,149 194,070 288,846 308,163 329,869 Benefit Payments -242,213 -269,070 -288,846 -308,163 -329,869 Other Payments -5,415 -5,560 -5,690 -5,832 -5,976 Closing Assets 3,931,057 4,136,388 4,435,232 4,755,947 5,100,146
Note: Numbers may not add due to rounding.
The funding plan for the defined benefit superannuation liability will help reduce the longer-term cost as investment returns provide a source of funding for future liabilities.
The difference between the estimated liability and investment assets represents the level of unfunded superannuation liability. The estimated funding percentage of the defined benefit superannuation liability over the budget and forward years is projected to increase as illustrated below in Table 8.3.4.
Table 8.3.4: Superannuation liability funding
2017-18 Est. Outcome
$’000
2018-19 Budget
$’000
2019-20 Estimate
$’000
2020-21 Estimate
$’000
2021-22 Estimate
$’000 Superannuation Liability1 7,539,369 7,801,570 8,048,716 8,281,360 8,496,985 Investments 3,931,057 4,136,388 4,435,232 4,755,947 5,100,146 Unfunded Liability 3,608,312 3,665,182 3,613,484 3,525,413 3,396,839 Funding Percentage 52% 53% 55% 57% 60%
Notes: Numbers may not add due to rounding. 1. The liability valuations from 30 June 2018 utilise a long-term discount rate assumption of five per cent. The actual
discount rate at 30 June 2017 was 3.51 per cent. A lower discount rate leads to a higher liability valuation estimate.
2018-19 Budget Paper No. 3 302 Unfunded superannuation liability
2018-19 Budget Paper No. 3 303 Management of financial assets and liabilities
8.4 MANAGEMENT OF FINANCIAL ASSETS AND LIABILITIES
Financial assets
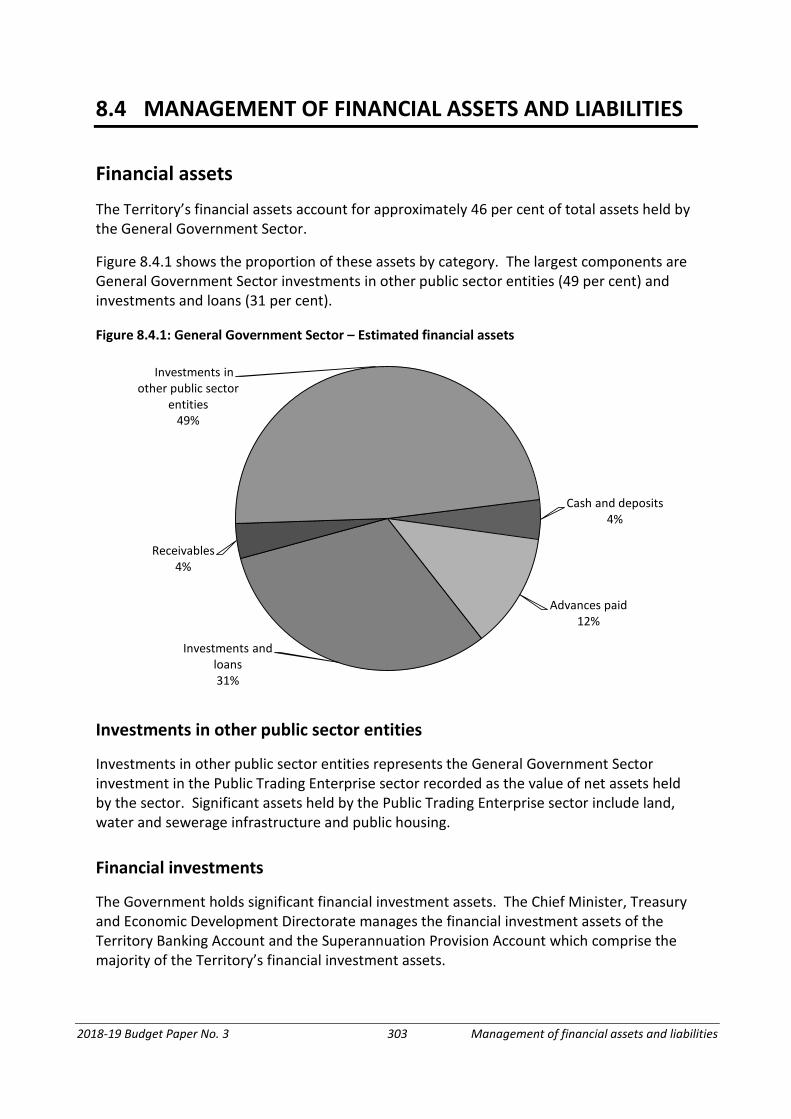
The Territory’s financial assets account for approximately 46 per cent of total assets held by the General Government Sector.
Figure 8.4.1 shows the proportion of these assets by category. The largest components are General Government Sector investments in other public sector entities (49 per cent) and investments and loans (31 per cent).
Figure 8.4.1: General Government Sector – Estimated financial assets
Cash and deposits4%
Advances paid12%
Investments and loans31%
Receivables4%
Investments in other public sector
entities49%
Investments in other public sector entities
Investments in other public sector entities represents the General Government Sector investment in the Public Trading Enterprise sector recorded as the value of net assets held by the sector. Significant assets held by the Public Trading Enterprise sector include land, water and sewerage infrastructure and public housing.
Financial investments
The Government holds significant financial investment assets. The Chief Minister, Treasury and Economic Development Directorate manages the financial investment assets of the Territory Banking Account and the Superannuation Provision Account which comprise the majority of the Territory’s financial investment assets.
2018-19 Budget Paper No. 3 304 Management of financial assets and liabilities
The purpose and role of the financial investment assets is to derive competitive financial returns, based on prudent financial and portfolio management principles, with an investment structure that is low cost and effective in deriving market-based returns. These investment assets are managed in accordance with an established Investment Plan and Responsible Investment Policy.
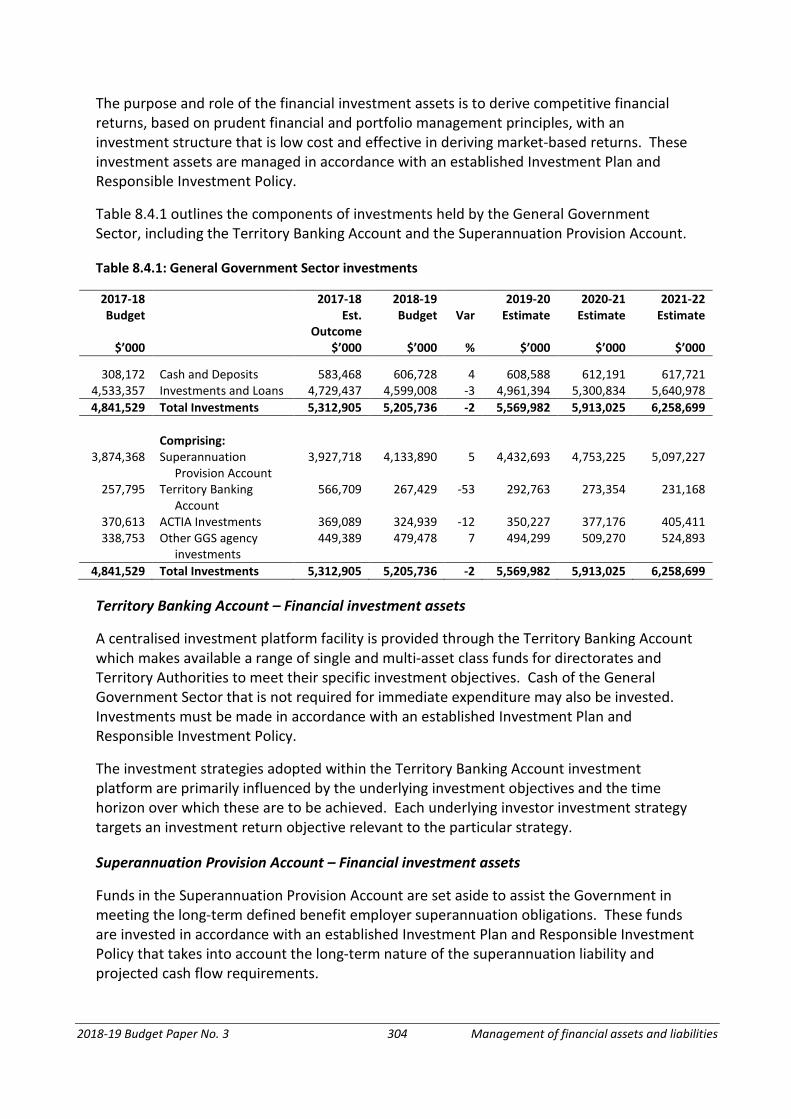
Table 8.4.1 outlines the components of investments held by the General Government Sector, including the Territory Banking Account and the Superannuation Provision Account.
Table 8.4.1: General Government Sector investments
2017-18 2017-18 2018-19 2019-20 2020-21 2021-22 Budget Est.
Outcome Budget Var Estimate Estimate Estimate
$’000 $’000 $’000 % $’000 $’000 $’000
308,172 Cash and Deposits 583,468 606,728 4 608,588 612,191 617,721 4,533,357 Investments and Loans 4,729,437 4,599,008 -3 4,961,394 5,300,834 5,640,978 4,841,529 Total Investments 5,312,905 5,205,736 -2 5,569,982 5,913,025 6,258,699
Comprising:
3,874,368 Superannuation Provision Account
3,927,718 4,133,890 5 4,432,693 4,753,225 5,097,227
257,795 Territory Banking Account
566,709 267,429 -53 292,763 273,354 231,168
370,613 ACTIA Investments 369,089 324,939 -12 350,227 377,176 405,411 338,753 Other GGS agency
investments 449,389 479,478 7 494,299 509,270 524,893
4,841,529 Total Investments 5,312,905 5,205,736 -2 5,569,982 5,913,025 6,258,699
Territory Banking Account – Financial investment assets
A centralised investment platform facility is provided through the Territory Banking Account which makes available a range of single and multi-asset class funds for directorates and Territory Authorities to meet their specific investment objectives. Cash of the General Government Sector that is not required for immediate expenditure may also be invested. Investments must be made in accordance with an established Investment Plan and Responsible Investment Policy.
The investment strategies adopted within the Territory Banking Account investment platform are primarily influenced by the underlying investment objectives and the time horizon over which these are to be achieved. Each underlying investor investment strategy targets an investment return objective relevant to the particular strategy.
Superannuation Provision Account – Financial investment assets
Funds in the Superannuation Provision Account are set aside to assist the Government in meeting the long-term defined benefit employer superannuation obligations. These funds are invested in accordance with an established Investment Plan and Responsible Investment Policy that takes into account the long-term nature of the superannuation liability and projected cash flow requirements.
2018-19 Budget Paper No. 3 305 Management of financial assets and liabilities
The long-term investment return objective for the Superannuation Provision Account is the Consumer Price Index (CPI) plus 4.75 per cent per annum. Due to the volatile nature of global investment markets, actual investment earnings recognised in any particular year will vary from the annual budget estimates.
The investment return for 2017-18 is estimated to be 7.7 per cent, or CPI plus 5.6 per cent, with investment earnings of approximately $282 million. The actual investment return achieved for the 2016-17 financial year was 10.2 per cent, or CPI plus 8.2 per cent, with investment earnings of $345 million.
Incorporating the estimated investment return outcome for 2017-18, the Superannuation Provision Account portfolio will have generated a nominal investment return of 7.8 per cent per annum, or CPI plus 5.2 per cent per annum, over the past 22 years (1996-97 to 2017-18).
Loan receivables
General Government Sector financial assets include loans provided to Icon Water Ltd, ACTION and the Chief Minister, Treasury and Economic Development Directorate.
• Icon Water Ltd loans are funded by matching external borrowings from the Territory’s debt issuance program. Forms of funding include inflation-linked bonds, fixed rate medium-term notes, and short-term discount securities. Loan maturity dates range from June 2020 to June 2048. The total estimated outstanding principal at 30 June 2018 is $1.7 billion.
• The Chief Minister, Treasury and Economic Development Directorate Community Housing Canberra loans – provided through repayable capital injection appropriation – are to support the Government’s affordable housing action plan. The total estimated outstanding principal at 30 June 2018 is $65.6 million. Repayment of the loan principal commenced in December 2017.
• The Chief Minister, Treasury and Economic Development Directorate Exhibition Park loan – provided through a repayable capital injection appropriation – is to support the development and operation of low cost accommodation facilities. Loan principal and interest repayments commence on 1 October 2018, with a maturity date of 1 July 2033. The total estimated outstanding principal at 30 June 2018 is $1.5 million.
• The ACTION loan relates to funding provided from the Commonwealth Government at the commencement of self-government. The loan matures in June 2023. The total estimated outstanding principal at 30 June 2018 is $1.7 million.
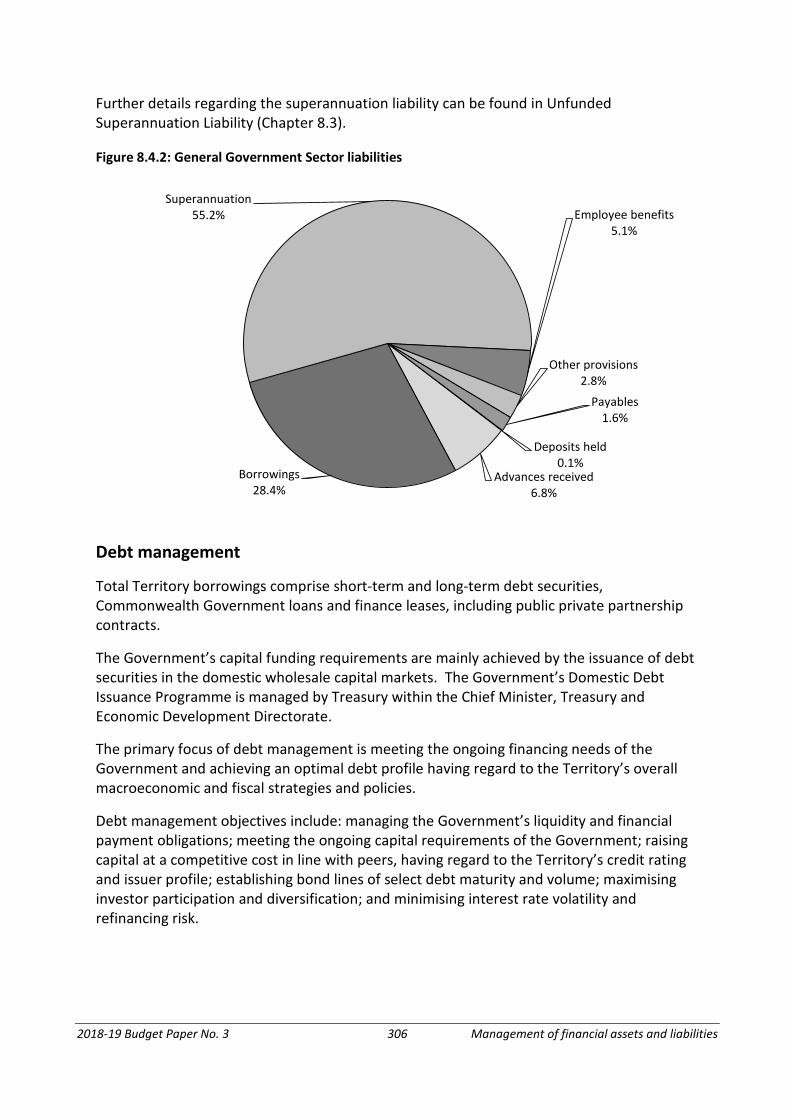
Liabilities
Figure 8.4.2 demonstrates the proportion of liabilities by category. The majority of the General Government Sector liabilities comprise superannuation (55 per cent) and borrowings (28 per cent).
2018-19 Budget Paper No. 3 306 Management of financial assets and liabilities
Further details regarding the superannuation liability can be found in Unfunded Superannuation Liability (Chapter 8.3).
Figure 8.4.2: General Government Sector liabilities
Deposits held0.1%
Advances received6.8%
Borrowings28.4%
Superannuation55.2% Employee benefits
5.1%
Other provisions2.8%
Payables1.6%
Debt management
Total Territory borrowings comprise short-term and long-term debt securities, Commonwealth Government loans and finance leases, including public private partnership contracts.
The Government’s capital funding requirements are mainly achieved by the issuance of debt securities in the domestic wholesale capital markets. The Government’s Domestic Debt Issuance Programme is managed by Treasury within the Chief Minister, Treasury and Economic Development Directorate.
The primary focus of debt management is meeting the ongoing financing needs of the Government and achieving an optimal debt profile having regard to the Territory’s overall macroeconomic and fiscal strategies and policies.
Debt management objectives include: managing the Government’s liquidity and financial payment obligations; meeting the ongoing capital requirements of the Government; raising capital at a competitive cost in line with peers, having regard to the Territory’s credit rating and issuer profile; establishing bond lines of select debt maturity and volume; maximising investor participation and diversification; and minimising interest rate volatility and refinancing risk.
2018-19 Budget Paper No. 3 307 Management of financial assets and liabilities
Credit rating
The Territory holds AAA (negative) long-term and A-1+ short-term local currency credit ratings from the International ratings agency Standard & Poor’s.
The long-term AAA rating reflects the ACT’s very strong economy and financial management, strong budgetary flexibility, exceptional liquidity, moderate debt burden and low contingent liabilities.
The negative outlook is a function of this being applied to the Commonwealth Government. No state or territory is expected to be able to hold a stronger credit rating than the sovereign government.
Borrowings
A summary of the borrowing estimates for the 2018-19 Budget are detailed below in Tables 8.4.2 and 8.4.3.
Table 8.4.2: Total Territory borrowings – Principal outstanding
2017-18 2017-18 2018-19 2019-20 2020-21 2021-22 Budget Est. Outcome Budget Estimate Estimate Estimate
$m $m $m $m $m $m Total Territory
3,571.1 Market Borrowings 3,429.2 3,510.2 4,219.1 4,687.8 4,774.1 125.9 Historic Commonwealth Loans
(self-government) 125.9 117.2 108.3 99.4 90.5
950.0 Commonwealth Loan – Asbestos Eradication Scheme
950.0 900.0 850.0 750.0 650.0
111.0 Finance Leases 0.21 488.0 476.9 465.3 455.2
4,758.0 Total 4,505.3 5,015.4 5,654.3 6,002.5 5,969.8
Note: Numbers may not add due to rounding. 1. The variance in the 2017-18 estimated outcome from the original budget is mainly due to the liability for the Courts
public private partnerships commitments associated with the delay in construction and operation of the new ACT Law Court facility.
2018-19 Budget Paper No. 3 308 Management of financial assets and liabilities
Table 8.4.3: Total Territory borrowings – Interest expense
2017-18 2017-18 2018-19 2019-20 2020-21 2021-22 Budget Est. Outcome Budget Estimate Estimate Estimate
$m $m $m $m $m $m Total Territory
155.2 Market Borrowings 156.5 145.0 161.1 178.6 195.2 6.3 Historic Commonwealth Loans
(self-government) 6.3 5.9 5.5 5.0 4.6
27.1 Commonwealth Loan – Asbestos Eradication Scheme
27.1 25.7 24.4 23.0 20.3
5.8 Finance Leases 0.5 27.1 32.1 31.3 30.5
194.3 Total 190.4 203.8 223.0 237.9 250.6
Note: Numbers may not add due to rounding.
Total market-financed borrowings and loans are estimated to be $3.4 billion as at 30 June 2018, an estimated $141.9 million lower than the 2017-18 Budget estimate.
The Government estimates that there will be a net increase in market financed borrowings of approximately $1.3 billion over the 2018-19 Budget and forward estimates period. Over this same period, loans from the Commonwealth will be reduced by an estimated $335.4 million.
The Government’s 2018-19 Budget will continue the successful strategy of investing in Canberra to meet the needs of the growing community, through significant investment in frontline services ensuring that Canberra remains one of the most liveable cities in the world.
The 2018-19 Budget strategy continues to maintain debt at sustainable levels while providing the flexibility to deal with emerging pressures and continuing to invest in a record infrastructure and capital program.
2018-19 Budget Paper No. 3 309 Management of financial assets and liabilities
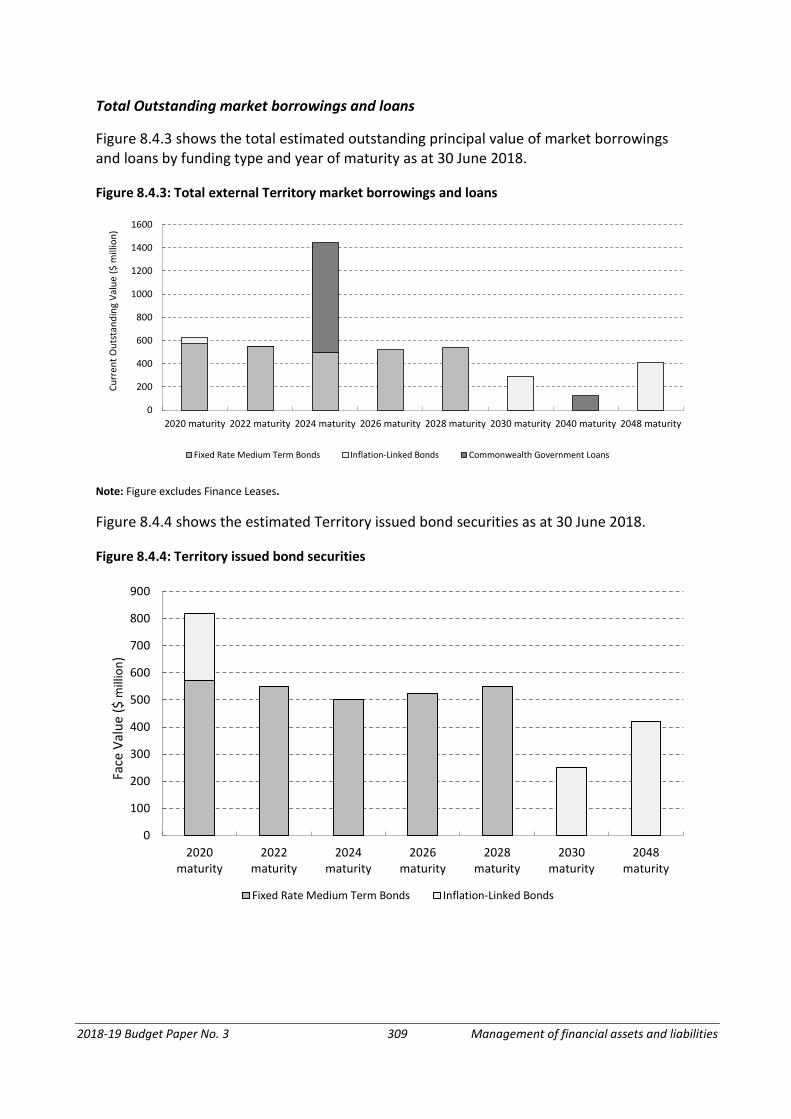
Total Outstanding market borrowings and loans
Figure 8.4.3 shows the total estimated outstanding principal value of market borrowings and loans by funding type and year of maturity as at 30 June 2018.
Figure 8.4.3: Total external Territory market borrowings and loans
0
200
400
600
800
1000
1200
1400
1600
2020 maturity 2022 maturity 2024 maturity 2026 maturity 2028 maturity 2030 maturity 2040 maturity 2048 maturity
Fixed Rate Medium Term Bonds Inflation-Linked Bonds Commonwealth Government Loans
Curr
ent O
utst
andi
ngVa
lue
($ m
illio
n)
Note: Figure excludes Finance Leases.
Figure 8.4.4 shows the estimated Territory issued bond securities as at 30 June 2018.
Figure 8.4.4: Territory issued bond securities
0
100
200
300
400
500
600
700
800
900
2020maturity
2022maturity
2024maturity
2026maturity
2028maturity
2030maturity
2048maturity
Fixed Rate Medium Term Bonds Inflation-Linked Bonds
Face
Val
ue ($
mill
ion)
2018-19 Budget Paper No. 3 310 Management of financial assets and liabilities
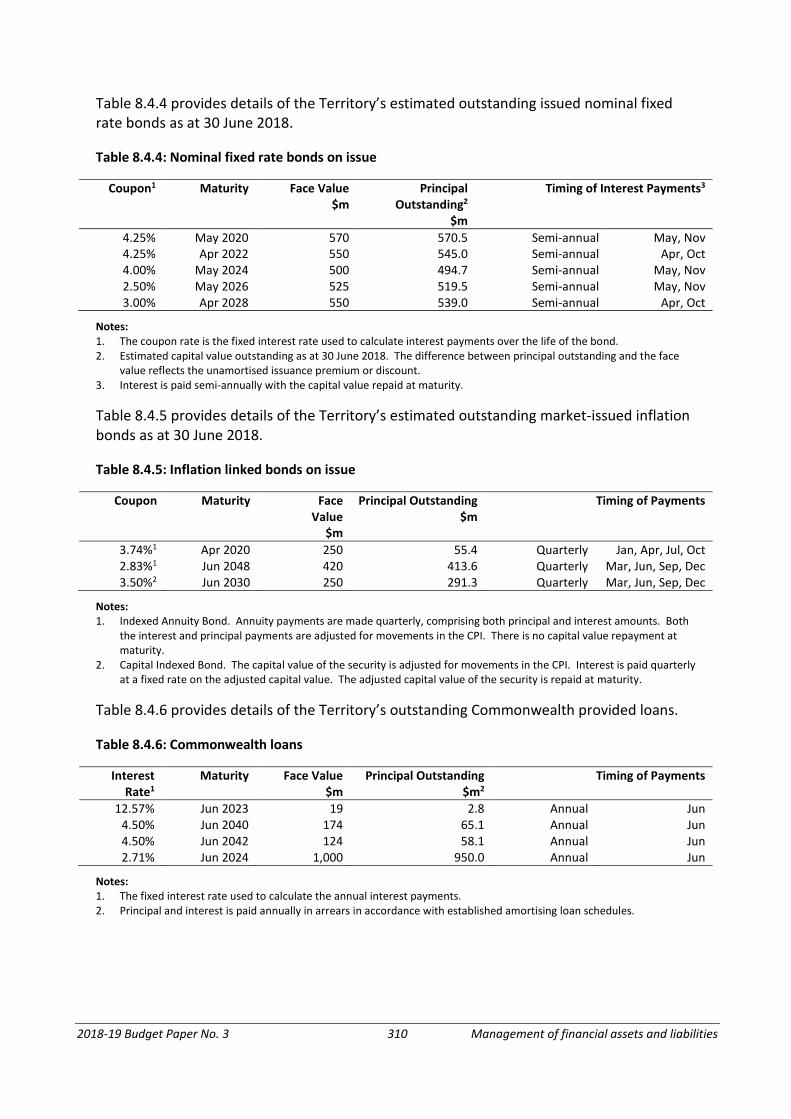
Table 8.4.4 provides details of the Territory’s estimated outstanding issued nominal fixed rate bonds as at 30 June 2018.
Table 8.4.4: Nominal fixed rate bonds on issue
Coupon1 Maturity Face Value $m
Principal Outstanding2
$m
Timing of Interest Payments3
4.25% May 2020 570 570.5 Semi-annual May, Nov 4.25% Apr 2022 550 545.0 Semi-annual Apr, Oct 4.00% May 2024 500 494.7 Semi-annual May, Nov 2.50% May 2026 525 519.5 Semi-annual May, Nov 3.00% Apr 2028 550 539.0 Semi-annual Apr, Oct
Notes: 1. The coupon rate is the fixed interest rate used to calculate interest payments over the life of the bond. 2. Estimated capital value outstanding as at 30 June 2018. The difference between principal outstanding and the face
value reflects the unamortised issuance premium or discount. 3. Interest is paid semi-annually with the capital value repaid at maturity.
Table 8.4.5 provides details of the Territory’s estimated outstanding market-issued inflation bonds as at 30 June 2018.
Table 8.4.5: Inflation linked bonds on issue
Coupon Maturity Face Value
$m
Principal Outstanding
$m Timing of Payments
3.74%1 Apr 2020 250 55.4 Quarterly Jan, Apr, Jul, Oct 2.83%1 Jun 2048 420 413.6 Quarterly Mar, Jun, Sep, Dec 3.50%2 Jun 2030 250 291.3 Quarterly Mar, Jun, Sep, Dec
Notes: 1. Indexed Annuity Bond. Annuity payments are made quarterly, comprising both principal and interest amounts. Both
the interest and principal payments are adjusted for movements in the CPI. There is no capital value repayment at maturity.
2. Capital Indexed Bond. The capital value of the security is adjusted for movements in the CPI. Interest is paid quarterly at a fixed rate on the adjusted capital value. The adjusted capital value of the security is repaid at maturity.
Table 8.4.6 provides details of the Territory’s outstanding Commonwealth provided loans.
Table 8.4.6: Commonwealth loans
Interest Rate1
Maturity Face Value $m
Principal Outstanding
$m2 Timing of Payments
12.57% Jun 2023 19 2.8 Annual Jun 4.50% Jun 2040 174 65.1 Annual Jun 4.50% Jun 2042 124 58.1 Annual Jun 2.71% Jun 2024 1,000 950.0 Annual Jun
Notes: 1. The fixed interest rate used to calculate the annual interest payments. 2. Principal and interest is paid annually in arrears in accordance with established amortising loan schedules.
2018-19 Budget Paper No. 3 311 Management of financial assets and liabilities
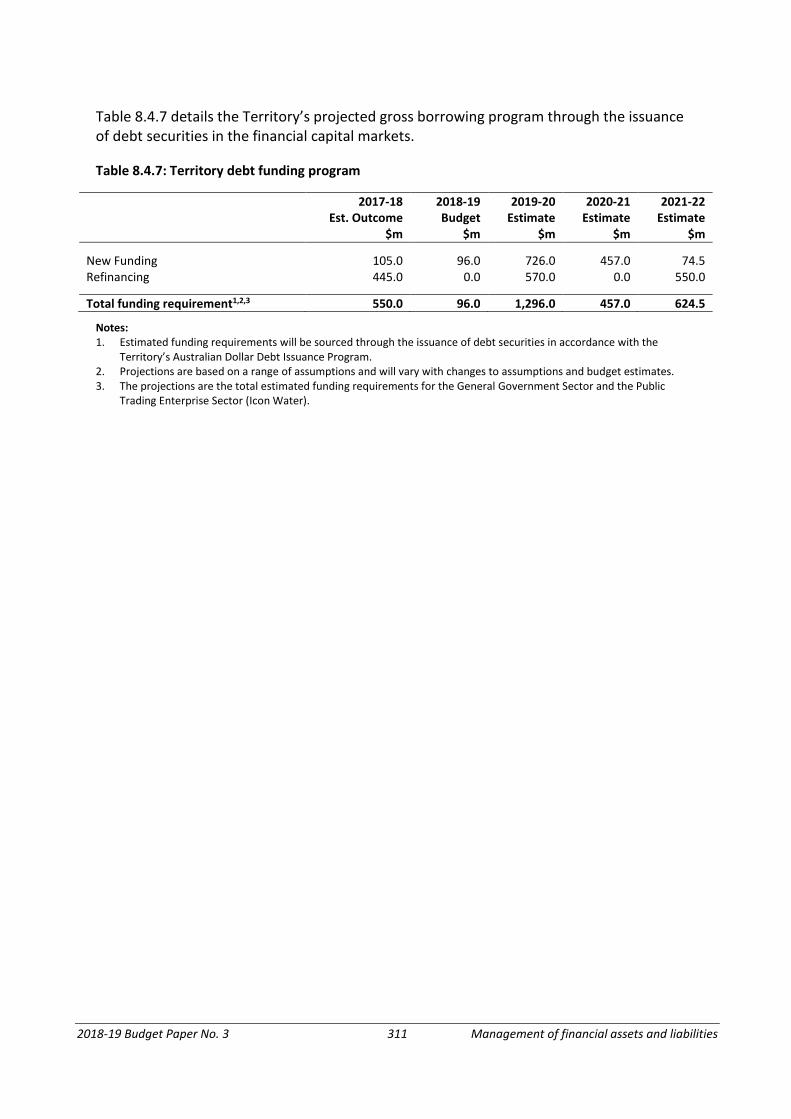
Table 8.4.7 details the Territory’s projected gross borrowing program through the issuance of debt securities in the financial capital markets.
Table 8.4.7: Territory debt funding program
2017-18 2018-19 2019-20 2020-21 2021-22 Est. Outcome Budget Estimate Estimate Estimate $m $m $m $m $m
New Funding 105.0 96.0 726.0 457.0 74.5 Refinancing 445.0 0.0 570.0 0.0 550.0
Total funding requirement1,2,3 550.0 96.0 1,296.0 457.0 624.5
Notes: 1. Estimated funding requirements will be sourced through the issuance of debt securities in accordance with the
Territory’s Australian Dollar Debt Issuance Program. 2. Projections are based on a range of assumptions and will vary with changes to assumptions and budget estimates. 3. The projections are the total estimated funding requirements for the General Government Sector and the Public
Trading Enterprise Sector (Icon Water).
2018-19 Budget Paper No. 3 312 Management of financial assets and liabilities