Embed Size (px)
Citation preview

2018 – 2020
Joint Strategic Needs Assessment
for Torbay

CONTENTS
Contents
Quick Facts about Torbay and Torbay residents: ..................................................................... 1
Foreword ....................................................................................................................................... 2
Exec Summary ............................................................................................................................. 3
The Torbay Area ........................................................................................................................... 4
Introduction .................................................................................................................................. 5
Background ................................................................................................................................ 5
The structure of the JSNA .......................................................................................................... 6
Life course .................................................................................................................................. 8
Comparisons............................................................................................................................... 9
Additional profiles ..................................................................................................................... 10
Inequalities ................................................................................................................................. 11
Wider determinants ................................................................................................................... 15
Prevention opportunities ........................................................................................................... 17
Public sector expenditure ......................................................................................................... 18
Population overview .................................................................................................................. 24
Starting and developing well overview .................................................................................... 28
Living and working well overview ............................................................................................ 35
Ageing and dying well overview ............................................................................................... 41
References .................................................................................................................................. 46

1
QUICK FACTS
Quick Facts about Torbay and Torbay residents:
133,883 people live in Torbay(2016)
The average age in Torbay is 44.8 years
(2016)
3.7% are aged 85 years and over
(2016)
There are, on average, 3.8 births per day
(2014/16)There are, on average,
4.8 deaths per day(2013/15)
Life expectancy at birth83.3 years for females78.9 years for males
(2013/15)
Housing conditions are worse in Torbay, with 45% living in the most
deprived quintile in England for indoor
deprivation
There are, on average, 145 attendances at A & E per day
With an average age of 43.8 years(2016/17)
There are, on average, 170 admissions to
hospital per dayWith an average age of
55.8 years(2016/17)
285 children were looked after by the Local
Authority, equivalent to 112 per 10,000
(2017)Around 66,400 (68%)
adults are overweight or obese in Torbay
(2016)
Around 18,100 adults in Torbay smoke
(2016)
On an average day, the spend across 6 public sector organisations is
around £2.5M(2015/16)
There are 12 GP practices, and
37 PharmaciesServing Torbay
2
FOREWORD
Foreword
I am delighted that we have developed a report that provides a comprehensive picture of the key
issues facing the population of Torbay. It is important that we understand these issues, and that
we plan the services we deliver according to the health and well-being needs of the local
population.
The 2018 Joint Strategic needs Assessment (JSNA) brings together data from a range of
partners across the South Devon and Torbay community. It identifies key issues which leaders,
planners and commissioners can concentrate on for the following years.
As with other areas in the UK, we face a number of health and wellbeing issues in Torbay. The
statistics show that two out of every three adults are overweight, with one in four being deemed
obese. In primary schools, one in five children is obese by the time they reach Year 6.
We have an ageing population - one in four adults is aged over 65 and this statistic is increasing.
Torbay also has a high number of households which fall in the poverty category, high levels of
frailty, and there are high rates of alcohol related admissions to hospitals and mortality due to
corresponding liver disease.
With this in mind, it is vital for upstream interventions to be strengthened. By preventing ill health
in the first place through healthy lifestyles and choices, the healthier we can keep individuals,
society, and our health and economic systems.
I hope you enjoy reading this document and that it helps you better understand your community
or the community you serve and that you will use this document to help you plan services and
interventions that best suit your community needs.
Chair Torbay Health and Wellbeing Board

3
EXEC SUMMARY
Exec Summary
This is the 6th JSNA to be written for Torbay since 2007. This JSNA presents the most acute
levels of social challenge within the Torbay population so far.
The last 10 years has seen a consistent set of issues highlighted. The key challenges facing the
population and the organisations that serve the population are highlighted below.
Inequalities have been widening as relative deprivation worsens; Torbay is ranked as the
most deprived local authority in the South West region
Children
o The number of children looked after by the local authority remains amongst the
highest in England
o Around 1 in 4 children continue to live in households where income is less than
60% of the median income (living in poverty)
Economy Torbay’s economy is amongst the weakest in England, and has declined in
recent years
Risk taking behaviours
o Around 6 out of 10 adults in Torbay are overweight or obese
o Around 1 in 6 adults in Torbay smoke
o There are high levels of alcohol related admissions to hospital
o Torbay has high levels of self-harm in the population
Vulnerable populations there are high levels of vulnerability in the population, with high
levels of specialist need cohorts and high levels of mental ill health
Ageing population the number of people aged over 85 is expected to increase by around
3,000 (56%) over the next decade or so. With increasing numbers expected to be frail and
require support from health and social care services.
Costs Public sector spend is around £2.5M per day in Torbay, across 6 areas. Spend
associated with an ageing population and a consequence of risk taking behaviours is
expected to increase.
There are opportunities for specific needs assessments to understand the specific needs of
defined cohorts, such as those with Learning Disabilities or children looked after.
This document is part of the JSNA in Torbay, a large part of the JSNA is the district, town and
electoral ward profiles which cover the life course. These can be found at:
www.southdevonandtorbay.info/jsna

4
THE TORBAY AREA
The Torbay Area
Torbay has a rich, diverse and proud heritage spanning many thousands of years. Torbay became
a popular holiday destination early in the 19th century, famed for its romantic quality, its balmy air
and perfect environment for relaxation and convalescence. It was the Victorians that coined the
phrase the ‘English Riviera’, likening the area to its French equivalent.
Subtropical plants and the celebrated Torbay Palm, flourishing within the special microclimate, add
to the Mediterranean feel, and these days the busy waterfronts are a hive of activity catering for
both working and pleasure craft. The three Riviera towns of Brixham, Paignton and Torquay
surround the natural, sheltered Bay which, with a south easterly aspect, forms an ideal suntrap
and boasts many Blue Flag beaches.
Figure 1: An overview of the Torbay area
Torbay has the romance of a
seaside town, sandy beaches
and above-average warm
weather. With these
attractions, Torbay, of course,
has been a popular retirement
destination for many years.
This is reflected in the
population structure of Torbay.
Torbay area covers some 64
square kilometres (24.6 Sq
Miles) and takes in around 44
kilometres (27.7 miles) of
coastline.

5
INTRODUCTION
Introduction
Background
The Torbay JSNA is not a standalone document but a suite of documents, web tools and
presentations which help to analyse the health needs of populations to inform and guide
commissioning of health, wellbeing and social care services within the local authority area [2]. The
JSNA is a means by which local leaders work together to understand and agree the needs of
the local population [3]. JSNAs, along with health and wellbeing strategies enable commissioners
to plan and commission more effective and integrated services to meet the needs of the Torbay
population [3], in particular for the most vulnerable, and for groups with the worst health outcomes,
and to help reduce the overall inequalities that exist.
This diagram of the commissioning cycle (fig 2) shows a way of breaking the cycle down into three
main stages: Strategic Planning, Providing Services, and Monitoring and Evaluation. The JSNA
supports the strategic planning by identifying the needs within communities. Understanding the
needs of the population informs and influences commissioning intentions and priorities.
Figure 2: Commissioning cycle
Helping people to live longer and healthier
lives is not simply about the healthcare
received through GPs or at hospital, it is
also about the wider social determinants
of where we live and work [4]. The
collective action of agencies is needed
today to promote the health of tomorrow’s
older population. Preventing ill health
starts before birth, and continues to
accumulate throughout individuals’ lives
[4].
Source: http://commissioning.libraryservices.nhs.uk/
The Local Government and Public Involvement in Health Act (2007) [7] required Primary Care
Trusts (PCTs) and Local Authorities to produce a JSNA of the health and well-being of their local
community. From April 2013, Local Authorities and Clinical Commissioning Groups (CCG) have

6
INTRODUCTION
equal and explicit obligations to prepare JSNA, under the governance of the health and well-being
board [8].
The approach to the JSNA in Torbay is to provide a collection of narrative and data interpretation
to support the community, the voluntary sector and statutory organisations across Torbay. This
approach then provides a consistency of multi-agency data to support strategies,
commisioning and needs assessments across Torbay, illustrated in figure 3 below.
Figure 3: Influences of JSNA
The structure of the JSNA
This report represents a written JSNA narrative for Torbay. This report highlights the key
challenges and issues facing the population of Torbay across the life course, as well as
highlighting areas of spend and opportunity. In addition to this report, there is a series of two page
profiles highlighting key population outcomes across the life course and across different
communities. The structure of the JSNA is presented in figure 4 below.
Figure 5 shows that the written report is supported by a set of profiles for Torbay covering different
stages of the life course and across the different communities in Torbay. For example, the
electoral wards in Torbay each have a 2 page summary highlighting key outcomes for those aged
0 to 4 (starting well). Further details of the life course are presented below.
Figure 4: Structure of 2018 JSNA Figure 5: Structure of 2018 JSNA
JSNA
Influences organisational
priorities
Supports funding bid applications
Provides consistent intelligence for
needs assessments / strategies
JSNA
POPULATION LEVELSTRATEGIC OVERVIEW
SPECIFIC NEEDS ASSESSMENTS
DEFINED COHORTS WITHIN THE POPULATION
E.g.Learning Disability
Children looked after
NEEDS ASSESSMENTS

7
INTRODUCTION
The content of the profiles was derived from a multi-agency workshop held in May 2017. The
workshop was attended with representation and contributions from the following areas;
Table 1: JSNA contributors
Citizens Advice Bureau Torbay Public Health
Commissioners
Devon and Cornwall
Constabulary
Torbay Adult Social Care
commissioners
Health Watch Torbay Department for Work and
Pensions
Torbay Children’s services
commissioners
Torbay Development Agency An Elected Member
South Devon and Torbay
Clinical Commissioning group
Torbay and South Devon NHS
Foundation Trust
Output from the workshop formed the content list for the profiles. There are 5 profiles for each
geographical area, covering the life course. In total there are 95 profiles, covering the life course
across Torbay, the towns and electoral wards.
Figure 6: Torbay Population overview profile – EXAMPLE PROFILE
Larger copies of the profiles are available at www.southdevonandtorbay.info/jsna
8
INTRODUCTION
This written narrative is themed into the following chapters:
Inequalities – highlights differences in outcomes across our communities
Prevention – identifies ways to consider upstream approaches to risk factors
Public sector spend – examines public sector spend in Torbay compared to other areas
Life course chapters – each chapter presents a summary of key age specific challenges
affecting the population of Torbay
o Population overview sets the scene for the current & future population structure
across Torbay. It includes top level population overviews
o Starting Well is about understanding the needs of the population through
pregnancy, birth and for the first few years of life.
o Developing Well is about understanding the needs of the population between the
ages of 5 and 24.
o Living and Working Well is about understanding the needs of the working age
population.
o Ageing and Dying Well is about understanding the needs of those from around 65
years and over.
The Torbay JSNA is wider than the set of profiles and this narrative report. The JSNA includes
specific overviews of conditions, diseases or analysis of specific cohorts within the population.
The JSNA can be accessed at: www.southdevonandtorbay.info/jsna
Life course
A life course approach enables an understanding of needs and risks to health and wellbeing at
different points along the path of life. For example, our needs as babies and in our early years
differ significantly to our needs and risks to health and wellbeing as we enter adulthood or
retirement. Understanding the risks to health and wellbeing at different points along the path of life
enables opportunities to promote positive health and wellbeing and to prevent future ill health, or to
understand the potential burden of disease that may need to be considered in delivering services.
Understanding needs across the life course also enables an understanding of exposures in
childhood, adolescence and early adult life and how they influence the risk of disease and socio-
economic position in later life [5]. Understanding the influence of risk in this way may help to
prevent future generations experiencing some of the illnesses of today.

9
INTRODUCTION
Comparisons
The Chartered Institute of Public Finance and Accountancy (CIPFA), working with local authorities,
have developed an approach to aid benchmarking and comparing similar local authorities. CIPFA
have developed a methodology that allows local authorities to compare themselves with similar
authorities. These are known as nearest neighbours. Torbay’s nearest neighbours are presented,
with some demographic information, in table 2 below.
Contextualisation presented within this report, and across the JSNA profiles, shows a statistic for
‘CIPFA’. The statistic is the average of the nearest neighbours. The statistics are constructed
through a robust way to ensure the stats are comparable, for example, calculating appropriate
numerators and denominators, or age specific rates.
Table 2: Torbay’s nearest neighbours
Nearest Neighbour Model
(CIPFA)
Deprivation
score
(IMD 2015)
Total
Population
(2015)
Aged 65
and over
% of Pop
aged 65+
Blackpool 42.0 139,600 28,400 20.3%
Bournemouth 21.8 194,500 34,900 17.9%
Cornwall 23.8 549,400 131,900 24.0%
Darlington 23.6 105,400 20,500 19.4%
East Riding of Yorkshire 15.8 336,700 82,600 24.5%
Isle of Wight 23.1 139,400 37,000 26.5%
North East Lincolnshire 30.9 159,600 31,100 19.5%
North Somerset 15.8 209,900 48,800 23.2%
North Tyneside 21.3 202,500 39,200 19.4%
Northumberland 20.5 315,300 72,700 23.1%
Poole 15.2 150,600 33,100 22.0%
Redcar & Cleveland 28.6 135,300 29,200 21.6%
Sefton 25.7 273,700 61,800 22.6%
Southend-on-Sea 24.5 178,700 34,000 19.0%
Torbay 28.8 133,400 34,300 25.7%
Wirral 26.9 320,900 67,000 20.9%
Source: CIPFA
Analysis around South Devon and Torbay Clinical Commissioning spend compares the local CCG
to its equivalent nearest neighbours, referred to as RightCare.
Further information on RightCare nearest neighbours, or comparator groups can be found at
https://www.england.nhs.uk/rightcare/

10
INTRODUCTION
Additional profiles
Further information and profiles are available from Public Health England. These contextualise
Torbay against a national perspective, as well as against Torbay’s CIPFA neighbours.
Further profiles are available at: https://fingertips.phe.org.uk/
Figure 7: Public Health Profiles

11
INEQUALITIES
Inequalities
Inequalities are evident across the life course, from children being born in more deprived areas
expected to experience shorter life expectancy (figure 8); to working age persons with lower or
no qualifications; to premature mortality.
In order to begin to reduce inequalities, an understanding of the complex web of issues is required.
There is evidence to suggest that disadvantage starts before birth and accumulates
throughout life [1]. To reduce inequalities across the life course, it is important to reduce early
disadvantage, poorer outcomes from pregnancy and birth, and during childhood.
Health inequalities are when different people experience different outcomes. For example, higher
rates of people dying prematurely in one community compared to another community (figure 9).
There is a well evidenced relationship between poorer communities, in terms of income, and
poorer health outcomes such as life expectancy [1].
Figure 8: 2014/15 Life expectancy at birth by deprivation quintile across Torbay
Source: PCMD, NOMIS and ONS
Figure 9: 2013/15 Life expectancy at birth by electoral ward and sex across Torbay
compared to England
Source: PCMD, NOMIS and ONS

12
INEQUALITIES
The gap in life expectancy at birth between communities across South Devon and Torbay is
around 8.9 years for males and 5.2 years for females.
Whilst people in our more deprived communities tend to die earlier than those in the least
deprived, they also tend to spend more of their life in poor health. The gap between disability free
life expectancy and life expectancy is widest in our poorer communities (left hand side of figures
10 and 11). The gap is smallest at the less deprived end of the spectrum, right hand side of figures
10 and 11.
Communities in Torbay are represented by the red dots in the two charts. The lower banding of
dots represents the disability free life expectancy experienced in communities, whilst the upper
banding of dots represents the life expectancy on communities. The gap between these two
community measures, represents an inequality across communities.
Figure 10: Female life expectancy and
disability free life expectancy at birth, by
neighbourhood deprivation level, England,
2009 to 2013
Figure 11: Male life expectancy and disability
free life expectancy at birth, by
neighbourhood deprivation level, England,
2009 to 2013
Source: ONS
What this means is that, on average, the more deprived female populations in Torbay can expect
to live their last 23.8 years of life with a disability compared to those in the least deprived (16.2
years) population, and still expect to die around 8.3 years earlier. For the males population in
the most deprived communities of Torbay, they can expect to live their last 20.5 years of life with
a disability compared to those in the least deprived (14.7 years) population, and still expect to
die around 8.7 years earlier. Proportionately, people in Torbay’s more deprived communities
spend a larger amount of their life in need of some increased level of support.

13
INEQUALITIES
Life expectancy for both females and males has increased over time. A gap between the sexes
remains with females, on average, living longer than males. It is of particular note that whilst life
expectancy has been increasing, disability free life expectancy has decreased. This suggests that
the population are ageing in poorer health, and this may in turn have a negative impact on the
demand for support services to manage a population in poorer health.
Figure 12: Female Disability-free life
expectancy and life expectancy over time
Figure 13: Male Disability-free life
expectancy and life expectancy over time
Source: ONS
Figures 10 and 11 (above) show that people in our more deprived communities live for longer
with a disability. This population needs to access care for a relatively longer period of time.
Reducing the gap between disability free life expectancy and life expectancy would result in
significant financial savings to the public purse.
Reducing inequalities in health does not require a separate health agenda, but action across the
whole of society [1]. Inequalities in health are not simply about levelling out the burden of disease
across the population, as good health is not simply a measure of the absence of disease.
Where we live, and who we are, all impact on health, and inequalities.
At a national level, it is estimated that the cost of inequality in illness accounts for productivity
losses of around £32 billion per year [1]. Proportionately, in Torbay this could represent a cost of
inequality in illness of around £75 to £80 million per year. That would include lost taxes, higher
welfare payments and higher NHS healthcare costs. The figure presented is based on a national
population spend per head being applied to the South Devon and Torbay population; it has not
been adjusted for deprivation, age or sex. It does however represent a wider system perspective
on costs.
In 2015, Torbay’s overall position for multiple deprivation rank of average rank was 46th out of 326
district local authorities and 37th out of 152 upper tier Local authorities in England. Compared to
the South West of England, Torbay is ranked as the most deprived on a range of summary

14
INEQUALITIES
measures (including income and employment deprivation summary measures). Torbay’s position
is relatively worse than for previous versions of the IMD (index of Multiple Deprivation).
For local authority districts, Torbay is ranked within the top 20% most deprived local authorities in
England (figure 14), and when compared to CIPFA statistical neighbours, Torbay has the second
highest levels of multiple deprivation (table 3).
Table 3: Torbay’s nearest unitary
neighbours
Figure 14: Average rank summary measure
of the 2015 IMD, for local authority districts
Source: CIPFA nearest unitary authority neighbours, 2015
CIPFA nearest neighbour
(district LA rank of 326)
IMD rank of average
rank
2010 2015
Blackpool 10 4
Torbay 49 46
North East Lincolnshire 78 65
Cornwall 82 68
Redcar and Cleveland 71 78
Isle of Wight 106 83
Sefton 114 102
Southend-on-Sea 117 105
Wirral 103 106
Bournemouth 96 117
Darlington 104 122
North Tyneside 124 138
Northumberland 144 145
Poole 187 208
East Riding of Yorkshire 216 215
North Somerset 224 224
Figure 15: Change in count of LSOAs in Torbay in the top 20% most deprived in England
Since 2004 the number of areas in Torbay in
the top 20% most deprived in England has
increased (figure 15). The darker circles
represent the 2015 indices of multiple
deprivation.
There are currently 28 areas in Torbay in the
top 20% most deprived in England; up from
12 in 2004. These areas are presented in red
and dark blue in fig 16 below.

15
INEQUALITIES
Figure 16: 2015 rank of index of multiple deprivation
Wider determinants of health
Whilst it is not possible to change some of our individual determinants of health, such as our age,
our sex at birth and our genetic makeup (family history). There are other factors that we can try to
influence that impact on health and wellbeing, such as the environment in which we live, our ability
to work and the lifestyle choices we make. Figure 17 illustrates the main influences on health [6].
These influences are known as the wider determinants of health.
The layers presented in figure 17 include:
individual lifestyle factors such as smoking habits, diet and physical activity have the
potential to promote or damage health
social and community network interactions with friends, relatives and mutual support
within a community can sustain people's health

16
INEQUALITIES
wider influences on health include living and working conditions, food supplies, access to
essential goods and services, and the overall economic, cultural and environmental
conditions prevalent in society as a whole
Figure 17: Wider determinants of health [6]
Influencing these layers, across the life course, is required to reduce inequalities, such as the gap
in life expectancy, and improve the health and wellbeing of the South Devon and Torbay
population.
Social and economic factors are estimated to contribute to 40% of health outcomes, made up of
education (10%), employment (10%), income (10%), family and social support (5%) and
community safety (5%). Contributions are illustrated in figure 18 below.
Figure 18: contribution of determinants to health outcomes
HEALTH BEHAVIOURS (30%)
TOBACCO USE (10%)
DIET AND EXERCISE (10%)
ALCOHOL USE (5%) SEXUAL ACTIVITY (5%)
CLINICAL CARE (20%)
ACCESS TO CARE (10%)
QUALITY OF CARE (10%)
SOCIAL AND ECONOMIC FACTORS
(40%)
EDUCATION (10%)
EMPLOYMENT (10%)
INCOME (10%)
FAMILY AND SOCIAL SUPPORT (5%)
COMMUNITY SAFETY (5%)
PHYSICAL ENVIRONMENT (10%)
AIR QUALITY (5%) BUILT ENVIRONMENT
(5%)
Source: County Health, Rankings Working Paper. Madison (WI): University of Wisconsin Population Health Institute, 2010 [9]

17
PREVENTION OPPORTUNITIES
Prevention opportunities
Prevention means different things to different people, and there are different perceptions and
perspectives of prevention. From a population level perspective, illustrated in fig 20 as health
improvement opportunities to prevent the need for treatment services are more cost effective than
treating people, to tertiary prevention that aims to prevent the worsening or repeat need for
treatment.
For example, continuously pulling people out of the river downstream (fig 19) takes resources and
over time would be more costly than simply fixing the bridge and preventing people falling into the
river in the first place. This could be applied to any treatment or activity based services.
Figure 19: Upstream – Downstream opportunities to reduce costs
Figure 20: Prevention opportunities
Understanding the Community Population structure, differences
between communities, community assets
Understanding the Risks to Health and Wellbeing
‘fixing the bridge’Preventing people falling in the river
in the first place
Promoting Health and WellbeingIntervention – ‘throwing a rope’
Shortening the period in the river and promoting early recovery
Understanding Health and Wellbeing outcomes
‘pulling people out of the river’Burden of disease and mortality
£
£
£
£
SPEND
£
Tertiary prevention seeks to limit disability or incapacitye.g. physical exercise as part of cardiac rehabilitation
Tertiary prevention seeks to limit disability or incapacitye.g. physical exercise as part of cardiac rehabilitation
Tertiary prevention
Secondary prevention
Primary prevention
Health improvement
Secondary prevention seeks to shorten episodes and duration of illness
e.g. smoking cessation for asthmatics
Secondary prevention seeks to shorten episodes and duration of illness
e.g. smoking cessation for asthmatics
Primary prevention seeks to avoid onset of illness / disability by the detection of high risk groups and advise on healthy living
e.g. screening programmes, advice on balanced diets
Primary prevention seeks to avoid onset of illness / disability by the detection of high risk groups and advise on healthy living
e.g. screening programmes, advice on balanced diets
Health improvement operates in the community and focuses on creating the conditions that promote healthy lives and aspirations
Health improvement operates in the community and focuses on creating the conditions that promote healthy lives and aspirations

18
PUBLIC SECTOR SPEND ACROSS TORBAY
Public sector expenditure
The public sector includes services commissioned and provided for the public. This includes
support services such as benefits, as well as schools, hospitals and refuse collection. This
includes central government, national agencies, local NHS organisations and Torbay Council.
In 2015/16 around £920M was spent by 6 public sector bodies in Torbay, which equates to
around £2.5M per day. Over half of spend was through the Department of Work and Pensions,
spending £476M. The breakdown of spend is shown in figure 21.
Figure 21: Estimated spend across 6 public sector agencies in 2015 / 16
Source: Revenue Accounts, schools block allocation, benefit expenditure – gov.uk
Data for the Clinical Commissioning Group has been apportioned based on resident population,
with a Torbay figure allocated according to population. The data is not adjusted for age or
deprivation.
The same apportioned based methodology has been applied to both the Police (Devon and
Cornwall Constabulary) and Fire and Rescue (Devon and Somerset Fire and Rescue Service).
The data is published and in the public domain, and analysis of CIPFA nearest neighbours has
been undertaken to add further contextualisation where possible.

19
PUBLIC SECTOR SPEND ACROSS TORBAY
Department for Work and Pensions spend 2015/16
The department for work and pensions spent around £476M in Torbay in 2015/16. Around £250M
was spent on state pension, and with Torbay’s more aged demographic, this explains Torbay’s
higher than average spend DWP spend per head of population.
Spend on Job Seekers Allowance was around £5.4M, and represented a relatively small
proportion of overall spend by the department for work and pensions.
Figure 22: DWP spend per head – 2015-16 Figure 23: Proportion of DWP spend by
benefit
Source: DWP Benefit Expenditure, gov.uk
South Devon Clinical Commissioning Group spend 2015/16
Clinical Commissioning Groups (CCGs) were created following the Health and Social Care Act in
2012, and replaced Primary Care Trusts on 1 April 2013. They are clinically-led statutory NHS
bodies responsible for the planning and commissioning of health care services for their local
area. There are now 207 CCGs in England.
Commissioning is about getting the best possible health outcomes for the local population. This
involves assessing local needs, deciding priorities and strategies, and then buying services on
behalf of the population from providers such as hospitals, clinics, community health bodies, etc. It
is an ongoing process. CCGs must constantly respond and adapt to changing local
circumstances. They are responsible for the health of their entire population, and measured by
how much they improve outcomes.
The South Devon and Torbay CCG is responsible for commissioning health services for the
Torbay population, as well as around 40% of the South Hams and 80% of the Teignbridge
populations. In 2015/16 the South Devon and Torbay CCG total spend was around £387M (CCG
Breakdown of Programme Costs 2015/16 Plans). Apportion based on resident population,

20
PUBLIC SECTOR SPEND ACROSS TORBAY
equates to an estimated spend of £193M for the population of Torbay. The following spend
analysis (figures 24 and 25) is across the whole CCG footprint. The average spend is based on
CCG allocation. As a health geography, there are different comparator groups, the South Devon
and Torbay CCG has a group of similar organisations, referred to as RightCare. Details of the
CCGs that form this group can be found at: https://www.england.nhs.uk/rightcare/products/
South Devon and Torbay have a similar spend per head of population when compared to their
RightCare average, however it is higher than the England average (fig 24). The South Devon and
Torbay CCG spend more per head on acute and community services (fig 25) – the majority will
be commissioned from Torbay and South Devon NHS foundation trust.
Figure 24: CCG spend per head of registered
population – 2015/16
(South Devon and Torbay)
Figure 25: CCG Spend per head of registered
population 2015/16 Plans
(South Devon and Torbay)
Source: CCG Breakdown of Programme Costs 2015/16 Plans
Further analysis of Torbay registered patients by the CCG PBR data (payments by results)
shows that the average spend per head increases with age. Allowing for demographic change,
estimates suggest an increase of £7.3M between 2017 and 2025.
Figure 26: Three year average spend per
head of population (Torbay)
Figure 27: Forecasted spend (Torbay)
Source: 2014 Subnational population projections, ONS; South Devon and Torbay CCG, SUS

21
PUBLIC SECTOR SPEND ACROSS TORBAY
Local Authority (Torbay Council) Revenue Accounts 2015/16
Torbay council is an upper tier unitary local authority, responsible for providing services to the
population of Torbay. Local government in England and Wales is funded through:
grants from central government (about 54%) made up mainly of redistributed business
rates, including the Revenue Support Grant and the Public Health grant
and locally raised funding (about 46%) which includes council tax (charged to local people)
and other sources such as car parks, parking permits and the hire of sports facilities
However this system is currently going through a major change. By 2020 the Government has
committed to phasing out central grants for local government, so that local government will be
funded entirely through locally retained business rates and council tax. The aim of this move is to
encourage local authorities to promote local economic growth and to be financially self-sufficient.
This system of 100% Business Rate Retention is still being designed by DCLG.
https://www.lgiu.org.uk/local-government-facts-and-figures/
In Torbay, the revenue account budget for 2017-18, revenue account data for total service
expenditure is £164M. The £164M is distributed across different service areas, such as Adult
social care, childrens social care and other services. The distribution is presented in figure 28
Figure 28: Revenue Account Budget 2017-18: Figure 29: Total Service Expenditure
(£ per head of total population)
Source: Local authority revenue expenditure and financing, gov.uk
Torbay’s expenditure per head of population is significantly lower than the England average, and
also significantly lower than the CIPFA nearest neighbours average. The expenditure per head
reduced significantly over recent years, as shown in fig 29.
Further analysis across Children’s Social Care, Education, Adult Social Care and Public Health
follow.

22
PUBLIC SECTOR SPEND ACROSS TORBAY
With an increase in academy schools, the expenditure for maintained education that came
through the local authority decreased. This change is important to understand to interpret fig 30.
Torbay has a significantly higher rate of children looked after than most other authorities across
England, and the costs of children’s social care per head of 0 to 19 year olds shows that Torbay
spends around 40% more than both the England and CIPFA averages (fig 31).
Figure 30: Total Education Services
(£ per head of 0 to 19 year olds)
Figure 31: Total Children's Social Care
(£ per head of 0 to 19 year olds)
Source: Local authority revenue expenditure and financing, gov.uk
A great majority of children who become looked after do so because of abuse, neglect or family
dysfunction that causes acute stress among family members [10]. These risk factors tend to be
higher in populations with higher levels of deprivation.
Figure 32: Total Adult Social Care
(£ per head of 18+)
Figure 33: Total Public Health
(£ per head of total population)
Source: Local authority revenue expenditure and financing, gov.uk
With a more aged population, we expected Torbay to have higher levels of adult social care need
compared to the England population, and therefore a higher expenditure per head of population.

23
PUBLIC SECTOR SPEND ACROSS TORBAY
Torbay’s population is expected to continue to have an increase in an older demographic, and
this is expected to continue to increase need for adult social care.
Inequalities across the population of England mean that Local Authorities require different levels
of Public Health funding. Public Health England and the Department of Health have funded local
authority areas relative to the scale or size of need in their population. In essence, this is an
application of proportionate universalism [1]
There is a significant evidence base that identifies greater needs in populations with greater
levels of relative deprivation [1]
An analysis of spend and outcome (figures 34 and 35) suggests that Torbay’s overall outcomes
are similar to the England average (represented by ‘PH’ in figure 34). Specific outliers for Torbay
in relation to overall local authority spend and outcome identified by the SPOT tool suggest
children’s social services, along with planning and cultural services, have higher levels of spend
and worse outcomes compared to the England average.
Within the portfolio of Public Health services, there is variation of spend and outcomes - shown in
figure 35. Drug and alcohol services can be seen as higher spend and worse outcomes (Drug);
this is primarily driven by alcohol specific admissions to hospital, and also claimants of benefits
due to alcoholism. Not all of these outcomes are commissioned through public health in the local
authority setting.
Figure 34: Torbay 2016 Spend and
Outcomes
Figure 35: Torbay 2016 Public Health spend
and outcomes
Source: Public Health England, Spend and Outcome Tool (SPOT)

24
POPULATION OVERVIEW
Population overview
This section provides an overview of the Torbay population, including population estimates and
projections and a chart of key indicators and outcomes.
Torbay has a resident population of 133,883 (2016 Mid-Year Estimate), with 51.5% female and
48.5% male. Torbay’s population structure continues to experience an older demographic, as
shown in the population pyramid (fig 36) below.
Figure 36: population pyramid for
Torbay compared to England, 2016
Figure 37: Population projections for Torbay
Source: NOMIS, 2016 Mid-Year estimates, 2014 based subnational population projections
Torbay’s population is projected to increase over the coming years. The under 65 population
shows modest growth while the over 65 population shows significant growth (shown visually in fig
37 and tabulated in table 4). Torbay’s over 85 population is expected to double over the next
twenty years. These significant increases in the older population are expected to drive increasing
demand on support and treatment services.
Table 4: population estimates by year and age group
Age Group
2017 2018 2019 2020 2025 2030
0-14 21,131 21,336 21,535 21,663 22,071 21,990
15-29 20,598 20,436 20,312 20,256 19,891 20,453
30-44 19,896 19,820 19,770 19,867 20,965 21,158
45-64 37,501 37,560 37,623 37,573 36,419 34,554
65-84 30,212 30,696 31,121 31,540 34,033 36,944
85+ 5,142 5,228 5,332 5,466 6,429 8,039
Total 134,481 135,077 135,691 136,366 139,809 143,140
Source: NOMIS, 2014 based subnational population projections

25
POPULATION OVERVIEW
How to read the profile: The black line running down the middle of the spine chart is the England
average, the circles (to the left or right) are the Torbay value, compared to the England average,
The diamonds represent the CIPFA average. The colours are explained in the key.
Figure 38: Population overview profile
Indicator notes: 1. Average age for the total population [ONS] 2. % of dependents (<15 & 65+yrs) per working population [ONS] 3. Years of male life expectancy from birth [PCMD; ONS, PHE] 4. Years of female life expectancy from birth [PCMD; ONS, PHE] 5. Years of male disability free life expectancy from birth [PHE Local Health] 6. Years of female disability free life expectancy from birth [PHE Local Health] 7. Directly age standardised (DSR) all-cause mortality rate per 100,000 [PCMD; ONS] 8. DSR all-cause premature (<75yrs) mortality rate per 100,000 [PCMD; ONS, PHE] 9. % of population living in areas amongst 20% most deprived in England [DCLG] 10. % of population reporting to be Black Asian Minority Ethnic (BAME) [CENSUS] 11. % of population reporting to have a religion [CENSUS] 12. % of population reporting to be divorced or separated [CENSUS] 13. % of population reporting to be in a same-sex civil partnership [CENSUS] 14. % of households with 1 room or fewer than required for occupants [CENSUS] 15. % of households who privately rent accommodation [CENSUS] 16. % of households who socially rent accommodation [CENSUS]
17. % of households living in fuel poverty “Low income, High Cost” measure [DECC] 18. % of population living in areas amongst 20% most indoor environment deprived in
England [DCLG] 19. % of households with no cars/vans available for use by household [CENSUS] 20. % of population who cannot speak English or speak English well [CENSUS] 21. Rate of total crimes per 1,000 population [Data.Police.UK] 22. Rate of domestic abuse crime per 1,000 population [Police universal dataset] 23. Rate of antisocial behaviour per 1,000 population [Data.Police.UK] 24. % reporting bad health status and long-term health problem/disability [CENSUS] 25. % of population living in areas amongst 20% most mood and anxiety deprived in
England [DCLG] 26. DSR urgent care (ED & MIU) attendances per 100,000 population [HES; ONS] 27. DSR emergency non-elective admissions per 100,000 population [HES; ONS] 28. DSR elective admissions per 100,000 population [HES; ONS] 29. DSR emergency readmissions within 30 days per 100,000 population [HES; ONS] 30 DSR ambulance trips which result in a ‘see and convey’ to hospital [SWAST]
Larger copies of the profiles are available at www.southdevonandtorbay.info/jsna
26
POPULATION OVERVIEW
Highlights from the overview profile:
Torbay’s aged population has further challenges in higher levels of dependency. Where
there are higher levels of dependent population per working age population. This is
important with regards to the potential workforce within Torbay.
Torbay has one of the highest levels of divorced or separated in the country.
There are higher proportions of the population living in the private rented sector and lower
levels living in social housing in Torbay.
Rates of reported crime and domestic abuse are lower in Torbay, whilst levels of anti-
social behaviour are higher.
There are high levels of self-reported bad health in the population, and a lot of people
living with mood or anxiety disorders.
There are higher rates of emergency admissions to hospital and lower levels of elective
admissions.
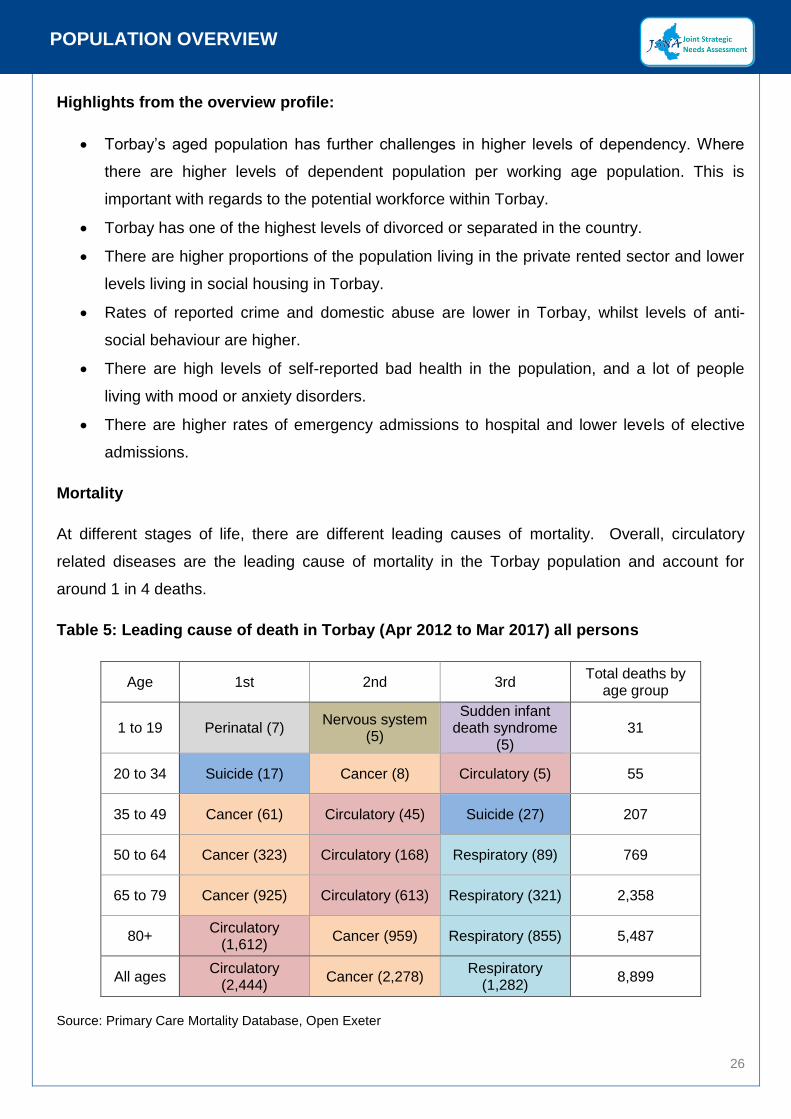
Mortality
At different stages of life, there are different leading causes of mortality. Overall, circulatory
related diseases are the leading cause of mortality in the Torbay population and account for
around 1 in 4 deaths.
Table 5: Leading cause of death in Torbay (Apr 2012 to Mar 2017) all persons
Age 1st 2nd 3rd Total deaths by
age group
1 to 19 Perinatal (7) Nervous system
(5)
Sudden infant death syndrome
(5) 31
20 to 34 Suicide (17) Cancer (8) Circulatory (5) 55
35 to 49 Cancer (61) Circulatory (45) Suicide (27) 207
50 to 64 Cancer (323) Circulatory (168) Respiratory (89) 769
65 to 79 Cancer (925) Circulatory (613) Respiratory (321) 2,358
80+ Circulatory
(1,612) Cancer (959) Respiratory (855) 5,487
All ages Circulatory
(2,444) Cancer (2,278)
Respiratory (1,282)
8,899
Source: Primary Care Mortality Database, Open Exeter
27
POPULATION OVERVIEW
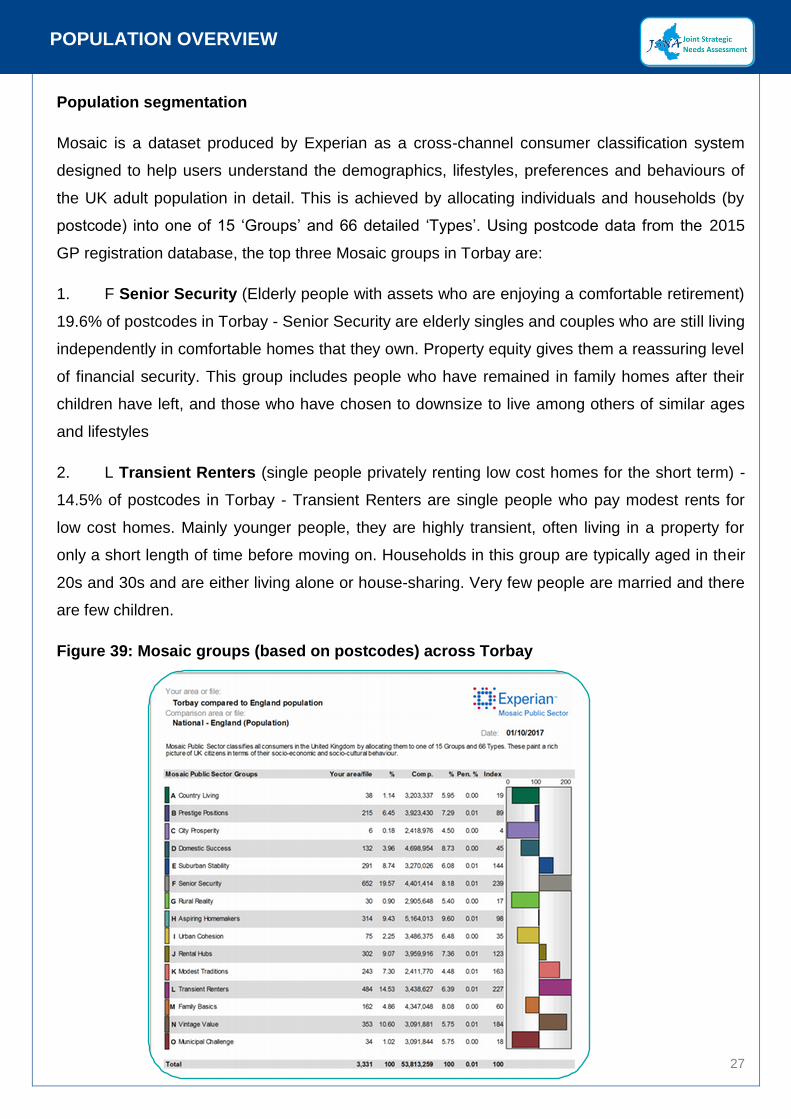
Population segmentation
Mosaic is a dataset produced by Experian as a cross-channel consumer classification system
designed to help users understand the demographics, lifestyles, preferences and behaviours of
the UK adult population in detail. This is achieved by allocating individuals and households (by
postcode) into one of 15 ‘Groups’ and 66 detailed ‘Types’. Using postcode data from the 2015
GP registration database, the top three Mosaic groups in Torbay are:
1. F Senior Security (Elderly people with assets who are enjoying a comfortable retirement)
19.6% of postcodes in Torbay - Senior Security are elderly singles and couples who are still living
independently in comfortable homes that they own. Property equity gives them a reassuring level
of financial security. This group includes people who have remained in family homes after their
children have left, and those who have chosen to downsize to live among others of similar ages
and lifestyles
2. L Transient Renters (single people privately renting low cost homes for the short term) -
14.5% of postcodes in Torbay - Transient Renters are single people who pay modest rents for
low cost homes. Mainly younger people, they are highly transient, often living in a property for
only a short length of time before moving on. Households in this group are typically aged in their
20s and 30s and are either living alone or house-sharing. Very few people are married and there
are few children.
Figure 39: Mosaic groups (based on postcodes) across Torbay

28
STARTING AND DEVELOPING WELL OVERVIEW
Starting and developing well overview
This section brings together key information around Torbay’s younger population. It includes
population estimates for the 0 to 24 year old population, as well as presenting key challenges and
outcomes for the population. The section is presented in two parts, starting well and developing
well. Starting well is about understanding the needs of the population from pregnancy, birth and
for the first few years of life. Developing well is about understanding the needs of the population
between the ages of 5 and 17.
Population
Population projections suggest the number of births in Torbay will average around 1,400 per
year. However, over the next 10 to 12 years, the number of children of school age is expected to
increase. Most acutely in secondary school provision, with an estimated 1,000 more in the
population aged 12 to 16 between 2017 and 2030.
Table 6: population projections for the 0 to 24’s in Torbay
Age group 2017 2018 2019 2020 2025 2030
Maternity (births) 1,410 1,420 1,420 1,420 1,410 1,400
Early Years (0 to 4) 7,160 7,110 7,110 7,140 7,180 7,090
Primary School (5 to 11) 9,920 10,150 10,230 10,240 10,230 10,340
Secondary School (12 to 16) 6,620 6,760 6,920 7,080 7,690 7,640
17 to 18 year olds 2,960 2,720 2,600 2,700 3,030 3,250
19 to 24 year olds 7,810 7,680 7,580 7,320 6,870 7,660
Source: NOMIS, 2016 Mid-Year estimates, 2014 based subnational population projections
Figure 40: Population projections for 0 to 24’s in Torbay
Source: NOMIS, 2016 Mid-Year estimates, 2014 based subnational population projections

29
STARTING AND DEVELOPING WELL OVERVIEW
How to read the profile: The black line running down the middle of the spine chart is the England
average, the circles (to the left or right) are the Torbay value, compared to the England average,
The diamonds represent the CIPFA average. The colours are explained in the key.
Figure 41: Starting well overview profile
Indicator notes: 1. General fertility rate per 1,000 females aged 15-44 years [Vital Statistics; ONS] 2. Infant mortality rate (<1 year) per 1,000 live births [PCMD; Vital Statistics; PHE] 3. % of children living in families in receipt of Child Tax Credit whose reported income is
less than 60% of the median income or in receipt of IS or JSA [HMRC] 4. % of youngest dependent child (0-4yrs) living in lone parent household [CENSUS] 5. Rate of domestic abuse crimes with children present per 1,000 <19 yrs. population.
[Local Police Minimum Dataset (Torbay UA); ONS] 6. % of children <5yrs with limited day-to-day activity [CENSUS] 7. % of children <5yr with statements/EHCPs or SEN Support [Torbay UA; DfE] 8. Rate of children in need (<5yrs) per 1,000 <5yr population [Torbay UA; ONS; DfE] 9. Rate of children on child protection plans (<5yrs) per 1,000 <5yr population [Torbay
UA; ONS; DfE] 10. Rate of looked after children (<5yrs) per 1,000 <5yrs pop [Torbay UA; ONS; DfE] 11. Rate of safeguarding queries for children <5yrs per 1,000 <5yrs pop [MASH; ONS] 12. % of maternities where mother reported smoking at birth [TSDNHSFT; PHOF] 13. % of term babies (37+weeks) born <2500g [TSDNHSFT; PHOF] 14. % of women giving birth who initiate breastfeeding in first 48hrs [TSDFT; PHE]
15. % of infants being totally or partially breastfeed at 6-8wks [TSDNHSFT; PHE] 16. % of children receiving 2 dose MMR vaccine before 5th birthday [TSDFT, PHE] 17. % of children (2-2.5yrs) who received ASQ-3 as part of review [TSDFT; PHE] 18. % of children reaching expected level in early learning goals [Torbay UA; PHE] 19. As above (18) with free school meal eligibility (FSM) [Torbay UA; PHE] 20. % of children reaching expected level in phonics screening [Torbay UA; PHE] 21. As above (20) with free school meal eligibility (FSM) [Torbay UA; PHE] 22. % of children (4-5yrs) who are overweight & very overweight [Torbay UA; PHE] 23. % <5yrs with a hospital dental extraction due to caries [HES- NHSD; ONS, PHE] 24. Rate of hospital admissions for injuries per 100,000 <5yrs population [HES- NHSD;
ONS; PHE] 25. Rate of ED & MIU attendances per 100,000 <5yrs pop [HES- NHSD; ONS] 26. Rate of ED attendances with no investigation, treatment or follow up (disposal code =
‘03’ & SUSHRG code = ‘VB11Z’) per 100,000 <5yrs pop [HES- NHSD; ONS] 27. Rate of hospital emergency admissions per 100,000 <5yrs pop [HES- NHSD; ONS] 28. Rate of hospital emergency admissions for ambulatory care sensitive conditions per
100,000 <5yrs population [HES- NHSD; ONS] 29. Rate of elective admissions per 100,000 <5yrs population [HES- NHSD; ONS] 30. Rate of ambulance call outs which are taken to hospital <5yrs [SWAST; ONS]
Larger copies of the profiles are available at www.southdevonandtorbay.info/jsna

30
STARTING AND DEVELOPING WELL OVERVIEW
]
Highlights from the starting well overview profile:
Torbay experiences higher proportions of children living in poverty
Children in Torbay have higher levels of long term health problems or disability
Torbay has amongst the highest rates of looked after children in England
1 in 5 mothers in Torbay smoke during pregnancy
Excess weight in reception age children is high, with 1 in 4 being overweight or obese
Fewer children achieve a good level of development in Torbay
Highlights from the Developing well overview profile:
There are higher levels of dependent children living in lone parent households
Torbay has higher rates of under 18 conceptions
Around 1 in 5 of school aged children have a special educational need in Torbay
More children provide levels of unpaid care and support in Torbay
Levels of statutory children’s services support are significantly higher in Torbay
Children in schools in Torbay have higher levels of absenteeism
There are higher levels of hospital admissions for young people in Torbay – particularly
self-harm and injuries

31
STARTING AND DEVELOPING WELL OVERVIEW
How to read the profile: The black line running down the middle of the spine chart is the England
average, the circles (to the left or right) are the Torbay value, compared to the England average,
The diamonds represent the CIPFA average. The colours are explained in the key.
Figure 42: Developing well overview profile
Indicator notes: 1. Directly age standardised rate (DSR) of all-cause mortality per 100,000 population
[PCMD; ONS] 2. % <20yrs living in families in receipt of Child Tax Credit whose reported income is
less than 60% of the median income or in receipt of IS or JSA [HMRC] 3. % of children eligible for free school meals (FSM) [Torbay UA] 4. % of youngest dependent child (5-18yrs) living in a lone parent household [CENSUS] 5. Rate of teenage conceptions per 1,000 female pop aged 15-17yrs [TSDFT; PHE] 6. % of children (5-19yrs) with statements/EHCPs or SEN Support [Torbay UA; DfE] 7. % of unpaid carers (care 1+hrs per week) under 25 years [CENSUS] 8. Rate of 10-17yrs receiving first reprimand, warning or conviction per 100,000
population [PHE] 9. Rate of domestic abuse crimes with children present per 1,000 <19 yrs. population.
[Local Police Minimum Dataset (Torbay UA); ONS] 10. Rate of children in need (<19yrs) per 1,000 pop <19yrs [Torbay UA; ONS; DfE] 11. Rate of children on child protection plans (<19yrs) per 1,000 population <19yrs
[Torbay UA; ONS; DfE] 12. Rate of looked after children (<19yrs) per 1,000 pop <19y [Torbay UA; ONS; DfE] 13. Rate of safeguarding queries for children <19yrs per 1,000 pop <19y [MASH; ONS]
14. % of Key Stage 2 meeting expected in reading, writing & maths [Torbay UA] 15. % of GCSEs achieved (%A*-C including English and maths) [Torbay UA] 16. % of possible school sessions with an unauthorised or authorised absence [DfE] 17. % of 16-18yrs not in education, employment or training [PHE] 18. % (16-24yrs) claiming Job Seekers Allowance [DWP, ONS] 19. % of children (10-11yrs) who are overweight or very overweight [Torbay UA; PHE] 20. % of children (15yrs) who are regular smokers [Way Survey, PHE] 21. % of girls (13-14yrs) who received second dose of HPV vaccine [TSDFT; PHE] 22. Rate of chlamydia detection per 100,000 aged 15-24yrs [PHE] 23. % aged 5-18yrs with a hospital dental extraction due to caries [HES- NHSD; ONS] 24. Rate of admissions for injuries per 100,000 5-18yrs pop [HES–NHSD; ONS] 25. DSR of emergency self-harm admissions per 100,000 10-24yrs [HES-NHSD; ONS) 26. Rate of alcohol specific admissions per 100,000 <18yrs [HES-NHSD; ONS; PHE] 27. DSR of ED & MIU attendances per 100,000 5-24yrs pop [HES- NHSDigital; ONS] 28. DSR of emergency admissions per 100,000 5-24yrs pop [HES- NHSDigital; ONS] 29. DSR of elective admissions per 100,000 5-24yrs population [HES- NHSD; ONS] 30 DSR of ambulance call outs taken to hospital per 100,000 5-24yrs [SWAST; ONS]
Larger copies of the profiles are available at www.southdevonandtorbay.info/jsna

32
STARTING AND DEVELOPING WELL OVERVIEW
Children’s statutory services in Torbay
The rate of children looked after, and the rate of children engaged in statutory services is higher
in Torbay compared to comparative areas and the national average. There are a number of
challenges for the children of Torbay, as highlighted in the profiles, and the local authority’s
children’s service is currently rated as inadequate at a time when the number of children on child
protection plans increase.
As a hierarchy of need, children looked after (CLA) are considered top of the list of need. These
are children who are given accommodation away from their families at the request of their parent
and those in care as the result of a Care Order. These are the most vulnerable children, and for
the local authority, represent a significant cost.
Opportunities to prevent or reduce the flow of children entering statutory services could be
considered from the perspective of going upstream and understanding potential causal factors. A
specific needs assessment of children entering children’s services would enable understanding of
these factors allowing opportunity to commission services to intervene and prevent.
Figure 43: levels of need with counts of children in Torbay (2017)
Source: gov.uk
Table 7: Counts and rates of children (per 10,000 aged under 18) in Torbay over time
Year
Children looked after Child Protection
Plans Children in Need
Count Rate per 10,000
Count Rate per 10,000
Count Rate per 10,000
2013 305 122 176 70.8 1,513 576.9
2014 315 126 166 66.6 1,843 701.9
2015 305 122 151 60.2 1,555 585.8
2016 280 111 130 51.5 1,180 438.9
2017 285 112 212 84.0 1,196 445.0
Source: gov.uk
LEVEL 4 – Statutory servicesChildren Looked After (CLA)Child Protection Plan (CPP)
Children In Need (CIN)
LEVEL 4 – Statutory servicesChildren Looked After (CLA)Child Protection Plan (CPP)
Children In Need (CIN)
LEVEL 1 – Universal services - 0 to 17 PopulationLEVEL 1 – Universal services - 0 to 17 Population
LEVEL 2 & 3 – Targeted services – Early help LEVEL 2 & 3 – Targeted services – Early help
CLA285
CPP212
CIN 1,196
Early Help
Population25,350

33
STARTING AND DEVELOPING WELL OVERVIEW
Over recent years, there has been a significant reduction in the number of children in need in
Torbay, however there has also been a significant increase in children on child protection plans,
while the number of children looked after remains fairly static.
Figure 44: Counts of children in services in Torbay over time
Source: gov.uk
Rates of children looked after in Torbay have reduced slightly over the last five years, but not
significantly. The rates remain significantly higher than the England and comparator group
averages.
Analysis of local authority data shows a distinct social gradient associated with children looked
after (fig 46), with rates in communities with higher levels of deprivation being significantly higher
than less deprived communities.
Figure 45: Rates per 10,000 CLA Figure 46: Rate of CLA per 10,000
Source: Gov.uk. Table LAA1: Children looked after at 31 March, by local authority; local authority data from
Children’s services
0
200
400
600
800
1,000
1,200
1,400
1,600
1,800
2,000
2013 2014 2015 2016 2017
Children looked after Child Protection Plans Children in Need
0
20
40
60
80
100
120
140
160
2013 2014 2015 2016 2017
England CIPFA Torbay

34
STARTING AND DEVELOPING WELL OVERVIEW
Rates of children subject to a child protection plan in Torbay increased significantly in 2017
compared to the last five years. The rate has fluctuated in recent years and is now again
significantly higher than the England and comparator group averages.
Analysis of local authority data shows a distinct social gradient associated with children who were
subject to a child protection plan (fig 48), with rates in communities with higher levels of
deprivation being significantly higher than less deprived communities.
Figure 47: Rate of children who were the
subject of a child protection plan at 31 March
per 10,000 children
Figure 48: Rate of CPP per 10,000 in Torbay
by deprivation
Source: Gov.uk. Table D1: Numbers of children who were the subject of a child protection plan
Rates of children in need in Torbay have reduced significantly over the last five years. The rates
remain significantly higher than the England and comparator group averages.
Analysis of local authority data shows a distinct social gradient associated with children in need in
Torbay (fig 50), with rates in communities with higher levels of deprivation being significantly
higher than less deprived communities.
Figure 49: Rate of children in need per 10,000 Figure 50: Rate of CIN per 10,000
Source: Gov.uk. Table B1: Numbers of children in need
020406080100120 2012/13 2013/14 2014/15 2015/16 2016/17England CIPFA Torbay
0
20
40
60
80
100
120
2013 2014 2015 2016 2017
England CIPFA Torbay
0
100
200
300
400
500
600
700
800
900
2013 2014 2015 2016 2017
England CIPFA Torbay

35
LIVING AND WORKING WELL OVERVIEW
Living and working well overview
This section brings together key information around Torbay’s working age population. It includes
population estimates for the working age population, as well as presenting key challenges and
outcomes for the population.
Population
Population projections suggest the number of working age people in Torbay will average around
1,400 per year. However, over the next 10 to 12 years, the number of children of school age is
expected to increase. Most acutely in secondary school provision, with an estimated 1,000 more
in the population aged 12 to 16 between 2017 and 2030.
Table 8: Population projections for 16 to 64’s with ratios of working age population to
dependent population (non-working age)
Age groups 2017 2018 2019 2020 2025 2030
Torbay's working age population (16 to 64) 76,673 76,463 76,345 76,273 75,714 74,642
Torbay’s non-working age population 57,808 58,613 59,345 60,093 64,095 68,498
Ratio of working age to dependent age population
Torbay 1.33 1.30 1.29 1.27 1.18 1.09
England 1.69 1.67 1.65 1.64 1.56 1.48
CIPFA 1.49 1.47 1.45 1.43 1.34 1.25
Source: NOMIS, 2016 Mid-Year estimates, 2014 based subnational population projections
Figure 51: Population projections for 16 to 64’s in Torbay
Source: NOMIS, 2016 Mid-Year estimates, 2014 based subnational population projections
0
10,000
20,000
30,000
40,000
50,000
60,000
70,000
80,000
90,000
2017 2018 2019 2020 2021 2022 2023 2024 2025 2026 2027 2028 2029 2030
16 to 24 25 to 34 35 to 44 45 to 54 55 to 64

36
LIVING AND WORKING WELL OVERVIEW
How to read the profile: The black line running down the middle of the spine chart is the England
average, the circles (to the left or right) are the Torbay value, compared to the England average,
The diamonds represent the CIPFA average. The colours are explained in the key.
Figure 52: Living and working well overview profile
Indicator notes: 1. % with no qualifications [CENSUS] 2. % of population (all ages) living in areas amongst 20% most employment deprived in
England [DCLG] 3. % claiming Job Seekers Allowance/Universal Credit (16-64yrs) [NOMIS; ONS] 4. % claiming Employment Support Allowance (ESA) 16-64 years [DWP; ONS] 5. % claiming ESA for a mental and behavioural disorders 16-64 years [DWP; ONS] 6. Rate of CAB debt queries per 1,000 16-64yrs pop[Torbay CAB; ONS] 7. Rate of violence against the person offences per 1,000 population (all ages) [Police
Universal Dataset (Torbay UA); ONS] 8. % of unpaid carers (care 1+hrs per week) under 25-64 years [CENSUS] 9. Rate of requests for Adult Social Care (ASC) support for new clients aged 18-64 years
per 100,000 population aged 18-64 years [TSDNHSFT; NHS Digital] 10. Rate of ASC long-term support for learning disability aged 18-64 years per 100,000
population aged 18-64 years [TSDNHSFT; NHS Digital] 11. As indicator above for physical personal care [TSDNHSFT; NHS Digital] 12. As indicator above for mental health [TSDNHSFT; NHS Digital] 13. Rate of permanent admissions to residential and nursing care homes per 100,000
population aged 18-64 years [TSDNHSFT; ASCOF- PHE]
14. Directly age standardised rate (DSR) of mortality from causes considered preventable (with public health intervention) per 100,000 pop [PCMD; ONS; PHE)
15. % age & sex modelled (local) prevalence of smoking 16yrs+ [IHS; ONS; PHE] 16. % modelled prevalence of binge drinking 16yrs+ [PHE Local Health] 17. % modelled prevalence of obesity 16yrs+ [PHE Local Health] 18. % modelled prevalence (local) of depression 16yrs+ [Thomas et al, 2000; ONS] 19. % modelled prevalence (local) of hypertension 16yrs+ [THIN 2006; ONS; PHE] 20. % modelled prevalence (local) of CVD all ages [CPRD 2013; ONS; PHE] 21. % modelled prevalence (local) of COPD 15yrs+ [HSE 2005; ONS; PHE] 22. % modelled prevalence of Type 1 and 2 diabetes 16yrs+ [HSE 2006; ONS; PHE] 23. DSR of obesity related admission episodes per 100,000 [HES-NHSD; ONS; NHSD] 24. DSR of smoking attributable admissions per 100,000 35yrs+ (HES; ONS; PHE] 25. DSR of admission episodes for alcohol-related conditions (Narrow) per 100,000 (all
ages) [HES-NHSD; ONS; PHE] 26. DSR of ED & MIU attendances per 100,000 25-64yrs pop [HES- NHSDigital; ONS] 27. DSR of emergency admissions for ambulatory care sensitive (ACS) conditions per
100,000 16-64yrs population [HES- NHSD; ONS] 28. DSR of emergency admissions per 100,000 25-64yrs pop [HES- NHSDigital; ONS] 29. DSR of elective admissions per 100,000 25-64yrs population [HES- NHSD; ONS] 30 DSR of ambulance call outs taken to hospital per 100,000 25-64yrs [SWAST; ONS]
Larger copies of the profiles are available at www.southdevonandtorbay.info/jsna

37
LIVING AND WORKING WELL OVERVIEW
Highlights from the living and working well overview profile:
1 in 4 adults in the population do not have any formal qualifications
Torbay has significantly higher levels of people on employment support allowance
A high proportion of the population provided support as an unpaid carer
Torbay has high levels of long-term support need in the population
Prevalence of long term conditions are high in the population
There are high levels of potentially avoidable lifestyle related hospital admissions
Housing
Torbay has a housing stock of around 64,370 household spaces. Occupancy of household
spaces is below the England average, with some 59,010 (91.7%) occupied with at least one
usual resident. This compares to 95.7% across England and 93.8% across CIPFA nearest
neighbours. This is to be expected given Torbay’s position as a seaside tourist destination.
More acutely for the population is the underrepresentation of social housing in the market. Torbay
has higher levels of private rented accommodation, and significantly lower social rented (fig 53).
Of the occupied housing stock, just under 1 in 3 dwellings are a flat, maisonette of apartment. A
more detailed analysis would be needed to understand if the planning policy and provision of
dwelling types are meeting the populations housing needs.
Figure 53: Tenure of dwellings Figure 54: Dwelling Types
Source: NOMIS, 2011 Census
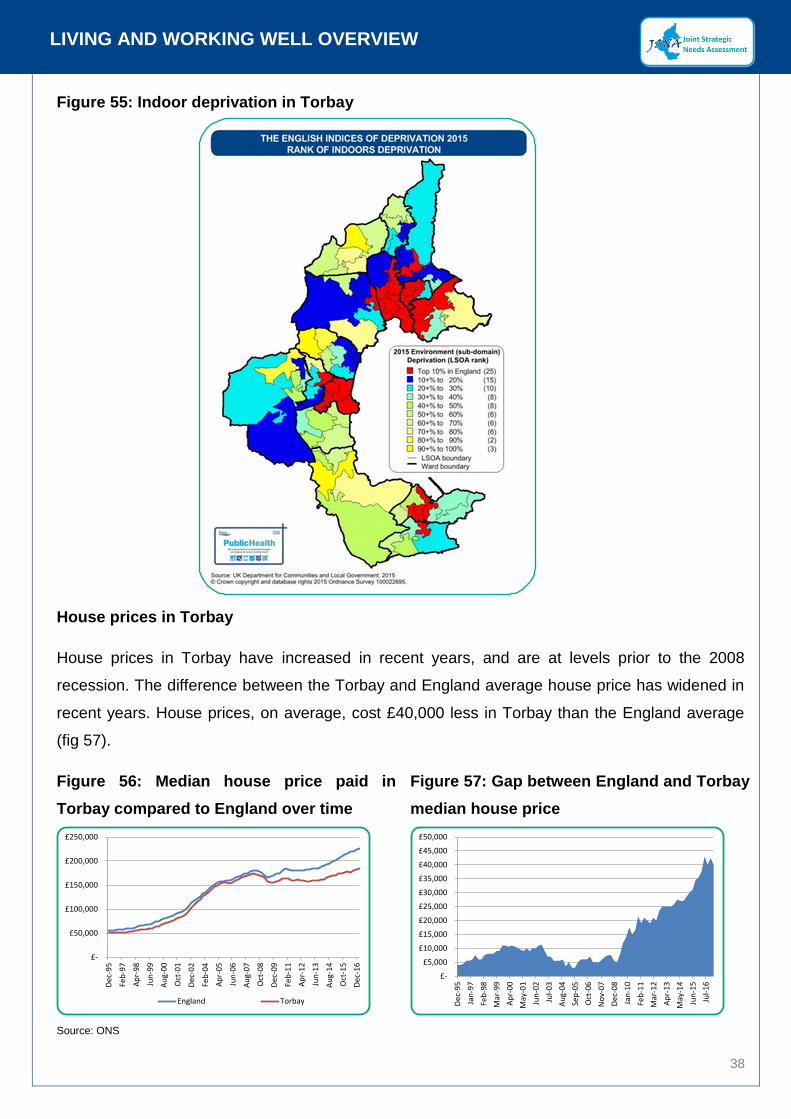
The quality of Torbay’s housing stock is relatively poor. Torbay has high levels of indoor
deprivation, identified in figure 55 with areas in red and dark blue. 45% of Torbay’s population live
in an area in the top 20% most deprived in England. The drivers for the indoor living environment
domain are: houses without central heating and houses in poor condition (do not meet the
Decent Home standard).
0%
10%
20%
30%
40%
50%
60%
70%
80%
Owned Social rented Private rented
England CIPFA Torbay
0%
5%
10%
15%
20%
25%
30%
35%
Whole house orbungalow:Detached
Whole house orbungalow: Semi-
detached
Whole house orbungalow:
Terraced (includingend-terrace)
Flat, maisonette orapartment:
England CIPFA Torbay
38
LIVING AND WORKING WELL OVERVIEW
Figure 55: Indoor deprivation in Torbay
House prices in Torbay
House prices in Torbay have increased in recent years, and are at levels prior to the 2008
recession. The difference between the Torbay and England average house price has widened in
recent years. House prices, on average, cost £40,000 less in Torbay than the England average
(fig 57).
Figure 56: Median house price paid in
Torbay compared to England over time
Figure 57: Gap between England and Torbay
median house price
Source: ONS
£-
£50,000
£100,000
£150,000
£200,000
£250,000
De
c-9
5
Feb
-97
Ap
r-9
8
Jun
-99
Au
g-0
0
Oct
-01
De
c-0
2
Feb
-04
Ap
r-0
5
Jun
-06
Au
g-0
7
Oct
-08
De
c-0
9
Feb
-11
Ap
r-1
2
Jun
-13
Au
g-1
4
Oct
-15
De
c-1
6
England Torbay
£-
£5,000
£10,000
£15,000
£20,000
£25,000
£30,000
£35,000
£40,000
£45,000
£50,000
De
c-9
5
Jan
-97
Feb
-98
Mar
-99
Ap
r-0
0
May
-01
Jun
-02
Jul-
03
Au
g-0
4
Sep
-05
Oct
-06
No
v-0
7
De
c-0
8
Jan
-10
Feb
-11
Mar
-12
Ap
r-1
3
May
-14
Jun
-15
Jul-
16

39
LIVING AND WORKING WELL OVERVIEW
0.0%
1.0%
2.0%
3.0%
4.0%
5.0%
6.0%
De
c 2
00
4
Sep
20
05
Jun
20
06
Mar
20
07
De
c 2
00
7
Sep
20
08
Jun
20
09
Mar
20
10
De
c 2
01
0
Sep
20
11
Jun
20
12
Mar
20
13
De
c 2
01
3
Sep
20
14
Jun
20
15
Mar
20
16
De
c 2
01
6
Sep
20
17
England CIPFA Torbay
House prices may be lower; however earnings are also significantly lower than the average. This
gives Torbay a higher than average affordability ratio (fig 59). This means that it is harder for
people in Torbay to afford their own housing.
Earnings and employment
Average earnings for full time workers in Torbay are significantly lower than the England average.
Residents in Torbay earn the 4th lowest earnings (full time annual gross pay) in England out of
152 local authority areas. The gap between the England and Torbay average is some £9.3k per
year (fig 58).
Figure 58: Gross annual pay - mean full time
workers
Figure 59 Ratio of average full time earnings
to house prices
Source: NOMIS, ONS
The levels of residents claiming JSA (job seekers allowance) has been reducing at a rate similar
to the national average. Around 1% of the working age population are currently claiming JSA.
Figure 60: Job seekers allowance
Source: NOMIS
As a tourist destination it is expected that Torbay would have higher levels of employment in the
distribution, hotels and restaurants sector (fig 61). Around 1 in 3 of those aged 16 to 64 in
0123456789
England average

40
LIVING AND WORKING WELL OVERVIEW
employment work in public admin, education and health. There are significantly higher levels of
those in employment aged 16 to 64 being part time employment in Torbay compared to both
CIPFA nearest neighbours and the England average (fig 62).
Figure 61: % aged 16-64 in employment who
work in:
Figure 62: % in employment working full-
time or part time- aged 16-64
Source: NOMIS, Annual population survey
Gross Value Added (GVA) measures the contribution to the economy of each individual
producer, industry or sector and is used in the estimation of Gross Domestic Product (GDP).
Based on GVA the local economy of Torbay is amongst the weakest in England (figure 63 shows
the relative contribution of Torbay compared to CIPFA neighbours). Recent figures from the
Office for National Statistics suggest Torbay’s economic worth in 2015, was in the region of
£2.081 billion, or around £15,600 per head of population. This compares to £18,127 per head
across CIPFA neighbours and £25,601 per head across England (figure 64).
Figure 63: Headline GVA per head indices at
current basic prices
Figure 64: Gross Value Added (Income
Approach) per head of population at current
basic prices
Source: ONS
0%
10%
20%
30%
40%
50%
60%
70%
80%
Full-time Part-time
England CIPFA Torbay

41
AGEING AND DYING WELL OVERVIEW
Ageing and dying well overview
This section brings together key information around Torbay’s retirement age population. It
includes population estimates for the over 65 population, mortality forecasts as well as presenting
key challenges and outcomes for the population.
Population
Population projections suggest the number of people aged over 65 in Torbay will increase by
almost 10,000 by 2030. The largest increase is expected in those aged 80 to 84, which is
expected to see an increase of some 3,000, or a 62% increase on the current number.
Populations aged 85 and over are expected to increase by over 50% by 2030. These increases
are expected to increase demand on support services as increased people become frail towards
the end of their life.
Table 9: Population projections for the over 65’s
Age group 2017 2018 2019 2020 2025 2030
65 to 69 9,586 9,314 9,058 9,006 9,770 11,203
70 to 74 9,339 9,723 9,890 9,908 8,763 9,548
75 to 79 6,339 6,605 6,980 7,330 9,139 8,173
80 to 84 4,948 5,054 5,193 5,296 6,361 8,020
85 to 89 3,099 3,166 3,260 3,364 3,917 4,851
90+ 2,043 2,062 2,072 2,102 2,512 3,188
Source: NOMIS, 2016 Mid-Year estimates, 2014 based subnational population projections
The number of people dying a year is expected to start increasing towards the end of the 2020’s.
Figure 65: population projections by age
group
Figure 66: Estimated number of deaths in
Torbay
Source: NOMIS, 2016 Mid-Year estimates, 2014 based subnational population projections
0
5,000
10,000
15,000
20,000
25,000
30,000
35,000
40,000
45,000
50,000
2017 2018 2019 2020 2021 2022 2023 2024 2025 2026 2027 2028 2029 2030
65 to 69 70 to 74 75 to 79 80 to 84 85 to 89 90+

42
AGEING AND DYING WELL OVERVIEW
How to read the profile: The black line running down the middle of the spine chart is the England
average, the circles (to the left or right) are the Torbay value, compared to the England average,
The diamonds represent the CIPFA average. The colours are explained in the key.
Figure 67: Ageing and dying well overview profile
Indicator notes: 1. % of dependents (65+yrs) per working population (15-64yrs) [ONS] 2. Years of male life expectancy aged 65yrs+ [PCMD; ONS; PHE] 3. Years of female life expectancy aged 65yrs+ [PCMD; ONS; PHE] 4. Ratio of extra male deaths (65+) in winter months compared with the expected
number of deaths (average non-winter deaths) expressed as % [PCMD; PHE] 5. As indicator above for females. [PCMD; PHE] 6. % of deaths in usual place of residence [PCMD; PHE] 7. % of persons living alone 65+yrs [CENSUS] 8. % of 60+yrs living in areas amongst 20% most income deprived (affecting older
people 60+) in England [DCLG] 9. % 60+yrs claiming Pension Credits [DWP; ONS] 10. % 65+yrs claiming Attendance Allowance (in payment) [DWP; ONS] 11. Rate of CAB debt queries per 1,000 65yrs+ pop[Torbay CAB; ONS] 12. % of unpaid carers (care 1+hrs per week) under 65+ years [CENSUS] 13. % 65+yrs with bad health and a long-term health problem/disability [CENSUS] 14. Rate of requests for Adult Social Care (ASC) support for new clients aged 65+yrs per
100,000 population aged 65+yrs [TSDNHSFT; NHS Digital]
15. Rate of ASC long-term support for learning disability aged 65+yrs per 100,000 population aged 65+yrs [TSDNHSFT; NHS Digital]
16. As indicator above for physical personal care [TSDNHSFT; NHS Digital] 17. As indicator above for mental health [TSDNHSFT; NHS Digital] 18. As indicator above for social isolation/other [TSDNHSFT; NHS Digital] 19. % 65+yrs still at home 91 days after discharge to reablement/rehabilitation services
[TSDNHSFT; ASCOF- PHE] 20. Rate of permanent admissions to residential and nursing care homes per 100,000
population aged 65+yrs [TSDNHSFT; ASCOF- PHE] 21. % modelled prevalence (local) of dementia 65+yrs [Matthews et al, 2013; ONS] 22. % modelled prevalence (local) of stroke all ages [BHF 2014; ONS] 23. % flu vaccination coverage aged 65yrs+ [PHE] 24. Directly age standardised rate (DSR) of emergency admissions for injuries due to falls
per 100,000 65yrs+ [HES- NHSDigital, PHE] 25. DSR ED & MIU attendances per 100,000 65yrs+ population [HES- NHSD; ONS] 26. DSR of emergency admissions per 100,000 65yrs+ pop [HES- NHSDigital; ONS] 27. DSR of emergency admissions for ACS conditions per 100,000 65yrs+ [HES-; ONS] 28. DSR of elective admissions per 100,000 65yrs+ population [HES- NHSD; ONS] 29. Rate of delayed transfers of care aged 18+yrs [ASCOF- PHE] 30 DSR of ambulance call outs taken to hospital per 100,000 65yrs+[SWAST; ONS]
Larger copies of the profiles are available at www.southdevonandtorbay.info/jsna

43
AGEING AND DYING WELL OVERVIEW
Highlights from the ageing and dying well overview profile:
Torbay has a high proportion of dependents (65+yrs) compared to those of working age;
More people die in their own homes;
Significantly more are claiming Attendance Allowance for physical or mental disability;
There are significantly more unpaid carers;
Less people are still at home 91 days after discharge from hospital (this is a negative);
There are less permanent admissions to nursing or residential care;
There is a higher prevalence of stroke;
Torbay vaccination coverage for flu is worse;
Admissions for chronic conditions that could be treated in the community are lower.
Long term conditions
People in more deprived communities tend to experience multiple long-term conditions and
generally have poorer health outcomes, such as shorter life expectancy.
Long-term conditions are those that, at present, cannot be cured but can be managed through
treatment and behaviour. These include conditions such as heart disease, diabetes and mental
health problems. People with long term conditions are the most frequent users of healthcare
services. Those with long-term conditions account for around 29% of the population, but use
around 50% of all GP appointments and 70% of all inpatient bed days. Long-term conditions fall
more heavily on the poorest in society: according to ONS people in the poorest social class have
60% higher prevalence of long-term conditions than those in the highest social class. Half of
people aged over 60 in England have a long-term condition. With an ageing population and the
growth of health harming behaviours such as physical inactivity, harmful alcohol consumption
and smoking, we would expect the prevalence of long-term conditions to rise unless checked.
The number of people with comorbidities (more than one health condition) is expected to rise by
a third in the next ten years.
As our population ages, we expect the number of frail people, people with, for example, limited
physical mobility, weakness, weight loss, slowness and low physical activity to increase,
specifically in our older age groups. The number of people with dementia is also expected to
increase over the coming years. Estimates for the counts of frail people and also those with
dementia are presented in figures 68 and 69.

44
AGEING AND DYING WELL OVERVIEW
Figure 68: Frailty estimates for Torbay Figure 69: Dementia estimates for Torbay
Source: ONS Sub-National Population Projections, 2014. Prevalence of frailty in community-dwelling older persons (Collard et al 2012) and
Dementia UK Prevalence Estimates, 2014
Adult social care
Adult social care is defined as including all forms of personal care and other practical assistance
provided for individuals aged 18 and over who, by reason of age, illness, disability, pregnancy,
childbirth, dependence on alcohol or drugs, or any other similar circumstances, are in need of
such care or other assistance [11]. Some people need practical or emotional care or support to
lead an active life and do the everyday things that most of us take for granted. The social care
system provides this support for those who need it to help them keep their independence and
dignity. Adult social care services are commissioned through the upper tier local authorities of
Devon County Council and Torbay Council for the South Devon and Torbay population. Provider
organisations are responsible for assessing individuals need for ‘community care’ or ‘social care’
services [12]. Community Care describes the services and support which help people to continue
to live independently at home, whilst social care services help people who are in need of support
due to illness, disability, old age or poverty. This could take place in residential settings.
The number of long term residential and nursing placements has been reducing over time as
alternative care models are implemented. That is the number of placements that the local
authority funds. The monthly trend is shown in fig 70. A model of future demand based on current
activity, and allowing for demographic change, suggests a continued slight reduction in LA
funded placements (fig 71).
0
500
1,000
1,500
2,000
2,500
3,000
3,500
4,000
4,500
2017 2018 2019 2020 2021 2022 2023 2024 2025 2026 2027 2028 2029 2030 2031 2032 2033 2034 2035
Aged 60 to 64 Aged 65 to 69 Aged 70 to 74 Aged 75 to 79 Aged 80 to 84 Aged 85 to 89 Aged 90+

45
AGEING AND DYING WELL OVERVIEW
Figure 70: Long term residential and
nursing LA funded placements Torbay
Figure 71: Long term residential and
nursing LA funded placements Torbay
historical averages and future modelled
averages
Source: Torbay and South Devon NHS Foundation Trust
Mortality and end of life
The number of mortalities has increased in recent years in Torbay. The proportion of people
dying in hospital has increased slightly, as the proportion dying at home decreased.
Overall of all mortality over the period 1st Jan 2012 to 31st Dec 2016, around 4 in 10 people die in
hospital, 3 in 10 in a care home, 2 in 10 at home and 1 in 10 die either in a hospice, or
elsewhere.
Around 77% of mortalities in Torbay are expected (fig 73). This suggests a significant need for
palliative care, with around 1,370 people dying from expected deaths per year. However, the
primary care palliative care register has around 570 people on it, suggesting significant unmet
need.
Figure 72: Count of deaths over time by
place of death
Figure 73: Proportion of mortalities that are
expected
Source: PCMD, Murtagh et al (2014) [13]
TOTAL MORTALITIES
8,844 (2012/16)
EXPECTED MORTALITIES
6,837 (77.3%)
UNEXPECTED (REST) MORTALITIES
2,007 (22.7%)

46
REFERENCES
References
1. Sir Michael Marmot. (2010) Fair Society, Healthy Lives; The Marmot Review
2. NHS Confederation. (2011) The joint strategic needs assessment; a vital tool to guide
commissioning
3. Department of Health. (2011) Joint Strategic Needs Assessment and joint health and
wellbeing strategies explained; Commissioning for populations
4. Torbay Council (2013) Torbay Director of Public Health Annual Report
5. D, Kuh. Y, Shlomo. J, Lynch. J, Hallqvist. C, Power. (2003) Life course epidemiology. Journal
and Epidemiology Community Health 2003;57:778-783 doi:10.1136/jech.57.10.778
6. G, Dahlgren. M, Whitehead. (1991) Polices and strategies to promote social equity in health;
back ground document to WHO – strategy paper for Europe.
7. Department of Health (2006) The Local Government & Public Involvement Health Act 2007
8. Department of Health (2012) JSNAs & joint health and wellbeing strategies–draft guidance
9. Health Policy Brief (2014) The Relative Contribution of Multiple Determinants to Health
Outcomes. https://www.rwjf.org/content/dam/farm/reports/issue_briefs/2014/rwjf415185
10. Public health guideline [PH28] Looked-after children and young people
https://www.nice.org.uk/guidance/ph28/chapter/3-considerations
11. Source: Torbay and South Devon NHS Foundation Trust
12. Local government Ombudsman. http://www.lgo.org.uk/adult-social-care/
13. Murtagh et al (2014) http://journals.sagepub.com/doi/pdf/10.1177/0269216313489367

HOBSON/JAN/18