Embed Size (px)
Citation preview
U.S. General Services Administration
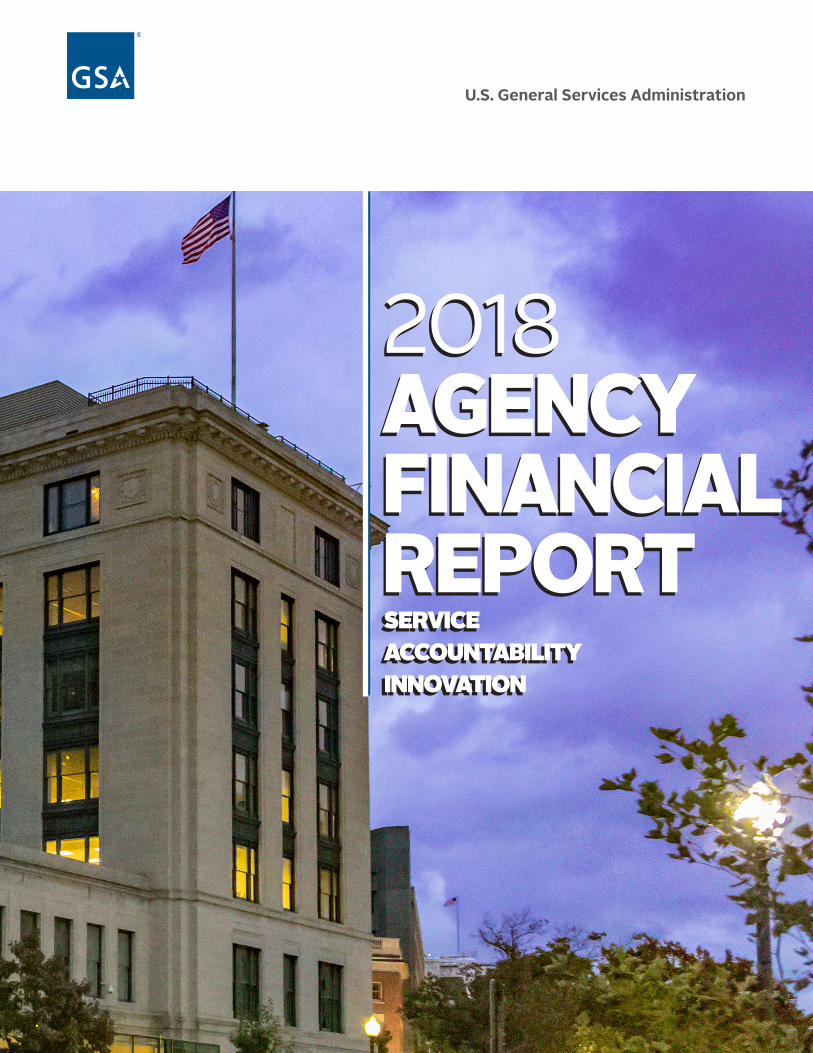
2018 AGENCY FINANCIAL REPORTSERVICE ACCOUNTABILITY INNOVATION
2018 AGENCY FINANCIAL REPORTSERVICE ACCOUNTABILITY INNOVATION

1FY 2018 AGENCY FINANCIAL REPORT • ABOUT THIS REPORT
This Agency Financial Report (AFR) for fiscal year (FY) 2018 presents the General Services Administration (GSA) Financial Information relative to our vital mission and stewardship of the resources entrusted to the agency.
The AFR also highlights GSA’s priorities, accomplishments and challenges.
In accordance with the Office of Management and Budget (OMB) Circular A-136, Financial Reporting Requirements, GSA produces the following reports: (i) an AFR issued by November 15, 2018 and (ii) an Annual Performance Report (APR) submitted with the GSA Congressional Budget Justification to be issued by February 4, 2019. The AFR and the APR will be available online at:
https://www.gsa.gov/reference/reports/budget-performance/annual-reports
How this Report is OrganizedThis AFR provides financial and performance information for the FY beginning October 1, 2017, and ending on September 30, 2018, with comparative prior year data, where appropriate. The AFR demonstrates GSA’s commitment to our mission and accountability to Congress and the American people. This report presents GSA’s mission, accomplishments, and challenges. The AFR begins with a message from our Administrator, Emily Murphy, followed by three main sections:
ABOUT THIS REPORT
Section 1: Management’s Discussion and Analysis
Section 2: Financial Section Section 3: Other Information
1. Organization
2. Performance Summary
3. Financial Statements Summary and Analysis
4. GSA Management Assurances
1. Letter from the Chief Financial Officer
2. Inspector General’s Transmittal Memorandum of the Independent Auditors’ Report
3. The Independent Auditors’ Report
4. Consolidated Financial Statements
5. Notes to the Financial Statements
6. Consolidating Financial Statements
7. Required Supplemental Information (Unaudited)
1. Inspector General’s Assessment of Management Challenges & GSA’s Responses
2. Summary of Financial Statement Audit and Management Assurances (Unaudited)
3. Payment Integrity (Unaudited)
4. Fraud Reduction Report
5. Other GSA Statutorily Required Reports (Unaudited)
6. Reduce the Footprint (Unaudited)
7. Civil Monetary Penalties Inflation Adjustment
8. Acronyms and Abbreviations

TABLE OF CONTENTS
About This Report 1Letter From the Administrator 5How GSA Benefits the Public 7
MANAGEMENT’S DISCUSSION AND ANALYSIS (UNAUDITED) 11
Brief Overview of The AFR 13Organization 14Performance Summary 18Financial Statements Summary and Analysis 24 Federal Buildings Fund 24 Acquisition Services Fund 25GSA Management Assurances 27GSA Management and
Internal Control Program 29Forward-Looking Information 32
FINANCIAL SECTION 33Letter From the
Chief Financial Officer 35Independent Auditor’s Report 38Consolidated Financial Statements 50Notes to the Financial Statements 54Consolidating Financial Statements 81Required Supplementary
Information (Unaudited) 85
OTHER INFORMATION (UNAUDITED) 87
Inspector General’s Assessment of GSA's Management and Performance Challenges For FY 2019 89
GSA Responses to the Office of Inspector General’s Management Challenges For FY 2019 118
Summary of Financial Statement Audit and Management Assurances 139
Payment Integrity 141Fraud Reduction Report 156Other GSA Statutorily Required Reports 161Reduce the Footprint 162Civil Monetary Penalties Inflation Adjustment 163Acronyms and Abbreviations 164 This report can be found on the Internet at gsa.gov/annualreports

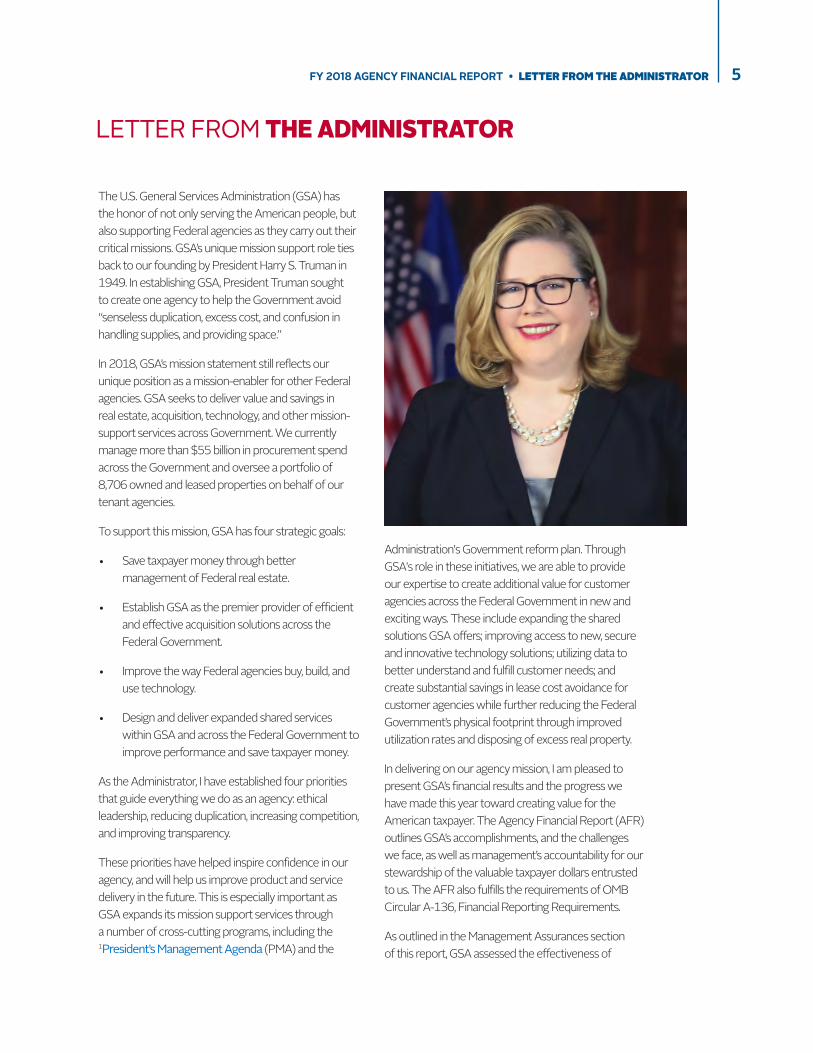
5FY 2018 AGENCY FINANCIAL REPORT • LETTER FROM THE ADMINISTRATOR
LETTER FROM THE ADMINISTRATOR
The U.S. General Services Administration (GSA) has the honor of not only serving the American people, but also supporting Federal agencies as they carry out their critical missions. GSA’s unique mission support role ties back to our founding by President Harry S. Truman in 1949. In establishing GSA, President Truman sought to create one agency to help the Government avoid “senseless duplication, excess cost, and confusion in handling supplies, and providing space.”
In 2018, GSA’s mission statement still reflects our unique position as a mission-enabler for other Federal agencies. GSA seeks to deliver value and savings in real estate, acquisition, technology, and other mission-support services across Government. We currently manage more than $55 billion in procurement spend across the Government and oversee a portfolio of 8,706 owned and leased properties on behalf of our tenant agencies.
To support this mission, GSA has four strategic goals:
• Save taxpayer money through better management of Federal real estate.
• Establish GSA as the premier provider of efficient and effective acquisition solutions across the Federal Government.
• Improve the way Federal agencies buy, build, and use technology.
• Design and deliver expanded shared services within GSA and across the Federal Government to improve performance and save taxpayer money.
As the Administrator, I have established four priorities that guide everything we do as an agency: ethical leadership, reducing duplication, increasing competition, and improving transparency.
These priorities have helped inspire confidence in our agency, and will help us improve product and service delivery in the future. This is especially important as GSA expands its mission support services through a number of cross-cutting programs, including the 1President’s Management Agenda (PMA) and the
Administration's Government reform plan. Through GSA's role in these initiatives, we are able to provide our expertise to create additional value for customer agencies across the Federal Government in new and exciting ways. These include expanding the shared solutions GSA offers; improving access to new, secure and innovative technology solutions; utilizing data to better understand and fulfill customer needs; and create substantial savings in lease cost avoidance for customer agencies while further reducing the Federal Government’s physical footprint through improved utilization rates and disposing of excess real property.
In delivering on our agency mission, I am pleased to present GSA’s financial results and the progress we have made this year toward creating value for the American taxpayer. The Agency Financial Report (AFR) outlines GSA’s accomplishments, and the challenges we face, as well as management’s accountability for our stewardship of the valuable taxpayer dollars entrusted to us. The AFR also fulfills the requirements of OMB Circular A-136, Financial Reporting Requirements.
As outlined in the Management Assurances section of this report, GSA assessed the effectiveness of

LETTER FROM THE ADMINISTRATOR • FY 2018 AGENCY FINANCIAL REPORT6
internal control over operations, systems, and reporting. GSA can provide reasonable assurance that internal controls were operating effectively in each of these areas throughout the year. Management relies on these internal controls to identify material weaknesses in financial and program performance areas and to identify corrective actions required to resolve them. As mandated by the Reports Consolidation Act of 2000, I have assessed the financial and performance data used in this report, and believe them to be complete and reliable. As in FY 2017, GSA does not have any material weaknesses in its internal controls.
All GSA employees have an important role in ensuring wise stewardship of tax dollars and an obligation to report waste, fraud and abuse. I am grateful for the support of GSA’s workforce in developing this year’s AFR and their work, each day, to ensure transparency and accountability in our agency’s finances.
Emily W. Murphy Administrator November 8, 2018

7FY 2018 AGENCY FINANCIAL REPORT • HOW GSA BENEFITS THE PUBLIC
HOW GSA BENEFITS THE PUBLIC
While the world has changed in the nearly seven decades since GSA was founded, the need for an efficient and effective Federal Government remains critical. GSA was established on July 1, 1949, to consolidate many administrative functions across Government into one organization. The agency was charged with eliminating wasteful duplication, reducing costs, streamlining acquisition and distribution of supplies, generate more competition for American business and centralizing the management of Federal buildings. For more information on GSA please see 2Celebrating 69 Years of Carrying Out GSA's Vision.
During the last 69 years, GSA’s responsibilities have grown exponentially, often leading change and championing new, fresh and dynamic ideas. GSA’s expertise, ideas and innovation are wide-ranging and touch nearly every aspect of the Federal Government’s operation.
What has not changed is GSA’s commitment to supporting Federal customers and partners by providing cost-effective, high-quality services. GSA provides the physical space, supplies, technical innovation and products and services essential to operating the Federal Government. As described in 3GSA's 2018-2022 Strategic Plan, the agency mission of delivering value and savings in real estate, acquisition, technology and other mission-support services across Government is at the core of our work. Every day, GSA helps agencies buy smarter and create a more agile Government to help make a difference in communities across the country.
In short, GSA strives for the highest levels of efficiency and effectiveness so the Federal Government can better serve the American people.
Well Managed, Cost Effective Real EstateGSA’s first strategic goal is to save taxpayer money through better management of Federal real estate. With more than 368 million rentable square feet (RSF) in over 8,700 active assets, GSA administers one of the largest and most diversified real estate portfolios in the world. The agency supports safe, productive workplaces by managing and preserving Government buildings, as well as leasing and managing commercial real estate. GSA manages assets throughout 50 states, five U.S. territories, and the District of Columbia to meet the varied missions of our many Federal agency partners.
In addition to providing workspace to customer agencies, GSA is responsible for promoting effective use of Federal real property assets and the adopting of innovative workplace solutions and technologies. Through lease and purchase transactions, GSA delivers the workspace necessary to meet the varied missions of its customer agencies.
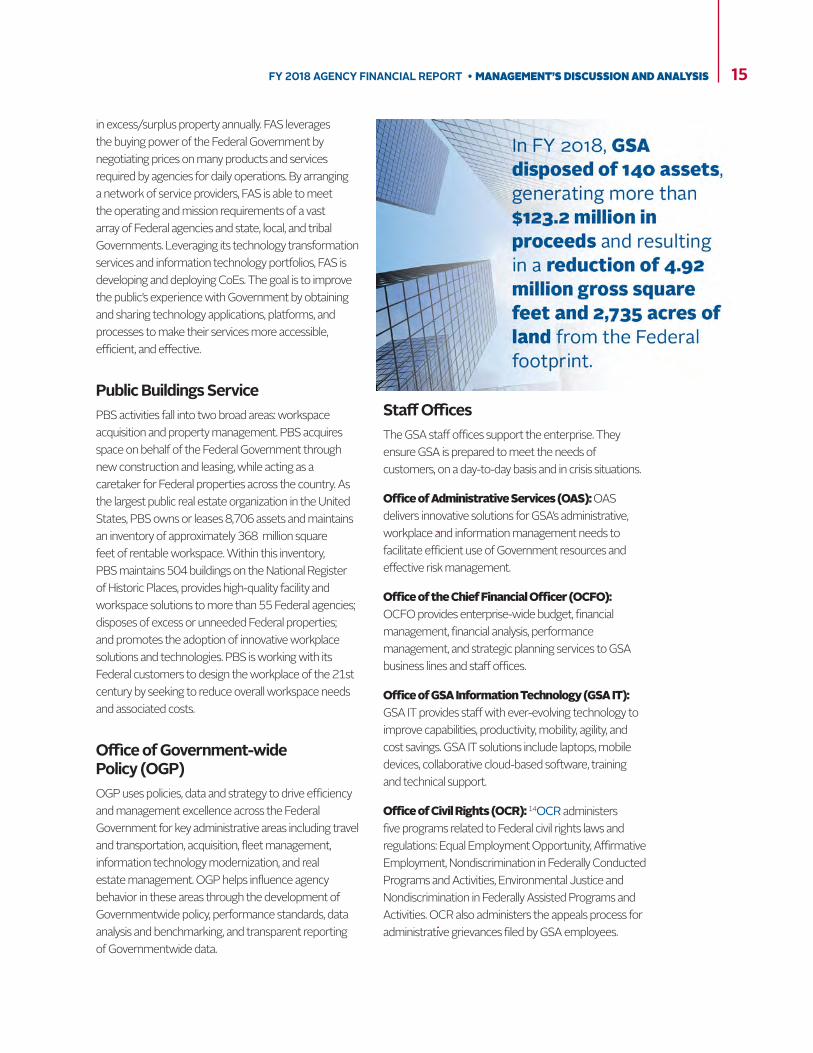
In FY 2018, GSA disposed of 140 assets on behalf of the Federal Government generating more than $123.2 million in proceeds; these disposals resulted in a reduction of more than 4.92 million gross square feet and 2,735 acres of land from the Federal inventory. Many of these former Federal properties found

HOW GSA BENEFITS THE PUBLIC • FY 2018 AGENCY FINANCIAL REPORT8
new uses fueling local economic development and community revitalization efforts.
In FY 2018, GSA made data from the Federal Government’s 2017 4real property inventory available to the public for the first time through the Federal Real Property Profile Management System. The FRPP Management System lists an inventory of Federal properties under the custody and control of executive branch agencies. This database improves transparency in the Federal Government’s real property footprint and assists agencies by making it easier to identify and dispose of underutilized property.
GSA does work beyond acquisitions and rent. Sometimes customer service requires taking an extra step. In 2018, GSA helped the U. S. Customs and Border Patrol (CBP) recover a plaque dedicated to customs service members who served in the First World War, Second World War and the Korean War. The plaque, damaged during the 9/11 attacks, was recovered from a landfill, refurbished and is now installed inside the One World Trade Center after GSA worked with CBP to create space for 9/11 remembrance. 5This video talks about GSA's role in preserving 9/11 artifacts.
Easy, Efficient and Modern AcquisitionGSA’s second strategic goal is to serve as the premier provider of efficient and effective acquisition solutions across the Federal Government. Our acquisition solutions offer private sector professional services, equipment, supplies, telecommunications, and information technology to Government organizations and the military. In 2018, GSA leadership focused on simplifying and streamlining access to the Federal marketplace for buyers and vendors, making operations more efficient, and modernizing systems and processes.
GSA utilizes the buying power of the Government which facilitates $55 billion a year in the procurement of goods and services in support of Government agencies. At the same time, GSA's acquisition tools and programs reduce wasteful contract duplications and allow customer agencies to focus more resources on fulfilling their missions to the American people. One example of GSA’s efforts to streamline services across the Government is the signature City Pairs travel program. Led by the Federal Acquisition Service, City Pairs is the largest negotiated contract and managed airline program in the world. The contract delivers savings to all Federal agencies through pre-negotiated and firm-fixed-price rates, offering a 49 percent discount on comparable commercial fares. The discounted fares result in approximately $2 billion in savings annually to the American taxpayer over the cost of full price commercial fares.
GSA helped Customs and Border Patrol restore and install this plaque that was damaged in the World Trade Center terrorist attack. The installation is part of a 9/11 remembrance in the One World Trade Center Federal offices.

9FY 2018 AGENCY FINANCIAL REPORT • HOW GSA BENEFITS THE PUBLIC
Additionally, GSA’s Office of Small Business Utilization manages programs designed to increase small business contracting opportunities with the Federal Government. GSA works diligently to ensure contracting opportunities are available to small disadvantaged businesses, businesses owned by women and service-disabled veterans and those operating in historically underutilized geographic areas (HUBZones). In 2018, GSA awarded or maintained contracts with this vendor community valued at $1.8 billion for goods and services.
Access to and Use of Innovative Information Technology (IT) GSA’s third strategic goal is to improve the way Federal agencies buy, build and use technology. The modernization of the Federal Government’s IT infrastructure and applications is an important priority of the Administration.
6Technology Transformation Services (TTS) is part of the Federal Acquisition Service (FAS). Its mission is to improve the public’s experience with the Government by helping Federal and state agencies build, buy and share technology that allows them to better serve the public.
In partnership with the White House Office of American Innovation, GSA introduced IT Modernization Centers of Excellence (CoE) in FY 2018 to make it easier for the American people to interact with their Government. Working side-by-side with tech leaders at the U.S. Department of Agriculture (USDA) and U.S. Department of Housing and Urban Development, GSA is helping assess the state of both agencies IT resources and needs -- not just hardware, but people, time and project scope -- to determine the smartest way to identify and address these needs while also helping them deliver on their missions.
GSA also supports the operation and administration of the 7Technology Modernization Fund (TMF). The TMF is an innovative funding vehicle that enables Federal agencies to invest in modernizing aging technologies through loans to deliver services to the American public more quickly, better secure sensitive systems and data, and use taxpayer dollars more efficiently.
Improved Operations through Shared ServicesThe fourth strategic goal is to implement expanded shared services across the Federal Government to improve performance and save taxpayer money.
Administrative services constitute the infrastructure necessary for an agency to execute its primary mission. In order to improve the way Government serves the American public, Government is transforming the way it does business internally. The bottom line: sharing systems and people that support administrative functions makes good business sense - it will allow agencies to direct more resources toward their core missions.
According to the 8President's Management Agenda Cross-Agency Priority (CAP) Goal Action Plan for FY 2018 Q2, Federal agencies spend more than $28.6 billion every year on administrative services such as processing hiring transactions, managing finances, closing contracts, and processing payroll. In many cases agencies have addressed their needs by creating unique systems and processes resulting in duplication across Government. For example, there are currently more than 100 systems to track time and attendance.

HOW GSA BENEFITS THE PUBLIC • FY 2018 AGENCY FINANCIAL REPORT10
GSA is leading the effort to adopt quality shared services, where appropriate, across the Government through the PMA. To begin this work, GSA, in partnership with the Office of Management and Budget, consulted with agencies to gather information on questions like, “What processes are most common within your agency today?” and “Are there ways we can realize significant cost savings and increase efficiency by taking an enterprise approach to services?”
Through this process, GSA will create new standards defining which services make the most sense to share, as well as the technology needed to support the services, while ensuring that GSA meets agency needs in a standard, uniform way.
ConclusionAround the globe and at every level across the agency, the people of GSA understand and take immense pride in meeting our Federal customers’ needs, as well as those of the American people. Wherever GSA is present, there is a passion for delivering actionable solutions that will have a lasting, positive effect on the agency customers we serve. We look forward to continuing to deliver value and savings in real estate, acquisition, technology and other mission-support services across the Federal Government.

MANAGEMENT’S DISCUSSION AND ANALYSIS (UNAUDITED)
13FY 2018 AGENCY FINANCIAL REPORT • MANAGEMENT’S DISCUSSION AND ANALYSIS
BRIEF OVERVIEW OF THE AFR
The purpose of the GSA FY 2018 AFR is to inform the President, Congress, and the American people how GSA used Federal resources in FY 2018 to reliably deliver cost-effective real estate, acquisition, and technology services to the Federal departments and agencies it serves. Providing these services at a good value to our Federal customers allows them to focus their resources on meeting their core missions to the American people. GSA chose to produce both an AFR and an APR for FY 2018. and will post this AFR on 9GSA.gov under Annual Reports. To learn more about the FY 2018 AFR 10watch this video featuring GSA's Chief Financial Officer Gerard Badorrek.
This AFR provides high-level financial and highlighted performance results with assessments of controls, a summary of challenges, and GSA stewardship information. The report satisfies the reporting requirements contained in the following laws, and regulations:
• CFO Act of 1990;
• Digital Accountability and Transparency Act of 2014;
• Federal Managers Financial Integrity Act (FMFIA) of 1982;
• Federal Financial Management Improvement Act (FFMIA) of 1996;
• Government Management Reform Act of 1994;
• Government Performance and Results Modernization Act of 2010 ;
• Improper Payments Information Act (IPIA) of 2002;
• Improper Payments Elimination and Recovery Act (IPERA) of 2010;
• Improper Payments Elimination and Recovery Improvement Act (IPERIA) of 2012;
• OMB Circular A-11, Part 6;
• OMB Circular No. A-123, Management’s Responsibility for Enterprise Risk Management (ERM) and Internal Control;
• OMB Circular No. A-136, Financial Reporting Requirements;
• OMB Memorandum M-12-12 Section 3 - Freeze the Footprint (FTF);
• OMB Memorandum M-17-08 Section 3, Amending OMB Memorandum M-12-12 Section 3 - Reduce the Footprint (RTF); and,
• Reports Consolidation Act of 2000.
The APR is a detailed report on GSA’s progress toward achieving the goals and objectives described in the agency’s Strategic Plan and Annual Performance Plan, including progress on the strategic objectives, performance goals, and agency priority goals. The report will be delivered to Congress with GSA's Congressional Budget Justification by February 4, 2019.

MANAGEMENT’S DISCUSSION AND ANALYSIS • FY 2018 AGENCY FINANCIAL REPORT14
ORGANIZATION
Composed of the Federal Acquisition Service (11FAS), the Public Buildings Service (12PBS), the Office of Government-wide Policy (13OGP), 11 staff offices, and three independent offices, GSA services and supports
more than 60 Federal departments and agencies. Headquartered in Washington, D.C., GSA delivers goods and services to its Federal customers through 11 regional offices.
Federal Acquisition ServiceFAS and annually delivers over $55 billion in information technology products, services and solutions, telecommunications services, assisted acquisition services, travel and transportation management
solutions, motor vehicles and fleet services, and charge card services. FAS manages more than 215,000 GSA-owned vehicles, oversees issuance of more than 3.5 million charge cards and provides personal property disposal services facilitating the reuse of $1 billion
15FY 2018 AGENCY FINANCIAL REPORT • MANAGEMENT’S DISCUSSION AND ANALYSIS
in excess/surplus property annually. FAS leverages the buying power of the Federal Government by negotiating prices on many products and services required by agencies for daily operations. By arranging a network of service providers, FAS is able to meet the operating and mission requirements of a vast array of Federal agencies and state, local, and tribal Governments. Leveraging its technology transformation services and information technology portfolios, FAS is developing and deploying CoEs. The goal is to improve the public’s experience with Government by obtaining and sharing technology applications, platforms, and processes to make their services more accessible, efficient, and effective.
Public Buildings ServicePBS activities fall into two broad areas: workspace acquisition and property management. PBS acquires space on behalf of the Federal Government through new construction and leasing, while acting as a caretaker for Federal properties across the country. As the largest public real estate organization in the United States, PBS owns or leases 8,706 assets and maintains an inventory of approximately 368 million square feet of rentable workspace. Within this inventory, PBS maintains 504 buildings on the National Register of Historic Places, provides high-quality facility and workspace solutions to more than 55 Federal agencies; disposes of excess or unneeded Federal properties; and promotes the adoption of innovative workplace solutions and technologies. PBS is working with its Federal customers to design the workplace of the 21st century by seeking to reduce overall workspace needs and associated costs.
Office of Government-wide Policy (OGP)OGP uses policies, data and strategy to drive efficiency and management excellence across the Federal Government for key administrative areas including travel and transportation, acquisition, fleet management, information technology modernization, and real estate management. OGP helps influence agency behavior in these areas through the development of Governmentwide policy, performance standards, data analysis and benchmarking, and transparent reporting of Governmentwide data.
Staff OfficesThe GSA staff offices support the enterprise. They ensure GSA is prepared to meet the needs of customers, on a day-to-day basis and in crisis situations.
Office of Administrative Services (OAS): OAS delivers innovative solutions for GSA’s administrative, workplace and information management needs to facilitate efficient use of Government resources and effective risk management.
Office of the Chief Financial Officer (OCFO): OCFO provides enterprise-wide budget, financial management, financial analysis, performance management, and strategic planning services to GSA business lines and staff offices.
Office of GSA Information Technology (GSA IT): GSA IT provides staff with ever-evolving technology to improve capabilities, productivity, mobility, agility, and cost savings. GSA IT solutions include laptops, mobile devices, collaborative cloud-based software, training and technical support.
Office of Civil Rights (OCR): 14OCR administers five programs related to Federal civil rights laws and regulations: Equal Employment Opportunity, Affirmative Employment, Nondiscrimination in Federally Conducted Programs and Activities, Environmental Justice and Nondiscrimination in Federally Assisted Programs and Activities. OCR also administers the appeals process for administrative grievances filed by GSA employees.

MANAGEMENT’S DISCUSSION AND ANALYSIS • FY 2018 AGENCY FINANCIAL REPORT16
Office of Congressional and Intergovernmental Affairs (OCIA): OCIA maintains agency liaison with Congress; prepares and coordinates the GSA annual legislative program; communicates the GSA legislative program to OMB, Congress, and other interested parties; and works closely with OMB in the coordination and clearance of all proposed legislation impacting GSA.
Office of Customer Experience (OCE): OCE works with internal clients to enhance relationships with customers, industry partners, and stakeholders. OCE improves the end-to-end experience of GSA customers by aligning operations to customer needs. OCE leads qualitative and quantitative research, develops customer-centric strategies, builds the capacity of teams to practice human-centered design, gather customer feedback, and conducts pilots with internal and external partners.
Office of General Counsel (OGC): OGC provides legal advice and representation to GSA, serves as GSA’s Designated Agency Ethics Official and is responsible for managing the agency’s ethics program. OGC also manages GSA-wide claims under the Federal Tort Claims Act.
Office of Human Resources Management (OHRM): OHRM delivers comprehensive human resources services and solutions to GSA and its employees. OHRM’s primary focus is to work with GSA services and staff offices to attract, motivate, develop, retain and reward employees to maintain and enhance a mission-ready workforce.
Office of Mission Assurance (OMA): OMA ensures resilience and continuity of the agency’s critical business processes by integrating and coordinating activities across all domains of security (physical, personnel, and industrial), HSPD-12 credentialing, emergency
management, and contingency and continuity planning. OMA provides an enterprise-wide approach to mission assurance planning while ensuring the safety, privacy, and security of GSA facilities, people, and assets nationwide.
Office of Small Business Utilization (OSBU): OSBU partners with GSA mission delivery and support offices to meet and exceed statutory prime and subcontracting small business and socio-economic small business goals. To achieve this, OSBU promotes access to GSA’s nationwide procurement opportunities and provides training to the acquisition workforce and small and disadvantaged businesses.
Office of Strategic Communication (OSC): OSC works with internal clients to build effective communication strategies to meet their business goals. OSC services include internal communication, graphic design and production, media relations, web and social media, audiovisual production, writing and editing, speechwriting and executive communication, and risk communication/crisis management..

17FY 2018 AGENCY FINANCIAL REPORT • MANAGEMENT’S DISCUSSION AND ANALYSIS
Independent OfficesOffice of the Inspector General (OIG): OIG is responsible for promoting economy and efficiency.OIG also detects and prevents fraud, waste and mismanagement in GSA programs and operations.
Civilian Board of Contract Appeals (CBCA): CBCA is an independent tribunal housed within GSA. Its primary responsibility is to adjudicate contract disputes between civilian Federal agencies and contractors under the Contract Disputes Act.
Federal Permitting Improvement Steering Council (FPISC): FPISC is responsible for leading ongoing Governmentwide efforts to modernize the Federal permitting and review process for major infrastructure projects. FPISC works with Federal agency partners to implement and oversee adherence to the statutory requirements set forth in the Fixing America’s Surface Transportation Act of 2015.
Full-Time Equivalent (FTE) Breakdown by OrganizationAt the close of FY 2018, GSA’s employee workforce totaled 11,137 full-time equivalents (FTE). This total represents a decrease from FY 2017 of nearly 400 FTE, which is primarily driven by attrition within PBS.
FTE are defined as the total number of hours worked, divided by the number of compensable hours applicable to each fiscal year. Compensable hours include leave, but not holiday and overtime hours.
FY 2016 FY 2017 FY 2018FTE Change (FY16-18)
FTE Change (FY17-18)
2018 % change
from 2016
2018 % change
from 2017Staff Offices 2,676 2,662 2,470 (206) (192) (7.70)% (7.21)%FAS* 3,171 3,261 3,282 111 21 3.50% 0.64%PBS^ 5,331 5,614 5,385 54 (229) 1.01% (4.08)%Total 11,178 11,537 11,137 (41) (400) (0.37)% (3.47)%
* FAS includes FTE funded out of the Acquisition Services Fund, Federal Citizen Services Fund, Transportation Audits Warrant, and a part of GSA’s Operating Expenses Appropriation.
^ PBS includes FTE funded out of the Federal Buildings Fund and a part of GSA’s Operating Expenses Appropriation for disposal activities.

MANAGEMENT’S DISCUSSION AND ANALYSIS • FY 2018 AGENCY FINANCIAL REPORT18
PERFORMANCE SUMMARY
GSA has an ongoing focus on IT modernization, customer experience, data analytics, and change management to support major initiatives in FY 2019. With this focus, our agency will deliver better services and better solutions to customers across the Federal Government.
MissionDeliver value and savings in real estate, acquisition, technology, and other mission-support services across the Government.
Save taxpayer money through better management of Federal real estate.
Establish GSA as the premier provider of efficient and effective acquisition solutions across the Federal Government
Improve the way Federal agencies buy, build, and use technology.
Design and deliver expanded shared services within GSA and across the Federal Government to improve performance and save taxpayer money.
Strategic Goals
Administrator’s Priorities
• Ethical leadership• Reduce duplication• Increase competition• Improve transparency

19FY 2018 AGENCY FINANCIAL REPORT • MANAGEMENT’S DISCUSSION AND ANALYSIS
Key Outcomes
Savings
Mission
Productivity
Security
Speed
Simplification
Satisfaction

MANAGEMENT’S DISCUSSION AND ANALYSIS • FY 2018 AGENCY FINANCIAL REPORT20
Agency Performance GoalsThis section provides an overview of GSA’s performance against four strategic goals representing our major program areas. A complete analysis of GSA’s successes and challenges related to FY 2018 performance targets will be included in the FY 2018 Annual Performance Report.
1. Real Estate – Save taxpayer money through better management of Federal real estate.
GSA met its performance target for keeping capital projects (large-scale construction and repair/alterations) on schedule and on budget. However, GSA underperformed in total lease revenue after costs, staying within market rates for leases, and cleaning/maintenance costs.
GSA underperformed in the share of leases negotiated at or below market rate. Forty-four percent of transactions in FY 2018 were negotiated at or below market, a decrease in performance compared to FY 2017. However, by focusing negotiation efforts on high-value leases, rather than simply the number of leases, GSA was able to avoid millions in costs for customer
agencies during FY 2018. To further reduce overall real property costs to the Government and save taxpayer dollars in FY 2019, GSA will continue implementing its comprehensive Lease Cost Savings Plan to focus resources on replacing high-cost leases expiring over the next six years. The plan calls for negotiating more long-term leases to achieve more favorable lease rates.
GSA missed its target to cover its costs for its non-Government owned lease portfolio, with revenue
covering 99.6 percent of our associated costs in FY 2018. Administrative costs associated with small dollar leases contribute to this deficit. To improve our operational efficiency for leasing, GSA will increase the use of the Automated Advanced Acquisition Program (AAAP) and GSA Leasing Support (GLS) Services for lease awards. AAAP provides the opportunity for private building owners and building owner representatives to offer building space to the Federal Government. GLS leverages private sector resources and expertise to supplement GSA’s leasing workforce.
GSA met its target in keeping 90 percent of its capital projects on schedule and on budget despite facing challenging market conditions, including uncertainty
over potential price increases and labor shortages in the construction market.
Although showing improvement from the previous year, GSA did not meet its FY 2018 goal to keep cleaning and maintenance costs within market range. GSA is currently working with a contractor to refine market comparisons to inform management practices and portfolio management.
Performance Indicator
FY 2016 Results
FY 2017 Results
FY 2018 Results
FY 2018 Target Status
Leases negotiated at or below market rate*
49.0% 48.0% 44.0% 55.0% Missed target
Leased revenue after administering the program
-1.16% -0.59% -0.40% 0 to 2% Missed target
Capital projects on schedule/budget 98.0% 99.0% 90.0% 90.0% Met target
Cleaning and maintenance costs within market range
80.3% 73.2% 73.6% 78.0% Missed target
* Agency Priority Goal

21FY 2018 AGENCY FINANCIAL REPORT • MANAGEMENT’S DISCUSSION AND ANALYSIS
2. Acquisition – Establish GSA as the premier provider of efficient and effective acquisition solutions across the Federal Government.
GSA provides substantial savings to the Government through focused acquisition programs. For each of the past three years, these programs have generated more than $5 billion in annual savings, with increased savings projected for FY 2018 and beyond. Based on current data, GSA is confident that the $5.22 billion target will be attained in FY 2018.
Customer loyalty scores have remained stable and we anticipate improvement over the next two years. One area of focus is to increase customer satisfaction by improving the ease of access to the products and services we offer. This strategy will emphasize enhancing and streamlining technology interfaces and systems that are touchpoints for customer interactions, while ensuring
secure sources of supply for the products and services we provide. GSA is also committed to expanding market intelligence capabilities by utilizing data as a means to
better understand, anticipate, and deliver customer requirements.
Although suppliers are sharing that GSA is communicating more effectively, supplier satisfaction scores only increased marginally in FY 2018 (from 3.61 to 3.69). Suppliers see GSA vehicles as an avenue to new markets, but are frustrated when they cannot easily navigate the procurement process. To address this issue, GSA is assessing opportunities to consolidate schedules, reducing burdens on industry. Consolidating
schedules can remove the need for industry to manage multiple contracts, lessening administrative burdens for vendors that provide services and for customer agencies purchasing across multiple schedules.
GSA continues to excel in meeting the prime small business targets set by the Small Business Administration (SBA). GSA received an A, A+, and an A on SBA’s Small Business Scorecard for fiscal years 2015-2017, respectively. GSA is confident that it will meet or exceed its FY 2018 small business prime contracting goal of 35 percent (annual results are pending validation by SBA). GSA will continue to work with SBA to encourage increased vendor pools for small business and socio-economic small business categories.
Performance Indicator
FY 2016 Results
FY 2017 Results
FY 2018 Results
FY 2018 Target Status
Acquisition program savings (billions of $)
$6.02B $5.17B $5.06B* $5.22BExpect to meet target*
Customer loyalty score(10-point scale) 7.5 7.4 7.5 7.4 Met target
Supplier satisfaction score (5-point scale)
3.70 3.61 3.69 3.80** Missed target
Percent of GSA contract dollars awarded to small business through prime contracting
39.2% 42.6% 39.1%*** 35.0%Expect to meet target***
* 15 of 18 acquisition programs have reported full-year results. When the remaining three programs report full-year results, GSA expects to meet its FY 2018 target.
** FY 2018 target reflects methodology used in prior years, while the FY 2016, FY 2017 and FY 2018 results reflect scores based on the current methodology. Targets beginning in FY 2019 are set using the current baseline.
*** Pending validation by SBA. GSA expects to meet its FY 2018 target.
MANAGEMENT’S DISCUSSION AND ANALYSIS • FY 2018 AGENCY FINANCIAL REPORT22
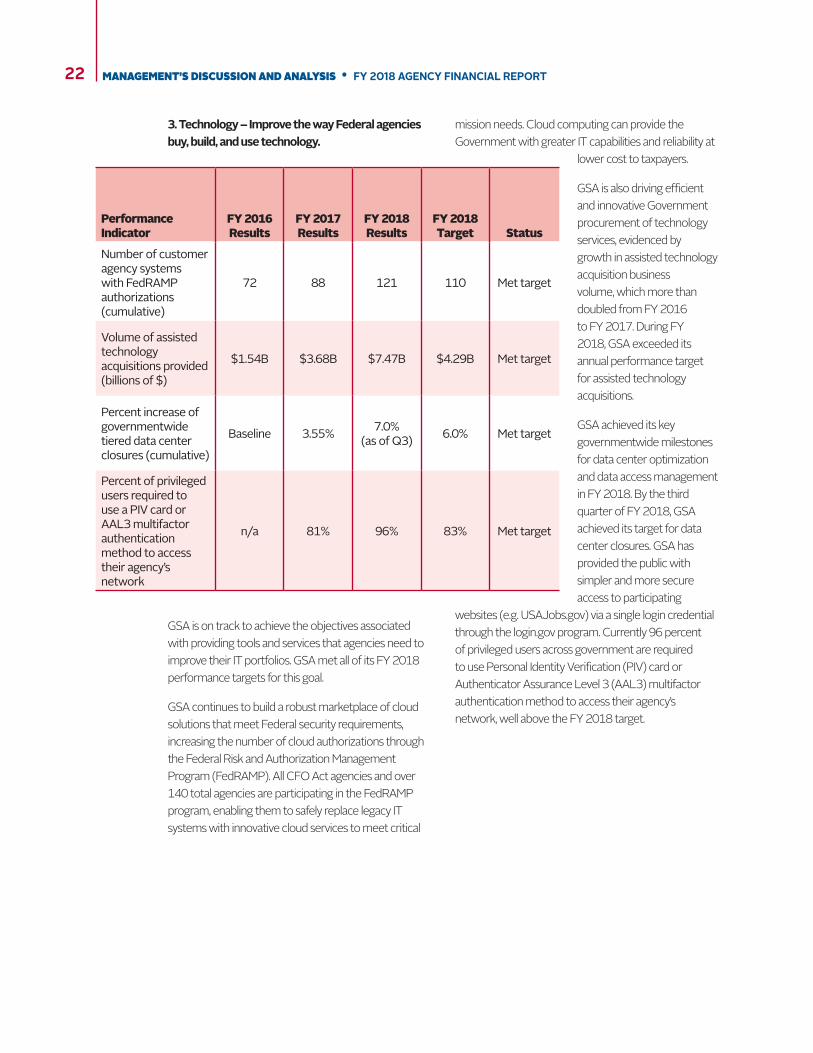
3. Technology – Improve the way Federal agencies buy, build, and use technology.
GSA is on track to achieve the objectives associated with providing tools and services that agencies need to improve their IT portfolios. GSA met all of its FY 2018 performance targets for this goal.
GSA continues to build a robust marketplace of cloud solutions that meet Federal security requirements, increasing the number of cloud authorizations through the Federal Risk and Authorization Management Program (FedRAMP). All CFO Act agencies and over 140 total agencies are participating in the FedRAMP program, enabling them to safely replace legacy IT systems with innovative cloud services to meet critical
mission needs. Cloud computing can provide the Government with greater IT capabilities and reliability at
lower cost to taxpayers.
GSA is also driving efficient and innovative Government procurement of technology services, evidenced by growth in assisted technology acquisition business volume, which more than doubled from FY 2016 to FY 2017. During FY 2018, GSA exceeded its annual performance target for assisted technology acquisitions.
GSA achieved its key governmentwide milestones for data center optimization and data access management in FY 2018. By the third quarter of FY 2018, GSA achieved its target for data center closures. GSA has provided the public with simpler and more secure access to participating
websites (e.g. USAJobs.gov) via a single login credential through the login.gov program. Currently 96 percent of privileged users across government are required to use Personal Identity Verification (PIV) card or Authenticator Assurance Level 3 (AAL3) multifactor authentication method to access their agency’s network, well above the FY 2018 target.
Performance Indicator
FY 2016 Results
FY 2017 Results
FY 2018 Results
FY 2018 Target Status
Number of customer agency systems with FedRAMP authorizations (cumulative)
72 88 121 110 Met target
Volume of assisted technology acquisitions provided (billions of $)
$1.54B $3.68B $7.47B $4.29B Met target
Percent increase of governmentwide tiered data center closures (cumulative)
Baseline 3.55% 7.0% (as of Q3) 6.0% Met target
Percent of privileged users required to use a PIV card or AAL3 multifactor authentication method to access their agency’s network
n/a 81% 96% 83% Met target
23FY 2018 AGENCY FINANCIAL REPORT • MANAGEMENT’S DISCUSSION AND ANALYSIS
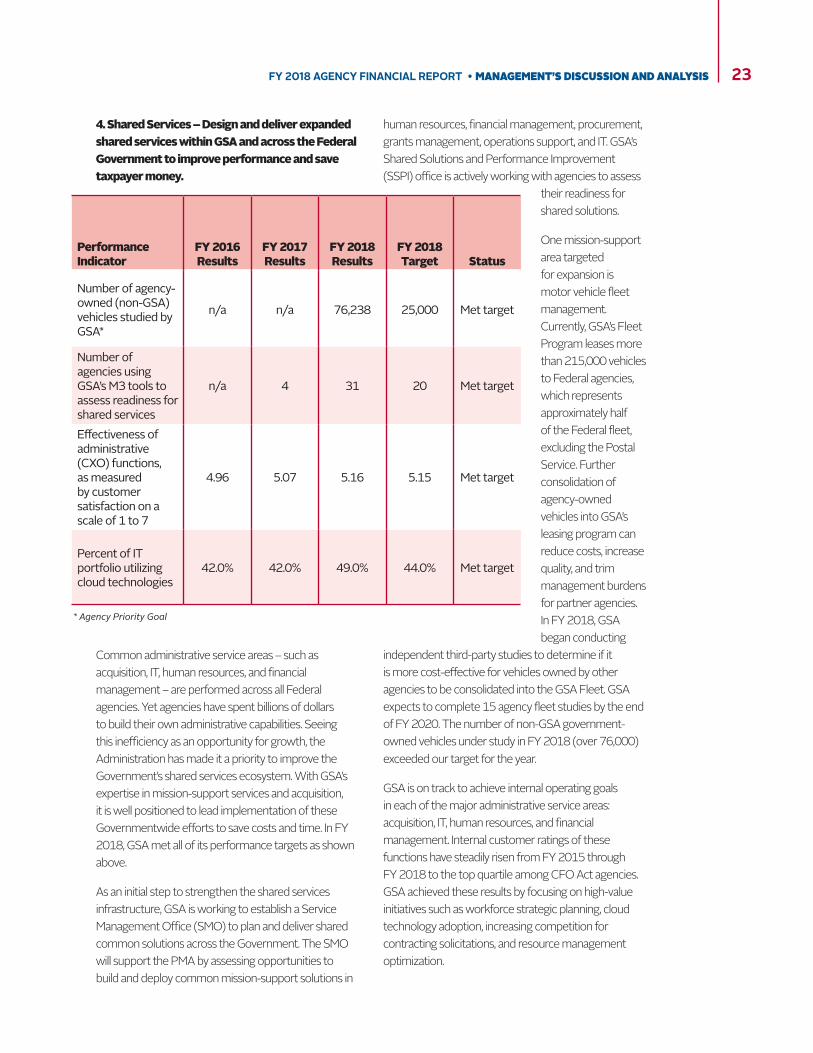
4. Shared Services – Design and deliver expanded shared services within GSA and across the Federal Government to improve performance and save taxpayer money.
Common administrative service areas – such as acquisition, IT, human resources, and financial management – are performed across all Federal agencies. Yet agencies have spent billions of dollars to build their own administrative capabilities. Seeing this inefficiency as an opportunity for growth, the Administration has made it a priority to improve the Government’s shared services ecosystem. With GSA’s expertise in mission-support services and acquisition, it is well positioned to lead implementation of these Governmentwide efforts to save costs and time. In FY 2018, GSA met all of its performance targets as shown above.
As an initial step to strengthen the shared services infrastructure, GSA is working to establish a Service Management Office (SMO) to plan and deliver shared common solutions across the Government. The SMO will support the PMA by assessing opportunities to build and deploy common mission-support solutions in
human resources, financial management, procurement, grants management, operations support, and IT. GSA’s Shared Solutions and Performance Improvement (SSPI) office is actively working with agencies to assess
their readiness for shared solutions.
One mission-support area targeted for expansion is motor vehicle fleet management. Currently, GSA’s Fleet Program leases more than 215,000 vehicles to Federal agencies, which represents approximately half of the Federal fleet, excluding the Postal Service. Further consolidation of agency-owned vehicles into GSA’s leasing program can reduce costs, increase quality, and trim management burdens for partner agencies. In FY 2018, GSA began conducting
independent third-party studies to determine if it is more cost-effective for vehicles owned by other agencies to be consolidated into the GSA Fleet. GSA expects to complete 15 agency fleet studies by the end of FY 2020. The number of non-GSA government-owned vehicles under study in FY 2018 (over 76,000) exceeded our target for the year.
GSA is on track to achieve internal operating goals in each of the major administrative service areas: acquisition, IT, human resources, and financial management. Internal customer ratings of these functions have steadily risen from FY 2015 through FY 2018 to the top quartile among CFO Act agencies. GSA achieved these results by focusing on high-value initiatives such as workforce strategic planning, cloud technology adoption, increasing competition for contracting solicitations, and resource management optimization.
Performance Indicator
FY 2016 Results
FY 2017 Results
FY 2018 Results
FY 2018 Target Status
Number of agency-owned (non-GSA) vehicles studied by GSA*
n/a n/a 76,238 25,000 Met target
Number of agencies using GSA’s M3 tools to assess readiness for shared services
n/a 4 31 20 Met target
Effectiveness of administrative (CXO) functions, as measured by customer satisfaction on a scale of 1 to 7
4.96 5.07 5.16 5.15 Met target
Percent of IT portfolio utilizing cloud technologies
42.0% 42.0% 49.0% 44.0% Met target
* Agency Priority Goal

MANAGEMENT’S DISCUSSION AND ANALYSIS • FY 2018 AGENCY FINANCIAL REPORT24
FINANCIAL STATEMENTS SUMMARY AND ANALYSISAgency management is accountable for the integrity of the financial information presented in the financial statements. The financial statements and financial data presented in this report have been prepared from GSA accounting records in conformity with Generally Accepted Accounting Principles (GAAP) as prescribed by the Federal Accounting Standards Advisory Board (FASAB). The Consolidated Statements of Net Cost present, by major program and activity, the revenues and expenses incurred to provide goods and services to our customers and execute GSA’s programs.
Consolidated Financial Results
GSA Assets
GSA assets primarily include: property and equipment such as Federal buildings, motor vehicles, and office equipment; Fund Balance with Treasury (FBwT); and amounts due to GSA from Federal agencies and non-Federal customers, mostly from sales transactions or uncollected rent (Accounts Receivable). In FY 2018, GSA reported total assets of $42.9 billion compared to FY 2017 total assets of $41.4 billion, representing a net increase of approximately $1.5 billion. Significant changes in assets include an increase in the overall FBwT of $938 million, mainly due to the Federal Buildings Fund (FBF), which saw an increase of $1 billion as funding generated for capital programs to cover building repairs and alterations (R&A) and new constructions costs exceed amounts spent on these programs.
GSA Liabilities
GSA liabilities are primarily amounts owed to commercial vendors for goods and services received but not yet paid (Accounts Payable), amounts GSA owes to other Federal entities, and long-term estimates of future environmental remediation costs. In FY 2018, Total Liabilities were $8 billion; a net increase of $627 million compared to FY 2017 Total Liabilities of $7.4 billion. The increase is primarily attributable to the increased business in the Acquisition Services Fund (ASF), particularly in the Assisted Acquisition Services
(AAS) and the General Supplies and Services (GS&S) business lines. The increase in Accounts Payable to the Public is due to the timing of individual orders as the magnitude of payables and receivables have increased as a result of the overall level of business increasing.
GSA Revenue
GSA reported $23.8 billion in revenue during FY 2018 compared to $21.8 billion reported in FY 2017.
Changes in the FBF and ASF net operating results are discussed further below.
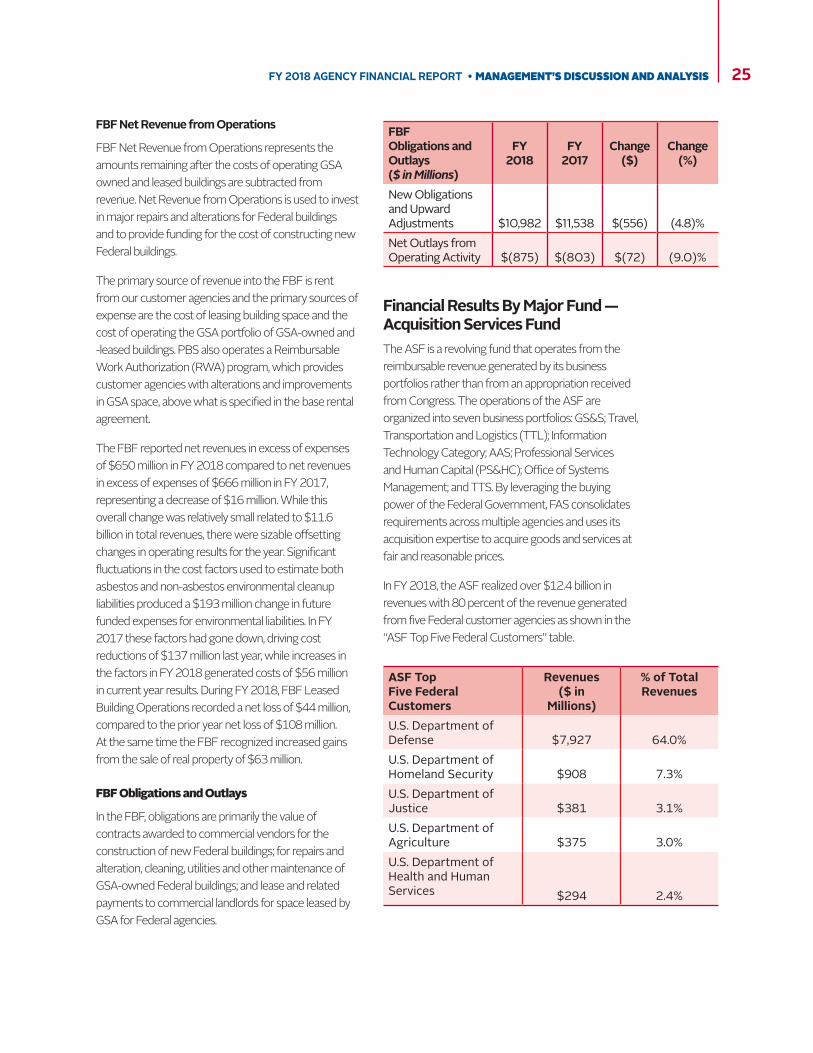
Financial Results by Major Fund – Federal Buildings FundThe FBF is the primary fund of PBS. PBS provides workplaces for Federal agencies and their employees. FBF is primarily supported by rent paid to GSA from other Federal agencies. Operating results are displayed on the Consolidating Statements of Net Cost, segregated into the two primary components of Building Operations – Government Owned, and Building Operations – Leased.
FY 2018 FBF gross revenue is over $11.6 billion, with over half of the revenue generated from five Federal customer agencies as shown in the “FBF Top Five Federal Customers” table.
FBF Top 5 Federal
Customers
Revenues ($ in
Millions)
% of Total
RevenuesU.S. Department of Justice $1,912 16.4%U.S. Department of Homeland Security $1,846 15.8%
Federal Judiciary $1,201 10.3%
U.S. Social Security Administration $880 7.5%
U.S. Department of the Treasury $712 6.1%
25FY 2018 AGENCY FINANCIAL REPORT • MANAGEMENT’S DISCUSSION AND ANALYSIS
FBF Obligations and Outlays ($ in Millions)
FY 2018
FY 2017
Change ($)
Change (%)
New Obligations and Upward Adjustments $10,982 $11,538 $(556) (4.8)%Net Outlays from Operating Activity $(875) $(803) $(72) (9.0)%
FBF Net Revenue from Operations
FBF Net Revenue from Operations represents the amounts remaining after the costs of operating GSA owned and leased buildings are subtracted from revenue. Net Revenue from Operations is used to invest in major repairs and alterations for Federal buildings and to provide funding for the cost of constructing new Federal buildings.
The primary source of revenue into the FBF is rent from our customer agencies and the primary sources of expense are the cost of leasing building space and the cost of operating the GSA portfolio of GSA-owned and -leased buildings. PBS also operates a Reimbursable Work Authorization (RWA) program, which provides customer agencies with alterations and improvements in GSA space, above what is specified in the base rental agreement.
The FBF reported net revenues in excess of expenses of $650 million in FY 2018 compared to net revenues in excess of expenses of $666 million in FY 2017, representing a decrease of $16 million. While this overall change was relatively small related to $11.6 billion in total revenues, there were sizable offsetting changes in operating results for the year. Significant fluctuations in the cost factors used to estimate both asbestos and non-asbestos environmental cleanup liabilities produced a $193 million change in future funded expenses for environmental liabilities. In FY 2017 these factors had gone down, driving cost reductions of $137 million last year, while increases in the factors in FY 2018 generated costs of $56 million in current year results. During FY 2018, FBF Leased Building Operations recorded a net loss of $44 million, compared to the prior year net loss of $108 million. At the same time the FBF recognized increased gains from the sale of real property of $63 million.
FBF Obligations and Outlays
In the FBF, obligations are primarily the value of contracts awarded to commercial vendors for the construction of new Federal buildings; for repairs and alteration, cleaning, utilities and other maintenance of GSA-owned Federal buildings; and lease and related payments to commercial landlords for space leased by GSA for Federal agencies.
Financial Results By Major Fund — Acquisition Services FundThe ASF is a revolving fund that operates from the reimbursable revenue generated by its business portfolios rather than from an appropriation received from Congress. The operations of the ASF are organized into seven business portfolios: GS&S; Travel, Transportation and Logistics (TTL); Information Technology Category; AAS; Professional Services and Human Capital (PS&HC); Office of Systems Management; and TTS. By leveraging the buying power of the Federal Government, FAS consolidates requirements across multiple agencies and uses its acquisition expertise to acquire goods and services at fair and reasonable prices.
In FY 2018, the ASF realized over $12.4 billion in revenues with 80 percent of the revenue generated from five Federal customer agencies as shown in the “ASF Top Five Federal Customers” table.
ASF Top Five Federal Customers
Revenues($ in
Millions)
% of Total Revenues
U.S. Department of Defense $7,927 64.0%U.S. Department of Homeland Security $908 7.3%U.S. Department of Justice $381 3.1%U.S. Department of Agriculture $375 3.0%U.S. Department of Health and Human Services $294 2.4%

MANAGEMENT’S DISCUSSION AND ANALYSIS • FY 2018 AGENCY FINANCIAL REPORT26
ASF Net Revenues from Operations
ASF Net Revenue from Operations represents the revenue remaining after deducting costs of goods and services sold and cost of operations. Net Revenues from Operations are invested in the GSA Fleet, IT systems, other programs to improve FAS service levels, and to comply with regulatory and statutory requirements. In FY 2018, the ASF reported positive net results of $87 million compared to net loss of $8 million in FY 2017. In the TTL business line, revenues and expenses, as well as net operating results, have increased due to strong performance within the Fleet Leasing program. In the GS&S business line, revenue increased due to larger than expected business volume, particularly due to the growth in Supply Chain Management and Retail Operations. Personal Property sales also increased as a result of the aircraft sales that were comparably low in FY 2017. AAS programs have
continued to experience significant increased revenue due to higher business volume. The Federal Systems Integration and Management Center’s (FedSIM) increase is responsible for nearly two-thirds of the AAS growth.
ASF Obligations and Outlays
ASF obligations and outlays are primarily driven by contracts awarded to commercial vendors providing goods and services in support of the ASF portfolios. New Obligations and Upward Adjustments increased by $1.634 billion between FY 2017 and FY 2018 and Net Outlays from Operating Activity increased by $181 million, primarily due to higher business volume in the AAS and GS&S programs.
ASF Obligations and Outlays($ in millions)
FY 2018
FY 2017
Change ($)
Change (%)
New obligations and upward adjustments $15,260 $13,626 $1,634 12.0%Net Outlays from Operating Activity $95 $(86) $181 (210.4)%
Limitations of Financial Statements
The principal financial statements are prepared to report the financial position and results of operations, pursuant to the requirements of 31 U.S.C. 3515 (b). The statements are prepared from the books and records of GSA in accordance with Federal GAAP and the formats prescribed by OMB. Reports used to monitor and control budgetary resources are prepared from the same books and records. The financial statements should be read with the realization that they are for a component of the U.S. Government.

27FY 2018 AGENCY FINANCIAL REPORT • MANAGEMENT’S DISCUSSION AND ANALYSIS
GSA MANAGEMENT ASSURANCES
Statement of AssuranceGSA management is responsible for managing risks and maintaining effective internal control to meet the objectives of Sections 2 and 4 of the Federal Managers’ Financial Integrity Act. GSA conducted its assessment of risk and internal control in accordance with OMB Circular No. A-123, Management’s Responsibility for Enterprise Risk Management and Internal Control. Based on the results of the assessment, the Agency can provide reasonable assurance that internal controls over operations, reporting, and compliance were operating effectively as of September 30, 2018.
In FY 2017, GSA confronted the same challenge as other Federal agencies: many employees are retirement eligible and can leave the Federal workforce. Workforce planning, which includes staffing and succession plans will mitigate the impact of high retirement eligibility in mission-critical occupations.
During FY 2018, GSA addressed succession planning issues by implementing knowledge transfer and developmental programs aimed at mitigating the impact of high retirement eligibility. GSA established a policy offering potential retirees the option for a phased retirement. This would ensure there is an opportunity to transfer knowledge prior to experienced staff leaving the agency.
GSA continues its commitment implementing programs designed to identify the future leaders of the agency. GSA has improved the hiring and retention initiatives at the entry level. GSA also launched the Senior Executive Service Candidate Development Program which is a succession management tool to identify and prepare future senior leaders to fill vacant executive positions.
GSA initiated a Competitive Development Program designed to foster leadership development at different grade levels and provide participants the opportunity to build the skills, knowledge, and behaviors required to meet current and future business challenges at GSA.
As part of the annual assessment of the design and effectiveness of internal controls, GSA offices completed an internal control assessment tool to evaluate compliance with the 5 components and 17 principles of internal control. Each office was also required to prepare and sign statements of assurance for their areas of responsibility to improve accountability over GSA internal controls.
The potential Antideficiency Act (ADA) violation disclosed in the FY 2017 Statement of Assurance has been reviewed, and forwarded to OMB for final determination. The potential violation entailed GSA accepting customer orders in excess of the limitation in GSA’s ASF apportionment. GSA implemented additional business forecasting controls and monitoring controls over apportioned budget authority.
Also in FY 2017, a potential ADA was identified related to the Federal Citizen Services Fund (FCSF), which resulted from utilizing the FCSF to support search capability for state and local Government websites. GSA corrected the situation by ending these services in February 2017.
Both potential ADA violations are pending OMB final review.
During 2018, the GSA Inspector General identified fraudulent activity around the System for Award Management (SAM), the platform used by vendors who wish to conduct business with the U.S. Government.
GSA established additional controls to reduce the risk of future fraud including: multi-factor authentication, restricting access to expired registration data, increasing verification requirements for changing banking information, and masking of sensitive data in the system.
The FY 2018 external audit cited two significant deficiencies: the first was related to controls over the financial reporting process, and the second was related to weaknesses in information technology controls designed to protect GSA’s financial
MANAGEMENT’S DISCUSSION AND ANALYSIS • FY 2018 AGENCY FINANCIAL REPORT28
management systems. GSA is developing and will execute corrective action plans to address these two significant deficiencies in FY 2019.
Finally, GSA has monitored and assessed its financial systems to ensure compliance with Federal financial management standards, as required by the FFMIA of 1996 and OMB Circular A-123 Appendix D. GSA assessed its degree of substantial compliance by utilizing the FFMIA Risk Model, and all financial management systems substantially comply with FFMIA as of September 2018. GSA is confident that all systems substantially comply with the Federal accounting standards promulgated by the Federal Accounting Standards Advisory Board, and with the U.S. Standard General Ledger (USSGL) at the transaction level as of September 30, 2018.
Emily W. Murphy Administrator November 8, 2018

29FY 2018 AGENCY FINANCIAL REPORT • MANAGEMENT’S DISCUSSION AND ANALYSIS
GSA MANAGEMENT AND INTERNAL CONTROL PROGRAM1. Management’s Responsibility for
Enterprise Risk Management and Internal Controls
Internal control is at the core of GSA fulfilling its mission and achieving its goals while safeguarding Governmental resources. GSA management is responsible for implementing internal control activities across the agency.
GSA uses a top-down approach to implement effective and efficient internal controls. The agency’s senior assessment team, the Management Control Oversight Council (MCOC), chaired by the Deputy Administrator, is responsible for establishing governance for GSA’s senior managers to provide the leadership and oversight necessary for effective implementation of the agency’s Internal Control Program. GSA evaluates internal control across the agency at various levels of the organization to ensure significant risks are identified and related internal controls are tested and evaluated.
The OCFO A-123 Internal Control Review team and the Office of Government-wide Policy (OGP) conducted parallel financial and acquisition reviews across the agency. The organization within OGP performing the work is the Procurement Management Review (PMR) Division, which is a component of the Office of Acquisition Policy reporting directly to the GSA Senior Procurement Executive. This office completed a total of 1,061 contract/real property lease reviews in FY 2018 covering 18 GSA Contracting organizations.
PMR reviews assessed the effectiveness of internal controls over procurement management. By analyzing activities from both an acquisition and financial perspective, GSA addressed control issues that involved financial and acquisition functions. Any identified control deficiencies are tracked and monitored for timely and accurate implementation of corrective actions. No material weakness was identified during this review process.
The OCFO deploys an extensive annual testing and assessment methodology that evaluates the
effectiveness of internal controls over financial reporting and financial systems. In FY 2018, the OCFO conducted an agency-wide assessment of the five Components and 17 Principles of Internal Control as required by the U. S. Government Accountability Office (GAO) Standards for Internal Control in the Federal Government (Green Book). The OCFO improved the quality of the reporting and monitoring of improper payments by enhancing the sampling model used for estimating the improper payment rate for Rental of Space. The previous model sampled from one information source: the disbursement population from our Pegasys financial system. The new sampling model uses three sources of information: the disbursement population from our Pegasys financial system, overpayments identified from our Federal Shared Service Provider (FSSP), and overpayments identified from our Payment Recapture Audit. Using this multi-pronged approach generates a more accurate Rental of Space improper payment rate estimate. It also provides additional information for analyzing the root causes of improper payments. In FY 2018, the test results for Rental of Space indicate an improper payment rate of 0.29 percent and an improper payment amount of $16.70 million.
2. Federal Managers’ Financial Integrity Act
The FMFIA of 1982 requires that agencies establish internal controls and financial systems to provide reasonable assurance that the integrity of Federal programs and operations is protected. Furthermore, it requires the head of the agency to provide an annual assurance statement on whether the agency has met this requirement and whether any material weaknesses exist.
In response to the FMFIA, the agency holds managers accountable for the performance, productivity, operations and integrity of their programs through the use of internal controls. Senior managers at the agency each year evaluate the adequacy of the internal controls and determine whether the controls conform
MANAGEMENT’S DISCUSSION AND ANALYSIS • FY 2018 AGENCY FINANCIAL REPORT30
to the internal control standards established by OMB and GAO. The results of these evaluations and other information provided to senior management are used to determine whether there are any internal control matters to be reported as material weaknesses. The agency’s senior assessment team, the MCOC, provides oversight of the internal control program and advises the Administrator on the Statement of Assurance.
Additionally, GSA monitors internal controls over purchase and travel cards. See the Fraud Reduction Report Section for comments on this activity.
3. OMB Circular No. A-123, Appendix A
Appendices A and D of OMB Circular No. A-123 provide requirements to agencies for conducting the management assessment of internal control over reporting and financial systems, respectively. In FY 2018, the OCFO continued to deploy an extensive annual assessment methodology that assesses risk across key business processes and identifies the related key internal controls over reporting and financial systems. The key controls were then evaluated for appropriate design and operational effectiveness, while financial system assessments were conducted to identify potential risk areas.
The Agency’s evaluation for FY 2018 did not identify any material weaknesses in controls or material system non-conformances as of, or subsequent to, September 30, 2018.
4. Federal Financial Management Improvement Act
The FFMIA of 1996 was designed to improve Federal financial management and reporting by requiring that financial management systems comply substantially with three requirements:
• Federal financial management system requirements;
• Applicable Federal accounting standards; and,
• The U. S. Government Standard General Ledger at the transaction level.
Furthermore, the Act requires independent auditors to report on agency compliance with the three stated
requirements as part of financial statement audit reports. The agency evaluated its financial management systems and has determined they substantially comply with Federal financial management systems requirements, applicable Federal accounting standards and the U. S. Government Standard General Ledger at the transaction level.
5. Information and Financial Management Systems Framework
The CFO Act assigns responsibilities for planning, developing, maintaining, and integrating financial management systems within Federal agencies. GSA currently maintains e-Payroll applications, portions of its legacy core accounting system, and general support systems, which operate on a variety of hosting platforms to support various feeder applications.
In FY 2018, GSA continued its progress in financial systems modernization. GSA completed a project to move the Visual Invoice Tracking and Payment (VITAP) application, an accounts payable subsystem, to a new platform. The new .Net platform improved GSA’s security posture and retired a significant portion of legacy FoxPro code. Additional benefits included 508 Compliance, implementing Single Sign-On, and enhancing the overall user experience and usability of this mission-critical application.
GSA’s legacy time and attendance and leave management systems, ETAMS and ALOHA, were replaced in FY 2018 by the GSA’s new HR Links system. HR Links system is a PeopleSoft solution operated and configured by IBM and QTS Realty Trust, Inc. (QTS). QTS operates the two FedRAMP-certified data centers where the application is hosted. HRLinks improves GSA’s security posture by providing multi-factor authentication to one integrated system, and additional benefits include single-sign-on, self-service features, easy access to leave balances, 508 compliance, and mobile access.
GSA also undertook activities to improve processes, increase automation, and further consolidate applications. These strategies support GSA's financial management system goals of reducing operating and maintenance costs, while enhancing compliance and IT security controls. Projects included in part: piloting Robotics Process Automation to streamline processes and significantly increase automation; implementing
31FY 2018 AGENCY FINANCIAL REPORT • MANAGEMENT’S DISCUSSION AND ANALYSIS
database and technology transformations and continuing efforts to consolidate General Support Systems application functionality into a single system and/or migrating it to GSA’s core financial system, Pegasys.
6. Federal Information Security Modernization Act
The Federal Information Security Management Act (FISMA) requires Federal agencies to implement a set of processes and system controls designed to ensure the confidentiality, integrity, and availability of system-related information. The controls in each Federal agency must follow established Federal Information Processing Standards, National Institute of Standards and Technology (NIST) standards, and other legislative requirements pertaining to Federal information systems, such as the Privacy Act of 1974.
To facilitate FISMA compliance, GSA maintains a formal program for information security management focused on FISMA requirements, protecting GSA IT resources. This program is focused on processes necessary to mitigate new threats and anticipate risks posed by new technologies.
Designated GSA information system security managers and information system security officers implement information security requirements in accordance with FISMA requirements and GSA policies.
GSA continues to address weaknesses identified in its Plan of Action and Milestones. GSA annually provides security and privacy awareness training to more than 15,000 employees and contractors. GSA continues to implement and develop a continuous diagnostics and mitigation program in accordance with NIST, U.S. Department of Homeland Security, and OMB direction.
7. Digital Accountability and Transparency Act (DATA Act)
The Digital Accountability and Transparency Act (DATA Act) was enacted in 2014, amending the Federal Financial Accountability and Transparency Act of 2006 (FFATA). FFATA requires reporting of obligations and award-related information for all Federal financial assistance and procurement awards. The DATA Act expands upon FFATA by adding U.S. Department of
the Treasury (Treasury) account-level reporting; this includes reporting all Treasury Account Symbols that fund each award and contract transaction, budget authority, program activity, outlays, and budget object classes, among other data elements. The DATA Act also requires the Federal Government to collectively standardize the data elements reportable under the Act. GSA submitted its quarterly DATA Act submissions as required. This information is 15publicly accessible and searchable by the American public to see how their tax dollars are being spent. The 16Spending Explorer makes it easy to conduct high level analysis of Federal spending.
8. Antideficiency Act (ADA)The Antideficiency Act, Pub.L. 97–258, 96 Stat. 923, is legislation enacted by the Congress to prevent the incurring of obligations or the making of expenditures in excess of amounts available in appropriations or funds. The law was initially enacted in 1884, with major amendments occurring in 1950 and 1982. It is now codified at 31 U.S.C. § 1341.
GSA is working with OMB on final decisions for two potential FY 2017 violations of the ADA. In one instance, the ASF apportionment did not account for growth potential of a specific reimbursable agreement and the ASF flow-through apportionment limitation was exceeded. In response to this potential violation, GSA initiated a Corrective Action Plan (CAP) with four actions, which have been completed. Additional information on this potential ADA is included in the OIG’s Management Challenges and the Statement of Assurance.
The second potential ADA violation identified in FY 2017 was related to the FCSF. The FCSF was utilized to support search capability for state and local Government websites. GSA corrected the situation by discontinuing these services in February 2017.

MANAGEMENT’S DISCUSSION AND ANALYSIS • FY 2018 AGENCY FINANCIAL REPORT32
FORWARD-LOOKING INFORMATION
Risk ManagementGSA annually identifies and assesses risks to the agency’s strategic goals and objectives that have a significant likelihood of occurrence over a multi-year horizon. The assessment encompasses risks both to the implementation of strategic initiatives and ongoing operations. Risks are identified and prioritized through a cross-functional process by engaging a team representing GSA’s mission delivery units and core mission-support offices. Prioritized risks are then presented to GSA leadership for review and concurrence.
As an output of this year’s risk management process, GSA prioritized a set of enterprise risks. Some of the risks identified include:
1. Cybersecurity - Cybersecurity operations and investments must be optimized to reduce the risk of insider and external threats to sensitive Government data. The Fraud Reduction Report in the latter section of this report provides specific mitigation plans for the cybersecurity risk.
2. Workforce Succession Planning - Significant levels of retirement eligibility at GSA requires an increased focus on talent pipeline management to reduce the impact of organizational skill and knowledge gaps resulting from foreseen separations. The Statement of Assurance identifies actions taken by GSA to mitigate this risk in FY 2018.
3. Legacy Database Technologies - Continued reliance on legacy database technologies increases costs and impacts operational performance. GSA
is therefore identifying and pursuing Software-as-a-Service opportunities in a software deployment and reducing agency dependence on legacy systems.
4. Shared Services Adoption - GSA’s ability to drive adoption of Governmentwide systems across the agency, challenging the traditional model of shared service solutions is affected by the risk that resources and priorities at customer agencies may not consistently align with shared services objectives.
Each of these risks has the potential to impact GSA’s ability to meet our mission. Organizational awareness and proactive leadership are essential to ensure the risks are managed and mitigated. GSA has developed project plans and mitigation strategies for enterprise risks while monitoring qualitative and quantitative data to gauge the pervasiveness of the risks. Planned organizational investments will also contribute to minimizing the impact of the risk and its likelihood of occurring. Effective management of these risks is an opportunity for GSA to strengthen its internal operations and external defenses to maximize value to customer agencies and the American Public.

FINANCIAL SECTION

35FY 2018 AGENCY FINANCIAL REPORT • FINANCIAL SECTION
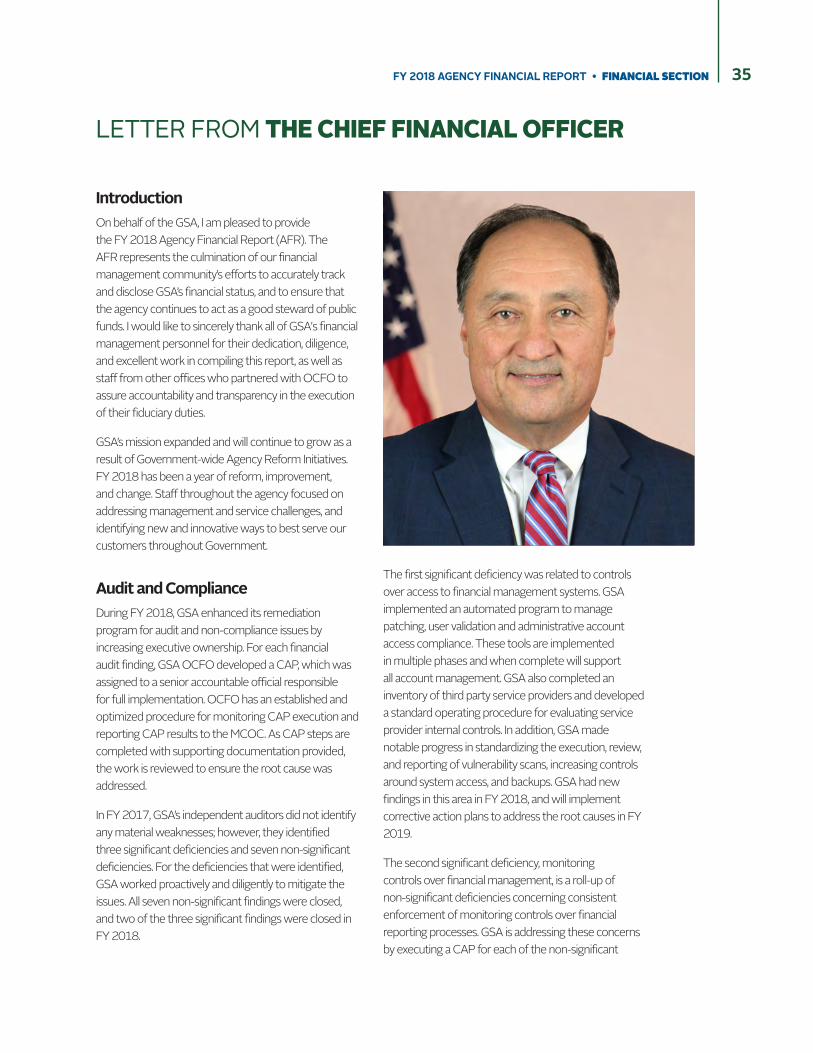
LETTER FROM THE CHIEF FINANCIAL OFFICER
IntroductionOn behalf of the GSA, I am pleased to provide the FY 2018 Agency Financial Report (AFR). The AFR represents the culmination of our financial management community’s efforts to accurately track and disclose GSA’s financial status, and to ensure that the agency continues to act as a good steward of public funds. I would like to sincerely thank all of GSA's financial management personnel for their dedication, diligence, and excellent work in compiling this report, as well as staff from other offices who partnered with OCFO to assure accountability and transparency in the execution of their fiduciary duties.
GSA’s mission expanded and will continue to grow as a result of Government-wide Agency Reform Initiatives. FY 2018 has been a year of reform, improvement, and change. Staff throughout the agency focused on addressing management and service challenges, and identifying new and innovative ways to best serve our customers throughout Government.
Audit and ComplianceDuring FY 2018, GSA enhanced its remediation program for audit and non-compliance issues by increasing executive ownership. For each financial audit finding, GSA OCFO developed a CAP, which was assigned to a senior accountable official responsible for full implementation. OCFO has an established and optimized procedure for monitoring CAP execution and reporting CAP results to the MCOC. As CAP steps are completed with supporting documentation provided, the work is reviewed to ensure the root cause was addressed.
In FY 2017, GSA’s independent auditors did not identify any material weaknesses; however, they identified three significant deficiencies and seven non-significant deficiencies. For the deficiencies that were identified, GSA worked proactively and diligently to mitigate the issues. All seven non-significant findings were closed, and two of the three significant findings were closed in FY 2018.
The first significant deficiency was related to controls over access to financial management systems. GSA implemented an automated program to manage patching, user validation and administrative account access compliance. These tools are implemented in multiple phases and when complete will support all account management. GSA also completed an inventory of third party service providers and developed a standard operating procedure for evaluating service provider internal controls. In addition, GSA made notable progress in standardizing the execution, review, and reporting of vulnerability scans, increasing controls around system access, and backups. GSA had new findings in this area in FY 2018, and will implement corrective action plans to address the root causes in FY 2019.
The second significant deficiency, monitoring controls over financial management, is a roll-up of non-significant deficiencies concerning consistent enforcement of monitoring controls over financial reporting processes. GSA is addressing these concerns by executing a CAP for each of the non-significant

FINANCIAL SECTION • FY 2018 AGENCY FINANCIAL REPORT36
findings. Highlights of corrective actions taken to date include increased review and verifications of asbestos reports for accuracy, updated internal policies over RWA acquisition/construction to align with Federal accounting standards, increased oversight and accountability for tracking construction in process projects to ensure timely recording of substantial completion, and updated standard operating procedures for accounting adjustments for non-level rent to clearly define roles and responsibilities and reconciliation requirements.
The third significant deficiency related to budgetary controls over apportionments GSA did not effectively monitor apportionment to allow for support time to request reapportionment from OMB when customer obligations exceeded what was anticipated and apportioned. While the OMB does not intend to restrict the amount of customer orders GSA can fill, the apportionment process effectively places limitations on resources available to spend on reimbursable activities. In response to this FY 2017 finding, GSA improved monitoring controls over apportionment levels, SF-133 execution, and revenue/business volume forecasts to ensure alignment between budgetary and proprietary forecasts. During FY 2018, the OCFO improved monitoring over the apportionment process and worked with the business lines to improve communications on anticipating business volumes and forecasts. Furthermore, GSA is exploring expanded automated, preventative controls to ensure compliance with apportionment limitations as part of GSA’s corrective action.
Key Financial Accomplishments in FY 2018GSA OCFO continues to work closely with OMB, Treasury and FASAB to improve Federal financial reporting. Our collaborative goal is to achieve a “clean” audit opinion for the 17U.S. Government’s Consolidated Financial Report. A current impediment to a “clean” opinion is intragovernmental balances between Federal agencies. As GSA’s mission is to support other Federal agencies through acquisition support and occupancy services, one of OCFO’s key financial management activities is to resolve discrepancies in those balances. GSA OCFO staff has been working
closely with our Federal partners to identify and resolve intragovernmental billing differences. With Treasury, we have been advancing a Government-wide solution to address intragovernmental differences. Early implementation of Treasury’s G-Invoicing system should improve the controls by having a central repository of general terms and conditions for agreements with our Federal partners. OCFO is engaging the various program managers of the business feeder systems to help develop our implementation strategy.
GSA made significant improvements to the Rental of Space high risk program. In FY 2018, GSA improved the Rental of Space payment processes and worked with OMB to establish a realistic target, bringing the program into compliance. Test results show that this program’s improper payment rate is 0.29 percent with a monetary loss to the Government below 1.0 percent of program outlays.
Ambitious Goals for CFO-Wide Transformation OCFO Leadership set ambitious goals for the organization in FY 2018 to drive improvements and gain efficiencies. Meeting these goals enabled OCFO to deliver the high-quality, efficient services that our partners rely on to deliver acquisition, technology, and real estate solutions to the entire Federal Government.
OCFO was recently recognized by OMB for its business transformation efforts and contributions to the President’s Management Agenda - Cross-Agency Priority Goal 6. OCFO pursued the high-value services mandated by Cross-Agency Priority Goal 6 during FY 2018, specifically through the following initiatives:
• 18Eliminate, Optimize, and Automate Initiative - OCFO launched a broad scale initiative to eliminate, optimize, and automate our GSA-wide financial management workload. We sought to eliminate manual tasks by adding value through optimization and reduction in the level of effort needed to complete tasks, and automation of work processes with a focus on robotics process automation.
Our leadership team established an ambitious goal of identifying 40,000 hours of annualized
37FY 2018 AGENCY FINANCIAL REPORT • FINANCIAL SECTION
work across GSA to be saved and reallocated to more value-added reporting, analytics, and control work. OCFO staff contributed nearly 200 ideas as candidates for hours that could be re-allocated to higher value or new requirements across all functional areas. From these staff submissions, OCFO identified nearly 100,000 hours of workload across GSA for evaluation and further exploration.
• Robotics (software “bots”) - One of the enablers of the eliminate, optimize and automate initiative is process robotics. In FY 2018 OCFO created a robust internal capability to implement process robotics solutions for opportunities identified both within financial functions and across GSA. OCFO set an ambitious goal to fully implement at least ten bots during the calendar year, a target which OCFO will fully achieve. The use of bots has allowed OCFO to significantly reduce the amount of time spent manually completing dashboards, financial transactions, queries, and reconciliations. This time has been reallocated to providing high-value services for our partners. In FY 2018, OCFO deployed process robotics applications eliminating 7,280 labor hours annually and have planned automations for FY 2019 that will eliminate an additional 184,000 per year for OCFO and PBS. Success of GSA’s automation initiatives is expected to allow a shifting of resources. These resources could be applied to tasks such as mitigating interagency discrepancies, researching root causes of chargebacks and implementing FASAB changes that impact our financial statements.
• HR Links/Payroll including additional controls - GSA implemented a new Human Resources system that consolidated the functionality from four legacy systems. The new system provides employee performance, human resources, time, and leave management in one solution. HR Links includes improved front end time and attendance controls that assist employees and supervisors in submitting accurate timesheets. In addition,
the integration of leave requests and time and attendance reporting into a single system has streamlined the process of requesting and reporting leave, while reducing the chance of human error.
ConclusionGSA made significant progress in FY 2018 in developing a culture of financial transparency, accountability, and control within our agency and across Government. GSA continues to receive a clean opinion on its financial reports and is working with Treasury and OMB to address areas keeping the Federal Government from obtaining a clean opinion.
As we move into FY 2019, GSA OCFO will expand the use of Robotics Process Automation, support the Treasury's G-Invoicing initiative and refine our service offerings for GSA and Federal partners. This is an exciting time for GSA OCFO, and I look forward to another year of progress. I appreciate all the support I receive from staff as we work to improve our operations and ensure GSA remains a good steward of public funds.
Gerard E. Badorrek Chief Financial Officer
November 8, 2018

FINANCIAL SECTION • FY 2018 AGENCY FINANCIAL REPORT38
Inspector General’s Transmittal Memorandum of The Independent Auditor’s Report

39FY 2018 AGENCY FINANCIAL REPORT • FINANCIAL SECTION

FINANCIAL SECTION • FY 2018 AGENCY FINANCIAL REPORT40
41FY 2018 AGENCY FINANCIAL REPORT • FINANCIAL SECTION

FINANCIAL SECTION • FY 2018 AGENCY FINANCIAL REPORT42

43FY 2018 AGENCY FINANCIAL REPORT • FINANCIAL SECTION

FINANCIAL SECTION • FY 2018 AGENCY FINANCIAL REPORT44

45FY 2018 AGENCY FINANCIAL REPORT • FINANCIAL SECTION
FINANCIAL SECTION • FY 2018 AGENCY FINANCIAL REPORT46

47FY 2018 AGENCY FINANCIAL REPORT • FINANCIAL SECTION

FINANCIAL SECTION • FY 2018 AGENCY FINANCIAL REPORT48

49FY 2018 AGENCY FINANCIAL REPORT • FINANCIAL SECTION

FINANCIAL SECTION • FY 2018 AGENCY FINANCIAL REPORT50
The accompanying notes are an integral part of these statements.
CONSOLIDATED FINANCIAL STATEMENTSU.S. General Services AdministrationConsolidated Balance SheetsAs of September 30, 2018 and 2017 (Dollars in Millions)
2018 2017ASSETS Intragovernmental Assets: Fund Balance with Treasury (Notes 1-D, 2) $12,328 $11,390 Accounts Receivable - Federal, Net (Note 4) 2,972 2,415 Capital Lease Payments Receivable (Note 8) 55 71 Prepaid Expenses and Advances - Federal 139 141 Total Intragovernmental Assets 15,494 14,017 Accounts Receivable - Non-Federal, Net (Note 4) 144 157 Inventories (Note 1-E) 3 7 Other Assets (Note 5) 200 203 Property and Equipment: (Notes 1-F, 6) Buildings 47,518 46,273 Leasehold Improvements 306 334 Motor Vehicles 6,022 5,751 Equipment and Other Property 722 717 Less: Accumulated Depreciation and Amortization (30,830) (29,180) Subtotal 23,738 23,895 Land 1,695 1,695 Construction in Process and Software in Development 1,668 1,447 Total Property and Equipment, Net 27,101 27,037 TOTAL ASSETS $42,942 $41,421
LIABILITIES AND NET POSITION Intragovernmental Liabilities: Accounts Payable and Accrued Expenses - Federal $30 $44 Judgment Fund Liability (Note 11) 495 490 Deferred Revenues and Advances - Federal (Note 11) 755 664 Amounts Owed to the General Fund (Note 11) 30 34 Other Intragovernmental Liabilities (notes 9,11) 72 88 Total Intragovernmental Liabilities 1,382 1,320 Accounts Payable and Accrued Expenses - Non-Federal 3,155 2,761 Environmental and Disposal Liabilities (Notes 6,11) 2,007 1,922 Capital Lease and Installment Purchase Liability (Note 11) 685 571 Unamortized Rent Abatement Liability (Note 11) 476 485 Workers' Compensation Actuarial Liability (Notes 7,11) 112 113 Annual Leave Liability (Notes 1-G, 11) 110 109 Deposit Fund Liability (Note 11) 16 28 Other Liabilities (Notes 9,11) 83 90 Total Liabilities 8,026 7,399 Net Position: (Note 14) Cumulative Results of Operations 34,487 33,797 Unexpended Appropriations 429 225 Total Net Position 34,916 34,022 TOTAL LIABILITIES AND NET POSITION $42,942 $41,421
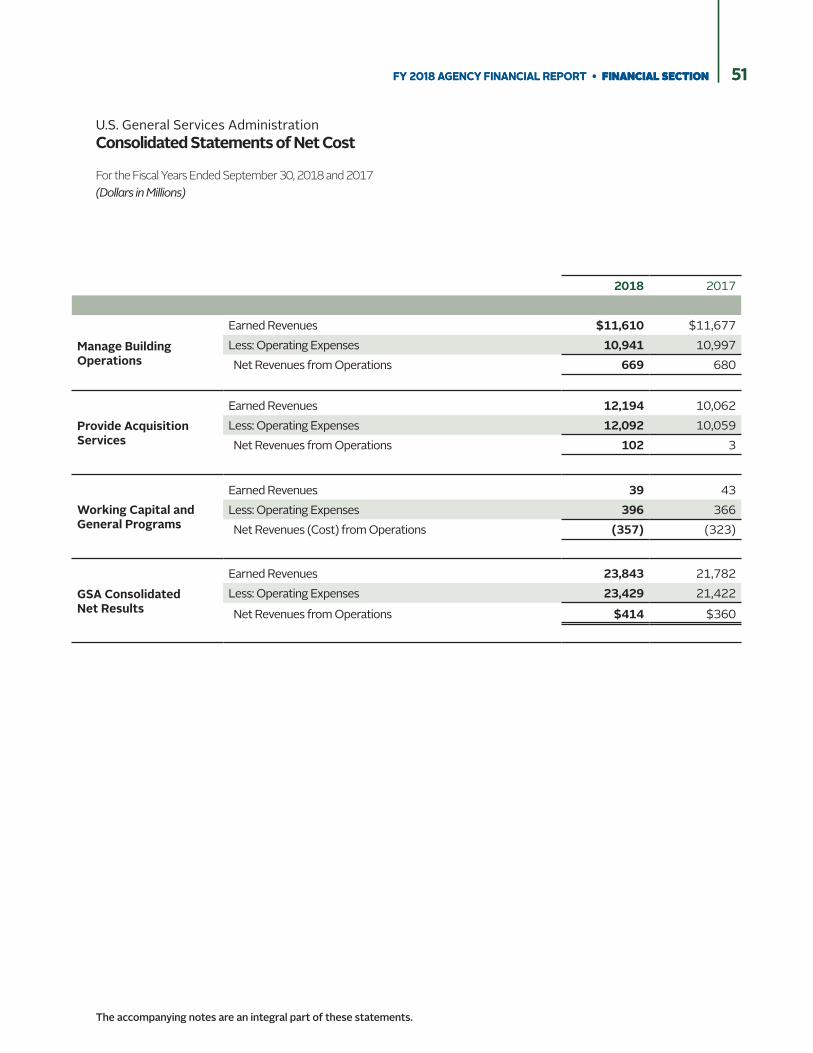
51FY 2018 AGENCY FINANCIAL REPORT • FINANCIAL SECTION 51FY 2018 AGENCY FINANCIAL REPORT • FINANCIAL SECTION
The accompanying notes are an integral part of these statements.
U.S. General Services AdministrationConsolidated Statements of Net Cost
For the Fiscal Years Ended September 30, 2018 and 2017 (Dollars in Millions)
2018 2017
Manage Building Operations
Earned Revenues $11,610 $11,677Less: Operating Expenses 10,941 10,997 Net Revenues from Operations 669 680
Provide Acquisition Services
Earned Revenues 12,194 10,062Less: Operating Expenses 12,092 10,059 Net Revenues from Operations 102 3
Working Capital and General Programs
Earned Revenues 39 43Less: Operating Expenses 396 366 Net Revenues (Cost) from Operations (357) (323)
GSA ConsolidatedNet Results
Earned Revenues 23,843 21,782Less: Operating Expenses 23,429 21,422 Net Revenues from Operations $414 $360

FINANCIAL SECTION • FY 2018 AGENCY FINANCIAL REPORT52
The accompanying notes are an integral part of these statements.
U.S. General Services AdministrationConsolidated Statements of Changes in Net Position
For the Fiscal Years Ended September 30, 2018 and 2017 (Dollars in Millions)
2018 2017
BEGINNING BALANCE OF NET POSITION:
Cumulative Results of Operations $ 33,797 $ 33,226
Unexpended Appropriations 225 247
Net Position Beginning Balance 34,022 33,473
RESULTS OF OPERATIONS:
Net Revenues From Operations 414 360
Appropriations Used (Note 1-C) 256 274
Non-Exchange Revenue (Notes 1-C, 1-D) 97 80
Imputed Financing Provided By Others 105 79
Transfers of Financing Sources (To) From the U.S. Treasury (75) (121)
Transfers of Net Assets and Liabilities (To) From Other Federal Agencies (102) (94)
Other (5) (7)
Net Results of Operations 690 571
CHANGES IN UNEXPENDED APPROPRIATIONS:
Appropriations Received 461 253
Appropriations Used (256) (274)
Appropriations Adjustments and Transfers (To) From Other Agencies or Funds (1) (1)
Net Change in Unexpended Appropriations 204 (22)
ENDING BALANCE OF NET POSITION:
Cumulative Results of Operations 34,487 33,797
Unexpended Appropriations 429 225
Net Position Ending Balance $34,916 $34,022
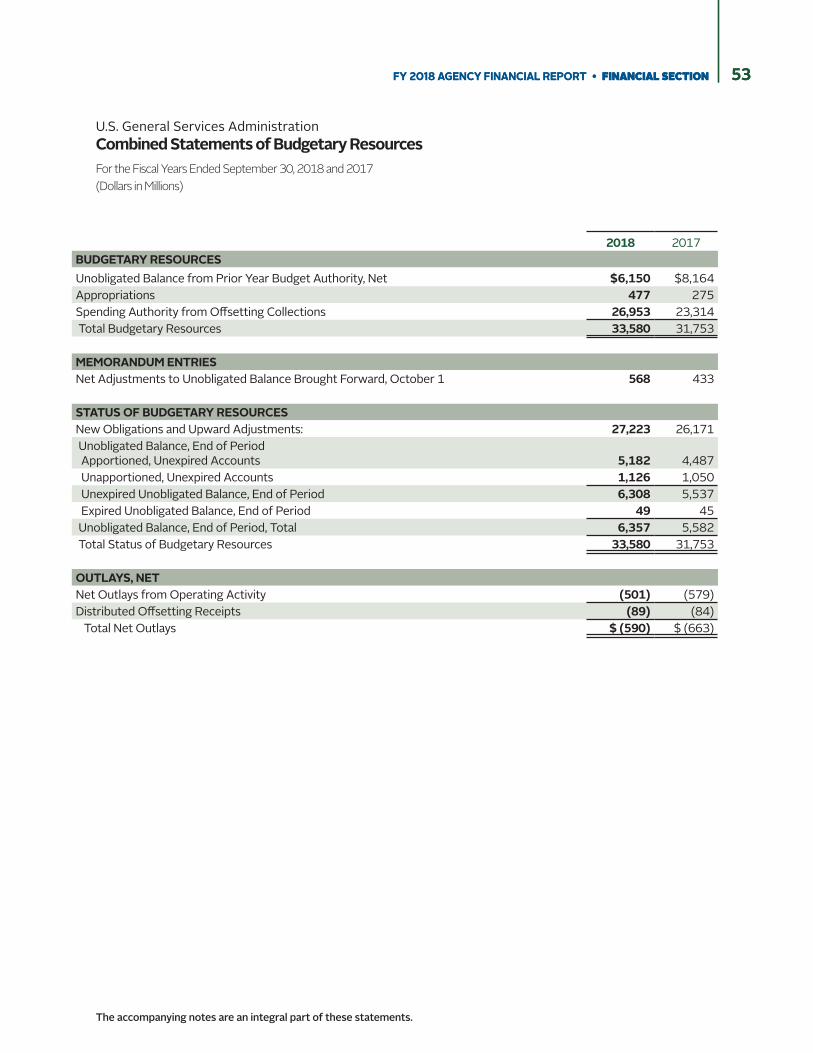
53FY 2018 AGENCY FINANCIAL REPORT • FINANCIAL SECTION 53FY 2018 AGENCY FINANCIAL REPORT • FINANCIAL SECTION
The accompanying notes are an integral part of these statements.
U.S. General Services AdministrationCombined Statements of Budgetary ResourcesFor the Fiscal Years Ended September 30, 2018 and 2017 (Dollars in Millions)
2018 2017BUDGETARY RESOURCESUnobligated Balance from Prior Year Budget Authority, Net $6,150 $8,164 Appropriations 477 275 Spending Authority from Offsetting Collections 26,953 23,314 Total Budgetary Resources 33,580 31,753
MEMORANDUM ENTRIESNet Adjustments to Unobligated Balance Brought Forward, October 1 568 433
STATUS OF BUDGETARY RESOURCESNew Obligations and Upward Adjustments: 27,223 26,171 Unobligated Balance, End of Period Apportioned, Unexpired Accounts 5,182 4,487 Unapportioned, Unexpired Accounts 1,126 1,050 Unexpired Unobligated Balance, End of Period 6,308 5,537 Expired Unobligated Balance, End of Period 49 45 Unobligated Balance, End of Period, Total 6,357 5,582 Total Status of Budgetary Resources 33,580 31,753
OUTLAYS, NETNet Outlays from Operating Activity (501) (579) Distributed Offsetting Receipts (89) (84) Total Net Outlays $ (590) $ (663)

FINANCIAL SECTION • FY 2018 AGENCY FINANCIAL REPORT54
NOTES TO THE FINANCIAL STATEMENTS(For the Fiscal Years Ended September 30, 2018 and 2017).
The General Services Administration (GSA) was created by the U.S. Federal Property and Administrative Services Act of 1949, as amended. Congress enacted this legislation to provide for the Federal Government an economic and efficient system for the procurement, and operation of buildings, procurement, and distribution of general supplies, acquisition and management of a motor vehicle fleet, management of automated data processing resources, and management of telecommunications programs.
The Administrator of GSA, appointed by the President of the United States with the advice and consent of the U.S. Senate, oversees the operations of GSA. GSA carries out its responsibilities through the operation of several appropriated and revolving funds.
1. Significant Accounting Policies
A. Reporting Entity
GSA presents comparative Consolidated and Consolidating Balance Sheets, Consolidated and Consolidating Statements of Net Cost, Consolidated and Consolidating Statements of Changes in Net Position, and Combined and Combining Statements of Budgetary Resources. The consolidating and combining formats display GSA’s two largest components: the FBF and the ASF. All other entities have been combined under Other Funds. In accordance with newly established SFFAS 47 Reporting Entity requirement to report disclosure entities and related parties, GSA conducted a thorough review of all our non-Federal relationships across all business lines. GSA concluded we have no relationships requiring disclosure as a reporting entity, disclosure entity, or related party entity.
The FBF is the primary fund used to record activities of PBS. The ASF is the primary fund used to record activities of the FAS.
GSA’s accompanying financial statements include the accounts of all funds that have been established and maintained to account for resources under the control of GSA management. The entities included in the Other Funds category are described below, together with a discussion of the different fund types.
Revolving Funds are accounts established by law to finance a continuing cycle of operations with receipts derived from such operations usually available in their entirety for use by the fund without further action by Congress. Both the FBF and the ASF are large revolving funds. The revolving funds in the Other Funds category consist of the following:
• Federal Citizen Services Fund (FCSF)
• Working Capital Fund (WCF)
General Funds are accounts used to record financial transactions arising under congressional appropriations or other authorizations to spend general revenues. GSA manages 23 General Funds. Six of these General Funds are funded by one year appropriations; nine by no-year appropriations; two by multi-year appropriation; one cannot incur new obligations; and five are budget clearing accounts that temporarily hold collections until a more appropriate fund can be determined. The General Funds included in the Other Funds category are as follows:
• Allowances and Office Staff for Former Presidents
• Asset Proceeds and Space Management Fund
• Budget Clearing Account – Broker Rebates

55FY 2018 AGENCY FINANCIAL REPORT • FINANCIAL SECTION
• Budget Clearing Account – Proceeds of Sales, Personal Property
• Budget Clearing Account – Real Property
• Budget Clearing Account – Suspense
• Budget Clearing Account – Undistributed Intragovernmental Payments
• Data Driven Innovation – Executive Office of the President (EOP) Child
• Civilian Board of Contract Appeals
• Environmental Review Improvement Fund
• Excess and Surplus Real and Related Personal Property Holding Account
• Expenses, Electronic Government Fund
• Expenses, Governmentwide Policy
• Expenses, Presidential Transition
• Pre-Election Presidential Transition
• Governmentwide Policy – Multi-Year
• Information Technology Oversight and Reform - EOP Child
• Expenses, OIG
• OIG – No-Year
• OIG – Recovery Act
• Operating Expenses, GSA
• Real Property Relocation
• Technology Modernization Fund (TMF)
Special and Trust Funds are accounts established for receipts dedicated by law for a specific purpose, but are not generated by a cycle of operations for which there is continuing authority to reuse such receipts. In accordance with FASAB SFFAS No. 43, Funds from Dedicated Collections: Amending Statement of Federal Financial Accounting Standards 27, Identifying and Reporting Earmarked Funds, these Special and Trust Funds are classified as funds from dedicated collections. GSA uses Special Fund receipts to pay certain costs associated with the disposal of surplus real property, for funding of the Transportation Audits program, and to fund the Acquisition Workforce Training program. GSA has one Trust Fund with authority to accept unconditional gifts of property in aid of any project or function within its jurisdiction. GSA’s Special and Trust Funds consist of the following:
• Expenses, Disposal of Real and Related Personal Property
• Expenses, Transportation Audits
• Expenses, Acquisition Workforce Training Fund
• Other Receipts, Surplus Real and Related Personal Property

FINANCIAL SECTION • FY 2018 AGENCY FINANCIAL REPORT56
• Receipts of Rent, Leases and Lease Payments for Government-Owned Real Property
• Receipts, Transportation Audits
• Receipts, Acquisition Workforce Training Fund
• Transfers of Surplus Real and Related Personal Property
• Unconditional Gifts of Real, Personal or Other Property
Miscellaneous Receipt and Deposit Funds are considered non-entity accounts since GSA management does not exercise control over how the monies in these accounts can be used. Miscellaneous Receipt Fund accounts hold receipts and accounts receivable resulting from miscellaneous activities of GSA where, by law, such monies may not be deposited into funds under GSA management control. The U.S. Department of the Treasury automatically transfers all cash balances in these receipt accounts to the General Fund of the U.S. Treasury at the end of each fiscal year. Deposit Fund accounts hold monies outside the budget. Accordingly, their transactions do not affect budget surplus or deficit.
These accounts include:
• Deposits received for which GSA is acting as an agent or custodian
• Unidentified remittances
• Monies withheld from payments for goods and services received, and
• Monies whose distribution awaits a legal determination or investigation.
The receipt and deposit funds in the Other Funds category consist of the following:
• Advances Without Orders from Non-Federal Sources
• GSA Child Care Deposits
• Fines, Penalties, and Forfeitures, Not Otherwise Classified
• Forfeitures of Unclaimed Money and Property
• General Fund Proprietary Interest, Not Otherwise Classified
• General Fund Proprietary Receipts, Not Otherwise Classified, All Other
• Other Earnings from Business Operations and Intragovernmental Revolving Funds
• Proceeds from Sale of Surplus Property
• Small Escrow Amounts
• Special and Trust Fund Proprietary Receipts Returned to the General Fund of the U.S. Treasury
• Withheld State and Local Taxes
GSA is able to delegate a portion of its funds for certain program and financial operations to other Federal agencies to execute on GSA’s behalf. Unique sub-accounts, also known as allocation accounts (child), of GSA funds (parent) are created in the U.S. Treasury to provide for the reporting of obligations and outlays incurred by such other agencies.

57FY 2018 AGENCY FINANCIAL REPORT • FINANCIAL SECTION
Generally, all child allocation account financial activity is reportable in combination with the results of the parent fund, from which the underlying legislative authority, appropriations and budget apportionments are derived. For FY 2018 and FY 2017, GSA’s FBF has an allocation account in this regard with the U.S. Department of Commerce. However, during FY 2018, all remaining balances of the Commerce allocation account were returned to the FBF and the allocation activity has been discontinued.
In addition, other agencies may delegate certain programs and financial operations to GSA to execute on their behalf. The GSA Data Driven Innovation Fund was established in FY 2015 as a child account to the EOP Data Driven Innovation Fund. The amount transferred to this child account supports an initiative to increase tax filings by potentially eligible Earned Income Tax Credit claimants. In accordance with OMB Circular No. A-136, Financial Reporting Requirements, agencies that receive allocation transfers from the EOP are to include such balances in their financial statements.
B. Basis of Accounting and Presentation
The principal financial statements are prepared from the books and records of GSA, in accordance with Generally Accepted Accounting Principles (GAAP) as promulgated by the Federal Accounting Standards Advisory Board (FASAB), and OMB Circular No. A-136, in all material respects. FASAB SFFAS No. 34, The Hierarchy of Generally Accepted Accounting Principles, including the Application of Standards Issued by the Federal Accounting Standards Board, established the hierarchy of GAAP for Federal financial statements. The Consolidated Statements of Net Cost present the operating results of the FBF, ASF and Other Fund functions, as well as GSA Consolidated operating results as a whole. The Consolidated Balance Sheets present the financial position of GSA using a format segregating intragovernmental balances. The Consolidated Statements of Changes in Net Position display the changes in Cumulative Results of Operations and Unexpended Appropriations. The Combined Statements of Budgetary Resources (CSBR) present the sources, status and uses of GSA budgetary resources.
Transactions are recorded on both an accrual and budgetary basis. Under the accrual method of accounting, revenues are recognized when earned and expenses are recognized when incurred without regard to receipt or payment of cash. Budgetary accounting principles, on the other hand, are designed to facilitate compliance with legal requirements and controls over the use of Federal funds.
GSA reconciles all intragovernmental fiduciary transaction activity and works with agency partners to reduce significant or material differences reported by other agencies in conformance with U.S. Treasury intragovernmental reporting guidelines and requirements of OMB Circular No. A-136.
On the Consolidated Statements of Net Cost, Consolidated Balance Sheets and Consolidated Statements of Changes in Net Position, all significant intra-agency balances and transactions have been eliminated in consolidation. On the Consolidated Statements of Net Cost, adjustments to eliminate GSAs intra-fund revenues and expenses are applied to reduce such balances of the activity providing services (seller) to the other GSA components. No such eliminations have been made on the CSBR.
On the Consolidating Statements of Net Cost, intra-GSA eliminations of revenue and expenses are displayed separately, and results of individual funds reflect the full amounts of such balances that flowed through those funds. Certain amounts of expenses eliminated on the Consolidating Statements of Net Cost are imputed costs for which the matching resource is not revenue on this statement, but imputed resources provided by others, displayed on the Consolidating Statements of Changes in Net Position. Accordingly, on the Consolidating Statements of Net Cost, the revenue and expense eliminations do not match. The Consolidating Statements of Changes in Net Position display the offsetting balances between these categories.
The preparation of financial statements requires management to make estimates and assumptions that affect the reported amounts of assets and liabilities and disclosure of contingent assets and liabilities at the date of the financial
FINANCIAL SECTION • FY 2018 AGENCY FINANCIAL REPORT58
statements and the reported amounts of revenues and expenses during the reporting period. Actual results may differ from those estimates. Operating expenses and related accounts payable accruals and estimates are recorded in the period goods or services are received.
Certain prior year balances have been reclassified to conform to the current year presentation.
C. Revenue Recognition and Appropriations Used
Substantially all revenues reported by GSA funds on the Consolidated Statements of Net Cost are generated from intragovernmental sales of goods and services, with only three percent of revenues earned from non-Federal customers for the years ended September 30, 2018, and 2017. Expenses are primarily incurred with non-Federal entities supplying the underlying goods and services being provided to GSA and its Federal customers. Each revolving fund has established rate-setting processes governed by the laws authorizing its activities. In most cases, the rates charged are intended to cover the full cost that GSA funds will pay for such goods and services and to provide capital maintenance. In accordance with the governing laws, rates are generally not designed to recover imputed costs not borne by GSA, but covered by other funds or entities of the U.S. Government, such as for post-employment and other inter-entity costs. As the amount of services provided to non-Federal customers is generally insignificant, maintaining separate rate structures for these customers to recover imputed costs is not warranted.
Generally, Revolving Fund and reimbursable General Fund revenue is recognized when goods have been delivered or services rendered.
In the FBF, rent revenues are earned based on occupancy agreements (OA) with customers, as space and services are provided. Generally, agencies housed in Government-owned buildings are billed based upon commercial rates for comparable space. Agencies housed in buildings leased by GSA are generally billed at rates to recover the cost of that space. In some instances, special rates are arranged in accordance with congressional guidance or other authorized purposes. Most agencies using funding from Trust Funds have rent rates set to recover full cost. For revenue under non-recurring reimbursable building R&A projects, GSA charges customers actual cost, and as a result, revenues are generally earned to match costs incurred.
In the ASF, GS&S revenues are recognized when goods are provided to customers. In the TTL portfolio, vehicle acquisition revenues are recognized when goods are provided. Vehicle leasing revenues are recognized based on rental arrangements over the period vehicles are dispatched. AAS revenues are recognized when goods or services are provided, and fee revenues in the GSA Schedules programs are earned based on estimated and actual usage of GSA contracting vehicles by other agencies. The Schedules programs generated $179 million in fees, constituting one percent of ASF revenues in FY 2018, and $255 million in fees, two percent of ASF revenues, in FY 2017. Information Technology revenues are earned when goods or services are provided or as reimbursable project costs are incurred. Telecommunications service revenues are generally recognized based on customer usage or on fixed line rates.
The WCF charges fees based on a fee schedule established through an annual rate setting process performed collaboratively with our customers. The rate-setting process is generally designed to provide revenues sufficient to match the spending that will be incurred for the goods, services, and resources provided to customers. The rate-setting process also provides information to customers to assist in their resource management.
Non-Exchange Revenues are recognized on an accrual basis on the Consolidated Statements of Changes in Net Position for sales of surplus real property, reimbursements due from the audit of payments to transportation carriers, and other miscellaneous items resulting from GSA operations where ultimate collections must be deposited in miscellaneous receipt accounts of the U.S. Treasury.
Appropriations for General Fund activities are recorded as a financing source on the Consolidated Statements of Changes in Net Position when expended. Unexpended appropriations are reported as an element of Net Position on the Consolidated Balance Sheets..

59FY 2018 AGENCY FINANCIAL REPORT • FINANCIAL SECTION
D. Fund Balance with Treasury (See Note 2)
This total represents all unexpended balances for GSA accounts with the U.S Treasury. Substantially all balances of FBwT are available to GSA management to execute the authorities provided by its funds. In the following instances, authorities limit use of collections to dedicated purposes.
GSA acts as a disposal agent for surplus Federal real and personal property. In some cases, public law entitles the owning agency to the sales proceeds, net of disposal expenses incurred by GSA. Proceeds from the disposal of equipment are generally retained by GSA to replace equipment. Under GSA legislative authorities, the gross proceeds from some sales are deposited in GSA Special Fund receipt accounts and recorded as Non-Exchange Revenues in the Consolidated Statements of Changes in Net Position. A portion of these proceeds is subsequently transferred to a Special Fund to finance expenses incurred in disposing of surplus real property. The remainder is periodically accumulated and transferred, by law, to the Land and Water Conservation Fund administered by the U.S. Department of the Interior (DOI).
E. Inventories (See Note 18)
Inventories held for sale to other Federal agencies consist primarily of ASF inventories valued at historical cost, generally determined on a moving average basis. The recorded values are adjusted for the results of physical inventories taken periodically in accordance with a cyclical counting plan. In the ASF, an inconsequential amount of the balances in inventories held for sale are excess inventories. Excess inventories are defined as those exceeding the economic retention limit (i.e., the number of units of stock that may be held in inventory without incurring excessive carrying costs). Excess inventories are generally transferred to another Federal agency, sold, or donated to state or local governments.
F. Property and Equipment (See Note 6)
Generally, property and equipment purchases of $10,000 or more, having a useful life of two or more years, are capitalized and valued at cost. Property and equipment transferred to GSA from other Federal agencies on the date GSA was established is stated at the transfer value, which approximates historical cost. Subsequent thereto, equipment transferred to GSA is stated at net book value and surplus real and related personal property transferred to GSA is stated at the lower of net book value or appraised value.
Expenditures for major additions, replacements and alterations to real property of $50,000 or more are capitalized. Normal repair and maintenance costs are expensed as incurred. The cost of R&A and leasehold improvements performed by GSA, but financed by other agencies, is not capitalized in GSA financial statements as such amounts are transferred to the other agencies upon completion of the project. The majority of all land, buildings and leasehold improvements are leased to other Federal agencies under short-term cancellable agreements.
Depreciation and amortization of property and equipment are calculated on a straight-line basis over their initial or remaining useful lives. Leasehold Improvements are amortized over the lesser of their useful lives, generally five years, or the unexpired lease term. It is GSA policy to reclassify capitalized costs of construction in process into the Buildings accounts upon project completion. Buildings acquired through purchase, construction, or under captial lease agreements are depreciated over 30 years. Major and minor building renovation projects carry estimated useful lives of 20 years and 10 years, respectively.
Most of the assets comprising Other Equipment are used internally by GSA and are depreciated over periods generally ranging from three to 10 years.
GSA maintains a fleet of Motor Vehicles for rental to other Federal agencies to meet their operational needs, with monthly billings rendered to recover program costs. The various vehicle types are depreciated over a general range of four to 12 years.

FINANCIAL SECTION • FY 2018 AGENCY FINANCIAL REPORT60
In accordance with FASAB SFFAS No. 10, Accounting for Internal Use Software, capitalization of software development costs incurred for systems having a useful life of two years or more is required. With implementation of this standard, GSA adopted minimum dollar thresholds per system that would be required before capitalization would be warranted. For the FBF, this minimum threshold is $1 million. For all other funds, it is $250,000. Once completed, software applications are depreciated over an estimated useful life determined on a case-by-case basis, ranging from three to ten years. Capitalized software is reported as an element of Other Equipment on the Consolidated Balance Sheets.
G. Annual, Sick and Other Types of Leave
Annual leave liability is accrued as it is earned and the accrual is reduced as leave is taken. Each year the balance in the accrued annual leave account is adjusted to reflect current pay rates.
Sick leave and other types of non-vested leave are expensed as taken.
2. Fund Balance with Treasury (FBwT)
A. Reconciliation to U.S. Treasury
There were no material differences between amounts reported by GSA and those reported to the U.S. Treasury as of September 30, 2018, and 2017
B. Relationship to the Budget
In accordance with SFFAS No. 1, Accounting for Selected Assets and Liabilities, the following information is provided to further identify amounts in FBwT as of September 30, 2018, and 2017, against which obligations have been made, and for unobligated balances, to identify amounts available for future expenditures and those only available to liquidate prior obligations. In the FBF, amounts of FBwT shown below as Unobligated Balance – Unavailable include a combination of the amounts reported on the CSBR as Resources Temporarily Unavailable and Unobligated Balance Not Available. Also, in two instances, the portion of FBwT presented below as unobligated balances will not equal related amounts reported on the CSBR. In the FBF, the CSBR unobligated balances include resources associated with borrowing authority for which actual funds have not yet been realized. In the Other Funds group, the schedule below includes amounts displayed as unavailable unobligated balances for the FBwT held in Special Receipt, Clearing, and Deposit Funds, which are not reportable for purposes of the CSBR. The following schedule presents elements of the FBwT (dollars in millions):
Obligated Unobligated Balance Non- Budgetary
FBwT Total1Balance, Net 2Available UnavailableFY 2018FBF $47 $4,411 $6,240 $- $10,698ASF (89) 573 362 - 846Other Funds 301 171 155 157 784Total $259 $5,155 $6,757 $157 $12,328FY 2017FBF $305 $4,750 $4,642 $- $9,697ASF 351 (344) 934 - 941Other Funds 340 76 146 190 752Total $996 $4,482 $5,722 $190 $11,390
1. Negative amounts in Obligated Net Balance are the result of Uncollected Customer Payments exceeding Unpaid Obligations.
2. The FY17 ASF Unobligated Balance Available is negative because the apportionment for Category B Flow-through activity was exceeded in FY17.
61FY 2018 AGENCY FINANCIAL REPORT • FINANCIAL SECTION
C. Availability of Funds
Included in GSA’s FBwT are dedicated collections from Special Receipt Funds that may be transferred to either the U.S. Treasury, or the Land and Water Conservation Fund (see Note 1-D). These amounts, related to the Transportation Audits program, Acquisition Workforce Training program and surplus real property disposals, are subject to transfer upon GSA’s determination of the internal working capital needs of these programs. The FBwT in these funds totaled $107 million and $110 million at September 30, 2018, and 2017, respectively, of which $20 million and $26 million, respectively, were recorded as liabilities in the Consolidated Balance Sheets. In FY 2018 and FY 2017, $2 million and $1 million, respectively, of unused funds from expired appropriations were returned to the U.S. Treasury as of September 30. Such balances are excluded from the amount reported as FBwT in accordance with U.S. Treasury guidelines. A portion of FBwT also includes amounts where authority to incur new obligations has expired, but the funds are available to liquidate residual obligations that originated when the funds were available. Such expired balances totaled $48 million and $45 million at September 30, 2018, and 2017, respectively. The FBF has balances that are temporarily not available in accordance with annual appropriation acts that limit the amount of reimbursable resources that are available for spending each year. Such amounts totaled $5,582 million and $4,658 million at September 30, 2018, and 2017, respectively and will not be available for expenditure except as authorized in future appropriation acts.
Under ASF legislative authorities, GSA is permitted to retain earnings to ensure the fund has sufficient resources to support operations in association with a cost and capital planning process as approved by the Administrator of GSA. The ASF returned $68 million of funds to the U.S. Treasury in FY 2017. All ASF Cumulative Results of Operations at the end of FY 2018 are being retained in accordance with the cost and capital plan to meet program needs. Cumulative Results of Operations in the ASF have been used for activities such as to cover discontinued operations and investments in Governmentwide software applications to include the System for Award Management (SAM) and the Common Acquisition Platform.
3. Non-Entity AssetsAs of September 30, 2018, and 2017, certain amounts reported on the Consolidated Balance Sheets are elements of Budget Clearing, Deposit, and Miscellaneous Receipt Funds, which are not available to management for use in ongoing operations and are classified as Non-entity assets (see Note 1-A). The only substantial balances of non-entity assets were Fund Balance with Treasury, which totaled $50 million and $80 million, as of September 30, 2018, and 2017, respectively.
4. Accounts and Notes Receivable, NetSubstantially all accounts receivable are from other Federal agencies, with only 4.6 and 6.1 percent due from non-Federal customers as of September 30, 2018, and 2017, respectively. Unbilled accounts receivable result from the delivery of goods or performance of services for which bills have not yet been rendered. Additionally, TMF transfers to other Federal Agencies are recorded as accounts receivable, as legislation requires transferred funds to be repaid to the TMF. Allowances for doubtful accounts are recorded using aging methodologies based on analysis of historical collections and write-offs. In addition to accounts receivable balances displayed below, GSA has an inconsequential balance of notes receivable, net of allowances for doubtful accounts. In accordance with FASAB SFFAS No. 1, GSA does not recognize interest receivable or allowance related to notes deemed uncollectible. As of September 30, 2018, and 2017, accumulated unrecognized interest on all notes deemed uncollectible totaled $212 million and $186 million, respectively. A summary of Accounts Receivable as of September 30, 2018, and 2017, is as follows (dollars in millions):

FINANCIAL SECTION • FY 2018 AGENCY FINANCIAL REPORT62
FBF ASFOTHERFUNDS
LESS:INTRA-GSA
ELIMINATIONS
GSACONSOLIDATED
TOTALS2018 2017 2018 2017 2018 2017 2018 2017 2018 2017
Accounts Receivable - Billed $190 $115 $161 $97 $20 $15 $- $- $371 $227Accounts Receivable - Unbilled 313 428 2,469 1,991 13 2 38 48 2,757 2,373Allowance for Doubtful Accounts (6) (16) (3) (11) (3) (1) - - (12) (28)Total Accounts Receivable, Net $497 $527 $2,627 $2,077 $30 $16 $38 $48 $3,116 $2,572
5. Other AssetsAs of September 30, 2018, and 2017, Other Assets were comprised of the following balances (dollars in millions):
FBF ASF
GSACONSOLIDATED
TOTALS2018 2017 2018 2017 2018 2017
Surplus Property Held for Sale $36 $45 $22 $27 $58 $72Unamortized Deferred Charges and Prepayments(non-Federal) 111 95 - - 111 95Intangible Assets - - 19 22 19 22Miscellaneous 12 14 - - 12 14Total Other Assets $159 $154 $41 $49 $200 $203

63FY 2018 AGENCY FINANCIAL REPORT • FINANCIAL SECTION
6. Property and Equipment, Net
A. Summary of Balances
Balances in GSA Property and Equipment accounts subject to depreciation as of September 30, 2018, and 2017, are summarized below (dollars in millions):
B. Environmental and Disposal Liabilities
Environmental and Disposal Liabilities represent cleanup costs associated with removing, containing, and disposing of (1) hazardous waste from property; (2) material and property that consists of hazardous waste at permanent or temporary closure, or shutdown of associated plant, property and equipment (PP&E) (i.e. asset retirement and equipment disposal); or (3) asbestos. Cleanup costs may include characterization, decontamination, decommissioning, restoration, monitoring, closure, post closure, future surveys, studies and assessments on the environmental site. Cleanup costs also may include compensation and benefits of human resources devoting a significant amount of time directly to the remediation effort.
In accordance with guidance issued by FASAB, SFFAS No. 5, Accounting for Liabilities of the Federal Government and SFFAS No. 6, Accounting for Property, Plant, and Equipment, Federal Financial Accounting and Auditing Technical Release No. 2, Determining Probable and Reasonably Estimable for Environmental Liabilities in the Federal Government, GSA is required to recognize a liability for environmental related cleanup costs resulting from past transactions or events and when a future outflow or other sacrifice of resources is probable and reasonably estimable. GSA’s FBF assesses the likelihood of required cleanup for PP&E, including land acquired for or in connection with other PP&E, used in providing goods or services. If the likelihood of required cleanup is probable and the cost can be reasonably estimated, a liability is recorded in the financial statements, if the likelihood is probable but not reasonably estimated or reasonably possible, the costs of cleanup are disclosed in the notes to the financial statements; and if the likelihood is remote, no liability or estimate is recorded or disclosed.
2018 2017
CostAccumulatedDepreciation
NetBook Value Cost
AccumulatedDepreciation
NetBook Value
Buildings: FBF $47,518 $27,791 $19,727 $46,273 $26,238 $20,035Leasehold Improvements: FBF 269 242 27 300 259 41 ASF 33 27 6 31 25 6 Other Funds 4 2 2 3 1 2Total Leasehold Improvements 306 271 35 334 285 49Motor Vehicles: ASF 6,022 2,119 3,903 5,751 2,031 3,720Other Equipment: FBF 167 149 18 176 149 27 ASF 387 352 35 378 339 39 Other Funds 168 148 20 163 138 25Total Other Equipment 722 649 73 717 626 91
Total, Depreciable Property & Equipment $54,568 $30,830 $23,738 $53,075 $29,180 $23,895

FINANCIAL SECTION • FY 2018 AGENCY FINANCIAL REPORT64
Environmental related cleanup costs include liabilities covered by current budgetary resources and liabilities not covered by current budgetary resources known as future funded expenses.
Cleanup of such hazards is governed by various Federal and state laws. The laws most applicable to GSA are the Comprehensive Environmental Response Compensation and Liability Act of 1980, the Asbestos Hazard Emergency Response Act, and the Resource Conservation and Recovery Act. Various state, local laws and regulations are also applicable.
GSA’s FBF recognized $1.871 billion and $1.823 billion for Environmental and Disposal Liabilities as of September 30, 2018, and 2017, respectively, for properties currently in GSA’s inventory. Included in this balance are the current estimates for potential future cleanup costs associated with: release of hazardous substances (into the environment) at properties where GSA is legally responsible for cleanup; asbestos liabilities (e.g., abatement); and non-asbestos liabilities (e.g., lead abatement) associated with PP&E at asset retirement or disposal (dollars in millions).
C. Environmental Liabilities: External Releases to the Environment
PBS reported a total estimated environmental liability (releases to the environment) of $148 million for FY 2018. This is a decrease from $156 million reported in FY 2017. The decrease is attributable to remediation efforts along with cost re-estimations for environmental services (e.g., remediation activities) and adjustments to the scope of services for projects managed by PBS. PBS’ environmental remediation projects range from the cleanup of hazardous substances (chemical solvents, toxic metals, polychlorinated biphenyls) and petroleum released into the soil and groundwater to complex, long-term remediation of former Department of Defense sites (munitions manufacturing and stockpile centers). GSA’s PBS does not have any sites identified as probable but not reasonably estimable regarding cleanup costs. As of September 30, 2018 and 2017, GSA's FBF had $21.3 million and $172 million, respectively, for ‘reasonably possible’ cleanup costs. This decrease is attributable to the transfer to a non-Federal entity, of the Bannister Federal Complex in Kansas City, MO.
D. Asbestos Liabilities
In accordance with FASAB Technical Bulletin 2006-1, Recognition and Measurement of Asbestos-Related Cleanup Costs, the focus is to recognize an unfunded liability and related expenses for asbestos related cleanup costs where it is both probable and reasonably estimable for Federal entities that own tangible property, plant and equipment containing asbestos.
GSA’s methodology for developing estimated future asbestos liability involved selection of asbestos abatement survey reports performed by third party contractors, independent from GSA, to develop an average cost factor. The average cost factor from these asbestos survey reports is applied to GSA’s total square feet of applicable inventory in order to determine the total estimated asbestos liability.
In accordance with Technical Bulletin 2006-1, GSA recognizes cleanup costs, over the estimated life of the underlying assets. The building useful life of 30 years is used for purposes of recognizing and amortizing the long term estimated asbestos cleanup costs. During FY 2018, changes to GSA’s total estimated liability consisted of cost re-estimates, inflation and amortization of remaining future year costs.
2018 2017
Environmental Liabilities (external releases to the environment) $148 $156 Asbestos Liabilities 1,458 1,438PP&E: Non-asbestos Liabilities 265 229
Total Environmental and Disposal Liabilities (amortized) $1,871 $1,823
65FY 2018 AGENCY FINANCIAL REPORT • FINANCIAL SECTION
The amortized asbestos related liabilities reported for FY 2018 are $1.5 billion which is an increase from FY 2017 of $1.4 billion. The increase is due to changes in asbestos liability cost factor based upon updated asbestos abatement survey reports provided by third party contractors and changes in building inventory. The unamortized asbestos liabilities for FY 2018 compared to FY 2017 are $10.3 million and $13.6 million, respectively.
E. Property Plant & Equipment: Non-Asbestos Liabilities
GSA reports cleanup costs associated with PP&E that consist of removal of hazardous waste at asset retirement or related to equipment disposal in the financial statements under PP&E - non-asbestos liabilities. GSA’s methodology for estimating non-asbestos related liabilities captures the cost of remediating certain hazards, such as, but not limited to, lead based paint and polychlorinated biphenyls.
GSA’s methodology uses actual cost data from major renovation projects and cost estimates from independent third party environmental surveys, to develop average cost factors for PP&E non-asbestos remediation. These average cost factors are applied to GSA’s total square feet of applicable inventory in order to determine the total estimated non-asbestos liability. For FY 2018, the amortized PP&E non-asbestos related liabilities are $265 million compared to FY 2017 of $229 million. The increase is due to changes in non-asbestos liability cost factors based upon updated project and building surveys’ cost estimate data. The unamortized PP&E non-asbestos liabilities for FY 2018 compared to FY 2017 are $43.6 million and $39.4 million, respectively.
F. Heritage Assets
The average age of GSA buildings is 49 years old; therefore, many buildings have historical, cultural and/or architectural significance. While GSA uses these buildings to meet the office space and other needs of the Federal Government, maintaining and preserving these historical elements is a significant priority. In accordance with FASAB SFFAS No. 29, Heritage Assets and Stewardship Land, these buildings meet the definition of Multi-use Heritage Assets, and are reportable within Property and Equipment on the Consolidated Balance Sheets. Deferred maintenance and repairs related to GSA’s heritage assets are separately disclosed in the required supplementary information.
GSA defines its Historic Buildings as those buildings that are either listed on the National Register of Historic Places, have formally been determined eligible, or appear to meet eligibility criteria to be listed. In FY2018 GSA has 504 buildings on the National Register, up from 416 at the end of FY 2017, of which 76 are designated as National Historic Landmarks. An additional 93 buildings are potentially eligible for listing on the National Register, but have not gone through the formal listing process. Under the National Historic Preservation Act, GSA is required to give these buildings special consideration, including first preference for Federal use and rehabilitation in accordance with standards established by the DOI.
GSA also has a collection of artworks with historical significance, maintained for display in Federal buildings to increase the cultural and aesthetic quality of the buildings for visitors and workers.
7. Workers’ Compensation BenefitsThe Federal Employees’ Compensation Act (FECA) provides wage replacement and medical cost protection to covered Federal civilian employees injured on the job, incurred a work-related occupational disease, or beneficiaries of employees whose death is attributable to a job-related injury or occupational disease. The FECA program is administered by the U.S. Department of Labor (DOL), which initially pays valid claims and subsequently seeks reimbursement from the Federal agencies employing the claimants. DOL provides the actuarial liability for claims outstanding at the end of each fiscal year. This liability includes the estimated future costs of death benefits, workers’ wage replacement, and medical and miscellaneous costs for approved compensation cases.
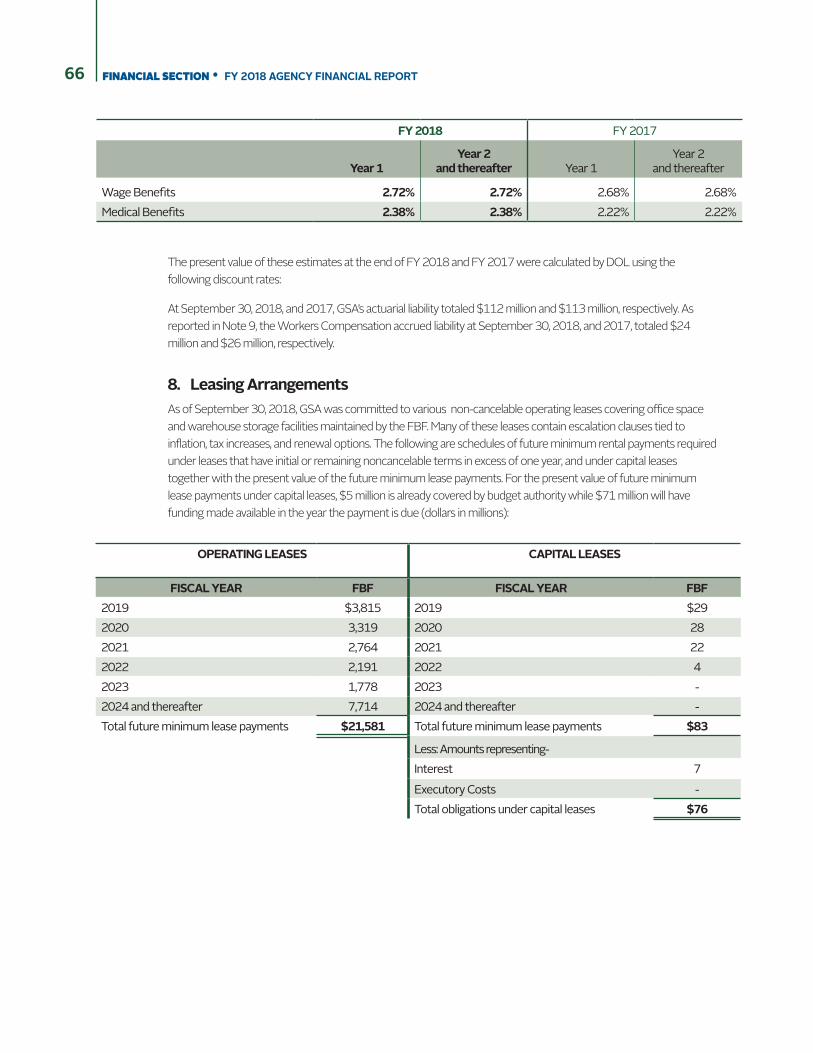
FINANCIAL SECTION • FY 2018 AGENCY FINANCIAL REPORT66
The present value of these estimates at the end of FY 2018 and FY 2017 were calculated by DOL using the following discount rates:
At September 30, 2018, and 2017, GSA’s actuarial liability totaled $112 million and $113 million, respectively. As reported in Note 9, the Workers Compensation accrued liability at September 30, 2018, and 2017, totaled $24 million and $26 million, respectively.
8. Leasing ArrangementsAs of September 30, 2018, GSA was committed to various non-cancelable operating leases covering office space and warehouse storage facilities maintained by the FBF. Many of these leases contain escalation clauses tied to inflation, tax increases, and renewal options. The following are schedules of future minimum rental payments required under leases that have initial or remaining noncancelable terms in excess of one year, and under capital leases together with the present value of the future minimum lease payments. For the present value of future minimum lease payments under capital leases, $5 million is already covered by budget authority while $71 million will have funding made available in the year the payment is due (dollars in millions):
FY 2018 FY 2017
Year 1Year 2
and thereafter Year 1Year 2
and thereafter
Wage Benefits 2.72% 2.72% 2.68% 2.68%Medical Benefits 2.38% 2.38% 2.22% 2.22%
OPERATING LEASES CAPITAL LEASES
FISCAL YEAR FBF FISCAL YEAR FBF2019 $3,815 2019 $292020 3,319 2020 282021 2,764 2021 222022 2,191 2022 42023 1,778 2023 -2024 and thereafter 7,714 2024 and thereafter -Total future minimum lease payments $21,581 Total future minimum lease payments $83
Less: Amounts representing-Interest 7Executory Costs -Total obligations under capital leases $76

67FY 2018 AGENCY FINANCIAL REPORT • FINANCIAL SECTION
Substantially all leased and owned space maintained by the FBF is sublet to other Federal agencies at rent charges to recover GSA’s cost of that space, or commercial equivalent charges. The majority of agreements covering these arrangements allow customer agencies to terminate the agreement with four months’ notice, any time after the first 16 months of the agreement term. In some instances, agreements with customers may include non-cancellation clauses or restricted clauses that limit the ability to cancel prior to the agreement’s expiration date. Customer agencies may also enter into a supplemental occupancy agreement with the ASF’s Total Workplace program. This program assists customers with right-sizing their operations to improve space utilization, reduce the real estate footprint, and increase workplace efficiency while minimizing initial capital investments for items such as furniture and information technology equipment. Base terms generally have a duration of 30 months for furniture and 18 months for IT equipment with a renewal option. Agreements may be canceled with four months’ notice; however, the customer is still liable for the remaining term payments on the leased equipment. GSA believes that these agreements will also continue without interruption. The following is a schedule displaying the future minimum rental revenues due to GSA for all non-cancellable and restricted clause agreements with terms in excess of one year (dollars in millions):
For four of GSA’s buildings, the rental agreements with the customer include transfer of building ownership at the end of the rental term. Total Workplace currently has eight agreements classified as direct financing capital leases where the furniture and IT equipment will transfer to the lessee at the end of the lease term. The remaining minimum rental payments due from these agreements are as follows (dollars in millions):
Rental income under subleasing agreements and related reimbursable arrangements for tenant improvements and above standard service requirements approximated $6.4 billion and $6.6 billion for the years ended September 30, 2018, and 2017, respectively. The vast majority of the $6.4 billion in FY 2018 rental income comes from Federal sources while only $32 million is from outleases to non federal entities. Rent expense under all operating leases,
DIRECT FINANCING LEASE REVENUESFISCAL YEAR FBF ASF TOTAL2019 $8 $10 $182020 8 1 92021 4 1 52022 4 - 42023 4 - 42024 and thereafter 17 - 17
Total future minimum lease rentals $45 $12 $57
OPERATING LEASE REVENUESFISCAL YEAR FBF ASF TOTAL2019 $1,634 $7 $1,6412020 1,364 4 1,3682021 1,242 2 1,2442022 1,028 1 1,0292023 915 - 9152024 and thereafter 5,842 - 5,842Total future minimumlease receipts $12,025 $14 $12,039

FINANCIAL SECTION • FY 2018 AGENCY FINANCIAL REPORT68
including short-term non-cancellable leases, was approximately $5.8 billion for both years ended September 30, 2018, and 2017. Of the $5.8 billion in FY 2018 rent expense, only $24 million was paid to other Federal agency lessees with the remaining expense being paid to non federal entities.. The Consolidated Balance Sheets as of September 30, 2018, and 2017, include capital lease assets of $383 million and $383 million for buildings, respectively and accumulated amortization on such structures of $330 million and $328 million, respectively. For substantially all of its leased property, GSA expects that in the normal course of business such leases will be either renewed or replaced in accordance with the needs of its customer agencies.
9. Other LiabilitiesAs of September 30, 2018 and 2017, the amounts reported on the Consolidated Balance Sheets as Other Intragovernmental Liabilities and Other Liabilities, are substantially long-term in nature, with the exception of Federal Benefit Withholdings, Salaries and Benefits Payable, and Deposits in Clearing Funds, which are current liabilities. Other Intragovernmental Liabilities and Other Liabilities consisted of the following (dollars in millions)
FBF ASF OTHER FUNDS
GSA CONSOLIDATED
TOTALS
2018 2017 2018 2017 2018 2017 2018 2017
OTHER INTRAGOVERNMENTAL LIABILITIESWorkers' Compensation Due to DOL $16 $17 $5 $6 $3 $3 $24 $26Federal Benefit Withholdings 6 6 4 3 4 3 14 12Deposits in Clearing Funds - - - - 34 50 34 50 Total Other Intragovernmental Liabilities 22 23 9 9 41 56 72 88
OTHER LIABILITIES
Salaries and Benefits Payable 21 23 14 14 12 14 47 51Deferred Revenues/Advances from the Public 14 17 - 1 - - 14 18Lease Termination Liability (Note 18) - - 8 8 - - 8 8Contingencies 1 1 - - - - 1 1Pensions for Former Presidents - - - - 13 12 13 12Total Other Liabilities $36 $41 $22 $23 $25 $26 $83 $90

69FY 2018 AGENCY FINANCIAL REPORT • FINANCIAL SECTION
10. Commitments and Contingencies
A. Commitments and Undelivered Orders
In addition to future lease commitments discussed in Note 8, GSA is committed under obligations for goods and services that have been ordered but not yet received (undelivered orders) at fiscal year-end. Aggregate undelivered orders for all GSA activities at September 30, 2018, and 2017, are as follows (dollars in millions):
B. Contingencies
GSA is a party in various administrative proceedings, legal actions, environmental suits and claims brought by or against the agency. In the opinion of GSA management and legal counsel, the ultimate resolution of these proceedings, actions and claims will not materially affect the financial position or results of operations of GSA, FBF, or ASF, and the Other Funds. Based on the nature of each claim, resources available to liquidate these liabilities may be from GSA funds or, in some instances, are covered by the U.S. Treasury Judgment Fund, as discussed below.
In many cases, legal matters that directly involve GSA relate to contractual arrangements GSA entered into either for property or services it has obtained or procured on behalf of other Federal agencies. The costs of administering, litigating and resolving these actions are generally borne by GSA unless it can recover the cost from another Federal agency. Certain legal matters in which GSA may be a named party are administered and, in some instances, litigated by other Federal agencies. Amounts to be paid under any decision, settlement or award pertaining thereto are sometimes funded by those agencies.
No amounts have been accrued in the financial records for claims where the amount of probable loss cannot be estimated or the likelihood of an unfavorable outcome is less than probable. These matters arise in the course of carrying out GSA programs and operations, including contracting actions, operating carbon-fueled vehicles, owning and leasing buildings and facilities for other Federal agencies and related claims. Matters for which the likelihood of an unfavorable outcome is less than probable but more than remote involve a wide variety of allegations and claims.
C. Probable Contingencies covered by GSA
As of September 30, 2018, and 2017, the FBF recorded liabilities in total of $1 million each year for pending and threatened legal matters for which, in the opinion of GSA management and legal counsel, a loss against the FBF is probable, and the amount of the loss can be estimated.
D. Reasonably Possible Contingencies covered by GSA
GSA has contingencies where it is reasonably possible, but not probable, that GSA funds will incur some cost. Accordingly, no balances have been recorded in the financial statements for these contingencies. The ranges of reasonably possible losses for claims to be paid by GSA are as follows (dollars in millions):
2018 2017Federal Non-Federal Paid Unpaid Total
FBF $190 $3,220 $135 $3,275 $3,410 $3,264 ASF 259 6,975 26 7,208 7,234 6,089 Other Funds 119 134 1 252 253 280 Total Undelivered Orders $568 $10,329 $162 $10,735 $10,897 $9,633

FINANCIAL SECTION • FY 2018 AGENCY FINANCIAL REPORT70
E. Probable Contingencies not covered by GSA
In many cases, tort and environmental claims are administered and resolved by the U.S. Department of Justice, and any amounts necessary for resolution are obtained from a special Judgment Fund maintained by the U.S. Treasury. In accordance with the FASAB’s Interpretation No. 2, Accounting for Treasury Judgment Fund Transactions, costs incurred by the Federal Government are to be reported by the agency responsible for incurring the liability, or to which liability has been assigned, regardless of the ultimate source of funding. In accordance with this interpretation, as of September 30, 2018, and 2017, GSA’s Other Funds recorded $136 million and $99 million, respectively, of Environmental and Disposal Liabilities for contingencies that will require funding exclusively through the Judgment Fund. Substantially all of those amounts result from several environmental cases outstanding at the end of FYs 2018 and 2017, where GSA has been named as a potentially responsible party. Environmental costs are estimated in accordance with the FASAB Accounting and Auditing Policy Committee’s Federal Financial Accounting and Auditing Technical Release No. 2, Determining Probable and Reasonably Estimable for Environmental Liabilities in the Federal Government.
The recognition of claims to be funded through the Judgment Fund on GSA Consolidated Statements of Net Cost and Consolidated Balance Sheets is, in effect, recognition of these liabilities against the Federal Government as a whole, and should not be interpreted as claims against the assets or resources of any GSA fund, nor will any future resources of GSA be required to liquidate any resulting losses. Further, for most environmental claims, GSA has no managerial responsibility other than as custodian and successor on claims made against former Federal entities, particularly former World War II defense related activities.
F. Reasonably Possible Contingencies not covered by GSA
The ranges for contingencies subject to ultimate funding from the Judgment Fund where the risk of loss is reasonably possible, but not probable, are as follows (dollars in millions):
G. Judgment Fund Payments
In 1956, Congress enacted the Judgment Fund as a permanent, indefinite appropriation for the payment of claims that did not have another source of funding. This resulted in prompter payments that reduced the interest that
2018 2017Low High Low High
FBF $13 $188 $4 $169ASF 1 2 - 4Other Funds - 28 - 28 Total Reasonably Possible Range of Loss for Claims to be Paid by GSA $14 $218 $4 $201
2018 2017Low High Low High
FBF $69 $102 $69 $100ASF - - - 90Other Funds 125 247 125 168Total Reasonably Possible Range of Loss for Claims to be Paid by the U.S. Treasury Judgment Fund $194 $349 $194 $358
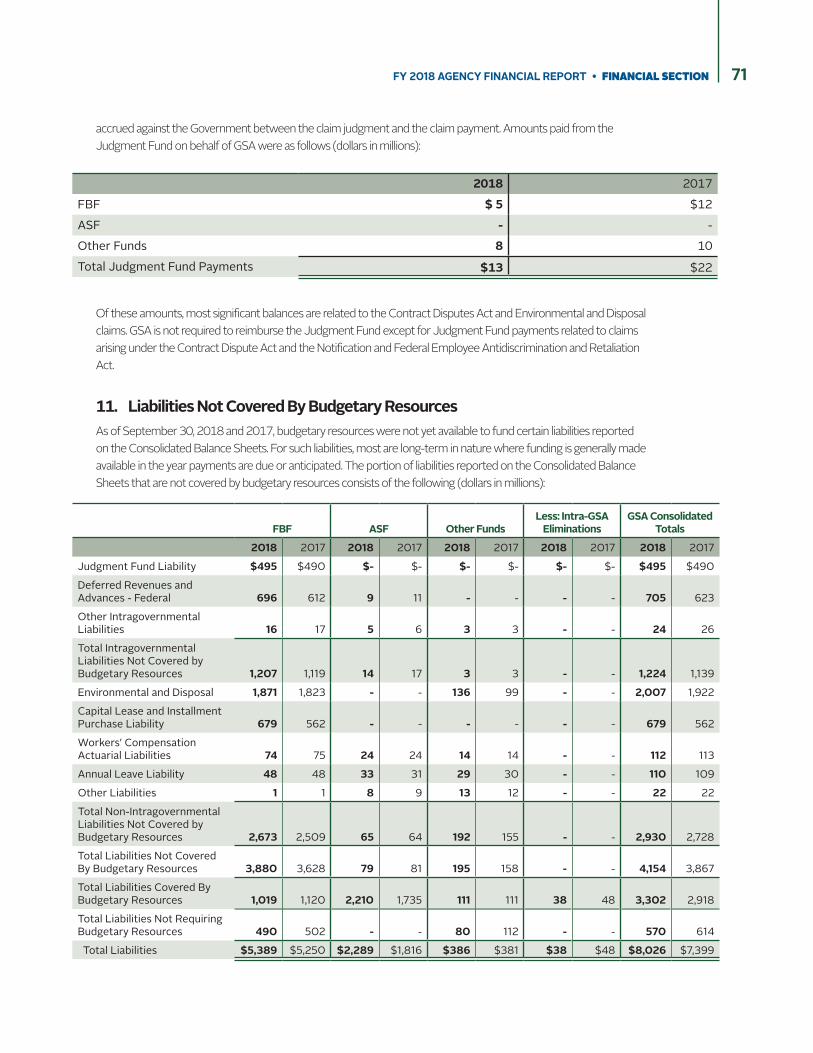
71FY 2018 AGENCY FINANCIAL REPORT • FINANCIAL SECTION
2018 2017FBF $ 5 $12ASF - -Other Funds 8 10Total Judgment Fund Payments $13 $22
accrued against the Government between the claim judgment and the claim payment. Amounts paid from the Judgment Fund on behalf of GSA were as follows (dollars in millions):
Of these amounts, most significant balances are related to the Contract Disputes Act and Environmental and Disposal claims. GSA is not required to reimburse the Judgment Fund except for Judgment Fund payments related to claims arising under the Contract Dispute Act and the Notification and Federal Employee Antidiscrimination and Retaliation Act.
11. Liabilities Not Covered By Budgetary ResourcesAs of September 30, 2018 and 2017, budgetary resources were not yet available to fund certain liabilities reported on the Consolidated Balance Sheets. For such liabilities, most are long-term in nature where funding is generally made available in the year payments are due or anticipated. The portion of liabilities reported on the Consolidated Balance Sheets that are not covered by budgetary resources consists of the following (dollars in millions):
FBF ASF Other FundsLess: Intra-GSA
EliminationsGSA Consolidated
Totals
2018 2017 2018 2017 2018 2017 2018 2017 2018 2017
Judgment Fund Liability $495 $490 $- $- $- $- $- $- $495 $490
Deferred Revenues and Advances - Federal 696 612 9 11 - - - - 705 623
Other Intragovernmental Liabilities 16 17 5 6 3 3 - - 24 26
Total Intragovernmental Liabilities Not Covered by Budgetary Resources 1,207 1,119 14 17 3 3 - - 1,224 1,139
Environmental and Disposal 1,871 1,823 - - 136 99 - - 2,007 1,922
Capital Lease and Installment Purchase Liability 679 562 - - - - - - 679 562
Workers' Compensation Actuarial Liabilities 74 75 24 24 14 14 - - 112 113
Annual Leave Liability 48 48 33 31 29 30 - - 110 109
Other Liabilities 1 1 8 9 13 12 - - 22 22
Total Non-Intragovernmental Liabilities Not Covered by Budgetary Resources 2,673 2,509 65 64 192 155 - - 2,930 2,728
Total Liabilities Not Covered By Budgetary Resources 3,880 3,628 79 81 195 158 - - 4,154 3,867
Total Liabilities Covered By Budgetary Resources 1,019 1,120 2,210 1,735 111 111 38 48 3,302 2,918
Total Liabilities Not Requiring Budgetary Resources 490 502 - - 80 112 - - 570 614
Total Liabilities $5,389 $5,250 $2,289 $1,816 $386 $381 $38 $48 $8,026 $7,399

FINANCIAL SECTION • FY 2018 AGENCY FINANCIAL REPORT72
Certain balances, while also unfunded by definition (as no budgetary resources have been applied), will be liquidated from resources outside of the traditional budgeting process and require no further congressional action to do so. Such balances include: 1) amounts reported in the Consolidated Balance Sheets under the captions Unamortized Rent Abatement Liability and Deposit Fund Liability; 2) the portion of amounts included in Other Intragovernmental Liabilities shown as Deposits Held in Suspense and Earnings Payable to Treasury in Note 9; and 3) substantially all amounts included in Other Liabilities shown as Deferred Revenues/Advances From the Public in Note 9.
12. Reconciliation to the President’s BudgetIn accordance with FASAB SFFAS No. 7, Accounting for Revenue and Other Financing Sources and Concepts for Reconciling Budgetary and Financial Accounting, if there are differences between amounts reported in these financial statements versus those reported in the most recent Budget of the United States Government (President’s Budget), they must be disclosed. With the President’s Budget generally released in February each year, the most current comparable data is the FY 2019 President’s Budget, which contains FY 2017 financial statement results. The FY 2020 President’s Budget, containing FY 2018 actual results is expected to be released in February 2019 on OMB’s website. The portion of the President’s Budget relating specifically to GSA can be found in the appendix of that document. Balances submitted to the U.S. Treasury constitute the basis for reporting of actual results in the President’s Budget. The basis of the President’s Budget and the CSBR is data reported to the U.S. Treasury on the Reports on Budget Execution and Budgetary Resources (SF 133s). Reconciling differences are caused by the presentation style of the President’s Budget, which excludes Budgetary Resources, New Obligations and Upward Adjustments and Unobligated Balances in expired annual funds, as well as offsetting collections, which are required for reporting on the CSBR. Small rounding differences may also exist between the CSBR and the President’s Budget due to an alternative rounding methodology used by GSA.
The following two schedules highlight the most significant comparable amounts reported in the FY 2017 CSBR and FY 2019 President’s Budget (dollars in millions). The first schedule shows the total differences where the CSBR contains balances greater or (less) than amounts reported in the President’s Budget by fund. Following this is a second schedule displaying the components of each difference at the combined level.
GSA’s Presidential Budget submission includes available and unavailable budgetary resources. In the CSBR and FBF SBR, the total budgetary resources of $31.7 billion and $16.3 billion as of September 30, 2017, respectively, represent budgetary resources net of FBF’s unavailable budgetary resources of $4.7 billion. For GSA’s reconciliation between the CSBR and the President’s Budget, we added back FBF’s unavailable resources to the Budgetary Resources amounts reported under the FBF CSBR column in the first chart and the CSBR row in the second chart.
FBF ASF OTHER FUNDS GSA CONSOLIDATED TOTALS
CSBRPres.
Budget CSBRPres.
Budget CSBRPres.
Budget CSBRPres.
Budget DifferenceBudgetary Resources $20,957 $ 20,949 $ 14,241 $ 14,241 $ 1,228 $ 1,191 $ 36,426 $ 36,381 $ 45New Obligations and Upward Adjustments 11,538 11,538 13,626 13,626 1,007 1,007 26,171 26,171 -Net Outlays from Operating Activities (803) (803) (86) (86) 310 312 (579) (577) (2)Distributed Offsetting Receipts - - - - (84) - (84) - (84)
Budgetary Resources
New Obligations and Upward Adjustments
Net Outlays
Distributed Offsetting Receipts
Combined Statement of Budgetary Resources $ 36,426 $ 26,171 $ (579) (84)Expired Funds, Not Reflected in the Budget (47) - - -Offsetting Receipts Not Reflected in the Budget - - - 84Other 2 - 2 -Budget of the U.S. Government $ 36,381 $ 26,171 $ (577) $-

73FY 2018 AGENCY FINANCIAL REPORT • FINANCIAL SECTION
13. Combined Statements of Budgetary ResourcesThe CSBR presents GSA budgetary results in accordance with reporting requirements prescribed in OMB Circular A-11, Preparation, Submission, and Execution of the Budget. In consolidated reporting by OMB and the U.S. Treasury, for the U.S. government as a whole, substantially all of GSA’s program operations and operating results are categorized as general government functions.
The FY 2017 financial statements and notes were reclassified to conform to the FY 2018 financial statement presentation of OMB Circular No. A-136 and include, among other things, changes in the presentation of the consolidated CSBR, which were streamlined to reflect the requirements of FASAB standards.
The reclassifications had no effect on combined total budgetary resources and consolidating net cost of operations by program agency as previously reported.
The FY 2017 CSBR in the required supplementary information were reclassified to conform to the FY 2018 presentation requirements for the combining CSBR and in the required supplemental information. The reclassifications had no effect on the combining total budgetary resources previously reported.
The basis of the CSBR is data reported to the U.S. Treasury on the SF 133. There were no significant differences between the balances used to prepare the CSBR and the SF 133s in FY 2018 or FY 2017.
As a result of the new OMB A-136 SBR format changes, the SBR includes a new section called Memorandum Entries that ties the Prior Year total Unobligated Balance, End of Period to the current year Unobligated Balance from Prior Year Budget Authority, Net. The table below illustrates the lines from prior year that were aggregated into the current year Unobligated Balance from Prior Year Budget Authority, Net.
14. Consolidated Statements of Changes in Net Position
A. Cumulative Results of Operations
Cumulative results of operations for Revolving Funds include the net cost of operations since their inception, reduced by funds returned to the U.S. Treasury, congressional rescissions, and transfers to other Federal agencies, in addition
FEDERAL BUILDINGS
FUND
ACQUISITION SERVICES
FUNDOTHER FUNDS
GSA COMBINED TOTALS
2018 2017 2018 2017 2018 2017 2018 2017
Prior Year Total Unobligated Balance, End of Period $4,746 $5,903 $615 $1,595 $221 $233 $ 5,582 $7,731
MEMORANDUM ENTRIES
(1) - - - (1) - (2) -
Unobligated Balance transferred from other accounts 1 - - - - - 1 -
15 - - - - - 15 -
129 167 390 302 31 29 550 498
6 2 2 (61) (4) (6) 4 (65)
Total Memorandum Entries 150 169 392 241 26 23 568 433
$4,896 $6,072 $1,007 $1,836 $247 $256 $6,150 $8,164
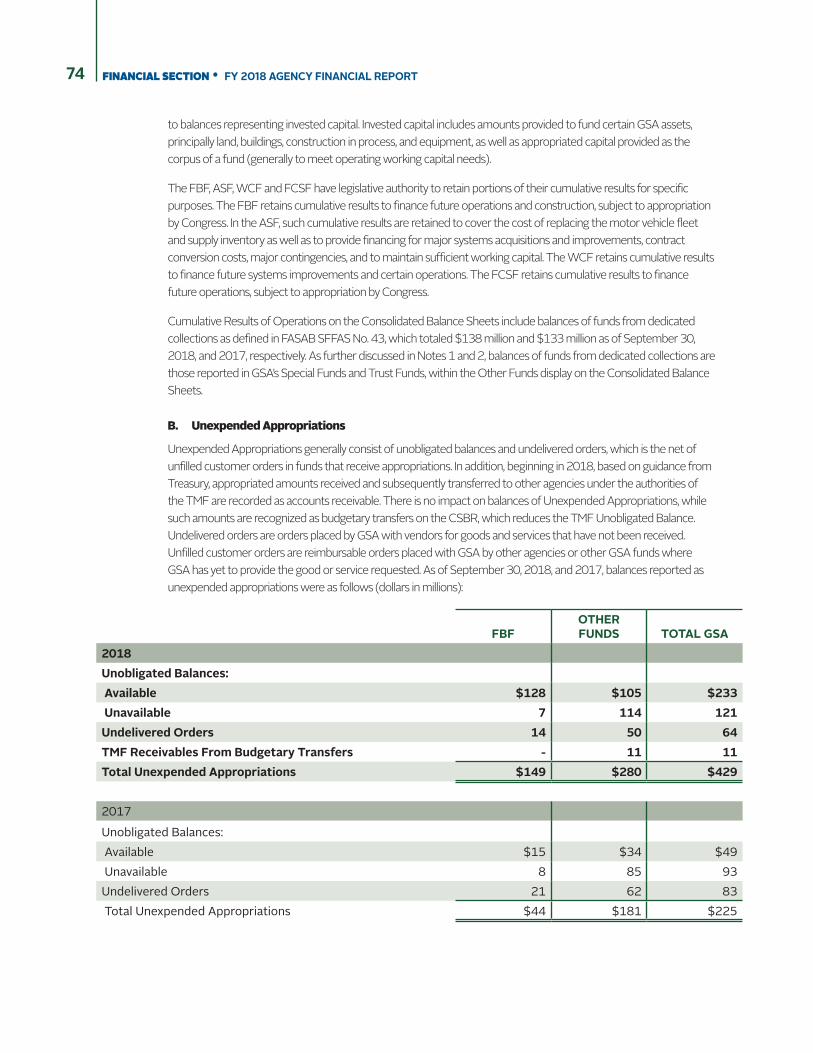
FINANCIAL SECTION • FY 2018 AGENCY FINANCIAL REPORT74
to balances representing invested capital. Invested capital includes amounts provided to fund certain GSA assets, principally land, buildings, construction in process, and equipment, as well as appropriated capital provided as the corpus of a fund (generally to meet operating working capital needs).
The FBF, ASF, WCF and FCSF have legislative authority to retain portions of their cumulative results for specific purposes. The FBF retains cumulative results to finance future operations and construction, subject to appropriation by Congress. In the ASF, such cumulative results are retained to cover the cost of replacing the motor vehicle fleet and supply inventory as well as to provide financing for major systems acquisitions and improvements, contract conversion costs, major contingencies, and to maintain sufficient working capital. The WCF retains cumulative results to finance future systems improvements and certain operations. The FCSF retains cumulative results to finance future operations, subject to appropriation by Congress.
Cumulative Results of Operations on the Consolidated Balance Sheets include balances of funds from dedicated collections as defined in FASAB SFFAS No. 43, which totaled $138 million and $133 million as of September 30, 2018, and 2017, respectively. As further discussed in Notes 1 and 2, balances of funds from dedicated collections are those reported in GSA’s Special Funds and Trust Funds, within the Other Funds display on the Consolidated Balance Sheets.
B. Unexpended Appropriations
Unexpended Appropriations generally consist of unobligated balances and undelivered orders, which is the net of unfilled customer orders in funds that receive appropriations. In addition, beginning in 2018, based on guidance from Treasury, appropriated amounts received and subsequently transferred to other agencies under the authorities of the TMF are recorded as accounts receivable. There is no impact on balances of Unexpended Appropriations, while such amounts are recognized as budgetary transfers on the CSBR, which reduces the TMF Unobligated Balance. Undelivered orders are orders placed by GSA with vendors for goods and services that have not been received. Unfilled customer orders are reimbursable orders placed with GSA by other agencies or other GSA funds where GSA has yet to provide the good or service requested. As of September 30, 2018, and 2017, balances reported as unexpended appropriations were as follows (dollars in millions):
FBFOTHER FUNDS TOTAL GSA
2018Unobligated Balances: Available $128 $105 $233 Unavailable 7 114 121Undelivered Orders 14 50 64TMF Receivables From Budgetary Transfers - 11 11Total Unexpended Appropriations $149 $280 $429
2017Unobligated Balances: Available $15 $34 $49 Unavailable 8 85 93Undelivered Orders 21 62 83 Total Unexpended Appropriations $44 $181 $225

75FY 2018 AGENCY FINANCIAL REPORT • FINANCIAL SECTION
15. Employee Benefit Plans
A. Background
Although GSA funds a portion of pension benefits for its employees under the Civil Service Retirement System (CSRS) and the Federal Employees Retirement System (FERS), and makes the necessary payroll withholdings, GSA is not required to disclose the assets of the systems or the actuarial data related to accumulated plan benefits or the unfunded pension liability relative to its employees. Reporting the amounts of health care benefits for current and retired employees is the direct responsibility of the Office of Personnel Management (OPM).
In accordance with FASAB SFFAS No. 5, GSA recognizes the normal cost of pension programs and the normal cost of other post-employment health and life insurance benefits, as defined in that standard, on the Consolidated Statements of Net Cost. While contributions submitted by GSA to OPM do cover a significant portion of the normal cost of retirement benefits, the contribution rates defined in law do not cover the full normal cost of those retirement benefits. To achieve the recognition of the full normal cost required by SFFAS No. 5, GSA records the combination of funded cost for agency contributions, and imputed cost for the portion of normal costs not covered by contributions. Amounts recognized as normal cost related to contributions, as well as imputed costs are further provided below.
B. Civil Service Retirement System
At the end of FY 2018, 4.7 percent (down from 5.5 percent in FY 2017) of GSA employees were covered by the CSRS, a defined benefit plan. Total GSA (employer) contributions (7.5 percent of base pay for law enforcement employees, and 7.0 percent for all others) to CSRS for all employees were as follows (dollars in millions):
C. Federal Employees Retirement System
On January 1, 1987, the FERS, a mixed system of defined benefit and defined contribution plans, went into effect pursuant to Public Law 99-335. Employees hired after December 31, 1983, were automatically covered by FERS and Social Security while employees hired before January 1, 1984, elected to either join FERS and Social Security or remain in CSRS. As of September 30, 2018, 95.2 percent (up from 93.9 percent in FY 2017) of GSA employees were covered under FERS. One of the primary differences between the systems is that FERS offers automatic and matching contributions into the Federal Government’s Thrift Savings Plan (TSP) for each employee. All employees could invest up to $18,500 and $18,000 in their TSP account in calendar years 2018 and 2017, respectively. In addition, for FERS employees, GSA automatically contributes one percent of base pay and matches employee contributions up to an additional four percent of base pay. For calendar years 2018 and 2017, total contributions made on behalf of an employee could not exceed $55,000 and $54,000, respectively. For FYs 2018 and 2017, the GSA (employer) contributions to FERS (30.1 percent of base pay for law enforcement employees and 13.7 percent for all others) were as follows (dollars in millions):
2018 2017FBF $2 $2ASF 1 1Other Funds 1 2Total Employer Contributions $4 $5
2018 2017FBF $68 $68ASF 43 42Other Funds 41 40Total Employer Contributions $152 $150

FINANCIAL SECTION • FY 2018 AGENCY FINANCIAL REPORT76
Additional GSA contributions to the TSP were as follows (dollars in millions):
D. Social Security System
GSA also makes matching contributions for programs of the Social Security Administration (SSA) under the Federal Insurance Contributions Act. For employees covered by FERS, GSA contributed 6.2 percent of gross pay (up to $128,400 and $127,200 in calendar years 2018 and 2017, respectively) to SSA’s Old-Age, Survivors, and Disability Insurance Program in calendar year 2018. Additionally, GSA makes matching contributions for all employees of 1.45 percent of gross pay to the Medicare Hospital Insurance program in calendar year 2018. In FY 2018 and 2017, 0.1 percent and 0.6 percent, respectively, of GSA employees are covered exclusively by these programs. Payments to these programs were as follows (dollars in millions):
E. Schedule of Unfunded Benefit Costs
Amounts recorded in FYs 2018 and 2017, in accordance with FASAB SFFAS No. 5, for imputed post-employment benefits were as follows (dollars in millions):
2018 2017FBF $23 $22
ASF 14 14Other Funds 13 13Total Employer Contributions $50 $49
2018 2017FBF $38 $38
ASF 23 23Other Funds 22 21Total Employer Contributions $83 $82
PENSION BENEFITS HEALTH/LIFE INSURANCE TOTAL2018FBF $13 $32 $45ASF 9 18 27Other Funds 8 17 25 Total Unfunded Benefit Costs $30 $67 $972017FBF $7 $25 $32ASF 4 14 18Other Funds 4 13 17 Total Unfunded Benefit Costs $15 $52 $67

77FY 2018 AGENCY FINANCIAL REPORT • FINANCIAL SECTION
16. Reconciliation of Net Costs of Operations to BudgetThe recognition of earning reimbursable budgetary resources and spending budgetary resources on the CSBR generally has a direct or causal relationship to revenues and expenses recognized on the Consolidated Statements of Net Cost. The reconciliation schedules below bridge the gap between these sources and uses of budgetary resources with the operating results reported on the Consolidated Statements of Net Cost for the fiscal years ended September 30, 2018 and 2017, (dollars in millions):
FEDERAL BUILDINGS
FUND
ACQUISITION SERVICES
FUNDOTHER FUNDS
LESS: INTRA-GSA
ELIMINATIONS
GSA CONSOLIDATED
TOTALS
2018 2017 2018 2017 2018 2017 2018 2017 2018 2017
RESOURCES USED TO FINANCE ACTIVITIES
New Obligations And Upward Adjustments $10,982 $11,538 $15,260 $13,626 $981 $1,007 $- $- $27,223 $26,171
Less: Spending Authority From Offsetting Collections and Adjustments (12,115) (11,867) (15,581) (12,714) (741) (725) - - (28,437) (25,306)
Financing Imputed for Cost Subsidies 65 45 42 31 35 29 36 26 106 79
Other 124 107 1 (28) 83 88 - - 208 167
Total Resources Used to Finance Activities (944) (177) (278) 915 358 399 36 26 (900) 1,111
RESOURCES USED THAT ARE NOT PART OF THE NET COST OF OPERATIONS
(Increase)/Decrease in Goods and Services Ordered But Not Yet Received (145) (158) (1,145) (1,885) 27 $20 - - (1,263) (2,023)
Increase/(Decrease) in Unfilled Customer Orders (330) (381) 1,473 963 14 (4) - - 1,817 578
Costs Capitalized on the Balance Sheet (1,367) (1,726) (943) (763) (5) (11) - - (2,315) (2,500)
Financing Sources Funding Prior Year Costs (307) (175) 12 11 (2) (14) - - (297) (178)
Other 93 429 (3) (2) (89) (87) - - (1) 340
Total Resources Used That Are Not Part of the Net Cost of Operations (1,396) (2,011) (606) (1,676) (55) (96) - - (2,057) (3,783)
COSTS FINANCED BY RESOURCES RECEIVED IN PRIOR PERIODS
Depreciation and Amortization 1,644 1,619 572 555 11 10 - - 2,227 2,184
Net Book Value of Property Sold - - 225 214 - - - - 225 214
Other 5 25 - - - - - - 5 25
Total Costs Financed by Resources Received in Prior Periods 1,649 1,644 797 769 11 10 - - 2,457 2,423
COSTS REQUIRING RESOURCES IN FUTURE PERIODS
Unfunded Capitalized Costs - - - - - - - - - -
Unfunded Current Expenses 44 (122) - - 45 11 - - 89 (111)
Total Costs Requiring Resources in Future Periods 44 (122) - - 45 11 - - 89 (111)
Net (Revenues From) Cost of Operations $(650) $(666) $(87) $8 $359 $324 $36 $26 $(414) $(360)

FINANCIAL SECTION • FY 2018 AGENCY FINANCIAL REPORT78
17. Net Cost by Responsibility Segment OMB Circular A-136, Financial Reporting Requirements, requires that the presentation of the Consolidated Statements of Net Cost align with the goals and outcomes identified in the agency’s strategic plan. The strategic goals presented in GSA’s Consolidated Statements of Net Cost are derived from the missions of the agency’s two largest service organizations: PBS, which manages the FBF, and FAS, which manages the ASF. PBS manages building operations by overseeing the design, construction, leasing, and maintenance of Government-owned and leased facilities. Responsibility segments include the Government-Owned and the Leased Building segments. FAS is organized into five main business portfolios: GS&S, TTL, IT, AAS, and PS&HC. FAS provides acquisition services by leveraging the buying power of the Federal Government to obtain best values. In May 2016, GSA established TTS which included the consulting group known as 18F, PIF (Presidential Innovation Fellows), Office of Citizen Services and Innovative Technologies (OCSIT), and Electronic Capital Planning Investment Control. The TTS programs were consolidated into FAS in June 2017.
The GSA agency-wide strategic plan goals of providing cost savings to customers, increasing operational efficiency, and delivering excellent customer service are embedded in the missions of its service organizations. Revenues and expenses not associated with PBS or FAS are reported as Working Capital and General Programs. Eliminations of intra-agency activity are recorded against the organization providing the goods or services, displayed in the “ELIM” column. The following tables present the FY 2018 and FY 2017 net operating results by strategic goal for each responsibility segment.
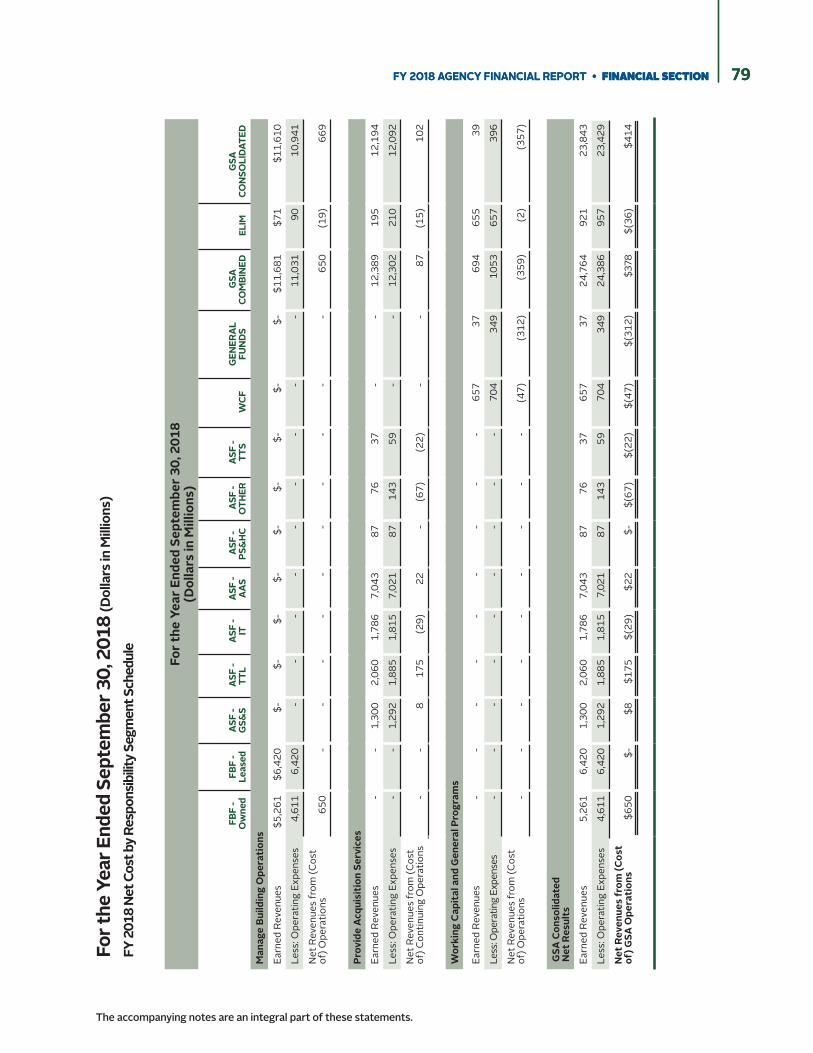
79FY 2018 AGENCY FINANCIAL REPORT • FINANCIAL SECTION 79FY 2018 AGENCY FINANCIAL REPORT • FINANCIAL SECTION
The accompanying notes are an integral part of these statements.
For t
he Y
ear E
nded
Sep
tem
ber 3
0, 2
018
(Dol
lars
in M
illio
ns)
FY 2
018
Net C
ost b
y Res
pons
ibilit
y Seg
men
t Sch
edul
e
For t
he Y
ear E
nded
Sep
tem
ber 3
0, 2
018
(Dol
lars
in M
illio
ns)
FBF
- O
wne
dFB
F -
Leas
edAS
F -
GS&
S A
SF -
TTL
ASF
- IT
AS
F -
AAS
ASF
- PS
&HC
A
SF -
OTH
ER
ASF
- TT
S W
CF
GEN
ERAL
FU
NDS
GSA
CO
MBI
NED
E
LIM
G
SACO
NSO
LIDA
TED
Man
age
Build
ing
Ope
rati
ons
Earn
ed R
even
ues
$5,2
61$6
,420
$-$-
$-$-
$-$-
$-$-
$-$1
1,68
1 $7
1 $1
1,61
0
Less
: Ope
ratin
g Ex
pens
es4,
611
6,42
0-
--
--
--
--
11,0
3190
10,9
41
Net
Rev
enue
s fr
om (C
ost
of) O
pera
tions
650
--
--
--
--
--
650
(19)
669
Prov
ide
Acqu
isit
ion
Serv
ices
Earn
ed R
even
ues
--
1,30
02,
060
1,78
67,
043
8776
37
--
12,3
8919
512
,194
Less
: Ope
ratin
g Ex
pens
es-
-1,
292
1,88
51,
815
7,02
187
143
59
--
12,3
0221
012
,092
Net
Rev
enue
s fr
om (C
ost
of) C
ontin
uing
Ope
ratio
ns-
-8
175
(29)
22
-(6
7) (2
2)-
-87
(15)
102
3-1
22
Wor
king
Cap
ital
and
Gen
eral
Pro
gram
s
Earn
ed R
even
ues
--
--
--
--
-65
737
694
655
39
Less
: Ope
ratin
g Ex
pens
es-
--
--
--
--
704
349
1053
657
396
Net
Rev
enue
s fr
om (C
ost
of) O
pera
tions
--
--
--
--
-(4
7)(3
12)
(359
)(2
)(3
57)
GSA
Con
solid
ated
N
et R
esul
ts
Earn
ed R
even
ues
5,26
16,
420
1,30
02,
060
1,78
67,
043
87 7
6 3
7 65
737
24,7
6492
123
,843
Less
: Ope
ratin
g Ex
pens
es4,
611
6,42
0 1,
292
1,88
5 1,
815
7,02
1 87
1
43
59
704
349
24,3
8695
7 23
,429
Net
Rev
enue
s fr
om (C
ost
of) G
SA O
pera
tion
s$6
50
$-
$8
$175
$(
29)
$22
$-
$(6
7) $
(22)
$(47
)$(
312)
$378
$(
36)
$414

FINANCIAL SECTION • FY 2018 AGENCY FINANCIAL REPORT80
The accompanying notes are an integral part of these statements.
For t
he Y
ear E
nded
Sep
tem
ber 3
0, 2
017
(Dol
lars
in M
illio
ns)
FY 2
017
Net C
ost b
y Res
pons
ibilit
y Seg
men
t Sch
edul
e
For t
he Y
ear E
nded
Sep
tem
ber 3
0, 2
017
(Dol
lars
in M
illio
ns)
FBF
- O
wne
dFB
F -
Leas
edAS
F -
GS&
S A
SF -
TTL
ASF
- IT
AS
F -
AAS
ASF
- PS
&HC
A
SF -
OTH
ER
ASF
-TT
S W
CF
GEN
ERAL
FU
NDS
GSA
CO
MBI
NED
E
LIM
G
SACO
NSO
LIDA
TED
Man
age
Build
ing
Ope
rati
ons
Earn
ed R
even
ues
$5,
150
$6,
598
$-$-
$-$-
$-$-
$-$-
$- $
11,7
48
$71
$
11,6
77
Less
: Ope
ratin
g Ex
pens
es 4
,376
6
,706
-
--
--
--
--
11,
082
85
10,
997
Net
Rev
enue
s fr
om (C
ost
of) O
pera
tions
774
(1
08)
--
--
--
--
- 6
66
(14)
680
Prov
ide
Acqu
isit
ion
Serv
ices
Earn
ed R
even
ues
--
995
1
,849
1
,831
5
,382
9
0 7
4 2
9 -
- 1
0,25
0 1
88
10,
062
Less
: Ope
ratin
g Ex
pens
es-
- 1
,050
1
,692
1
,853
5
,379
9
3 1
36
55
--
10,
258
199
1
0,05
9
Net
Rev
enue
s fr
om (C
ost
of) C
ontin
uing
Ope
ratio
ns-
- (5
5) 1
57
(22)
3
(3)
(62)
(26)
--
(8)
(11)
3
3-1
22
Wor
king
Cap
ital
and
Gen
eral
Pro
gram
s
Earn
ed R
even
ues
--
--
--
--
- 6
58
42
700
6
57
43
Less
: Ope
ratin
g Ex
pens
es-
--
--
--
--
701
32
3 1
,024
6
58
366
Net
Rev
enue
s fr
om (C
ost
of) O
pera
tions
--
--
--
--
- (4
3) (2
81)
(324
) (1
) (3
23)
GSA
Con
solid
ated
N
et R
esul
ts
Earn
ed R
even
ues
5,1
50
6,5
98
995
1
,849
1
,831
5
,382
9
0 7
4 2
9 6
58
42
22,
698
916
2
1,78
2
Less
: Ope
ratin
g Ex
pens
es 4
,376
6
,706
1
,050
1
,692
1
,853
5
,379
9
3 1
36
55
701
3
23
22,
364
942
2
1,42
2
Net
Rev
enue
s fr
om (C
ost
of) G
SA O
pera
tion
s $
774
$ (1
08)
$(5
5) $
157
$(2
2) $
3 $
(3)
(62)
$(2
6) $
(43)
$(2
81)
$33
4 $
(26)
$36
0
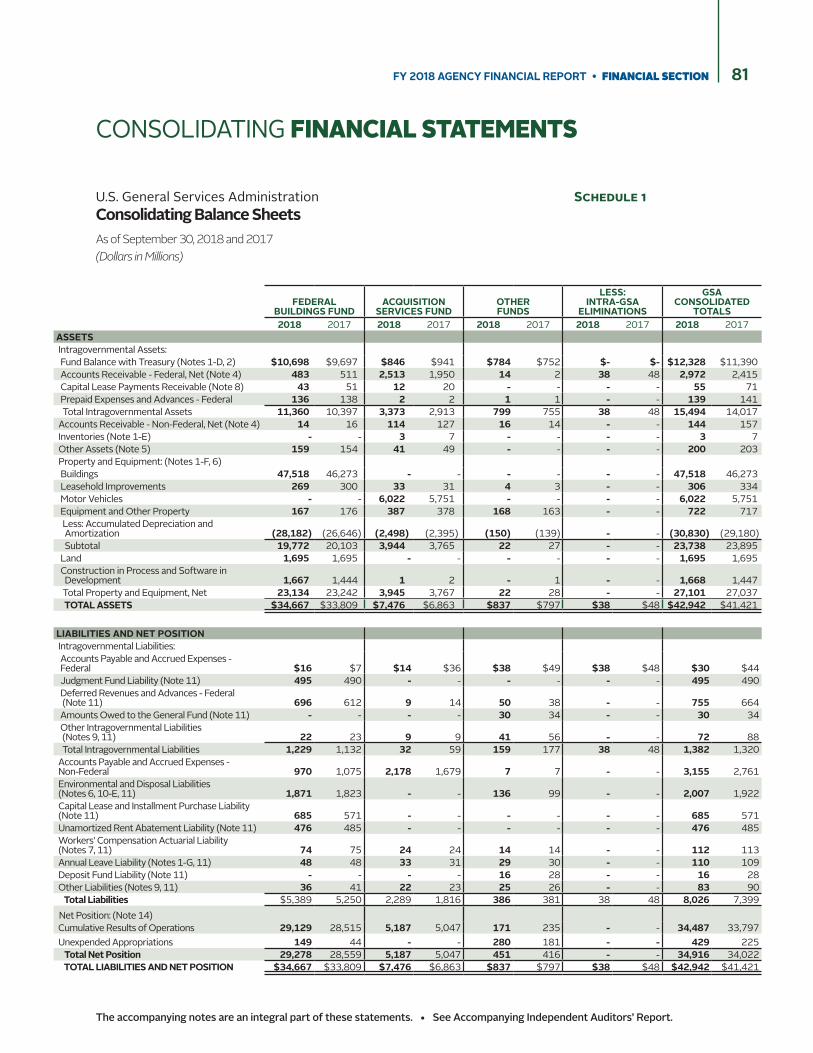
81FY 2018 AGENCY FINANCIAL REPORT • FINANCIAL SECTION
The accompanying notes are an integral part of these statements. • See Accompanying Independent Auditors’ Report.
CONSOLIDATING FINANCIAL STATEMENTS
U.S. General Services Administration Schedule 1Consolidating Balance SheetsAs of September 30, 2018 and 2017 (Dollars in Millions)
FEDERAL BUILDINGS FUND
ACQUISITION SERVICES FUND
OTHER FUNDS
LESS: INTRA-GSA
ELIMINATIONS
GSA CONSOLIDATED
TOTALS2018 2017 2018 2017 2018 2017 2018 2017 2018 2017
ASSETS Intragovernmental Assets: Fund Balance with Treasury (Notes 1-D, 2) $10,698 $9,697 $846 $941 $784 $752 $- $- $12,328 $11,390 Accounts Receivable - Federal, Net (Note 4) 483 511 2,513 1,950 14 2 38 48 2,972 2,415 Capital Lease Payments Receivable (Note 8) 43 51 12 20 - - - - 55 71 Prepaid Expenses and Advances - Federal 136 138 2 2 1 1 - - 139 141 Total Intragovernmental Assets 11,360 10,397 3,373 2,913 799 755 38 48 15,494 14,017 Accounts Receivable - Non-Federal, Net (Note 4) 14 16 114 127 16 14 - - 144 157 Inventories (Note 1-E) - - 3 7 - - - - 3 7 Other Assets (Note 5) 159 154 41 49 - - - - 200 203 Property and Equipment: (Notes 1-F, 6) Buildings 47,518 46,273 - - - - - - 47,518 46,273 Leasehold Improvements 269 300 33 31 4 3 - - 306 334 Motor Vehicles - - 6,022 5,751 - - - - 6,022 5,751 Equipment and Other Property 167 176 387 378 168 163 - - 722 717 Less: Accumulated Depreciation and Amortization (28,182) (26,646) (2,498) (2,395) (150) (139) - - (30,830) (29,180) Subtotal 19,772 20,103 3,944 3,765 22 27 - - 23,738 23,895 Land 1,695 1,695 - - - - - - 1,695 1,695 Construction in Process and Software in Development 1,667 1,444 1 2 - 1 - - 1,668 1,447 Total Property and Equipment, Net 23,134 23,242 3,945 3,767 22 28 - - 27,101 27,037 TOTAL ASSETS $34,667 $33,809 $7,476 $6,863 $837 $797 $38 $48 $42,942 $41,421
LIABILITIES AND NET POSITION Intragovernmental Liabilities: Accounts Payable and Accrued Expenses - Federal $16 $7 $14 $36 $38 $49 $38 $48 $30 $44 Judgment Fund Liability (Note 11) 495 490 - - - - - - 495 490 Deferred Revenues and Advances - Federal (Note 11) 696 612 9 14 50 38 - - 755 664 Amounts Owed to the General Fund (Note 11) - - - - 30 34 - - 30 34 Other Intragovernmental Liabilities (Notes 9, 11) 22 23 9 9 41 56 - - 72 88 Total Intragovernmental Liabilities 1,229 1,132 32 59 159 177 38 48 1,382 1,320 Accounts Payable and Accrued Expenses - Non-Federal 970 1,075 2,178 1,679 7 7 - - 3,155 2,761 Environmental and Disposal Liabilities (Notes 6, 10-E, 11) 1,871 1,823 - - 136 99 - - 2,007 1,922 Capital Lease and Installment Purchase Liability (Note 11) 685 571 - - - - - - 685 571 Unamortized Rent Abatement Liability (Note 11) 476 485 - - - - - - 476 485 Workers' Compensation Actuarial Liability (Notes 7, 11) 74 75 24 24 14 14 - - 112 113 Annual Leave Liability (Notes 1-G, 11) 48 48 33 31 29 30 - - 110 109 Deposit Fund Liability (Note 11) - - - - 16 28 - - 16 28 Other Liabilities (Notes 9, 11) 36 41 22 23 25 26 - - 83 90 Total Liabilities $5,389 5,250 2,289 1,816 386 381 38 48 8,026 7,399 Net Position: (Note 14) Cumulative Results of Operations 29,129 28,515 5,187 5,047 171 235 - - 34,487 33,797 Unexpended Appropriations 149 44 - - 280 181 - - 429 225 Total Net Position 29,278 28,559 5,187 5,047 451 416 - - 34,916 34,022 TOTAL LIABILITIES AND NET POSITION $34,667 $33,809 $7,476 $6,863 $837 $797 $38 $48 $42,942 $41,421

FINANCIAL SECTION • FY 2018 AGENCY FINANCIAL REPORT82
The accompanying notes are an integral part of these statements. • See Accompanying Independent Auditors’ Report.
U.S. General Services Administration Schedule 2Consolidating Statements of Net Cost
For the Fiscal Years Ended September 30, 2018 and 2017 (Dollars in Millions)
2018 2017
REVENUES EXPENSES
NET REVENUES FROM
(COST OF) OPERATIONS REVENUES EXPENSES
NET REVENUES FROM
(COST OF) OPERATIONS
FEDERAL BUILDINGS FUND:
Building Operations - Government Owned $5,261 $4,611 $650 $5,150 $4,376 $774
Building Operations - Leased 6,420 6,420 - 6,598 6,706 (108)
Subtotal 11,681 11,031 650 11,748 11,082 666
ACQUISITION SERVICES FUND:
General Supplies and Services 1,300 1,292 8 995 1,050 (55)
Travel, Transportation, and Logistics 2,060 1,885 175 1,849 1,692 157
Information Technology 1,786 1,815 (29) 1,831 1,853 (22)
Assisted Acquisition Services 7,043 7,021 22 5,382 5,379 3
Professional Services and Human Capital 87 87 - 90 93 (3)
Other Programs 113 202 (89) 103 191 (88)
Subtotal 12,389 12,302 87 10,250 10,258 (8)
OTHER FUNDS:
Working Capital Fund 657 704 (47) 663 705 (42)
Other General Funds 37 349 (312) 37 319 (282)
Subtotal 694 1,053 (359) 700 1,024 (324)
INTRA-GSA ELIMINATIONS:
Less: Intra-GSA Eliminations 921 957 (36) 916 942 (26)
GSA Consolidated Totals $23,843 $ 23,429 $414 $21,782 $21,422 $360

83FY 2018 AGENCY FINANCIAL REPORT • FINANCIAL SECTION
The accompanying notes are an integral part of these statements. • See Accompanying Independent Auditors’ Report.
U.S. General Services Administration Schedule 3Consolidating Statements of Changes in Net Position
For the Fiscal Years Ended September 30, 2018 and 2017 (Dollars in Millions)
FEDERAL BUILDINGS
FUNDACQUISITION
SERVICES FUND OTHER FUNDS
LESS: INTRA-GSA
ELIMINATIONS
GSA CONSOLIDATED
TOTALS
2018 2017 2018 2017 2018 2017 2018 2017 2018 2017
BEGINNING BALANCE OF NET POSITION:
Cumulative Results of Operations $28,515 $27,885 $5,047 $5,081 $235 $260 $- $- $33,797 $33,226
Unexpended Appropriations 44 69 - - 181 178 - - 225 247
Net Position Beginning Balance 28,559 27,954 5,047 5,081 416 438 - - 34,022 33,473
RESULTS OF OPERATIONS:
Net Revenues From (Cost of) Operations 650 666 87 (8) (359) (324) (36) (26) 414 360
Appropriations Used (Note 1-C) 21 25 - - 235 249 - - 256 274
Non-Exchange Revenue (Notes 1-C, 1-D) (9) (1) - - 106 81 - - 97 80
Imputed Financing Provided By Others 65 45 42 31 34 29 36 26 105 79
Transfers of Financing Sources (To) From the U.S. Treasury - - - (68) (75) (53) - - (75) (121)
Transfers of Net Assets and Liabilities(To) From Other Federal Agencies (113) (105) 11 11 - - - - (102) (94)
Other - - - - (5) (7) - - (5) (7)
Net Results of Operations 614 630 140 (34) (64) (25) - - 690 571
CHANGES IN UNEXPENDED APPROPRIATIONS:
Appropriations Received 127 - - - 334 253 - - 461 253
Appropriations Used (21) (25) - - (235) (249) - - (256) (274)
Appropriations Adjustments and Transfers (To) From Other Agencies or Funds (1) - - - - (1) - - (1) (1)
Net Change in Unexpended Appropriations 105 (25) - - 99 3 - - 204 (22)
ENDING BALANCE OF NET POSITION:
Cumulative Results of Operations 29,129 28,515 5,187 5,047 171 235 - - 34,487 33,797
Unexpended Appropriations 149 44 - - 280 181 - - 429 225
Net Position Ending Balance
$29,278
$28,559 $5,187 $5,047 $451 $416 $- $-
$34,916
$34,022

FINANCIAL SECTION • FY 2018 AGENCY FINANCIAL REPORT84
The accompanying notes are an integral part of these statements. • See Accompanying Independent Auditors’ Report.
U.S. General Services Administration Schedule 4Combining Statements of Budgetary Resources
For the Fiscal Years Ended September 30, 2018 and 2017 (Dollars in Millions)
FEDERAL BUILDINGS FUND
ACQUISITION SERVICES FUND
OTHER FUNDS
GSA COMBINED TOTALS
2018 2017 2018 2017 2018 2017 2018 2017BUDGETARY RESOURCESUnobligated Balance from Prior Year Budget Authority, Net $ 4,896 $6,072 $1,007 $1,836 $247 $256 $6,150 $8,164
Appropriations 127 - - - 350 275 477 275 Spending Authority from Offsetting Collections 11,055 10,212 15,189 12,405 709 697 26,953 23,314
Total Budgetary Resources 16,078 16,284 16,196 14,241 1,306 1,228 33,580 31,753
MEMORANDUM ENTRIESNet Adjustments to Unobligated Balance Brought Forward, October 1 150 169 392 241 26 23 568 433
STATUS OF BUDGETARY RESOURCESNew Obligations and Upward Adjustments 10,982 11,538 15,260 13,626 981 1,007 27,223 26,171 Unobligated Balance, End of Period Apportioned, Unexpired Accounts 4,438 4,730 573 (319) 171 76 5,182 4,487 Unapportioned, Unexpired Accounts 650 8 363 934 113 108 1,126 1,050 Unexpired Unobligated Balance, End of Period 5,088 4,738 936 615 284 184 6,308 5,537 Expired Unobligated Balance, End of Period 8 8 - - 41 37 49 45 Unobligated Balance, End of Period, Total 5,096 4,746 936 615 325 221 6,357 5,582 Total Status of Budgetary Resources 16,078 16,284 16,196 14,241 1,306 1,228 33,580 31,753
OUTLAYS, NET Net Outlays from Operating Activity (875) (803) 95 (86) 279 310 (501) (579) Distributed Offsetting Receipts - - - - (89) (84) (89) (84) Total Net Outlays $(875) $(803) $95 $(86) $190 $226 $(590) $(663)

85FY 2018 AGENCY FINANCIAL REPORT • FINANCIAL SECTION 85FY 2018 AGENCY FINANCIAL REPORT • FINANCIAL SECTION
Unaudited - See Accompanying Independent Auditors’ Report
REQUIRED SUPPLEMENTARY INFORMATION (UNAUDITED)Deferred Maintenance and RepairsGSA reports Deferred Maintenance and Repairs consistent with the definition in SFFAS 42:
Deferred maintenance and repairs (DM&R) are maintenance and repairs that were not performed when scheduled or delayed for a future period. Maintenance and repairs are activities directed toward keeping fixed assets in an acceptable condition. Activities include preventive maintenance; replacement of parts, systems, or components; and other activities needed to preserve or maintain the asset. Maintenance and repairs, as distinguished from capital improvements, exclude activities directed towards expanding the capacity of an asset or otherwise upgrading it to serve needs different from, or significantly greater than, its current use.
In accordance with SFFAS 42, GSA has disclosable DM&R related to its inventory of Buildings in the FBF. GSA utilizes the Building Assessment Tool (BAT) to determine the amount of all repairs and alterations needed to correct major components or systems deficiencies in owned buildings (and certain leased buildings where GSA has responsibility for repairs and alterations). GSA requires a Building Assessment for every Government-owned, leased, or delegated asset that meets all the following criteria according to the Real Estate Across the United States (REXUS) system:
• GSA has R&A responsibility
• The asset maintains an "active" or "excess" status
• The asset has a real property type of "building" or "structure"
No assets meeting the criteria identified above are excluded from this requirement. The surveys are conducted biennially to inspect and electronically document building conditions, with approximately half of the building inventory being surveyed each year. The BAT is a 37 question survey that provides a regular and consistent assessment of the physical condition of each building’s basic structure and systems provides an overall assessment of GSA’s building inventory. The process of identifying building deficiencies and developing a multi-year plan of repairs and alterations projects begins with the BAT. All repair and alteration projects, not just those associated with DM&R, are prioritized using established weights of the pre-defined criteria and placed in order of importance.
Data collected in the BAT is gathered to support GSA’s overall building assessment, workload planning, and budgeting needs, and is not designed to specifically capture data that would be defined as DM&R. However, subsets of the workload planning directly results from conditions classified as DM&R. GSA has determined from analysis of data in the BAT, that when applying certain data criteria, results can be used to provide a reasonable estimate to meet the FASAB DM&R reporting objectives. At the end of FYs 2018, 2017 and 2016, based on the analysis of the BAT results, GSA estimates the total cost of DM&R to be approximately $1.455 billion, $1.385 billion and $1.214 billion, respectively, for activities categorized as work needing to be performed immediately to restore or maintain acceptable condition of the building inventory.
GSA measures the condition of its inventory of buildings by using an industry accepted metric called the Facility Condition Index (FCI). The FCI is the ratio between total Repair and Alteration Needs and the Functional Replacement Value of an asset (i.e. repair needs divided by the asset’s replacement value). Based on the end of FY 2018 BAT data, approximately 74.0 percent of GSA’s inventory, according to square footage, is considered in “Good Condition,” with an FCI of 10 percent or less.

FINANCIAL SECTION • FY 2018 AGENCY FINANCIAL REPORT86 FINANCIAL SECTION • FY 2018 AGENCY FINANCIAL REPORT86
Unaudited - See Accompanying Independent Auditors’ Report
Supplemental Schedule of Budgetary Resources
In its principal financial statements, GSA displays balances for the two major funds (FBF and ASF) while combining all remaining funds into an “Other Funds” group. Within the Other Funds group, The Working Capital Fund (WCF) and Technology Modernization Fund (TMF) make up approximately 68 percent of the total budgetary resources. As these Funds are a very significant component of the total Other Funds budgetary results, below is a schedule showing the activities of WCF, TMF and Other Funds for the years ended September 30, 2018, and 2017 (dollars in millions).
OTHER FUNDS EXCLUDING
WCF AND TMFWORKING CAPITAL
FUND
TECHNOLOGY MODERNIZATION
FUND OTHER FUNDS TOTAL2018 2017 2018 2017 2018 2017 2018 2017
BUDGETARY RESOURCESUnobligated Balance from Prior Year Budget Authority, Net $118 $125 $129 $131 $- $- $247 $256 Appropriations 261 275 - - 89 - 350 275 Spending Authority from Offsetting Collections 50 35 659 662 - - 709 697 Total Budgetary Resources 429 435 788 793 89 - 1,306 1,228
MEMORANDUM ENTRIESNet Adjustments to Unobligated Balance Brought Forward (3) (1) 29 24 - - 26 23
STATUS OF BUDGETARY RESOURCESNew Obligations and Upward Adjustments 287 314 693 693 1 - 981 1,007 Unobligated Balance, End of Period - - Apportioned, Unexpired Accounts 63 62 20 14 88 - 171 76 Unapportioned, Unexpired Accounts 38 22 75 86 - - 113 108 Unexpired Unobligated Balance, End of Period 101 84 95 100 88 - 284 184 Expired Unobligated Balance, End of Period 41 37 - - - - 41 37 Unobligated Balance, End of Period, Total 142 121 95 100 88 - 325 221 Total Status of Budgetary Resources 429 435 788 793 89 - 1,306 1,228
OUTLAYS, NETNet Outlays from Operating Activity 243 264 36 46 - - 279 310 Distributed Offsetting Receipts (89) (84) - - - - (89) (84) Total Net Outlays $154 $180 $36 $46 $- $- $190 $226

OTHER INFORMATION (UNAUDITED)
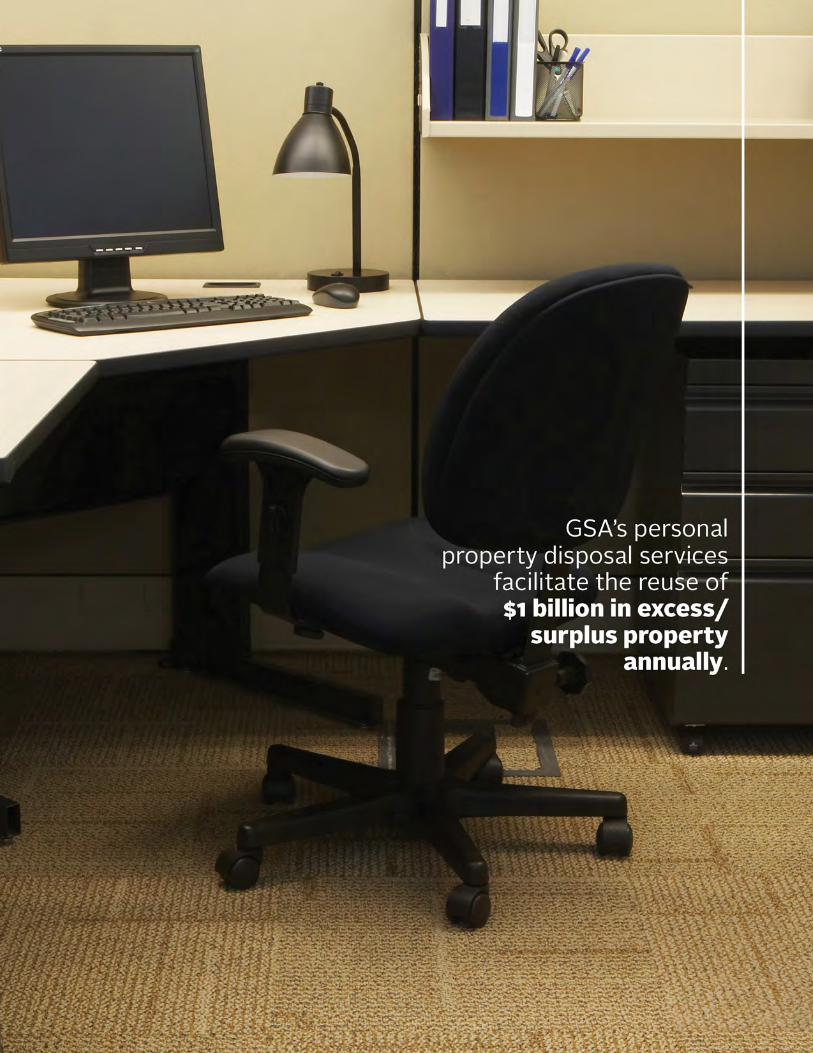

89FY 2018 AGENCY FINANCIAL REPORT • OTHER INFORMATION
INSPECTOR GENERAL’S ASSESSMENT OF GSA's MANAGEMENT & PERFORMANCE CHALLENGES FOR FY 2019

OTHER INFORMATION • FY 2018 AGENCY FINANCIAL REPORT90
Unaudited - See Accompanying Independent Auditors’ Report

91FY 2018 AGENCY FINANCIAL REPORT • OTHER INFORMATION
Unaudited - See Accompanying Independent Auditors’ Report

OTHER INFORMATION • FY 2018 AGENCY FINANCIAL REPORT92
Unaudited - See Accompanying Independent Auditors’ Report

93FY 2018 AGENCY FINANCIAL REPORT • OTHER INFORMATION
Unaudited - See Accompanying Independent Auditors’ Report

OTHER INFORMATION • FY 2018 AGENCY FINANCIAL REPORT94
Unaudited - See Accompanying Independent Auditors’ Report
95FY 2018 AGENCY FINANCIAL REPORT • OTHER INFORMATION
Unaudited - See Accompanying Independent Auditors’ Report

OTHER INFORMATION • FY 2018 AGENCY FINANCIAL REPORT96
Unaudited - See Accompanying Independent Auditors’ Report
97FY 2018 AGENCY FINANCIAL REPORT • OTHER INFORMATION
Unaudited - See Accompanying Independent Auditors’ Report

OTHER INFORMATION • FY 2018 AGENCY FINANCIAL REPORT98
Unaudited - See Accompanying Independent Auditors’ Report

99FY 2018 AGENCY FINANCIAL REPORT • OTHER INFORMATION
Unaudited - See Accompanying Independent Auditors’ Report
OTHER INFORMATION • FY 2018 AGENCY FINANCIAL REPORT100
Unaudited - See Accompanying Independent Auditors’ Report

101FY 2018 AGENCY FINANCIAL REPORT • OTHER INFORMATION
Unaudited - See Accompanying Independent Auditors’ Report
OTHER INFORMATION • FY 2018 AGENCY FINANCIAL REPORT102
Unaudited - See Accompanying Independent Auditors’ Report

103FY 2018 AGENCY FINANCIAL REPORT • OTHER INFORMATION
Unaudited - See Accompanying Independent Auditors’ Report

OTHER INFORMATION • FY 2018 AGENCY FINANCIAL REPORT104
Unaudited - See Accompanying Independent Auditors’ Report
105FY 2018 AGENCY FINANCIAL REPORT • OTHER INFORMATION
Unaudited - See Accompanying Independent Auditors’ Report

OTHER INFORMATION • FY 2018 AGENCY FINANCIAL REPORT106
Unaudited - See Accompanying Independent Auditors’ Report

107FY 2018 AGENCY FINANCIAL REPORT • OTHER INFORMATION
Unaudited - See Accompanying Independent Auditors’ Report

OTHER INFORMATION • FY 2018 AGENCY FINANCIAL REPORT108
Unaudited - See Accompanying Independent Auditors’ Report

109FY 2018 AGENCY FINANCIAL REPORT • OTHER INFORMATION
Unaudited - See Accompanying Independent Auditors’ Report

OTHER INFORMATION • FY 2018 AGENCY FINANCIAL REPORT110
Unaudited - See Accompanying Independent Auditors’ Report

111FY 2018 AGENCY FINANCIAL REPORT • OTHER INFORMATION
Unaudited - See Accompanying Independent Auditors’ Report

OTHER INFORMATION • FY 2018 AGENCY FINANCIAL REPORT112
Unaudited - See Accompanying Independent Auditors’ Report

113FY 2018 AGENCY FINANCIAL REPORT • OTHER INFORMATION
Unaudited - See Accompanying Independent Auditors’ Report
OTHER INFORMATION • FY 2018 AGENCY FINANCIAL REPORT114
Unaudited - See Accompanying Independent Auditors’ Report
115FY 2018 AGENCY FINANCIAL REPORT • OTHER INFORMATION
Unaudited - See Accompanying Independent Auditors’ Report

OTHER INFORMATION • FY 2018 AGENCY FINANCIAL REPORT116
Unaudited - See Accompanying Independent Auditors’ Report

117FY 2018 AGENCY FINANCIAL REPORT • OTHER INFORMATION
Unaudited - See Accompanying Independent Auditors’ Report

OTHER INFORMATION • FY 2018 AGENCY FINANCIAL REPORT118
GSA RESPONSES TO THE OFFICE OF INSPECTOR GENERAL’S MANAGEMENT CHALLENGES FOR FY 2019 (UNAUDITED)CHALLENGE #1: Establishing and Maintaining an Effective Internal Control Environment Across GSA
AGENCY ACTION PLANGSA agrees that internal controls serve as the first line of defense in safeguarding assets. However, GSA strongly disagrees that the agency has pervasive internal control weaknesses. GSA’s success in the financial audit has resulted in substantial reductions in findings from our independent public accountant (IPA) and no material weaknesses for the past 4 years. We value the insights provided by the OIG in their program audits and reports, and we take timely steps to implement corrective actions.
The GSA Administrator has made addressing audit recommendations an organizational priority, using individual performance plans to hold GSA senior management accountable for strengthening internal controls and improving audit results. In addition, GSA has active participation of senior leadership and the OIG in our internal control oversight team, the Management Control and Oversight Council (MCOC). No significant internal control challenges have been communicated to the MCOC by the OIG in these meetings or in the monthly meetings between the Inspector General, GSA Administrator, and Deputy Administrator. We remain committed and focused on developing a more effective internal control framework across GSA.
Over the last several years, GSA has worked to develop corrective action plans and has successfully implemented those plans to achieve a significant reduction in findings. GSA’s notifications, findings, and recommendations (NFRs) received from its IPA were reduced to three significant deficiencies by FY 2017. In addition, GSA has not reported a material weakness since 2014, as noted in the table below:
GSA IPA NFRs FY 2014 - FY 2017
Fiscal Year
Audit Opinion
Material Weaknesses
Significant Deficiencies
Non-Significant Deficiencies
Total
2014 Unmodified 2 37 12 512015 Unmodified 0 9 3 12*2016 Unmodified 0 4 12 162017 Unmodified 0 3 7 10
* Beginning in FY 2015, the IPA consolidated similar findings, thereby reducing the total number of NFRs.
119FY 2018 AGENCY FINANCIAL REPORT • OTHER INFORMATION
Out of the three significant deficiencies identified in the FY 2017 audit and highlighted by the OIG, two out of three significant deficiencies were closed by the IPA in FY 2018, based on their testing and assessment. GSA does not consider them an FY 2019 challenge. In FY 2017, GSA exceeded its apportionment for reimbursable activity and has completed a corrective action plan that led to the closing of this finding in FY 2018. In this instance, customer agencies had sufficient funds to authorize purchases by GSA, but the total amounts exceeded the business forecast that underpinned GSA’s reimbursable apportionment. GSA is working with OMB to improve the business forecasting process and review the apportionment requirements for reimbursable authority. The FY 2017 audit by our IPA also identified select controls around systems access and backups as a significant deficiency and that will continue to be addressed by GSA in FY 2019.
Regarding internal controls for GSA programs and operations, GSA leadership established new audit oversight processes in FY 2018 that hold GSA leadership and management accountable for timely development and implementation of corrective actions. GSA initiated new tracking and data analysis tools to enhance existing processes, leading to improved audit results. These tools form the foundation for data analytics that will enable insight into agency-wide performance.
GSA has demonstrated a strong track record in FY 2018 of responding to OIG audits. Eleven of the 18 audits and memoranda noted by the OIG are closed or require no further work. Of the remaining seven, GSA expects to close five by February 2019 and two are waiting on a response from the OIG.
Corrective actions were previously implemented for the following items identified by the OIG:
• Regarding the FAS controls over compliance with emission standards in the Pacific Rim region, GSA informed the OIG in April 2018 that steps have been taken to prevent future instances of non-compliance and that all vehicles cited for non-compliance were replaced or otherwise found to be compliant as of July 2017.
• Under our CAP for the ESPC White Oak Audit Findings, currently being reviewed by the OIG, we have completed reviews of the modifications identified in the audit report for re-compete possibilities. In addition, we have instituted an internal review process of any new significant modifications through a Within Scope Determination review/concur process that includes: Office of Acquisition Leadership, Office of General Counsel, National ESPC Program Office, and the Head of Contracting Activity before action is taken. In addition, some training on the areas identified in our CAP have been provided, including Department of Energy, Federal Energy Management Program ESPC Training, and the Competition in Contracting Act. Other areas (like Other Than Full and Open competition contracts, Acquisition Plans, and Price Negotiation Memorandum) are under development for training of personnel prior to the end of calendar year 2018. We have also implemented the National ESPC Policy developed by the GSA Central Office to ensure adherence to all applicable Department of Energy policies.
• Regarding GSA’s Computers for Learning (CFL) Program, the FAS Commissioner concurred with the findings on June 30, 2017, and informed the OIG that FAS is leading an interagency effort to improve the CFL program and ensure OIG’s recommendations are fully implemented. GSA has completed all steps in the corrective action plan.
• While GSA met five of the six requirements of the Improper Payments Act, we did not meet the .025 percent improper payment target established for the Rental of Space Program in FY 2017. We expect to be fully compliant with the FY 2018 target and do not view this as an FY 2019 challenge. In FY 2018, GSA’s proper payment rate for GSA’s Rental of Space program was 99.71 percent. Also, OMB has approved our request for relief from improper payment reporting for the Purchase Card Program, as a result of being compliant with the Act for this program for the past 3 years. Therefore, we do not consider purchase card testing or reporting an FY 2019 challenge. A copy of OMB’s approval was forwarded to GSA OIG on October 2, 2018.
In conclusion, GSA is committed to strengthening all financial, operational, and programmatic internal controls, and we take all audit findings seriously. GSA aggressively manages its corrective action plans and holds its executives

OTHER INFORMATION • FY 2018 AGENCY FINANCIAL REPORT120
accountable for execution of the plans. We are committed to working with the Inspector General to increase mutual communication about our performance on all audits and identify any control weaknesses that warrant GSA-wide attention.
CHALLENGE #2: Enhancing Government ProcurementSupporting the Acquisition Gateway
AGENCY ACTION PLAN - Acquisition GatewayLaunched in 2014, the Acquisition Gateway platform evolved from an initial focus on category management to addressing the shortcomings of agency contract writing and management systems. This fills a critical need of the acquisition workforce where FAS is uniquely positioned to create value within the scope of its mission while simultaneously deferring the investment in the platform. This is accomplished through the influenced value gained from access to its solutions and from investment by federal agencies in content and tools.
GSA agreed with the FY 2017 Management Challenge concerns regarding measuring Gateway success based on usage-based metrics such as the total number of users, and additional emphasis was placed on measuring return users as recommended. For example, from September 2017 to September 2018, the Gateway experienced a 27.6 percent increase in 90-day user return rate. At the same time, FAS enhanced its capabilities to track user journeys through the platform and experimented with goals-based measurements of success using advanced analytics to measure desired outcomes of the partner agencies and organizations contributing content and tools to the platform. One initial candidate has been the FAS Policy Library built on the platform in partnership with FAS’s Office of Policy and Compliance. Since launch, 129 users have visited the library and 49 of those have viewed two or more policy documents. Once baseline data is collected, targets could be selected for these measures or other related data as determined by the content owner.
Also, FAS carefully considered investment levels relative to potential returns as part of its duty to efficiently steward revolving funds accounts. The Gateway program is currently managed by 7 FTE and the yearly budget has been reduced by over two-thirds since FY 2017. In FY 2018, the Gateway generated in excess of $1 million in cost avoidance/savings from the reusable components inherent to the platform and influenced an estimated $1 billion of government acquisition spend. The inherent and influenced value of the platform will be measures of success in FY 2019.
In combination with FAS Customer Relationship Management tools, it is possible to develop analyses demonstrating clear correlations between Gateway usage and agency spend on governmentwide vehicles, including those designated Best in Class (BIC) by the OMB. Additionally, other agencies, including the Department of Defense’s Service Reform Team, have entrusted FAS with additional funding to build modern and efficient tools for their workforce on the Gateway platform to avoid costs associated with running duplicative IT platforms and establishing user bases.
Providing users unbiased information and best practices while facilitating access to FAS’s governmentwide solutions represent complementary, not competing priorities. Several agencies, including the Departments of Justice and Treasury, have chosen the platform to host their policy and compliance content due to low resource investment and ease of reaching their workforce. The Gateway also serves as the home of the Office of Federal Procurement Policy’s Acquisition Innovation Hub. Concurrently, governmentwide and BIC solutions from all potential government sources are easily available, including FAS. By design, clear indicators separate educational content from editorial and promotional materials. This is similar to how many information sources, including periodicals and other mass media, contain broad arrays of content to meet the needs of the information consumer while simultaneously supporting revenue generation.

121FY 2018 AGENCY FINANCIAL REPORT • OTHER INFORMATION
Transforming the Multiple Award Schedules Program
Consolidated Schedules
AGENCY ACTION PLAN - Consolidated SchedulesGSA kicked off the MAS Reform initiative in FY 2018, completing a detailed discovery phase to better understand the Schedules vehicle, including business trends. This included research related to previous attempts to consolidate portions of the Schedules program (including the Professional Services Schedule consolidation and associated management findings from OIG), conversations about the strengths of the Schedules program, what can be improved upon, and the associated risks. GSA has leveraged existing resources by utilizing a cross functional and integrated project team that includes subject matter experts from the acquisition workforce, systems architecture, finance, policy, customer and stakeholder engagement, and many other disciplines. This has allowed the acquisition workforce to participate and use industry days to have conversations and gain buy-in. GSA has been working closely with multiple members of the systems teams to identify various ways to utilize the current systems with minimal costs to promote consolidation.
At this time, GSA does not foresee any legislative changes necessary to consolidate Schedules. GSA is considering the impact that regulatory and internal acquisition policy changes would have on a Schedules consolidation effort.
With several strategic initiatives occurring simultaneously, FAS understands the need for cross-portfolio integration, communication, and transparency so the workforce has an understanding of each initiative and their implementation objectives. To coordinate these efforts, FAS has dedicated a team to serve as an overarching integrator of the federal marketplace strategy. The integration is designed to ensure the workforce, customers, and industry are kept aware of and have opportunities to participate in meeting the goals of this multi-year effort.
Transactional Data Reporting
AGENCY ACTION PLAN - Transactional Data ReportFAS and OGP reviewed the findings issued in the Transactional Data Report Pilot Evaluation Plan and Metrics Report (Report Number A140143/Q/T/P18004). On June 22, 2018, FAS and OGP provided detailed comments to the GSA Office of Inspector General (OIG), Office of Audits regarding the content of the report and recommendations included in the Report. On September 18, 2018, FAS and OGP submitted a CAP to OIG. On October 18, 2018, OIG confirmed that the CAP was responsive to the recommendations. FAS and OGP are committed to continue working with and considering input from all stakeholders in implementing the Transactional Data Reporting pilot.
Contract Awarded Labor Category Tool and the Replacement for the Formatted Product Tool
AGENCY ACTION PLAN - Contract Awarded Labor Category Tool and the Replacement for the Formatted Product Tool
GSA takes seriously its commitment to serve as a responsible steward of taxpayer dollars and to provide contracting officials with the policies, tools, data, and materials to award and manage contract vehicles that allow the Federal Government to achieve mission success. To achieve this, GSA appreciates that the tools must be reliable and user-friendly, as well as support regulatory guidance and, as appropriate, address the needs of vendors, GSA contracting officials, and federal buyers.
The Contract Awarded Labor Category (CALC) tool was built to augment search capabilities on GSA Advantage! and GSA e-Library to quickly and easily visualize labor category priced Schedules data. The tool provides basic pricing intelligence functions, certification and license information (where required and available), security clearance information, and keyword search capabilities. The tool is primarily used by customer agencies to conduct market

OTHER INFORMATION • FY 2018 AGENCY FINANCIAL REPORT122
research about companies who provide services under GSA Schedules contracts, the labor categories and rates are included in those contracts, and as one of the data points in developing estimates for task orders that will be competed under GSA Schedules. In contrast, GSA Schedules contracting officers use the tool as one part of their price analyses when awarding new Schedules contracts with labor category services and exercising options to extend the term of the contract modifications. In FY 2019, the tool will be evaluated as part of a larger effort to rationalize pricing tools being utilized across the organization. Future enhancements to CALC will be evaluated after this work is completed.
The Formatted Product Tool (FPT) was developed to be an enhancement to the existing eOffer/eMod tool used by the vendors to submit Schedules contract offers and modifications to the GSA contracting officials. The intent of the FPT enhancements was to provide an electronic tool that could help vendors and GSA contracting officials alike in important pricing and supply chain activities such as consistently identifying and displaying like or identical products, analyzing current pricing on existing Schedules as well as providing some commercial pricing context. As GSA recognized the need to provide better access to this type of data, a data analytics capability, 4P, was simultaneously developed. The 4P capability uses manual pulls of data from existing capabilities, runs analytical analyses, and provides the intelligence to the GSA contracting officials. However, 4P is not integrated into the legacy eOffer/eMod system. FPT was rolled out per the implementation plan to a small set of vendors in the Mid-Atlantic region’s acquisition center. The subset was selected to test the capabilities with a discreet group of trained contracting officials and vendors. After approximately three quarters, GSA determined that FPT was not ready to be rolled out to the broader Schedules population. The business and data rules developed for FPT and for 4P, as well as the experience in design capabilities, will be incorporated into the upcoming initiatives for an FAS enterprise contracting writing system and catalog management tools.
GSA Advantage!
AGENCY ACTION PLAN - GSA Advantage!GSA is continuously refining GSA Advantage! to improve functionality and content to meet the Federal community’s procurement needs, offer commercial vendors access to the Federal market, and continue to be a secure technology platform for all stakeholders. GSA has taken positive actions to solicit input from customer and vendor stakeholders to guide improvement efforts for GSA Advantage!.
For the first time, GSA’s annual Customer Loyalty Survey included a stand-alone survey for GSA Advantage!. We solicited customer input on many aspects of the site’s user experience and received over 4,700 responses. GSA is now developing action plans to address the main customer pain points identified in the feedback. GSA invited representatives from several large customer agencies (Veterans Affairs, Army, Navy, Marine Corps, and Homeland Security) to a newly established GSA Advantage Customer Advisory Group. The advisory group convenes quarterly to offer a forum for customers to discuss experiences with GSA Advantage! and for GSA to provide updates on key system changes. We are using feedback gained from the forum to inform and prioritize our improvement plan for GSA Advantage!.
In FY 2019, GSA plans to launch a transactional survey to ask customers for input on user experience as they complete their shopping sessions. The data collected will be used to inform and help prioritize investment decisions regarding the enhancement of GSA Advantage!.
We have completed or are in the process of developing several enhancements to GSA Advantage! to improve customer experience. We are also aware that minimum buying requirements are inconvenient for customers using GSA Advantage!. Many of the vendors displaying products on GSA Advantage! have these minimum requirements as a commercial term and condition of their Schedule contract, which carries forward for display on GSA Advantage!. To reduce the level of dissatisfaction, we are developing a solution to organize search results and product details to help customers quickly identify desired products that are not subject to minimums on GSA Advantage!. In addition, GSA is developing contracting approaches to reduce the incidence of minimum buying requirements on the underlying Schedules and GSA Global Supply contracts.

123FY 2018 AGENCY FINANCIAL REPORT • OTHER INFORMATION
GSA upgraded a self-help website application, Ask GSA, to allow Advantage and other customers to research and track order status, report a problem, or request information from GSA online, 24 hours a day. To further improve order status availability and accuracy, GSA’s contracting officers have developed contract conditions to encourage more vendors to utilize Electronic Data Interchange to provide better order status and visibility for customers.
GSA has deployed other features to keep pace with current technology and e-commerce practices. We developed an “automatic parked cart” feature, allowing customers to add products to a virtual shopping cart prior to completing a purchase, ensuring they can save products to purchase across multiple shopping sessions.
Based on customer feedback, GSA Advantage! now includes suggestive purchasing (e.g., “Customers who bought A also bought B.”) that recommends related products to customers based on prior sales and search data. This functionality allows customers to quickly find related products based on the search terms entered.
We are also working to ensure GSA Advantage! is a secure platform for its customers. GSA is adding multi-factor authentication for GSA Advantage! external e-commerce applications, GSA Advantage!, and eBuy. We are committed to managing supply chain risks that could impact national security and have removed from GSA Advantage! syndicated content referencing products prohibited by legislation and regulation.
GSA is increasing its collaboration with GSA Advantage! customers and has implemented changes in the Advantage e-commerce platform to reflect the feedback we have received. This trend will continue in FY 2019.
Implementing Procurement Through Commercial E-commerce Portals
AGENCY ACTION PLAN - Implementing Procurement Through Commercial E-commerce Portals
The FY2018 National Defense Authorization Act (NDAA) outlines implementation of commercial platforms over multiple years across 3+ phases:
• Phase 1: (90 days) Implementation plan;
• Phase 2: (90 days + 1 year) Market Research and Consultation;
• Phase 3: (90 days + 2 years) Implementation Guidance; and,
• Phase 4: (TBD) Additional implementation phases.
GSA and the OMB announced completion of Phase I in March 2018, which included an initial implementation plan with policy recommendations. As part of Phase I, GSA recommended legislative changes the agency views as optimal to begin the implementation of purchasing through e-commerce portals. The FY 2019 NDAA was signed on August 13, 2018, and contained the competition provision that grants GSA the ability to develop ordering procedures deemed compliant with the Competition in Contracting Act. However, our recommendation to increase the micro-purchase threshold to $25,000 for purchases through the GSA-approved commercial e-commerce portals was not part of the final legislation. In accordance with the legislation, Phase II required market research to inform a path forward.
Phase II (FY 2018/FY 2019) allocates a significant amount of time for market research and consultation with stakeholders across industry and government to learn more about their procurement needs and the role of e-commerce portals. As part of Phase II, a second report is due to Congress in March 2019. Since the submission of the Phase I report, the team has focused on market research with industry, customer agencies, understanding commercial practices, determining policy impacts, and assessing the impact to existing programs. These findings will be part of the Phase II report.
OTHER INFORMATION • FY 2018 AGENCY FINANCIAL REPORT124
GSA seeks to maintain the balance between existing government buying regulations and commercial buying practices. Over the last year, stakeholder engagement has been a focal point in order to gain an understanding of standard business-to-business e-commerce practices. It has also been an opportunity to collaborate with our agency partners to understand what rules are truly needed and important to the buying process. Our recommendations to date represent a balanced approach to meeting Congress’s direction to follow all commercial terms and conditions while also adhering to existing procurement rules and regulations.
On the basis of research to date, exploring a proof of concept in late 2019 will allow GSA to test the balanced approach in a controlled and structured environment, to include assessing the impacts to pricing and competition. The proof of concept will address in a smaller segment of the federal market limited risk and allow us to test acquisition reform concepts on a smaller scale before any long-term decisions are made. This proof of concept allows GSA to be innovative in its approach and to use the results to bring the federal marketplace more in alignment with a commercial model, including customary terms and conditions. It becomes a means of testing and proving the opportunity for simplification in acquisition.
GSA recognizes the risk of potential programmatic duplication, but also sees potential significant new benefits associated with reducing administrative cost and increasing speed. This program has the potential to, for the first time, introduce competition into the world of micro-purchases. Competition is at the heart of the Section 846 effort, and GSA is committed to creating a dynamic, highly competitive environment through partnerships with multiple commercial e-commerce providers. Additionally, Section 838 of the FY 2019 NDAA further emphasizes the need for competition at the order level, which GSA will address in its ordering procedures. Through the proof of concept, GSA will begin to demonstrate, on a small scale, the benefits of this competitive environment in the form of faster buys, reduced program costs, and the shifting of activities from the acquisition workforce to the program offices. The proof of concept also creates the potential for agencies to gain direct access to their spend data. While harvesting the power of spend data may take time, it will ultimately provide new insights on compliance with micro-purchase requirements and may even be useful in crafting smarter buying strategies.
With several strategic initiatives occurring simultaneously, FAS understands the need for cross-portfolio integration, communication, and transparency so that the workforce has an understanding of each initiative and implementation objective. To coordinate these efforts, FAS has dedicated a team to serve as the overarching integrator of the federal marketplace strategy. The integration is designed to ensure the workforce, customers, and industry are kept aware of and participate in the goals and progress of the end-state improvements of this multi-year effort.
Leading the Transition to Enterprise Infrastructure Solutions Contract
AGENCY ACTION PLAN - Leading the Transition to Enterprise Infrastructure Solutions Contract
GSA continues to partner with agencies and industry to achieve IT modernization and fiscally responsible acquisition of IT infrastructure by leveraging the GSA-awarded EIS contract. GSA has established an action plan to achieve the modernization objectives, address enterprise level transition, incorporate contemporary service delivery models, and deliver overall compliance (security, IT acquisition policy, etc.). To be successful, GSA recognizes that agencies and industry must also serve as strong partners in leading the transition toward IT modernization goals within an aggressive timeframe.
Additionally, the GSA action plan recognizes the challenges identified by the GSA OIG, including agency acquisition planning delays, full service exit, and transition execution. The central objectives of this action plan are to: (1) increase the collaboration within and across agencies and industry; (2) more aggressively leverage the transition to EIS to drive network infrastructure modernization as directed in the President’s Report on Federal IT Modernization issued in December 2017; (3) manage in a unique operating environment post EIS-award (e.g., need for dual operations during transition); and, (4) ensure the products and services delivered through EIS address the emerging and growing security challenges of today’s operating environment. A primary challenge in achieving
125FY 2018 AGENCY FINANCIAL REPORT • OTHER INFORMATION
these objectives is the time and effort required to complete transition prior to the 2020 expiration of many of the legacy contracts.
Agency transition delays reflect the governmentwide and market-wide nature of these challenges as opposed to isolated agency performance or GSA program management challenges. As cloud computing, software-defined networking, and mobile technology continue to blur the lines between traditional IT infrastructure and networking infrastructure, increased collaboration from all stakeholders is required to define modernization objectives, identify and share transition best practices, and meet the expectations of taxpayers.
The departure from the full service telecommunications delivery model reflects the need for modernization and greater compliance with statutes like FITARA and acquisition guidance. The telecom industry is considering eliminating legacy infrastructure components as early as December 2023. At the same time, Federal budget cycles limit agencies from moving away from this legacy infrastructure quickly. A five-year plan should be adequate for agencies to modernize their infrastructure in line with industry plans and move away from GSA-provided services to centralized management of the infrastructure under the Agency CIO.
GSA’s Action Plan to Lead EIS Transition addresses the challenges above and has the following components:
1. Agency Collaboration at Strategic and Tactical Levels: This includes continued transition support activities to help agencies inventory their infrastructure, develop solicitations, and share best practices regarding solicitation, evaluation, award, implementation, and ongoing management. Over the last 10+ months, GSA has deployed several contractor and internal resources with agencies via its Transition Ordering Assistance (TOA) contract to support EIS transition and also reviews the agency solicitation deliverables for scope and modernization measures. These TOA experts identified best practices in emerging technology such as Software Defined Networking, Zero Trust Networking, and unified communications to transform agency operations. GSA’s Transition Coordination Center (TCC) is also an enabler for agencies by providing the raw materials of inventory, structured process/tools (e.g., EIS Fair Opportunity Ordering Guide), and project plan templates/metrics to provide further assistance in their solicitation development. The TCC has also delivered multiple workshops and webinars regarding inventory collection, unified communication, and enterprise solicitation risk management. A critical agency milestone that remains is to release all solicitations by March 31, 2019. GSA will continue to administer an EIS advisory body called the Infrastructure Advisory Group, which consists of large agency representatives and is co-chaired by a cabinet level CIO. GSA hosts these forums for the purpose of addressing agency concerns and accelerating the identification of successes.
2. Industry Collaboration: EIS success requires collaboration and transparency between all industry, agency, and GSA stakeholders. Since the EIS awards, GSA has promoted these attributes via its Interact site, industry events, and collaborative outreach. GSA’s action plan will build on the openness and transparency with continued Quarterly Program Management Reviews with individual contractors and bi-annual PMRs with all contractors to ensure that tactical direction and strategic guidance (e.g., OMB/Federal CIO) are understood on a level playing field. The first major milestone with industry was the completion of all Business Support Systems testing and the bi-annual PMR. An additional example of partnership and GSA’s commitment to industry collaboration is the attainment of their FISMA Authority to Operate (ATO) at the moderate level. This milestone is required for any EIS contractor to receive a task order award and begin delivery of services. GSA has formed an ATO Tiger Team whose sole purpose is to assist each contractor in obtaining their ATO in the most expeditious manner possible.
3. Small Agency Support: As chartered in the President’s Report on IT Modernization, GSA looks to address small agencies lack of acquisition resources and technical expertise to bring best practices and scale in the

OTHER INFORMATION • FY 2018 AGENCY FINANCIAL REPORT126
acquisition of networking services historically purchased through GSA contracts. GSA will offer Assisted Acquisition Services support with two options to small agencies. One option will offer GSA to award the task order on behalf of the agency and then transfer the awarded task order back to the small agency for administration through close-out. The second option is for GSA to award and administer the task order on behalf of a small agency as a cradle-to-grave assisted acquisition for those agencies unable to administer the task orders themselves. A performance-based acquisition approach will be utilized to maximize industry expertise and to obtain the best technical solution. Industry will be involved early and throughout the process via an Industry day and Pre-Solicitation conference. It is anticipated that GSA will also release a draft RFP in order to partner with and collect feedback from industry.
4. Governmentwide Tools and Forums to Address Governmentwide Problems: Governmentwide Tools and Forums to Address Governmentwide Problems: GSA Conexus and the EIS Pricer that will come online in FY 2019 will enable automated ordering, provisioning, market pricing, and other management functions needed to oversee purchase, implementation, and management of modern government networks. Although not yet launched, these tools build on the success of the Networx program and already enabled EIS to be designated BIC due to its use of proven transactional data collection and analysis tools and processes. Building on its successful FY 2019 EIS Industry Partner Day and October 4 EIS Contractor PMR, GSA will host events in FY 2019 to further stimulate the market and ensure that sufficient collaboration exists to drive modernization while increasing value to taxpayers. GSA will listen to agency EIS transition managers to develop the agenda and content for these forums, the first of which is anticipated in Q2 FY 2019.
Delivering the System for Award Management
AGENCY ACTION PLAN - Delivering the System for Award ManagementThe Integrated Award Environment (IAE) Program Management Office (PMO) in GSA continues to focus on product delivery in the System for Award Management (SAM) modernization effort. The first release of beta.sam.gov was delivered in FY 2017, providing users with the ability to search and view public IAE data from one user interface. In FY 2018, GSA transitioned the Catalog for Federal Domestic Assistance to beta.sam.gov and decommissioned the legacy system, consolidated the Contractor Performance Assessment Reporting System (CPARS) and Past Performance Information Retrieval System (PPIRS), and completed technical pre-modernization for the Federal Procurement Data System (FPDS). In FY 2019, GSA will decommission PPIRS, transition Federal Business Opportunities to beta.sam.gov and decommission the legacy system, complete technical pre-modernization for the legacy SAM, migrate both FPDS and SAM to a cloud environment, and complete the FPDS and SAM integration development work into beta.sam.gov to present the legacy systems as candidates for retirement. This sets the stage to launch the new SAM.gov in Q1 FY 2020 and decommission both legacy FPDS and SAM. Our product delivery is monitored continuously by senior GSA management and the IAE governing bodies (OMB, ACE, PCE, FACE, and the IAE CCB). In addition, the GSA OIG team continues to formally monitor the modernization effort (to include cost, schedule, performance, as well as any current technical issues) on a bi-monthly basis.
Dedicated to increasing protection of users and data in FY 2019, GSA will build on the preventative measures and enhanced controls implemented in SAM.gov during FY 2018. GSA continues to actively support the investigative arm of GSA OIG, take action against bad actors, and update SAM.gov functionality to reduce future fraudulent activity. The partnership with GSA's Login.gov team and the GSA OIG investigators is strong. GSA has seen shifts in behavior based on enhanced controls already emplaced and is collaborating on further deterrents. Ongoing SAM.gov work includes modifications to the approach for sharing public data such as reducing the frequency of SAM public data extract publication (from daily to once a month) and removing from public availability any incomplete SAM entity registration data. These two modifications complement additional Application Program Interface (API) controls deployed in FY 2018. GSA believes the additional investment in this area is justified and is planning now for the work so as not to impact or delay the overall modernization schedule.
127FY 2018 AGENCY FINANCIAL REPORT • OTHER INFORMATION
In FY 2019, GSA plans to competitively award an entity validation services contract that will reduce burden on users, increase operational flexibility, and foster predictable transitions. The government intends to transition to a government-owned and - managed unique entity identifier supported by these entity validation services. GSA received proposals on October 12, 2018, in response to the Request for Proposal (RFP). Award is expected to take place in December 2018. GSA is prepared to complete the SAM.gov system development necessary to transition to the new unique entity identifier and supporting entity validation services in FY 2020. This procurement is part of an overall approach to improve SAM entity registration by consolidating all functions within the boundaries of SAM.gov.
CHALLENGE #3: Maximizing the Performance of GSA's Real Property Inventory
Reducing and Consolidating Space
AGENCY ACTION PLAN - Reducing and Consolidating SpaceGSA is leading efforts to improve asset utilization, reduce agency space requirements, effectively manage real property, and reduce our reliance on leased space to save money for the American taxpayer. GSA is helping agencies develop and implement aggressive space reductions while meeting their mission needs.
Since FY 2014, GSA has helped agencies reduce their space by over eight million square feet. In FY 2018 alone, GSA reduced its leased and Federally owned inventory by just over three million square feet.
GSA reduces space, vacancy, and costs through consolidations, co-locations, and disposition opportunities. In developing asset and investment strategies, GSA balances customer need, market dynamics, asset financial performance, asset condition, and value to the taxpayer. Specifically, PBS uses portfolio planning tools and processes, such as the integrated portfolio planning process, national customer strategy and success plans, asset segmentation, and asset repositioning tools. GSA also actively pursues savings on large dollar leases by reducing space, negotiating below market and setting longer firm term leases. Additionally, GSA has implemented a new requirements gathering process to allow sufficient time to develop cost-efficient housing plans, decrease vacant space, and limit extensions and holdovers. GSA will continue its efforts to review agency Reduce the Footprint plans for long-term real estate planning.
GSA tracks financial performance, cumulative reinvestment needs, fair market value, and the functional replacement value of its assets to develop strategies for every asset in the portfolio. While GSA strives to apply this comprehensive portfolio strategy to help make important decisions about reinvestment and consolidation opportunities, GSA is limited to appropriated funding, which is not enough to carry out all necessary Federal real property reinvestment needs. While GSA takes pride in the comprehensive analysis performed to help guide its portfolio strategy, limitations such as these also factor into the final portfolio decisions. Greater access to move and replication funding to support customer agency moves will help GSA deliver more consolidation projects, resulting in greater savings to the taxpayer.
The $20 million in consolidation funding PBS received in FY 2018 supported four consolidation projects. When complete, GSA’s customers will save $6 million in annual rental payments, reduce their footprint by approximately 95,000 usable square feet, and save the taxpayer approximately $4 million in private sector lease payments. In FY 2016 and FY 2017, GSA funded projects to reduce customer annual rental payments by $28 million and annual lease costs avoidance of $360 million with consolidation funding. GSA works with customers to optimize space, repurpose or dispose of under-utilized buildings, backfill vacant space, and develop investment strategies based on rigorous evaluation criteria.
Regarding vacant space reporting, GSA’s vacancy rate of three percent is significantly lower than the industry average. GSA is planning to amend its internal process to allow agencies to self-report underutilized space in

OTHER INFORMATION • FY 2018 AGENCY FINANCIAL REPORT128
non-cancellable Occupancy Agreements; however, this change will not materially impact PBS’s vacancy rate. Once reported as under-utilized and no longer needed, GSA will begin the process of marketing viable space to other agencies. This will involve a non-cancellable occupancy agreement policy change, revised standard operating procedures, training to impacted employees, and communication to customers announcing the change in FY 2019.
GSA works with its customers to better understand their housing needs, while developing asset investment strategies that improve the condition of the Federal portfolio and maximizes utilization to save money for the taxpayer.
Disposing Federal Property
AGENCY ACTION PLAN - Disposing Federal PropertySince FY 2016, GSA has met its disposal target by reducing the overall government footprint by 10.1 million square feet. In FY 2017 alone, GSA disposed of 123 assets governmentwide generating over $115 million in gross proceeds and resulting in a reduction of almost three million square feet. GSA made important strides during FY 2018 in rightsizing the Federal footprint and in developing strong partnerships to pave the way for greater success in the years to come. In FY 2018, GSA disposed of 140 assets governmentwide and generated over $123 million in proceeds. These disposals resulted in a reduction of 4,918,160 square feet and 2,735 acres from the Federal footprint.
With respect to the Lakewood land disposal, this property’s disposal action is on hold as it is subject to litigation brought by a nonprofit organization that provides services to the homeless. The organization is questioning the review of its application by the U.S. Department of Health and Human Services to acquire this property under a no-cost conveyance. With regard to the Federal Assets Sale and Transfer Act of 2016, GSA is awaiting the finalization of the board required under the statute.
Reducing Leasing Costs
AGENCY ACTION PLAN - Reducing Leasing CostsGSA has taken steps to reduce its overall lease costs, the amount of leased space occupied, and the number of leases in holdover or short-term extension status. Despite taking on new leasing requirements, as agencies with independent statutory authority turn to GSA to fulfill their leasing requirements (e.g., Veterans Administration and Security and Exchange Commission) and requirements that had been previously met through delegation of authority are returned, GSA’s Rental of Space budget has stabilized over the past four years.
Fiscal Year Rentable Square Feet Leased1 (in millions)
Rental of Space Budget 2(in thousands)
FY 2013 194.9 $5,210,198FY 2014 193.4 $5,387,109FY 2015 190.8 $5,666,348FY 2016 187.9 $5,579,055FY 2017 190.4 $5,628,363FY 2018 187.6 $5,590,141FY 2019 (Requested) TBD $5,430,345
1 PBS State of the Portfolio 2015-2019 and PBS External Lease Inventory
2 GSA Congressional Justifications 2015-2019

129FY 2018 AGENCY FINANCIAL REPORT • OTHER INFORMATION
To continue to focus on lowering lease costs, in FY 2018 GSA implemented its Lease Cost Avoidance Plan. This plan reduces GSA lease costs by lowering agency space requirements through innovative workplace strategies, negotiating lower lease rates, executing better lease terms, maximizing the backfill of vacant Federal space, leveraging online leasing tools (such as the Automated Advanced Acquisition Platform [AAAP]), and using the GSA Leasing Support Service Contract (GLS) more effectively.
The key to achieving this plan is replacing expiring leases, specifically the largest expiring leases in the GSA portfolio, in a timely fashion at reduced square footages and below market rates. Replacing leases timely begins with gathering client agency requirements earlier. To that end, GSA issued a policy directing the gathering of client agency requirements 12 months sooner (24 months sooner in the case of prospectus level projects). Agency requirements gathering begins 36 months before expiration or 60 months prior to expiration for a prospectus level project. Timely gathering of requirements for expiring leases is a PBS measure that is tracked monthly at the senior leadership level.
Timely replacing leases results in fewer holdovers and extensions. GSA ended FY 2018 with fewer leases in holdover than at the end of FY 2017. At the end of FY 2018, 58 leases (0.7 percent of the inventory) were in holdover status, as compared to 74 (0.9 percent) at the end of FY 2017. GSA tracks and monitors its holdovers monthly.
GSA strives to negotiate leases at below market rates. In FY 2018, the aggregate dollars of GSA-negotiated lease transactions were five percent below market costs for comparable leases, a cost avoidance of $120.7 million over the term of the lease.
As GSA replaces these expiring leases, it is focused on executing leases with better lease terms. Longer lease terms, where appropriate, reduce lease costs by decreasing the risk of the lease to the financing community, which results in better rates for the Government. Both the full and firm term of GSA leases have continued to increase in the past fiscal years. In FY 2015, 20 percent of leases executed in that fiscal year had a firm term of 10 years or greater; in FY 2018, 35 percent of leases had a firm term of 10 years or greater.
Finally in FY 2018, GSA increased the use of its workforce multiplier tools: AAAP and GLS. Maximizing the use of these tools enables GSA to replace more leases in a given fiscal year, reducing holdovers, extensions, and lease costs. In FY 2018, GSA increased the number of leases awarded using the AAAP by 140 percent. In FY 2018, 308 leases were awarded in AAAP. Additionally, in FY 2018, GSA increased the number of lease acquisition projects utilizing our broker partners by 61 percent. In FY 2018, 378 projects utilized the GLS contract. GSA will continue to maximize the use of these tools in FY 2019 through its performance metrics.
Administration of Leases
AGENCY ACTION PLAN - Administration of LeasesGSA has taken steps to improve the lease management program, strengthen communication between stakeholders, and enhance its internal electronic enterprise tools to increase efficiency.
In FY 2017, GSA established the National Lease Occupancy Oversight Review Team and developed a regional self-assessment process for Contracting Officer Representative (COR) Lease Administration in accordance with the PBS Lease Management Desk Guide (LMDG) and other applicable PBS policy and guidance. In FY 2018, each GSA region performed the program self-assessment. GSA assigned each Region to review 25 lease COR files for a total of 275 lease files. The criteria used to select the lease pool included a variety of CORs, a wide geographic area, a broad range of lease effective or expiration dates, and leases with assorted rentable square footage. The self-assessment contained 37 questions regarding proper documentation, including, but not limited to, lease inspections, disseminating inspection results, inspection follow-up, the cure process, and other required

OTHER INFORMATION • FY 2018 AGENCY FINANCIAL REPORT130
documentation in accordance with current PBS guidance.
Each Region compiled a narrative findings report and corrective action plan, which GSA combined into a national findings report and corrective action plan. GSA communicated the findings and plan to leadership, management, and personnel responsible for oversight of the lease management program. The national corrective action plan includes, but is not limited to:
• Strengthening communication between business lines and partnering, whereby each Region submitted a joint communication plan in August 2018;
• Soliciting management support in reinforcing the use of the LMDG, the Lease Management Tool (LMT), the GSA Real Estate Exchange application, and other applicable e-tools;
• Delivering a “Leasing Lite Learning” session to communicate the findings and corrective action plan, and promote improved communication using regional communication plans from the leasing and lease management community;
• Updating the Lease Acquisition Training to promote the involvement of the Lease Administration Manager or COR in the acquisition process;
• Updating the 2014 Lease Management Program Training;
• Completing LMT enhancements to implement a revised Lease Inspection Form 500 and the form’s offline capability; and
• Requesting e-tool workflow and automation enhancements, which include:
• Requesting to automate COR letters;
• Requesting to automate the net lease service contract procedures to include Occupancy Agreement updates; and
• Automating Overtime Utility procedures and checklist.
PBS Lease Administration has been incorporated into the agency-wide FY 2019 Procurement Management Review under the Office of Government-wide Policy oversight.
Meeting the Operations and Maintenance Needs of Federal Buildings
AGENCY ACTION PLAN - Meeting the Operations and Maintenance Needs of Federal Buildings
GSA’s approach to delivering safe, reliable, and functional work environments is focused on the optimization of the GSA operation and maintenance program to mitigate the inherent risk associated with sustained cost reduction efforts.
GSA has taken steps to enhance program oversight and compliance through GSA’s agency-wide maintenance management system (ensuring maintenance accomplishment and service delivery) and transactional customer feedback. The current satisfaction is rated a 4.3 out of 5. To ensure consistent delivery of services across its portfolio, GSA revised the Management Analysis Review System (MARS) to be completed and implemented in FY 2019. In seeking to increase transparency of operation and maintenance expenditures at a granular level, tableau monthly reports are posted on Data to Decisions (D2D). To ensure costs associated with above standard services are recovered, GSA has reviewed over 4,000 FY 2019 overtime utility estimates for accuracy, resulting

131FY 2018 AGENCY FINANCIAL REPORT • OTHER INFORMATION
in an additional $1.2 million to be collected. GSA continues to strengthen controls to ensure accurate coding of transactions. There are ongoing efforts to institutionalize approaches and tactics that have proven successful through networking and sharing of best practices, including monthly meetings with Facilities Management and Service Centers communities to share information and best practices.
Seeking to leverage acquisition strategies from a portfolio-wide perspective, GSA is promoting the use of FAS 03FAC schedules. Finally, GSA is making efforts to strengthen vendor alliances through a partnering initiative and working closely with AbilityOne and SourceAmerica. GSA agrees with the IG’s statement: “The risk that reduced levels of building operations and maintenance could lead to increased costs is especially problematic since the identified repair needs of PBS's building portfolio are already high and growing.” One of the Office of Facilities Management’s strategic initiatives for FY 2019 is to begin implementation of a five-year plan to gain efficiencies by optimally utilizing acquisition tools and strategies, including aggregation of requirements, while not impacting services. Deferring required annual preventive maintenance is not an acceptable cost reduction strategy.
Ensuring Effective Management of Energy Savings Performance Contracts and Utility Energy Service Contracts
AGENCY ACTION PLAN - Ensuring Effective Management of Energy Savings Performance Contracts and Utility Energy Service Contracts
GSA appreciates process improvement recommendations ensuring effective management of energy savings performance contracts (ESPC) and utility energy service contracts (UESC). Various efforts have been implemented to address these challenges.
With regard to ESPC oversight, GSA has implemented a new Portfolio Review Process to monitor the extent to which ESPC projects are achieving expected savings at both the portfolio and individual levels.
With regard to ESPC Standardization and Process Improvements, GSA has instituted a policy of procuring all new large/complex ESPCs through use of the U.S. Department of Energy (DOE) ESPC Indefinite Delivery/Indefinite Quantity (IDIQ) contracts. The procurement of large/complex ESPCs is now only being performed by the central office ESPC Program Management Office (PMO). Centralized procurement provides GSA the means to standardize contract terms and incorporate ESPC best practices and lessons learned. In rare cases, a region may desire to use a contracting vehicle other than the DOE IDIQ. In these circumstances, the region must provide the centralized ESPC PMO a written justification explaining why it is in the Government’s best interest to use a different contract vehicle. If the justification is approved, the acquisition plan for the contract must include a review and approval by the Head of the Contracting Activity. All stand-alone ESPC contracts must include an approved Measurement and Verification (M&V) as part of the contract award.
In addressing ESPC compliance, GSA provided ESPC training to GSA Regions in February 2018. A guidance document entitled, “Operational Guidance and Instructions Outlining Roles, Responsibilities, Administration and Reporting Requirements for Energy Savings Performance Contract (ESPCs)” was provided to regional personnel in January 2018. This guidance addresses building “Hold Status.”
With regard to addressing pricing risk, in accordance with DOE contract procedures, ESCO selection is based upon a qualifications competition. To help ensure reasonable pricing at the time of task order award, the selection criteria has been adjusted by GSA to include price components for key cost drivers. To address performance risk the ESPC Portfolio Review Plan process provides program level visibility of government actions and market conditions that pose a risk to achieving the guaranteed energy savings on individual ESPC contracts. In addition, newly procured ESPC contracts include use of DOE Measurement & Verification Guidelines v4.0, which requires ESCOs to document and explain adjustments made to the energy baseline during the performance period and designate responsibility (ESCO or Government action) for any energy savings shortfalls. The documentation is provided

OTHER INFORMATION • FY 2018 AGENCY FINANCIAL REPORT132
annually in the M&V report.
Finally, GSA will electronically identify equipment associated with ESPC contracts within our National CMMS system. This will streamline the process of monitoring ESPC related requirements and ensure that ESPC equipment is not modified, de-commissioned, or removed prior to ESPC contract completion. The enhanced monitoring capability and protection of equipment against unauthorized actions will assist in ensuring Government-caused energy savings shortfalls are minimized.
In order to promote competition and address contracting risk, the PBS National Capital Region instituted new procedures to: (1) formalize contracting officers’ documentation of any determination that large change orders are within the scope of the original contract or order; and (2) re-emphasize the need for a justification for an exception to full and open competition or fair opportunity in instances where the change is outside of the scope of the initial contract or order.
PBS continues to adhere to the Limitation of Government Obligation policy, per Procurement Instructional Bulletin 16-01, Rev. 2.0 (Sept. 28, 2016).
UESCs; include Mandated Savings Guarantees, Limited Competition, and Sole Source Contracts.
UESCs procured after October 2012 require the following elements: (1) energy savings performance assurances or guarantees of the savings to be generated by improvements, which must cover the full cost of the Federal investment for the improvements; (2) measurement and verification of savings through commissioning and retro-commissioning; and (3) competition or an alternatives analysis as part of the selection process prior to entering into a UESC. GSA guidance, entitled “Procuring Energy Management Services with the GSA Area-wide Contract,” states that language must be included in the negotiated Authorizations (i.e., Performance Assurance Plans) that secure guarantees of the energy and/or cost savings. If more than one franchised utility company is available in the service area or if the area-wide contract is determined to be non-advantageous, the facility is required by the Federal Acquisition Regulation (FAR) to acquire service via competitive acquisition procedures (i.e., separate contract), allowing all utilities the opportunity to bid for service. If the area-wide contract is determined to provide the best value to the Government in response to the need for energy management services, the process must be documented through the justification and approval process as outlined in the FAR.
CHALLENGE #4: Prioritizing Agency Cybersecurity
Protection of GSA's Building Control Systems against Cyber Attacks
AGENCY ACTION PLAN -Protection of GSA’s Building Control Systems against Cyber Attacks
GSA IT, in partnership with PBS, will continue to enhance the overall security of building systems. These initiatives include: maintaining a full and complete inventory of building management systems; taking a proactive approach to identify and modernize at-risk building systems; targeting high-risk buildings and at-risk technologies investing in the hygiene of the network infrastructure; implementing personnel and technology process improvements; conducting vendor outreach and management; and training the workforce.
GSA IT and the PBS Office of Facilities Management (OFM) currently utilize a Risk Management Framework (RMF) scorecard to identify and prioritize at-risk building systems. In FY 2018, GSA assessed 30 buildings and applied the framework to focus on 17 prioritized buildings. In FY 2019, GSA will apply the RMF scorecard to 40 additional buildings to identify key focus areas for the year; which will include the following activities:
133FY 2018 AGENCY FINANCIAL REPORT • OTHER INFORMATION
• Categorize systems and data by that system based on practical impact of the system;
• Select and tailor baseline security controls for the system based on potential security impacts;
• Implement security controls;
• Document how the controls are deployed within the system and operating environment;
• Periodically assess the implemented security controls to determine how well the controls are implemented and operating;
• Authorize use of the systems based upon a risk-management determination of the actual risk presented by the system; and
• Regularly monitor and assess selected security controls in the system including:
• assessing security control effectiveness;
• documenting changes to the system or operating environment;
• conducting security impact analyses of any associated changes; and,
• reporting the security posture of the system to appropriate stakeholders.
GSA will also develop a funding and procurement strategy to address operational risks across the building systems portfolio. This will include identifying and replacing End of Life technology, completing an audit of circuit and network connections to ensure appropriate security controls are in place, and mitigating other potential vulnerabilities through active and continuous diagnostics and monitoring.
Vendor and employee outreach efforts will continue in FY 2019 to ensure products adhere to Federal IT and cybersecurity requirements and that employees understand and respond effectively to building related security vulnerabilities. GSA IT and PBS OFM will hold regular meetings with industry to ensure products meet Federal and GSA security policies and processes. GSA IT will also provide workforce training on cyber hygiene to address issues of sharing passwords and following IT security policies.
In addition to engaging the workforce, GSA IT will continue to partner with PBS to ensure that building system stakeholders are aware of security requirements and the importance of securing GSA facilities against risks and incidents. GSA will provide guidance and language to include in leasing agreements to outline cybersecurity requirements that are in line with existing cybersecurity and IT policy.
Controlling Access to Sensitive Information in GSA Systems
AGENCY ACTION PLAN - Controlling Access to Sensitive Information in GSA Systems
GSA IT will continue to modernize and strengthen its cybersecurity defenses to proactively address known and evolving threats. GSA IT will provide a wide array of cybersecurity services across GSA to protect the agency’s sensitive information, while monitoring and responding to threats and breaches to the network. In FY 2019, GSA IT will continue to control access to sensitive information in GSA systems by:
• Working with the system owners to ensure that privileged accounts for applications, databases, and at the operating system level, by FISMA system, have been recertified for proper roles and access.
• Continuing to participate in the DHS Continuous Diagnostics and Mitigation program. As part of the program, GSA will implement solutions and capabilities supporting the privilege management across the enterprise for
OTHER INFORMATION • FY 2018 AGENCY FINANCIAL REPORT134
all accounts that provide elevated privileges by the end of FY 2020.
• Ensuring that the enterprise infrastructure support contract has Service Level Agreements that meet critical cybersecurity requirements and metrics of the Agency and the Federal Government.
• Continuing to provide ongoing monthly training to the cybersecurity stakeholders responsible for the implementation of key cybersecurity controls within GSA information systems. These topics shall be reviewed continuously based on the emerging threats to GSA information systems.
• Ensuring that Contracting Officers, Contracting Officer Representatives, and program managers verify that the appropriate cybersecurity language is included in all GSA IT contracts, as outlined in GSA policy and procedures.
• Conducting security self-assessments focused around the findings and recommendations from the FY 2018 FISMA and financial audits.
• Reviewing all mobile device management policies and practices for validity against the current threat environment.
• Performing an analysis and developing a plan to implement data at rest encryption for all GSA information systems, including contractor-owned and -operated, that store, process, and transmit Personal Identifiable Information (PII) and financial information.
In addition, GSA will implement new technologies, policy updates, and process improvements to continue decreasing the risk of unintentional mishandling of GSA’s data and ensure prompt and effective responses to reported breaches. This will be achieved through the following activities in FY 2019:
• Continuing to provide targeted, role-based training to system owners, program managers, and others responsible for the implementation of key privacy controls within GSA information systems. The training offerings shall be reviewed continuously based on privacy risks identified in GSA information systems.
• Holding a tabletop breach response exercise with the goals of practicing notifying internal stakeholders, escalating an incident as a "major incident," testing the agency breach response procedure, and helping ensure that members of the Full Response Team are familiar with the plan and understand their specific roles.
• Providing the Senior Agency Official for Privacy with a report detailing the status of each breach reported during the previous fiscal year.
• Submitting to the OIG a revised corrective action plan for assignment 180001 to address the elements of the original corrective action plan that the OIG found were not fully implemented.
CHALLENGE #5: Managing Human Capital Efficiently to Accomplish GSA's Mission
AGENCY ACTION PLAN - Managing Human Capital Efficiently to Accomplish GSA's Mission
Agency Action: Continue to conduct enterprise-wide Workforce Planning in support of GSA’s Long-Term Workforce Plan and Human Capital Operating Plan.
GSA is actively mitigating the risks and challenges associated with GSA’s high-retirement eligibility by efficiently
135FY 2018 AGENCY FINANCIAL REPORT • OTHER INFORMATION
managing human capital to accomplish GSA’s mission. GSA workforce planning efforts during FY 2018 have targeted these human capital risks, particularly for mission-critical occupations (Acquisition, Financial Management, Information Technology, Program Management, Property Management, Realty, and Human Resources).
In FY 2018, GSA launched workforce planning enterprise-wide to identify and address gaps between the workforce of today and the human capital needs of tomorrow. Partnering with agency Service and Staff Offices (SSO), GSA’s Office Of Human Resources Management (OHRM) conducted workforce assessments to define each organization’s desired future state and human capital requirements. These involved workforce analyses, skills gap identification, and the development of actionable workforce plans that outline strategies to close the skills gaps.
GSA Workforce Planning assessments further confirmed the need to address risks associated with turnover rates and high retirement eligibility, through succession management and knowledge transfer. SSO workforce action plans were completed in Q3 FY 2018. Implementation of workforce action plan strategies has begun and will continue throughout FY 2019. Key workforce planning focus areas for the agency include: retention; organizational design/functional alignment; recruitment/staffing; talent development; succession planning; and performance management. GSA will continue to pursue an annual workforce planning cycle to ensure human capital strategies are updated to reflect the evolving human capital needs of the agency.
To maintain expertise in mission-critical occupations, GSA also plans to establish an enterprise-wide competency management program to build critical competencies needed throughout the agency and to support agency succession planning.
CHALLENGE #6: Safeguarding Federal Facilities and Providing a Secure Work Environment
AGENCY ACTION PLAN – Safeguarding Federal Facilities and Providing a Secure Work Environment
The Office of Mission Assurance (OMA) continues to collaborate with the Federal Acquisition Service (FAS), the Public Buildings Service (PBS) and other internal partners to ensure that contractors are properly cleared prior to gaining access to GSA facilities and systems. OMA also conducts ongoing training sessions with GSA Requesting/Contracting Officials in an effort to increase compliance and streamline the contractor clearance process.
GSA has been working on improving the Facility Security Assessment (FSA) process overall, with a focus on training for GSA employees. In addition to the GSA FSA order with responsibilities for both OMA and PBS, GSA has recently released a FSA plan with actions for future years. To date, hundreds of PBS property managers have attended in-person training offered by the Interagency Security Committee (ISC). GSA and the ISC are also looking into providing GSA with online training modules administered through GSA’s Online University that can be offered to a larger group of people while also tracking completion status.
GSA has created a standardized process that governs the distribution and use of Personal Identity Verification (PIV) cards for contractors. This process requires the completion of a background investigation for contractors and outlines a phased-approach that bans the distribution and use of generic facility access cards in GSA-controlled facilities. Further, over the past fiscal years, GSA has worked diligently to improve the tracking and the maintenance of data in GSA's Credential and Identity Management System (GCIMS). GCIMS was updated to capture collection and destruction of GSA Access Cards. A GCIMS user guide was also created for system role holders. The thousands of records were validated after the GSA Office of Inspector General Report was released, and GSA now updates the data on a monthly basis to ensure the most current data is being used.

OTHER INFORMATION • FY 2018 AGENCY FINANCIAL REPORT136
OMA continues to partner with the Federal Protective Service (FPS) and receives quarterly updates regarding completed FSAs in GSA facilities. The current FSA data that GSA received from FPS (more than 1,400 records) contained more data points than in the past, including the Facility Security Committee chairperson’s contact information, the date of the completed assessment, the assessment presentation date, and the date of the next in-cycle assessment. GSA is surveying property managers to ensure receipt. The FSA collection process will continue to improve in FY 2019 as the GSA/DHS Memorandum of Agreement has just been signed. GSA will receive a digital copy of all FSAs. Creating a gateway for GSA to view and receive the digital FSA from the FPS repository will allow GSA to review, store, and distribute the FSAs as necessary. OMA will continue to have an open dialogue with FPS on the overall FSA process at each step.
CHALLENGE #7: Managing Revolving Funds Effectively
Acquisition Services Fund
AGENCY ACTION PLAN - Managing Revolving Funds EffectivelyGSA works to ensure that its revolving funds, including the Acquisition Services Fund (ASF), have revenues to cover expenditures and that the necessary budgetary controls are in place. For the ASF, GSA looks at Net Operating Results and Net Financial Impact (NFI), which determine the ASF’s net gain/loss before and after making strategic investments using the fund’s accumulated retained earnings. Since its inception in FY 2007, the ASF has generated retained earnings as the result of positive net income in prior years. Over the last few years, GSA has made investments that have drawn down accumulated retained earnings in the short term but should generate a positive financial return in the long run.
The $8 million loss in FY 2017 is the ASF’s financial position after accounting for strategic investments GSA made to enhance its operating posture. This amount is effectively break-even relative to $10.3 billion in revenue. Because the ASF has fixed costs and fluctuating levels of customer orders, there may be very small net losses on an annual basis. But GSA closely manages the fund so that losses in a given year do not detrimentally affect the overall health of the fund. Additionally, the FAS Commissioner has been working with each of the ASF business lines to ensure full cost recovery of the fund and GSA expects the ASF to break even at the NFI level in FY 2020. FAS is constantly exploring innovative ways to increase business volume, adjust rates, or reduce costs.
The Technology Transformation Services (TTS) under FAS will continue to review and optimize cost structures and business opportunities, including staffing level reviews to assess and optimize billable and non-billable workload. In FY 2019, several focus areas are planned around the ongoing efforts to increase staff utilization rates. These efforts include conducting weekly projections and increasing the management of individuals’ utilization performance; continuing to aggressively manage the pipeline of actual and potential work orders to ensure that expenses are managed and the workforce is utilized efficiently; and continuing to expand use of the ASF authorities to secure multi-year interagency agreements with other agencies to maximize staff utilization. A culture of cost recovery and personal accountability will continue to be emphasized and reinforced. Additionally, individual performance plans will be updated to promote focus and accountability on increasing utilization rates driving toward cost recoverability.
Optimization of TTS’s cost structure will also include a thorough review of billing rates to customer agencies by conducting market research and pricing analysis to ensure competitive pricing while increasing profitability. TTS will also continue to explore new billing models under ASF authority.
On the cost savings side, TTS will assess travel and training budget allocations to optimize resource levels and execution rates. The organization will continue to explore cost saving measures for travel and further reduce the training budget. TTS will continue to decrease overall impact to weekly utilization rates by limiting simultaneous conference attendance and training.

137FY 2018 AGENCY FINANCIAL REPORT • OTHER INFORMATION
Finally, in FY 2019, TTS will focus on developing deeper client relationships and partnering on larger and more impactful modernization projects and initiatives. TTS will define and organize our brand internally around a clear set of complementary service and product offerings. The organization will grow the project pipeline by marketing products and services to attract new customers and highlight industry best practices. By adding new services for existing customer agencies, attracting new customers, and executing plans to expand Centers of Excellence, cost recovery goals in alignment with FAS break-even objectives can be achieved.
Regarding budgetary control issues, GSA exceeded its FY 2017 ASF apportionment limitation with respect to flow-through activity. This activity is related to customer orders where GSA has entered into a reimbursable agreement with agencies to procure goods and services for the customer agency. Orders with GSA are funded out of customer agencies’ appropriations to ensure that government funds are available. Agency flow-through obligations are inherently difficult to predict because they fluctuate significantly over time. GSA processed more than $2.3 billion in flow-through obligations in September 2017, which represented a 30 percent increase over what was recorded in September 2016. This was higher than the anticipated customer orders that had been built into the ASF’s apportionment. Even though the ASF obligations were based on valid, funded customer orders, the ASF flow-through apportionment limitation was exceeded.
In response to this, GSA initiated a Corrective Action Plan (CAP) with four actions:
1. Establish monthly monitoring controls over apportionment levels, including updates on monthly levels in briefings with OCFO and FAS leadership, and create an automated SF-133 report to assist in this process;
2. Develop monthly forecasts for end-of-year apportionment based on historical data and business volume projections;
3. Establish a process for reapportionment, which ultimately leads to a monthly determination by the FAS Budget Director as to whether an adjustment to the apportionment is necessary and should be communicated to the GSA Budget Director; and,
4. Explore the feasibility of developing and implementing automated preventive system controls in FAS’s ordering systems to alert users of activity.
All four corrective actions have been completed. GSA’s auditor has accepted and validated this CAP, and GSA is also working with OMB to consider measures that would allow for flexibility in its apportionment to accommodate the uncertainty surrounding flow-through obligations.
CHALLENGE #8: Implementing GSA's Role Under the Comprehensive Plan for Reorganizing the Executive Branch
AGENCY ACTION PLAN - Implementing GSA's Role Under the Comprehensive Plan for Reorganizing the Executive Branch
GSA agrees that the integration of the U.S. Office of Personnel Management’s (OPM) functions into GSA offers an opportunity for considerable operational efficiencies while acknowledging that the transition will be challenging. GSA and OPM are committed to conducting the merger in a way that minimizes service disruption for OPM and GSA customers and employees. We have initially been focused on ensuring a successful transfer of OPM’s Human Resources Solutions (HRS) to GSA, while concurrently, The Executive Office of the President initiates analysis of the potential move of retirement and healthcare benefits. GSA and OPM are developing the value proposition and qualitative business case for the merger and will continue to analyze the most effective way to integrate OPM functions into GSA while taking into account the Federal employees who rely on the services. GSA and OPM have developed an initial list of risks and mitigation strategies that we will monitor and implement throughout the transition.

OTHER INFORMATION • FY 2018 AGENCY FINANCIAL REPORT138
On June 21, 2018, the same day the President’s Reform and Reorganization Plan (Plan) was released, GSA kicked off its Task Force to plan and execute the merger. The GSA Task Force is led by Mary Davie, a senior executive in GSA who has prior experience with large reorganizations focused on fee-for-service federal organizations. The GSA Task Force, which meets weekly as a group, has representation from the Public Buildings Service, the Federal Acquisition Service, and all GSA staff offices. Working with their OPM counterparts and HRS leadership, the Task Force members have developed the transition and implementation plan to move HRS and its supporting functions and technology to GSA. Each functional area (human resources, CFO, CIO, facilities, personnel security, procurement, legal, and administrative support services) has created project plans identifying all required activities and milestones to effect the transition in their respective functional area. The OPM and GSA Task Force leads provide oversight and coordination between the organizations and track project plan activities. In addition, GSA has acquired contract assistance to support strategic planning and ensure successful execution in alignment with recognized best practices and approaches. The June 2018 GAO Framework 18-427 “Key Questions to Assess Agency Reform Efforts” is being used as a guide in this merger.
GSA recognizes the importance of communication, engagement, and change management for all stakeholders. GSA and OPM have created a robust communications plan that includes employees, customers, industry partners, and external stakeholders to ensure they receive accurate and timely information ahead of key dates in the transition and implementation plan to move OPM functions and technology to GSA. Examples of internal communications include: weekly briefings to the GSA leadership team; monthly updates provided to all GSA executives; and numerous agency-wide communications through town halls, emails, blog posts, a video communication and shared email inbox. In addition to the July 2018 Homeland Security and Government Affairs (HSGAC) hearing, GSA, OPM, and OMB briefed the relevant authorizing Committees and the House Committee on Oversight and Government Reform) in July, shortly after the release of the Plan. Subsequently, all three entities jointly briefed the authorizing Committee staff and the House and Senate Appropriations staff in September, with a commitment to provide regular briefings on the merger’s progress.
GSA recognizes the importance of determining the appropriate organizational structure for OPM functions within GSA and understands the criticality of successful and timely onboarding of staff. To achieve this, GSA and OPM are undertaking a best business fit analysis to guide placement of OPM products/services/solutions within GSA and to determine other organizational realignments that may increase efficiency and align offerings. The analysis will include impacts to workforce and customers, and is planned to be completed in early Q2 of FY 2019. As a service provider to Federal, state, and local entities worldwide, GSA understands the importance of ensuring a smooth transition of staff in order to minimize or eliminate disruption to customers and the industry partners who do business through us. GSA also has experience with transition of employees, technology, and functions to other agencies and will use that experience and lessons learned to help guide the GSA/OPM merger.
GSA is committed to working with Congress and staff, as well as GAO and OIG, in providing information on the transition and supporting their oversight roles.

139FY 2018 AGENCY FINANCIAL REPORT • OTHER INFORMATION
SUMMARY OF FINANCIAL STATEMENT AUDIT AND MANAGEMENT ASSURANCES (UNAUDITED) Table 1 Summary of Financial Statement Audit
Audit Opinion UnmodifiedRestatement No
Material Weaknesses
Beginning Balance New Resolved Consolidated
Ending Balance
Total Material Weaknesses 0 0 0 0 0
Table 2 Summary of Management Assurance
Effectiveness of Internal Control over Financial Reporting (FMFIA § 2)Statement of Assurance Unmodified
Material Weaknesses
Beginning Balance New Resolved Consolidated Reassessed
Ending Balance
Total Material Weaknesses 0 0 0 0 0 0
Effectiveness of Internal Control over Operations (FMFIA § 2)Statement of Assurance Unmodified
Material Weaknesses
Beginning Balance New Resolved Consolidated Reassessed
Ending Balance
Total Material Weaknesses 0 0 0 0 0 0

OTHER INFORMATION • FY 2018 AGENCY FINANCIAL REPORT140
Compliance with Federal Financial Management System Requirements (FMFIA § 4)Statement of Assurance Federal Systems comply to financial management system requirements
Non-ComplianceBeginning Balance New Resolved Consolidated Reassessed
Ending Balance
0 0 0 0 0 0
Total Non-compliances 0 0 0 0 0 0
Compliance with Section 803(a) of the Federal Financial Management Improvement Act (FFMIA)Agency Auditor
1. Federal Financial Management System Requirements No lack of compliance noted No lack of compliance noted
2. Applicable Federal Accounting Standards No lack of compliance noted No lack of compliance noted
3. USSGL at Transaction Level No lack of compliance noted No lack of compliance noted

141FY 2018 AGENCY FINANCIAL REPORT • OTHER INFORMATION
PAYMENT INTEGRITY (UNAUDITED)
BackgroundPer OMB Circular A-136, agencies must report information on payment integrity, disclosing proper and improper payments. IPERIA, Pub. L. 112-248, amends IPIA, Pub. L. 107-300, and the Improper Payments Elimination and Recovery Act of 2010 (IPERA, Pub. L. 111-204); it provides guidance on monitoring and reporting improper payments.
IPERIA requires agencies to annually report information on improper payments to the President and Congress and continue reviewing programs annually to identify those susceptible to significant improper payments. OMB defines significant improper payments as gross annual improper payments in a program exceeding both the threshold of 1.5 percent of program outlays and $10 million of improper program payments, or $100 million in improper program payments regardless of percentage.
For FY 2018, GSA is required to report on the Rental of Space program. The 19https://paymentaccuracy.gov/ link contains more detailed information on improper payments and information reported in previous FYs.
Purchase Cards Program Reporting ReliefOMB guidance allows agencies to request approval for exemption from improper payment reporting when those programs no longer meet the criteria to qualify as high risk. For the previous three fiscal years, GSA reported the following improper payments for the Purchase Card Program totaling: FY 2015 $1.98 million, FY 2016 $1.57 million and FY 2017 $1.28 million. These amounts are significantly below the OMB reporting base floor of $10 million.
GSA requested relief from improper payment reporting for the Purchase Card Program for FY 2018. OMB reviewed and approved this request. In accordance with OMB Circular A-123, Appendix C, GSA is required to complete a risk assessment on this program within the next three years. The risk assessment for Purchase Cards will be conducted in FY 2020. An additional risk assessment is scheduled in FY 2020 for Employee Payments and Travel.
Rental of Space ResultsBased on the sample results, GSA’s improper payment rate for Rental of Space was 0.29 percent, which is below the FY 2018 target rate of 1.80 percent. It is important to point out that GSA’s proper payment rate for Rental of Space is 99.71 percent.
The chart at right presents Rental of Space payments and the percentage of associated proper and improper payments.
Improper Payments of Rental Space
Proper Payments = 99.71%
Improper Payments = 0.29%

OTHER INFORMATION • FY 2018 AGENCY FINANCIAL REPORT142
Ongoing Actions GSA has demonstrated a commitment to reducing improper payments. In FY 2018, GSA’s PBS Office of Leasing developed written guidance, training, and oversight of consistent standard procedures for the administration of leases. This Office became the primary liaison to coordinate recommendations resulting from the payment recapture audit.
GSA’s OCFO established a continuous monitoring corrective action group. The group includes representatives from the OCFO, the PBS Office of Leasing, and GSA’s FSSP. This multi-office working group meets monthly to discuss improper payment error types, options for reducing improper payments, and ways to standardize business processes.
GSA provides the following improper payment reporting details in accordance with IPERIA, OMB Circular A-123, Appendix C, Requirements for Effective Estimation and Remediation of Improper Payments, and OMB Circular A-136, Financial Reporting Requirements.
Statistical SamplingFor FY 2018, GSA measured, estimated, and reported improper payment percentages and dollars for the Rental of Space program. A stratified sampling design was used to test payments based on FY 2017 disbursements. A statistician designed the statistical sample plans and the extrapolation of sample errors across the payment populations.
The sampling plan provided an overall estimate of the percentage of improper payment dollars within +/-2.5 percent precision at the 95 percent confidence level, as specified by OMB M-18-20 guidance. Using a stratified random sampling approach, payments were grouped into mutually exclusive strata, or groups based on total dollars. These stratified samples provide greater precision than a simple random sample of the same size.
The following procedure describes the sample selection process:
1. Grouped payments into mutually exclusive strata based on the sample design;
2. Using a random number generator, assigned each payment a random number;
3. Sorted the population by stratum and random number within stratum; and,
4. Selected the number of payments within each stratum (by ordered random numbers) following the sample size design. For some strata, all payments were selected.
To estimate improper payment dollars for the population from the sample data, the stratum specific ratio of improper to total payment dollars was calculated.
Accountability, Agency Information Systems and Other Infrastructure, and Barriers These sections are not applicable as the Rental of Space program does not exceed the improper payment statutory thresholds.
Additional CommentsGSA has made significant improvements in reporting for Rental of Space, a program designated as “high risk” for improper payments. In FY 2018, GSA improved the payment processes for this activity and worked with OMB to establish realistic targets, bringing the Rental of Space program into compliance. Test results show that this program has an improper payment rate below the Agency's FY 2018 target and has monetary losses to the Government below one percent of annual program payments.

143FY 2018 AGENCY FINANCIAL REPORT • OTHER INFORMATION
Improper Payment TablesTable 1 details the FY 2018 improper payment (IP) amounts and rates for the Rental of Space program as well as the projected outlays and targeted improper payment amount and rate for FY 2019.
Table 1 Improper Payment Reduction Outlook ($ in millions) 12 month Sampling Timeframe for FY 2018 data
Program Name
FY2017Outlays
($M)
FY 2017IP
Amount($M)1
FY 2017IP Rate1
FY 2018Outlays
($M)
FY 2018IP
Amount($M)3
FY 2018IP Rate
FY 2018 Over-
payment $
FY 2018 Under-
payment $
FY 2019 Est.
Outlays4
FY 2019 Est. IP
%5FY 2019 Est. IP $
Start Date for
dataEnd date for data
Rental of Space2 $ 5,486.41 $ 107.80 1.96% $ 5,683.11 $ 16.70 0.29% $ 16.56 $ 0.14 $ 5,615.97 1.40% $ 78.62 10/1/16 9/30/2017
Purchase Cards6 $ 28.56 $ 1.28 4.47% NA NA NA NA NA NA NA NA NA NA
1 The amount GSA reported in FY17 included leases with expired SAM registrations. GSA has been advised by the Office of General Counsel that issues with SAM registrations should not be considered improper payments. Reclassifying these leases from improper to proper would result in an improper payment rate of 0.72% and Improper payment amount of $39.4 million.
2 To determine improper payments for Rental of Space: (1) For Pegasys financial testing, GSA compared Lease Digest Actions (GSA Form R620) to actual payments in Pegasys to identify discrepancies. (2) For GSA Outside Payment Recapture testing, GSA reviewed lease documents including amendments, Lease Digest Actions with particular attention to document execution dates, agreement effective dates, and payment dates. (3) For Payment Recapture testing, using lease contracts, supplemental lease agreements, lease agreements, R620s and other lease documents, a detailed monthly rental schedule was developed from lease commencement to the most recent rent payment. This schedule was then compared to actual payments, by month, to identify any discrepancies.
3 IP estimate for the Rental of Space program was based on 3 different categories:(1) Projected IP amount from Pegasys financial sample plus (2) Projected IP amount in error from Outside Payment recapture sample plus (3) 100% of amount in error from Payment Recapture audit report.
4 The Rental of Space FY 2019 estimated outlays are based on payments made in FY 2018.
5 GSA reduced its target to 1.40% for FY 2019. This represents a significant reduction from the prior year's target rate of 1.80%. GSA will be reviewing more tenant improvement (TI) reconciliations during FY 2019. There is uncertainty around the effect these TI transactions will have on next year's IP rate as a small number of errors can lead to large IP percentage increases.
6 GSA requested relief from IP reporting for the Purchase Card Program for FY 2018. OMB reviewed and approved our request.
Program or Activity CY Confidence Level CY Margin of ErrorRental of Space 95% 0.12%
Table 2 CY Estimate Statistical Information

OTHER INFORMATION • FY 2018 AGENCY FINANCIAL REPORT144
Corrective Actions Undertaken by GSA ProgramsGSA’s Rental of Space program does not exceed the statutory thresholds. Therefore, GSA is not required to describe corrective action plans.
Monetary Loss to the GovernmentTable 4 estimates the total improper payments monetary loss to the Government for the Rental of Space program. In order to estimate improper payment dollars by actual monetary loss to the Government, GSA omits underpayments and overpayments not involving claims.
Reason for Improper PaymentRental of Space
Overpayments Underpayments
Program Design or Structural IssueInability to Authenticate Eligibility: Inability to Access Data Inability to Authenticate Eligibility: Data Needed Does Not Exist
Failure to Verify:
Death DataFinancial DataExcluded Party DataPrisoner DataOther Eligibility Data (explain)
Administrative or Process Error Made by:
Federal Agency $14.46 $0.14State or Local AgencyOther Party (e.g., participating lender, health care provider, or any other organization administering Federal dollars)
Medical NecessityInsufficient Documentation to DetermineOther Reason1 $2.10
TOTAL $16.56 $0.14
¹ Other Reason constitutes improper payments that occurred based on Real Estate Tax Credits - Tax Bills\Refunds not Submitted and Tax Bills Reassessed.
Table 3 Improper Payment Root Cause Category Matrix ($ in millions)
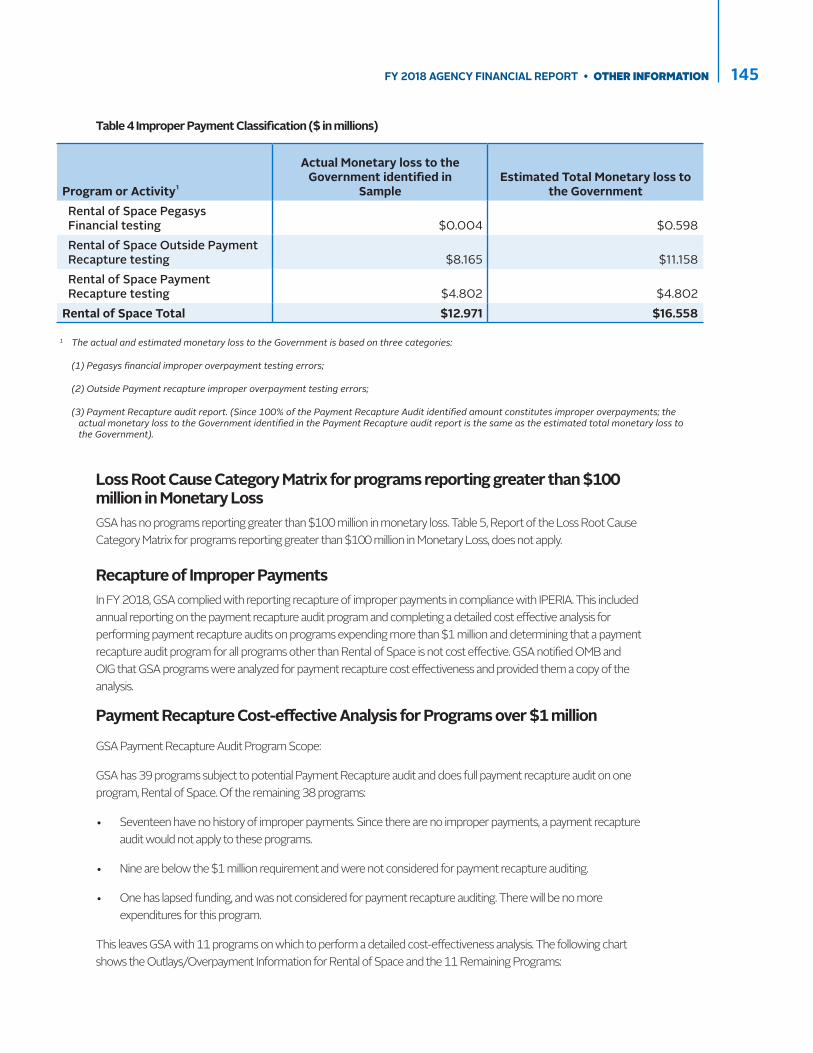
145FY 2018 AGENCY FINANCIAL REPORT • OTHER INFORMATION
Table 4 Improper Payment Classification ($ in millions)
Program or Activity¹
Actual Monetary loss to the Government identified in
SampleEstimated Total Monetary loss to
the Government Rental of Space Pegasys Financial testing $0.004 $0.598 Rental of Space Outside Payment Recapture testing $8.165 $11.158 Rental of Space Payment Recapture testing $4.802 $4.802Rental of Space Total $12.971 $16.558
1 The actual and estimated monetary loss to the Government is based on three categories:
(1) Pegasys financial improper overpayment testing errors;
(2) Outside Payment recapture improper overpayment testing errors;
(3) Payment Recapture audit report. (Since 100% of the Payment Recapture Audit identified amount constitutes improper overpayments; the actual monetary loss to the Government identified in the Payment Recapture audit report is the same as the estimated total monetary loss to the Government).
Loss Root Cause Category Matrix for programs reporting greater than $100 million in Monetary LossGSA has no programs reporting greater than $100 million in monetary loss. Table 5, Report of the Loss Root Cause Category Matrix for programs reporting greater than $100 million in Monetary Loss, does not apply.
Recapture of Improper PaymentsIn FY 2018, GSA complied with reporting recapture of improper payments in compliance with IPERIA. This included annual reporting on the payment recapture audit program and completing a detailed cost effective analysis for performing payment recapture audits on programs expending more than $1 million and determining that a payment recapture audit program for all programs other than Rental of Space is not cost effective. GSA notified OMB and OIG that GSA programs were analyzed for payment recapture cost effectiveness and provided them a copy of the analysis.
Payment Recapture Cost-effective Analysis for Programs over $1 million
GSA Payment Recapture Audit Program Scope:
GSA has 39 programs subject to potential Payment Recapture audit and does full payment recapture audit on one program, Rental of Space. Of the remaining 38 programs:
• Seventeen have no history of improper payments. Since there are no improper payments, a payment recapture audit would not apply to these programs.
• Nine are below the $1 million requirement and were not considered for payment recapture auditing.
• One has lapsed funding, and was not considered for payment recapture auditing. There will be no more expenditures for this program.
This leaves GSA with 11 programs on which to perform a detailed cost-effectiveness analysis. The following chart shows the Outlays/Overpayment Information for Rental of Space and the 11 Remaining Programs:

OTHER INFORMATION • FY 2018 AGENCY FINANCIAL REPORT146
Outlays/Over Payment Information for Rental of Space and 11 Other Programs
Program Name Outlays In Dollars
Average Three Year
Overpayments as % of Outlays
Average Three Year
Overpayments 2017 2016 2015
Rental of space $5,680,898,408 0.5136 $ 29,175,278 $ 21,424,022 $ 37,182,350 $ 28,919,461
Integrated Technology Services (ITS) - Flow-Thru $1,454,266,154 0.2822 $ 4,104,603 $ - $ 1,367,044 $ 10,946,765
Building operations $2,466,075,079 0.0992 $ 2,447,040 $ 2,122,228 $ 2,205,194 $ 3,013,696
Assisted Acquisition Services (AAS) - Flow-Thru $5,181,845,806 0.0139 $ 721,147 $ 576,632 $ 1,586,133 $ 676
Operating Expenses (Reimbursable) $5,206,412 6.5140 $ 339,146 $ - $ 1,015,998 $ 1,440
Repairs and alterations $674,710,147 0.0501 $ 338,105 $ 496,341 $ 38,991 $ 478,983
Acquisition Services Fund - Operating $1,092,049,850 0.0188 $ 205,771 $ 231,854 $ 385,077 $ 382
Construction and acquisition of facilities $578,308,482 0.0247 $ 142,898 $ 1,038 $ 81,570 $ 346,085
Special services and improvements $1,779,209,030 0.0025 $ 43,873 $ 31,473 $ 35,503 $ 64,643
Government-wide Policy (Reimbursable) $ 27,105,919 0.0920 $ 24,941 $ 74,824 $ - $ -
Federal Citizen Services Fund (Reimbursable) $ 3,023,980 0.0141 $ 425 $ - $ 1,275 $ -
Operating Expenses (Direct) $ 53,419,671 0.0000 $ 5 $ - $ - $ 15
147FY 2018 AGENCY FINANCIAL REPORT • OTHER INFORMATION
Agency Program PrioritizationGSA reviewed these programs, giving priority to those with a higher potential for overpayments and recoveries. GSA utilized known sources of improper payment information, giving priority to recent payments and to payments made in programs identified as susceptible to significant improper payments. GSA’s audit recovery program focuses on its largest program, Rental of Space. For the $24.97 million in FY 2017 overpayments; 85.7 percent ($21.42 million) related to the Rental of Space with only 14.3 percent ($3.55 million) related to other programs.
GSA Self-Reported Overpayments Information ExplainedGSA self-reported overpayments generally involve those overpayments identified by GSA regions as improper and forwarded to our FSSP for processing. GSA tracked the trends of these self-reported overpayments for the past three years and included this as a factor in its risk assessment analysis.
Based on this factor, the Payment Recapture Audit focused on the Rental of Space program. Over the past three years this audit identified $19.1 million in overpayments. In FY 2017 GSA recovered $11.5 million. GSA recoveries are accounted for in the year of receipt.
Likelihood That Identified Overpayments Will Be RecapturedGSA anticipates that identified overpayments will be recaptured. The nature of GSA operations involve recapturing overpayments from commercial vendors. These commercial vendors have the resources to remit overpayments with the applicable laws and regulations allowing recovery from such vendors. The evidence of overpayment is generally clear and convincing with little or no resistance from vendors concerning payment recovery.
Likelihood that Expected Recoveries Exceed Costs According to the GSA’s Payment Recapture contract, the Auditor is able to perform Payment Recapture Audits on any program they believe to be cost-effective (other than the two OIG programs). The following chart shows the minimum upfront costs GSA would spend if the Payment Recapture Audit was conducted on a new program.
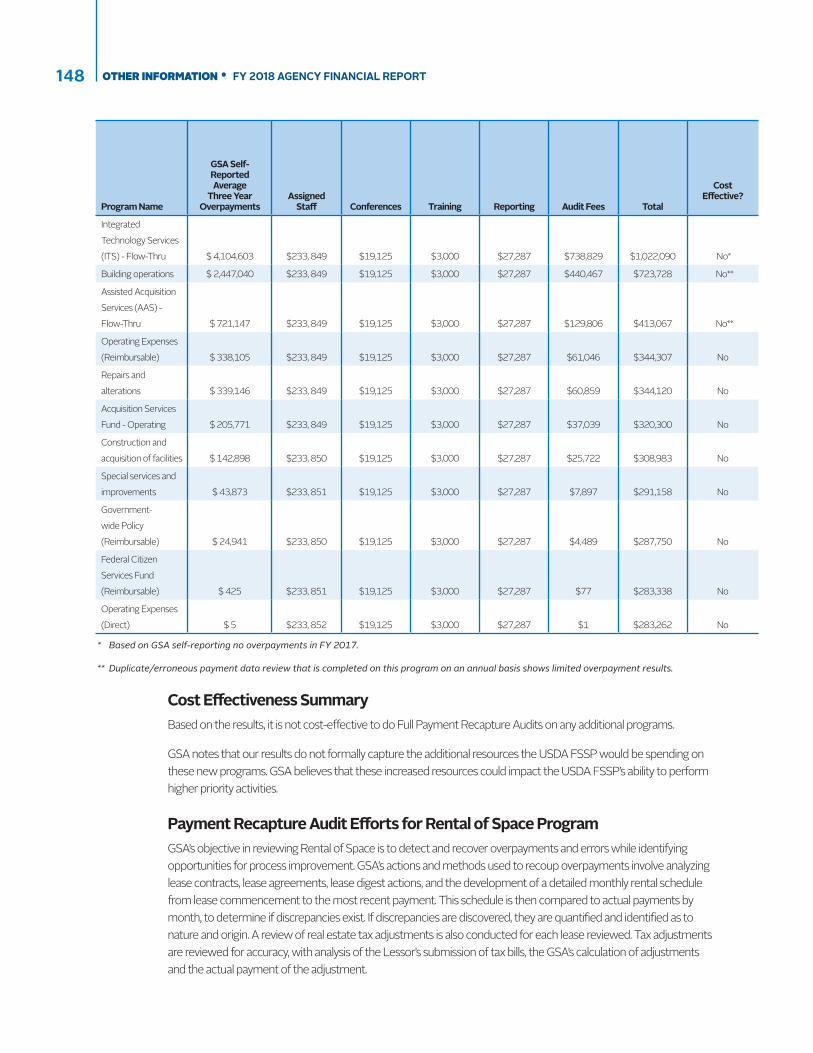
OTHER INFORMATION • FY 2018 AGENCY FINANCIAL REPORT148
Program Name
GSA Self-Reported Average
Three Year Overpayments
Assigned Staff Conferences Training Reporting Audit Fees Total
CostEffective?
Integrated Technology Services (ITS) - Flow-Thru $ 4,104,603 $233, 849 $19,125 $3,000 $27,287 $738,829 $1,022,090 No*
Building operations $ 2,447,040 $233, 849 $19,125 $3,000 $27,287 $440,467 $723,728 No**
Assisted Acquisition Services (AAS) - Flow-Thru $ 721,147 $233, 849 $19,125 $3,000 $27,287 $129,806 $413,067 No**
Operating Expenses (Reimbursable) $ 338,105 $233, 849 $19,125 $3,000 $27,287 $61,046 $344,307 No
Repairs and alterations $ 339,146 $233, 849 $19,125 $3,000 $27,287 $60,859 $344,120 No
Acquisition Services Fund - Operating $ 205,771 $233, 849 $19,125 $3,000 $27,287 $37,039 $320,300 No
Construction and acquisition of facilities $ 142,898 $233, 850 $19,125 $3,000 $27,287 $25,722 $308,983 No
Special services and improvements $ 43,873 $233, 851 $19,125 $3,000 $27,287 $7,897 $291,158 No
Government-wide Policy (Reimbursable) $ 24,941 $233, 850 $19,125 $3,000 $27,287 $4,489 $287,750 No
Federal Citizen Services Fund (Reimbursable) $ 425 $233, 851 $19,125 $3,000 $27,287 $77 $283,338 No
Operating Expenses (Direct) $ 5 $233, 852 $19,125 $3,000 $27,287 $1 $283,262 No
Cost Effectiveness SummaryBased on the results, it is not cost-effective to do Full Payment Recapture Audits on any additional programs.
GSA notes that our results do not formally capture the additional resources the USDA FSSP would be spending on these new programs. GSA believes that these increased resources could impact the USDA FSSP’s ability to perform higher priority activities.
Payment Recapture Audit Efforts for Rental of Space ProgramGSA’s objective in reviewing Rental of Space is to detect and recover overpayments and errors while identifying opportunities for process improvement. GSA’s actions and methods used to recoup overpayments involve analyzing lease contracts, lease agreements, lease digest actions, and the development of a detailed monthly rental schedule from lease commencement to the most recent payment. This schedule is then compared to actual payments by month, to determine if discrepancies exist. If discrepancies are discovered, they are quantified and identified as to nature and origin. A review of real estate tax adjustments is also conducted for each lease reviewed. Tax adjustments are reviewed for accuracy, with analysis of the Lessor’s submission of tax bills, the GSA’s calculation of adjustments and the actual payment of the adjustment.
* Based on GSA self-reporting no overpayments in FY 2017.
** Duplicate/erroneous payment data review that is completed on this program on an annual basis shows limited overpayment results.
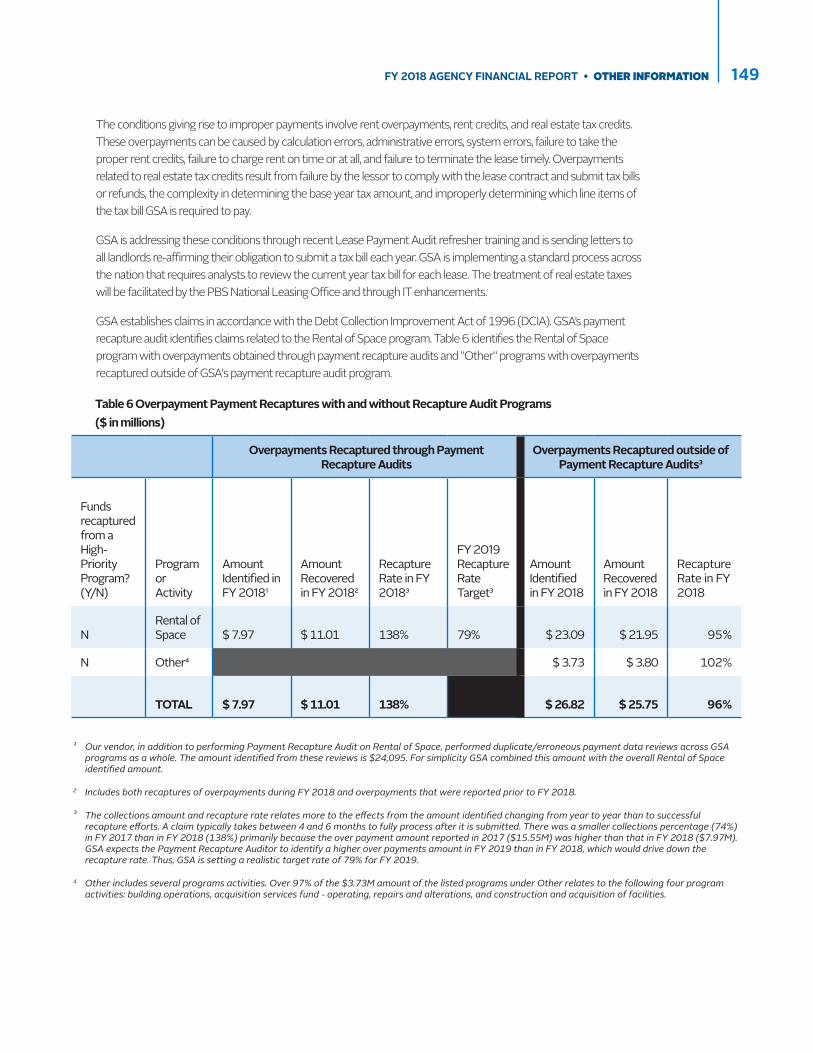
149FY 2018 AGENCY FINANCIAL REPORT • OTHER INFORMATION
The conditions giving rise to improper payments involve rent overpayments, rent credits, and real estate tax credits. These overpayments can be caused by calculation errors, administrative errors, system errors, failure to take the proper rent credits, failure to charge rent on time or at all, and failure to terminate the lease timely. Overpayments related to real estate tax credits result from failure by the lessor to comply with the lease contract and submit tax bills or refunds, the complexity in determining the base year tax amount, and improperly determining which line items of the tax bill GSA is required to pay.
GSA is addressing these conditions through recent Lease Payment Audit refresher training and is sending letters to all landlords re-affirming their obligation to submit a tax bill each year. GSA is implementing a standard process across the nation that requires analysts to review the current year tax bill for each lease. The treatment of real estate taxes will be facilitated by the PBS National Leasing Office and through IT enhancements.
GSA establishes claims in accordance with the Debt Collection Improvement Act of 1996 (DCIA). GSA’s payment recapture audit identifies claims related to the Rental of Space program. Table 6 identifies the Rental of Space program with overpayments obtained through payment recapture audits and "Other" programs with overpayments recaptured outside of GSA's payment recapture audit program.
Table 6 Overpayment Payment Recaptures with and without Recapture Audit Programs ($ in millions)
Overpayments Recaptured through Payment Recapture Audits
Overpayments Recaptured outside of Payment Recapture Audits3
Funds recaptured from a High-Priority Program? (Y/N)
Program or Activity
Amount Identified in FY 20181
AmountRecovered in FY 20182
Recapture Rate in FY 20183
FY 2019 Recapture Rate Target3
Amount Identified in FY 2018
Amount Recovered in FY 2018
Recapture Rate in FY 2018
NRental of Space $ 7.97 $ 11.01 138% 79% $ 23.09 $ 21.95 95%
N Other4 $ 3.73 $ 3.80 102%
TOTAL $ 7.97 $ 11.01 138% $ 26.82 $ 25.75 96%
¹ Our vendor, in addition to performing Payment Recapture Audit on Rental of Space, performed duplicate/erroneous payment data reviews across GSA programs as a whole. The amount identified from these reviews is $24,095. For simplicity GSA combined this amount with the overall Rental of Space identified amount.
2 Includes both recaptures of overpayments during FY 2018 and overpayments that were reported prior to FY 2018.
³ The collections amount and recapture rate relates more to the effects from the amount identified changing from year to year than to successful recapture efforts. A claim typically takes between 4 and 6 months to fully process after it is submitted. There was a smaller collections percentage (74%) in FY 2017 than in FY 2018 (138%) primarily because the over payment amount reported in 2017 ($15.55M) was higher than that in FY 2018 ($7.97M).GSA expects the Payment Recapture Auditor to identify a higher over payments amount in FY 2019 than in FY 2018, which would drive down the recapture rate. Thus, GSA is setting a realistic target rate of 79% for FY 2019.
4 Other includes several programs activities. Over 97% of the $3.73M amount of the listed programs under Other relates to the following four program activities: building operations, acquisition services fund - operating, repairs and alterations, and construction and acquisition of facilities.

OTHER INFORMATION • FY 2018 AGENCY FINANCIAL REPORT150
The Payment Recapture Audit for the Rental of Space program is funded through a revolving fund. Therefore, funds recaptured are credited back to their original purpose. Disposition of recaptured funds from the FY 2018 payment recapture audit is identified in Table 7.
Table 7 Disposition of Funds Recaptured Through Payment Recapture Audit Programs ($ in millions)
Program or
ActivityAmount
Recaptured
Agency Expenses to Administer
the Program
Payment Recapture Audit Fees1
Financial Management Improvement
ActivitiesOriginal Purpose
Office of Inspector General
Returned to Treasury
Other (please
explain in footnote)
Rental of Space $ 11.01 NA $ 1.85 NA $ 9.16 NA NA NA
TOTAL $ 11.01 NA $ 1.85 NA $ 9.16 NA NA NA
1 Fees based on invoices submitted by Payment Recapture Audit firm in FY 2018.
The aging of an overpayment begins at the time the overpayment is detected, which is the date that the Payment Recapture Audit GSA Contracting Officer Representative executes final approval of the claim form. Thus, GSA is reporting aging of outstanding overpayments based on the final approval date on claim forms, rather than the date that the accounts receivable record related to a claim is established in the accounting system.. Unsatisfied debt is referred to the Treasury Offset Program for further collection efforts. Uncollectable accounts are written off based on the Accounts Receivable Policy Handbook, CFO P 4253.1, Chapter 4, Servicing Non-Federal Accounts Receivable. See Table 8, Aging of Outstanding Overpayments Identified in the Payment Recapture Audit Programs.
The Outstanding overpayments identified in the payment recapture audits in FY 2018 are reflected in Table 8.

151FY 2018 AGENCY FINANCIAL REPORT • OTHER INFORMATION
Table 8 Aging of Outstanding Overpayments Identified in the Payment Recapture Audit Programs¹($ in millions)
Program or Activity
Amount Outstanding
(0 – 6 months)
Amount Outstanding
(6 months to 1 year)
Amount Outstanding(over 1 year)
Amount determined to not
be collectable2
Rental of Space3 $ 1.59 $1.63 $3.39 $3.17TOTAL $1.59 $1.63 $3.39 $3.17
1 The aging of an overpayment begins at the time the overpayment is detected, which is the date that the Payment Recapture Audit GSA Contracting Officer Representative executes final approval on the claim form. Thus, GSA is reporting aging of outstanding overpayments based on the final approval date on claim forms, rather than the date that the accounts receivable record related to a claim is established in the accounting system.
If GSA reported aging of outstanding overpayments based on the date a receivable claim is established in the accounting system, the aging amounts would be as follows:
Amount Outstanding (0-6 months): $1.14 Amount Outstanding (6 months to 1 year): $1.58 Amount Outstanding (over 1 year): $3.37 Amount Determined not to be Collectable: $3.17
² Uncollectable accounts are written off based on the Accounts Receivable Policy Handbook, CFO P 4253.1B, as amended, Chapter 4, Servicing Non-Federal Accounts Receivable. GSA writes off claims with a remaining principal balance under $100 at 120 days old; claims above $100 are written off after they have been referred to Treasury for collection for 60 days. Amount determined to not be collectable is cumulative, based on OMB Town Hall guidance, and includes all current and prior amounts determined to not be collectable dating back to October 2010.
³ As follows are the percent such amounts represent of the total overpayments from recapture audits of the agency (i.e., overpayments that have been identified but not recaptured):
Amount Outstanding (0-6 months): 16.24% Amount Outstanding (6 months to 1 year): 16.71% Amount Outstanding (over 1 year): 34.70% Amount Determined not to be Collectable: 32.35%
Note: The percentages are based on full numbers and not the rounded outstanding dollar amounts listed hereon.

OTHER INFORMATION • FY 2018 AGENCY FINANCIAL REPORT152
Confirmed Fraud (FY 2018)Table 9 reports the amount of fraud confirmed within the FY 2018. GSA consulted with the GSA OIG to collect the data listed in Table 9. The amounts reflected in the table below represent the result of GSA OIG investigations of fraud against GSA and against other Federal agencies.
Table 9 Confirmed Fraud¹ ($ in millions)Annual Figures Covering October 1, 2017 through September 30, 2018
Program or Activity Confirmed FraudCriminal Results $16.144Civil Results $74.054Non-Judicial Recoveries $7.054TOTAL $97.252
1 Information provided by GSA OIG Office of Investigations.
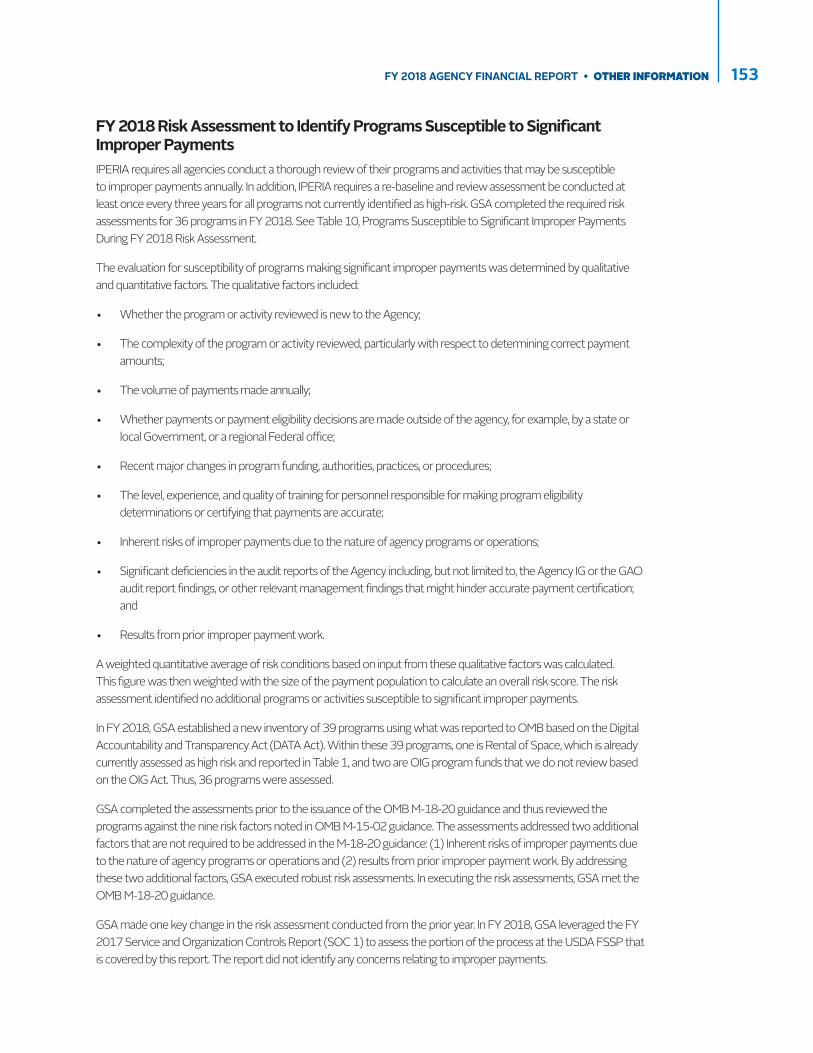
153FY 2018 AGENCY FINANCIAL REPORT • OTHER INFORMATION
FY 2018 Risk Assessment to Identify Programs Susceptible to Significant Improper Payments IPERIA requires all agencies conduct a thorough review of their programs and activities that may be susceptible to improper payments annually. In addition, IPERIA requires a re-baseline and review assessment be conducted at least once every three years for all programs not currently identified as high-risk. GSA completed the required risk assessments for 36 programs in FY 2018. See Table 10, Programs Susceptible to Significant Improper Payments During FY 2018 Risk Assessment.
The evaluation for susceptibility of programs making significant improper payments was determined by qualitative and quantitative factors. The qualitative factors included:
• Whether the program or activity reviewed is new to the Agency;
• The complexity of the program or activity reviewed, particularly with respect to determining correct payment amounts;
• The volume of payments made annually;
• Whether payments or payment eligibility decisions are made outside of the agency, for example, by a state or local Government, or a regional Federal office;
• Recent major changes in program funding, authorities, practices, or procedures;
• The level, experience, and quality of training for personnel responsible for making program eligibility determinations or certifying that payments are accurate;
• Inherent risks of improper payments due to the nature of agency programs or operations;
• Significant deficiencies in the audit reports of the Agency including, but not limited to, the Agency IG or the GAO audit report findings, or other relevant management findings that might hinder accurate payment certification; and
• Results from prior improper payment work.
A weighted quantitative average of risk conditions based on input from these qualitative factors was calculated. This figure was then weighted with the size of the payment population to calculate an overall risk score. The risk assessment identified no additional programs or activities susceptible to significant improper payments.
In FY 2018, GSA established a new inventory of 39 programs using what was reported to OMB based on the Digital Accountability and Transparency Act (DATA Act). Within these 39 programs, one is Rental of Space, which is already currently assessed as high risk and reported in Table 1, and two are OIG program funds that we do not review based on the OIG Act. Thus, 36 programs were assessed.
GSA completed the assessments prior to the issuance of the OMB M-18-20 guidance and thus reviewed the programs against the nine risk factors noted in OMB M-15-02 guidance. The assessments addressed two additional factors that are not required to be addressed in the M-18-20 guidance: (1) Inherent risks of improper payments due to the nature of agency programs or operations and (2) results from prior improper payment work. By addressing these two additional factors, GSA executed robust risk assessments. In executing the risk assessments, GSA met the OMB M-18-20 guidance.
GSA made one key change in the risk assessment conducted from the prior year. In FY 2018, GSA leveraged the FY 2017 Service and Organization Controls Report (SOC 1) to assess the portion of the process at the USDA FSSP that is covered by this report. The report did not identify any concerns relating to improper payments.
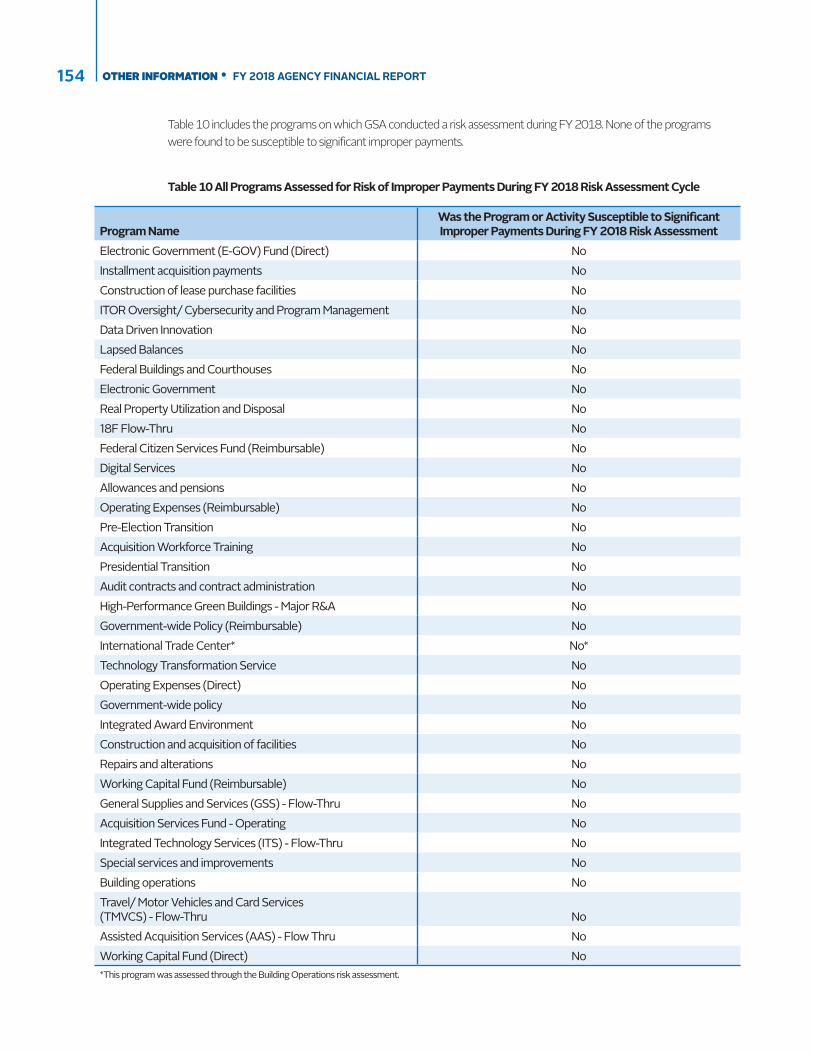
OTHER INFORMATION • FY 2018 AGENCY FINANCIAL REPORT154
Program NameWas the Program or Activity Susceptible to Significant Improper Payments During FY 2018 Risk Assessment
Electronic Government (E-GOV) Fund (Direct) NoInstallment acquisition payments NoConstruction of lease purchase facilities NoITOR Oversight/ Cybersecurity and Program Management NoData Driven Innovation NoLapsed Balances NoFederal Buildings and Courthouses NoElectronic Government NoReal Property Utilization and Disposal No18F Flow-Thru NoFederal Citizen Services Fund (Reimbursable) NoDigital Services NoAllowances and pensions NoOperating Expenses (Reimbursable) NoPre-Election Transition NoAcquisition Workforce Training NoPresidential Transition NoAudit contracts and contract administration NoHigh-Performance Green Buildings - Major R&A NoGovernment-wide Policy (Reimbursable) NoInternational Trade Center* No*Technology Transformation Service NoOperating Expenses (Direct) NoGovernment-wide policy NoIntegrated Award Environment NoConstruction and acquisition of facilities NoRepairs and alterations NoWorking Capital Fund (Reimbursable) NoGeneral Supplies and Services (GSS) - Flow-Thru NoAcquisition Services Fund - Operating NoIntegrated Technology Services (ITS) - Flow-Thru NoSpecial services and improvements NoBuilding operations NoTravel/ Motor Vehicles and Card Services (TMVCS) - Flow-Thru NoAssisted Acquisition Services (AAS) - Flow Thru NoWorking Capital Fund (Direct) No*This program was assessed through the Building Operations risk assessment.
Table 10 All Programs Assessed for Risk of Improper Payments During FY 2018 Risk Assessment Cycle
Table 10 includes the programs on which GSA conducted a risk assessment during FY 2018. None of the programs were found to be susceptible to significant improper payments.
155FY 2018 AGENCY FINANCIAL REPORT • OTHER INFORMATION
Do Not Pay Initiative When enrolling in Do Not Pay (DNP), GSA elected to match against the Death Master File (DMF) and the General Services Administration’s Excluded Parties List System (EPLS) database. The GSA vendor table is transmitted to DNP on the 10th of every month. GSA compares the vendor file to the EPLS and the DMF. Vendors that have exclusions are annotated and deactivated in the GSA vendor master database file. No corrections to the SAM/EPLS Private database have been identified by GSA in our review process.
Additionally, GSA utilizes online single-search DNP functionality to check for any matches prior to establishing a new vendor record in the GSA vendor table. GSA also receives results for our payments processed on a daily basis from DNP. These results reflect matches to the SAM Exclusion Records and to Deceased Individuals as a result of post-payment matching of GSA payments schedules to these databases. The payment matches and exclusion information are reviewed in the DNP Portal. The SAM Data Universal Numbering System (DUNS) registrations interface directly into GSA's accounting vendor database ensuring vendors with debarments do not receive improper payments.
Once they are reviewed, the payments are adjudicated as proper or improper. In general, GSA’s items to adjudicate monthly in DNP are very low, ranging from none to one per month. GSA’s reduction in improper payments is mostly attributable to GSA’s PBS National Office of Leasing and OCFO developing written guidance and oversight of standard procedures for the administration of leases rather than the DNP initiative.
OTHER INFORMATION • FY 2018 AGENCY FINANCIAL REPORT156
Agency progress on implementing the Fraud Reduction and Data Analytics Act of 2015 (Pub. L. 114-186, 31 USC 3321):
The Fraud Reduction and Data Analytics Act of 2015 requires annual reporting on the Agency’s progress in implementing financial and administrative controls to identify and assess fraud risks.The Act also requires the agency to implement control activities designed to prevent, detect, and respond to fraud, including improper payments. Guidance, implementing instructions, and the internal control framework are provided in:
• OMB Circular A-123, Management’s Responsibility for Enterprise Risk Management and Internal Control, July 2016; and
• GAO-14-704G, The Standards for Internal Control in the Federal Government, September 2014 (the Green Book)
GSA uses Federal solutions to strengthen controls that reduce the risk of fraud against the Federal Government. For example, the DNP solution is a Governmentwide initiative mandated by the Improper Payments Elimination and Recovery Improvement Act of 2012 to screen payment recipients before a contract award or payment is made in order to eliminate payment errors. GSA has incorporated this mandate into our business processes. The DNP database is also used in the acquisition process. Prior to contract award the DNP is reviewed as part of the evaluation process, as well as GSA’s SAM and the Internal Revenue Service’s Taxpayer Identification Number (TIN) Match Program.
GSA works closely with the OIG to implement recommendations identified during audits and investigations. The OIG analyzes potentially fraudulent or otherwise criminal activities. They conduct nationwide criminal, civil and administrative investigations of illegal or improper activities involving GSA programs, operations, and personnel. GSA reviews OIG reports and the Semi- Annual Report to Congress to help identify areas where controls could be improved.
In FY 2018, the OIG identified fraudulent activity in the SAM database. GSA implemented multiple preventive measures to fix these controls including:
1. Multi-factor authentication to log into SAM.gov. This requires a SAM user to be validated at login by having a unique code sent to a electronic device that is entered as part of the login process.
2. Restricted access to the expired registration data migrated into SAM from the Central Contractor Registration system. This prevents individuals or businesses from impersonating a legitimate business that is currently inactive.
3. When a vendor changes bank information, the parent entity is notified to reduce the risk. Parent approvals are also required if a child entity tries to register in SAM.
4. Masking sensitive data so it is not displayed publicly in the SAM database. Examples include displaying the last four characters of the Marketing Partner Identification Number TIN, ABA Routing Number, and Bank Account Number for users with approved roles.
Additionally, the OCFO sponsored training on Managing Risk Through Effective ERM. Over sixty members of the OCFO staff successfully completed the training.
FRAUD REDUCTION REPORT

157FY 2018 AGENCY FINANCIAL REPORT • OTHER INFORMATION
GSA revamped methods to evaluate compliance with the five components and 17 principles of Internal Controls, including Principle 8, the fraud risk principle. The new tool was completed by 16 Heads of Services and Staff Offices. Fraud Risk was discussed by the GSA Senior Assessment Team, and the MCOC, to ensure it was appropriately addressed in the Administrator’s Annual Statement of Assurance.
In FY 2018, the MCOC meetings included discussions on the status of corrective actions for outstanding audit findings from the annual external financial statement audit, the annual internal control plan for financial management and financial systems. At the conclusion of the fiscal year the MCOC members completed a survey to identify internal control and fraud issues not previously reported. No areas of concern were identified.
GSA addressed fraud at the program level through annual internal program reviews, which included an assessment of risk. GSA has a total of 393 internal control reviews, which it evaluates over a 5 year cycle. In FY 2018, GSA performed all 88 of the planned internal control reviews.
GSA Continues to Make Progress in Implementing Leading Practices for Managing Fraud RiskTo monitor delinquencies associated with the travel card, GSA established a Centrally Billed Account with the contracted Electronic Travel System (ETS) vendor for travel transportation expenses. The ETS vendor performs an automated reconciliation of travel transportation billings and provides GSA with a list of reconciled charges. There are no delinquencies on this account since it is paid on a bi-weekly basis. For individually billed accounts, a monthly delinquency report is now provided to the cardholder’s supervisor and OHRM with a listing of aged delinquent accounts. Approving Officials (AO) conduct counsel and/or discipline employees, as necessary, in consultation with OHRM. GSA initiates salary offset for collecting undisputed delinquent travel charge card debt. To further reduce the potential for delinquent accounts, GSA has incorporated the split disbursement feature into ETS for payment directly to the charge card contractor. There are no delinquencies for the purchase card program since payment to the charge card contractor is made on a daily basis.
To mitigate the risk associated with employees who separate from GSA and fail to properly return their travel cards, GSA uses a daily Employee Separation List and verifies the names on the list in Citibank’s Citidirect Card Management System (CCMS). These accounts are immediately cancelled with Citibank. As an additional control, a monthly separation list from OHRM is used to verify closing separated employee accounts in CCMS that may have been missing from the daily list. GSA also reconciles the list of active charge card participants from Citibank to Human Resources files on a periodic basis (minimum of once per year).
Additional Travel/Purchase Card ControlsGSA program offices receive a semi-annual report of inactive purchase cardholders (accounts with no activity in the preceding 12 months) for review. The program offices initiate closure for accounts that are no longer needed.
GSA utilizes retail blocks on questionable/high risk Merchant Category Codes (MCC) for purchases and travel. GSA reviews and updates the use of these codes periodically.
Travel card applicants complete their travel card application online in lieu of completing a paper application. The online application increases sustainability by reducing the number of paper applications processed and increases security of an applicant’s personally identifiable information.
GSA requires all charge card participants, regardless of level or responsibilities, to complete training prior to appointment or issuance of a charge card (purchase or travel).
GSA requires all approving officials, charge card holders, Agency/Organization Program Coordinators, and Charge Card Coordinators to complete charge card refresher training every two years for travel cards, and every three years for purchase cards.

OTHER INFORMATION • FY 2018 AGENCY FINANCIAL REPORT158
Charge card program improvements in FY 2018 include:
• Monthly questionable charges and delinquency reports are sent to OHRM to ensure approving officials and/or supervisors carry out consistent application of disciplinary action, when necessary.
• Cardholder‘s purchase card account is suspended if a cardholder is expected to be away from the office for more than 20 business days.
• Charge Card Coordinators sample purchase card transactions monthly to ensure purchase cardholders upload supporting documentation in GSA’s financial system.
GSA Utilizes the Following Reports to Detect Possible Charge Card Misuse Pegasys Daily Charges Report - This report is used by cardholders to review daily transactions. Credit card vendors import transaction data into Pegasys generating email notifications to cardholders on availability of daily transaction report. The report is then downloaded for review and verification by cardholders.
Pegasys Monthly Charge Card Transaction Report - This report is used by approving officials to review their cardholder’s monthly transactions. The Pegasys charge card module automatically sends an email to the AOs including a consolidated report of all their cardholders’ monthly charge card transactions. AOs can elect to receive daily emails of new charge activity as it occurs, and they can access a variety of reports on their cardholders’ accounts at any time from the Pegasys reports module. All AOs are required to review and certify their monthly reports within ten days of receipt and take action on all unauthorized and questionable charges. In addition, the OAS monitors AOs’ monthly reviews to ensure completion.
Questionable Charges Report - This report utilizes the MasterCard Expert Monitoring System to assess questionable transactions. On a monthly basis, OAS uses data mining techniques to identify questionable charges using attributes such as:
• Merchant description;
• MCC;
• Merchant names; and
• Weekend and holiday transactions.
The data is reviewed and compiled into the Questionable Charges Report and sent to the AOs for review and comments.
Agency progress was also made in identifying risks and vulnerabilities to fraud with respect to payroll, beneficiary payments, large contracts, and purchase and travel cards. A new time and attendance system was implemented in the third quarter of FY 2018, which integrated leave requests with the time card, and reduced the risk associated with paying employees improperly. Controls were also strengthened to reduce the risk of paying employees after separation.
The GSA OIG has direct access to all purchase and travel card data and performs limited data mining on purchase card transactions. In addition, the program office contacts the OIG if inappropriate use of the card is discovered. The GSA OCFO, A-123 Review Team conducts a quarterly review of internal controls in accordance with the IPERA of 2010.
Impending Suspensions Report – OAS notifies regional coordinators to follow up with AOs who have not reviewed and certified their Pegasys monthly transactions. Upon notification, the AOs have ten days to review and certify the Pegasys reports to prevent the suspension of their cardholders’ accounts.
159FY 2018 AGENCY FINANCIAL REPORT • OTHER INFORMATION
Transaction File - This monthly nationwide file of all purchase card transactions is provided to the GSA OIG and the Federal shared service provider for financial services for review and audit sampling.
Potential Split Transactions – This report notifies the Heads of Services and Staff Offices and Regional Commissioners of potential split transactions by cardholders. Management officials review the transactions and report to OAS on whether inappropriate use is discovered or whether charges comply with policy. Management officials are advised to counsel the employee and/or take disciplinary action in consultation with their servicing human resources office, if inappropriate use of the purchase card is discovered. Management officials must also conduct a procurement review to determine if any corrective action is needed.
Travel Card
The Questionable Charges Report described above is also utilized for travel cards. In addition, OAS uses data mining attributes such as:
• ATM transactions > $250 in 1 Week;
• Merchant description;
• MCC;
• Merchant names;
• Returned checks; and
• Travel card transactions that are not supported by an approved travel authorization in ETS.
In FY 2018, OAS has implemented the following actions to strengthen the charge card program:
1. Monthly questionable charges reports and delinquency reports are sent to the OHRM to ensure approving officials and/or supervisors carry out consistent application of disciplinary action, when necessary.
2. Cardholder‘s purchase card account is suspended if a cardholder is expected to be away from the office for more than 20 business days.
3. Charge Card Coordinators perform a monthly sampling of purchase card transactions to ensure purchase cardholders upload supporting documentation in GSA’s financial system.
Additional Control to Curb FraudThe “Lost and Stolen Card Report” is run annually to identify cardholders who report their purchase card lost or stolen during the period. The report is used to monitor potential fraud and abuse of the purchase card. OAS may revoke a cardholder’s purchase card and refer the cardholder to the OIG, as warranted.
Agency progress made on establishing strategies and procedures to curb fraud included integrity awareness, OIG investigations, and the OIG hotline.
Integrity AwarenessThe GSA OIG presents Integrity Awareness Briefings nationwide to educate GSA employees on their responsibilities for the prevention of fraud and abuse. This period, OIG presented 27 briefings attended by 628 GSA employees,

OTHER INFORMATION • FY 2018 AGENCY FINANCIAL REPORT160
other Government employees, and Government contractors. These briefings explain the statutory mission of the OIG and the methods available for reporting suspected examples of wrongdoing. In addition, through case studies, the briefings make GSA employees aware of actual examples of fraud in GSA and other Federal agencies and help prevent their reoccurence. GSA employees are the first line of defense against fraud, abuse, and mismanagement. They are a valuable source of successful investigative information.
The GSA OIG plays a significant role in the GSA’s prevention and detection of fraud. The following activities were reported in the OIG Semiannual Report to Congress:
October 1, 2017 – March 31, 2018:
Significant InvestigationsThe Office of Investigations conducts independent and objective investigations relating to GSA programs, operations, and personnel. The office consists of special agents with full statutory law enforcement authority to make arrests, execute search warrants, serve subpoenas, and carry concealed weapons. Special agents conduct investigations that may be criminal, civil, or administrative in nature and often involve complex fraud schemes. Investigations can also involve theft, false statements, extortion, embezzlement, bribery, anti-trust violations, credit card fraud, diversion of excess Government property, and digital crimes. During the reporting period of October 1, 2017 - March 31, 2018, the office opened 54 investigative cases, closed 83 investigative cases, referred 97 subjects for criminal prosecution, and helped obtain 35 convictions. Civil, criminal, and other monetary recoveries resulting from OIG’s investigations reported totaled over $97 million.
Other Significant WorkSuspension and Debarment Initiative
GSA has a responsibility to ascertain whether the people or companies with whom it does business are eligible to participate in Federally assisted programs and are not considered “excluded parties.” Excluded parties are declared ineligible to receive contracts by a Federal agency. The Federal Acquisition Regulation authorizes an agency to suspend or debar individuals or companies for the commission of any offense indicating a lack of business integrity or business honesty that directly affects the present responsibility of a Government contractor or subcontractor.
During this reporting period, the OIG made 54 referrals for consideration of suspension or debarment to the GSA Office of Acquisition Policy. GSA issued 120 actions based on current and previous OIG referrals.
Hotline
The OIG hotline provides an avenue for employees and other concerned citizens to report suspected wrongdoing. Hotline posters located in GSA-controlled buildings encourage employees to submit complaints using the hotline (which is also available online). OIG’s first Semi-Annual Report to Congress for FY2018 documents receiving 751 hotline contracts -- 59 were referred to GSA program officials for review and appropriate action; 18 were referred to other Federal agencies; 17 were referred to the OIG Office of Audits; four were referred to the Inspections; and 59 were referred to investigative field.

161FY 2018 AGENCY FINANCIAL REPORT • OTHER INFORMATION
OTHER GSA STATUTORILY REQUIRED REPORTS (UNAUDITED)Debt ManagementGSA reported $157.9 million of outstanding debt from non-Federal sources, subject to the DCIA of 1996. Of that amount, $34.3 million, or 22 percent of the outstanding debt was delinquent at the end of FY 2018. Non-Federal receivables consist of debts owed on third-party claims, travel advances, proceeds from the sale of real property, and other miscellaneous receivables.
To comply with the DCIA of 1996, GSA transmits delinquent claims each month to the U.S. Treasury, Bureau of the Fiscal Service for cross-servicing collection. During FY 2018, the OCFO referred over $8.7 million of delinquent non-Federal claims to the U.S. Treasury for cross-servicing collection activities. Collections on non-Federal claims during this period exceeded $815.6 million.
The OCFO has continued to implement and initiate actions to improve our debt collection efforts and reduce the amount of debt written off as uncollectible by GSA.
GSA actively pursues delinquent non-Federal claims using installment agreements, salary offset, administrative wage garnishment, and any other statutory requirement or authority that is applicable. GSA continues to place a high priority on resolving delinquent accounts receivable and claims.
Cash and Payments ManagementThe Prompt Payment Act, along with the DCIA, requires the timely payment of commercial obligations for supplies and services using electronic funds transfer. In FY 2018, GSA paid interest of $488 thousand on disbursements subject to the Prompt Payment Act of $20.8 billion, or $ 23.48 in interest per million disbursed. The statistics for the current and preceding two fiscal years are:
FY 2016 FY 2017 FY 2018Total Number of Invoices Paid 1,843,201 1,920,286 2,123,989Total Dollars Disbursed $17.6B $18.9B $21.2BTotal Dollars of Interest Penalties $418,587 $704,052 $488,255Interest Paid per Million Disbursed $23.79 $37.30 $23.48Percentage of Invoices Paid-On-Time 99.6% 99.7% 99.7%Percentage of Invoices Paid Late 0.4% 0.3% 0.3%Percentage of Invoices Paid Electronically 99.8% 99.5% 97.31%
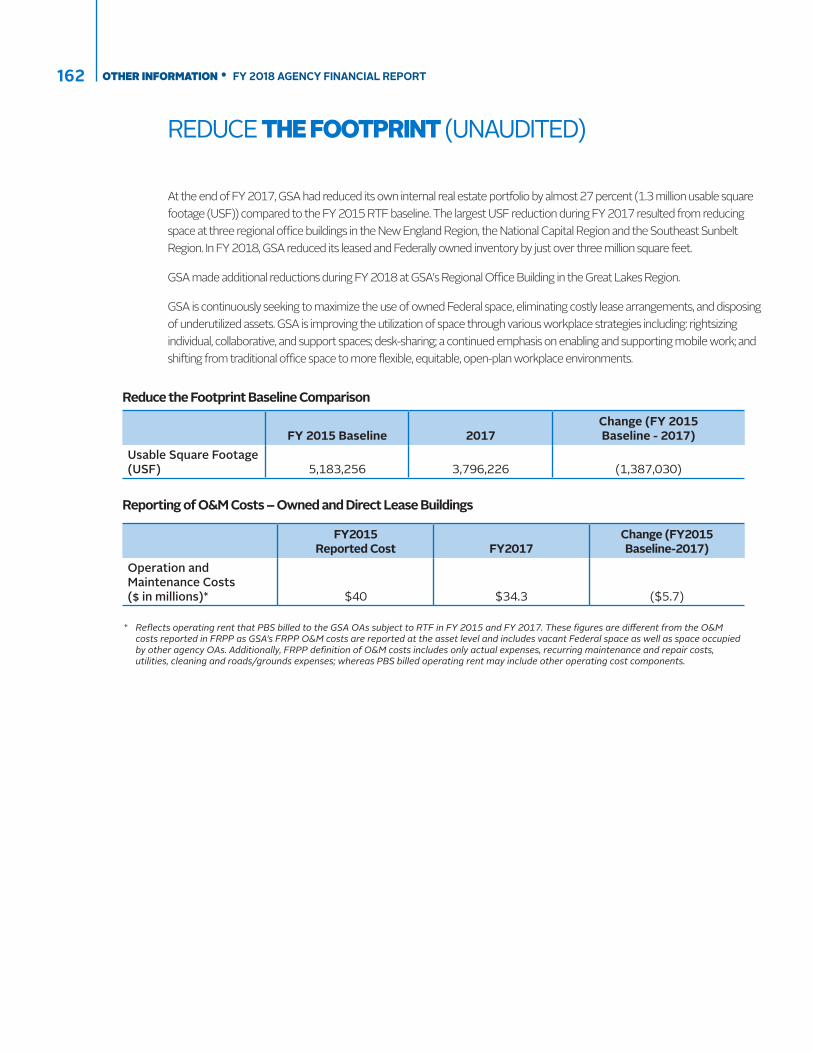
OTHER INFORMATION • FY 2018 AGENCY FINANCIAL REPORT162
REDUCE THE FOOTPRINT (UNAUDITED)
At the end of FY 2017, GSA had reduced its own internal real estate portfolio by almost 27 percent (1.3 million usable square footage (USF)) compared to the FY 2015 RTF baseline. The largest USF reduction during FY 2017 resulted from reducing space at three regional office buildings in the New England Region, the National Capital Region and the Southeast Sunbelt Region. In FY 2018, GSA reduced its leased and Federally owned inventory by just over three million square feet.
GSA made additional reductions during FY 2018 at GSA's Regional Office Building in the Great Lakes Region.
GSA is continuously seeking to maximize the use of owned Federal space, eliminating costly lease arrangements, and disposing of underutilized assets. GSA is improving the utilization of space through various workplace strategies including: rightsizing individual, collaborative, and support spaces; desk-sharing; a continued emphasis on enabling and supporting mobile work; and shifting from traditional office space to more flexible, equitable, open-plan workplace environments.
Reduce the Footprint Baseline Comparison
FY 2015 Baseline 2017Change (FY 2015 Baseline - 2017)
Usable Square Footage (USF) 5,183,256 3,796,226 (1,387,030)
Reporting of O&M Costs – Owned and Direct Lease Buildings
FY2015 Reported Cost FY2017
Change (FY2015 Baseline-2017)
Operation andMaintenance Costs ($ in millions)* $40 $34.3 ($5.7)
* Reflects operating rent that PBS billed to the GSA OAs subject to RTF in FY 2015 and FY 2017. These figures are different from the O&M costs reported in FRPP as GSA’s FRPP O&M costs are reported at the asset level and includes vacant Federal space as well as space occupied by other agency OAs. Additionally, FRPP definition of O&M costs includes only actual expenses, recurring maintenance and repair costs, utilities, cleaning and roads/grounds expenses; whereas PBS billed operating rent may include other operating cost components.

163FY 2018 AGENCY FINANCIAL REPORT • OTHER INFORMATION
CIVIL MONETARY PENALTIES INFLATION ADJUSTMENT (UNAUDITED)
The Federal Civil Penalties Inflation Adjustment Act of 1990 (the Inflation Adjustment Act), as amended, requires agencies to make regular and consistent inflationary adjustments of civil monetary penalties (CMP) to maintain their deterrent effect. The following are those penalties and applicable authorities identified for inflationary adjustment in accordance with Act.
Statutory Authority
Penalty (Name or Description)
Year Enacted
Latest year of adjustment
(via statute or regulation
Current Penalty Level ($ Amount
or Range)
Sub-Agency/Bureau/
Unit
Location for Penalty
Update Details
40 U.S.C. Program Fraud Civil
Remedies Act (PFCRA)
1986 11-Jan-18 $11,001 for each false,
fictitious, or fraudulent statement
N/A 41 CFR Part 105-70, effective
February 12, 2018(rule
published January 11,
2018)

OTHER INFORMATION • FY 2018 AGENCY FINANCIAL REPORT164
ACRONYMS AND ABBREVIATIONS (UNAUDITED)
AAL3 Authenticated Assurance Level 3
AAAP Automated Advanced Acquisition Program
AAS Assisted Acquisition Services
ADA Antideficiency Act
AFR Agency Financial Report
AO Approving Official
APR Annual Performance Plan and Report
ASF Acquisition Services Fund
BAT Building Assessment Tool
CAP Corrective Action Plan
CBCA Civilian Board of Contract Appeals
CCMS Citidirect Card Management System
CFO Chief Financial Officer
CoE IT Modernization Centers of Excellence
CSBR Combined Statements of Budgetary Resources
CSRS Civil Service Retirement System
CY Current Year
DATA Act Digital Accountability and Transparency Act of 2014
DCIA Debt Collection Improvement Act of 1996
DMF Death Master File
DM&R Deferred Maintenance and Repairs
DNP Do Not Pay
DOI U.S. Department of the Interior
DOL U.S. Department of Labor
DUNS Data Universal Numbering System
EOP Executive Office of the President
EPLS Excluded Parties List System
ERM Enterprise Risk Management
ETS Electronic Travel System
FAS Federal Acquisition Service
FASAB Federal Accounting Standards Advisory Board
FBF Federal Buildings Fund
FBwT Fund Balance with Treasury
FCI Facility Condition Index
FCSF Federal Citizen Services Fund
FECA Federal Employees Compensation Act
FedSIM Federal Systems Integration and Management Center
FERS Federal Employees Retirement System
FFMIA Federal Financial Management Improvement Act of 1996
FISMA Federal Information Security Management Act
FMFIA Federal Managers’ Financial Integrity Act of 1982
FPISC Federal Permitting Improvement Steering Council
FRPP Federal Real Property Profile
FSSP Federal Shared Service Provider
FTE Full-time Equivalent
FTF Freeze the Footprint
FY Fiscal Year
GAAP Generally Accepted Accounting Principles
GAO U.S. Government Accountability Office
GLS GSA Leasing Support Services
GS&S General Supplies and Services
GSA U.S. General Services Administration
GSA IT Office of GSA Information Technology
IP Improper Payment
IPERA Improper Payments Elimination and Recovery Act of 2010
IPERIA Improper Payments Elimination and Recovery Improvement Act of 2012

165FY 2018 AGENCY FINANCIAL REPORT • OTHER INFORMATION
IPIA Improper Payments Information Act of 2002
IT Information Technology
MCC Merchant Category Code
MCOC Management Control and Oversight Council
NIST National Institute of Standards and Technology
OA Occupancy Agreement
OAS Office of Administrative Services
O&M Operation and Maintenance
OCE Office of Customer Experience
OCFO Office of the Chief Financial Officer
OCIA Office of Congressional and Intergovernmental Affairs
OCIO Office of the Chief Information Officer
OCR Office of Civil Rights
OCSIT/18F Office of Citizen Services and Innovative Technologies/18F
OGC Office of General Counsel
OGP Office of Government-wide Policy
OHRM Office of Human Resources Management
OIG Office of the Inspector General
OMA Office of Mission Assurance
OMB Office of Management and Budget
OPM Office of Personnel Management
OSBU Office of Small Business Utilization
OSC Office of Strategic Communication
PBS Public Buildings Service
PFCRA Program Fraud Civil Remedies Act
PIF Presidential Innovation Fellows
PIV Personal Identity Verification
PMA President’s Management Agenda
PMR Procurement Management Review
PP&E Plant, Property and Equipment
PS&HC Professional Services and Human Capital
R&A Repairs and Alterations
REXUS Real Estate Across the United States
RSF Rentable Square Feet
RSI Required Supplemental Information
RTF Reduce the Footprint
RWA Reimbursable Work Authorization
SAM System for Award Management
SBA Small Business Administration
SF 133s Reports on Budget Execution and Budgetary Resources
SFFAS Statements of Federal Financial Accounting Standards
SMO Services Management Office
SOC 1 Service and Organization Controls Report
SSA Social Security Administration
SSPI Shared Solutions and Performance Improvement
TIN Internal Revenue Service’s Taxpayer Identification Number
TMF Technology Modernization Fund
TSP Thrift Savings Plan
TTL Travel, Transportation and Logistics
TTS Technology Transformation Services
USDA U. S. Department of Agriculture
USF Usable Square Footage
WCF Working Capital Fund

OTHER INFORMATION • FY 2018 AGENCY FINANCIAL REPORT166
ENDNOTES
1 President’s Management Agenda URL address is: https://www.whitehouse.gov/wp-content/uploads/2018/03/The-President%E2%80%99s-Management-Agenda.pdf
2 Celebrating 69 Years of Carrying out GSA’s Vision, URL address is: https://www.youtube.com/watch?v=VlEk8pgHweA
3 GSA's 2018-2022 Strategic Plan URL address is: https://www.gsa.gov/reference/reports/budget-performance/gsa-fy-20182022-strategic-plan
4 Real Property Inventory URL address is: https://www.gsa.gov/policy-regulations/policy/real-property-policy/asset-management/federal-real-property-profile-frpp/federal-real-property-profile-public-data-set?bypassAkamaiCache=1511550008
5 CBP Plaque in One World Trade Center: https://www.youtube.com/watch?v=RpA_8davW-0
6 Technology Transformation Services URL address is: https://www.gsa.gov/about-us/organization/Federal-acquisition-service/technology-transformation-services
7 Technology Modernization Fund URL address is: https://tmf.cio.gov/
8 President’s Management Agenda CAP goals URL address is: https://www.performance.gov/CAP/action_plans/FY2018_Q2_Sharing_Quality_Services.pdf
9 GSA.AFR URL address is: https://www.gsa.gov/reference/reports/budget-performance/annual-reports
10 CFO video URL address: https://youtu.be/UA6cZlXznIk
11 Federal Acquisition Service URL address is: https://www.gsa.gov/about-us/organization/Federal-acquisition-service
12 Public Buildings Service URL address is: https://www.gsa.gov/about-us/organization/public-buildings-service
13 Office of Government-wide Policy URL address is: https://www.gsa.gov/about-us/organization/office-of-governmentwide-policy-overview
14 Office of Civil RIghts URL address is: https://www.gsa.gov/about-us/organization/office-of-civil-rights-overview
15 Public spending URL address is: https://www.usaspending.gov/#/
16 https://www.usaspending.gov/#/explorer
17 https://www.fiscal.treasury.gov/fsreports/rpt/finrep/finrep17/fr_index_new.htm
18 https://www.gsa.gov/cdnstatic/CAPGoal6GSACFOCaseStudyFINAL_rev.pdfr
19 https://paymentaccuracy.gov
167FY 2018 AGENCY FINANCIAL REPORT • OTHER INFORMATION
ACKNOWLEDGMENTSThe U.S. General Services Administration appreciates the contributions of all staff who compiled and produced the FY 2018 Agency Financial Report. It is a significant agency-wide undertaking, and is directly tied to GSA’s mission to deliver value and savings in real estate, acquisition, technology, and other mission-support services across Government. The dedication of our financial management community ensures we are delivering these solutions in a financially responsible, transparent, and accountable way.
We specifically, acknowledge the staff of the Office of Financial Management in OCFO. Their year round efforts to compile the GSA’s financial statements and accompanying notes, monitor internal controls and improper payments and manage the financial statement audit, greatly impact GSA’s ability to be an effective and responsible steward of public funds. In particular, we recognize, the following individuals and organizations for their contributions:
Office of Financial Management within the Office of the Chief Financial OfficerKathy Hammer, Director
Keriann BandCurt BartlettJoy BendixWilliam BezioPaula BohnwagnerJeffery BowmanGail BrussEd BurrowsStefanie CraneMonica Cush
Christi DewhirstFrancie FlasinskiThomas CrabillAngela EvansFelicia Ford-JonesLauren FranklinMichelle GattoEric GeroEdward GrampKimberlli Greenlee
Deborah HoldenCassandra HolmanKenneth KirtleyJared LeichtTheresa LewisDonna McGonagleDennis McNamaraJeff MillerMichael MontenegroDeanna Neal
April PrattNatasha SchatzmanBob SmalskasAndrea StanleyGloria SterembergKai TerryScott WheelerJohn Willett
Office of Analytics, Performance, and Improvement within the Office of the Chief Financial OfficerStephen Brockelman, DirectorHal Hendricks Mark Sachse Joshua Vogel
Other Contributors Brian BlockLakesha DavisErik Dorman
Evan FarleyCraig HullCecilia Keeley
Sunny KwaMehul ParekhJohn Rich
Bryan SchillingerBrian WeymanZakiya Zaid
We offer special thanks to Office of Strategic Communications.
We would also like to acknowledge the Office of Inspector General for their input on the audit process and KPMG for the professional manner in which they conducted the audit of the FY 2018 financial statements.
Kind regards - Gerard Badorrek, GSA CFO

OTHER INFORMATION • FY 2018 AGENCY FINANCIAL REPORT168
PHOTOS
Front cover and back: U.S. General Services Administration, Central Office, Washington DC photo: GSA
page opposite table of contents: Detail FBI Miami Field Office Exterior, Miramar, FL photo: GSA
page 4 GSA Plaque, Sandra Day O'connor U.S. Courthouse Phoenix AZ. photo: GSA
Page 7: Ronald V. Dellums Federal Building and U.S. Courthouse. Oakland, CA photo: V Smoothe
Page 8: Recovered plaque dedicated to Customs Service members photo: GSA
Page 8: Airplane/Airport photo: Thinkstock/Getty Images
Page 12: Southwest Ledge Lighthouse,New Haven, CT photo: Versageek
Page 15: Skyscrapers photo: Thinkstock/Getty Images
Page 34: Credit cards photo: Thinkstock/Getty Images
Page 88: Office photo: Thinkstock/Getty Images
Inside back cover Eagle, U.S. General Services Administration, Central Office, Washington DC photo: GSA

GENERAL SERVICESADMINISTRATIONWEBSITES
Main Site www. gsa. gov
Technology www.gsa.gov/technology
Acquisition www.gsa.gov/acquisition
Travel Resources www.gsa.gov/acquisition
Real Estate www.gsa.gov/real-estate
Properties www.gsa.gov/real-estate/gsa-properties
Historic Preservation www.gsa.gov/real-estate/historic-preservation
Agency Performance Report www.gsa.gov/reference/reports/budget-performance/annual-reports
Agency Financial Report www.gsa.gov/reference/reports/budget-performance/annual-reports.
www.facebook.com/gsa
twitter.com/usgsa
www.youtube.com/usgsa
www.instagram.com/usgsa
www.gsa.gov/blog
JOIN THE CONVERSATION

U.S. General Services Administration1800 F Street, NWWashington, DC 20405
gsa.gov/annualreports


![[Afr] Revista Afr n 096](https://img.pdfslide.net/doc/110x75/55cf9724550346d0338feb9f/afr-revista-afr-n-096.jpg)


![[AFR] Revista AFR Nº 093](https://img.pdfslide.net/doc/110x75/577d26191a28ab4e1ea0465c/afr-revista-afr-no-093.jpg)

![[AFR] Revista AFR N 023](https://img.pdfslide.net/doc/110x75/5571f9f7497959916990e502/afr-revista-afr-n-023.jpg)