Embed Size (px)
Citation preview
iShares, Inc.
� iShares MSCI Brazil ETF | EWZ | NYSE Arca
� iShares MSCI Chile ETF | ECH | Cboe BZX
� iShares MSCI Colombia ETF | ICOL | NYSE Arca
� iShares MSCI Israel ETF | EIS | NYSE Arca
� iShares MSCI Russia ETF | ERUS | NYSE Arca
� iShares MSCI South Africa ETF | EZA | NYSE Arca
� iShares MSCI Turkey ETF | TUR | NASDAQ
� iShares MSCI USA Equal Weighted ETF | EUSA | NYSE Arca
AUGUST 31, 2018
2018 ANNUAL REPORT

Page
Market Overview . . . . . . . . . . . . . . . . . . . . . . . . . . . . . . . . . . . . . . . . . . . . . . . . . . . . . . . . . . . . . . . . . . . . . . . . . . . . . . . . . . . . . . . . . . . . . . . . . . . . . . . . . . . . . . . . . . . . . . . . . . . . . . . . . . . . . . . . . . . . . . . . . . . . . . . . . . . . 5Fund Summary . . . . . . . . . . . . . . . . . . . . . . . . . . . . . . . . . . . . . . . . . . . . . . . . . . . . . . . . . . . . . . . . . . . . . . . . . . . . . . . . . . . . . . . . . . . . . . . . . . . . . . . . . . . . . . . . . . . . . . . . . . . . . . . . . . . . . . . . . . . . . . . . . . . . . . . . . . . . . . 6About Fund Performance . . . . . . . . . . . . . . . . . . . . . . . . . . . . . . . . . . . . . . . . . . . . . . . . . . . . . . . . . . . . . . . . . . . . . . . . . . . . . . . . . . . . . . . . . . . . . . . . . . . . . . . . . . . . . . . . . . . . . . . . . . . . . . . . . . . . . . . . . . . . . . . . . . . . 22Shareholder Expenses. . . . . . . . . . . . . . . . . . . . . . . . . . . . . . . . . . . . . . . . . . . . . . . . . . . . . . . . . . . . . . . . . . . . . . . . . . . . . . . . . . . . . . . . . . . . . . . . . . . . . . . . . . . . . . . . . . . . . . . . . . . . . . . . . . . . . . . . . . . . . . . . . . . . . . . 22Schedules of Investments . . . . . . . . . . . . . . . . . . . . . . . . . . . . . . . . . . . . . . . . . . . . . . . . . . . . . . . . . . . . . . . . . . . . . . . . . . . . . . . . . . . . . . . . . . . . . . . . . . . . . . . . . . . . . . . . . . . . . . . . . . . . . . . . . . . . . . . . . . . . . . . . . . . . 23Financial Statements
Statements of Assets and Liabilities. . . . . . . . . . . . . . . . . . . . . . . . . . . . . . . . . . . . . . . . . . . . . . . . . . . . . . . . . . . . . . . . . . . . . . . . . . . . . . . . . . . . . . . . . . . . . . . . . . . . . . . . . . . . . . . . . . . . . . . . . . . . . . . . . . . . . . . . 46Statements of Operations . . . . . . . . . . . . . . . . . . . . . . . . . . . . . . . . . . . . . . . . . . . . . . . . . . . . . . . . . . . . . . . . . . . . . . . . . . . . . . . . . . . . . . . . . . . . . . . . . . . . . . . . . . . . . . . . . . . . . . . . . . . . . . . . . . . . . . . . . . . . . . . . . 48Statements of Changes in Net Assets . . . . . . . . . . . . . . . . . . . . . . . . . . . . . . . . . . . . . . . . . . . . . . . . . . . . . . . . . . . . . . . . . . . . . . . . . . . . . . . . . . . . . . . . . . . . . . . . . . . . . . . . . . . . . . . . . . . . . . . . . . . . . . . . . . . . . . 50
Financial Highlights . . . . . . . . . . . . . . . . . . . . . . . . . . . . . . . . . . . . . . . . . . . . . . . . . . . . . . . . . . . . . . . . . . . . . . . . . . . . . . . . . . . . . . . . . . . . . . . . . . . . . . . . . . . . . . . . . . . . . . . . . . . . . . . . . . . . . . . . . . . . . . . . . . . . . . . . . . 54Notes to Financial Statements. . . . . . . . . . . . . . . . . . . . . . . . . . . . . . . . . . . . . . . . . . . . . . . . . . . . . . . . . . . . . . . . . . . . . . . . . . . . . . . . . . . . . . . . . . . . . . . . . . . . . . . . . . . . . . . . . . . . . . . . . . . . . . . . . . . . . . . . . . . . . . . . 62Report of Independent Registered Public Accounting Firm . . . . . . . . . . . . . . . . . . . . . . . . . . . . . . . . . . . . . . . . . . . . . . . . . . . . . . . . . . . . . . . . . . . . . . . . . . . . . . . . . . . . . . . . . . . . . . . . . . . . . . . . . . . . . . . . . . . . . 72Important Tax Information (Unaudited) . . . . . . . . . . . . . . . . . . . . . . . . . . . . . . . . . . . . . . . . . . . . . . . . . . . . . . . . . . . . . . . . . . . . . . . . . . . . . . . . . . . . . . . . . . . . . . . . . . . . . . . . . . . . . . . . . . . . . . . . . . . . . . . . . . . . . . . . 73Board Review and Approval of Investment Advisory Contract . . . . . . . . . . . . . . . . . . . . . . . . . . . . . . . . . . . . . . . . . . . . . . . . . . . . . . . . . . . . . . . . . . . . . . . . . . . . . . . . . . . . . . . . . . . . . . . . . . . . . . . . . . . . . . . . . . 74Supplemental Information . . . . . . . . . . . . . . . . . . . . . . . . . . . . . . . . . . . . . . . . . . . . . . . . . . . . . . . . . . . . . . . . . . . . . . . . . . . . . . . . . . . . . . . . . . . . . . . . . . . . . . . . . . . . . . . . . . . . . . . . . . . . . . . . . . . . . . . . . . . . . . . . . . . . 86Director and Officer Information . . . . . . . . . . . . . . . . . . . . . . . . . . . . . . . . . . . . . . . . . . . . . . . . . . . . . . . . . . . . . . . . . . . . . . . . . . . . . . . . . . . . . . . . . . . . . . . . . . . . . . . . . . . . . . . . . . . . . . . . . . . . . . . . . . . . . . . . . . . . . . 92General Information . . . . . . . . . . . . . . . . . . . . . . . . . . . . . . . . . . . . . . . . . . . . . . . . . . . . . . . . . . . . . . . . . . . . . . . . . . . . . . . . . . . . . . . . . . . . . . . . . . . . . . . . . . . . . . . . . . . . . . . . . . . . . . . . . . . . . . . . . . . . . . . . . . . . . . . . . 94Glossary of Terms Used in this Report . . . . . . . . . . . . . . . . . . . . . . . . . . . . . . . . . . . . . . . . . . . . . . . . . . . . . . . . . . . . . . . . . . . . . . . . . . . . . . . . . . . . . . . . . . . . . . . . . . . . . . . . . . . . . . . . . . . . . . . . . . . . . . . . . . . . . . . . 95
Table of Contents

THIS PAGE INTENTIONALLY LEFT BLANK.

iShares, Inc.
Global Market Overview
Global equity markets advanced for the 12 months ended August 31, 2018 (“reporting period”). The MSCI ACWI, a broad global equity index that includes both developedand emerging markets, returned 11.41% in U.S. dollar terms for the reporting period.
Global stocks rallied sharply from the beginning of the reporting period through January 2018. Improving global economic growth drove the advance — particularly in theU.S., Europe, Japan, and China — along with rising corporate profits across most regions of the world. By the end of 2017, global corporate earnings estimates for 2018accelerated at their fastest pace in more than a decade.
However, global equity markets grew increasingly volatile during the latter half of the reporting period. While the U.S. economy continued to strengthen, economic growthin other regions of the globe slowed. In addition, rising interest rates and signs of higher inflation weighed on global stocks. Late in the reporting period, escalating tradetensions between the U.S. and several of its trading partners (particularly China), as well as geopolitical developments in Turkey and the Middle East, contributed to furthereconomic concerns and heightened volatility in global equity markets.
U.S. stocks outpaced equity markets in other regions of the world for the reporting period. The U.S. market benefited from a stronger domestic economy; the unemploymentrate reached an 18-year low in May 2018, while manufacturing activity increased meaningfully and consumer spending rose steadily throughout 2018. Tax reformTTlegislation, passed in December 2017, lowered corporate tax rates and contributed to record profit growth for U.S. companies. As the economy strengthened, inflation inthe U.S. increased to its fastest rate in more than six years. In response, the U.S. Federal Reserve Bank (“Fed”) raised short-term interest rates three times during thereporting period, pushing the Fed’s short-term rate target to its highest level in a decade.
Outside of the U.S., equity markets in the Asia-Pacific region posted the strongest returns. Japanese stocks led the advance in the region as the nation’s economy had itslongest sustained expansion in more than 20 years. Australia’s stock market was also a solid performer, benefiting from increased economic activity as exports surged,especially to China, and prices for commodities such as oil and metals rose.
European stock markets trailed other developed markets for the reporting period. Equity market gains in Europe were tempered by slowing economic growth and trade tariffconcerns during the last half of the reporting period. Nonetheless, the European Central Bank (“ECB”) announced plans to end its quantitative easing measures by the endof 2018, indicating that it believes the worst of the European economic downturn is over. On a country basis, the strongest performing markets in Europe were France,Finland, and Norway, while Spain and Belgium trailed.
In contrast to the broad advance in developed equity markets, emerging markets declined modestly for the reporting period. After a strong advance in late 2017 and early2018, emerging markets declined sharply over the last six months of the reporting period. Rising global interest rates, a stronger U.S. dollar, and trade tensions led toreduced expectations for growth and corporate profits in emerging economies. Equity markets in Brazil, Turkey, and Greece declined the most, while the strongestperforming emerging markets included Thailand, Qatar, and the Czech Republic.
Market Overview
M A R K E T O V E R V I E W 5
Investment Objective
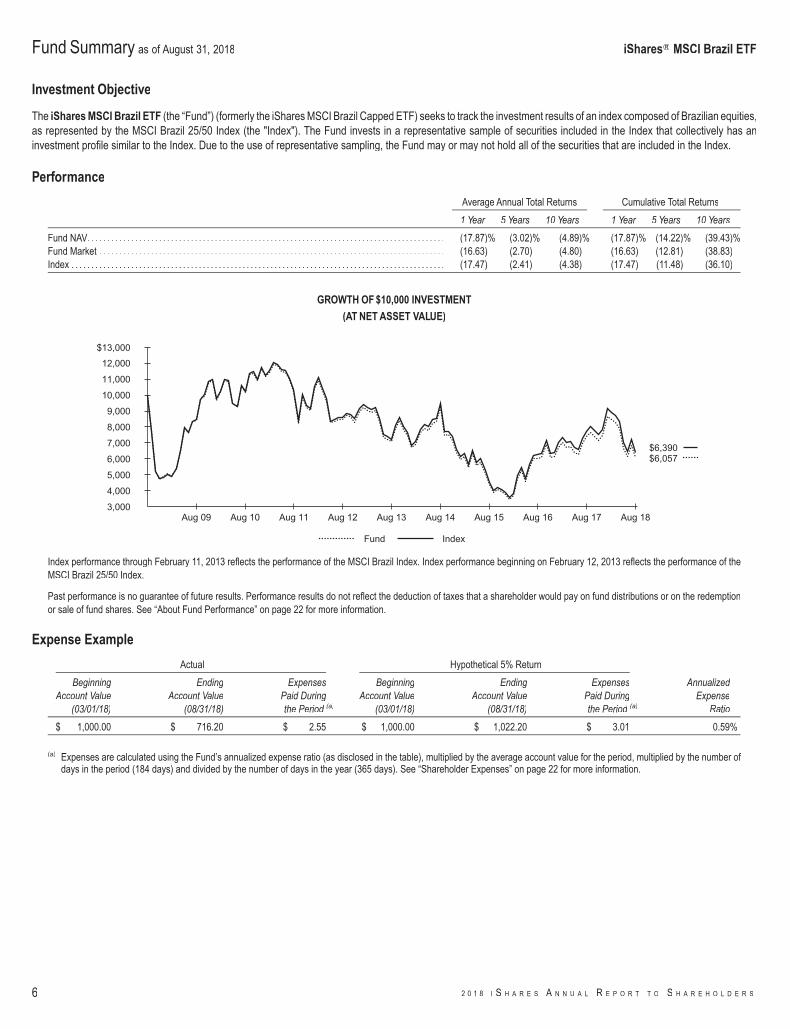
The iShares MSCI Brazil ETF (the “Fund”) (formerly the iShares MSCI Brazil Capped ETF) seeks to track the investment results of an index composed of Brazilian equities,as represented by the MSCI Brazil 25/50 Index (the "Index"). The Fund invests in a representative sample of securities included in the Index that collectively has aninvestment profile similar to the Index. Due to the use of representative sampling, the Fund may or may not hold all of the securities that are included in the Index.
Performance
Average Annual Total Returns Cumulative Total Returns
1 Year 5 Years 10 Years 1 Year 5 Years 10 Years
Fund NAV. . . . . . . . . . . . . . . . . . . . . . . . . . . . . . . . . . . . . . . . . . . . . . . . . . . . . . . . . . . . . . . . . . . . . . . . . . . . . . . . . . . . . . . . . . (17.87)% (3.02)% (4.89)% (17.87)% (14.22)% (39.43)%Fund Market . . . . . . . . . . . . . . . . . . . . . . . . . . . . . . . . . . . . . . . . . . . . . . . . . . . . . . . . . . . . . . . . . . . . . . . . . . . . . . . . . . . . . . . (16.63) (2.70) (4.80) (16.63) (12.81) (38.83)Index . . . . . . . . . . . . . . . . . . . . . . . . . . . . . . . . . . . . . . . . . . . . . . . . . . . . . . . . . . . . . . . . . . . . . . . . . . . . . . . . . . . . . . . . . . . . . . (17.47) (2.41) (4.38) (17.47) (11.48) (36.10)
GROWTH OF $10,000 INVESTMENT
(AT NET ASSET VALUE)
$6,057$6,390
3,000
4,000
5,000
6,000
7,000
8,000
9,000
10,000
11,000
12,000
$13,000
Aug 18Aug 17Aug 16Aug 15Aug 14Aug 13Aug 12Aug 11Aug 10Aug 09
Fund Index
Index performance through February 11, 2013 reflects the performance of the MSCI Brazil Index. Index performance beginning on February 12, 2013 reflects the performance of theMSCI Brazil 25/50 Index.
Past performance is no guarantee of future results. Performance results do not reflect the deduction of taxes that a shareholder would pay on fund distributions or on the redemptionor sale of fund shares. See “About Fund Performance” on page 22 for more information.
Expense Example
Actual Hypothetical 5% Return
BeginningAccount Value
(03/01/18)
EndingAccount Value
(08/31/18)
ExpensesPaid Duringthe Period (a)
BeginningAccount Value
(03/01/18)
EndingAccount Value
(08/31/18)
ExpensesPaid Duringthe Period (a)
AnnualizedExpense
Ratio
$ 1,000.00 $ 716.20 $ 2.55 $ 1,000.00 $ 1,022.20 $ 3.01 0.59%
(a) Expenses are calculated using the Fund’s annualized expense ratio (as disclosed in the table), multiplied by the average account value for the period, multiplied by the number ofdays in the period (184 days) and divided by the number of days in the year (365 days). See “Shareholder Expenses” on page 22 for more information.
Fund Summary as of August 31, 2018 iShares� MSCI Brazil ETF
6 2 0 1 8 I S H A R E S A N N U A L R E P O R T T O S H A R E H O L D E R S
Portfolio Management Commentary
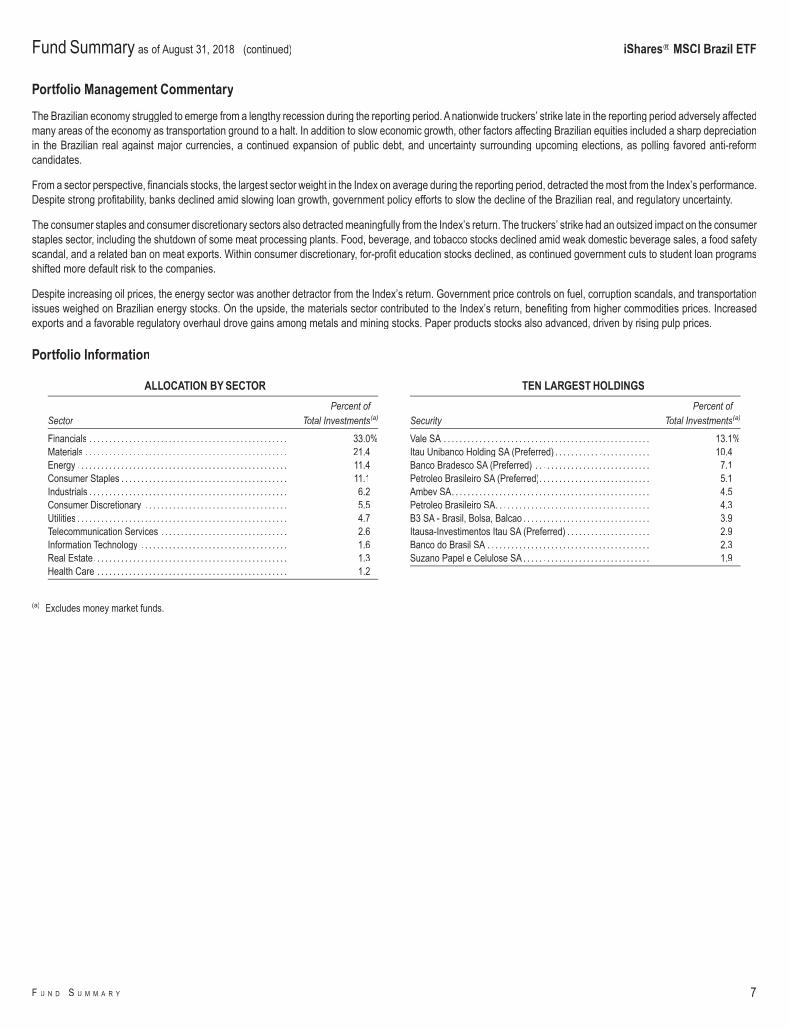
The Brazilian economy struggled to emerge from a lengthy recession during the reporting period. A nationwide truckers’ strike late in the reporting period adversely affectedmany areas of the economy as transportation ground to a halt. In addition to slow economic growth, other factors affecting Brazilian equities included a sharp depreciationin the Brazilian real against major currencies, a continued expansion of public debt, and uncertainty surrounding upcoming elections, as polling favored anti-reformcandidates.
From a sector perspective, financials stocks, the largest sector weight in the Index on average during the reporting period, detracted the most from the Index’s performance.Despite strong profitability, banks declined amid slowing loan growth, government policy efforts to slow the decline of the Brazilian real, and regulatory uncertainty.
The consumer staples and consumer discretionary sectors also detracted meaningfully from the Index’s return. The truckers’ strike had an outsized impact on the consumerstaples sector, including the shutdown of some meat processing plants. Food, beverage, and tobacco stocks declined amid weak domestic beverage sales, a food safetyscandal, and a related ban on meat exports. Within consumer discretionary, for-profit education stocks declined, as continued government cuts to student loan programsshifted more default risk to the companies.
Despite increasing oil prices, the energy sector was another detractor from the Index’s return. Government price controls on fuel, corruption scandals, and transportationissues weighed on Brazilian energy stocks. On the upside, the materials sector contributed to the Index’s return, benefiting from higher commodities prices. Increasedexports and a favorable regulatory overhaul drove gains among metals and mining stocks. Paper products stocks also advanced, driven by rising pulp prices.
Portfolio Information
ALLOCATION BY SECTOR
SectorPercent of
Total Investments(a)
Financials . . . . . . . . . . . . . . . . . . . . . . . . . . . . . . . . . . . . . . . . . . . . . . . . . . 33.0%Materials . . . . . . . . . . . . . . . . . . . . . . . . . . . . . . . . . . . . . . . . . . . . . . . . . . . 21.4Energy . . . . . . . . . . . . . . . . . . . . . . . . . . . . . . . . . . . . . . . . . . . . . . . . . . . . . 11.4Consumer Staples . . . . . . . . . . . . . . . . . . . . . . . . . . . . . . . . . . . . . . . . . . 11.1Industrials . . . . . . . . . . . . . . . . . . . . . . . . . . . . . . . . . . . . . . . . . . . . . . . . . . 6.2Consumer Discretionary . . . . . . . . . . . . . . . . . . . . . . . . . . . . . . . . . . . . 5.5Utilities . . . . . . . . . . . . . . . . . . . . . . . . . . . . . . . . . . . . . . . . . . . . . . . . . . . . . 4.7Telecommunication Services . . . . . . . . . . . . . . . . . . . . . . . . . . . . . . . . 2.6Information Technology . . . . . . . . . . . . . . . . . . . . . . . . . . . . . . . . . . . . . 1.6Real Estate. . . . . . . . . . . . . . . . . . . . . . . . . . . . . . . . . . . . . . . . . . . . . . . . . 1.3Health Care . . . . . . . . . . . . . . . . . . . . . . . . . . . . . . . . . . . . . . . . . . . . . . . . 1.2
TEN LARGEST HOLDINGS
SecurityPercent of
Total Investments(a)
Vale SA . . . . . . . . . . . . . . . . . . . . . . . . . . . . . . . . . . . . . . . . . . . . . . . . . . . . 13.1%Itau Unibanco Holding SA (Preferred) . . . . . . . . . . . . . . . . . . . . . . . . 10.4Banco Bradesco SA (Preferred) . . . . . . . . . . . . . . . . . . . . . . . . . . . . . 7.1Petroleo Brasileiro SA (Preferred). . . . . . . . . . . . . . . . . . . . . . . . . . . . 5.1Ambev SA. . . . . . . . . . . . . . . . . . . . . . . . . . . . . . . . . . . . . . . . . . . . . . . . . . 4.5Petroleo Brasileiro SA. . . . . . . . . . . . . . . . . . . . . . . . . . . . . . . . . . . . . . . 4.3B3 SA - Brasil, Bolsa, Balcao . . . . . . . . . . . . . . . . . . . . . . . . . . . . . . . . 3.9Itausa-Investimentos Itau SA (Preferred) . . . . . . . . . . . . . . . . . . . . . 2.9Banco do Brasil SA . . . . . . . . . . . . . . . . . . . . . . . . . . . . . . . . . . . . . . . . . 2.3Suzano Papel e Celulose SA . . . . . . . . . . . . . . . . . . . . . . . . . . . . . . . . 1.9
(a) Excludes money market funds.
Fund Summary as of August 31, 2018 (continued) iShares� MSCI Brazil ETF
F U N D S U M M A R Y 7
Investment Objective
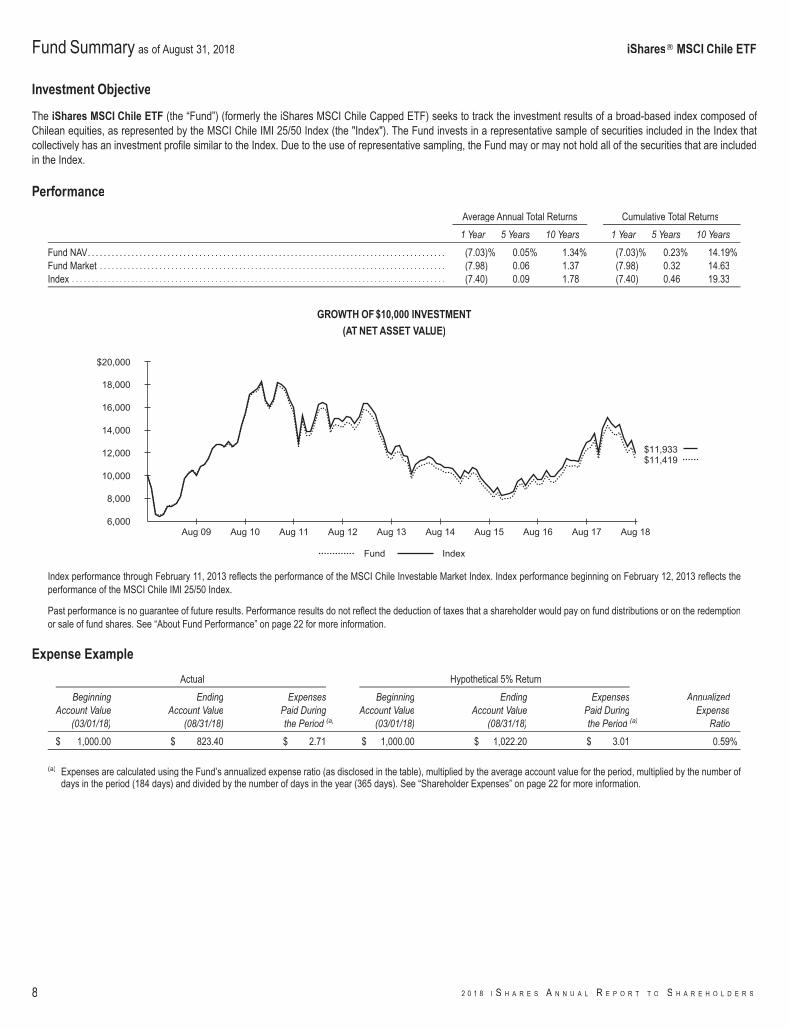
The iShares MSCI Chile ETF (the “Fund”) (formerly the iShares MSCI Chile Capped ETF) seeks to track the investment results of a broad-based index composed ofChilean equities, as represented by the MSCI Chile IMI 25/50 Index (the "Index"). The Fund invests in a representative sample of securities included in the Index thatcollectively has an investment profile similar to the Index. Due to the use of representative sampling, the Fund may or may not hold all of the securities that are includedin the Index.
Performance
Average Annual Total Returns Cumulative Total Returns
1 Year 5 Years 10 Years 1 Year 5 Years 10 Years
Fund NAV. . . . . . . . . . . . . . . . . . . . . . . . . . . . . . . . . . . . . . . . . . . . . . . . . . . . . . . . . . . . . . . . . . . . . . . . . . . . . . . . . . . . . . . . . . (7.03)% 0.05% 1.34% (7.03)% 0.23% 14.19%Fund Market . . . . . . . . . . . . . . . . . . . . . . . . . . . . . . . . . . . . . . . . . . . . . . . . . . . . . . . . . . . . . . . . . . . . . . . . . . . . . . . . . . . . . . . (7.98) 0.06 1.37 (7.98) 0.32 14.63Index . . . . . . . . . . . . . . . . . . . . . . . . . . . . . . . . . . . . . . . . . . . . . . . . . . . . . . . . . . . . . . . . . . . . . . . . . . . . . . . . . . . . . . . . . . . . . . (7.40) 0.09 1.78 (7.40) 0.46 19.33
GROWTH OF $10,000 INVESTMENT
(AT NET ASSET VALUE)
$11,419$11,933
6,000
8,000
10,000
12,000
14,000
16,000
18,000
$20,000
Aug 18Aug 17Aug 16Aug 15Aug 14Aug 13Aug 12Aug 11Aug 10Aug 09
Fund Index
Index performance through February 11, 2013 reflects the performance of the MSCI Chile Investable Market Index. Index performance beginning on February 12, 2013 reflects theperformance of the MSCI Chile IMI 25/50 Index.
Past performance is no guarantee of future results. Performance results do not reflect the deduction of taxes that a shareholder would pay on fund distributions or on the redemptionor sale of fund shares. See “About Fund Performance” on page 22 for more information.
Expense Example
Actual Hypothetical 5% Return
BeginningAccount Value
(03/01/18)
EndingAccount Value
(08/31/18)
ExpensesPaid Duringthe Period (a)
BeginningAccount Value
(03/01/18)
EndingAccount Value
(08/31/18)
ExpensesPaid Duringthe Period (a)
AnnualizedExpense
Ratio
$ 1,000.00 $ 823.40 $ 2.71 $ 1,000.00 $ 1,022.20 $ 3.01 0.59%
(a) Expenses are calculated using the Fund’s annualized expense ratio (as disclosed in the table), multiplied by the average account value for the period, multiplied by the number ofdays in the period (184 days) and divided by the number of days in the year (365 days). See “Shareholder Expenses” on page 22 for more information.
Fund Summary as of August 31, 2018 iShares� MSCI Chile ETF
8 2 0 1 8 I S H A R E S A N N U A L R E P O R T T O S H A R E H O L D E R S
Portfolio Management Commentary
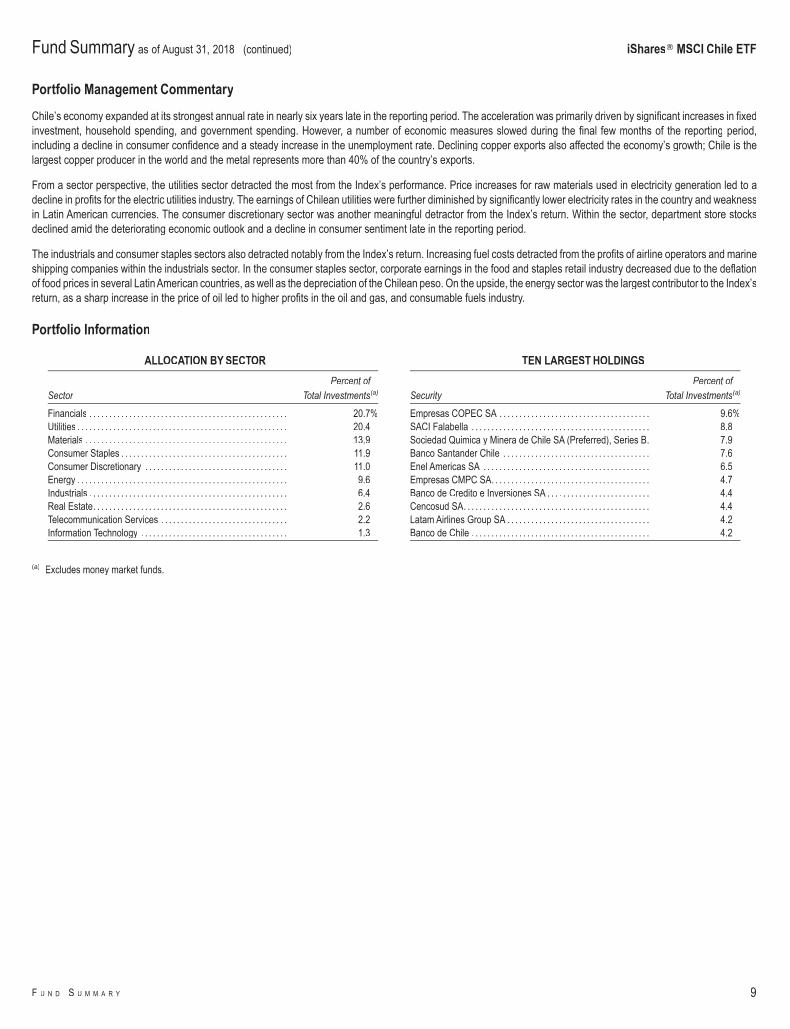
Chile’s economy expanded at its strongest annual rate in nearly six years late in the reporting period. The acceleration was primarily driven by significant increases in fixedinvestment, household spending, and government spending. However, a number of economic measures slowed during the final few months of the reporting period,including a decline in consumer confidence and a steady increase in the unemployment rate. Declining copper exports also affected the economy’s growth; Chile is thelargest copper producer in the world and the metal represents more than 40% of the country’s exports.
From a sector perspective, the utilities sector detracted the most from the Index’s performance. Price increases for raw materials used in electricity generation led to adecline in profits for the electric utilities industry. The earnings of Chilean utilities were further diminished by significantly lower electricity rates in the country and weaknessin Latin American currencies. The consumer discretionary sector was another meaningful detractor from the Index’s return. Within the sector, department store stocksdeclined amid the deteriorating economic outlook and a decline in consumer sentiment late in the reporting period.
The industrials and consumer staples sectors also detracted notably from the Index’s return. Increasing fuel costs detracted from the profits of airline operators and marineshipping companies within the industrials sector. In the consumer staples sector, corporate earnings in the food and staples retail industry decreased due to the deflationof food prices in several Latin American countries, as well as the depreciation of the Chilean peso. On the upside, the energy sector was the largest contributor to the Index’sreturn, as a sharp increase in the price of oil led to higher profits in the oil and gas, and consumable fuels industry.
Portfolio Information
ALLOCATION BY SECTOR
SectorPercent of
Total Investments(a)
Financials . . . . . . . . . . . . . . . . . . . . . . . . . . . . . . . . . . . . . . . . . . . . . . . . . . 20.7%Utilities . . . . . . . . . . . . . . . . . . . . . . . . . . . . . . . . . . . . . . . . . . . . . . . . . . . . . 20.4Materials . . . . . . . . . . . . . . . . . . . . . . . . . . . . . . . . . . . . . . . . . . . . . . . . . . . 13.9Consumer Staples . . . . . . . . . . . . . . . . . . . . . . . . . . . . . . . . . . . . . . . . . . 11.9Consumer Discretionary . . . . . . . . . . . . . . . . . . . . . . . . . . . . . . . . . . . . 11.0Energy . . . . . . . . . . . . . . . . . . . . . . . . . . . . . . . . . . . . . . . . . . . . . . . . . . . . . 9.6Industrials . . . . . . . . . . . . . . . . . . . . . . . . . . . . . . . . . . . . . . . . . . . . . . . . . . 6.4Real Estate. . . . . . . . . . . . . . . . . . . . . . . . . . . . . . . . . . . . . . . . . . . . . . . . . 2.6Telecommunication Services . . . . . . . . . . . . . . . . . . . . . . . . . . . . . . . . 2.2Information Technology . . . . . . . . . . . . . . . . . . . . . . . . . . . . . . . . . . . . . 1.3
TEN LARGEST HOLDINGS
SecurityPercent of
Total Investments(a)
Empresas COPEC SA . . . . . . . . . . . . . . . . . . . . . . . . . . . . . . . . . . . . . . 9.6%SACI Falabella . . . . . . . . . . . . . . . . . . . . . . . . . . . . . . . . . . . . . . . . . . . . . 8.8Sociedad Quimica y Minera de Chile SA (Preferred), Series B. 7.9Banco Santander Chile . . . . . . . . . . . . . . . . . . . . . . . . . . . . . . . . . . . . . 7.6Enel Americas SA . . . . . . . . . . . . . . . . . . . . . . . . . . . . . . . . . . . . . . . . . . 6.5Empresas CMPC SA. . . . . . . . . . . . . . . . . . . . . . . . . . . . . . . . . . . . . . . . 4.7Banco de Credito e Inversiones SA . . . . . . . . . . . . . . . . . . . . . . . . . . 4.4Cencosud SA. . . . . . . . . . . . . . . . . . . . . . . . . . . . . . . . . . . . . . . . . . . . . . . 4.4Latam Airlines Group SA . . . . . . . . . . . . . . . . . . . . . . . . . . . . . . . . . . . . 4.2Banco de Chile . . . . . . . . . . . . . . . . . . . . . . . . . . . . . . . . . . . . . . . . . . . . . 4.2
(a) Excludes money market funds.
Fund Summary as of August 31, 2018 (continued) iShares� MSCI Chile ETF
F U N D S U M M A R Y 9
Investment Objective
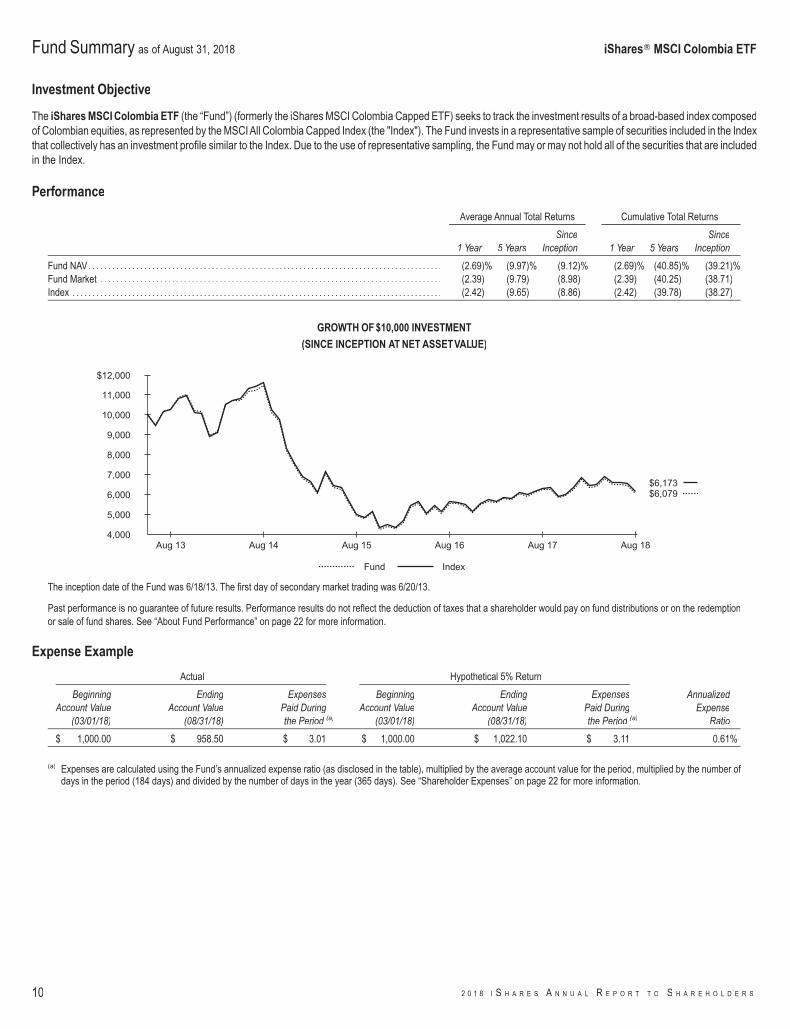
The iShares MSCI Colombia ETF (the “Fund”) (formerly the iShares MSCI Colombia Capped ETF) seeks to track the investment results of a broad-based index composedof Colombian equities, as represented by the MSCI All Colombia Capped Index (the "Index"). The Fund invests in a representative sample of securities included in the Indexthat collectively has an investment profile similar to the Index. Due to the use of representative sampling, the Fund may or may not hold all of the securities that are includedin the Index.
Performance
Average Annual Total Returns Cumulative Total Returns
1 Year 5 YearsSince
Inception 1 Year 5 YearsSince
Inception
Fund NAV. . . . . . . . . . . . . . . . . . . . . . . . . . . . . . . . . . . . . . . . . . . . . . . . . . . . . . . . . . . . . . . . . . . . . . . . . . . . . . . . . . . . . . . . . (2.69)% (9.97)% (9.12)% (2.69)% (40.85)% (39.21)%Fund Market . . . . . . . . . . . . . . . . . . . . . . . . . . . . . . . . . . . . . . . . . . . . . . . . . . . . . . . . . . . . . . . . . . . . . . . . . . . . . . . . . . . . . . (2.39) (9.79) (8.98) (2.39) (40.25) (38.71)Index . . . . . . . . . . . . . . . . . . . . . . . . . . . . . . . . . . . . . . . . . . . . . . . . . . . . . . . . . . . . . . . . . . . . . . . . . . . . . . . . . . . . . . . . . . . . . (2.42) (9.65) (8.86) (2.42) (39.78) (38.27)
GROWTH OF $10,000 INVESTMENT
(SINCE INCEPTION AT NET ASSETVALUE)
$6,079$6,173
4,000
5,000
6,000
7,000
8,000
9,000
10,000
11,000
$12,000
Aug 18Aug 17Aug 16Aug 15Aug 14Aug 13
Fund Index
The inception date of the Fund was 6/18/13. The first day of secondary market trading was 6/20/13.
Past performance is no guarantee of future results. Performance results do not reflect the deduction of taxes that a shareholder would pay on fund distributions or on the redemptionor sale of fund shares. See “About Fund Performance” on page 22 for more information.
Expense Example
Actual Hypothetical 5% Return
BeginningAccount Value
(03/01/18)
EndingAccount Value
(08/31/18)
ExpensesPaid Duringthe Period (a)
BeginningAccount Value
(03/01/18)
EndingAccount Value
(08/31/18)
ExpensesPaid Duringthe Period (a)
AnnualizedExpense
Ratio
$ 1,000.00 $ 958.50 $ 3.01 $ 1,000.00 $ 1,022.10 $ 3.11 0.61%
(a) Expenses are calculated using the Fund’s annualized expense ratio (as disclosed in the table), multiplied by the average account value for the period, multiplied by the number ofdays in the period (184 days) and divided by the number of days in the year (365 days). See “Shareholder Expenses” on page 22 for more information.
Fund Summary as of August 31, 2018 iShares� MSCI Colombia ETF
10 2 0 1 8 I S H A R E S A N N U A L R E P O R T T O S H A R E H O L D E R S
Portfolio Management Commentary
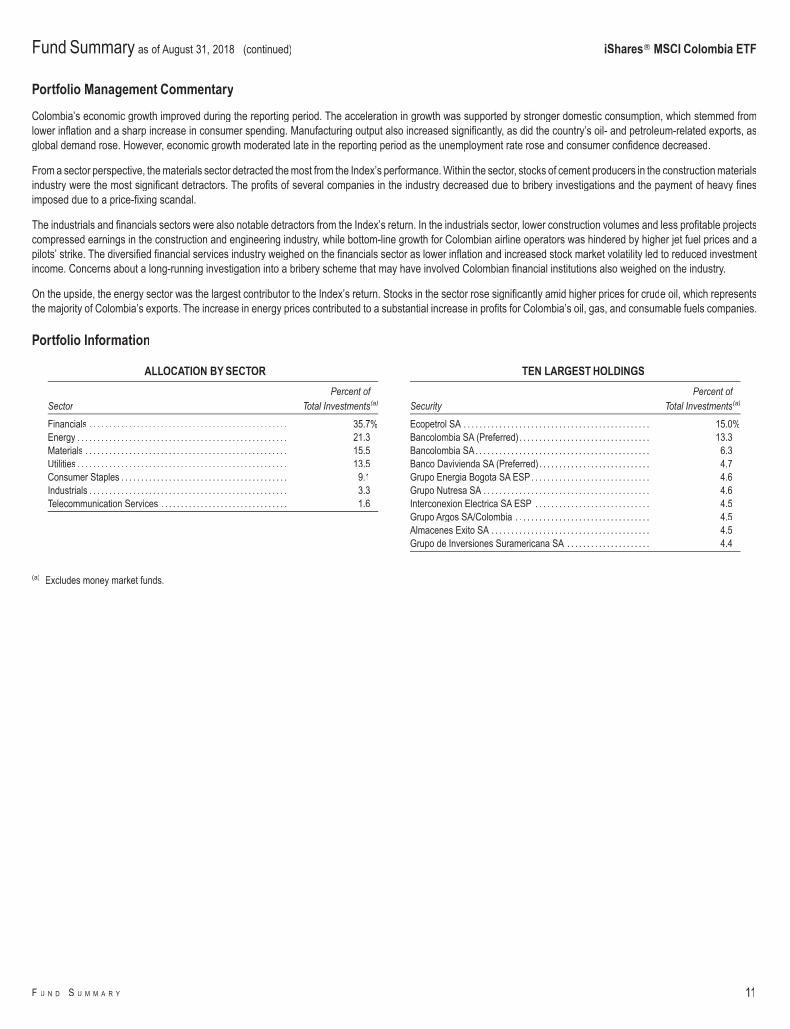
Colombia’s economic growth improved during the reporting period. The acceleration in growth was supported by stronger domestic consumption, which stemmed fromlower inflation and a sharp increase in consumer spending. Manufacturing output also increased significantly, as did the country’s oil- and petroleum-related exports, asglobal demand rose. However, economic growth moderated late in the reporting period as the unemployment rate rose and consumer confidence decreased.
From a sector perspective, the materials sector detracted the most from the Index’s performance. Within the sector, stocks of cement producers in the construction materialsindustry were the most significant detractors. The profits of several companies in the industry decreased due to bribery investigations and the payment of heavy finesimposed due to a price-fixing scandal.
The industrials and financials sectors were also notable detractors from the Index’s return. In the industrials sector, lower construction volumes and less profitable projectscompressed earnings in the construction and engineering industry, while bottom-line growth for Colombian airline operators was hindered by higher jet fuel prices and apilots’ strike. The diversified financial services industry weighed on the financials sector as lower inflation and increased stock market volatility led to reduced investmentincome. Concerns about a long-running investigation into a bribery scheme that may have involved Colombian financial institutions also weighed on the industry.
On the upside, the energy sector was the largest contributor to the Index’s return. Stocks in the sector rose significantly amid higher prices for crude oil, which representsthe majority of Colombia’s exports. The increase in energy prices contributed to a substantial increase in profits for Colombia’s oil, gas, and consumable fuels companies.
Portfolio Information
ALLOCATION BY SECTOR
SectorPercent of
Total Investments(a)
Financials . . . . . . . . . . . . . . . . . . . . . . . . . . . . . . . . . . . . . . . . . . . . . . . . . . 35.7%Energy . . . . . . . . . . . . . . . . . . . . . . . . . . . . . . . . . . . . . . . . . . . . . . . . . . . . . 21.3Materials . . . . . . . . . . . . . . . . . . . . . . . . . . . . . . . . . . . . . . . . . . . . . . . . . . . 15.5Utilities . . . . . . . . . . . . . . . . . . . . . . . . . . . . . . . . . . . . . . . . . . . . . . . . . . . . . 13.5Consumer Staples . . . . . . . . . . . . . . . . . . . . . . . . . . . . . . . . . . . . . . . . . . 9.1Industrials . . . . . . . . . . . . . . . . . . . . . . . . . . . . . . . . . . . . . . . . . . . . . . . . . . 3.3Telecommunication Services . . . . . . . . . . . . . . . . . . . . . . . . . . . . . . . . 1.6
TEN LARGEST HOLDINGS
SecurityPercent of
Total Investments(a)
Ecopetrol SA . . . . . . . . . . . . . . . . . . . . . . . . . . . . . . . . . . . . . . . . . . . . . . . 15.0%Bancolombia SA (Preferred) . . . . . . . . . . . . . . . . . . . . . . . . . . . . . . . . . 13.3Bancolombia SA. . . . . . . . . . . . . . . . . . . . . . . . . . . . . . . . . . . . . . . . . . . . 6.3Banco Davivienda SA (Preferred) . . . . . . . . . . . . . . . . . . . . . . . . . . . . 4.7Grupo Energia Bogota SA ESP . . . . . . . . . . . . . . . . . . . . . . . . . . . . . . 4.6Grupo Nutresa SA . . . . . . . . . . . . . . . . . . . . . . . . . . . . . . . . . . . . . . . . . . 4.6Interconexion Electrica SA ESP . . . . . . . . . . . . . . . . . . . . . . . . . . . . . 4.5Grupo Argos SA/Colombia . . . . . . . . . . . . . . . . . . . . . . . . . . . . . . . . . . 4.5Almacenes Exito SA . . . . . . . . . . . . . . . . . . . . . . . . . . . . . . . . . . . . . . . . 4.5Grupo de Inversiones Suramericana SA . . . . . . . . . . . . . . . . . . . . . 4.4
(a) Excludes money market funds.
Fund Summary as of August 31, 2018 (continued) iShares� MSCI Colombia ETF
F U N D S U M M A R Y 11
Investment Objective
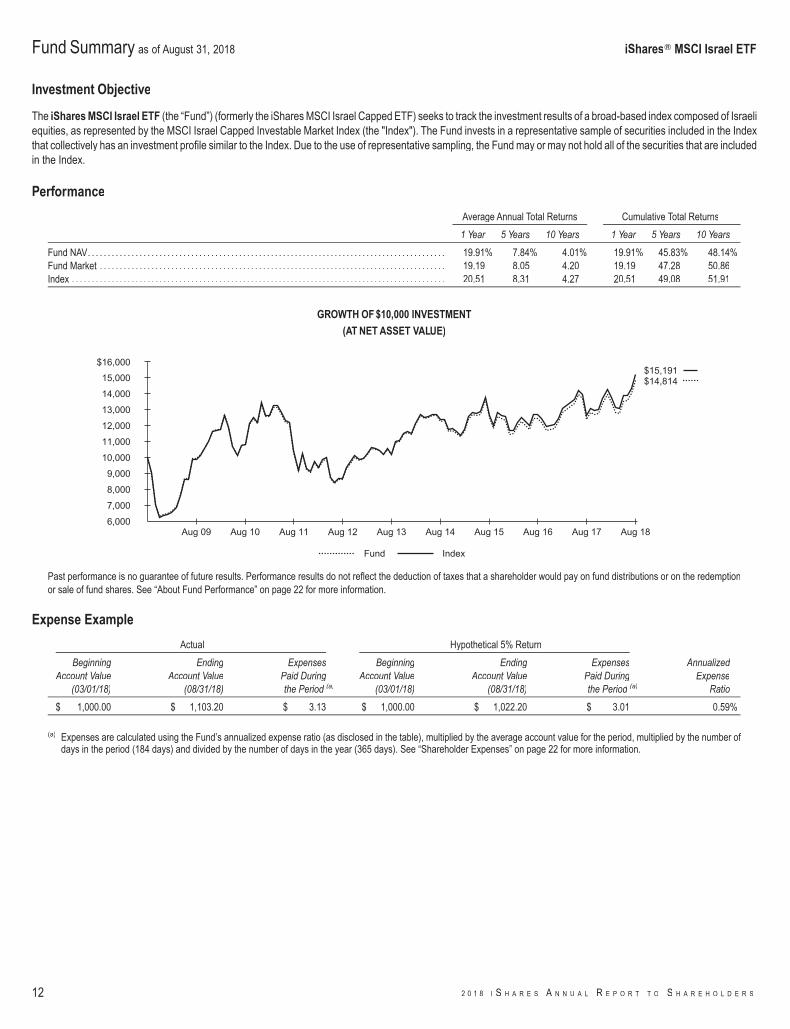
The iShares MSCI Israel ETF (the “Fund”) (formerly the iShares MSCI Israel Capped ETF) seeks to track the investment results of a broad-based index composed of Israeliequities, as represented by the MSCI Israel Capped Investable Market Index (the "Index"). The Fund invests in a representative sample of securities included in the Indexthat collectively has an investment profile similar to the Index. Due to the use of representative sampling, the Fund may or may not hold all of the securities that are includedin the Index.
Performance
Average Annual Total Returns Cumulative Total Returns
1 Year 5 Years 10 Years 1 Year 5 Years 10 Years
Fund NAV. . . . . . . . . . . . . . . . . . . . . . . . . . . . . . . . . . . . . . . . . . . . . . . . . . . . . . . . . . . . . . . . . . . . . . . . . . . . . . . . . . . . . . . . . . 19.91% 7.84% 4.01% 19.91% 45.83% 48.14%Fund Market . . . . . . . . . . . . . . . . . . . . . . . . . . . . . . . . . . . . . . . . . . . . . . . . . . . . . . . . . . . . . . . . . . . . . . . . . . . . . . . . . . . . . . . 19.19 8.05 4.20 19.19 47.28 50.86Index . . . . . . . . . . . . . . . . . . . . . . . . . . . . . . . . . . . . . . . . . . . . . . . . . . . . . . . . . . . . . . . . . . . . . . . . . . . . . . . . . . . . . . . . . . . . . . 20.51 8.31 4.27 20.51 49.08 51.91
GROWTH OF $10,000 INVESTMENT
(AT NET ASSET VALUE)
$14,814$15,191
6,000
7,000
8,000
9,000
10,000
11,000
12,000
13,000
14,000
15,000
$16,000
Aug 18Aug 17Aug 16Aug 15Aug 14Aug 13Aug 12Aug 11Aug 10Aug 09
Fund Index
Past performance is no guarantee of future results. Performance results do not reflect the deduction of taxes that a shareholder would pay on fund distributions or on the redemptionor sale of fund shares. See “About Fund Performance” on page 22 for more information.
Expense Example
Actual Hypothetical 5% Return
BeginningAccount Value
(03/01/18)
EndingAccount Value
(08/31/18)
ExpensesPaid Duringthe Period (a)
BeginningAccount Value
(03/01/18)
EndingAccount Value
(08/31/18)
ExpensesPaid Duringthe Period (a)
AnnualizedExpense
Ratio
$ 1,000.00 $ 1,103.20 $ 3.13 $ 1,000.00 $ 1,022.20 $ 3.01 0.59%
(a) Expenses are calculated using the Fund’s annualized expense ratio (as disclosed in the table), multiplied by the average account value for the period, multiplied by the number ofdays in the period (184 days) and divided by the number of days in the year (365 days). See “Shareholder Expenses” on page 22 for more information.
Fund Summary as of August 31, 2018 iShares� MSCI Israel ETF
12 2 0 1 8 I S H A R E S A N N U A L R E P O R T T O S H A R E H O L D E R S

Portfolio Management Commentary
Israel’s economy expanded during the reporting period, driven in large part by a flourishing information technology sector. This growth led to labor shortages as reflectedin the record-low unemployment rate and rising real wages. The benefits of the healthy job market to consumers was evident in higher levels of consumer spending. Thenotable performance of the country’s economy combined with the government’s budget and debt management prompted upgrades of its credit by prominent global creditrating agencies. Increases in foreign direct investment and exports further stimulated economic growth.
The healthcare sector contributed the most to the Index’s return for the reporting period. Shifting global demographic trends related to aging populations, healthcare reformin developed markets, and increased demand in emerging markets drove spending for healthcare goods and services. The pharmaceuticals industry was supported bysales of medications to treat chronic conditions such as multiple sclerosis. Growing demand for generic drugs, particularly by the expanding baby-boomer generation in theU.S., also benefited the industry.
The information technology sector was another meaningful contributor to the Index’s performance. Software companies led the sector’s gains, advancing on the growth inglobal demand and spending for artificial intelligence and cybersecurity solutions.
Higher cloud computing revenues made the internet software and services industry another contributor to the Index’s return.
The financials sector also significantly contributed to the Index’s return. Banks performed well as the healthy economy led to increasing loan activity and fee income andfewer credit losses. On the downside, the telecommunication services sector detracted slightly from the Index’s performance due to uncertainty regarding a governmentproposal to increase sector competition.
Portfolio Information
ALLOCATION BY SECTOR
SectorPercent of
Total Investments(a)
Information Technology . . . . . . . . . . . . . . . . . . . . . . . . . . . . . . . . . . . . . 27.9%Financials . . . . . . . . . . . . . . . . . . . . . . . . . . . . . . . . . . . . . . . . . . . . . . . . . . 23.1Health Care . . . . . . . . . . . . . . . . . . . . . . . . . . . . . . . . . . . . . . . . . . . . . . . . 17.5Real Estate. . . . . . . . . . . . . . . . . . . . . . . . . . . . . . . . . . . . . . . . . . . . . . . . . 8.4Materials . . . . . . . . . . . . . . . . . . . . . . . . . . . . . . . . . . . . . . . . . . . . . . . . . . . 7.2Industrials . . . . . . . . . . . . . . . . . . . . . . . . . . . . . . . . . . . . . . . . . . . . . . . . . . 4.9Telecommunication Services . . . . . . . . . . . . . . . . . . . . . . . . . . . . . . . . 3.2Energy . . . . . . . . . . . . . . . . . . . . . . . . . . . . . . . . . . . . . . . . . . . . . . . . . . . . . 3.1Consumer Discretionary . . . . . . . . . . . . . . . . . . . . . . . . . . . . . . . . . . . . 2.6Consumer Staples . . . . . . . . . . . . . . . . . . . . . . . . . . . . . . . . . . . . . . . . . . 1.8Utilities . . . . . . . . . . . . . . . . . . . . . . . . . . . . . . . . . . . . . . . . . . . . . . . . . . . . . 0.3
TEN LARGEST HOLDINGS
SecurityPercent of
Total Investments(a)
Teva Pharmaceutical Industries Ltd. . . . . . . . . . . . . . . . . . . . . . . . . . 16.8%Check Point Software Technologies Ltd. . . . . . . . . . . . . . . . . . . . . . 11.7Bank Leumi Le-Israel BM . . . . . . . . . . . . . . . . . . . . . . . . . . . . . . . . . . . 7.6Bank Hapoalim BM . . . . . . . . . . . . . . . . . . . . . . . . . . . . . . . . . . . . . . . . . 6.2Nice Ltd. . . . . . . . . . . . . . . . . . . . . . . . . . . . . . . . . . . . . . . . . . . . . . . . . . . . 4.5Israel Discount Bank Ltd., Class A . . . . . . . . . . . . . . . . . . . . . . . . . . . 3.4Frutarom Industries Ltd. . . . . . . . . . . . . . . . . . . . . . . . . . . . . . . . . . . . . 3.3Wix. com Ltd. . . . . . . . . . . . . . . . . . . . . . . . . . . . . . . . . . . . . . . . . . . . . . . 3.2Israel Chemicals Ltd. . . . . . . . . . . . . . . . . . . . . . . . . . . . . . . . . . . . . . . . 2.9Elbit Systems Ltd. . . . . . . . . . . . . . . . . . . . . . . . . . . . . . . . . . . . . . . . . . . 2.6
(a) Excludes money market funds.
Fund Summary as of August 31, 2018 (continued) iShares� MSCI Israel ETF
F U N D S U M M A R Y 13
Investment Objective
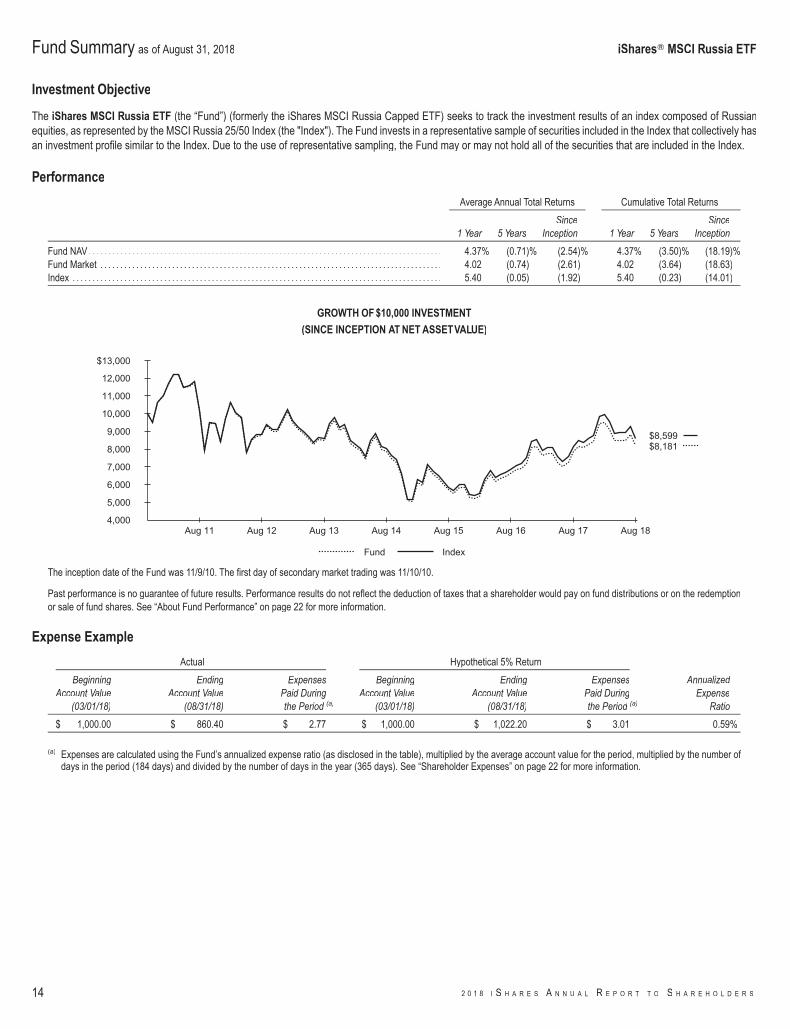
The iShares MSCI Russia ETF (the “Fund”) (formerly the iShares MSCI Russia Capped ETF) seeks to track the investment results of an index composed of Russianequities, as represented by the MSCI Russia 25/50 Index (the "Index"). The Fund invests in a representative sample of securities included in the Index that collectively hasan investment profile similar to the Index. Due to the use of representative sampling, the Fund may or may not hold all of the securities that are included in the Index.
Performance
Average Annual Total Returns Cumulative Total Returns
1 Year 5 YearsSince
Inception 1 Year 5 YearsSince
Inception
Fund NAV. . . . . . . . . . . . . . . . . . . . . . . . . . . . . . . . . . . . . . . . . . . . . . . . . . . . . . . . . . . . . . . . . . . . . . . . . . . . . . . . . . . . . . . . . 4.37% (0.71)% (2.54)% 4.37% (3.50)% (18.19)%Fund Market . . . . . . . . . . . . . . . . . . . . . . . . . . . . . . . . . . . . . . . . . . . . . . . . . . . . . . . . . . . . . . . . . . . . . . . . . . . . . . . . . . . . . . 4.02 (0.74) (2.61) 4.02 (3.64) (18.63)Index . . . . . . . . . . . . . . . . . . . . . . . . . . . . . . . . . . . . . . . . . . . . . . . . . . . . . . . . . . . . . . . . . . . . . . . . . . . . . . . . . . . . . . . . . . . . . 5.40 (0.05) (1.92) 5.40 (0.23) (14.01)
GROWTH OF $10,000 INVESTMENT
(SINCE INCEPTION AT NET ASSETVALUE)
$8,181$8,599
4,000
5,000
6,000
7,000
8,000
9,000
10,000
11,000
12,000
$13,000
Aug 18Aug 17Aug 16Aug 15Aug 14Aug 13Aug 12Aug 11
Fund Index
The inception date of the Fund was 11/9/10. The first day of secondary market trading was 11/10/10.
Past performance is no guarantee of future results. Performance results do not reflect the deduction of taxes that a shareholder would pay on fund distributions or on the redemptionor sale of fund shares. See “About Fund Performance” on page 22 for more information.
Expense Example
Actual Hypothetical 5% Return
BeginningAccount Value
(03/01/18)
EndingAccount Value
(08/31/18)
ExpensesPaid Duringthe Period (a)
BeginningAccount Value
(03/01/18)
EndingAccount Value
(08/31/18)
ExpensesPaid Duringthe Period (a)
AnnualizedExpense
Ratio
$ 1,000.00 $ 860.40 $ 2.77 $ 1,000.00 $ 1,022.20 $ 3.01 0.59%
(a) Expenses are calculated using the Fund’s annualized expense ratio (as disclosed in the table), multiplied by the average account value for the period, multiplied by the number ofdays in the period (184 days) and divided by the number of days in the year (365 days). See “Shareholder Expenses” on page 22 for more information.
Fund Summary as of August 31, 2018 iShares� MSCI Russia ETF
14 2 0 1 8 I S H A R E S A N N U A L R E P O R T T O S H A R E H O L D E R S
Portfolio Management Commentary
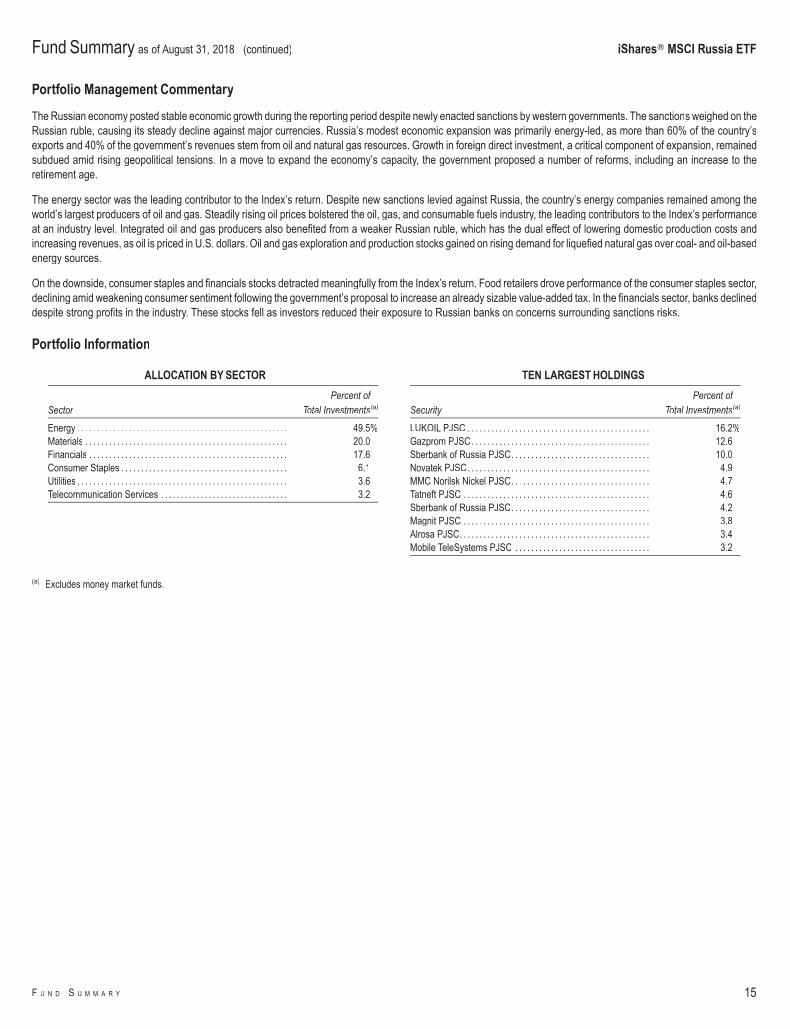
The Russian economy posted stable economic growth during the reporting period despite newly enacted sanctions by western governments. The sanctions weighed on theRussian ruble, causing its steady decline against major currencies. Russia’s modest economic expansion was primarily energy-led, as more than 60% of the country’sexports and 40% of the government’s revenues stem from oil and natural gas resources. Growth in foreign direct investment, a critical component of expansion, remainedsubdued amid rising geopolitical tensions. In a move to expand the economy’s capacity, the government proposed a number of reforms, including an increase to theretirement age.
The energy sector was the leading contributor to the Index’s return. Despite new sanctions levied against Russia, the country’s energy companies remained among theworld’s largest producers of oil and gas. Steadily rising oil prices bolstered the oil, gas, and consumable fuels industry, the leading contributors to the Index’s performanceat an industry level. Integrated oil and gas producers also benefited from a weaker Russian ruble, which has the dual effect of lowering domestic production costs andincreasing revenues, as oil is priced in U.S. dollars. Oil and gas exploration and production stocks gained on rising demand for liquefied natural gas over coal- and oil-basedenergy sources.
On the downside, consumer staples and financials stocks detracted meaningfully from the Index’s return. Food retailers drove performance of the consumer staples sector,declining amid weakening consumer sentiment following the government’s proposal to increase an already sizable value-added tax. In the financials sector, banks declineddespite strong profits in the industry. These stocks fell as investors reduced their exposure to Russian banks on concerns surrounding sanctions risks.
Portfolio Information
ALLOCATION BY SECTOR
SectorPercent of
Total Investments(a)
Energy . . . . . . . . . . . . . . . . . . . . . . . . . . . . . . . . . . . . . . . . . . . . . . . . . . . . . 49.5%Materials . . . . . . . . . . . . . . . . . . . . . . . . . . . . . . . . . . . . . . . . . . . . . . . . . . . 20.0Financials . . . . . . . . . . . . . . . . . . . . . . . . . . . . . . . . . . . . . . . . . . . . . . . . . . 17.6Consumer Staples . . . . . . . . . . . . . . . . . . . . . . . . . . . . . . . . . . . . . . . . . . 6.1Utilities . . . . . . . . . . . . . . . . . . . . . . . . . . . . . . . . . . . . . . . . . . . . . . . . . . . . . 3.6Telecommunication Services . . . . . . . . . . . . . . . . . . . . . . . . . . . . . . . . 3.2
TEN LARGEST HOLDINGS
SecurityPercent of
Total Investments(a)
LUKOIL PJSC . . . . . . . . . . . . . . . . . . . . . . . . . . . . . . . . . . . . . . . . . . . . . . 16.2%Gazprom PJSC. . . . . . . . . . . . . . . . . . . . . . . . . . . . . . . . . . . . . . . . . . . . . 12.6Sberbank of Russia PJSC. . . . . . . . . . . . . . . . . . . . . . . . . . . . . . . . . . . 10.0Novatek PJSC. . . . . . . . . . . . . . . . . . . . . . . . . . . . . . . . . . . . . . . . . . . . . . 4.9MMC Norilsk Nickel PJSC. . . . . . . . . . . . . . . . . . . . . . . . . . . . . . . . . . . 4.7Tatneft PJSC . . . . . . . . . . . . . . . . . . . . . . . . . . . . . . . . . . . . . . . . . . . . . . . 4.6Sberbank of Russia PJSC. . . . . . . . . . . . . . . . . . . . . . . . . . . . . . . . . . . 4.2Magnit PJSC . . . . . . . . . . . . . . . . . . . . . . . . . . . . . . . . . . . . . . . . . . . . . . . 3.8Alrosa PJSC. . . . . . . . . . . . . . . . . . . . . . . . . . . . . . . . . . . . . . . . . . . . . . . . 3.4Mobile TeleSystems PJSC . . . . . . . . . . . . . . . . . . . . . . . . . . . . . . . . . . 3.2
(a) Excludes money market funds.
Fund Summary as of August 31, 2018 (continued) iShares� MSCI Russia ETF
F U N D S U M M A R Y 15
Investment Objective
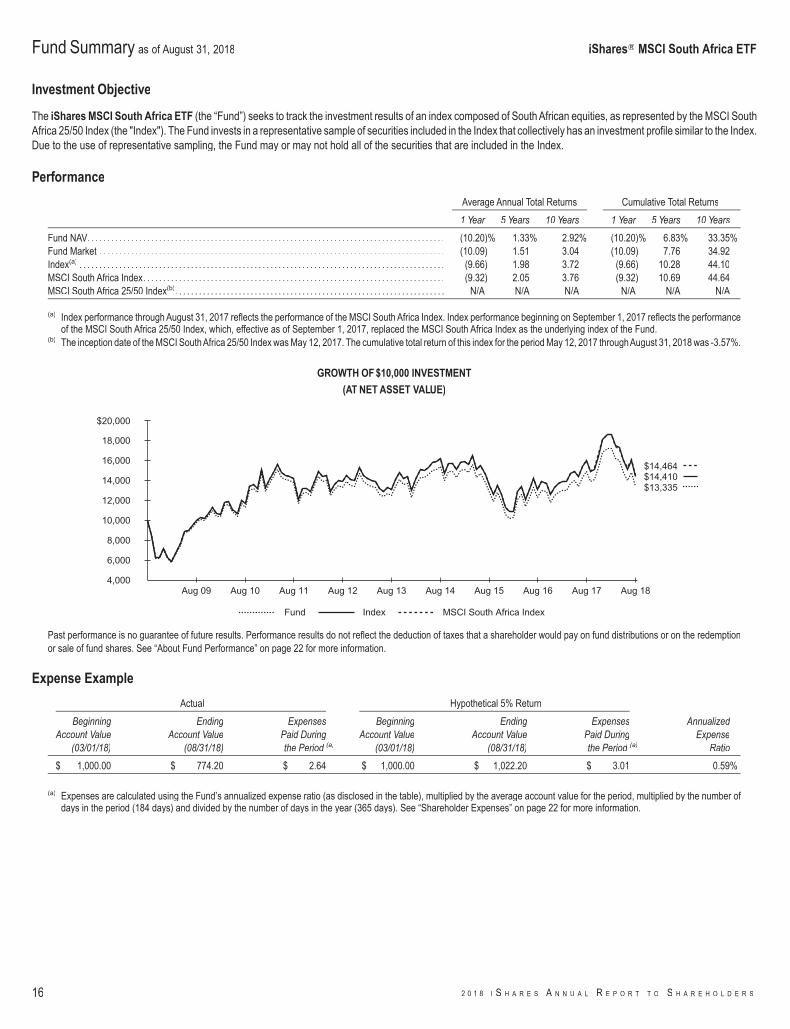
The iShares MSCI South Africa ETF (the “Fund”) seeks to track the investment results of an index composed of South African equities, as represented by the MSCI SouthAfrica 25/50 Index (the "Index"). The Fund invests in a representative sample of securities included in the Index that collectively has an investment profile similar to the Index.Due to the use of representative sampling, the Fund may or may not hold all of the securities that are included in the Index.
Performance
Average Annual Total Returns Cumulative Total Returns
1 Year 5 Years 10 Years 1 Year 5 Years 10 Years
Fund NAV. . . . . . . . . . . . . . . . . . . . . . . . . . . . . . . . . . . . . . . . . . . . . . . . . . . . . . . . . . . . . . . . . . . . . . . . . . . . . . . . . . . . . . . . . . (10.20)% 1.33% 2.92% (10.20)% 6.83% 33.35%Fund Market . . . . . . . . . . . . . . . . . . . . . . . . . . . . . . . . . . . . . . . . . . . . . . . . . . . . . . . . . . . . . . . . . . . . . . . . . . . . . . . . . . . . . . . (10.09) 1.51 3.04 (10.09) 7.76 34.92Index(a) . . . . . . . . . . . . . . . . . . . . . . . . . . . . . . . . . . . . . . . . . . . . . . . . . . . . . . . . . . . . . . . . . . . . . . . . . . . . . . . . . . . . . . . . . . . . (9.66) 1.98 3.72 (9.66) 10.28 44.10MSCI South Africa Index. . . . . . . . . . . . . . . . . . . . . . . . . . . . . . . . . . . . . . . . . . . . . . . . . . . . . . . . . . . . . . . . . . . . . . . . . . . . (9.32) 2.05 3.76 (9.32) 10.69 44.64MSCI South Africa 25/50 Index(b). . . . . . . . . . . . . . . . . . . . . . . . . . . . . . . . . . . . . . . . . . . . . . . . . . . . . . . . . . . . . . . . . . . . N/A N/A N/A N/A N/A N/A
(a) Index performance through August 31, 2017 reflects the performance of the MSCI South Africa Index. Index performance beginning on September 1, 2017 reflects the performanceof the MSCI South Africa 25/50 Index, which, effective as of September 1, 2017, replaced the MSCI South Africa Index as the underlying index of the Fund.
(b) The inception date of the MSCI SouthAfrica 25/50 Index was May 12, 2017. The cumulative total return of this index for the period May 12, 2017 throughAugust 31, 2018 was -3.57%.
GROWTH OF $10,000 INVESTMENT
(AT NET ASSET VALUE)
$13,335$14,410$14,464
4,000
6,000
8,000
10,000
12,000
14,000
16,000
18,000
$20,000
Aug 18Aug 17Aug 16Aug 15Aug 14Aug 13Aug 12Aug 11Aug 10Aug 09
Fund Index MSCI South Africa Index
Past performance is no guarantee of future results. Performance results do not reflect the deduction of taxes that a shareholder would pay on fund distributions or on the redemptionor sale of fund shares. See “About Fund Performance” on page 22 for more information.
Expense Example
Actual Hypothetical 5% Return
BeginningAccount Value
(03/01/18)
EndingAccount Value
(08/31/18)
ExpensesPaid Duringthe Period (a)
BeginningAccount Value
(03/01/18)
EndingAccount Value
(08/31/18)
ExpensesPaid Duringthe Period (a)
AnnualizedExpense
Ratio
$ 1,000.00 $ 774.20 $ 2.64 $ 1,000.00 $ 1,022.20 $ 3.01 0.59%
(a) Expenses are calculated using the Fund’s annualized expense ratio (as disclosed in the table), multiplied by the average account value for the period, multiplied by the number ofdays in the period (184 days) and divided by the number of days in the year (365 days). See “Shareholder Expenses” on page 22 for more information.
Fund Summary as of August 31, 2018 iShares� MSCI South Africa ETF
16 2 0 1 8 I S H A R E S A N N U A L R E P O R T T O S H A R E H O L D E R S
Portfolio Management Commentary
South Africa’s economy entered into a recession during the second half of the reporting period for the first time since the global financial crisis a decade ago. Decliningagricultural productivity played a meaningful role in the recession and was compounded by drought and other unfavorable climate-related events. Exports andmanufacturing output also contracted during the reporting period. South Africa’s recession negatively affected the country’s workers and consumers as unemploymentincreased and consumer spending declined.
From a sector perspective, the consumer discretionary sector was the largest detractor from the Index’s performance. In addition to the unfavorable economic environment,high prices for fuel and increasing tax rates led to a decline in spending on discretionary items, which weakened the sector. The telecommunications services sector wasanother significant detractor from the Index’s return. In a weaker economic environment, businesses decreased spending on communications and technology, whichweighed on revenues for telecommunication services companies.
The real estate and consumer staples sectors were also meaningful detractors from the Index’s return. The decline in the real estate sector was largely due to lowerresidential property prices, an oversupply of office space, and concerns about the accounting practices of a few real estate investment trusts. In the consumer staples sector,food-related industries declined due in part to a bacterial outbreak in processed meats. Declining prices for corn, wheat, and rice, especially early in the reporting period,also weighed on the food products industry.
On the upside, the financials sector was the largest contributor to the Index’s return. Despite the challenging economic environment, South African banks posted solidearnings, benefiting from successful cost-containment initiatives, innovative digital strategies, and operations in stronger-performing economies outside of South Africa.
Portfolio Information
ALLOCATION BY SECTOR
SectorPercent of
Total Investments(a)
Financials . . . . . . . . . . . . . . . . . . . . . . . . . . . . . . . . . . . . . . . . . . . . . . . . . . 31.9%Consumer Discretionary . . . . . . . . . . . . . . . . . . . . . . . . . . . . . . . . . . . . 26.8Materials . . . . . . . . . . . . . . . . . . . . . . . . . . . . . . . . . . . . . . . . . . . . . . . . . . . 12.9Consumer Staples . . . . . . . . . . . . . . . . . . . . . . . . . . . . . . . . . . . . . . . . . . 8.9Real Estate. . . . . . . . . . . . . . . . . . . . . . . . . . . . . . . . . . . . . . . . . . . . . . . . . 6.7Telecommunication Services . . . . . . . . . . . . . . . . . . . . . . . . . . . . . . . . 5.6Health Care . . . . . . . . . . . . . . . . . . . . . . . . . . . . . . . . . . . . . . . . . . . . . . . . 4.5Industrials . . . . . . . . . . . . . . . . . . . . . . . . . . . . . . . . . . . . . . . . . . . . . . . . . . 1.7Energy . . . . . . . . . . . . . . . . . . . . . . . . . . . . . . . . . . . . . . . . . . . . . . . . . . . . . 1.0
TEN LARGEST HOLDINGS
SecurityPercent of
Total Investments(a)
Naspers Ltd., Class N. . . . . . . . . . . . . . . . . . . . . . . . . . . . . . . . . . . . . . . 21.2%Sasol Ltd. . . . . . . . . . . . . . . . . . . . . . . . . . . . . . . . . . . . . . . . . . . . . . . . . . . 7.0Standard Bank Group Ltd. . . . . . . . . . . . . . . . . . . . . . . . . . . . . . . . . . . 5.3FirstRand Ltd. . . . . . . . . . . . . . . . . . . . . . . . . . . . . . . . . . . . . . . . . . . . . . . 5.2MTN Group Ltd. . . . . . . . . . . . . . . . . . . . . . . . . . . . . . . . . . . . . . . . . . . . . 3.3Old Mutual Ltd. . . . . . . . . . . . . . . . . . . . . . . . . . . . . . . . . . . . . . . . . . . . . 2.9Sanlam Ltd. . . . . . . . . . . . . . . . . . . . . . . . . . . . . . . . . . . . . . . . . . . . . . . . . 2.8Absa Group Ltd. . . . . . . . . . . . . . . . . . . . . . . . . . . . . . . . . . . . . . . . . . . . 2.7Aspen Pharmacare Holdings Ltd. . . . . . . . . . . . . . . . . . . . . . . . . . . . 2.6Remgro Ltd. . . . . . . . . . . . . . . . . . . . . . . . . . . . . . . . . . . . . . . . . . . . . . . . 2.6
(a) Excludes money market funds.
Fund Summary as of August 31, 2018 (continued) iShares� MSCI South Africa ETF
F U N D S U M M A R Y 17
Investment Objective
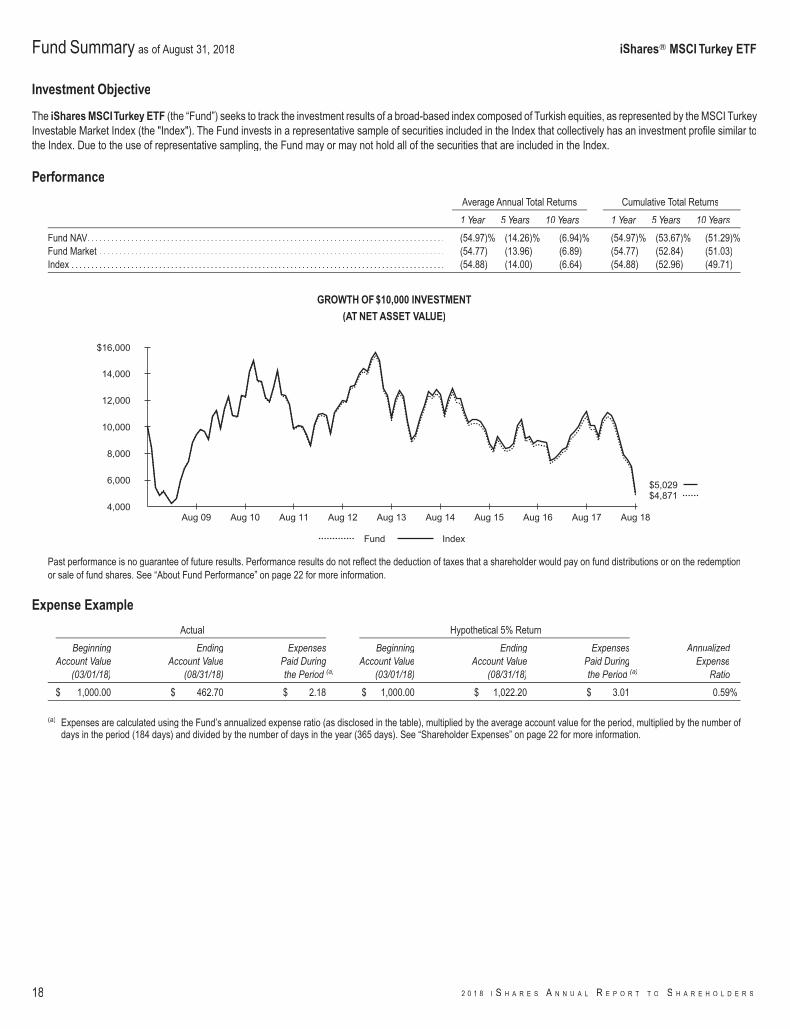
The iShares MSCITurkey ETF (the “Fund”) seeks to track the investment results of a broad-based index composed of Turkish equities, as represented by the MSCI TurkeyInvestable Market Index (the "Index"). The Fund invests in a representative sample of securities included in the Index that collectively has an investment profile similar tothe Index. Due to the use of representative sampling, the Fund may or may not hold all of the securities that are included in the Index.
Performance
Average Annual Total Returns Cumulative Total Returns
1 Year 5 Years 10 Years 1 Year 5 Years 10 Years
Fund NAV. . . . . . . . . . . . . . . . . . . . . . . . . . . . . . . . . . . . . . . . . . . . . . . . . . . . . . . . . . . . . . . . . . . . . . . . . . . . . . . . . . . . . . . . . . (54.97)% (14.26)% (6.94)% (54.97)% (53.67)% (51.29)%Fund Market . . . . . . . . . . . . . . . . . . . . . . . . . . . . . . . . . . . . . . . . . . . . . . . . . . . . . . . . . . . . . . . . . . . . . . . . . . . . . . . . . . . . . . . (54.77) (13.96) (6.89) (54.77) (52.84) (51.03)Index . . . . . . . . . . . . . . . . . . . . . . . . . . . . . . . . . . . . . . . . . . . . . . . . . . . . . . . . . . . . . . . . . . . . . . . . . . . . . . . . . . . . . . . . . . . . . . (54.88) (14.00) (6.64) (54.88) (52.96) (49.71)
GROWTH OF $10,000 INVESTMENT
(AT NET ASSET VALUE)
$4,871$5,029
4,000
6,000
8,000
10,000
12,000
14,000
$16,000
Aug 18Aug 17Aug 16Aug 15Aug 14Aug 13Aug 12Aug 11Aug 10Aug 09
Fund Index
Past performance is no guarantee of future results. Performance results do not reflect the deduction of taxes that a shareholder would pay on fund distributions or on the redemptionor sale of fund shares. See “About Fund Performance” on page 22 for more information.
Expense Example
Actual Hypothetical 5% Return
BeginningAccount Value
(03/01/18)
EndingAccount Value
(08/31/18)
ExpensesPaid Duringthe Period (a)
BeginningAccount Value
(03/01/18)
EndingAccount Value
(08/31/18)
ExpensesPaid Duringthe Period (a)
AnnualizedExpense
Ratio
$ 1,000.00 $ 462.70 $ 2.18 $ 1,000.00 $ 1,022.20 $ 3.01 0.59%
(a) Expenses are calculated using the Fund’s annualized expense ratio (as disclosed in the table), multiplied by the average account value for the period, multiplied by the number ofdays in the period (184 days) and divided by the number of days in the year (365 days). See “Shareholder Expenses” on page 22 for more information.
Fund Summary as of August 31, 2018 iShares� MSCI Turkey ETF
18 2 0 1 8 I S H A R E S A N N U A L R E P O R T T O S H A R E H O L D E R S
Portfolio Management Commentary
The Turkish economy weakened in the second half of the reporting period, largely due to a sharp increase in the country's inflation rate, which rose to nearly 18%.Consequently, both consumer and business confidence decreased. Escalating political tensions with the U.S. also weighed on Turkey’s economy, especially after the U.S.— the world’s largest buyer of Turkish steel — announced it would double tariffs on imports of Turkish metals. These factors directly contributed to Turkey’s currency crisis,in which the Turkish lira declined by 48% relative to the U.S. dollar during the reporting period, falling to an all-time low.
From a sector perspective, the financials sector, which represented approximately 33% of the Index on average during the reporting period, was the largest detractor fromthe Index’s performance. Financials stocks declined as Turkey’s currency crisis worsened and loan defaults increased, which ultimately led to credit rating downgrades fortwo dozen Turkish banks. Banks also faced concerns about whether corporate borrowers could repay their debts; many loans to companies were denominated in U.S.dollars or euros, but the revenues of these companies were earned in Turkish lira, which depreciated significantly in comparison.
The industrials sector also detracted meaningfully from the Index’s return, as industrial production in Turkey weakened throughout the reporting period. In addition, manyTurkish industrial companies have debt denominated in foreign currencies, which created balance sheet concerns as the Turkish lira declined. The consumer staples sectorwas another notable detractor from the Index’s performance. Historically, rising interest rates and higher inflation, both of which were prominent in Turkey during thereporting period, have adversely affected consumer staples stocks.
Portfolio Information
ALLOCATION BY SECTOR
SectorPercent of
Total Investments(a)
Financials . . . . . . . . . . . . . . . . . . . . . . . . . . . . . . . . . . . . . . . . . . . . . . . . . . 24.8%Industrials . . . . . . . . . . . . . . . . . . . . . . . . . . . . . . . . . . . . . . . . . . . . . . . . . . 24.1Materials . . . . . . . . . . . . . . . . . . . . . . . . . . . . . . . . . . . . . . . . . . . . . . . . . . . 16.1Consumer Staples . . . . . . . . . . . . . . . . . . . . . . . . . . . . . . . . . . . . . . . . . . 12.2Energy . . . . . . . . . . . . . . . . . . . . . . . . . . . . . . . . . . . . . . . . . . . . . . . . . . . . . 7.3Consumer Discretionary . . . . . . . . . . . . . . . . . . . . . . . . . . . . . . . . . . . . 6.5Telecommunication Services . . . . . . . . . . . . . . . . . . . . . . . . . . . . . . . . 5.5Real Estate. . . . . . . . . . . . . . . . . . . . . . . . . . . . . . . . . . . . . . . . . . . . . . . . . 1.5Utilities . . . . . . . . . . . . . . . . . . . . . . . . . . . . . . . . . . . . . . . . . . . . . . . . . . . . . 1.1Other (each representing less than 1%) . . . . . . . . . . . . . . . . . . . . . . 0.9
TEN LARGEST HOLDINGS
SecurityPercent of
Total Investments(a)
Eregli Demir ve Celik Fabrikalari TAS . . . . . . . . . . . . . . . . . . . . . . . . 7.9%BIM Birlesik Magazalar AS . . . . . . . . . . . . . . . . . . . . . . . . . . . . . . . . . . 7.4Tupras Turkiye Petrol Rafinerileri AS . . . . . . . . . . . . . . . . . . . . . . . . . 7.0Turkiye Garanti Bankasi AS . . . . . . . . . . . . . . . . . . . . . . . . . . . . . . . . . 6.5Akbank Turk AS . . . . . . . . . . . . . . . . . . . . . . . . . . . . . . . . . . . . . . . . . . . . 6.0Turkcell Iletisim Hizmetleri AS . . . . . . . . . . . . . . . . . . . . . . . . . . . . . . . 5.5KOC Holding AS. . . . . . . . . . . . . . . . . . . . . . . . . . . . . . . . . . . . . . . . . . . . 5.4Turk Hava Yollari AO . . . . . . . . . . . . . . . . . . . . . . . . . . . . . . . . . . . . . . . . 4.3Aselsan Elektronik Sanayi Ve Ticaret AS . . . . . . . . . . . . . . . . . . . . . 4.2Haci Omer Sabanci Holding AS. . . . . . . . . . . . . . . . . . . . . . . . . . . . . . 3.1
(a) Excludes money market funds.
Fund Summary as of August 31, 2018 (continued) iShares� MSCI Turkey ETF
F U N D S U M M A R Y 19
Investment Objective
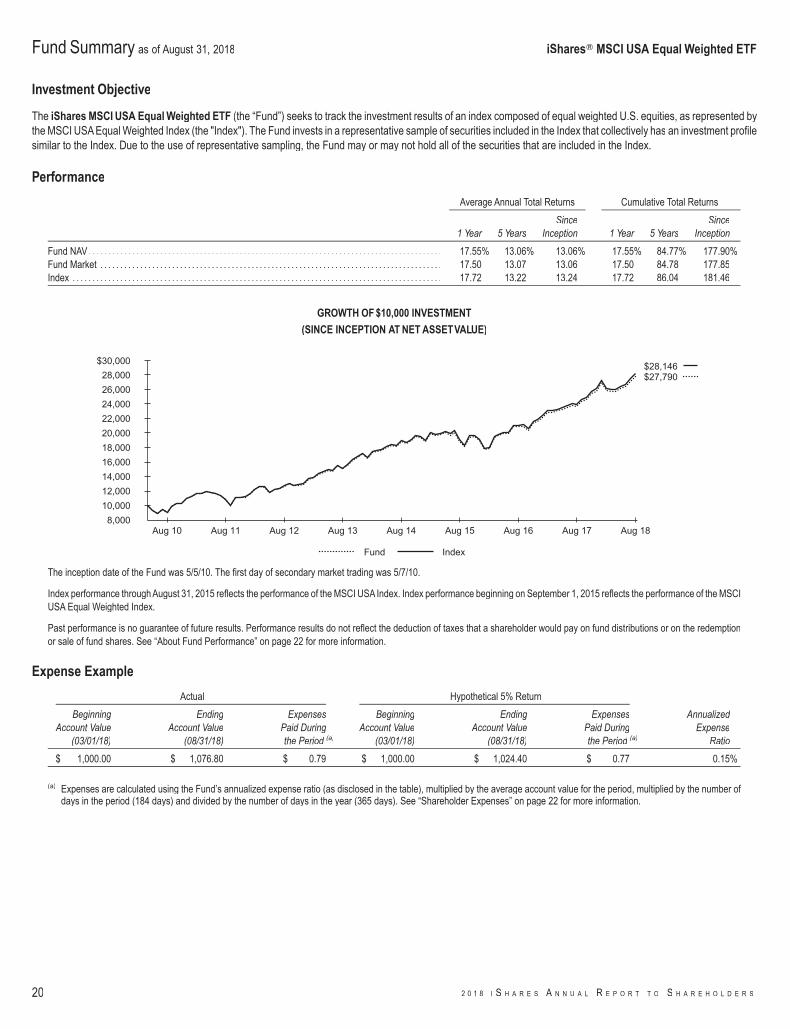
The iShares MSCI USA Equal Weighted ETF (the “Fund”) seeks to track the investment results of an index composed of equal weighted U.S. equities, as represented bythe MSCI USA Equal Weighted Index (the "Index"). The Fund invests in a representative sample of securities included in the Index that collectively has an investment profilesimilar to the Index. Due to the use of representative sampling, the Fund may or may not hold all of the securities that are included in the Index.
Performance
Average Annual Total Returns Cumulative Total Returns
1 Year 5 YearsSince
Inception 1 Year 5 YearsSince
Inception
Fund NAV. . . . . . . . . . . . . . . . . . . . . . . . . . . . . . . . . . . . . . . . . . . . . . . . . . . . . . . . . . . . . . . . . . . . . . . . . . . . . . . . . . . . . . . . . 17.55% 13.06% 13.06% 17.55% 84.77% 177.90%Fund Market . . . . . . . . . . . . . . . . . . . . . . . . . . . . . . . . . . . . . . . . . . . . . . . . . . . . . . . . . . . . . . . . . . . . . . . . . . . . . . . . . . . . . . 17.50 13.07 13.06 17.50 84.78 177.85Index . . . . . . . . . . . . . . . . . . . . . . . . . . . . . . . . . . . . . . . . . . . . . . . . . . . . . . . . . . . . . . . . . . . . . . . . . . . . . . . . . . . . . . . . . . . . . 17.72 13.22 13.24 17.72 86.04 181.46
GROWTH OF $10,000 INVESTMENT
(SINCE INCEPTION AT NET ASSETVALUE)
$27,790$28,146
8,00010,00012,00014,00016,00018,00020,00022,00024,00026,00028,000
$30,000
Aug 18Aug 17Aug 16Aug 15Aug 14Aug 13Aug 12Aug 11Aug 10
Fund Index
The inception date of the Fund was 5/5/10. The first day of secondary market trading was 5/7/10.
Index performance through August 31, 2015 reflects the performance of the MSCI USA Index. Index performance beginning on September 1, 2015 reflects the performance of the MSCIUSA Equal Weighted Index.
Past performance is no guarantee of future results. Performance results do not reflect the deduction of taxes that a shareholder would pay on fund distributions or on the redemptionor sale of fund shares. See “About Fund Performance” on page 22 for more information.
Expense Example
Actual Hypothetical 5% Return
BeginningAccount Value
(03/01/18)
EndingAccount Value
(08/31/18)
ExpensesPaid Duringthe Period (a)
BeginningAccount Value
(03/01/18)
EndingAccount Value
(08/31/18)
ExpensesPaid Duringthe Period (a)
AnnualizedExpense
Ratio
$ 1,000.00 $ 1,076.80 $ 0.79 $ 1,000.00 $ 1,024.40 $ 0.77 0.15%
(a) Expenses are calculated using the Fund’s annualized expense ratio (as disclosed in the table), multiplied by the average account value for the period, multiplied by the number ofdays in the period (184 days) and divided by the number of days in the year (365 days). See “Shareholder Expenses” on page 22 for more information.
Fund Summary as of August 31, 2018 iShares� MSCI USA Equal Weighted ETF
20 2 0 1 8 I S H A R E S A N N U A L R E P O R T T O S H A R E H O L D E R S
Portfolio Management Commentary
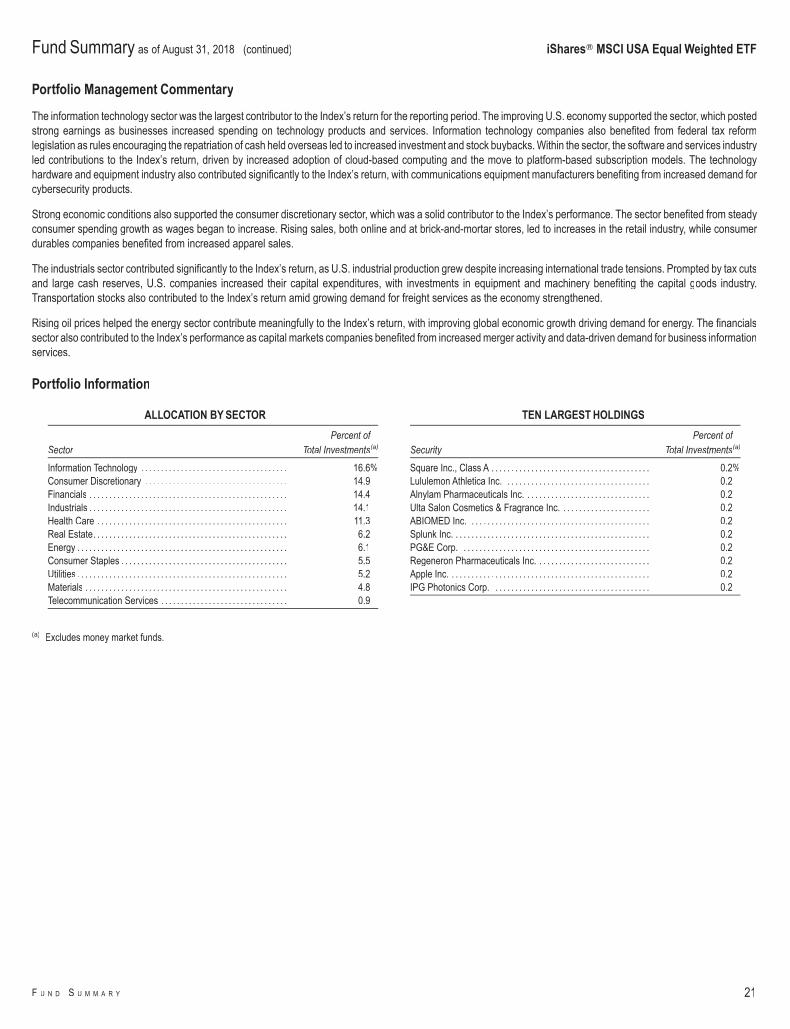
The information technology sector was the largest contributor to the Index’s return for the reporting period. The improving U.S. economy supported the sector, which postedstrong earnings as businesses increased spending on technology products and services. Information technology companies also benefited from federal tax reformlegislation as rules encouraging the repatriation of cash held overseas led to increased investment and stock buybacks. Within the sector, the software and services industryled contributions to the Index’s return, driven by increased adoption of cloud-based computing and the move to platform-based subscription models. The technologyhardware and equipment industry also contributed significantly to the Index’s return, with communications equipment manufacturers benefiting from increased demand forcybersecurity products.
Strong economic conditions also supported the consumer discretionary sector, which was a solid contributor to the Index’s performance. The sector benefited from steadyconsumer spending growth as wages began to increase. Rising sales, both online and at brick-and-mortar stores, led to increases in the retail industry, while consumerdurables companies benefited from increased apparel sales.
The industrials sector contributed significantly to the Index’s return, as U.S. industrial production grew despite increasing international trade tensions. Prompted by tax cutsand large cash reserves, U.S. companies increased their capital expenditures, with investments in equipment and machinery benefiting the capital goods industry.Transportation stocks also contributed to the Index’s return amid growing demand for freight services as the economy strengthened.
Rising oil prices helped the energy sector contribute meaningfully to the Index’s return, with improving global economic growth driving demand for energy. The financialssector also contributed to the Index’s performance as capital markets companies benefited from increased merger activity and data-driven demand for business informationservices.
Portfolio Information
ALLOCATION BY SECTOR
SectorPercent of
Total Investments(a)
Information Technology . . . . . . . . . . . . . . . . . . . . . . . . . . . . . . . . . . . . . 16.6%Consumer Discretionary . . . . . . . . . . . . . . . . . . . . . . . . . . . . . . . . . . . . 14.9Financials . . . . . . . . . . . . . . . . . . . . . . . . . . . . . . . . . . . . . . . . . . . . . . . . . . 14.4Industrials . . . . . . . . . . . . . . . . . . . . . . . . . . . . . . . . . . . . . . . . . . . . . . . . . . 14.1Health Care . . . . . . . . . . . . . . . . . . . . . . . . . . . . . . . . . . . . . . . . . . . . . . . . 11.3Real Estate. . . . . . . . . . . . . . . . . . . . . . . . . . . . . . . . . . . . . . . . . . . . . . . . . 6.2Energy . . . . . . . . . . . . . . . . . . . . . . . . . . . . . . . . . . . . . . . . . . . . . . . . . . . . . 6.1Consumer Staples . . . . . . . . . . . . . . . . . . . . . . . . . . . . . . . . . . . . . . . . . . 5.5Utilities . . . . . . . . . . . . . . . . . . . . . . . . . . . . . . . . . . . . . . . . . . . . . . . . . . . . . 5.2Materials . . . . . . . . . . . . . . . . . . . . . . . . . . . . . . . . . . . . . . . . . . . . . . . . . . . 4.8Telecommunication Services . . . . . . . . . . . . . . . . . . . . . . . . . . . . . . . . 0.9
TEN LARGEST HOLDINGS
SecurityPercent of
Total Investments(a)
Square Inc., Class A . . . . . . . . . . . . . . . . . . . . . . . . . . . . . . . . . . . . . . . . 0.2%Lululemon Athletica Inc. . . . . . . . . . . . . . . . . . . . . . . . . . . . . . . . . . . . . 0.2Alnylam Pharmaceuticals Inc. . . . . . . . . . . . . . . . . . . . . . . . . . . . . . . . 0.2Ulta Salon Cosmetics & Fragrance Inc. . . . . . . . . . . . . . . . . . . . . . . 0.2ABIOMED Inc. . . . . . . . . . . . . . . . . . . . . . . . . . . . . . . . . . . . . . . . . . . . . . 0.2Splunk Inc. . . . . . . . . . . . . . . . . . . . . . . . . . . . . . . . . . . . . . . . . . . . . . . . . . 0.2PG&E Corp. . . . . . . . . . . . . . . . . . . . . . . . . . . . . . . . . . . . . . . . . . . . . . . . 0.2Regeneron Pharmaceuticals Inc. . . . . . . . . . . . . . . . . . . . . . . . . . . . . 0.2Apple Inc. . . . . . . . . . . . . . . . . . . . . . . . . . . . . . . . . . . . . . . . . . . . . . . . . . . 0.2IPG Photonics Corp. . . . . . . . . . . . . . . . . . . . . . . . . . . . . . . . . . . . . . . . 0.2
(a) Excludes money market funds.
Fund Summary as of August 31, 2018 (continued) iShares� MSCI USA Equal Weighted ETF
F U N D S U M M A R Y 21
Past performance is no guarantee of future results. Current performance may be lower or higher than the performance data quoted. Performance data current to the mostrecent month-end is available at www.ishares.com. Performance results assume reinvestment of all dividends and capital gain distributions and do not reflect the deductionof taxes that a shareholder would pay on fund distributions or on the redemption or sale of fund shares. The investment return and principal value of shares will vary withchanges in market conditions. Shares may be worth more or less than their original cost when they are redeemed or sold in the market. Performance for certain funds mayreflect a waiver of a portion of investment advisory fees. Without such a waiver, performance would have been lower.
Net asset value or “NAV” is the value of one share of a fund as calculated in accordance with the standard formula for valuing mutual fund shares. The price used to calculatemarket return (“Market Price”) is determined by using the midpoint between the highest bid and the lowest ask on the primary stock exchange on which shares of a fundare listed for trading, as of the time that such fund’s NAV is calculated. Since shares of a fund may not trade in the secondary market until after the fund’s inception, for theperiod from inception to the first day of secondary market trading in shares of the fund, the NAV of the fund is used as a proxy for the Market Price to calculate market returns.Market and NAV returns assume that dividends and capital gain distributions have been reinvested at Market Price and NAV, respectively.
An index is a statistical composite that tracks a specified financial market or sector. Unlike a fund, an index does not actually hold a portfolio of securities and therefore doesnot incur the expenses incurred by a fund. These expenses negatively impact fund performance. Also, market returns do not include brokerage commissions that may bepayable on secondary market transactions. If brokerage commissions were included, market returns would be lower.
Shareholder Expenses
As a shareholder of your Fund, you incur two types of costs: (1) transaction costs, including brokerage commissions on purchases and sales of fund shares and (2) ongoingcosts, including management fees and other fund expenses. The expense example, which is based on an investment of $1,000 invested at the beginning of the period (orfrom the commencement of operations if less than 6 months) and held through the end of the period, is intended to help you understand your ongoing costs (in dollars andcents) of investing in your Fund and to compare these costs with the ongoing costs of investing in other funds.
Actual Expenses – The table provides information about actual account values and actual expenses. Annualized expense ratios reflect contractual and voluntary feewaivers, if any. To estimate the expenses that you paid on your account over the period, simply divide your account value by $1,000 (for example, an $8,600 account valuedivided by $1,000 = 8.6), then multiply the result by the number under the heading entitled “Expenses Paid During the Period.”
Hypothetical Example for Comparison Purposes – The table also provides information about hypothetical account values and hypothetical expenses based on yourFund’s actual expense ratio and an assumed rate of return of 5% per year before expenses. You may use this information to compare the ongoing costs of investing in yourFund and other funds. To do so, compare this 5% hypothetical example with the 5% hypothetical examples that appear in the shareholder reports of the other funds.
Please note that the expenses shown in the table are meant to highlight your ongoing costs only and do not reflect any transactional costs, such as brokerage commissionspaid on purchases and sales of fund shares. Therefore, the hypothetical examples are useful in comparing ongoing costs only and will not help you determine the relativetotal costs of owning different funds. In addition, if these transactional costs were included, your costs would have been higher.
About Fund Performance
22 2 0 1 8 I S H A R E S A N N U A L R E P O R T T O S H A R E H O L D E R S
Security Shares Value
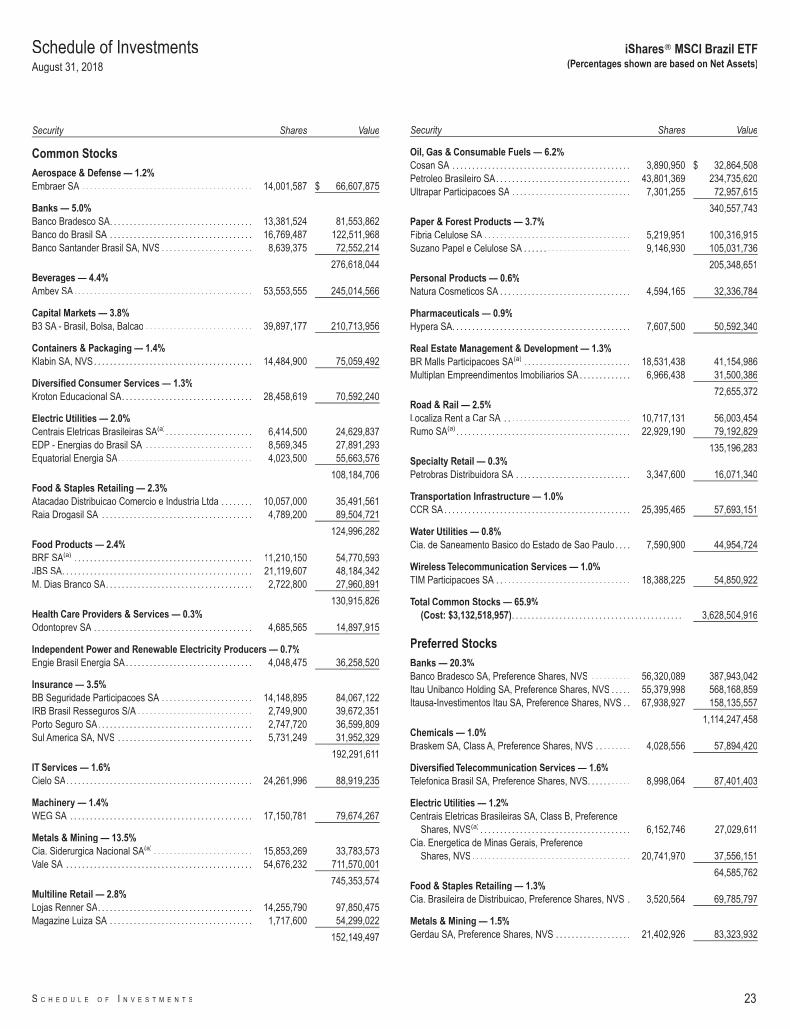
Common StocksAerospace & Defense — 1.2%Embraer SA . . . . . . . . . . . . . . . . . . . . . . . . . . . . . . . . . . . . . . . . . . . 14,001,587 $ 66,607,875
Banks — 5.0%Banco Bradesco SA. . . . . . . . . . . . . . . . . . . . . . . . . . . . . . . . . . . . 13,381,524 81,553,862Banco do Brasil SA . . . . . . . . . . . . . . . . . . . . . . . . . . . . . . . . . . . . 16,769,487 122,511,968Banco Santander Brasil SA, NVS . . . . . . . . . . . . . . . . . . . . . . . 8,639,375 72,552,214
276,618,044Beverages — 4.4%Ambev SA. . . . . . . . . . . . . . . . . . . . . . . . . . . . . . . . . . . . . . . . . . . . . 53,553,555 245,014,566
Capital Markets — 3.8%B3 SA - Brasil, Bolsa, Balcao . . . . . . . . . . . . . . . . . . . . . . . . . . . 39,897,177 210,713,956
Containers & Packaging — 1.4%Klabin SA, NVS. . . . . . . . . . . . . . . . . . . . . . . . . . . . . . . . . . . . . . . . 14,484,900 75,059,492
Diversified Consumer Services — 1.3%Kroton Educacional SA. . . . . . . . . . . . . . . . . . . . . . . . . . . . . . . . . 28,458,619 70,592,240
Electric Utilities — 2.0%Centrais Eletricas Brasileiras SA(a). . . . . . . . . . . . . . . . . . . . . . 6,414,500 24,629,837EDP - Energias do Brasil SA . . . . . . . . . . . . . . . . . . . . . . . . . . . 8,569,345 27,891,293Equatorial Energia SA. . . . . . . . . . . . . . . . . . . . . . . . . . . . . . . . . . 4,023,500 55,663,576
108,184,706Food & Staples Retailing — 2.3%Atacadao Distribuicao Comercio e Industria Ltda . . . . . . . . 10,057,000 35,491,561Raia Drogasil SA . . . . . . . . . . . . . . . . . . . . . . . . . . . . . . . . . . . . . . 4,789,200 89,504,721
124,996,282Food Products — 2.4%BRF SA(a) . . . . . . . . . . . . . . . . . . . . . . . . . . . . . . . . . . . . . . . . . . . . . 11,210,150 54,770,593JBS SA. . . . . . . . . . . . . . . . . . . . . . . . . . . . . . . . . . . . . . . . . . . . . . . . 21,119,607 48,184,342M. Dias Branco SA. . . . . . . . . . . . . . . . . . . . . . . . . . . . . . . . . . . . . 2,722,800 27,960,891
130,915,826Health Care Providers & Services — 0.3%Odontoprev SA . . . . . . . . . . . . . . . . . . . . . . . . . . . . . . . . . . . . . . . . 4,685,565 14,897,915
Independent Power and Renewable Electricity Producers — 0.7%Engie Brasil Energia SA. . . . . . . . . . . . . . . . . . . . . . . . . . . . . . . . 4,048,475 36,258,520
Insurance — 3.5%BB Seguridade Participacoes SA . . . . . . . . . . . . . . . . . . . . . . . 14,148,895 84,067,122IRB Brasil Resseguros S/A . . . . . . . . . . . . . . . . . . . . . . . . . . . . . 2,749,900 39,672,351Porto Seguro SA. . . . . . . . . . . . . . . . . . . . . . . . . . . . . . . . . . . . . . . 2,747,720 36,599,809Sul America SA, NVS . . . . . . . . . . . . . . . . . . . . . . . . . . . . . . . . . . 5,731,249 31,952,329
192,291,611IT Services — 1.6%Cielo SA. . . . . . . . . . . . . . . . . . . . . . . . . . . . . . . . . . . . . . . . . . . . . . . 24,261,996 88,919,235
Machinery — 1.4%WEG SA . . . . . . . . . . . . . . . . . . . . . . . . . . . . . . . . . . . . . . . . . . . . . . 17,150,781 79,674,267
Metals & Mining — 13.5%Cia. Siderurgica Nacional SA(a) . . . . . . . . . . . . . . . . . . . . . . . . . 15,853,269 33,783,573Vale SA . . . . . . . . . . . . . . . . . . . . . . . . . . . . . . . . . . . . . . . . . . . . . . . 54,676,232 711,570,001
745,353,574Multiline Retail — 2.8%Lojas Renner SA. . . . . . . . . . . . . . . . . . . . . . . . . . . . . . . . . . . . . . . 14,255,790 97,850,475Magazine Luiza SA . . . . . . . . . . . . . . . . . . . . . . . . . . . . . . . . . . . . 1,717,600 54,299,022
152,149,497
Security Shares Value
Oil, Gas & Consumable Fuels — 6.2%Cosan SA . . . . . . . . . . . . . . . . . . . . . . . . . . . . . . . . . . . . . . . . . . . . . 3,890,950 $ 32,864,508Petroleo Brasileiro SA. . . . . . . . . . . . . . . . . . . . . . . . . . . . . . . . . . 43,801,369 234,735,620Ultrapar Participacoes SA . . . . . . . . . . . . . . . . . . . . . . . . . . . . . . 7,301,255 72,957,615
340,557,743Paper & Forest Products — 3.7%Fibria Celulose SA . . . . . . . . . . . . . . . . . . . . . . . . . . . . . . . . . . . . . 5,219,951 100,316,915Suzano Papel e Celulose SA . . . . . . . . . . . . . . . . . . . . . . . . . . . 9,146,930 105,031,736
205,348,651Personal Products — 0.6%Natura Cosmeticos SA . . . . . . . . . . . . . . . . . . . . . . . . . . . . . . . . . 4,594,165 32,336,784
Pharmaceuticals — 0.9%Hypera SA. . . . . . . . . . . . . . . . . . . . . . . . . . . . . . . . . . . . . . . . . . . . . 7,607,500 50,592,340
Real Estate Management & Development — 1.3%BR Malls Participacoes SA(a) . . . . . . . . . . . . . . . . . . . . . . . . . . . 18,531,438 41,154,986Multiplan Empreendimentos Imobiliarios SA . . . . . . . . . . . . . 6,966,438 31,500,386
72,655,372Road & Rail — 2.5%Localiza Rent a Car SA . . . . . . . . . . . . . . . . . . . . . . . . . . . . . . . . 10,717,131 56,003,454Rumo SA(a) . . . . . . . . . . . . . . . . . . . . . . . . . . . . . . . . . . . . . . . . . . . . 22,929,190 79,192,829
135,196,283Specialty Retail — 0.3%Petrobras Distribuidora SA . . . . . . . . . . . . . . . . . . . . . . . . . . . . . 3,347,600 16,071,340
Transportation Infrastructure — 1.0%CCR SA . . . . . . . . . . . . . . . . . . . . . . . . . . . . . . . . . . . . . . . . . . . . . . . 25,395,465 57,693,151
Water Utilities — 0.8%Cia. de Saneamento Basico do Estado de Sao Paulo . . . . 7,590,900 44,954,724
Wireless Telecommunication Services — 1.0%TIM Participacoes SA . . . . . . . . . . . . . . . . . . . . . . . . . . . . . . . . . . 18,388,225 54,850,922
Total Common Stocks — 65.9%(Cost: $3,132,518,957). . . . . . . . . . . . . . . . . . . . . . . . . . . . . . . . . . . . . . . . . . . 3,628,504,916
Preferred StocksBanks — 20.3%Banco Bradesco SA, Preference Shares, NVS . . . . . . . . . . 56,320,089 387,943,042Itau Unibanco Holding SA, Preference Shares, NVS . . . . . 55,379,998 568,168,859Itausa-Investimentos Itau SA, Preference Shares, NVS . . 67,938,927 158,135,557
1,114,247,458Chemicals — 1.0%Braskem SA, Class A, Preference Shares, NVS . . . . . . . . . 4,028,556 57,894,420
Diversified Telecommunication Services — 1.6%Telefonica Brasil SA, Preference Shares, NVS. . . . . . . . . . . 8,998,064 87,401,403
Electric Utilities — 1.2%Centrais Eletricas Brasileiras SA, Class B, Preference
Shares, NVS(a) . . . . . . . . . . . . . . . . . . . . . . . . . . . . . . . . . . . . . . 6,152,746 27,029,611Cia. Energetica de Minas Gerais, Preference
Shares, NVS. . . . . . . . . . . . . . . . . . . . . . . . . . . . . . . . . . . . . . . . 20,741,970 37,556,151
64,585,762Food & Staples Retailing — 1.3%Cia. Brasileira de Distribuicao, Preference Shares, NVS . 3,520,564 69,785,797
Metals & Mining — 1.5%Gerdau SA, Preference Shares, NVS . . . . . . . . . . . . . . . . . . . 21,402,926 83,323,932
Schedule of InvestmentsAugust 31, 2018
iShares� MSCI Brazil ETF(Percentages shown are based on Net Assets)
S C H E D U L E O F I N V E S T M E N T S 23
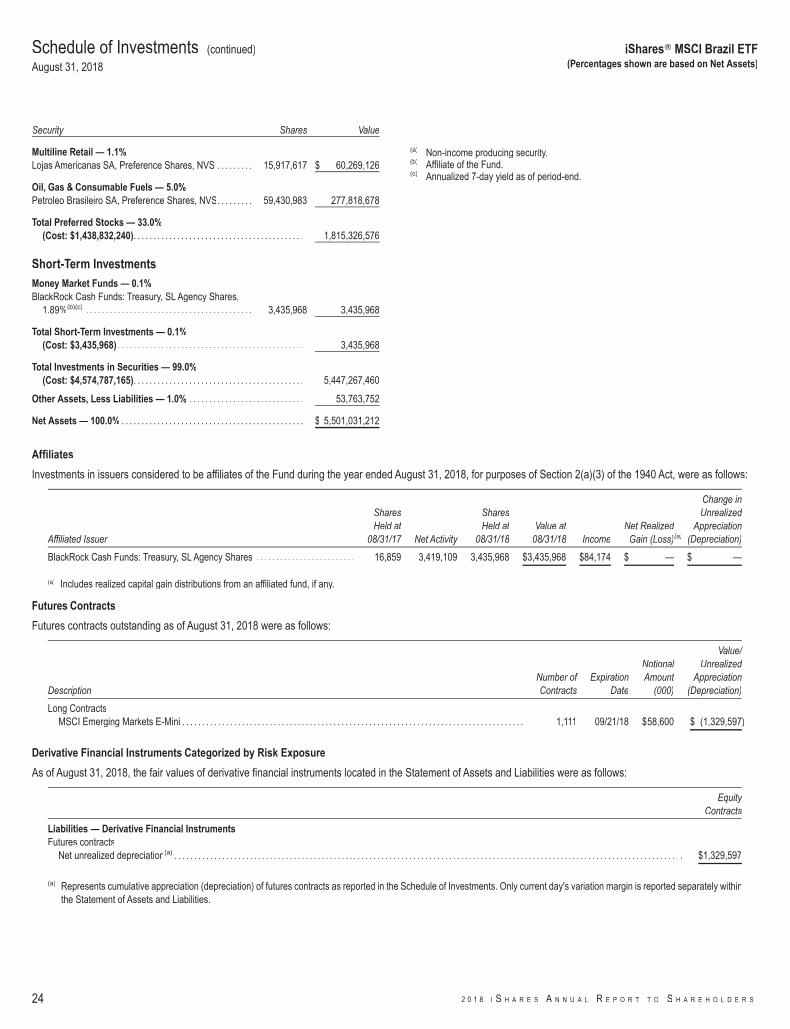
Security Shares Value
Multiline Retail — 1.1%Lojas Americanas SA, Preference Shares, NVS . . . . . . . . . 15,917,617 $ 60,269,126
Oil, Gas & Consumable Fuels — 5.0%Petroleo Brasileiro SA, Preference Shares, NVS. . . . . . . . . 59,430,983 277,818,678
Total Preferred Stocks — 33.0%(Cost: $1,438,832,240). . . . . . . . . . . . . . . . . . . . . . . . . . . . . . . . . . . . . . . . . . . 1,815,326,576
Short-Term InvestmentsMoney Market Funds — 0.1%BlackRock Cash Funds: Treasury, SL Agency Shares,
1.89%(b)(c) . . . . . . . . . . . . . . . . . . . . . . . . . . . . . . . . . . . . . . . . . . 3,435,968 3,435,968
Total Short-Term Investments — 0.1%(Cost: $3,435,968) . . . . . . . . . . . . . . . . . . . . . . . . . . . . . . . . . . . . . . . . . . . . . . . 3,435,968
Total Investments in Securities — 99.0%(Cost: $4,574,787,165). . . . . . . . . . . . . . . . . . . . . . . . . . . . . . . . . . . . . . . . . . . 5,447,267,460
Other Assets, Less Liabilities — 1.0% . . . . . . . . . . . . . . . . . . . . . . . . . . . . . 53,763,752
Net Assets — 100.0% . . . . . . . . . . . . . . . . . . . . . . . . . . . . . . . . . . . . . . . . . . . . . . $ 5,501,031,212
(a) Non-income producing security.(b) Affiliate of the Fund.(c) Annualized 7-day yield as of period-end.
Affiliates
Investments in issuers considered to be affiliates of the Fund during the year ended August 31, 2018, for purposes of Section 2(a)(3) of the 1940 Act, were as follows:
Affiliated Issuer
SharesHeld at
08/31/17 Net Activity
SharesHeld at
08/31/18Value at
08/31/18 IncomeNet RealizedGain (Loss)(a)
Change inUnrealized
Appreciation(Depreciation)
BlackRock Cash Funds: Treasury, SL Agency Shares . . . . . . . . . . . . . . . . . . . . . . . . . 16,859 3,419,109 3,435,968 $3,435,968 $84,174 $ — $ —
(a) Includes realized capital gain distributions from an affiliated fund, if any.
Futures Contracts
Futures contracts outstanding as of August 31, 2018 were as follows:
DescriptionNumber ofContracts
ExpirationDate
NotionalAmount
(000)
Value/Unrealized
Appreciation(Depreciation)
Long ContractsMSCI Emerging Markets E-Mini . . . . . . . . . . . . . . . . . . . . . . . . . . . . . . . . . . . . . . . . . . . . . . . . . . . . . . . . . . . . . . . . . . . . . . . . . . . . . . . . . . . . . . 1,111 09/21/18 $58,600 $ (1,329,597)
Derivative Financial Instruments Categorized by Risk Exposure
As of August 31, 2018, the fair values of derivative financial instruments located in the Statement of Assets and Liabilities were as follows:
EquityContracts
Liabilities — Derivative Financial InstrumentsFutures contracts
Net unrealized depreciation(a) . . . . . . . . . . . . . . . . . . . . . . . . . . . . . . . . . . . . . . . . . . . . . . . . . . . . . . . . . . . . . . . . . . . . . . . . . . . . . . . . . . . . . . . . . . . . . . . . . . . . . . . . . . . . . . . . . . . . . . . . . . . . . . . . $1,329,597
(a) Represents cumulative appreciation (depreciation) of futures contracts as reported in the Schedule of Investments. Only current day's variation margin is reported separately withinthe Statement of Assets and Liabilities.
Schedule of Investments (continued)
August 31, 2018
iShares� MSCI Brazil ETF(Percentages shown are based on Net Assets)
24 2 0 1 8 I S H A R E S A N N U A L R E P O R T T O S H A R E H O L D E R S
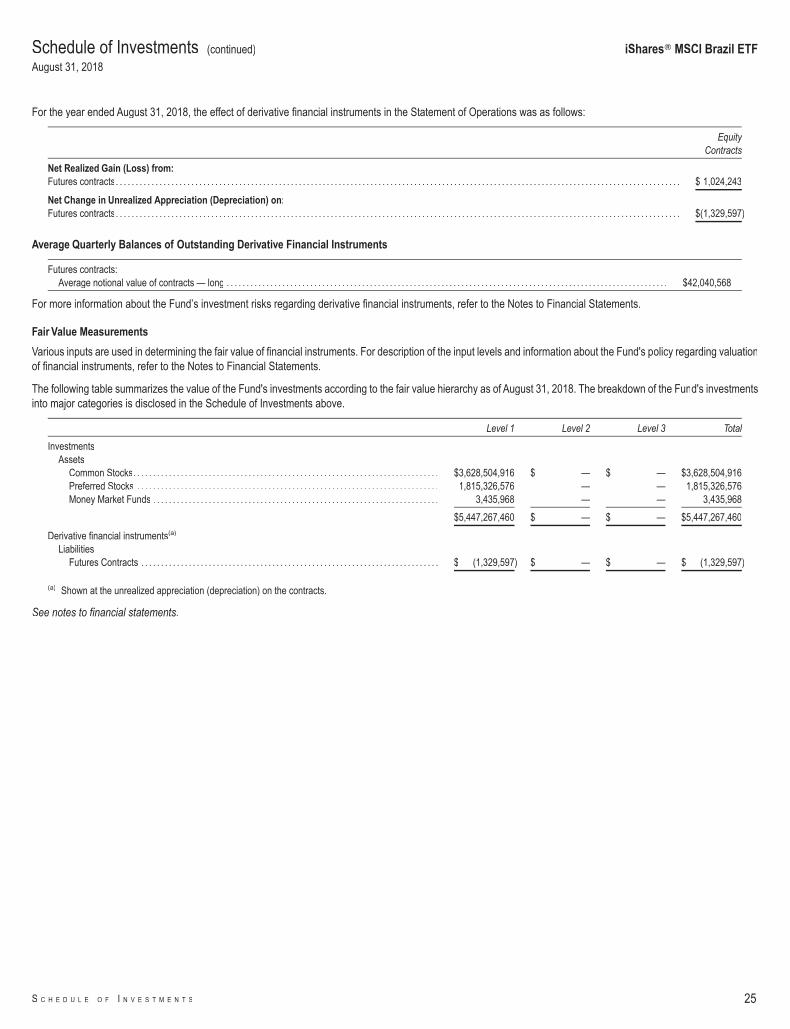
For the year ended August 31, 2018, the effect of derivative financial instruments in the Statement of Operations was as follows:
EquityContracts
Net Realized Gain (Loss) from:Futures contracts. . . . . . . . . . . . . . . . . . . . . . . . . . . . . . . . . . . . . . . . . . . . . . . . . . . . . . . . . . . . . . . . . . . . . . . . . . . . . . . . . . . . . . . . . . . . . . . . . . . . . . . . . . . . . . . . . . . . . . . . . . . . . . . . . . . . . . . . . . . . . . $ 1,024,243
Net Change in Unrealized Appreciation (Depreciation) on:Futures contracts. . . . . . . . . . . . . . . . . . . . . . . . . . . . . . . . . . . . . . . . . . . . . . . . . . . . . . . . . . . . . . . . . . . . . . . . . . . . . . . . . . . . . . . . . . . . . . . . . . . . . . . . . . . . . . . . . . . . . . . . . . . . . . . . . . . . . . . . . . . . . . $(1,329,597)
Average Quarterly Balances of Outstanding Derivative Financial Instruments
Futures contracts:Average notional value of contracts — long . . . . . . . . . . . . . . . . . . . . . . . . . . . . . . . . . . . . . . . . . . . . . . . . . . . . . . . . . . . . . . . . . . . . . . . . . . . . . . . . . . . . . . . . . . . . . . . . . . . . . . . . . . . . . . . $42,040,568
For more information about the Fund’s investment risks regarding derivative financial instruments, refer to the Notes to Financial Statements.
Fair Value Measurements
Various inputs are used in determining the fair value of financial instruments. For description of the input levels and information about the Fund's policy regarding valuationof financial instruments, refer to the Notes to Financial Statements.
The following table summarizes the value of the Fund's investments according to the fair value hierarchy as of August 31, 2018. The breakdown of the Fund's investmentsinto major categories is disclosed in the Schedule of Investments above.
Level 1 Level 2 Level 3 Total
InvestmentsAssets
Common Stocks. . . . . . . . . . . . . . . . . . . . . . . . . . . . . . . . . . . . . . . . . . . . . . . . . . . . . . . . . . . . . . . . . . . . . . . . . . . . . $3,628,504,916 $ — $ — $3,628,504,916Preferred Stocks . . . . . . . . . . . . . . . . . . . . . . . . . . . . . . . . . . . . . . . . . . . . . . . . . . . . . . . . . . . . . . . . . . . . . . . . . . . . 1,815,326,576 — — 1,815,326,576Money Market Funds . . . . . . . . . . . . . . . . . . . . . . . . . . . . . . . . . . . . . . . . . . . . . . . . . . . . . . . . . . . . . . . . . . . . . . . . 3,435,968 — — 3,435,968
$5,447,267,460 $ — $ — $5,447,267,460
Derivative financial instruments(a)
LiabilitiesFutures Contracts . . . . . . . . . . . . . . . . . . . . . . . . . . . . . . . . . . . . . . . . . . . . . . . . . . . . . . . . . . . . . . . . . . . . . . . . . . . $ (1,329,597) $ — $ — $ (1,329,597)
(a) Shown at the unrealized appreciation (depreciation) on the contracts.
See notes to financial statements.
Schedule of Investments (continued)
August 31, 2018
iShares� MSCI Brazil ETF
S C H E D U L E O F I N V E S T M E N T S 25
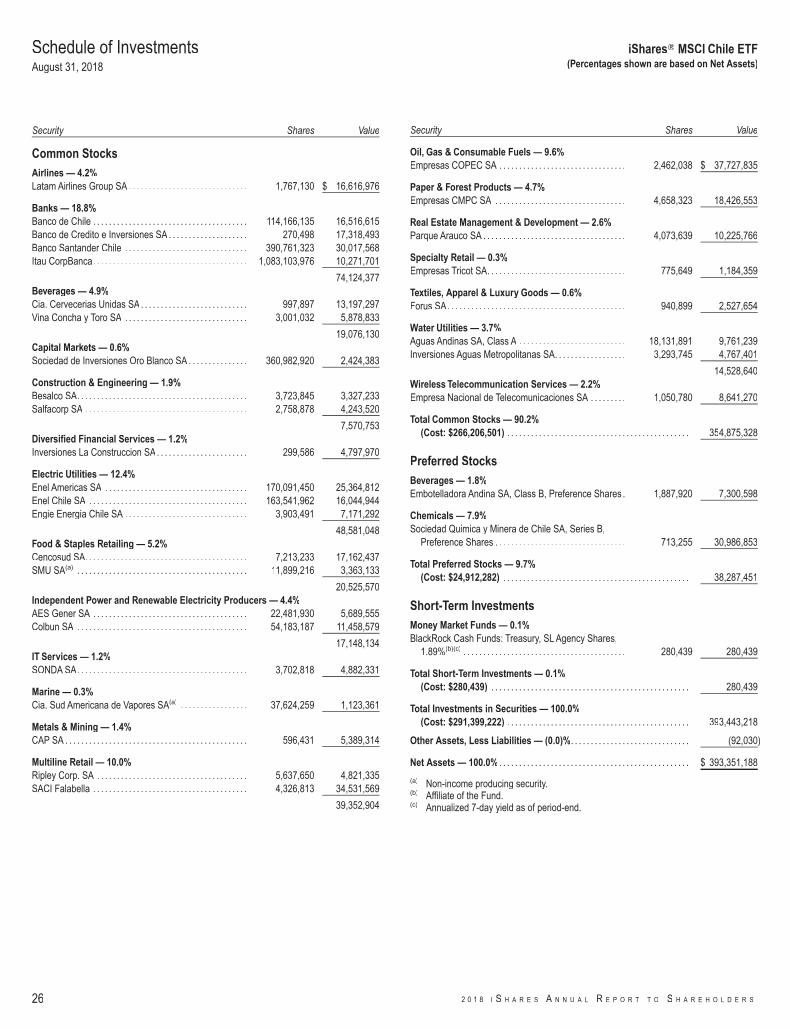
Security Shares Value
Common StocksAirlines — 4.2%Latam Airlines Group SA . . . . . . . . . . . . . . . . . . . . . . . . . . . . . . 1,767,130 $ 16,616,976
Banks — 18.8%Banco de Chile . . . . . . . . . . . . . . . . . . . . . . . . . . . . . . . . . . . . . . . 114,166,135 16,516,615Banco de Credito e Inversiones SA . . . . . . . . . . . . . . . . . . . . 270,498 17,318,493Banco Santander Chile . . . . . . . . . . . . . . . . . . . . . . . . . . . . . . . 390,761,323 30,017,568Itau CorpBanca. . . . . . . . . . . . . . . . . . . . . . . . . . . . . . . . . . . . . . . 1,083,103,976 10,271,701
74,124,377Beverages — 4.9%Cia. Cervecerias Unidas SA . . . . . . . . . . . . . . . . . . . . . . . . . . . 997,897 13,197,297Vina Concha y Toro SA . . . . . . . . . . . . . . . . . . . . . . . . . . . . . . . 3,001,032 5,878,833
19,076,130Capital Markets — 0.6%Sociedad de Inversiones Oro Blanco SA . . . . . . . . . . . . . . . 360,982,920 2,424,383
Construction & Engineering — 1.9%Besalco SA. . . . . . . . . . . . . . . . . . . . . . . . . . . . . . . . . . . . . . . . . . . 3,723,845 3,327,233Salfacorp SA . . . . . . . . . . . . . . . . . . . . . . . . . . . . . . . . . . . . . . . . . 2,758,878 4,243,520
7,570,753Diversified Financial Services — 1.2%Inversiones La Construccion SA. . . . . . . . . . . . . . . . . . . . . . . 299,586 4,797,970
Electric Utilities — 12.4%Enel Americas SA . . . . . . . . . . . . . . . . . . . . . . . . . . . . . . . . . . . . 170,091,450 25,364,812Enel Chile SA . . . . . . . . . . . . . . . . . . . . . . . . . . . . . . . . . . . . . . . . 163,541,962 16,044,944Engie Energia Chile SA . . . . . . . . . . . . . . . . . . . . . . . . . . . . . . . 3,903,491 7,171,292
48,581,048Food & Staples Retailing — 5.2%Cencosud SA. . . . . . . . . . . . . . . . . . . . . . . . . . . . . . . . . . . . . . . . . 7,213,233 17,162,437SMU SA(a) . . . . . . . . . . . . . . . . . . . . . . . . . . . . . . . . . . . . . . . . . . . 11,899,216 3,363,133
20,525,570Independent Power and Renewable Electricity Producers — 4.4%AES Gener SA . . . . . . . . . . . . . . . . . . . . . . . . . . . . . . . . . . . . . . . 22,481,930 5,689,555Colbun SA . . . . . . . . . . . . . . . . . . . . . . . . . . . . . . . . . . . . . . . . . . . 54,183,187 11,458,579
17,148,134IT Services — 1.2%SONDA SA. . . . . . . . . . . . . . . . . . . . . . . . . . . . . . . . . . . . . . . . . . . 3,702,818 4,882,331
Marine — 0.3%Cia. Sud Americana de Vapores SA(a) . . . . . . . . . . . . . . . . . 37,624,259 1,123,361
Metals & Mining — 1.4%CAP SA . . . . . . . . . . . . . . . . . . . . . . . . . . . . . . . . . . . . . . . . . . . . . . 596,431 5,389,314
Multiline Retail — 10.0%Ripley Corp. SA . . . . . . . . . . . . . . . . . . . . . . . . . . . . . . . . . . . . . . 5,637,650 4,821,335SACI Falabella . . . . . . . . . . . . . . . . . . . . . . . . . . . . . . . . . . . . . . . 4,326,813 34,531,569
39,352,904
Security Shares Value
Oil, Gas & Consumable Fuels — 9.6%Empresas COPEC SA . . . . . . . . . . . . . . . . . . . . . . . . . . . . . . . . 2,462,038 $ 37,727,835
Paper & Forest Products — 4.7%Empresas CMPC SA . . . . . . . . . . . . . . . . . . . . . . . . . . . . . . . . . 4,658,323 18,426,553
Real Estate Management & Development — 2.6%Parque Arauco SA . . . . . . . . . . . . . . . . . . . . . . . . . . . . . . . . . . . . 4,073,639 10,225,766
Specialty Retail — 0.3%Empresas Tricot SA. . . . . . . . . . . . . . . . . . . . . . . . . . . . . . . . . . . 775,649 1,184,359
Textiles, Apparel & Luxury Goods — 0.6%Forus SA. . . . . . . . . . . . . . . . . . . . . . . . . . . . . . . . . . . . . . . . . . . . . 940,899 2,527,654
Water Utilities — 3.7%Aguas Andinas SA, Class A . . . . . . . . . . . . . . . . . . . . . . . . . . . 18,131,891 9,761,239Inversiones Aguas Metropolitanas SA. . . . . . . . . . . . . . . . . . 3,293,745 4,767,401
14,528,640Wireless Telecommunication Services — 2.2%Empresa Nacional de Telecomunicaciones SA . . . . . . . . . 1,050,780 8,641,270
Total Common Stocks — 90.2%(Cost: $266,206,501) . . . . . . . . . . . . . . . . . . . . . . . . . . . . . . . . . . . . . . . . . . . . . . 354,875,328
Preferred StocksBeverages — 1.8%Embotelladora Andina SA, Class B, Preference Shares . 1,887,920 7,300,598
Chemicals — 7.9%Sociedad Quimica y Minera de Chile SA, Series B,
Preference Shares . . . . . . . . . . . . . . . . . . . . . . . . . . . . . . . . . 713,255 30,986,853
Total Preferred Stocks — 9.7%(Cost: $24,912,282) . . . . . . . . . . . . . . . . . . . . . . . . . . . . . . . . . . . . . . . . . . . . . . . 38,287,451
Short-Term InvestmentsMoney Market Funds — 0.1%BlackRock Cash Funds: Treasury, SL Agency Shares,
1.89%(b)(c) . . . . . . . . . . . . . . . . . . . . . . . . . . . . . . . . . . . . . . . . . 280,439 280,439
Total Short-Term Investments — 0.1%(Cost: $280,439) . . . . . . . . . . . . . . . . . . . . . . . . . . . . . . . . . . . . . . . . . . . . . . . . . . 280,439
Total Investments in Securities — 100.0%(Cost: $291,399,222) . . . . . . . . . . . . . . . . . . . . . . . . . . . . . . . . . . . . . . . . . . . . . . 393,443,218
Other Assets, Less Liabilities — (0.0)%. . . . . . . . . . . . . . . . . . . . . . . . . . . . . . (92,030)
Net Assets — 100.0% . . . . . . . . . . . . . . . . . . . . . . . . . . . . . . . . . . . . . . . . . . . . . . . . $ 393,351,188
(a) Non-income producing security.(b) Affiliate of the Fund.(c) Annualized 7-day yield as of period-end.
Schedule of InvestmentsAugust 31, 2018
iShares� MSCI Chile ETF(Percentages shown are based on Net Assets)
26 2 0 1 8 I S H A R E S A N N U A L R E P O R T T O S H A R E H O L D E R S
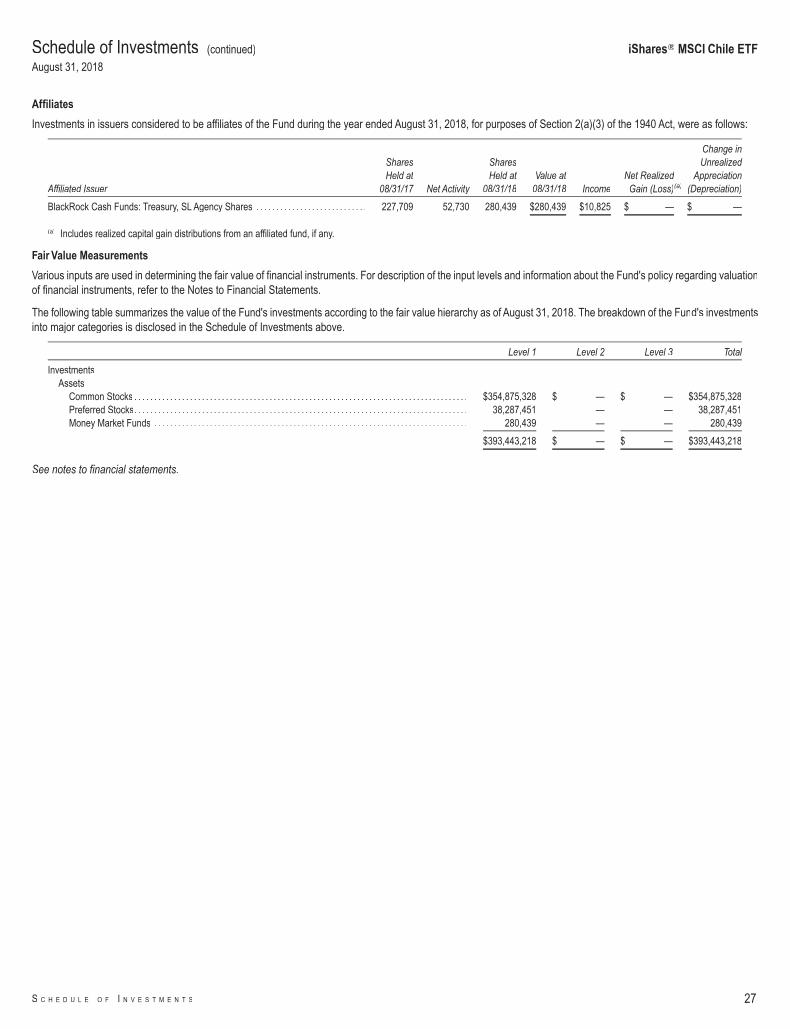
Affiliates
Investments in issuers considered to be affiliates of the Fund during the year ended August 31, 2018, for purposes of Section 2(a)(3) of the 1940 Act, were as follows:
Affiliated Issuer
SharesHeld at
08/31/17 Net Activity
SharesHeld at
08/31/18Value at
08/31/18 IncomeNet RealizedGain (Loss)(a)
Change inUnrealized
Appreciation(Depreciation)
BlackRock Cash Funds: Treasury, SL Agency Shares . . . . . . . . . . . . . . . . . . . . . . . . . . . . 227,709 52,730 280,439 $280,439 $10,825 $ — $ —
(a) Includes realized capital gain distributions from an affiliated fund, if any.
Fair Value Measurements
Various inputs are used in determining the fair value of financial instruments. For description of the input levels and information about the Fund's policy regarding valuationof financial instruments, refer to the Notes to Financial Statements.
The following table summarizes the value of the Fund's investments according to the fair value hierarchy as of August 31, 2018. The breakdown of the Fund's investmentsinto major categories is disclosed in the Schedule of Investments above.
Level 1 Level 2 Level 3 Total
InvestmentsAssets
Common Stocks . . . . . . . . . . . . . . . . . . . . . . . . . . . . . . . . . . . . . . . . . . . . . . . . . . . . . . . . . . . . . . . . . . . . . . . . . . . . . . . . . . . . $354,875,328 $ — $ — $354,875,328Preferred Stocks. . . . . . . . . . . . . . . . . . . . . . . . . . . . . . . . . . . . . . . . . . . . . . . . . . . . . . . . . . . . . . . . . . . . . . . . . . . . . . . . . . . . 38,287,451 — — 38,287,451Money Market Funds . . . . . . . . . . . . . . . . . . . . . . . . . . . . . . . . . . . . . . . . . . . . . . . . . . . . . . . . . . . . . . . . . . . . . . . . . . . . . . . 280,439 — — 280,439
$393,443,218 $ — $ — $393,443,218
See notes to financial statements.
Schedule of Investments (continued)
August 31, 2018
iShares� MSCI Chile ETF
S C H E D U L E O F I N V E S T M E N T S 27
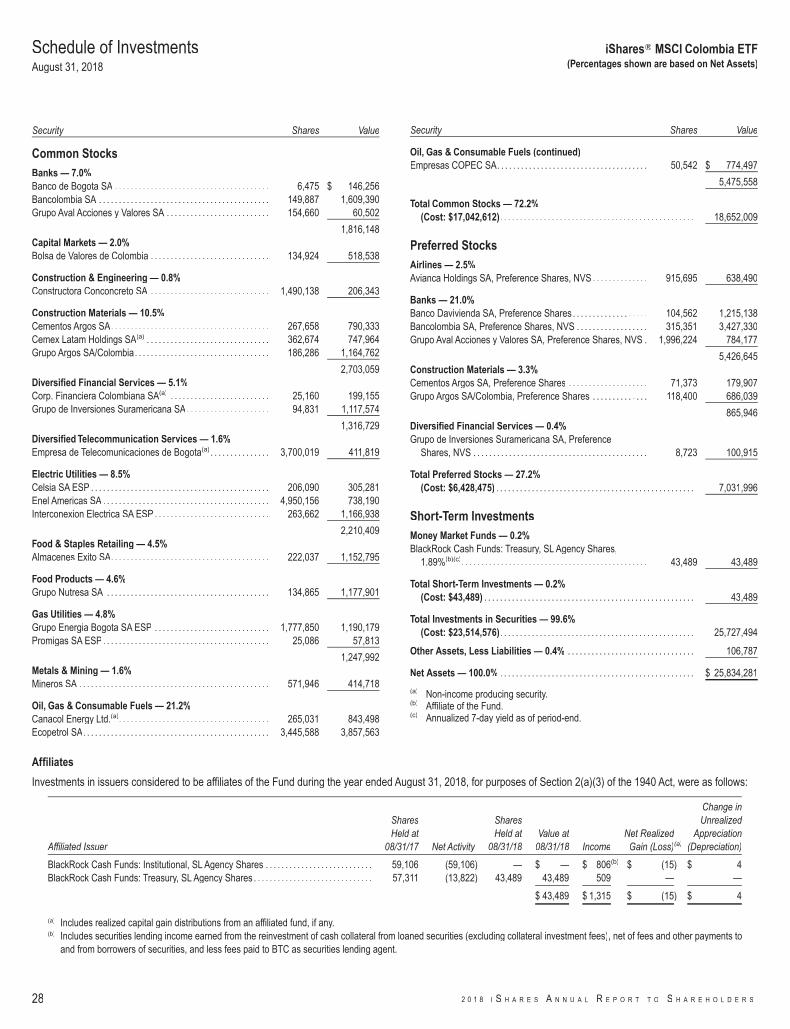
Security Shares Value
Common StocksBanks — 7.0%Banco de Bogota SA . . . . . . . . . . . . . . . . . . . . . . . . . . . . . . . . . . . . . . . 6,475 $ 146,256Bancolombia SA . . . . . . . . . . . . . . . . . . . . . . . . . . . . . . . . . . . . . . . . . . . 149,887 1,609,390Grupo Aval Acciones y Valores SA . . . . . . . . . . . . . . . . . . . . . . . . . . 154,660 60,502
1,816,148Capital Markets — 2.0%Bolsa de Valores de Colombia . . . . . . . . . . . . . . . . . . . . . . . . . . . . . . 134,924 518,538
Construction & Engineering — 0.8%Constructora Conconcreto SA . . . . . . . . . . . . . . . . . . . . . . . . . . . . . . 1,490,138 206,343
Construction Materials — 10.5%Cementos Argos SA. . . . . . . . . . . . . . . . . . . . . . . . . . . . . . . . . . . . . . . . 267,658 790,333Cemex Latam Holdings SA(a) . . . . . . . . . . . . . . . . . . . . . . . . . . . . . . . 362,674 747,964Grupo Argos SA/Colombia. . . . . . . . . . . . . . . . . . . . . . . . . . . . . . . . . . 186,286 1,164,762
2,703,059Diversified Financial Services — 5.1%Corp. Financiera Colombiana SA(a) . . . . . . . . . . . . . . . . . . . . . . . . . 25,160 199,155Grupo de Inversiones Suramericana SA. . . . . . . . . . . . . . . . . . . . . 94,831 1,117,574
1,316,729Diversified Telecommunication Services — 1.6%Empresa de Telecomunicaciones de Bogota(a) . . . . . . . . . . . . . . . 3,700,019 411,819
Electric Utilities — 8.5%Celsia SA ESP . . . . . . . . . . . . . . . . . . . . . . . . . . . . . . . . . . . . . . . . . . . . . 206,090 305,281Enel Americas SA . . . . . . . . . . . . . . . . . . . . . . . . . . . . . . . . . . . . . . . . . . 4,950,156 738,190Interconexion Electrica SA ESP . . . . . . . . . . . . . . . . . . . . . . . . . . . . . 263,662 1,166,938
2,210,409Food & Staples Retailing — 4.5%Almacenes Exito SA. . . . . . . . . . . . . . . . . . . . . . . . . . . . . . . . . . . . . . . . 222,037 1,152,795
Food Products — 4.6%Grupo Nutresa SA . . . . . . . . . . . . . . . . . . . . . . . . . . . . . . . . . . . . . . . . . 134,865 1,177,901
Gas Utilities — 4.8%Grupo Energia Bogota SA ESP . . . . . . . . . . . . . . . . . . . . . . . . . . . . . 1,777,850 1,190,179Promigas SA ESP. . . . . . . . . . . . . . . . . . . . . . . . . . . . . . . . . . . . . . . . . . 25,086 57,813
1,247,992Metals & Mining — 1.6%Mineros SA . . . . . . . . . . . . . . . . . . . . . . . . . . . . . . . . . . . . . . . . . . . . . . . . 571,946 414,718
Oil, Gas & Consumable Fuels — 21.2%Canacol Energy Ltd.(a). . . . . . . . . . . . . . . . . . . . . . . . . . . . . . . . . . . . . . 265,031 843,498Ecopetrol SA. . . . . . . . . . . . . . . . . . . . . . . . . . . . . . . . . . . . . . . . . . . . . . . 3,445,588 3,857,563
Security Shares Value
Oil, Gas & Consumable Fuels (continued)Empresas COPEC SA. . . . . . . . . . . . . . . . . . . . . . . . . . . . . . . . . . . . . . 50,542 $ 774,497
5,475,558
Total Common Stocks — 72.2%(Cost: $17,042,612). . . . . . . . . . . . . . . . . . . . . . . . . . . . . . . . . . . . . . . . . . . . . . . . . 18,652,009
Preferred StocksAirlines — 2.5%Avianca Holdings SA, Preference Shares, NVS . . . . . . . . . . . . . . 915,695 638,490
Banks — 21.0%Banco Davivienda SA, Preference Shares . . . . . . . . . . . . . . . . . . . 104,562 1,215,138Bancolombia SA, Preference Shares, NVS . . . . . . . . . . . . . . . . . . 315,351 3,427,330Grupo Aval Acciones y Valores SA, Preference Shares, NVS . 1,996,224 784,177
5,426,645Construction Materials — 3.3%Cementos Argos SA, Preference Shares . . . . . . . . . . . . . . . . . . . . 71,373 179,907Grupo Argos SA/Colombia, Preference Shares . . . . . . . . . . . . . . 118,400 686,039
865,946Diversified Financial Services — 0.4%Grupo de Inversiones Suramericana SA, Preference
Shares, NVS . . . . . . . . . . . . . . . . . . . . . . . . . . . . . . . . . . . . . . . . . . . . 8,723 100,915
Total Preferred Stocks — 27.2%(Cost: $6,428,475) . . . . . . . . . . . . . . . . . . . . . . . . . . . . . . . . . . . . . . . . . . . . . . . . . . 7,031,996
Short-Term InvestmentsMoney Market Funds — 0.2%BlackRock Cash Funds: Treasury, SL Agency Shares,
1.89%(b)(c). . . . . . . . . . . . . . . . . . . . . . . . . . . . . . . . . . . . . . . . . . . . . . . 43,489 43,489
Total Short-Term Investments — 0.2%(Cost: $43,489) . . . . . . . . . . . . . . . . . . . . . . . . . . . . . . . . . . . . . . . . . . . . . . . . . . . . . 43,489
Total Investments in Securities — 99.6%(Cost: $23,514,576). . . . . . . . . . . . . . . . . . . . . . . . . . . . . . . . . . . . . . . . . . . . . . . . . 25,727,494
Other Assets, Less Liabilities — 0.4% . . . . . . . . . . . . . . . . . . . . . . . . . . . . . . . . 106,787
Net Assets — 100.0% . . . . . . . . . . . . . . . . . . . . . . . . . . . . . . . . . . . . . . . . . . . . . . . . . $ 25,834,281
(a) Non-income producing security.(b) Affiliate of the Fund.(c) Annualized 7-day yield as of period-end.
Affiliates
Investments in issuers considered to be affiliates of the Fund during the year ended August 31, 2018, for purposes of Section 2(a)(3) of the 1940 Act, were as follows:
Affiliated Issuer
SharesHeld at
08/31/17 Net Activity
SharesHeld at
08/31/18Value at
08/31/18 IncomeNet RealizedGain (Loss)(a)
Change inUnrealized
Appreciation(Depreciation)
BlackRock Cash Funds: Institutional, SL Agency Shares . . . . . . . . . . . . . . . . . . . . . . . . . . . 59,106 (59,106) — $ — $ 806(b) $ (15) $ 4BlackRock Cash Funds: Treasury, SL Agency Shares . . . . . . . . . . . . . . . . . . . . . . . . . . . . . . 57,311 (13,822) 43,489 43,489 509 — —
$ 43,489 $ 1,315 $ (15) $ 4
(a) Includes realized capital gain distributions from an affiliated fund, if any.(b) Includes securities lending income earned from the reinvestment of cash collateral from loaned securities (excluding collateral investment fees), net of fees and other payments to
and from borrowers of securities, and less fees paid to BTC as securities lending agent.
Schedule of InvestmentsAugust 31, 2018
iShares� MSCI Colombia ETF(Percentages shown are based on Net Assets)
28 2 0 1 8 I S H A R E S A N N U A L R E P O R T T O S H A R E H O L D E R S
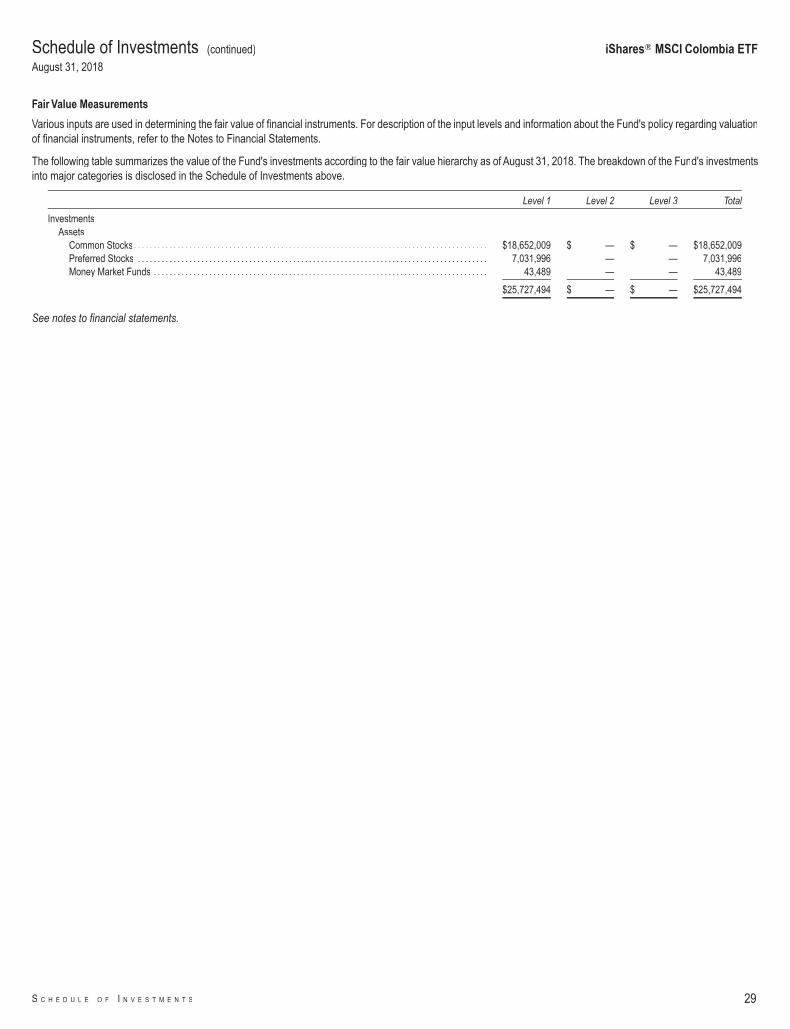
Fair Value Measurements
Various inputs are used in determining the fair value of financial instruments. For description of the input levels and information about the Fund's policy regarding valuationof financial instruments, refer to the Notes to Financial Statements.
The following table summarizes the value of the Fund's investments according to the fair value hierarchy as of August 31, 2018. The breakdown of the Fund's investmentsinto major categories is disclosed in the Schedule of Investments above.
Level 1 Level 2 Level 3 Total
InvestmentsAssets
Common Stocks. . . . . . . . . . . . . . . . . . . . . . . . . . . . . . . . . . . . . . . . . . . . . . . . . . . . . . . . . . . . . . . . . . . . . . . . . . . . . . . . . . . . . . . . . $18,652,009 $ — $ — $18,652,009Preferred Stocks . . . . . . . . . . . . . . . . . . . . . . . . . . . . . . . . . . . . . . . . . . . . . . . . . . . . . . . . . . . . . . . . . . . . . . . . . . . . . . . . . . . . . . . . 7,031,996 — — 7,031,996Money Market Funds . . . . . . . . . . . . . . . . . . . . . . . . . . . . . . . . . . . . . . . . . . . . . . . . . . . . . . . . . . . . . . . . . . . . . . . . . . . . . . . . . . . . 43,489 — — 43,489
$25,727,494 $ — $ — $25,727,494
See notes to financial statements.
Schedule of Investments (continued)
August 31, 2018
iShares� MSCI Colombia ETF
S C H E D U L E O F I N V E S T M E N T S 29
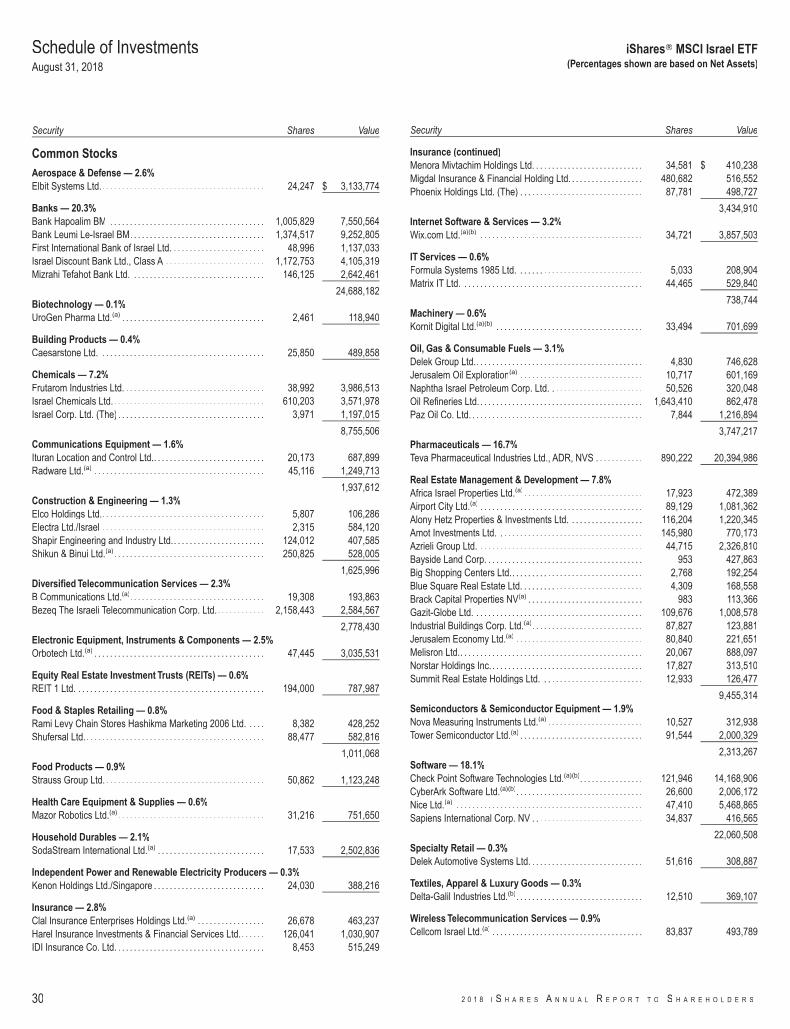
Security Shares Value
Common StocksAerospace & Defense — 2.6%Elbit Systems Ltd.. . . . . . . . . . . . . . . . . . . . . . . . . . . . . . . . . . . . . . . . . 24,247 $ 3,133,774
Banks — 20.3%Bank Hapoalim BM . . . . . . . . . . . . . . . . . . . . . . . . . . . . . . . . . . . . . . . 1,005,829 7,550,564Bank Leumi Le-Israel BM. . . . . . . . . . . . . . . . . . . . . . . . . . . . . . . . . . 1,374,517 9,252,805First International Bank of Israel Ltd. . . . . . . . . . . . . . . . . . . . . . . . 48,996 1,137,033Israel Discount Bank Ltd., Class A . . . . . . . . . . . . . . . . . . . . . . . . . 1,172,753 4,105,319Mizrahi Tefahot Bank Ltd. . . . . . . . . . . . . . . . . . . . . . . . . . . . . . . . . . 146,125 2,642,461
24,688,182Biotechnology — 0.1%UroGen Pharma Ltd.(a) . . . . . . . . . . . . . . . . . . . . . . . . . . . . . . . . . . . . 2,461 118,940
Building Products — 0.4%Caesarstone Ltd. . . . . . . . . . . . . . . . . . . . . . . . . . . . . . . . . . . . . . . . . . 25,850 489,858
Chemicals — 7.2%Frutarom Industries Ltd. . . . . . . . . . . . . . . . . . . . . . . . . . . . . . . . . . . . 38,992 3,986,513Israel Chemicals Ltd. . . . . . . . . . . . . . . . . . . . . . . . . . . . . . . . . . . . . . . 610,203 3,571,978Israel Corp. Ltd. (The) . . . . . . . . . . . . . . . . . . . . . . . . . . . . . . . . . . . . . 3,971 1,197,015
8,755,506Communications Equipment — 1.6%Ituran Location and Control Ltd.. . . . . . . . . . . . . . . . . . . . . . . . . . . . 20,173 687,899Radware Ltd.(a) . . . . . . . . . . . . . . . . . . . . . . . . . . . . . . . . . . . . . . . . . . . 45,116 1,249,713
1,937,612Construction & Engineering — 1.3%Elco Holdings Ltd.. . . . . . . . . . . . . . . . . . . . . . . . . . . . . . . . . . . . . . . . . 5,807 106,286Electra Ltd./Israel . . . . . . . . . . . . . . . . . . . . . . . . . . . . . . . . . . . . . . . . . 2,315 584,120Shapir Engineering and Industry Ltd.. . . . . . . . . . . . . . . . . . . . . . . 124,012 407,585Shikun & Binui Ltd.(a). . . . . . . . . . . . . . . . . . . . . . . . . . . . . . . . . . . . . . 250,825 528,005
1,625,996Diversified Telecommunication Services — 2.3%B Communications Ltd.(a). . . . . . . . . . . . . . . . . . . . . . . . . . . . . . . . . . 19,308 193,863Bezeq The Israeli Telecommunication Corp. Ltd.. . . . . . . . . . . . 2,158,443 2,584,567
2,778,430Electronic Equipment, Instruments & Components — 2.5%Orbotech Ltd.(a) . . . . . . . . . . . . . . . . . . . . . . . . . . . . . . . . . . . . . . . . . . . 47,445 3,035,531
Equity Real Estate Investment Trusts (REITs) — 0.6%REIT 1 Ltd. . . . . . . . . . . . . . . . . . . . . . . . . . . . . . . . . . . . . . . . . . . . . . . . 194,000 787,987
Food & Staples Retailing — 0.8%Rami Levy Chain Stores Hashikma Marketing 2006 Ltd. . . . . 8,382 428,252Shufersal Ltd.. . . . . . . . . . . . . . . . . . . . . . . . . . . . . . . . . . . . . . . . . . . . . 88,477 582,816
1,011,068Food Products — 0.9%Strauss Group Ltd. . . . . . . . . . . . . . . . . . . . . . . . . . . . . . . . . . . . . . . . . 50,862 1,123,248
Health Care Equipment & Supplies — 0.6%Mazor Robotics Ltd.(a). . . . . . . . . . . . . . . . . . . . . . . . . . . . . . . . . . . . . 31,216 751,650
Household Durables — 2.1%SodaStream International Ltd.(a) . . . . . . . . . . . . . . . . . . . . . . . . . . . 17,533 2,502,836
Independent Power and Renewable Electricity Producers — 0.3%Kenon Holdings Ltd./Singapore . . . . . . . . . . . . . . . . . . . . . . . . . . . . 24,030 388,216
Insurance — 2.8%Clal Insurance Enterprises Holdings Ltd.(a) . . . . . . . . . . . . . . . . . 26,678 463,237Harel Insurance Investments & Financial Services Ltd.. . . . . . 126,041 1,030,907IDI Insurance Co. Ltd. . . . . . . . . . . . . . . . . . . . . . . . . . . . . . . . . . . . . . 8,453 515,249
Security Shares Value
Insurance (continued)Menora Mivtachim Holdings Ltd. . . . . . . . . . . . . . . . . . . . . . . . . . . . 34,581 $ 410,238Migdal Insurance & Financial Holding Ltd. . . . . . . . . . . . . . . . . . . 480,682 516,552Phoenix Holdings Ltd. (The) . . . . . . . . . . . . . . . . . . . . . . . . . . . . . . . 87,781 498,727
3,434,910Internet Software & Services — 3.2%Wix.com Ltd.(a)(b) . . . . . . . . . . . . . . . . . . . . . . . . . . . . . . . . . . . . . . . . . 34,721 3,857,503
IT Services — 0.6%Formula Systems 1985 Ltd. . . . . . . . . . . . . . . . . . . . . . . . . . . . . . . . 5,033 208,904Matrix IT Ltd. . . . . . . . . . . . . . . . . . . . . . . . . . . . . . . . . . . . . . . . . . . . . . 44,465 529,840
738,744Machinery — 0.6%Kornit Digital Ltd.(a)(b) . . . . . . . . . . . . . . . . . . . . . . . . . . . . . . . . . . . . . 33,494 701,699
Oil, Gas & Consumable Fuels — 3.1%Delek Group Ltd.. . . . . . . . . . . . . . . . . . . . . . . . . . . . . . . . . . . . . . . . . . 4,830 746,628Jerusalem Oil Exploration(a) . . . . . . . . . . . . . . . . . . . . . . . . . . . . . . . 10,717 601,169Naphtha Israel Petroleum Corp. Ltd. . . . . . . . . . . . . . . . . . . . . . . . 50,526 320,048Oil Refineries Ltd. . . . . . . . . . . . . . . . . . . . . . . . . . . . . . . . . . . . . . . . . . 1,643,410 862,478Paz Oil Co. Ltd. . . . . . . . . . . . . . . . . . . . . . . . . . . . . . . . . . . . . . . . . . . . 7,844 1,216,894
3,747,217Pharmaceuticals — 16.7%Teva Pharmaceutical Industries Ltd., ADR, NVS . . . . . . . . . . . . 890,222 20,394,986
Real Estate Management & Development — 7.8%Africa Israel Properties Ltd.(a) . . . . . . . . . . . . . . . . . . . . . . . . . . . . . . 17,923 472,389Airport City Ltd.(a) . . . . . . . . . . . . . . . . . . . . . . . . . . . . . . . . . . . . . . . . . 89,129 1,081,362Alony Hetz Properties & Investments Ltd. . . . . . . . . . . . . . . . . . . 116,204 1,220,345Amot Investments Ltd. . . . . . . . . . . . . . . . . . . . . . . . . . . . . . . . . . . . . 145,980 770,173Azrieli Group Ltd. . . . . . . . . . . . . . . . . . . . . . . . . . . . . . . . . . . . . . . . . . 44,715 2,326,810Bayside Land Corp. . . . . . . . . . . . . . . . . . . . . . . . . . . . . . . . . . . . . . . . 953 427,863Big Shopping Centers Ltd.. . . . . . . . . . . . . . . . . . . . . . . . . . . . . . . . . 2,768 192,254Blue Square Real Estate Ltd. . . . . . . . . . . . . . . . . . . . . . . . . . . . . . . 4,309 168,558Brack Capital Properties NV(a) . . . . . . . . . . . . . . . . . . . . . . . . . . . . . 983 113,366Gazit-Globe Ltd. . . . . . . . . . . . . . . . . . . . . . . . . . . . . . . . . . . . . . . . . . . 109,676 1,008,578Industrial Buildings Corp. Ltd.(a). . . . . . . . . . . . . . . . . . . . . . . . . . . . 87,827 123,881Jerusalem Economy Ltd.(a) . . . . . . . . . . . . . . . . . . . . . . . . . . . . . . . . 80,840 221,651Melisron Ltd.. . . . . . . . . . . . . . . . . . . . . . . . . . . . . . . . . . . . . . . . . . . . . . 20,067 888,097Norstar Holdings Inc. . . . . . . . . . . . . . . . . . . . . . . . . . . . . . . . . . . . . . . 17,827 313,510Summit Real Estate Holdings Ltd. . . . . . . . . . . . . . . . . . . . . . . . . . 12,933 126,477
9,455,314Semiconductors & Semiconductor Equipment — 1.9%Nova Measuring Instruments Ltd.(a) . . . . . . . . . . . . . . . . . . . . . . . . 10,527 312,938Tower Semiconductor Ltd.(a) . . . . . . . . . . . . . . . . . . . . . . . . . . . . . . . 91,544 2,000,329
2,313,267Software — 18.1%Check Point Software Technologies Ltd.(a)(b). . . . . . . . . . . . . . . . 121,946 14,168,906CyberArk Software Ltd.(a)(b). . . . . . . . . . . . . . . . . . . . . . . . . . . . . . . . 26,600 2,006,172Nice Ltd.(a) . . . . . . . . . . . . . . . . . . . . . . . . . . . . . . . . . . . . . . . . . . . . . . . 47,410 5,468,865Sapiens International Corp. NV . . . . . . . . . . . . . . . . . . . . . . . . . . . . 34,837 416,565
22,060,508Specialty Retail — 0.3%Delek Automotive Systems Ltd. . . . . . . . . . . . . . . . . . . . . . . . . . . . . 51,616 308,887
Textiles, Apparel & Luxury Goods — 0.3%Delta-Galil Industries Ltd.(b). . . . . . . . . . . . . . . . . . . . . . . . . . . . . . . . 12,510 369,107
Wireless Telecommunication Services — 0.9%Cellcom Israel Ltd.(a) . . . . . . . . . . . . . . . . . . . . . . . . . . . . . . . . . . . . . . 83,837 493,789
Schedule of InvestmentsAugust 31, 2018
iShares� MSCI Israel ETF(Percentages shown are based on Net Assets)
30 2 0 1 8 I S H A R E S A N N U A L R E P O R T T O S H A R E H O L D E R S
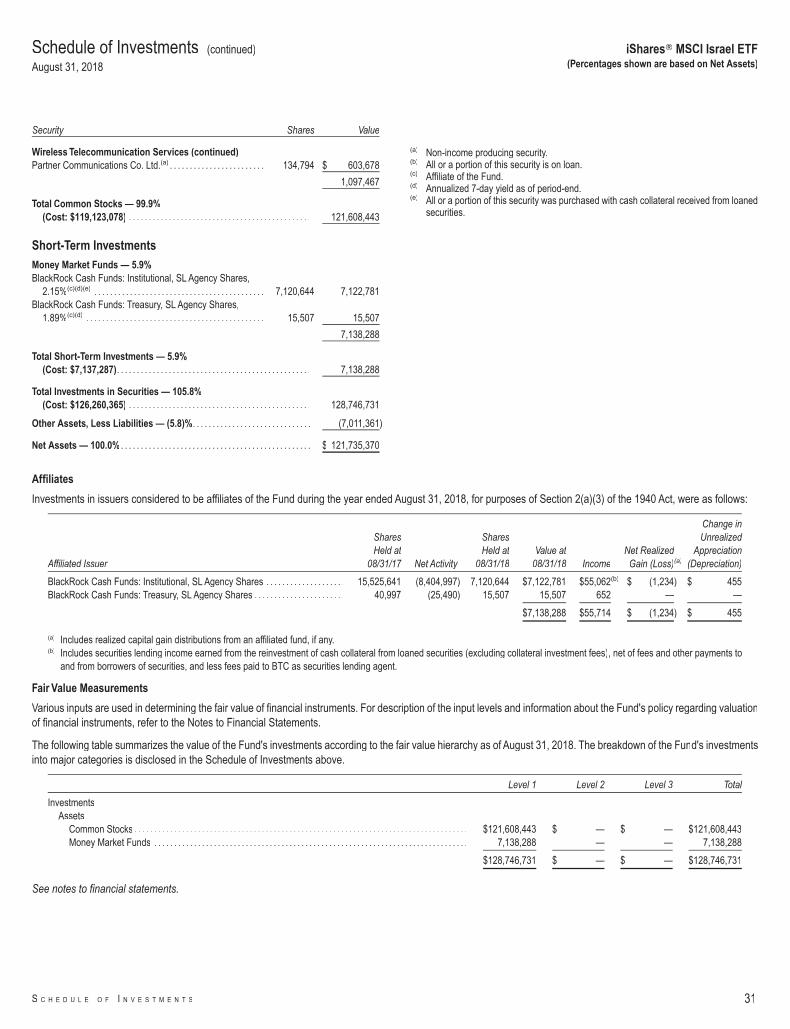
Security Shares Value
Wireless Telecommunication Services (continued)Partner Communications Co. Ltd.(a) . . . . . . . . . . . . . . . . . . . . . . . . 134,794 $ 603,678
1,097,467
Total Common Stocks — 99.9%(Cost: $119,123,078) . . . . . . . . . . . . . . . . . . . . . . . . . . . . . . . . . . . . . . . . . . . . . . 121,608,443
Short-Term InvestmentsMoney Market Funds — 5.9%BlackRock Cash Funds: Institutional, SL Agency Shares,
2.15%(c)(d)(e) . . . . . . . . . . . . . . . . . . . . . . . . . . . . . . . . . . . . . . . . . . . 7,120,644 7,122,781BlackRock Cash Funds: Treasury, SL Agency Shares,
1.89%(c)(d) . . . . . . . . . . . . . . . . . . . . . . . . . . . . . . . . . . . . . . . . . . . . . 15,507 15,507
7,138,288
Total Short-Term Investments — 5.9%(Cost: $7,137,287). . . . . . . . . . . . . . . . . . . . . . . . . . . . . . . . . . . . . . . . . . . . . . . . . 7,138,288
Total Investments in Securities — 105.8%(Cost: $126,260,365) . . . . . . . . . . . . . . . . . . . . . . . . . . . . . . . . . . . . . . . . . . . . . . 128,746,731
Other Assets, Less Liabilities — (5.8)%. . . . . . . . . . . . . . . . . . . . . . . . . . . . . . (7,011,361)
Net Assets — 100.0% . . . . . . . . . . . . . . . . . . . . . . . . . . . . . . . . . . . . . . . . . . . . . . . . $ 121,735,370
(a) Non-income producing security.(b) All or a portion of this security is on loan.(c) Affiliate of the Fund.(d) Annualized 7-day yield as of period-end.(e) All or a portion of this security was purchased with cash collateral received from loaned
securities.
Affiliates
Investments in issuers considered to be affiliates of the Fund during the year ended August 31, 2018, for purposes of Section 2(a)(3) of the 1940 Act, were as follows:
Affiliated Issuer
SharesHeld at
08/31/17 Net Activity
SharesHeld at
08/31/18Value at
08/31/18 IncomeNet RealizedGain (Loss)(a)
Change inUnrealized
Appreciation(Depreciation)
BlackRock Cash Funds: Institutional, SL Agency Shares . . . . . . . . . . . . . . . . . . . . 15,525,641 (8,404,997) 7,120,644 $7,122,781 $55,062(b) $ (1,234) $ 455BlackRock Cash Funds: Treasury, SL Agency Shares . . . . . . . . . . . . . . . . . . . . . . . 40,997 (25,490) 15,507 15,507 652 — —
$7,138,288 $55,714 $ (1,234) $ 455
(a) Includes realized capital gain distributions from an affiliated fund, if any.(b) Includes securities lending income earned from the reinvestment of cash collateral from loaned securities (excluding collateral investment fees), net of fees and other payments to
and from borrowers of securities, and less fees paid to BTC as securities lending agent.
Fair Value Measurements
Various inputs are used in determining the fair value of financial instruments. For description of the input levels and information about the Fund's policy regarding valuationof financial instruments, refer to the Notes to Financial Statements.
The following table summarizes the value of the Fund's investments according to the fair value hierarchy as of August 31, 2018. The breakdown of the Fund's investmentsinto major categories is disclosed in the Schedule of Investments above.
Level 1 Level 2 Level 3 Total
InvestmentsAssets
Common Stocks . . . . . . . . . . . . . . . . . . . . . . . . . . . . . . . . . . . . . . . . . . . . . . . . . . . . . . . . . . . . . . . . . . . . . . . . . . . . . . . . . . . . $121,608,443 $ — $ — $121,608,443Money Market Funds . . . . . . . . . . . . . . . . . . . . . . . . . . . . . . . . . . . . . . . . . . . . . . . . . . . . . . . . . . . . . . . . . . . . . . . . . . . . . . . 7,138,288 — — 7,138,288
$128,746,731 $ — $ — $128,746,731
See notes to financial statements.
Schedule of Investments (continued)
August 31, 2018
iShares� MSCI Israel ETF(Percentages shown are based on Net Assets)
S C H E D U L E O F I N V E S T M E N T S 31
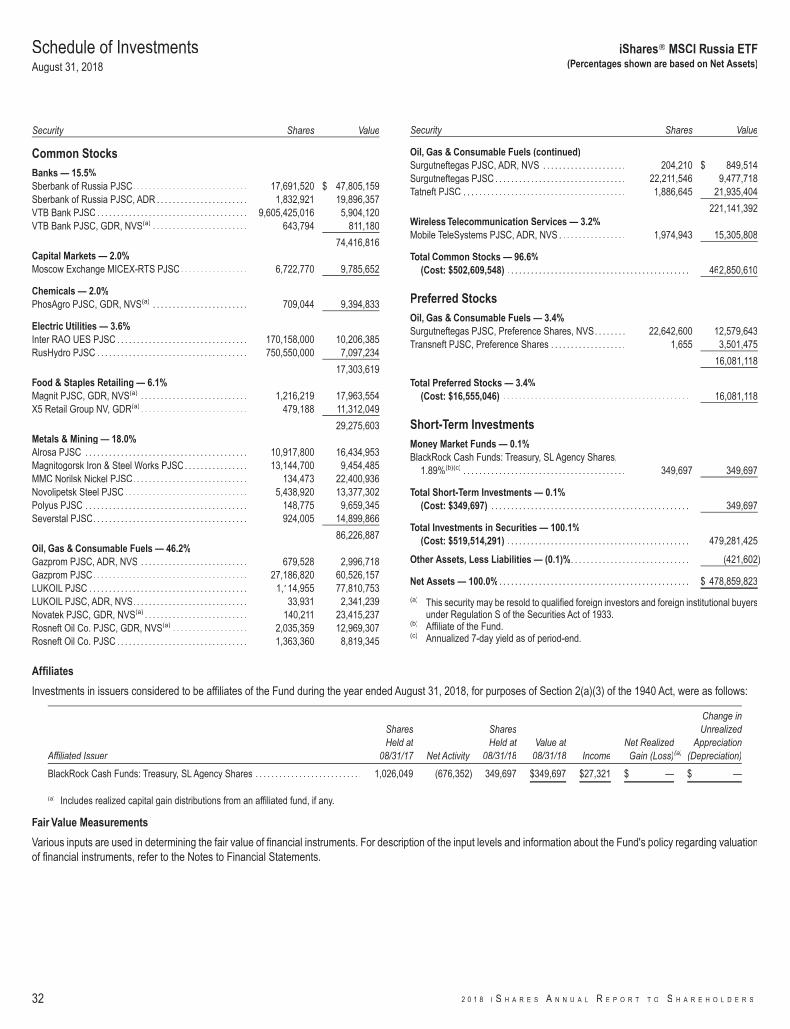
Security Shares Value
Common StocksBanks — 15.5%Sberbank of Russia PJSC. . . . . . . . . . . . . . . . . . . . . . . . . . . . . 17,691,520 $ 47,805,159Sberbank of Russia PJSC, ADR . . . . . . . . . . . . . . . . . . . . . . . 1,832,921 19,896,357VTB Bank PJSC . . . . . . . . . . . . . . . . . . . . . . . . . . . . . . . . . . . . . . 9,605,425,016 5,904,120VTB Bank PJSC, GDR, NVS(a) . . . . . . . . . . . . . . . . . . . . . . . . 643,794 811,180
74,416,816Capital Markets — 2.0%Moscow Exchange MICEX-RTS PJSC. . . . . . . . . . . . . . . . . 6,722,770 9,785,652
Chemicals — 2.0%PhosAgro PJSC, GDR, NVS(a) . . . . . . . . . . . . . . . . . . . . . . . . 709,044 9,394,833
Electric Utilities — 3.6%Inter RAO UES PJSC . . . . . . . . . . . . . . . . . . . . . . . . . . . . . . . . . 170,158,000 10,206,385RusHydro PJSC . . . . . . . . . . . . . . . . . . . . . . . . . . . . . . . . . . . . . . 750,550,000 7,097,234
17,303,619Food & Staples Retailing — 6.1%Magnit PJSC, GDR, NVS(a) . . . . . . . . . . . . . . . . . . . . . . . . . . . 1,216,219 17,963,554X5 Retail Group NV, GDR(a) . . . . . . . . . . . . . . . . . . . . . . . . . . . 479,188 11,312,049
29,275,603Metals & Mining — 18.0%Alrosa PJSC . . . . . . . . . . . . . . . . . . . . . . . . . . . . . . . . . . . . . . . . . 10,917,800 16,434,953Magnitogorsk Iron & Steel Works PJSC. . . . . . . . . . . . . . . . 13,144,700 9,454,485MMC Norilsk Nickel PJSC. . . . . . . . . . . . . . . . . . . . . . . . . . . . . 134,473 22,400,936Novolipetsk Steel PJSC. . . . . . . . . . . . . . . . . . . . . . . . . . . . . . . 5,438,920 13,377,302Polyus PJSC . . . . . . . . . . . . . . . . . . . . . . . . . . . . . . . . . . . . . . . . . 148,775 9,659,345Severstal PJSC. . . . . . . . . . . . . . . . . . . . . . . . . . . . . . . . . . . . . . . 924,005 14,899,866
86,226,887Oil, Gas & Consumable Fuels — 46.2%Gazprom PJSC, ADR, NVS . . . . . . . . . . . . . . . . . . . . . . . . . . . 679,528 2,996,718Gazprom PJSC. . . . . . . . . . . . . . . . . . . . . . . . . . . . . . . . . . . . . . . 27,186,820 60,526,157LUKOIL PJSC . . . . . . . . . . . . . . . . . . . . . . . . . . . . . . . . . . . . . . . . 1,114,955 77,810,753LUKOIL PJSC, ADR, NVS. . . . . . . . . . . . . . . . . . . . . . . . . . . . . 33,931 2,341,239Novatek PJSC, GDR, NVS(a) . . . . . . . . . . . . . . . . . . . . . . . . . . 140,211 23,415,237Rosneft Oil Co. PJSC, GDR, NVS(a) . . . . . . . . . . . . . . . . . . . 2,035,359 12,969,307Rosneft Oil Co. PJSC . . . . . . . . . . . . . . . . . . . . . . . . . . . . . . . . . 1,363,360 8,819,345
Security Shares Value
Oil, Gas & Consumable Fuels (continued)Surgutneftegas PJSC, ADR, NVS . . . . . . . . . . . . . . . . . . . . . 204,210 $ 849,514Surgutneftegas PJSC . . . . . . . . . . . . . . . . . . . . . . . . . . . . . . . . . 22,211,546 9,477,718Tatneft PJSC . . . . . . . . . . . . . . . . . . . . . . . . . . . . . . . . . . . . . . . . . 1,886,645 21,935,404
221,141,392Wireless Telecommunication Services — 3.2%Mobile TeleSystems PJSC, ADR, NVS . . . . . . . . . . . . . . . . . 1,974,943 15,305,808
Total Common Stocks — 96.6%(Cost: $502,609,548) . . . . . . . . . . . . . . . . . . . . . . . . . . . . . . . . . . . . . . . . . . . . . . 462,850,610
Preferred StocksOil, Gas & Consumable Fuels — 3.4%Surgutneftegas PJSC, Preference Shares, NVS. . . . . . . . 22,642,600 12,579,643Transneft PJSC, Preference Shares . . . . . . . . . . . . . . . . . . . 1,655 3,501,475
16,081,118
Total Preferred Stocks — 3.4%(Cost: $16,555,046) . . . . . . . . . . . . . . . . . . . . . . . . . . . . . . . . . . . . . . . . . . . . . . . 16,081,118
Short-Term InvestmentsMoney Market Funds — 0.1%BlackRock Cash Funds: Treasury, SL Agency Shares,
1.89%(b)(c) . . . . . . . . . . . . . . . . . . . . . . . . . . . . . . . . . . . . . . . . . 349,697 349,697
Total Short-Term Investments — 0.1%(Cost: $349,697) . . . . . . . . . . . . . . . . . . . . . . . . . . . . . . . . . . . . . . . . . . . . . . . . . . 349,697
Total Investments in Securities — 100.1%(Cost: $519,514,291) . . . . . . . . . . . . . . . . . . . . . . . . . . . . . . . . . . . . . . . . . . . . . . 479,281,425
Other Assets, Less Liabilities — (0.1)%. . . . . . . . . . . . . . . . . . . . . . . . . . . . . . (421,602)
Net Assets — 100.0% . . . . . . . . . . . . . . . . . . . . . . . . . . . . . . . . . . . . . . . . . . . . . . . . $ 478,859,823
(a) This security may be resold to qualified foreign investors and foreign institutional buyersunder Regulation S of the Securities Act of 1933.
(b) Affiliate of the Fund.(c) Annualized 7-day yield as of period-end.
Affiliates
Investments in issuers considered to be affiliates of the Fund during the year ended August 31, 2018, for purposes of Section 2(a)(3) of the 1940 Act, were as follows:
Affiliated Issuer
SharesHeld at
08/31/17 Net Activity
SharesHeld at
08/31/18Value at
08/31/18 IncomeNet RealizedGain (Loss)(a)
Change inUnrealized
Appreciation(Depreciation)
BlackRock Cash Funds: Treasury, SL Agency Shares . . . . . . . . . . . . . . . . . . . . . . . . . . . 1,026,049 (676,352) 349,697 $349,697 $27,321 $ — $ —
(a) Includes realized capital gain distributions from an affiliated fund, if any.
Fair Value Measurements
Various inputs are used in determining the fair value of financial instruments. For description of the input levels and information about the Fund's policy regarding valuationof financial instruments, refer to the Notes to Financial Statements.
Schedule of InvestmentsAugust 31, 2018
iShares� MSCI Russia ETF(Percentages shown are based on Net Assets)
32 2 0 1 8 I S H A R E S A N N U A L R E P O R T T O S H A R E H O L D E R S
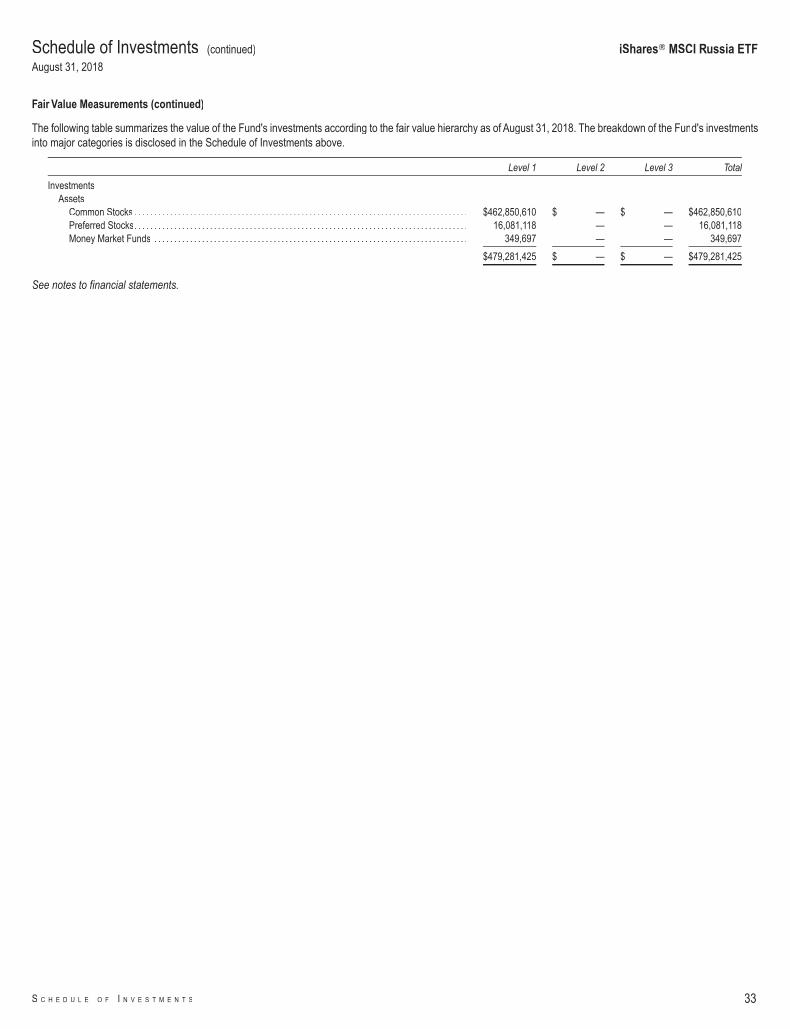
Fair Value Measurements (continued)
The following table summarizes the value of the Fund's investments according to the fair value hierarchy as of August 31, 2018. The breakdown of the Fund's investmentsinto major categories is disclosed in the Schedule of Investments above.
Level 1 Level 2 Level 3 Total
InvestmentsAssets
Common Stocks . . . . . . . . . . . . . . . . . . . . . . . . . . . . . . . . . . . . . . . . . . . . . . . . . . . . . . . . . . . . . . . . . . . . . . . . . . . . . . . . . . . . $462,850,610 $ — $ — $462,850,610Preferred Stocks. . . . . . . . . . . . . . . . . . . . . . . . . . . . . . . . . . . . . . . . . . . . . . . . . . . . . . . . . . . . . . . . . . . . . . . . . . . . . . . . . . . . 16,081,118 — — 16,081,118Money Market Funds . . . . . . . . . . . . . . . . . . . . . . . . . . . . . . . . . . . . . . . . . . . . . . . . . . . . . . . . . . . . . . . . . . . . . . . . . . . . . . . 349,697 — — 349,697
$479,281,425 $ — $ — $479,281,425
See notes to financial statements.
Schedule of Investments (continued)
August 31, 2018
iShares� MSCI Russia ETF
S C H E D U L E O F I N V E S T M E N T S 33
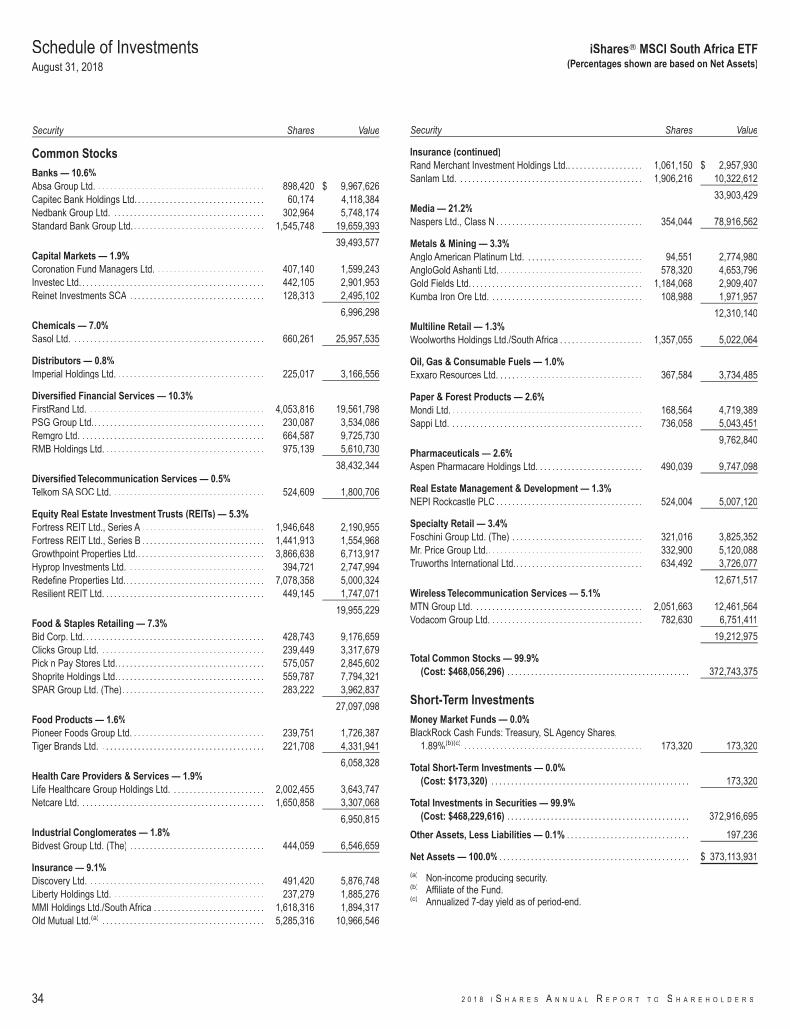
Security Shares Value
Common StocksBanks — 10.6%Absa Group Ltd. . . . . . . . . . . . . . . . . . . . . . . . . . . . . . . . . . . . . . . . . . . 898,420 $ 9,967,626Capitec Bank Holdings Ltd. . . . . . . . . . . . . . . . . . . . . . . . . . . . . . . . . 60,174 4,118,384Nedbank Group Ltd. . . . . . . . . . . . . . . . . . . . . . . . . . . . . . . . . . . . . . . 302,964 5,748,174Standard Bank Group Ltd. . . . . . . . . . . . . . . . . . . . . . . . . . . . . . . . . . 1,545,748 19,659,393
39,493,577Capital Markets — 1.9%Coronation Fund Managers Ltd. . . . . . . . . . . . . . . . . . . . . . . . . . . . 407,140 1,599,243Investec Ltd. . . . . . . . . . . . . . . . . . . . . . . . . . . . . . . . . . . . . . . . . . . . . . . 442,105 2,901,953Reinet Investments SCA . . . . . . . . . . . . . . . . . . . . . . . . . . . . . . . . . . 128,313 2,495,102
6,996,298Chemicals — 7.0%Sasol Ltd. . . . . . . . . . . . . . . . . . . . . . . . . . . . . . . . . . . . . . . . . . . . . . . . . 660,261 25,957,535
Distributors — 0.8%Imperial Holdings Ltd. . . . . . . . . . . . . . . . . . . . . . . . . . . . . . . . . . . . . . 225,017 3,166,556
Diversified Financial Services — 10.3%FirstRand Ltd. . . . . . . . . . . . . . . . . . . . . . . . . . . . . . . . . . . . . . . . . . . . . 4,053,816 19,561,798PSG Group Ltd.. . . . . . . . . . . . . . . . . . . . . . . . . . . . . . . . . . . . . . . . . . . 230,087 3,534,086Remgro Ltd. . . . . . . . . . . . . . . . . . . . . . . . . . . . . . . . . . . . . . . . . . . . . . . 664,587 9,725,730RMB Holdings Ltd. . . . . . . . . . . . . . . . . . . . . . . . . . . . . . . . . . . . . . . . . 975,139 5,610,730
38,432,344Diversified Telecommunication Services — 0.5%Telkom SA SOC Ltd. . . . . . . . . . . . . . . . . . . . . . . . . . . . . . . . . . . . . . . 524,609 1,800,706
Equity Real Estate Investment Trusts (REITs) — 5.3%Fortress REIT Ltd., Series A . . . . . . . . . . . . . . . . . . . . . . . . . . . . . . . 1,946,648 2,190,955Fortress REIT Ltd., Series B . . . . . . . . . . . . . . . . . . . . . . . . . . . . . . . 1,441,913 1,554,968Growthpoint Properties Ltd.. . . . . . . . . . . . . . . . . . . . . . . . . . . . . . . . 3,866,638 6,713,917Hyprop Investments Ltd. . . . . . . . . . . . . . . . . . . . . . . . . . . . . . . . . . . 394,721 2,747,994Redefine Properties Ltd.. . . . . . . . . . . . . . . . . . . . . . . . . . . . . . . . . . . 7,078,358 5,000,324Resilient REIT Ltd. . . . . . . . . . . . . . . . . . . . . . . . . . . . . . . . . . . . . . . . . 449,145 1,747,071
19,955,229Food & Staples Retailing — 7.3%Bid Corp. Ltd. . . . . . . . . . . . . . . . . . . . . . . . . . . . . . . . . . . . . . . . . . . . . . 428,743 9,176,659Clicks Group Ltd. . . . . . . . . . . . . . . . . . . . . . . . . . . . . . . . . . . . . . . . . . 239,449 3,317,679Pick n Pay Stores Ltd.. . . . . . . . . . . . . . . . . . . . . . . . . . . . . . . . . . . . . 575,057 2,845,602Shoprite Holdings Ltd.. . . . . . . . . . . . . . . . . . . . . . . . . . . . . . . . . . . . . 559,787 7,794,321SPAR Group Ltd. (The). . . . . . . . . . . . . . . . . . . . . . . . . . . . . . . . . . . . 283,222 3,962,837
27,097,098Food Products — 1.6%Pioneer Foods Group Ltd. . . . . . . . . . . . . . . . . . . . . . . . . . . . . . . . . . 239,751 1,726,387Tiger Brands Ltd. . . . . . . . . . . . . . . . . . . . . . . . . . . . . . . . . . . . . . . . . . 221,708 4,331,941
6,058,328Health Care Providers & Services — 1.9%Life Healthcare Group Holdings Ltd. . . . . . . . . . . . . . . . . . . . . . . . 2,002,455 3,643,747Netcare Ltd. . . . . . . . . . . . . . . . . . . . . . . . . . . . . . . . . . . . . . . . . . . . . . . 1,650,858 3,307,068
6,950,815Industrial Conglomerates — 1.8%Bidvest Group Ltd. (The) . . . . . . . . . . . . . . . . . . . . . . . . . . . . . . . . . . 444,059 6,546,659
Insurance — 9.1%Discovery Ltd. . . . . . . . . . . . . . . . . . . . . . . . . . . . . . . . . . . . . . . . . . . . . 491,420 5,876,748Liberty Holdings Ltd. . . . . . . . . . . . . . . . . . . . . . . . . . . . . . . . . . . . . . . 237,279 1,885,276MMI Holdings Ltd./South Africa . . . . . . . . . . . . . . . . . . . . . . . . . . . . 1,618,316 1,894,317Old Mutual Ltd.(a) . . . . . . . . . . . . . . . . . . . . . . . . . . . . . . . . . . . . . . . . . 5,285,316 10,966,546
Security Shares Value
Insurance (continued)Rand Merchant Investment Holdings Ltd.. . . . . . . . . . . . . . . . . . . 1,061,150 $ 2,957,930Sanlam Ltd. . . . . . . . . . . . . . . . . . . . . . . . . . . . . . . . . . . . . . . . . . . . . . . 1,906,216 10,322,612
33,903,429Media — 21.2%Naspers Ltd., Class N . . . . . . . . . . . . . . . . . . . . . . . . . . . . . . . . . . . . . 354,044 78,916,562
Metals & Mining — 3.3%Anglo American Platinum Ltd. . . . . . . . . . . . . . . . . . . . . . . . . . . . . . 94,551 2,774,980AngloGold Ashanti Ltd. . . . . . . . . . . . . . . . . . . . . . . . . . . . . . . . . . . . . 578,320 4,653,796Gold Fields Ltd. . . . . . . . . . . . . . . . . . . . . . . . . . . . . . . . . . . . . . . . . . . . 1,184,068 2,909,407Kumba Iron Ore Ltd. . . . . . . . . . . . . . . . . . . . . . . . . . . . . . . . . . . . . . . 108,988 1,971,957
12,310,140Multiline Retail — 1.3%Woolworths Holdings Ltd./South Africa . . . . . . . . . . . . . . . . . . . . . 1,357,055 5,022,064
Oil, Gas & Consumable Fuels — 1.0%Exxaro Resources Ltd. . . . . . . . . . . . . . . . . . . . . . . . . . . . . . . . . . . . . 367,584 3,734,485
Paper & Forest Products — 2.6%Mondi Ltd. . . . . . . . . . . . . . . . . . . . . . . . . . . . . . . . . . . . . . . . . . . . . . . . . 168,564 4,719,389Sappi Ltd. . . . . . . . . . . . . . . . . . . . . . . . . . . . . . . . . . . . . . . . . . . . . . . . . 736,058 5,043,451
9,762,840Pharmaceuticals — 2.6%Aspen Pharmacare Holdings Ltd. . . . . . . . . . . . . . . . . . . . . . . . . . . 490,039 9,747,098
Real Estate Management & Development — 1.3%NEPI Rockcastle PLC . . . . . . . . . . . . . . . . . . . . . . . . . . . . . . . . . . . . . 524,004 5,007,120
Specialty Retail — 3.4%Foschini Group Ltd. (The) . . . . . . . . . . . . . . . . . . . . . . . . . . . . . . . . . 321,016 3,825,352Mr. Price Group Ltd.. . . . . . . . . . . . . . . . . . . . . . . . . . . . . . . . . . . . . . . 332,900 5,120,088Truworths International Ltd.. . . . . . . . . . . . . . . . . . . . . . . . . . . . . . . . 634,492 3,726,077
12,671,517Wireless Telecommunication Services — 5.1%MTN Group Ltd. . . . . . . . . . . . . . . . . . . . . . . . . . . . . . . . . . . . . . . . . . . 2,051,663 12,461,564Vodacom Group Ltd. . . . . . . . . . . . . . . . . . . . . . . . . . . . . . . . . . . . . . . 782,630 6,751,411
19,212,975
Total Common Stocks — 99.9%(Cost: $468,056,296) . . . . . . . . . . . . . . . . . . . . . . . . . . . . . . . . . . . . . . . . . . . . . . 372,743,375
Short-Term InvestmentsMoney Market Funds — 0.0%BlackRock Cash Funds: Treasury, SL Agency Shares,
1.89%(b)(c) . . . . . . . . . . . . . . . . . . . . . . . . . . . . . . . . . . . . . . . . . . . . . 173,320 173,320
Total Short-Term Investments — 0.0%(Cost: $173,320) . . . . . . . . . . . . . . . . . . . . . . . . . . . . . . . . . . . . . . . . . . . . . . . . . . 173,320
Total Investments in Securities — 99.9%(Cost: $468,229,616) . . . . . . . . . . . . . . . . . . . . . . . . . . . . . . . . . . . . . . . . . . . . . . 372,916,695
Other Assets, Less Liabilities — 0.1% . . . . . . . . . . . . . . . . . . . . . . . . . . . . . . . 197,236
Net Assets — 100.0% . . . . . . . . . . . . . . . . . . . . . . . . . . . . . . . . . . . . . . . . . . . . . . . . $ 373,113,931
(a) Non-income producing security.(b) Affiliate of the Fund.(c) Annualized 7-day yield as of period-end.
Schedule of InvestmentsAugust 31, 2018
iShares� MSCI South Africa ETF(Percentages shown are based on Net Assets)
34 2 0 1 8 I S H A R E S A N N U A L R E P O R T T O S H A R E H O L D E R S
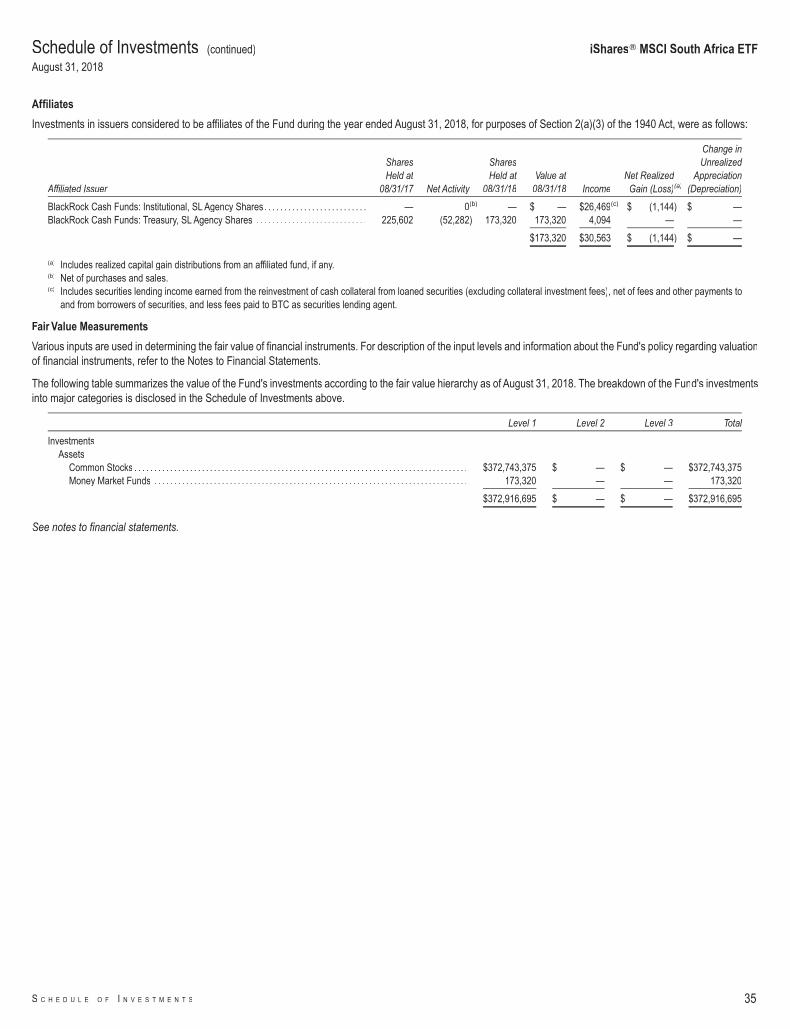
Affiliates
Investments in issuers considered to be affiliates of the Fund during the year ended August 31, 2018, for purposes of Section 2(a)(3) of the 1940 Act, were as follows:
Affiliated Issuer
SharesHeld at
08/31/17 Net Activity
SharesHeld at
08/31/18Value at
08/31/18 IncomeNet RealizedGain (Loss)(a)
Change inUnrealized
Appreciation(Depreciation)
BlackRock Cash Funds: Institutional, SL Agency Shares. . . . . . . . . . . . . . . . . . . . . . . . . . — 0(b) — $ — $26,469(c) $ (1,144) $ —BlackRock Cash Funds: Treasury, SL Agency Shares . . . . . . . . . . . . . . . . . . . . . . . . . . . . 225,602 (52,282) 173,320 173,320 4,094 — —
$173,320 $30,563 $ (1,144) $ —
(a) Includes realized capital gain distributions from an affiliated fund, if any.(b) Net of purchases and sales.(c) Includes securities lending income earned from the reinvestment of cash collateral from loaned securities (excluding collateral investment fees), net of fees and other payments to
and from borrowers of securities, and less fees paid to BTC as securities lending agent.
Fair Value Measurements
Various inputs are used in determining the fair value of financial instruments. For description of the input levels and information about the Fund's policy regarding valuationof financial instruments, refer to the Notes to Financial Statements.
The following table summarizes the value of the Fund's investments according to the fair value hierarchy as of August 31, 2018. The breakdown of the Fund's investmentsinto major categories is disclosed in the Schedule of Investments above.
Level 1 Level 2 Level 3 Total
InvestmentsAssets
Common Stocks . . . . . . . . . . . . . . . . . . . . . . . . . . . . . . . . . . . . . . . . . . . . . . . . . . . . . . . . . . . . . . . . . . . . . . . . . . . . . . . . . . . . $372,743,375 $ — $ — $372,743,375Money Market Funds . . . . . . . . . . . . . . . . . . . . . . . . . . . . . . . . . . . . . . . . . . . . . . . . . . . . . . . . . . . . . . . . . . . . . . . . . . . . . . . 173,320 — — 173,320
$372,916,695 $ — $ — $372,916,695
See notes to financial statements.
Schedule of Investments (continued)
August 31, 2018
iShares� MSCI South Africa ETF
S C H E D U L E O F I N V E S T M E N T S 35
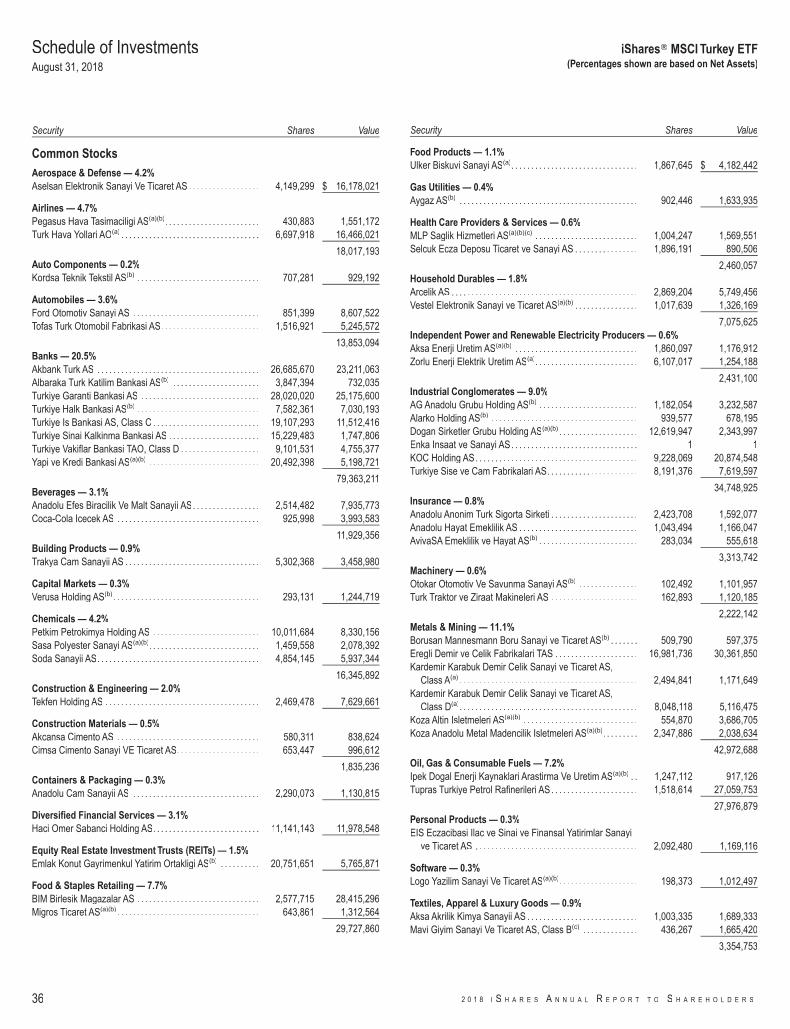
Security Shares Value
Common StocksAerospace & Defense — 4.2%Aselsan Elektronik Sanayi Ve Ticaret AS . . . . . . . . . . . . . . . . . . 4,149,299 $ 16,178,021
Airlines — 4.7%Pegasus Hava Tasimaciligi AS(a)(b). . . . . . . . . . . . . . . . . . . . . . . . 430,883 1,551,172Turk Hava Yollari AO(a) . . . . . . . . . . . . . . . . . . . . . . . . . . . . . . . . . . . 6,697,918 16,466,021
18,017,193Auto Components — 0.2%Kordsa Teknik Tekstil AS(b) . . . . . . . . . . . . . . . . . . . . . . . . . . . . . . . 707,281 929,192
Automobiles — 3.6%Ford Otomotiv Sanayi AS . . . . . . . . . . . . . . . . . . . . . . . . . . . . . . . . 851,399 8,607,522Tofas Turk Otomobil Fabrikasi AS. . . . . . . . . . . . . . . . . . . . . . . . . 1,516,921 5,245,572
13,853,094Banks — 20.5%Akbank Turk AS . . . . . . . . . . . . . . . . . . . . . . . . . . . . . . . . . . . . . . . . . 26,685,670 23,211,063Albaraka Turk Katilim Bankasi AS(b) . . . . . . . . . . . . . . . . . . . . . . 3,847,394 732,035Turkiye Garanti Bankasi AS . . . . . . . . . . . . . . . . . . . . . . . . . . . . . . 28,020,020 25,175,600Turkiye Halk Bankasi AS(b) . . . . . . . . . . . . . . . . . . . . . . . . . . . . . . . 7,582,361 7,030,193Turkiye Is Bankasi AS, Class C . . . . . . . . . . . . . . . . . . . . . . . . . . . 19,107,293 11,512,416Turkiye Sinai Kalkinma Bankasi AS . . . . . . . . . . . . . . . . . . . . . . . 15,229,483 1,747,806Turkiye Vakiflar Bankasi TAO, Class D . . . . . . . . . . . . . . . . . . . . 9,101,531 4,755,377Yapi ve Kredi Bankasi AS(a)(b) . . . . . . . . . . . . . . . . . . . . . . . . . . . . 20,492,398 5,198,721
79,363,211Beverages — 3.1%Anadolu Efes Biracilik Ve Malt Sanayii AS. . . . . . . . . . . . . . . . . 2,514,482 7,935,773Coca-Cola Icecek AS . . . . . . . . . . . . . . . . . . . . . . . . . . . . . . . . . . . . 925,998 3,993,583
11,929,356Building Products — 0.9%Trakya Cam Sanayii AS . . . . . . . . . . . . . . . . . . . . . . . . . . . . . . . . . . 5,302,368 3,458,980
Capital Markets — 0.3%Verusa Holding AS(b). . . . . . . . . . . . . . . . . . . . . . . . . . . . . . . . . . . . . 293,131 1,244,719
Chemicals — 4.2%Petkim Petrokimya Holding AS . . . . . . . . . . . . . . . . . . . . . . . . . . . 10,011,684 8,330,156Sasa Polyester Sanayi AS(a)(b). . . . . . . . . . . . . . . . . . . . . . . . . . . . 1,459,558 2,078,392Soda Sanayii AS. . . . . . . . . . . . . . . . . . . . . . . . . . . . . . . . . . . . . . . . . 4,854,145 5,937,344
16,345,892Construction & Engineering — 2.0%Tekfen Holding AS . . . . . . . . . . . . . . . . . . . . . . . . . . . . . . . . . . . . . . . 2,469,478 7,629,661
Construction Materials — 0.5%Akcansa Cimento AS . . . . . . . . . . . . . . . . . . . . . . . . . . . . . . . . . . . . 580,311 838,624Cimsa Cimento Sanayi VE Ticaret AS. . . . . . . . . . . . . . . . . . . . . 653,447 996,612
1,835,236Containers & Packaging — 0.3%Anadolu Cam Sanayii AS . . . . . . . . . . . . . . . . . . . . . . . . . . . . . . . . 2,290,073 1,130,815
Diversified Financial Services — 3.1%Haci Omer Sabanci Holding AS. . . . . . . . . . . . . . . . . . . . . . . . . . . 11,141,143 11,978,548
Equity Real Estate Investment Trusts (REITs) — 1.5%Emlak Konut Gayrimenkul Yatirim Ortakligi AS(b) . . . . . . . . . . 20,751,651 5,765,871
Food & Staples Retailing — 7.7%BIM Birlesik Magazalar AS . . . . . . . . . . . . . . . . . . . . . . . . . . . . . . . 2,577,715 28,415,296Migros Ticaret AS(a)(b) . . . . . . . . . . . . . . . . . . . . . . . . . . . . . . . . . . . . 643,861 1,312,564
29,727,860
Security Shares Value
Food Products — 1.1%Ulker Biskuvi Sanayi AS(a). . . . . . . . . . . . . . . . . . . . . . . . . . . . . . . . 1,867,645 $ 4,182,442
Gas Utilities — 0.4%Aygaz AS(b) . . . . . . . . . . . . . . . . . . . . . . . . . . . . . . . . . . . . . . . . . . . . . 902,446 1,633,935
Health Care Providers & Services — 0.6%MLP Saglik Hizmetleri AS(a)(b)(c) . . . . . . . . . . . . . . . . . . . . . . . . . . 1,004,247 1,569,551Selcuk Ecza Deposu Ticaret ve Sanayi AS . . . . . . . . . . . . . . . . 1,896,191 890,506
2,460,057Household Durables — 1.8%Arcelik AS . . . . . . . . . . . . . . . . . . . . . . . . . . . . . . . . . . . . . . . . . . . . . . . 2,869,204 5,749,456Vestel Elektronik Sanayi ve Ticaret AS(a)(b) . . . . . . . . . . . . . . . . 1,017,639 1,326,169
7,075,625Independent Power and Renewable Electricity Producers — 0.6%Aksa Enerji Uretim AS(a)(b) . . . . . . . . . . . . . . . . . . . . . . . . . . . . . . . 1,860,097 1,176,912Zorlu Enerji Elektrik Uretim AS(a). . . . . . . . . . . . . . . . . . . . . . . . . . 6,107,017 1,254,188
2,431,100Industrial Conglomerates — 9.0%AG Anadolu Grubu Holding AS(b) . . . . . . . . . . . . . . . . . . . . . . . . . 1,182,054 3,232,587Alarko Holding AS(b) . . . . . . . . . . . . . . . . . . . . . . . . . . . . . . . . . . . . . 939,577 678,195Dogan Sirketler Grubu Holding AS(a)(b) . . . . . . . . . . . . . . . . . . . . 12,619,947 2,343,997Enka Insaat ve Sanayi AS. . . . . . . . . . . . . . . . . . . . . . . . . . . . . . . . 1 1KOC Holding AS. . . . . . . . . . . . . . . . . . . . . . . . . . . . . . . . . . . . . . . . . 9,228,069 20,874,548Turkiye Sise ve Cam Fabrikalari AS. . . . . . . . . . . . . . . . . . . . . . . 8,191,376 7,619,597
34,748,925Insurance — 0.8%Anadolu Anonim Turk Sigorta Sirketi . . . . . . . . . . . . . . . . . . . . . . 2,423,708 1,592,077Anadolu Hayat Emeklilik AS . . . . . . . . . . . . . . . . . . . . . . . . . . . . . . 1,043,494 1,166,047AvivaSA Emeklilik ve Hayat AS(b) . . . . . . . . . . . . . . . . . . . . . . . . . 283,034 555,618
3,313,742Machinery — 0.6%Otokar Otomotiv Ve Savunma Sanayi AS(b) . . . . . . . . . . . . . . . 102,492 1,101,957Turk Traktor ve Ziraat Makineleri AS . . . . . . . . . . . . . . . . . . . . . . 162,893 1,120,185
2,222,142Metals & Mining — 11.1%Borusan Mannesmann Boru Sanayi ve Ticaret AS(b) . . . . . . . 509,790 597,375Eregli Demir ve Celik Fabrikalari TAS . . . . . . . . . . . . . . . . . . . . . 16,981,736 30,361,850Kardemir Karabuk Demir Celik Sanayi ve Ticaret AS,
Class A(a) . . . . . . . . . . . . . . . . . . . . . . . . . . . . . . . . . . . . . . . . . . . . . 2,494,841 1,171,649Kardemir Karabuk Demir Celik Sanayi ve Ticaret AS,
Class D(a). . . . . . . . . . . . . . . . . . . . . . . . . . . . . . . . . . . . . . . . . . . . . 8,048,118 5,116,475Koza Altin Isletmeleri AS(a)(b) . . . . . . . . . . . . . . . . . . . . . . . . . . . . . 554,870 3,686,705Koza Anadolu Metal Madencilik Isletmeleri AS(a)(b). . . . . . . . . 2,347,886 2,038,634
42,972,688Oil, Gas & Consumable Fuels — 7.2%Ipek Dogal Enerji Kaynaklari Arastirma Ve Uretim AS(a)(b) . . 1,247,112 917,126Tupras Turkiye Petrol Rafinerileri AS. . . . . . . . . . . . . . . . . . . . . . 1,518,614 27,059,753
27,976,879Personal Products — 0.3%EIS Eczacibasi Ilac ve Sinai ve Finansal Yatirimlar Sanayi
ve Ticaret AS . . . . . . . . . . . . . . . . . . . . . . . . . . . . . . . . . . . . . . . . . 2,092,480 1,169,116
Software — 0.3%Logo Yazilim Sanayi Ve Ticaret AS(a)(b). . . . . . . . . . . . . . . . . . . . 198,373 1,012,497
Textiles, Apparel & Luxury Goods — 0.9%Aksa Akrilik Kimya Sanayii AS . . . . . . . . . . . . . . . . . . . . . . . . . . . . 1,003,335 1,689,333Mavi Giyim Sanayi Ve Ticaret AS, Class B(c) . . . . . . . . . . . . . . 436,267 1,665,420
3,354,753
Schedule of InvestmentsAugust 31, 2018
iShares� MSCI Turkey ETF(Percentages shown are based on Net Assets)
36 2 0 1 8 I S H A R E S A N N U A L R E P O R T T O S H A R E H O L D E R S
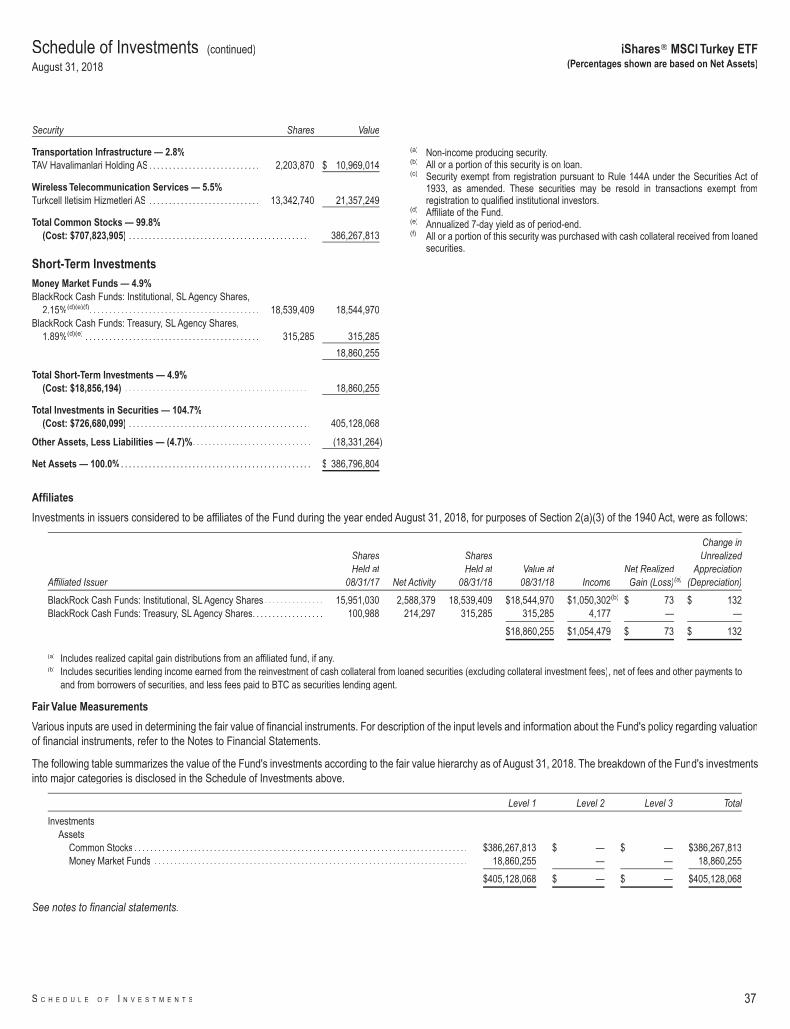
Security Shares Value
Transportation Infrastructure — 2.8%TAV Havalimanlari Holding AS. . . . . . . . . . . . . . . . . . . . . . . . . . . . 2,203,870 $ 10,969,014
Wireless Telecommunication Services — 5.5%Turkcell Iletisim Hizmetleri AS . . . . . . . . . . . . . . . . . . . . . . . . . . . . 13,342,740 21,357,249
Total Common Stocks — 99.8%(Cost: $707,823,905) . . . . . . . . . . . . . . . . . . . . . . . . . . . . . . . . . . . . . . . . . . . . . . 386,267,813
Short-Term InvestmentsMoney Market Funds — 4.9%BlackRock Cash Funds: Institutional, SL Agency Shares,
2.15%(d)(e)(f). . . . . . . . . . . . . . . . . . . . . . . . . . . . . . . . . . . . . . . . . . . 18,539,409 18,544,970BlackRock Cash Funds: Treasury, SL Agency Shares,
1.89%(d)(e) . . . . . . . . . . . . . . . . . . . . . . . . . . . . . . . . . . . . . . . . . . . . 315,285 315,285
18,860,255
Total Short-Term Investments — 4.9%(Cost: $18,856,194) . . . . . . . . . . . . . . . . . . . . . . . . . . . . . . . . . . . . . . . . . . . . . . . 18,860,255
Total Investments in Securities — 104.7%(Cost: $726,680,099) . . . . . . . . . . . . . . . . . . . . . . . . . . . . . . . . . . . . . . . . . . . . . . 405,128,068
Other Assets, Less Liabilities — (4.7)%. . . . . . . . . . . . . . . . . . . . . . . . . . . . . . (18,331,264)
Net Assets — 100.0% . . . . . . . . . . . . . . . . . . . . . . . . . . . . . . . . . . . . . . . . . . . . . . . . $ 386,796,804
(a) Non-income producing security.(b) All or a portion of this security is on loan.(c) Security exempt from registration pursuant to Rule 144A under the Securities Act of
1933, as amended. These securities may be resold in transactions exempt fromregistration to qualified institutional investors.
(d) Affiliate of the Fund.(e) Annualized 7-day yield as of period-end.(f) All or a portion of this security was purchased with cash collateral received from loaned
securities.
Affiliates
Investments in issuers considered to be affiliates of the Fund during the year ended August 31, 2018, for purposes of Section 2(a)(3) of the 1940 Act, were as follows:
Affiliated Issuer
SharesHeld at
08/31/17 Net Activity
SharesHeld at
08/31/18Value at
08/31/18 IncomeNet RealizedGain (Loss)(a)
Change inUnrealized
Appreciation(Depreciation)
BlackRock Cash Funds: Institutional, SL Agency Shares . . . . . . . . . . . . . . . 15,951,030 2,588,379 18,539,409 $18,544,970 $1,050,302(b) $ 73 $ 132BlackRock Cash Funds: Treasury, SL Agency Shares. . . . . . . . . . . . . . . . . . 100,988 214,297 315,285 315,285 4,177 — —
$18,860,255 $1,054,479 $ 73 $ 132
(a) Includes realized capital gain distributions from an affiliated fund, if any.(b) Includes securities lending income earned from the reinvestment of cash collateral from loaned securities (excluding collateral investment fees), net of fees and other payments to
and from borrowers of securities, and less fees paid to BTC as securities lending agent.
Fair Value Measurements
Various inputs are used in determining the fair value of financial instruments. For description of the input levels and information about the Fund's policy regarding valuationof financial instruments, refer to the Notes to Financial Statements.
The following table summarizes the value of the Fund's investments according to the fair value hierarchy as of August 31, 2018. The breakdown of the Fund's investmentsinto major categories is disclosed in the Schedule of Investments above.
Level 1 Level 2 Level 3 Total
InvestmentsAssets
Common Stocks . . . . . . . . . . . . . . . . . . . . . . . . . . . . . . . . . . . . . . . . . . . . . . . . . . . . . . . . . . . . . . . . . . . . . . . . . . . . . . . . . . . . $386,267,813 $ — $ — $386,267,813Money Market Funds . . . . . . . . . . . . . . . . . . . . . . . . . . . . . . . . . . . . . . . . . . . . . . . . . . . . . . . . . . . . . . . . . . . . . . . . . . . . . . . 18,860,255 — — 18,860,255
$405,128,068 $ — $ — $405,128,068
See notes to financial statements.
Schedule of Investments (continued)
August 31, 2018
iShares� MSCI Turkey ETF(Percentages shown are based on Net Assets)
S C H E D U L E O F I N V E S T M E N T S 37
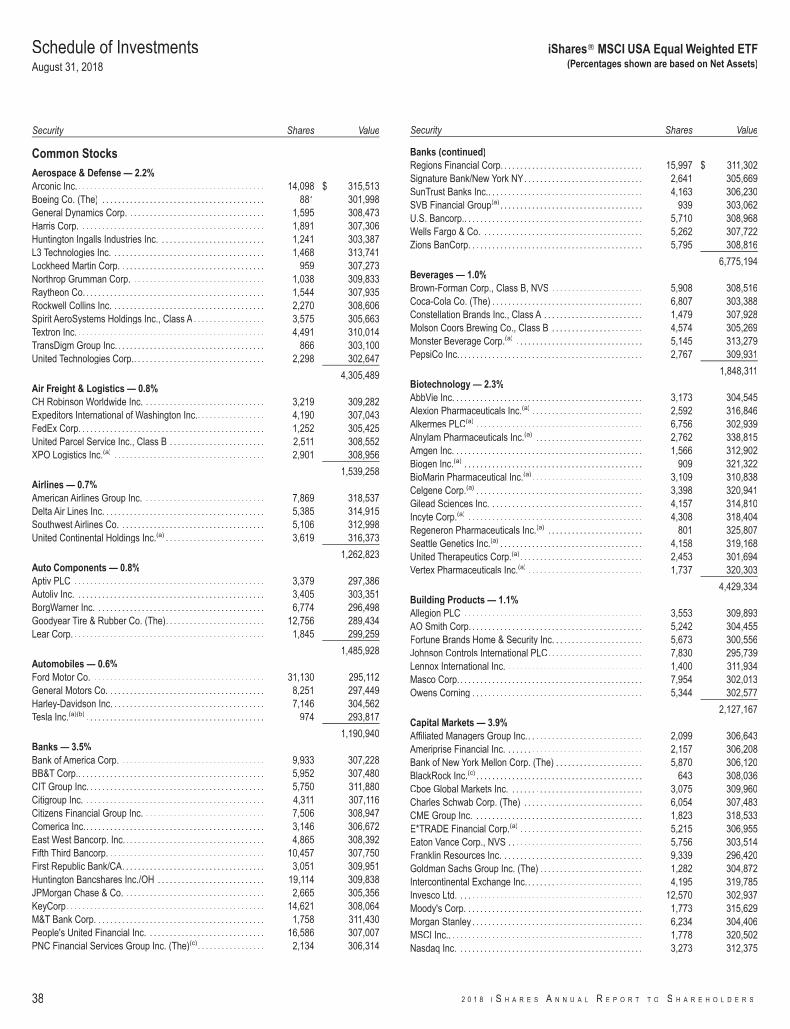
Security Shares Value
Common StocksAerospace & Defense — 2.2%Arconic Inc.. . . . . . . . . . . . . . . . . . . . . . . . . . . . . . . . . . . . . . . . . . . . . . . 14,098 $ 315,513Boeing Co. (The) . . . . . . . . . . . . . . . . . . . . . . . . . . . . . . . . . . . . . . . . . 881 301,998General Dynamics Corp. . . . . . . . . . . . . . . . . . . . . . . . . . . . . . . . . . . 1,595 308,473Harris Corp. . . . . . . . . . . . . . . . . . . . . . . . . . . . . . . . . . . . . . . . . . . . . . . 1,891 307,306Huntington Ingalls Industries Inc. . . . . . . . . . . . . . . . . . . . . . . . . . . 1,241 303,387L3 Technologies Inc. . . . . . . . . . . . . . . . . . . . . . . . . . . . . . . . . . . . . . . 1,468 313,741Lockheed Martin Corp. . . . . . . . . . . . . . . . . . . . . . . . . . . . . . . . . . . . . 959 307,273Northrop Grumman Corp. . . . . . . . . . . . . . . . . . . . . . . . . . . . . . . . . . 1,038 309,833Raytheon Co. . . . . . . . . . . . . . . . . . . . . . . . . . . . . . . . . . . . . . . . . . . . . . 1,544 307,935Rockwell Collins Inc. . . . . . . . . . . . . . . . . . . . . . . . . . . . . . . . . . . . . . . 2,270 308,606Spirit AeroSystems Holdings Inc., Class A . . . . . . . . . . . . . . . . . . 3,575 305,663Textron Inc. . . . . . . . . . . . . . . . . . . . . . . . . . . . . . . . . . . . . . . . . . . . . . . . 4,491 310,014TransDigm Group Inc.. . . . . . . . . . . . . . . . . . . . . . . . . . . . . . . . . . . . . 866 303,100United Technologies Corp.. . . . . . . . . . . . . . . . . . . . . . . . . . . . . . . . . 2,298 302,647
4,305,489Air Freight & Logistics — 0.8%CH Robinson Worldwide Inc. . . . . . . . . . . . . . . . . . . . . . . . . . . . . . . 3,219 309,282Expeditors International of Washington Inc.. . . . . . . . . . . . . . . . . 4,190 307,043FedEx Corp. . . . . . . . . . . . . . . . . . . . . . . . . . . . . . . . . . . . . . . . . . . . . . . 1,252 305,425United Parcel Service Inc., Class B . . . . . . . . . . . . . . . . . . . . . . . . 2,511 308,552XPO Logistics Inc.(a) . . . . . . . . . . . . . . . . . . . . . . . . . . . . . . . . . . . . . . 2,901 308,956
1,539,258Airlines — 0.7%American Airlines Group Inc. . . . . . . . . . . . . . . . . . . . . . . . . . . . . . . 7,869 318,537Delta Air Lines Inc. . . . . . . . . . . . . . . . . . . . . . . . . . . . . . . . . . . . . . . . . 5,385 314,915Southwest Airlines Co. . . . . . . . . . . . . . . . . . . . . . . . . . . . . . . . . . . . . 5,106 312,998United Continental Holdings Inc.(a) . . . . . . . . . . . . . . . . . . . . . . . . . 3,619 316,373
1,262,823Auto Components — 0.8%Aptiv PLC . . . . . . . . . . . . . . . . . . . . . . . . . . . . . . . . . . . . . . . . . . . . . . . . 3,379 297,386Autoliv Inc. . . . . . . . . . . . . . . . . . . . . . . . . . . . . . . . . . . . . . . . . . . . . . . . 3,405 303,351BorgWarner Inc. . . . . . . . . . . . . . . . . . . . . . . . . . . . . . . . . . . . . . . . . . . 6,774 296,498Goodyear Tire & Rubber Co. (The). . . . . . . . . . . . . . . . . . . . . . . . . 12,756 289,434Lear Corp. . . . . . . . . . . . . . . . . . . . . . . . . . . . . . . . . . . . . . . . . . . . . . . . . 1,845 299,259
1,485,928Automobiles — 0.6%Ford Motor Co. . . . . . . . . . . . . . . . . . . . . . . . . . . . . . . . . . . . . . . . . . . . 31,130 295,112General Motors Co. . . . . . . . . . . . . . . . . . . . . . . . . . . . . . . . . . . . . . . . 8,251 297,449Harley-Davidson Inc. . . . . . . . . . . . . . . . . . . . . . . . . . . . . . . . . . . . . . . 7,146 304,562Tesla Inc.(a)(b) . . . . . . . . . . . . . . . . . . . . . . . . . . . . . . . . . . . . . . . . . . . . . 974 293,817
1,190,940Banks — 3.5%Bank of America Corp. . . . . . . . . . . . . . . . . . . . . . . . . . . . . . . . . . . . . 9,933 307,228BB&T Corp.. . . . . . . . . . . . . . . . . . . . . . . . . . . . . . . . . . . . . . . . . . . . . . . 5,952 307,480CIT Group Inc. . . . . . . . . . . . . . . . . . . . . . . . . . . . . . . . . . . . . . . . . . . . . 5,750 311,880Citigroup Inc. . . . . . . . . . . . . . . . . . . . . . . . . . . . . . . . . . . . . . . . . . . . . . 4,311 307,116Citizens Financial Group Inc. . . . . . . . . . . . . . . . . . . . . . . . . . . . . . . 7,506 308,947Comerica Inc.. . . . . . . . . . . . . . . . . . . . . . . . . . . . . . . . . . . . . . . . . . . . . 3,146 306,672East West Bancorp. Inc. . . . . . . . . . . . . . . . . . . . . . . . . . . . . . . . . . . . 4,865 308,392Fifth Third Bancorp. . . . . . . . . . . . . . . . . . . . . . . . . . . . . . . . . . . . . . . . 10,457 307,750First Republic Bank/CA. . . . . . . . . . . . . . . . . . . . . . . . . . . . . . . . . . . . 3,051 309,951Huntington Bancshares Inc./OH . . . . . . . . . . . . . . . . . . . . . . . . . . . 19,114 309,838JPMorgan Chase & Co. . . . . . . . . . . . . . . . . . . . . . . . . . . . . . . . . . . . 2,665 305,356KeyCorp. . . . . . . . . . . . . . . . . . . . . . . . . . . . . . . . . . . . . . . . . . . . . . . . . . 14,621 308,064M&T Bank Corp. . . . . . . . . . . . . . . . . . . . . . . . . . . . . . . . . . . . . . . . . . . 1,758 311,430People's United Financial Inc. . . . . . . . . . . . . . . . . . . . . . . . . . . . . . 16,586 307,007PNC Financial Services Group Inc. (The)(c). . . . . . . . . . . . . . . . . 2,134 306,314
Security Shares Value
Banks (continued)Regions Financial Corp. . . . . . . . . . . . . . . . . . . . . . . . . . . . . . . . . . . . 15,997 $ 311,302Signature Bank/New York NY. . . . . . . . . . . . . . . . . . . . . . . . . . . . . . 2,641 305,669SunTrust Banks Inc.. . . . . . . . . . . . . . . . . . . . . . . . . . . . . . . . . . . . . . . 4,163 306,230SVB Financial Group(a) . . . . . . . . . . . . . . . . . . . . . . . . . . . . . . . . . . . . 939 303,062U.S. Bancorp.. . . . . . . . . . . . . . . . . . . . . . . . . . . . . . . . . . . . . . . . . . . . . 5,710 308,968Wells Fargo & Co. . . . . . . . . . . . . . . . . . . . . . . . . . . . . . . . . . . . . . . . . 5,262 307,722Zions BanCorp. . . . . . . . . . . . . . . . . . . . . . . . . . . . . . . . . . . . . . . . . . . . 5,795 308,816
6,775,194Beverages — 1.0%Brown-Forman Corp., Class B, NVS . . . . . . . . . . . . . . . . . . . . . . . 5,908 308,516Coca-Cola Co. (The) . . . . . . . . . . . . . . . . . . . . . . . . . . . . . . . . . . . . . . 6,807 303,388Constellation Brands Inc., Class A . . . . . . . . . . . . . . . . . . . . . . . . . 1,479 307,928Molson Coors Brewing Co., Class B . . . . . . . . . . . . . . . . . . . . . . . 4,574 305,269Monster Beverage Corp.(a) . . . . . . . . . . . . . . . . . . . . . . . . . . . . . . . . 5,145 313,279PepsiCo Inc. . . . . . . . . . . . . . . . . . . . . . . . . . . . . . . . . . . . . . . . . . . . . . . 2,767 309,931
1,848,311Biotechnology — 2.3%AbbVie Inc. . . . . . . . . . . . . . . . . . . . . . . . . . . . . . . . . . . . . . . . . . . . . . . . 3,173 304,545Alexion Pharmaceuticals Inc.(a) . . . . . . . . . . . . . . . . . . . . . . . . . . . . 2,592 316,846Alkermes PLC(a) . . . . . . . . . . . . . . . . . . . . . . . . . . . . . . . . . . . . . . . . . . 6,756 302,939Alnylam Pharmaceuticals Inc.(a) . . . . . . . . . . . . . . . . . . . . . . . . . . . 2,762 338,815Amgen Inc. . . . . . . . . . . . . . . . . . . . . . . . . . . . . . . . . . . . . . . . . . . . . . . . 1,566 312,902Biogen Inc.(a) . . . . . . . . . . . . . . . . . . . . . . . . . . . . . . . . . . . . . . . . . . . . . 909 321,322BioMarin Pharmaceutical Inc.(a) . . . . . . . . . . . . . . . . . . . . . . . . . . . . 3,109 310,838Celgene Corp.(a) . . . . . . . . . . . . . . . . . . . . . . . . . . . . . . . . . . . . . . . . . . 3,398 320,941Gilead Sciences Inc. . . . . . . . . . . . . . . . . . . . . . . . . . . . . . . . . . . . . . . 4,157 314,810Incyte Corp.(a) . . . . . . . . . . . . . . . . . . . . . . . . . . . . . . . . . . . . . . . . . . . . 4,308 318,404Regeneron Pharmaceuticals Inc.(a) . . . . . . . . . . . . . . . . . . . . . . . . 801 325,807Seattle Genetics Inc.(a) . . . . . . . . . . . . . . . . . . . . . . . . . . . . . . . . . . . . 4,158 319,168United Therapeutics Corp.(a). . . . . . . . . . . . . . . . . . . . . . . . . . . . . . . 2,453 301,694Vertex Pharmaceuticals Inc.(a) . . . . . . . . . . . . . . . . . . . . . . . . . . . . . 1,737 320,303
4,429,334Building Products — 1.1%Allegion PLC . . . . . . . . . . . . . . . . . . . . . . . . . . . . . . . . . . . . . . . . . . . . . 3,553 309,893AO Smith Corp. . . . . . . . . . . . . . . . . . . . . . . . . . . . . . . . . . . . . . . . . . . . 5,242 304,455Fortune Brands Home & Security Inc. . . . . . . . . . . . . . . . . . . . . . . 5,673 300,556Johnson Controls International PLC. . . . . . . . . . . . . . . . . . . . . . . . 7,830 295,739Lennox International Inc. . . . . . . . . . . . . . . . . . . . . . . . . . . . . . . . . . . 1,400 311,934Masco Corp. . . . . . . . . . . . . . . . . . . . . . . . . . . . . . . . . . . . . . . . . . . . . . . 7,954 302,013Owens Corning . . . . . . . . . . . . . . . . . . . . . . . . . . . . . . . . . . . . . . . . . . . 5,344 302,577
2,127,167Capital Markets — 3.9%Affiliated Managers Group Inc.. . . . . . . . . . . . . . . . . . . . . . . . . . . . . 2,099 306,643Ameriprise Financial Inc. . . . . . . . . . . . . . . . . . . . . . . . . . . . . . . . . . . 2,157 306,208Bank of New York Mellon Corp. (The) . . . . . . . . . . . . . . . . . . . . . . 5,870 306,120BlackRock Inc.(c) . . . . . . . . . . . . . . . . . . . . . . . . . . . . . . . . . . . . . . . . . . 643 308,036Cboe Global Markets Inc. . . . . . . . . . . . . . . . . . . . . . . . . . . . . . . . . . 3,075 309,960Charles Schwab Corp. (The) . . . . . . . . . . . . . . . . . . . . . . . . . . . . . . 6,054 307,483CME Group Inc. . . . . . . . . . . . . . . . . . . . . . . . . . . . . . . . . . . . . . . . . . . 1,823 318,533E*TRADE Financial Corp.(a) . . . . . . . . . . . . . . . . . . . . . . . . . . . . . . . 5,215 306,955Eaton Vance Corp., NVS . . . . . . . . . . . . . . . . . . . . . . . . . . . . . . . . . . 5,756 303,514Franklin Resources Inc. . . . . . . . . . . . . . . . . . . . . . . . . . . . . . . . . . . . 9,339 296,420Goldman Sachs Group Inc. (The) . . . . . . . . . . . . . . . . . . . . . . . . . . 1,282 304,872Intercontinental Exchange Inc.. . . . . . . . . . . . . . . . . . . . . . . . . . . . . 4,195 319,785Invesco Ltd. . . . . . . . . . . . . . . . . . . . . . . . . . . . . . . . . . . . . . . . . . . . . . . 12,570 302,937Moody's Corp. . . . . . . . . . . . . . . . . . . . . . . . . . . . . . . . . . . . . . . . . . . . . 1,773 315,629Morgan Stanley . . . . . . . . . . . . . . . . . . . . . . . . . . . . . . . . . . . . . . . . . . . 6,234 304,406MSCI Inc.. . . . . . . . . . . . . . . . . . . . . . . . . . . . . . . . . . . . . . . . . . . . . . . . . 1,778 320,502Nasdaq Inc. . . . . . . . . . . . . . . . . . . . . . . . . . . . . . . . . . . . . . . . . . . . . . . 3,273 312,375
Schedule of InvestmentsAugust 31, 2018
iShares� MSCI USA Equal Weighted ETF(Percentages shown are based on Net Assets)
38 2 0 1 8 I S H A R E S A N N U A L R E P O R T T O S H A R E H O L D E R S
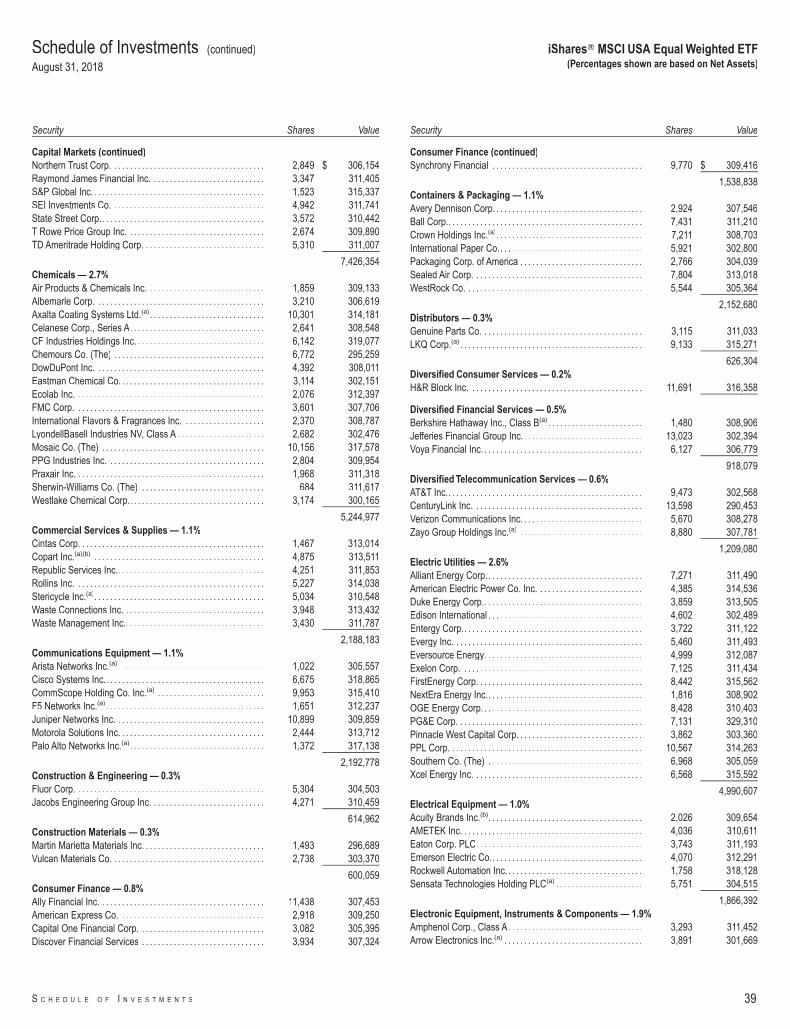
Security Shares Value
Capital Markets (continued)Northern Trust Corp. . . . . . . . . . . . . . . . . . . . . . . . . . . . . . . . . . . . . . . 2,849 $ 306,154Raymond James Financial Inc. . . . . . . . . . . . . . . . . . . . . . . . . . . . . 3,347 311,405S&P Global Inc. . . . . . . . . . . . . . . . . . . . . . . . . . . . . . . . . . . . . . . . . . . . 1,523 315,337SEI Investments Co. . . . . . . . . . . . . . . . . . . . . . . . . . . . . . . . . . . . . . . 4,942 311,741State Street Corp.. . . . . . . . . . . . . . . . . . . . . . . . . . . . . . . . . . . . . . . . . 3,572 310,442T Rowe Price Group Inc. . . . . . . . . . . . . . . . . . . . . . . . . . . . . . . . . . . 2,674 309,890TD Ameritrade Holding Corp. . . . . . . . . . . . . . . . . . . . . . . . . . . . . . . 5,310 311,007
7,426,354Chemicals — 2.7%Air Products & Chemicals Inc. . . . . . . . . . . . . . . . . . . . . . . . . . . . . . 1,859 309,133Albemarle Corp. . . . . . . . . . . . . . . . . . . . . . . . . . . . . . . . . . . . . . . . . . . 3,210 306,619Axalta Coating Systems Ltd.(a). . . . . . . . . . . . . . . . . . . . . . . . . . . . . 10,301 314,181Celanese Corp., Series A. . . . . . . . . . . . . . . . . . . . . . . . . . . . . . . . . . 2,641 308,548CF Industries Holdings Inc. . . . . . . . . . . . . . . . . . . . . . . . . . . . . . . . . 6,142 319,077Chemours Co. (The) . . . . . . . . . . . . . . . . . . . . . . . . . . . . . . . . . . . . . . 6,772 295,259DowDuPont Inc. . . . . . . . . . . . . . . . . . . . . . . . . . . . . . . . . . . . . . . . . . . 4,392 308,011Eastman Chemical Co. . . . . . . . . . . . . . . . . . . . . . . . . . . . . . . . . . . . . 3,114 302,151Ecolab Inc. . . . . . . . . . . . . . . . . . . . . . . . . . . . . . . . . . . . . . . . . . . . . . . . 2,076 312,397FMC Corp. . . . . . . . . . . . . . . . . . . . . . . . . . . . . . . . . . . . . . . . . . . . . . . . 3,601 307,706International Flavors & Fragrances Inc. . . . . . . . . . . . . . . . . . . . . 2,370 308,787LyondellBasell Industries NV, Class A . . . . . . . . . . . . . . . . . . . . . . 2,682 302,476Mosaic Co. (The) . . . . . . . . . . . . . . . . . . . . . . . . . . . . . . . . . . . . . . . . . 10,156 317,578PPG Industries Inc. . . . . . . . . . . . . . . . . . . . . . . . . . . . . . . . . . . . . . . . 2,804 309,954Praxair Inc. . . . . . . . . . . . . . . . . . . . . . . . . . . . . . . . . . . . . . . . . . . . . . . . 1,968 311,318Sherwin-Williams Co. (The). . . . . . . . . . . . . . . . . . . . . . . . . . . . . . . . 684 311,617Westlake Chemical Corp.. . . . . . . . . . . . . . . . . . . . . . . . . . . . . . . . . . 3,174 300,165
5,244,977Commercial Services & Supplies — 1.1%Cintas Corp. . . . . . . . . . . . . . . . . . . . . . . . . . . . . . . . . . . . . . . . . . . . . . . 1,467 313,014Copart Inc.(a)(b) . . . . . . . . . . . . . . . . . . . . . . . . . . . . . . . . . . . . . . . . . . . 4,875 313,511Republic Services Inc.. . . . . . . . . . . . . . . . . . . . . . . . . . . . . . . . . . . . . 4,251 311,853Rollins Inc. . . . . . . . . . . . . . . . . . . . . . . . . . . . . . . . . . . . . . . . . . . . . . . . 5,227 314,038Stericycle Inc.(a). . . . . . . . . . . . . . . . . . . . . . . . . . . . . . . . . . . . . . . . . . . 5,034 310,548Waste Connections Inc. . . . . . . . . . . . . . . . . . . . . . . . . . . . . . . . . . . . 3,948 313,432Waste Management Inc.. . . . . . . . . . . . . . . . . . . . . . . . . . . . . . . . . . . 3,430 311,787
2,188,183Communications Equipment — 1.1%Arista Networks Inc.(a) . . . . . . . . . . . . . . . . . . . . . . . . . . . . . . . . . . . . . 1,022 305,557Cisco Systems Inc.. . . . . . . . . . . . . . . . . . . . . . . . . . . . . . . . . . . . . . . . 6,675 318,865CommScope Holding Co. Inc.(a) . . . . . . . . . . . . . . . . . . . . . . . . . . . 9,953 315,410F5 Networks Inc.(a) . . . . . . . . . . . . . . . . . . . . . . . . . . . . . . . . . . . . . . . . 1,651 312,237Juniper Networks Inc. . . . . . . . . . . . . . . . . . . . . . . . . . . . . . . . . . . . . . 10,899 309,859Motorola Solutions Inc. . . . . . . . . . . . . . . . . . . . . . . . . . . . . . . . . . . . . 2,444 313,712Palo Alto Networks Inc.(a). . . . . . . . . . . . . . . . . . . . . . . . . . . . . . . . . . 1,372 317,138
2,192,778Construction & Engineering — 0.3%Fluor Corp. . . . . . . . . . . . . . . . . . . . . . . . . . . . . . . . . . . . . . . . . . . . . . . . 5,304 304,503Jacobs Engineering Group Inc. . . . . . . . . . . . . . . . . . . . . . . . . . . . . 4,271 310,459
614,962Construction Materials — 0.3%Martin Marietta Materials Inc. . . . . . . . . . . . . . . . . . . . . . . . . . . . . . . 1,493 296,689Vulcan Materials Co. . . . . . . . . . . . . . . . . . . . . . . . . . . . . . . . . . . . . . . 2,738 303,370
600,059Consumer Finance — 0.8%Ally Financial Inc. . . . . . . . . . . . . . . . . . . . . . . . . . . . . . . . . . . . . . . . . . 11,438 307,453American Express Co. . . . . . . . . . . . . . . . . . . . . . . . . . . . . . . . . . . . . 2,918 309,250Capital One Financial Corp. . . . . . . . . . . . . . . . . . . . . . . . . . . . . . . . 3,082 305,395Discover Financial Services . . . . . . . . . . . . . . . . . . . . . . . . . . . . . . . 3,934 307,324
Security Shares Value
Consumer Finance (continued)Synchrony Financial . . . . . . . . . . . . . . . . . . . . . . . . . . . . . . . . . . . . . . 9,770 $ 309,416
1,538,838Containers & Packaging — 1.1%Avery Dennison Corp. . . . . . . . . . . . . . . . . . . . . . . . . . . . . . . . . . . . . . 2,924 307,546Ball Corp.. . . . . . . . . . . . . . . . . . . . . . . . . . . . . . . . . . . . . . . . . . . . . . . . . 7,431 311,210Crown Holdings Inc.(a). . . . . . . . . . . . . . . . . . . . . . . . . . . . . . . . . . . . . 7,211 308,703International Paper Co.. . . . . . . . . . . . . . . . . . . . . . . . . . . . . . . . . . . . 5,921 302,800Packaging Corp. of America . . . . . . . . . . . . . . . . . . . . . . . . . . . . . . . 2,766 304,039Sealed Air Corp. . . . . . . . . . . . . . . . . . . . . . . . . . . . . . . . . . . . . . . . . . . 7,804 313,018WestRock Co. . . . . . . . . . . . . . . . . . . . . . . . . . . . . . . . . . . . . . . . . . . . . 5,544 305,364
2,152,680Distributors — 0.3%Genuine Parts Co. . . . . . . . . . . . . . . . . . . . . . . . . . . . . . . . . . . . . . . . . 3,115 311,033LKQ Corp.(a) . . . . . . . . . . . . . . . . . . . . . . . . . . . . . . . . . . . . . . . . . . . . . . 9,133 315,271
626,304Diversified Consumer Services — 0.2%H&R Block Inc. . . . . . . . . . . . . . . . . . . . . . . . . . . . . . . . . . . . . . . . . . . . 11,691 316,358
Diversified Financial Services — 0.5%Berkshire Hathaway Inc., Class B(a) . . . . . . . . . . . . . . . . . . . . . . . . 1,480 308,906Jefferies Financial Group Inc. . . . . . . . . . . . . . . . . . . . . . . . . . . . . . . 13,023 302,394Voya Financial Inc. . . . . . . . . . . . . . . . . . . . . . . . . . . . . . . . . . . . . . . . . 6,127 306,779
918,079Diversified Telecommunication Services — 0.6%AT&T Inc.. . . . . . . . . . . . . . . . . . . . . . . . . . . . . . . . . . . . . . . . . . . . . . . . . 9,473 302,568CenturyLink Inc. . . . . . . . . . . . . . . . . . . . . . . . . . . . . . . . . . . . . . . . . . . 13,598 290,453Verizon Communications Inc. . . . . . . . . . . . . . . . . . . . . . . . . . . . . . . 5,670 308,278Zayo Group Holdings Inc.(a) . . . . . . . . . . . . . . . . . . . . . . . . . . . . . . . 8,880 307,781
1,209,080Electric Utilities — 2.6%Alliant Energy Corp.. . . . . . . . . . . . . . . . . . . . . . . . . . . . . . . . . . . . . . . 7,271 311,490American Electric Power Co. Inc. . . . . . . . . . . . . . . . . . . . . . . . . . . 4,385 314,536Duke Energy Corp.. . . . . . . . . . . . . . . . . . . . . . . . . . . . . . . . . . . . . . . . 3,859 313,505Edison International . . . . . . . . . . . . . . . . . . . . . . . . . . . . . . . . . . . . . . . 4,602 302,489Entergy Corp.. . . . . . . . . . . . . . . . . . . . . . . . . . . . . . . . . . . . . . . . . . . . . 3,722 311,122Evergy Inc. . . . . . . . . . . . . . . . . . . . . . . . . . . . . . . . . . . . . . . . . . . . . . . . 5,460 311,493Eversource Energy. . . . . . . . . . . . . . . . . . . . . . . . . . . . . . . . . . . . . . . . 4,999 312,087Exelon Corp. . . . . . . . . . . . . . . . . . . . . . . . . . . . . . . . . . . . . . . . . . . . . . 7,125 311,434FirstEnergy Corp. . . . . . . . . . . . . . . . . . . . . . . . . . . . . . . . . . . . . . . . . . 8,442 315,562NextEra Energy Inc.. . . . . . . . . . . . . . . . . . . . . . . . . . . . . . . . . . . . . . . 1,816 308,902OGE Energy Corp. . . . . . . . . . . . . . . . . . . . . . . . . . . . . . . . . . . . . . . . . 8,428 310,403PG&E Corp. . . . . . . . . . . . . . . . . . . . . . . . . . . . . . . . . . . . . . . . . . . . . . . 7,131 329,310Pinnacle West Capital Corp. . . . . . . . . . . . . . . . . . . . . . . . . . . . . . . . 3,862 303,360PPL Corp. . . . . . . . . . . . . . . . . . . . . . . . . . . . . . . . . . . . . . . . . . . . . . . . . 10,567 314,263Southern Co. (The) . . . . . . . . . . . . . . . . . . . . . . . . . . . . . . . . . . . . . . . 6,968 305,059Xcel Energy Inc. . . . . . . . . . . . . . . . . . . . . . . . . . . . . . . . . . . . . . . . . . . 6,568 315,592
4,990,607Electrical Equipment — 1.0%Acuity Brands Inc.(b). . . . . . . . . . . . . . . . . . . . . . . . . . . . . . . . . . . . . . . 2,026 309,654AMETEK Inc. . . . . . . . . . . . . . . . . . . . . . . . . . . . . . . . . . . . . . . . . . . . . . 4,036 310,611Eaton Corp. PLC. . . . . . . . . . . . . . . . . . . . . . . . . . . . . . . . . . . . . . . . . . 3,743 311,193Emerson Electric Co.. . . . . . . . . . . . . . . . . . . . . . . . . . . . . . . . . . . . . . 4,070 312,291Rockwell Automation Inc.. . . . . . . . . . . . . . . . . . . . . . . . . . . . . . . . . . 1,758 318,128Sensata Technologies Holding PLC(a) . . . . . . . . . . . . . . . . . . . . . . 5,751 304,515
1,866,392Electronic Equipment, Instruments & Components — 1.9%Amphenol Corp., Class A. . . . . . . . . . . . . . . . . . . . . . . . . . . . . . . . . . 3,293 311,452Arrow Electronics Inc.(a) . . . . . . . . . . . . . . . . . . . . . . . . . . . . . . . . . . . 3,891 301,669
Schedule of Investments (continued)
August 31, 2018
iShares� MSCI USA Equal Weighted ETF(Percentages shown are based on Net Assets)
S C H E D U L E O F I N V E S T M E N T S 39
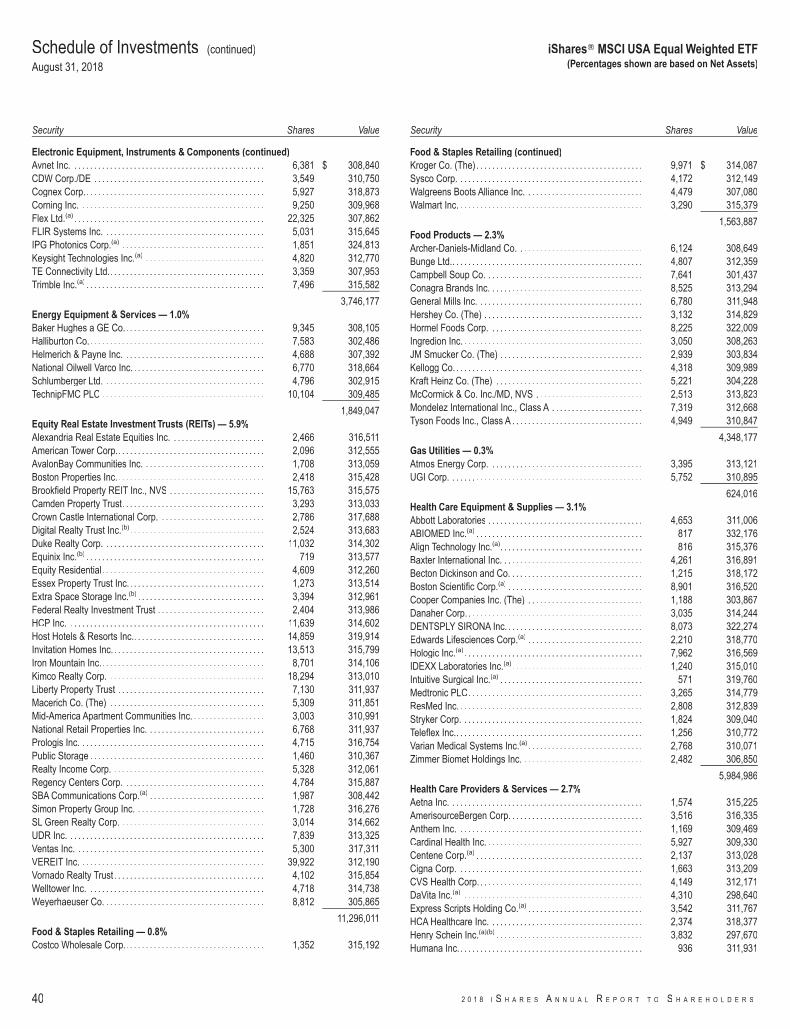
Security Shares Value
Electronic Equipment, Instruments & Components (continued)Avnet Inc. . . . . . . . . . . . . . . . . . . . . . . . . . . . . . . . . . . . . . . . . . . . . . . . . 6,381 $ 308,840CDW Corp./DE . . . . . . . . . . . . . . . . . . . . . . . . . . . . . . . . . . . . . . . . . . . 3,549 310,750Cognex Corp.. . . . . . . . . . . . . . . . . . . . . . . . . . . . . . . . . . . . . . . . . . . . . 5,927 318,873Corning Inc. . . . . . . . . . . . . . . . . . . . . . . . . . . . . . . . . . . . . . . . . . . . . . . 9,250 309,968Flex Ltd.(a) . . . . . . . . . . . . . . . . . . . . . . . . . . . . . . . . . . . . . . . . . . . . . . . . 22,325 307,862FLIR Systems Inc. . . . . . . . . . . . . . . . . . . . . . . . . . . . . . . . . . . . . . . . . 5,031 315,645IPG Photonics Corp.(a) . . . . . . . . . . . . . . . . . . . . . . . . . . . . . . . . . . . . 1,851 324,813Keysight Technologies Inc.(a) . . . . . . . . . . . . . . . . . . . . . . . . . . . . . . 4,820 312,770TE Connectivity Ltd.. . . . . . . . . . . . . . . . . . . . . . . . . . . . . . . . . . . . . . . 3,359 307,953Trimble Inc.(a) . . . . . . . . . . . . . . . . . . . . . . . . . . . . . . . . . . . . . . . . . . . . . 7,496 315,582
3,746,177Energy Equipment & Services — 1.0%Baker Hughes a GE Co.. . . . . . . . . . . . . . . . . . . . . . . . . . . . . . . . . . . 9,345 308,105Halliburton Co.. . . . . . . . . . . . . . . . . . . . . . . . . . . . . . . . . . . . . . . . . . . . 7,583 302,486Helmerich & Payne Inc. . . . . . . . . . . . . . . . . . . . . . . . . . . . . . . . . . . . 4,688 307,392National Oilwell Varco Inc. . . . . . . . . . . . . . . . . . . . . . . . . . . . . . . . . . 6,770 318,664Schlumberger Ltd. . . . . . . . . . . . . . . . . . . . . . . . . . . . . . . . . . . . . . . . . 4,796 302,915TechnipFMC PLC . . . . . . . . . . . . . . . . . . . . . . . . . . . . . . . . . . . . . . . . . 10,104 309,485
1,849,047Equity Real Estate Investment Trusts (REITs) — 5.9%Alexandria Real Estate Equities Inc. . . . . . . . . . . . . . . . . . . . . . . . 2,466 316,511American Tower Corp.. . . . . . . . . . . . . . . . . . . . . . . . . . . . . . . . . . . . . 2,096 312,555AvalonBay Communities Inc. . . . . . . . . . . . . . . . . . . . . . . . . . . . . . . 1,708 313,059Boston Properties Inc.. . . . . . . . . . . . . . . . . . . . . . . . . . . . . . . . . . . . . 2,418 315,428Brookfield Property REIT Inc., NVS . . . . . . . . . . . . . . . . . . . . . . . . 15,763 315,575Camden Property Trust. . . . . . . . . . . . . . . . . . . . . . . . . . . . . . . . . . . . 3,293 313,033Crown Castle International Corp. . . . . . . . . . . . . . . . . . . . . . . . . . . 2,786 317,688Digital Realty Trust Inc.(b). . . . . . . . . . . . . . . . . . . . . . . . . . . . . . . . . . 2,524 313,683Duke Realty Corp. . . . . . . . . . . . . . . . . . . . . . . . . . . . . . . . . . . . . . . . . 11,032 314,302Equinix Inc.(b) . . . . . . . . . . . . . . . . . . . . . . . . . . . . . . . . . . . . . . . . . . . . . 719 313,577Equity Residential. . . . . . . . . . . . . . . . . . . . . . . . . . . . . . . . . . . . . . . . . 4,609 312,260Essex Property Trust Inc. . . . . . . . . . . . . . . . . . . . . . . . . . . . . . . . . . . 1,273 313,514Extra Space Storage Inc.(b) . . . . . . . . . . . . . . . . . . . . . . . . . . . . . . . . 3,394 312,961Federal Realty Investment Trust . . . . . . . . . . . . . . . . . . . . . . . . . . . 2,404 313,986HCP Inc. . . . . . . . . . . . . . . . . . . . . . . . . . . . . . . . . . . . . . . . . . . . . . . . . . 11,639 314,602Host Hotels & Resorts Inc.. . . . . . . . . . . . . . . . . . . . . . . . . . . . . . . . . 14,859 319,914Invitation Homes Inc.. . . . . . . . . . . . . . . . . . . . . . . . . . . . . . . . . . . . . . 13,513 315,799Iron Mountain Inc.. . . . . . . . . . . . . . . . . . . . . . . . . . . . . . . . . . . . . . . . . 8,701 314,106Kimco Realty Corp. . . . . . . . . . . . . . . . . . . . . . . . . . . . . . . . . . . . . . . . 18,294 313,010Liberty Property Trust . . . . . . . . . . . . . . . . . . . . . . . . . . . . . . . . . . . . . 7,130 311,937Macerich Co. (The) . . . . . . . . . . . . . . . . . . . . . . . . . . . . . . . . . . . . . . . 5,309 311,851Mid-America Apartment Communities Inc. . . . . . . . . . . . . . . . . . . 3,003 310,991National Retail Properties Inc. . . . . . . . . . . . . . . . . . . . . . . . . . . . . . 6,768 311,937Prologis Inc. . . . . . . . . . . . . . . . . . . . . . . . . . . . . . . . . . . . . . . . . . . . . . . 4,715 316,754Public Storage . . . . . . . . . . . . . . . . . . . . . . . . . . . . . . . . . . . . . . . . . . . . 1,460 310,367Realty Income Corp. . . . . . . . . . . . . . . . . . . . . . . . . . . . . . . . . . . . . . . 5,328 312,061Regency Centers Corp. . . . . . . . . . . . . . . . . . . . . . . . . . . . . . . . . . . . 4,784 315,887SBA Communications Corp.(a) . . . . . . . . . . . . . . . . . . . . . . . . . . . . . 1,987 308,442Simon Property Group Inc. . . . . . . . . . . . . . . . . . . . . . . . . . . . . . . . . 1,728 316,276SL Green Realty Corp. . . . . . . . . . . . . . . . . . . . . . . . . . . . . . . . . . . . . 3,014 314,662UDR Inc. . . . . . . . . . . . . . . . . . . . . . . . . . . . . . . . . . . . . . . . . . . . . . . . . . 7,839 313,325Ventas Inc. . . . . . . . . . . . . . . . . . . . . . . . . . . . . . . . . . . . . . . . . . . . . . . . 5,300 317,311VEREIT Inc. . . . . . . . . . . . . . . . . . . . . . . . . . . . . . . . . . . . . . . . . . . . . . . 39,922 312,190Vornado Realty Trust. . . . . . . . . . . . . . . . . . . . . . . . . . . . . . . . . . . . . . 4,102 315,854Welltower Inc. . . . . . . . . . . . . . . . . . . . . . . . . . . . . . . . . . . . . . . . . . . . . 4,718 314,738Weyerhaeuser Co. . . . . . . . . . . . . . . . . . . . . . . . . . . . . . . . . . . . . . . . . 8,812 305,865
11,296,011Food & Staples Retailing — 0.8%Costco Wholesale Corp.. . . . . . . . . . . . . . . . . . . . . . . . . . . . . . . . . . . 1,352 315,192
Security Shares Value
Food & Staples Retailing (continued)Kroger Co. (The) . . . . . . . . . . . . . . . . . . . . . . . . . . . . . . . . . . . . . . . . . . 9,971 $ 314,087Sysco Corp. . . . . . . . . . . . . . . . . . . . . . . . . . . . . . . . . . . . . . . . . . . . . . . 4,172 312,149Walgreens Boots Alliance Inc. . . . . . . . . . . . . . . . . . . . . . . . . . . . . . 4,479 307,080Walmart Inc. . . . . . . . . . . . . . . . . . . . . . . . . . . . . . . . . . . . . . . . . . . . . . . 3,290 315,379
1,563,887Food Products — 2.3%Archer-Daniels-Midland Co. . . . . . . . . . . . . . . . . . . . . . . . . . . . . . . . 6,124 308,649Bunge Ltd.. . . . . . . . . . . . . . . . . . . . . . . . . . . . . . . . . . . . . . . . . . . . . . . . 4,807 312,359Campbell Soup Co. . . . . . . . . . . . . . . . . . . . . . . . . . . . . . . . . . . . . . . . 7,641 301,437Conagra Brands Inc. . . . . . . . . . . . . . . . . . . . . . . . . . . . . . . . . . . . . . . 8,525 313,294General Mills Inc. . . . . . . . . . . . . . . . . . . . . . . . . . . . . . . . . . . . . . . . . . 6,780 311,948Hershey Co. (The) . . . . . . . . . . . . . . . . . . . . . . . . . . . . . . . . . . . . . . . . 3,132 314,829Hormel Foods Corp. . . . . . . . . . . . . . . . . . . . . . . . . . . . . . . . . . . . . . . 8,225 322,009Ingredion Inc. . . . . . . . . . . . . . . . . . . . . . . . . . . . . . . . . . . . . . . . . . . . . . 3,050 308,263JM Smucker Co. (The) . . . . . . . . . . . . . . . . . . . . . . . . . . . . . . . . . . . . 2,939 303,834Kellogg Co. . . . . . . . . . . . . . . . . . . . . . . . . . . . . . . . . . . . . . . . . . . . . . . . 4,318 309,989Kraft Heinz Co. (The) . . . . . . . . . . . . . . . . . . . . . . . . . . . . . . . . . . . . . 5,221 304,228McCormick & Co. Inc./MD, NVS . . . . . . . . . . . . . . . . . . . . . . . . . . . 2,513 313,823Mondelez International Inc., Class A . . . . . . . . . . . . . . . . . . . . . . . 7,319 312,668Tyson Foods Inc., Class A . . . . . . . . . . . . . . . . . . . . . . . . . . . . . . . . . 4,949 310,847
4,348,177Gas Utilities — 0.3%Atmos Energy Corp. . . . . . . . . . . . . . . . . . . . . . . . . . . . . . . . . . . . . . . 3,395 313,121UGI Corp. . . . . . . . . . . . . . . . . . . . . . . . . . . . . . . . . . . . . . . . . . . . . . . . . 5,752 310,895
624,016Health Care Equipment & Supplies — 3.1%Abbott Laboratories . . . . . . . . . . . . . . . . . . . . . . . . . . . . . . . . . . . . . . . 4,653 311,006ABIOMED Inc.(a) . . . . . . . . . . . . . . . . . . . . . . . . . . . . . . . . . . . . . . . . . . 817 332,176Align Technology Inc.(a). . . . . . . . . . . . . . . . . . . . . . . . . . . . . . . . . . . . 816 315,376Baxter International Inc. . . . . . . . . . . . . . . . . . . . . . . . . . . . . . . . . . . . 4,261 316,891Becton Dickinson and Co. . . . . . . . . . . . . . . . . . . . . . . . . . . . . . . . . . 1,215 318,172Boston Scientific Corp.(a) . . . . . . . . . . . . . . . . . . . . . . . . . . . . . . . . . . 8,901 316,520Cooper Companies Inc. (The) . . . . . . . . . . . . . . . . . . . . . . . . . . . . . 1,188 303,867Danaher Corp. . . . . . . . . . . . . . . . . . . . . . . . . . . . . . . . . . . . . . . . . . . . . 3,035 314,244DENTSPLY SIRONA Inc. . . . . . . . . . . . . . . . . . . . . . . . . . . . . . . . . . . 8,073 322,274Edwards Lifesciences Corp.(a) . . . . . . . . . . . . . . . . . . . . . . . . . . . . . 2,210 318,770Hologic Inc.(a) . . . . . . . . . . . . . . . . . . . . . . . . . . . . . . . . . . . . . . . . . . . . . 7,962 316,569IDEXX Laboratories Inc.(a). . . . . . . . . . . . . . . . . . . . . . . . . . . . . . . . . 1,240 315,010Intuitive Surgical Inc.(a) . . . . . . . . . . . . . . . . . . . . . . . . . . . . . . . . . . . . 571 319,760Medtronic PLC. . . . . . . . . . . . . . . . . . . . . . . . . . . . . . . . . . . . . . . . . . . . 3,265 314,779ResMed Inc. . . . . . . . . . . . . . . . . . . . . . . . . . . . . . . . . . . . . . . . . . . . . . . 2,808 312,839Stryker Corp. . . . . . . . . . . . . . . . . . . . . . . . . . . . . . . . . . . . . . . . . . . . . . 1,824 309,040Teleflex Inc.. . . . . . . . . . . . . . . . . . . . . . . . . . . . . . . . . . . . . . . . . . . . . . . 1,256 310,772Varian Medical Systems Inc.(a) . . . . . . . . . . . . . . . . . . . . . . . . . . . . . 2,768 310,071Zimmer Biomet Holdings Inc. . . . . . . . . . . . . . . . . . . . . . . . . . . . . . . 2,482 306,850
5,984,986Health Care Providers & Services — 2.7%Aetna Inc. . . . . . . . . . . . . . . . . . . . . . . . . . . . . . . . . . . . . . . . . . . . . . . . . 1,574 315,225AmerisourceBergen Corp. . . . . . . . . . . . . . . . . . . . . . . . . . . . . . . . . . 3,516 316,335Anthem Inc. . . . . . . . . . . . . . . . . . . . . . . . . . . . . . . . . . . . . . . . . . . . . . . 1,169 309,469Cardinal Health Inc. . . . . . . . . . . . . . . . . . . . . . . . . . . . . . . . . . . . . . . . 5,927 309,330Centene Corp.(a) . . . . . . . . . . . . . . . . . . . . . . . . . . . . . . . . . . . . . . . . . . 2,137 313,028Cigna Corp. . . . . . . . . . . . . . . . . . . . . . . . . . . . . . . . . . . . . . . . . . . . . . . 1,663 313,209CVS Health Corp. . . . . . . . . . . . . . . . . . . . . . . . . . . . . . . . . . . . . . . . . . 4,149 312,171DaVita Inc.(a) . . . . . . . . . . . . . . . . . . . . . . . . . . . . . . . . . . . . . . . . . . . . . 4,310 298,640Express Scripts Holding Co.(a) . . . . . . . . . . . . . . . . . . . . . . . . . . . . . 3,542 311,767HCA Healthcare Inc. . . . . . . . . . . . . . . . . . . . . . . . . . . . . . . . . . . . . . . 2,374 318,377Henry Schein Inc.(a)(b) . . . . . . . . . . . . . . . . . . . . . . . . . . . . . . . . . . . . . 3,832 297,670Humana Inc. . . . . . . . . . . . . . . . . . . . . . . . . . . . . . . . . . . . . . . . . . . . . . . 936 311,931
Schedule of Investments (continued)
August 31, 2018
iShares� MSCI USA Equal Weighted ETF(Percentages shown are based on Net Assets)
40 2 0 1 8 I S H A R E S A N N U A L R E P O R T T O S H A R E H O L D E R S
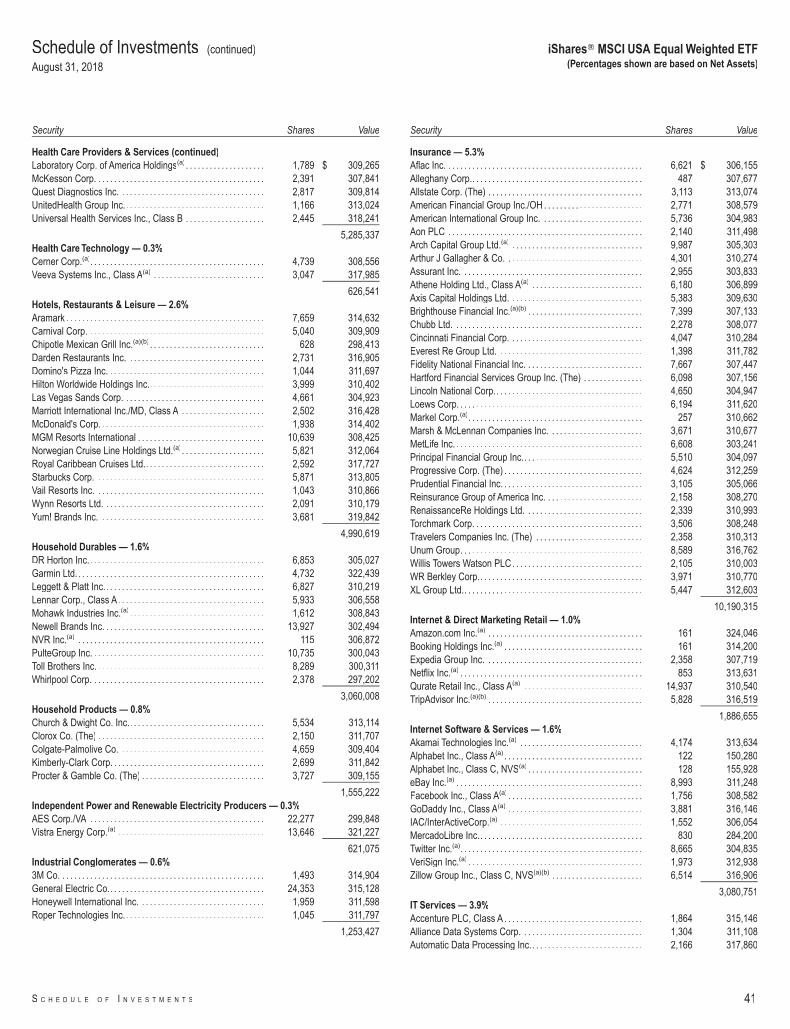
Security Shares Value
Health Care Providers & Services (continued)Laboratory Corp. of America Holdings(a). . . . . . . . . . . . . . . . . . . . 1,789 $ 309,265McKesson Corp. . . . . . . . . . . . . . . . . . . . . . . . . . . . . . . . . . . . . . . . . . . 2,391 307,841Quest Diagnostics Inc. . . . . . . . . . . . . . . . . . . . . . . . . . . . . . . . . . . . . 2,817 309,814UnitedHealth Group Inc.. . . . . . . . . . . . . . . . . . . . . . . . . . . . . . . . . . . 1,166 313,024Universal Health Services Inc., Class B . . . . . . . . . . . . . . . . . . . . 2,445 318,241
5,285,337Health Care Technology — 0.3%Cerner Corp.(a). . . . . . . . . . . . . . . . . . . . . . . . . . . . . . . . . . . . . . . . . . . . 4,739 308,556Veeva Systems Inc., Class A(a) . . . . . . . . . . . . . . . . . . . . . . . . . . . . 3,047 317,985
626,541Hotels, Restaurants & Leisure — 2.6%Aramark . . . . . . . . . . . . . . . . . . . . . . . . . . . . . . . . . . . . . . . . . . . . . . . . . . 7,659 314,632Carnival Corp. . . . . . . . . . . . . . . . . . . . . . . . . . . . . . . . . . . . . . . . . . . . . 5,040 309,909Chipotle Mexican Grill Inc.(a)(b) . . . . . . . . . . . . . . . . . . . . . . . . . . . . . 628 298,413Darden Restaurants Inc. . . . . . . . . . . . . . . . . . . . . . . . . . . . . . . . . . . 2,731 316,905Domino's Pizza Inc. . . . . . . . . . . . . . . . . . . . . . . . . . . . . . . . . . . . . . . . 1,044 311,697Hilton Worldwide Holdings Inc.. . . . . . . . . . . . . . . . . . . . . . . . . . . . . 3,999 310,402Las Vegas Sands Corp. . . . . . . . . . . . . . . . . . . . . . . . . . . . . . . . . . . . 4,661 304,923Marriott International Inc./MD, Class A . . . . . . . . . . . . . . . . . . . . . 2,502 316,428McDonald's Corp. . . . . . . . . . . . . . . . . . . . . . . . . . . . . . . . . . . . . . . . . . 1,938 314,402MGM Resorts International . . . . . . . . . . . . . . . . . . . . . . . . . . . . . . . . 10,639 308,425Norwegian Cruise Line Holdings Ltd.(a). . . . . . . . . . . . . . . . . . . . . 5,821 312,064Royal Caribbean Cruises Ltd.. . . . . . . . . . . . . . . . . . . . . . . . . . . . . . 2,592 317,727Starbucks Corp. . . . . . . . . . . . . . . . . . . . . . . . . . . . . . . . . . . . . . . . . . . 5,871 313,805Vail Resorts Inc. . . . . . . . . . . . . . . . . . . . . . . . . . . . . . . . . . . . . . . . . . . 1,043 310,866Wynn Resorts Ltd. . . . . . . . . . . . . . . . . . . . . . . . . . . . . . . . . . . . . . . . . 2,091 310,179Yum! Brands Inc. . . . . . . . . . . . . . . . . . . . . . . . . . . . . . . . . . . . . . . . . . 3,681 319,842
4,990,619Household Durables — 1.6%DR Horton Inc.. . . . . . . . . . . . . . . . . . . . . . . . . . . . . . . . . . . . . . . . . . . . 6,853 305,027Garmin Ltd.. . . . . . . . . . . . . . . . . . . . . . . . . . . . . . . . . . . . . . . . . . . . . . . 4,732 322,439Leggett & Platt Inc.. . . . . . . . . . . . . . . . . . . . . . . . . . . . . . . . . . . . . . . . 6,827 310,219Lennar Corp., Class A. . . . . . . . . . . . . . . . . . . . . . . . . . . . . . . . . . . . . 5,933 306,558Mohawk Industries Inc.(a) . . . . . . . . . . . . . . . . . . . . . . . . . . . . . . . . . . 1,612 308,843Newell Brands Inc. . . . . . . . . . . . . . . . . . . . . . . . . . . . . . . . . . . . . . . . . 13,927 302,494NVR Inc.(a) . . . . . . . . . . . . . . . . . . . . . . . . . . . . . . . . . . . . . . . . . . . . . . . 115 306,872PulteGroup Inc. . . . . . . . . . . . . . . . . . . . . . . . . . . . . . . . . . . . . . . . . . . . 10,735 300,043Toll Brothers Inc. . . . . . . . . . . . . . . . . . . . . . . . . . . . . . . . . . . . . . . . . . . 8,289 300,311Whirlpool Corp. . . . . . . . . . . . . . . . . . . . . . . . . . . . . . . . . . . . . . . . . . . . 2,378 297,202
3,060,008Household Products — 0.8%Church & Dwight Co. Inc.. . . . . . . . . . . . . . . . . . . . . . . . . . . . . . . . . . 5,534 313,114Clorox Co. (The) . . . . . . . . . . . . . . . . . . . . . . . . . . . . . . . . . . . . . . . . . . 2,150 311,707Colgate-Palmolive Co. . . . . . . . . . . . . . . . . . . . . . . . . . . . . . . . . . . . . 4,659 309,404Kimberly-Clark Corp. . . . . . . . . . . . . . . . . . . . . . . . . . . . . . . . . . . . . . . 2,699 311,842Procter & Gamble Co. (The) . . . . . . . . . . . . . . . . . . . . . . . . . . . . . . . 3,727 309,155
1,555,222Independent Power and Renewable Electricity Producers — 0.3%AES Corp./VA . . . . . . . . . . . . . . . . . . . . . . . . . . . . . . . . . . . . . . . . . . . . 22,277 299,848Vistra Energy Corp.(a) . . . . . . . . . . . . . . . . . . . . . . . . . . . . . . . . . . . . . 13,646 321,227
621,075Industrial Conglomerates — 0.6%3M Co. . . . . . . . . . . . . . . . . . . . . . . . . . . . . . . . . . . . . . . . . . . . . . . . . . . . 1,493 314,904General Electric Co.. . . . . . . . . . . . . . . . . . . . . . . . . . . . . . . . . . . . . . . 24,353 315,128Honeywell International Inc. . . . . . . . . . . . . . . . . . . . . . . . . . . . . . . . 1,959 311,598Roper Technologies Inc.. . . . . . . . . . . . . . . . . . . . . . . . . . . . . . . . . . . 1,045 311,797
1,253,427
Security Shares Value
Insurance — 5.3%Aflac Inc. . . . . . . . . . . . . . . . . . . . . . . . . . . . . . . . . . . . . . . . . . . . . . . . . . 6,621 $ 306,155Alleghany Corp.. . . . . . . . . . . . . . . . . . . . . . . . . . . . . . . . . . . . . . . . . . . 487 307,677Allstate Corp. (The) . . . . . . . . . . . . . . . . . . . . . . . . . . . . . . . . . . . . . . . 3,113 313,074American Financial Group Inc./OH . . . . . . . . . . . . . . . . . . . . . . . . . 2,771 308,579American International Group Inc. . . . . . . . . . . . . . . . . . . . . . . . . . 5,736 304,983Aon PLC . . . . . . . . . . . . . . . . . . . . . . . . . . . . . . . . . . . . . . . . . . . . . . . . . 2,140 311,498Arch Capital Group Ltd.(a) . . . . . . . . . . . . . . . . . . . . . . . . . . . . . . . . . 9,987 305,303Arthur J Gallagher & Co. . . . . . . . . . . . . . . . . . . . . . . . . . . . . . . . . . . 4,301 310,274Assurant Inc. . . . . . . . . . . . . . . . . . . . . . . . . . . . . . . . . . . . . . . . . . . . . . 2,955 303,833Athene Holding Ltd., Class A(a) . . . . . . . . . . . . . . . . . . . . . . . . . . . . 6,180 306,899Axis Capital Holdings Ltd. . . . . . . . . . . . . . . . . . . . . . . . . . . . . . . . . . 5,383 309,630Brighthouse Financial Inc.(a)(b) . . . . . . . . . . . . . . . . . . . . . . . . . . . . . 7,399 307,133Chubb Ltd. . . . . . . . . . . . . . . . . . . . . . . . . . . . . . . . . . . . . . . . . . . . . . . . 2,278 308,077Cincinnati Financial Corp. . . . . . . . . . . . . . . . . . . . . . . . . . . . . . . . . . 4,047 310,284Everest Re Group Ltd. . . . . . . . . . . . . . . . . . . . . . . . . . . . . . . . . . . . . 1,398 311,782Fidelity National Financial Inc. . . . . . . . . . . . . . . . . . . . . . . . . . . . . . 7,667 307,447Hartford Financial Services Group Inc. (The) . . . . . . . . . . . . . . . 6,098 307,156Lincoln National Corp.. . . . . . . . . . . . . . . . . . . . . . . . . . . . . . . . . . . . . 4,650 304,947Loews Corp. . . . . . . . . . . . . . . . . . . . . . . . . . . . . . . . . . . . . . . . . . . . . . . 6,194 311,620Markel Corp.(a). . . . . . . . . . . . . . . . . . . . . . . . . . . . . . . . . . . . . . . . . . . . 257 310,662Marsh & McLennan Companies Inc. . . . . . . . . . . . . . . . . . . . . . . . 3,671 310,677MetLife Inc. . . . . . . . . . . . . . . . . . . . . . . . . . . . . . . . . . . . . . . . . . . . . . . . 6,608 303,241Principal Financial Group Inc.. . . . . . . . . . . . . . . . . . . . . . . . . . . . . . 5,510 304,097Progressive Corp. (The) . . . . . . . . . . . . . . . . . . . . . . . . . . . . . . . . . . . 4,624 312,259Prudential Financial Inc. . . . . . . . . . . . . . . . . . . . . . . . . . . . . . . . . . . . 3,105 305,066Reinsurance Group of America Inc. . . . . . . . . . . . . . . . . . . . . . . . . 2,158 308,270RenaissanceRe Holdings Ltd. . . . . . . . . . . . . . . . . . . . . . . . . . . . . . 2,339 310,993Torchmark Corp. . . . . . . . . . . . . . . . . . . . . . . . . . . . . . . . . . . . . . . . . . . 3,506 308,248Travelers Companies Inc. (The) . . . . . . . . . . . . . . . . . . . . . . . . . . . 2,358 310,313Unum Group. . . . . . . . . . . . . . . . . . . . . . . . . . . . . . . . . . . . . . . . . . . . . . 8,589 316,762Willis Towers Watson PLC. . . . . . . . . . . . . . . . . . . . . . . . . . . . . . . . . 2,105 310,003WR Berkley Corp.. . . . . . . . . . . . . . . . . . . . . . . . . . . . . . . . . . . . . . . . . 3,971 310,770XL Group Ltd.. . . . . . . . . . . . . . . . . . . . . . . . . . . . . . . . . . . . . . . . . . . . . 5,447 312,603
10,190,315Internet & Direct Marketing Retail — 1.0%Amazon.com Inc.(a) . . . . . . . . . . . . . . . . . . . . . . . . . . . . . . . . . . . . . . . 161 324,046Booking Holdings Inc.(a) . . . . . . . . . . . . . . . . . . . . . . . . . . . . . . . . . . . 161 314,200Expedia Group Inc. . . . . . . . . . . . . . . . . . . . . . . . . . . . . . . . . . . . . . . . 2,358 307,719Netflix Inc.(a) . . . . . . . . . . . . . . . . . . . . . . . . . . . . . . . . . . . . . . . . . . . . . . 853 313,631Qurate Retail Inc., Class A(a) . . . . . . . . . . . . . . . . . . . . . . . . . . . . . . 14,937 310,540TripAdvisor Inc.(a)(b) . . . . . . . . . . . . . . . . . . . . . . . . . . . . . . . . . . . . . . . 5,828 316,519
1,886,655Internet Software & Services — 1.6%Akamai Technologies Inc.(a) . . . . . . . . . . . . . . . . . . . . . . . . . . . . . . . 4,174 313,634Alphabet Inc., Class A(a) . . . . . . . . . . . . . . . . . . . . . . . . . . . . . . . . . . . 122 150,280Alphabet Inc., Class C, NVS(a) . . . . . . . . . . . . . . . . . . . . . . . . . . . . . 128 155,928eBay Inc.(a) . . . . . . . . . . . . . . . . . . . . . . . . . . . . . . . . . . . . . . . . . . . . . . . 8,993 311,248Facebook Inc., Class A(a) . . . . . . . . . . . . . . . . . . . . . . . . . . . . . . . . . . 1,756 308,582GoDaddy Inc., Class A(a) . . . . . . . . . . . . . . . . . . . . . . . . . . . . . . . . . . 3,881 316,146IAC/InterActiveCorp.(a) . . . . . . . . . . . . . . . . . . . . . . . . . . . . . . . . . . . . 1,552 306,054MercadoLibre Inc.. . . . . . . . . . . . . . . . . . . . . . . . . . . . . . . . . . . . . . . . . 830 284,200Twitter Inc.(a). . . . . . . . . . . . . . . . . . . . . . . . . . . . . . . . . . . . . . . . . . . . . . 8,665 304,835VeriSign Inc.(a) . . . . . . . . . . . . . . . . . . . . . . . . . . . . . . . . . . . . . . . . . . . . 1,973 312,938Zillow Group Inc., Class C, NVS(a)(b) . . . . . . . . . . . . . . . . . . . . . . . 6,514 316,906
3,080,751IT Services — 3.9%Accenture PLC, Class A . . . . . . . . . . . . . . . . . . . . . . . . . . . . . . . . . . . 1,864 315,146Alliance Data Systems Corp. . . . . . . . . . . . . . . . . . . . . . . . . . . . . . . 1,304 311,108Automatic Data Processing Inc.. . . . . . . . . . . . . . . . . . . . . . . . . . . . 2,166 317,860
Schedule of Investments (continued)
August 31, 2018
iShares� MSCI USA Equal Weighted ETF(Percentages shown are based on Net Assets)
S C H E D U L E O F I N V E S T M E N T S 41
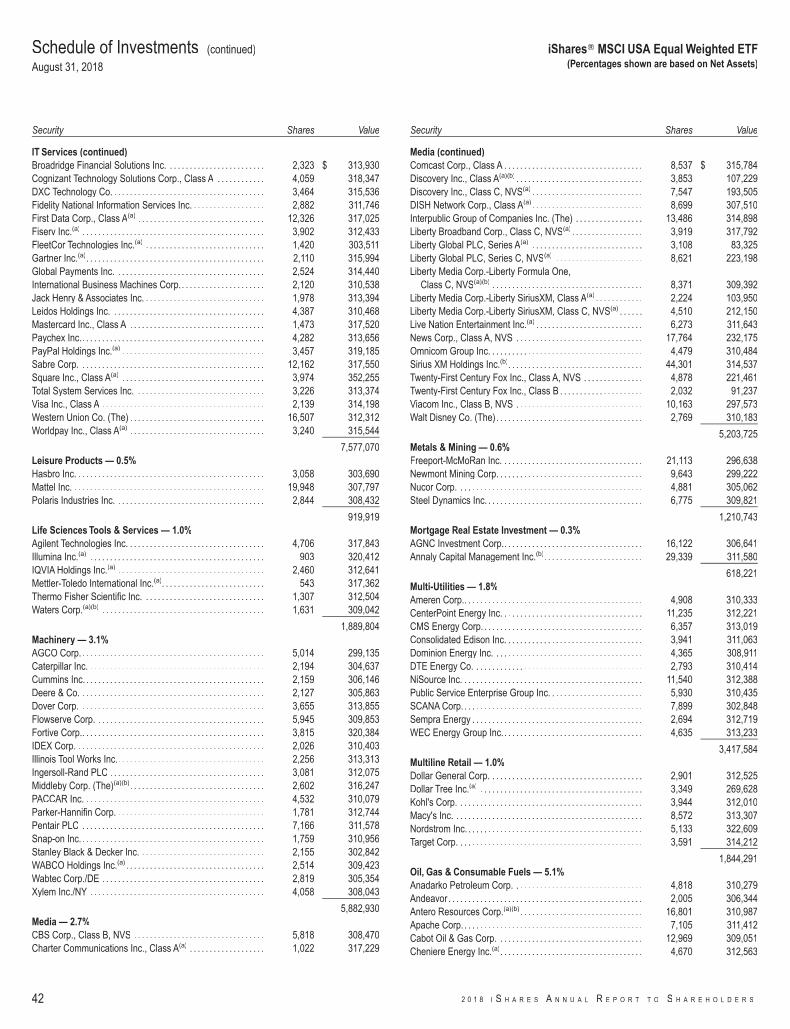
Security Shares Value
IT Services (continued)Broadridge Financial Solutions Inc. . . . . . . . . . . . . . . . . . . . . . . . . 2,323 $ 313,930Cognizant Technology Solutions Corp., Class A . . . . . . . . . . . . 4,059 318,347DXC Technology Co. . . . . . . . . . . . . . . . . . . . . . . . . . . . . . . . . . . . . . . 3,464 315,536Fidelity National Information Services Inc. . . . . . . . . . . . . . . . . . . 2,882 311,746First Data Corp., Class A(a) . . . . . . . . . . . . . . . . . . . . . . . . . . . . . . . . 12,326 317,025Fiserv Inc.(a) . . . . . . . . . . . . . . . . . . . . . . . . . . . . . . . . . . . . . . . . . . . . . . 3,902 312,433FleetCor Technologies Inc.(a) . . . . . . . . . . . . . . . . . . . . . . . . . . . . . . 1,420 303,511Gartner Inc.(a). . . . . . . . . . . . . . . . . . . . . . . . . . . . . . . . . . . . . . . . . . . . . 2,110 315,994Global Payments Inc. . . . . . . . . . . . . . . . . . . . . . . . . . . . . . . . . . . . . . 2,524 314,440International Business Machines Corp.. . . . . . . . . . . . . . . . . . . . . 2,120 310,538Jack Henry & Associates Inc. . . . . . . . . . . . . . . . . . . . . . . . . . . . . . . 1,978 313,394Leidos Holdings Inc. . . . . . . . . . . . . . . . . . . . . . . . . . . . . . . . . . . . . . . 4,387 310,468Mastercard Inc., Class A . . . . . . . . . . . . . . . . . . . . . . . . . . . . . . . . . . 1,473 317,520Paychex Inc.. . . . . . . . . . . . . . . . . . . . . . . . . . . . . . . . . . . . . . . . . . . . . . 4,282 313,656PayPal Holdings Inc.(a) . . . . . . . . . . . . . . . . . . . . . . . . . . . . . . . . . . . . 3,457 319,185Sabre Corp. . . . . . . . . . . . . . . . . . . . . . . . . . . . . . . . . . . . . . . . . . . . . . . 12,162 317,550Square Inc., Class A(a) . . . . . . . . . . . . . . . . . . . . . . . . . . . . . . . . . . . . 3,974 352,255Total System Services Inc. . . . . . . . . . . . . . . . . . . . . . . . . . . . . . . . . 3,226 313,374Visa Inc., Class A . . . . . . . . . . . . . . . . . . . . . . . . . . . . . . . . . . . . . . . . . 2,139 314,198Western Union Co. (The) . . . . . . . . . . . . . . . . . . . . . . . . . . . . . . . . . . 16,507 312,312Worldpay Inc., Class A(a) . . . . . . . . . . . . . . . . . . . . . . . . . . . . . . . . . . 3,240 315,544
7,577,070Leisure Products — 0.5%Hasbro Inc. . . . . . . . . . . . . . . . . . . . . . . . . . . . . . . . . . . . . . . . . . . . . . . . 3,058 303,690Mattel Inc. . . . . . . . . . . . . . . . . . . . . . . . . . . . . . . . . . . . . . . . . . . . . . . . . 19,948 307,797Polaris Industries Inc. . . . . . . . . . . . . . . . . . . . . . . . . . . . . . . . . . . . . . 2,844 308,432
919,919Life Sciences Tools & Services — 1.0%Agilent Technologies Inc. . . . . . . . . . . . . . . . . . . . . . . . . . . . . . . . . . . 4,706 317,843Illumina Inc.(a) . . . . . . . . . . . . . . . . . . . . . . . . . . . . . . . . . . . . . . . . . . . . 903 320,412IQVIA Holdings Inc.(a) . . . . . . . . . . . . . . . . . . . . . . . . . . . . . . . . . . . . . 2,460 312,641Mettler-Toledo International Inc.(a). . . . . . . . . . . . . . . . . . . . . . . . . . 543 317,362Thermo Fisher Scientific Inc. . . . . . . . . . . . . . . . . . . . . . . . . . . . . . . 1,307 312,504Waters Corp.(a)(b) . . . . . . . . . . . . . . . . . . . . . . . . . . . . . . . . . . . . . . . . . 1,631 309,042
1,889,804Machinery — 3.1%AGCO Corp. . . . . . . . . . . . . . . . . . . . . . . . . . . . . . . . . . . . . . . . . . . . . . . 5,014 299,135Caterpillar Inc. . . . . . . . . . . . . . . . . . . . . . . . . . . . . . . . . . . . . . . . . . . . . 2,194 304,637Cummins Inc. . . . . . . . . . . . . . . . . . . . . . . . . . . . . . . . . . . . . . . . . . . . . . 2,159 306,146Deere & Co. . . . . . . . . . . . . . . . . . . . . . . . . . . . . . . . . . . . . . . . . . . . . . . 2,127 305,863Dover Corp. . . . . . . . . . . . . . . . . . . . . . . . . . . . . . . . . . . . . . . . . . . . . . . 3,655 313,855Flowserve Corp. . . . . . . . . . . . . . . . . . . . . . . . . . . . . . . . . . . . . . . . . . . 5,945 309,853Fortive Corp.. . . . . . . . . . . . . . . . . . . . . . . . . . . . . . . . . . . . . . . . . . . . . . 3,815 320,384IDEX Corp. . . . . . . . . . . . . . . . . . . . . . . . . . . . . . . . . . . . . . . . . . . . . . . . 2,026 310,403Illinois Tool Works Inc.. . . . . . . . . . . . . . . . . . . . . . . . . . . . . . . . . . . . . 2,256 313,313Ingersoll-Rand PLC . . . . . . . . . . . . . . . . . . . . . . . . . . . . . . . . . . . . . . . 3,081 312,075Middleby Corp. (The)(a)(b). . . . . . . . . . . . . . . . . . . . . . . . . . . . . . . . . . 2,602 316,247PACCAR Inc. . . . . . . . . . . . . . . . . . . . . . . . . . . . . . . . . . . . . . . . . . . . . . 4,532 310,079Parker-Hannifin Corp. . . . . . . . . . . . . . . . . . . . . . . . . . . . . . . . . . . . . . 1,781 312,744Pentair PLC . . . . . . . . . . . . . . . . . . . . . . . . . . . . . . . . . . . . . . . . . . . . . . 7,166 311,578Snap-on Inc. . . . . . . . . . . . . . . . . . . . . . . . . . . . . . . . . . . . . . . . . . . . . . . 1,759 310,956Stanley Black & Decker Inc. . . . . . . . . . . . . . . . . . . . . . . . . . . . . . . . 2,155 302,842WABCO Holdings Inc.(a) . . . . . . . . . . . . . . . . . . . . . . . . . . . . . . . . . . . 2,514 309,423Wabtec Corp./DE . . . . . . . . . . . . . . . . . . . . . . . . . . . . . . . . . . . . . . . . . 2,819 305,354Xylem Inc./NY . . . . . . . . . . . . . . . . . . . . . . . . . . . . . . . . . . . . . . . . . . . . 4,058 308,043
5,882,930Media — 2.7%CBS Corp., Class B, NVS . . . . . . . . . . . . . . . . . . . . . . . . . . . . . . . . . 5,818 308,470Charter Communications Inc., Class A(a) . . . . . . . . . . . . . . . . . . . 1,022 317,229
Security Shares Value
Media (continued)Comcast Corp., Class A . . . . . . . . . . . . . . . . . . . . . . . . . . . . . . . . . . . 8,537 $ 315,784Discovery Inc., Class A(a)(b) . . . . . . . . . . . . . . . . . . . . . . . . . . . . . . . . 3,853 107,229Discovery Inc., Class C, NVS(a) . . . . . . . . . . . . . . . . . . . . . . . . . . . . 7,547 193,505DISH Network Corp., Class A(a) . . . . . . . . . . . . . . . . . . . . . . . . . . . . 8,699 307,510Interpublic Group of Companies Inc. (The) . . . . . . . . . . . . . . . . . 13,486 314,898Liberty Broadband Corp., Class C, NVS(a) . . . . . . . . . . . . . . . . . . 3,919 317,792Liberty Global PLC, Series A(a) . . . . . . . . . . . . . . . . . . . . . . . . . . . . 3,108 83,325Liberty Global PLC, Series C, NVS(a) . . . . . . . . . . . . . . . . . . . . . . 8,621 223,198Liberty Media Corp.-Liberty Formula One,
Class C, NVS(a)(b) . . . . . . . . . . . . . . . . . . . . . . . . . . . . . . . . . . . . . . 8,371 309,392Liberty Media Corp.-Liberty SiriusXM, Class A(a) . . . . . . . . . . . . 2,224 103,950Liberty Media Corp.-Liberty SiriusXM, Class C, NVS(a) . . . . . . 4,510 212,150Live Nation Entertainment Inc.(a) . . . . . . . . . . . . . . . . . . . . . . . . . . . 6,273 311,643News Corp., Class A, NVS . . . . . . . . . . . . . . . . . . . . . . . . . . . . . . . . 17,764 232,175Omnicom Group Inc. . . . . . . . . . . . . . . . . . . . . . . . . . . . . . . . . . . . . . . 4,479 310,484Sirius XM Holdings Inc.(b). . . . . . . . . . . . . . . . . . . . . . . . . . . . . . . . . . 44,301 314,537Twenty-First Century Fox Inc., Class A, NVS . . . . . . . . . . . . . . . 4,878 221,461Twenty-First Century Fox Inc., Class B . . . . . . . . . . . . . . . . . . . . . 2,032 91,237Viacom Inc., Class B, NVS . . . . . . . . . . . . . . . . . . . . . . . . . . . . . . . . 10,163 297,573Walt Disney Co. (The). . . . . . . . . . . . . . . . . . . . . . . . . . . . . . . . . . . . . 2,769 310,183
5,203,725Metals & Mining — 0.6%Freeport-McMoRan Inc. . . . . . . . . . . . . . . . . . . . . . . . . . . . . . . . . . . . 21,113 296,638Newmont Mining Corp. . . . . . . . . . . . . . . . . . . . . . . . . . . . . . . . . . . . . 9,643 299,222Nucor Corp. . . . . . . . . . . . . . . . . . . . . . . . . . . . . . . . . . . . . . . . . . . . . . . 4,881 305,062Steel Dynamics Inc. . . . . . . . . . . . . . . . . . . . . . . . . . . . . . . . . . . . . . . . 6,775 309,821
1,210,743Mortgage Real Estate Investment — 0.3%AGNC Investment Corp.. . . . . . . . . . . . . . . . . . . . . . . . . . . . . . . . . . . 16,122 306,641Annaly Capital Management Inc.(b). . . . . . . . . . . . . . . . . . . . . . . . . 29,339 311,580
618,221Multi-Utilities — 1.8%Ameren Corp.. . . . . . . . . . . . . . . . . . . . . . . . . . . . . . . . . . . . . . . . . . . . . 4,908 310,333CenterPoint Energy Inc. . . . . . . . . . . . . . . . . . . . . . . . . . . . . . . . . . . . 11,235 312,221CMS Energy Corp. . . . . . . . . . . . . . . . . . . . . . . . . . . . . . . . . . . . . . . . . 6,357 313,019Consolidated Edison Inc. . . . . . . . . . . . . . . . . . . . . . . . . . . . . . . . . . . 3,941 311,063Dominion Energy Inc. . . . . . . . . . . . . . . . . . . . . . . . . . . . . . . . . . . . . . 4,365 308,911DTE Energy Co. . . . . . . . . . . . . . . . . . . . . . . . . . . . . . . . . . . . . . . . . . . 2,793 310,414NiSource Inc. . . . . . . . . . . . . . . . . . . . . . . . . . . . . . . . . . . . . . . . . . . . . . 11,540 312,388Public Service Enterprise Group Inc. . . . . . . . . . . . . . . . . . . . . . . . 5,930 310,435SCANA Corp. . . . . . . . . . . . . . . . . . . . . . . . . . . . . . . . . . . . . . . . . . . . . . 7,899 302,848Sempra Energy . . . . . . . . . . . . . . . . . . . . . . . . . . . . . . . . . . . . . . . . . . . 2,694 312,719WEC Energy Group Inc.. . . . . . . . . . . . . . . . . . . . . . . . . . . . . . . . . . . 4,635 313,233
3,417,584Multiline Retail — 1.0%Dollar General Corp. . . . . . . . . . . . . . . . . . . . . . . . . . . . . . . . . . . . . . . 2,901 312,525Dollar Tree Inc.(a) . . . . . . . . . . . . . . . . . . . . . . . . . . . . . . . . . . . . . . . . . 3,349 269,628Kohl's Corp. . . . . . . . . . . . . . . . . . . . . . . . . . . . . . . . . . . . . . . . . . . . . . . 3,944 312,010Macy's Inc. . . . . . . . . . . . . . . . . . . . . . . . . . . . . . . . . . . . . . . . . . . . . . . . 8,572 313,307Nordstrom Inc. . . . . . . . . . . . . . . . . . . . . . . . . . . . . . . . . . . . . . . . . . . . . 5,133 322,609Target Corp. . . . . . . . . . . . . . . . . . . . . . . . . . . . . . . . . . . . . . . . . . . . . . . 3,591 314,212
1,844,291Oil, Gas & Consumable Fuels — 5.1%Anadarko Petroleum Corp. . . . . . . . . . . . . . . . . . . . . . . . . . . . . . . . . 4,818 310,279Andeavor . . . . . . . . . . . . . . . . . . . . . . . . . . . . . . . . . . . . . . . . . . . . . . . . . 2,005 306,344Antero Resources Corp.(a)(b) . . . . . . . . . . . . . . . . . . . . . . . . . . . . . . . 16,801 310,987Apache Corp. . . . . . . . . . . . . . . . . . . . . . . . . . . . . . . . . . . . . . . . . . . . . . 7,105 311,412Cabot Oil & Gas Corp. . . . . . . . . . . . . . . . . . . . . . . . . . . . . . . . . . . . . 12,969 309,051Cheniere Energy Inc.(a). . . . . . . . . . . . . . . . . . . . . . . . . . . . . . . . . . . . 4,670 312,563
Schedule of Investments (continued)
August 31, 2018
iShares� MSCI USA Equal Weighted ETF(Percentages shown are based on Net Assets)
42 2 0 1 8 I S H A R E S A N N U A L R E P O R T T O S H A R E H O L D E R S
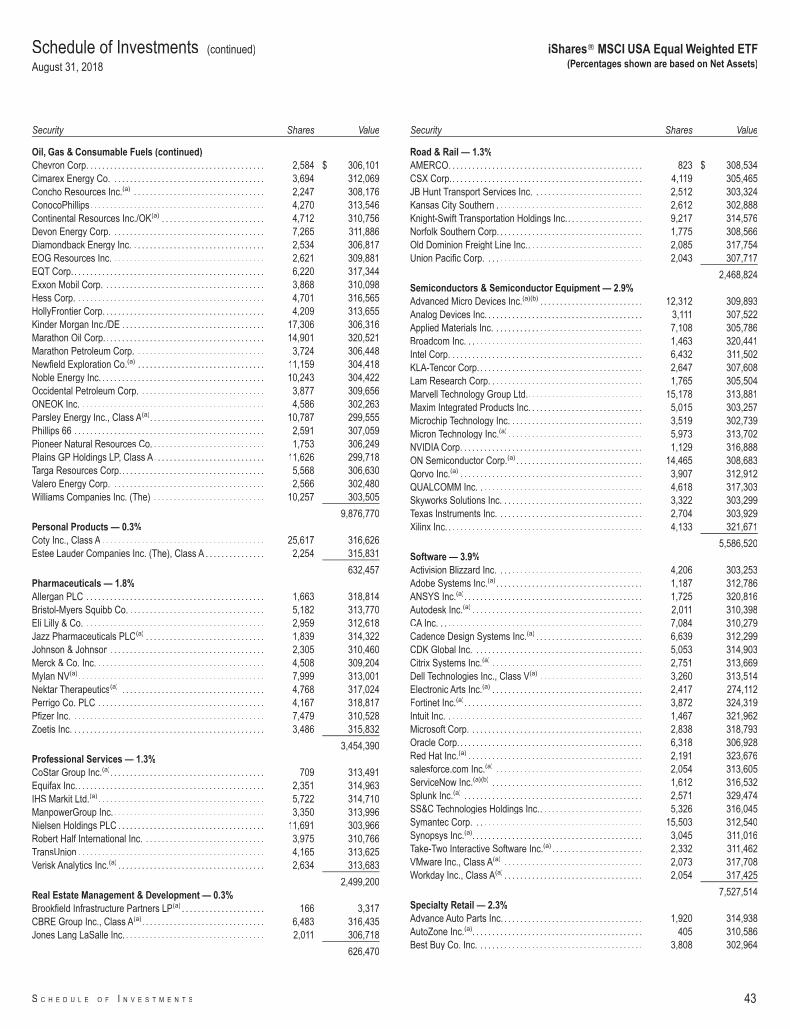
Security Shares Value
Oil, Gas & Consumable Fuels (continued)Chevron Corp. . . . . . . . . . . . . . . . . . . . . . . . . . . . . . . . . . . . . . . . . . . . . 2,584 $ 306,101Cimarex Energy Co. . . . . . . . . . . . . . . . . . . . . . . . . . . . . . . . . . . . . . . 3,694 312,069Concho Resources Inc.(a) . . . . . . . . . . . . . . . . . . . . . . . . . . . . . . . . . 2,247 308,176ConocoPhillips. . . . . . . . . . . . . . . . . . . . . . . . . . . . . . . . . . . . . . . . . . . . 4,270 313,546Continental Resources Inc./OK(a) . . . . . . . . . . . . . . . . . . . . . . . . . . 4,712 310,756Devon Energy Corp. . . . . . . . . . . . . . . . . . . . . . . . . . . . . . . . . . . . . . . 7,265 311,886Diamondback Energy Inc. . . . . . . . . . . . . . . . . . . . . . . . . . . . . . . . . . 2,534 306,817EOG Resources Inc. . . . . . . . . . . . . . . . . . . . . . . . . . . . . . . . . . . . . . . 2,621 309,881EQT Corp. . . . . . . . . . . . . . . . . . . . . . . . . . . . . . . . . . . . . . . . . . . . . . . . . 6,220 317,344Exxon Mobil Corp. . . . . . . . . . . . . . . . . . . . . . . . . . . . . . . . . . . . . . . . . 3,868 310,098Hess Corp. . . . . . . . . . . . . . . . . . . . . . . . . . . . . . . . . . . . . . . . . . . . . . . . 4,701 316,565HollyFrontier Corp. . . . . . . . . . . . . . . . . . . . . . . . . . . . . . . . . . . . . . . . . 4,209 313,655Kinder Morgan Inc./DE . . . . . . . . . . . . . . . . . . . . . . . . . . . . . . . . . . . . 17,306 306,316Marathon Oil Corp.. . . . . . . . . . . . . . . . . . . . . . . . . . . . . . . . . . . . . . . . 14,901 320,521Marathon Petroleum Corp. . . . . . . . . . . . . . . . . . . . . . . . . . . . . . . . . 3,724 306,448Newfield Exploration Co.(a) . . . . . . . . . . . . . . . . . . . . . . . . . . . . . . . . 11,159 304,418Noble Energy Inc. . . . . . . . . . . . . . . . . . . . . . . . . . . . . . . . . . . . . . . . . . 10,243 304,422Occidental Petroleum Corp. . . . . . . . . . . . . . . . . . . . . . . . . . . . . . . . 3,877 309,656ONEOK Inc. . . . . . . . . . . . . . . . . . . . . . . . . . . . . . . . . . . . . . . . . . . . . . . 4,586 302,263Parsley Energy Inc., Class A(a). . . . . . . . . . . . . . . . . . . . . . . . . . . . . 10,787 299,555Phillips 66 . . . . . . . . . . . . . . . . . . . . . . . . . . . . . . . . . . . . . . . . . . . . . . . . 2,591 307,059Pioneer Natural Resources Co. . . . . . . . . . . . . . . . . . . . . . . . . . . . . 1,753 306,249Plains GP Holdings LP, Class A. . . . . . . . . . . . . . . . . . . . . . . . . . . . 11,626 299,718Targa Resources Corp.. . . . . . . . . . . . . . . . . . . . . . . . . . . . . . . . . . . . 5,568 306,630Valero Energy Corp. . . . . . . . . . . . . . . . . . . . . . . . . . . . . . . . . . . . . . . 2,566 302,480Williams Companies Inc. (The) . . . . . . . . . . . . . . . . . . . . . . . . . . . . 10,257 303,505
9,876,770Personal Products — 0.3%Coty Inc., Class A . . . . . . . . . . . . . . . . . . . . . . . . . . . . . . . . . . . . . . . . . 25,617 316,626Estee Lauder Companies Inc. (The), Class A . . . . . . . . . . . . . . . 2,254 315,831
632,457Pharmaceuticals — 1.8%Allergan PLC . . . . . . . . . . . . . . . . . . . . . . . . . . . . . . . . . . . . . . . . . . . . . 1,663 318,814Bristol-Myers Squibb Co. . . . . . . . . . . . . . . . . . . . . . . . . . . . . . . . . . . 5,182 313,770Eli Lilly & Co. . . . . . . . . . . . . . . . . . . . . . . . . . . . . . . . . . . . . . . . . . . . . . 2,959 312,618Jazz Pharmaceuticals PLC(a) . . . . . . . . . . . . . . . . . . . . . . . . . . . . . . 1,839 314,322Johnson & Johnson . . . . . . . . . . . . . . . . . . . . . . . . . . . . . . . . . . . . . . . 2,305 310,460Merck & Co. Inc. . . . . . . . . . . . . . . . . . . . . . . . . . . . . . . . . . . . . . . . . . . 4,508 309,204Mylan NV(a). . . . . . . . . . . . . . . . . . . . . . . . . . . . . . . . . . . . . . . . . . . . . . . 7,999 313,001Nektar Therapeutics(a) . . . . . . . . . . . . . . . . . . . . . . . . . . . . . . . . . . . . 4,768 317,024Perrigo Co. PLC . . . . . . . . . . . . . . . . . . . . . . . . . . . . . . . . . . . . . . . . . . 4,167 318,817Pfizer Inc. . . . . . . . . . . . . . . . . . . . . . . . . . . . . . . . . . . . . . . . . . . . . . . . . 7,479 310,528Zoetis Inc. . . . . . . . . . . . . . . . . . . . . . . . . . . . . . . . . . . . . . . . . . . . . . . . . 3,486 315,832
3,454,390Professional Services — 1.3%CoStar Group Inc.(a). . . . . . . . . . . . . . . . . . . . . . . . . . . . . . . . . . . . . . . 709 313,491Equifax Inc.. . . . . . . . . . . . . . . . . . . . . . . . . . . . . . . . . . . . . . . . . . . . . . . 2,351 314,963IHS Markit Ltd.(a). . . . . . . . . . . . . . . . . . . . . . . . . . . . . . . . . . . . . . . . . . 5,722 314,710ManpowerGroup Inc. . . . . . . . . . . . . . . . . . . . . . . . . . . . . . . . . . . . . . . 3,350 313,996Nielsen Holdings PLC . . . . . . . . . . . . . . . . . . . . . . . . . . . . . . . . . . . . . 11,691 303,966Robert Half International Inc. . . . . . . . . . . . . . . . . . . . . . . . . . . . . . . 3,975 310,766TransUnion . . . . . . . . . . . . . . . . . . . . . . . . . . . . . . . . . . . . . . . . . . . . . . . 4,165 313,625Verisk Analytics Inc.(a) . . . . . . . . . . . . . . . . . . . . . . . . . . . . . . . . . . . . . 2,634 313,683
2,499,200Real Estate Management & Development — 0.3%Brookfield Infrastructure Partners LP(a) . . . . . . . . . . . . . . . . . . . . . 166 3,317CBRE Group Inc., Class A(a). . . . . . . . . . . . . . . . . . . . . . . . . . . . . . . 6,483 316,435Jones Lang LaSalle Inc. . . . . . . . . . . . . . . . . . . . . . . . . . . . . . . . . . . . 2,011 306,718
626,470
Security Shares Value
Road & Rail — 1.3%AMERCO. . . . . . . . . . . . . . . . . . . . . . . . . . . . . . . . . . . . . . . . . . . . . . . . . 823 $ 308,534CSX Corp.. . . . . . . . . . . . . . . . . . . . . . . . . . . . . . . . . . . . . . . . . . . . . . . . 4,119 305,465JB Hunt Transport Services Inc. . . . . . . . . . . . . . . . . . . . . . . . . . . . 2,512 303,324Kansas City Southern . . . . . . . . . . . . . . . . . . . . . . . . . . . . . . . . . . . . . 2,612 302,888Knight-Swift Transportation Holdings Inc.. . . . . . . . . . . . . . . . . . . 9,217 314,576Norfolk Southern Corp. . . . . . . . . . . . . . . . . . . . . . . . . . . . . . . . . . . . . 1,775 308,566Old Dominion Freight Line Inc.. . . . . . . . . . . . . . . . . . . . . . . . . . . . . 2,085 317,754Union Pacific Corp. . . . . . . . . . . . . . . . . . . . . . . . . . . . . . . . . . . . . . . . 2,043 307,717
2,468,824Semiconductors & Semiconductor Equipment — 2.9%Advanced Micro Devices Inc.(a)(b) . . . . . . . . . . . . . . . . . . . . . . . . . . 12,312 309,893Analog Devices Inc. . . . . . . . . . . . . . . . . . . . . . . . . . . . . . . . . . . . . . . . 3,111 307,522Applied Materials Inc. . . . . . . . . . . . . . . . . . . . . . . . . . . . . . . . . . . . . . 7,108 305,786Broadcom Inc. . . . . . . . . . . . . . . . . . . . . . . . . . . . . . . . . . . . . . . . . . . . . 1,463 320,441Intel Corp. . . . . . . . . . . . . . . . . . . . . . . . . . . . . . . . . . . . . . . . . . . . . . . . . 6,432 311,502KLA-Tencor Corp. . . . . . . . . . . . . . . . . . . . . . . . . . . . . . . . . . . . . . . . . . 2,647 307,608Lam Research Corp. . . . . . . . . . . . . . . . . . . . . . . . . . . . . . . . . . . . . . . 1,765 305,504Marvell Technology Group Ltd.. . . . . . . . . . . . . . . . . . . . . . . . . . . . . 15,178 313,881Maxim Integrated Products Inc. . . . . . . . . . . . . . . . . . . . . . . . . . . . . 5,015 303,257Microchip Technology Inc. . . . . . . . . . . . . . . . . . . . . . . . . . . . . . . . . . 3,519 302,739Micron Technology Inc.(a) . . . . . . . . . . . . . . . . . . . . . . . . . . . . . . . . . . 5,973 313,702NVIDIA Corp. . . . . . . . . . . . . . . . . . . . . . . . . . . . . . . . . . . . . . . . . . . . . . 1,129 316,888ON Semiconductor Corp.(a) . . . . . . . . . . . . . . . . . . . . . . . . . . . . . . . . 14,465 308,683Qorvo Inc.(a) . . . . . . . . . . . . . . . . . . . . . . . . . . . . . . . . . . . . . . . . . . . . . . 3,907 312,912QUALCOMM Inc. . . . . . . . . . . . . . . . . . . . . . . . . . . . . . . . . . . . . . . . . . 4,618 317,303Skyworks Solutions Inc. . . . . . . . . . . . . . . . . . . . . . . . . . . . . . . . . . . . 3,322 303,299Texas Instruments Inc. . . . . . . . . . . . . . . . . . . . . . . . . . . . . . . . . . . . . 2,704 303,929Xilinx Inc. . . . . . . . . . . . . . . . . . . . . . . . . . . . . . . . . . . . . . . . . . . . . . . . . . 4,133 321,671
5,586,520Software — 3.9%Activision Blizzard Inc. . . . . . . . . . . . . . . . . . . . . . . . . . . . . . . . . . . . . 4,206 303,253Adobe Systems Inc.(a). . . . . . . . . . . . . . . . . . . . . . . . . . . . . . . . . . . . . 1,187 312,786ANSYS Inc.(a). . . . . . . . . . . . . . . . . . . . . . . . . . . . . . . . . . . . . . . . . . . . . 1,725 320,816Autodesk Inc.(a) . . . . . . . . . . . . . . . . . . . . . . . . . . . . . . . . . . . . . . . . . . . 2,011 310,398CA Inc. . . . . . . . . . . . . . . . . . . . . . . . . . . . . . . . . . . . . . . . . . . . . . . . . . . . 7,084 310,279Cadence Design Systems Inc.(a) . . . . . . . . . . . . . . . . . . . . . . . . . . . 6,639 312,299CDK Global Inc. . . . . . . . . . . . . . . . . . . . . . . . . . . . . . . . . . . . . . . . . . . 5,053 314,903Citrix Systems Inc.(a) . . . . . . . . . . . . . . . . . . . . . . . . . . . . . . . . . . . . . . 2,751 313,669Dell Technologies Inc., Class V(a) . . . . . . . . . . . . . . . . . . . . . . . . . . 3,260 313,514Electronic Arts Inc.(a) . . . . . . . . . . . . . . . . . . . . . . . . . . . . . . . . . . . . . . 2,417 274,112Fortinet Inc.(a). . . . . . . . . . . . . . . . . . . . . . . . . . . . . . . . . . . . . . . . . . . . . 3,872 324,319Intuit Inc. . . . . . . . . . . . . . . . . . . . . . . . . . . . . . . . . . . . . . . . . . . . . . . . . . 1,467 321,962Microsoft Corp. . . . . . . . . . . . . . . . . . . . . . . . . . . . . . . . . . . . . . . . . . . . 2,838 318,793Oracle Corp. . . . . . . . . . . . . . . . . . . . . . . . . . . . . . . . . . . . . . . . . . . . . . . 6,318 306,928Red Hat Inc.(a) . . . . . . . . . . . . . . . . . . . . . . . . . . . . . . . . . . . . . . . . . . . . 2,191 323,676salesforce.com Inc.(a) . . . . . . . . . . . . . . . . . . . . . . . . . . . . . . . . . . . . . 2,054 313,605ServiceNow Inc.(a)(b) . . . . . . . . . . . . . . . . . . . . . . . . . . . . . . . . . . . . . . 1,612 316,532Splunk Inc.(a) . . . . . . . . . . . . . . . . . . . . . . . . . . . . . . . . . . . . . . . . . . . . . 2,571 329,474SS&C Technologies Holdings Inc.. . . . . . . . . . . . . . . . . . . . . . . . . . 5,326 316,045Symantec Corp. . . . . . . . . . . . . . . . . . . . . . . . . . . . . . . . . . . . . . . . . . . 15,503 312,540Synopsys Inc.(a). . . . . . . . . . . . . . . . . . . . . . . . . . . . . . . . . . . . . . . . . . . 3,045 311,016Take-Two Interactive Software Inc.(a) . . . . . . . . . . . . . . . . . . . . . . . 2,332 311,462VMware Inc., Class A(a) . . . . . . . . . . . . . . . . . . . . . . . . . . . . . . . . . . . 2,073 317,708Workday Inc., Class A(a) . . . . . . . . . . . . . . . . . . . . . . . . . . . . . . . . . . . 2,054 317,425
7,527,514Specialty Retail — 2.3%Advance Auto Parts Inc. . . . . . . . . . . . . . . . . . . . . . . . . . . . . . . . . . . . 1,920 314,938AutoZone Inc.(a). . . . . . . . . . . . . . . . . . . . . . . . . . . . . . . . . . . . . . . . . . . 405 310,586Best Buy Co. Inc. . . . . . . . . . . . . . . . . . . . . . . . . . . . . . . . . . . . . . . . . . 3,808 302,964
Schedule of Investments (continued)
August 31, 2018
iShares� MSCI USA Equal Weighted ETF(Percentages shown are based on Net Assets)
S C H E D U L E O F I N V E S T M E N T S 43
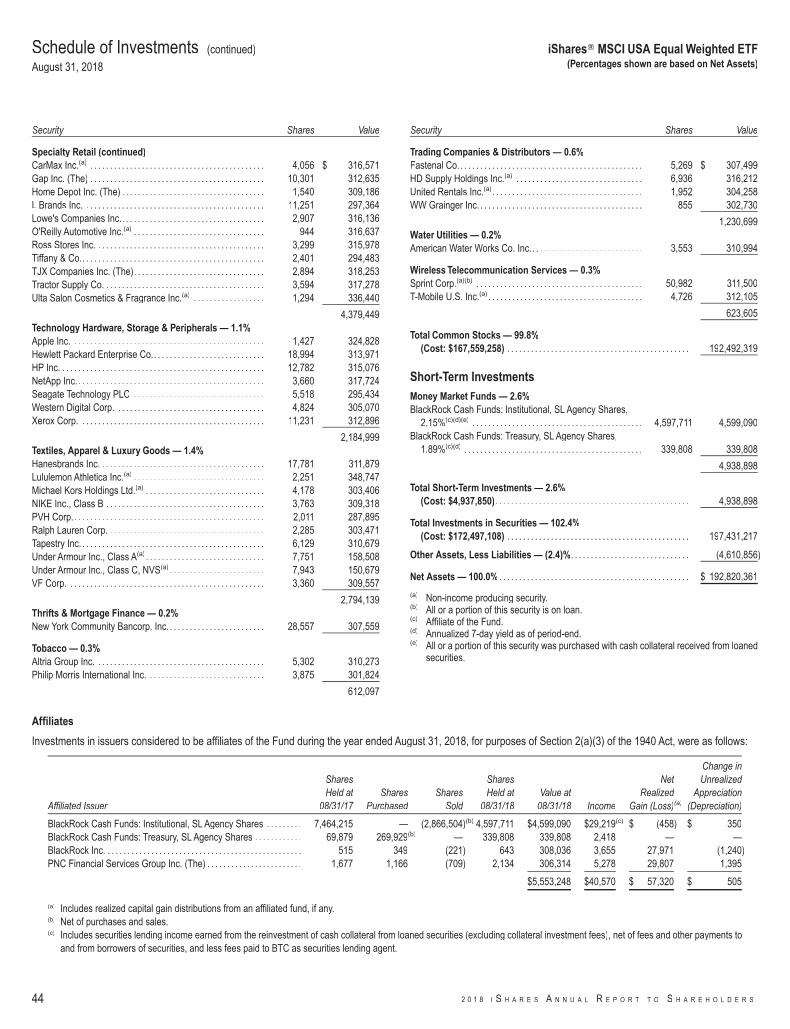
Security Shares Value
Specialty Retail (continued)CarMax Inc.(a) . . . . . . . . . . . . . . . . . . . . . . . . . . . . . . . . . . . . . . . . . . . . 4,056 $ 316,571Gap Inc. (The) . . . . . . . . . . . . . . . . . . . . . . . . . . . . . . . . . . . . . . . . . . . . 10,301 312,635Home Depot Inc. (The) . . . . . . . . . . . . . . . . . . . . . . . . . . . . . . . . . . . . 1,540 309,186L Brands Inc. . . . . . . . . . . . . . . . . . . . . . . . . . . . . . . . . . . . . . . . . . . . . . 11,251 297,364Lowe's Companies Inc.. . . . . . . . . . . . . . . . . . . . . . . . . . . . . . . . . . . . 2,907 316,136O'Reilly Automotive Inc.(a) . . . . . . . . . . . . . . . . . . . . . . . . . . . . . . . . . 944 316,637Ross Stores Inc. . . . . . . . . . . . . . . . . . . . . . . . . . . . . . . . . . . . . . . . . . . 3,299 315,978Tiffany & Co.. . . . . . . . . . . . . . . . . . . . . . . . . . . . . . . . . . . . . . . . . . . . . . 2,401 294,483TJX Companies Inc. (The). . . . . . . . . . . . . . . . . . . . . . . . . . . . . . . . . 2,894 318,253Tractor Supply Co. . . . . . . . . . . . . . . . . . . . . . . . . . . . . . . . . . . . . . . . . 3,594 317,278Ulta Salon Cosmetics & Fragrance Inc.(a) . . . . . . . . . . . . . . . . . . 1,294 336,440
4,379,449Technology Hardware, Storage & Peripherals — 1.1%Apple Inc. . . . . . . . . . . . . . . . . . . . . . . . . . . . . . . . . . . . . . . . . . . . . . . . . 1,427 324,828Hewlett Packard Enterprise Co.. . . . . . . . . . . . . . . . . . . . . . . . . . . . 18,994 313,971HP Inc. . . . . . . . . . . . . . . . . . . . . . . . . . . . . . . . . . . . . . . . . . . . . . . . . . . . 12,782 315,076NetApp Inc.. . . . . . . . . . . . . . . . . . . . . . . . . . . . . . . . . . . . . . . . . . . . . . . 3,660 317,724Seagate Technology PLC . . . . . . . . . . . . . . . . . . . . . . . . . . . . . . . . . 5,518 295,434Western Digital Corp. . . . . . . . . . . . . . . . . . . . . . . . . . . . . . . . . . . . . . 4,824 305,070Xerox Corp. . . . . . . . . . . . . . . . . . . . . . . . . . . . . . . . . . . . . . . . . . . . . . . 11,231 312,896
2,184,999Textiles, Apparel & Luxury Goods — 1.4%Hanesbrands Inc. . . . . . . . . . . . . . . . . . . . . . . . . . . . . . . . . . . . . . . . . . 17,781 311,879Lululemon Athletica Inc.(a) . . . . . . . . . . . . . . . . . . . . . . . . . . . . . . . . . 2,251 348,747Michael Kors Holdings Ltd.(a) . . . . . . . . . . . . . . . . . . . . . . . . . . . . . . 4,178 303,406NIKE Inc., Class B . . . . . . . . . . . . . . . . . . . . . . . . . . . . . . . . . . . . . . . . 3,763 309,318PVH Corp.. . . . . . . . . . . . . . . . . . . . . . . . . . . . . . . . . . . . . . . . . . . . . . . . 2,011 287,895Ralph Lauren Corp. . . . . . . . . . . . . . . . . . . . . . . . . . . . . . . . . . . . . . . . 2,285 303,471Tapestry Inc. . . . . . . . . . . . . . . . . . . . . . . . . . . . . . . . . . . . . . . . . . . . . . . 6,129 310,679Under Armour Inc., Class A(a) . . . . . . . . . . . . . . . . . . . . . . . . . . . . . . 7,751 158,508Under Armour Inc., Class C, NVS(a) . . . . . . . . . . . . . . . . . . . . . . . . 7,943 150,679VF Corp. . . . . . . . . . . . . . . . . . . . . . . . . . . . . . . . . . . . . . . . . . . . . . . . . . 3,360 309,557
2,794,139Thrifts & Mortgage Finance — 0.2%New York Community Bancorp. Inc. . . . . . . . . . . . . . . . . . . . . . . . . 28,557 307,559
Tobacco — 0.3%Altria Group Inc. . . . . . . . . . . . . . . . . . . . . . . . . . . . . . . . . . . . . . . . . . . 5,302 310,273Philip Morris International Inc. . . . . . . . . . . . . . . . . . . . . . . . . . . . . . 3,875 301,824
612,097
Security Shares Value
Trading Companies & Distributors — 0.6%Fastenal Co. . . . . . . . . . . . . . . . . . . . . . . . . . . . . . . . . . . . . . . . . . . . . . . 5,269 $ 307,499HD Supply Holdings Inc.(a) . . . . . . . . . . . . . . . . . . . . . . . . . . . . . . . . 6,936 316,212United Rentals Inc.(a). . . . . . . . . . . . . . . . . . . . . . . . . . . . . . . . . . . . . . 1,952 304,258WW Grainger Inc. . . . . . . . . . . . . . . . . . . . . . . . . . . . . . . . . . . . . . . . . . 855 302,730
1,230,699Water Utilities — 0.2%American Water Works Co. Inc.. . . . . . . . . . . . . . . . . . . . . . . . . . . . 3,553 310,994
Wireless Telecommunication Services — 0.3%Sprint Corp.(a)(b) . . . . . . . . . . . . . . . . . . . . . . . . . . . . . . . . . . . . . . . . . . 50,982 311,500T-Mobile U.S. Inc.(a) . . . . . . . . . . . . . . . . . . . . . . . . . . . . . . . . . . . . . . . 4,726 312,105
623,605
Total Common Stocks — 99.8%(Cost: $167,559,258) . . . . . . . . . . . . . . . . . . . . . . . . . . . . . . . . . . . . . . . . . . . . . . 192,492,319
Short-Term InvestmentsMoney Market Funds — 2.6%BlackRock Cash Funds: Institutional, SL Agency Shares,
2.15%(c)(d)(e) . . . . . . . . . . . . . . . . . . . . . . . . . . . . . . . . . . . . . . . . . . . 4,597,711 4,599,090BlackRock Cash Funds: Treasury, SL Agency Shares,
1.89%(c)(d) . . . . . . . . . . . . . . . . . . . . . . . . . . . . . . . . . . . . . . . . . . . . . 339,808 339,808
4,938,898
Total Short-Term Investments — 2.6%(Cost: $4,937,850). . . . . . . . . . . . . . . . . . . . . . . . . . . . . . . . . . . . . . . . . . . . . . . . . 4,938,898
Total Investments in Securities — 102.4%(Cost: $172,497,108) . . . . . . . . . . . . . . . . . . . . . . . . . . . . . . . . . . . . . . . . . . . . . . 197,431,217
Other Assets, Less Liabilities — (2.4)%. . . . . . . . . . . . . . . . . . . . . . . . . . . . . . (4,610,856)
Net Assets — 100.0% . . . . . . . . . . . . . . . . . . . . . . . . . . . . . . . . . . . . . . . . . . . . . . . . $ 192,820,361
(a) Non-income producing security.(b) All or a portion of this security is on loan.(c) Affiliate of the Fund.(d) Annualized 7-day yield as of period-end.(e) All or a portion of this security was purchased with cash collateral received from loaned
securities.
Affiliates
Investments in issuers considered to be affiliates of the Fund during the year ended August 31, 2018, for purposes of Section 2(a)(3) of the 1940 Act, were as follows:
Affiliated Issuer
SharesHeld at
08/31/17Shares
PurchasedShares
Sold
SharesHeld at
08/31/18Value at
08/31/18 Income
NetRealized
Gain (Loss)(a)
Change inUnrealized
Appreciation(Depreciation)
BlackRock Cash Funds: Institutional, SL Agency Shares . . . . . . . . . 7,464,215 — (2,866,504)(b) 4,597,711 $4,599,090 $29,219(c) $ (458) $ 350BlackRock Cash Funds: Treasury, SL Agency Shares . . . . . . . . . . . . 69,879 269,929(b) — 339,808 339,808 2,418 — —BlackRock Inc. . . . . . . . . . . . . . . . . . . . . . . . . . . . . . . . . . . . . . . . . . . . . . . . . . 515 349 (221) 643 308,036 3,655 27,971 (1,240)PNC Financial Services Group Inc. (The) . . . . . . . . . . . . . . . . . . . . . . . . 1,677 1,166 (709) 2,134 306,314 5,278 29,807 1,395
$5,553,248 $40,570 $ 57,320 $ 505
(a) Includes realized capital gain distributions from an affiliated fund, if any.(b) Net of purchases and sales.(c) Includes securities lending income earned from the reinvestment of cash collateral from loaned securities (excluding collateral investment fees), net of fees and other payments to
and from borrowers of securities, and less fees paid to BTC as securities lending agent.
Schedule of Investments (continued)
August 31, 2018
iShares� MSCI USA Equal Weighted ETF(Percentages shown are based on Net Assets)
44 2 0 1 8 I S H A R E S A N N U A L R E P O R T T O S H A R E H O L D E R S
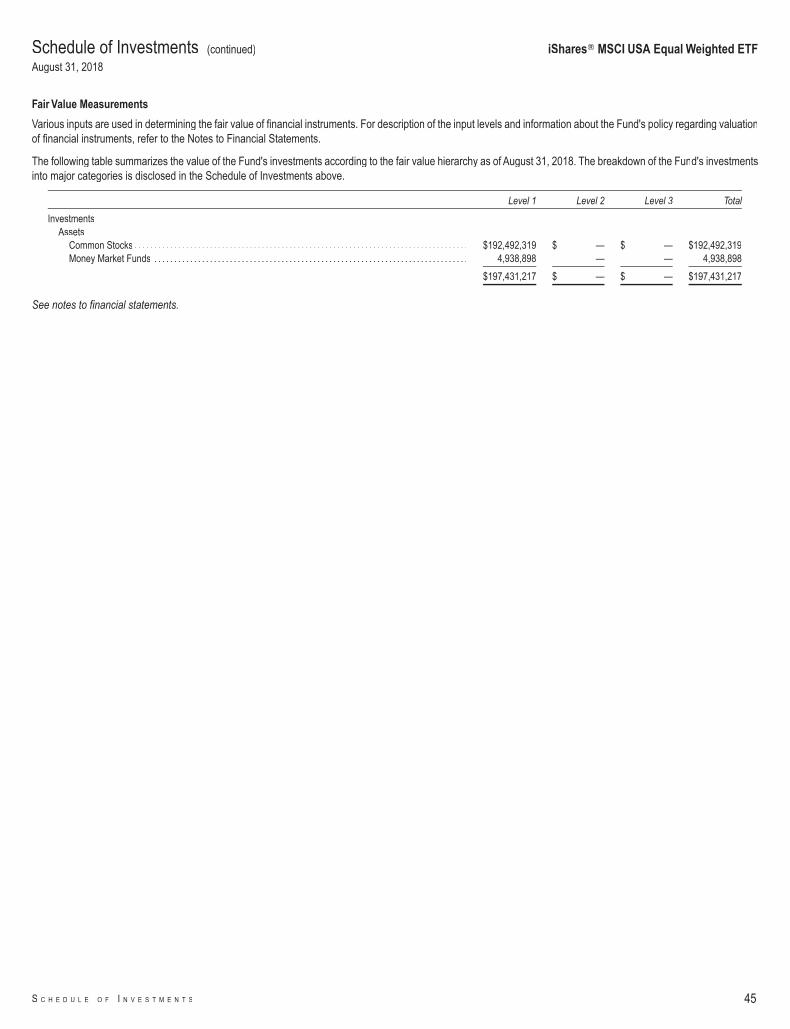
Fair Value Measurements
Various inputs are used in determining the fair value of financial instruments. For description of the input levels and information about the Fund's policy regarding valuationof financial instruments, refer to the Notes to Financial Statements.
The following table summarizes the value of the Fund's investments according to the fair value hierarchy as of August 31, 2018. The breakdown of the Fund's investmentsinto major categories is disclosed in the Schedule of Investments above.
Level 1 Level 2 Level 3 Total
InvestmentsAssets
Common Stocks . . . . . . . . . . . . . . . . . . . . . . . . . . . . . . . . . . . . . . . . . . . . . . . . . . . . . . . . . . . . . . . . . . . . . . . . . . . . . . . . . . . . $192,492,319 $ — $ — $192,492,319Money Market Funds . . . . . . . . . . . . . . . . . . . . . . . . . . . . . . . . . . . . . . . . . . . . . . . . . . . . . . . . . . . . . . . . . . . . . . . . . . . . . . . 4,938,898 — — 4,938,898
$197,431,217 $ — $ — $197,431,217
See notes to financial statements.
Schedule of Investments (continued)
August 31, 2018
iShares� MSCI USA Equal Weighted ETF
S C H E D U L E O F I N V E S T M E N T S 45
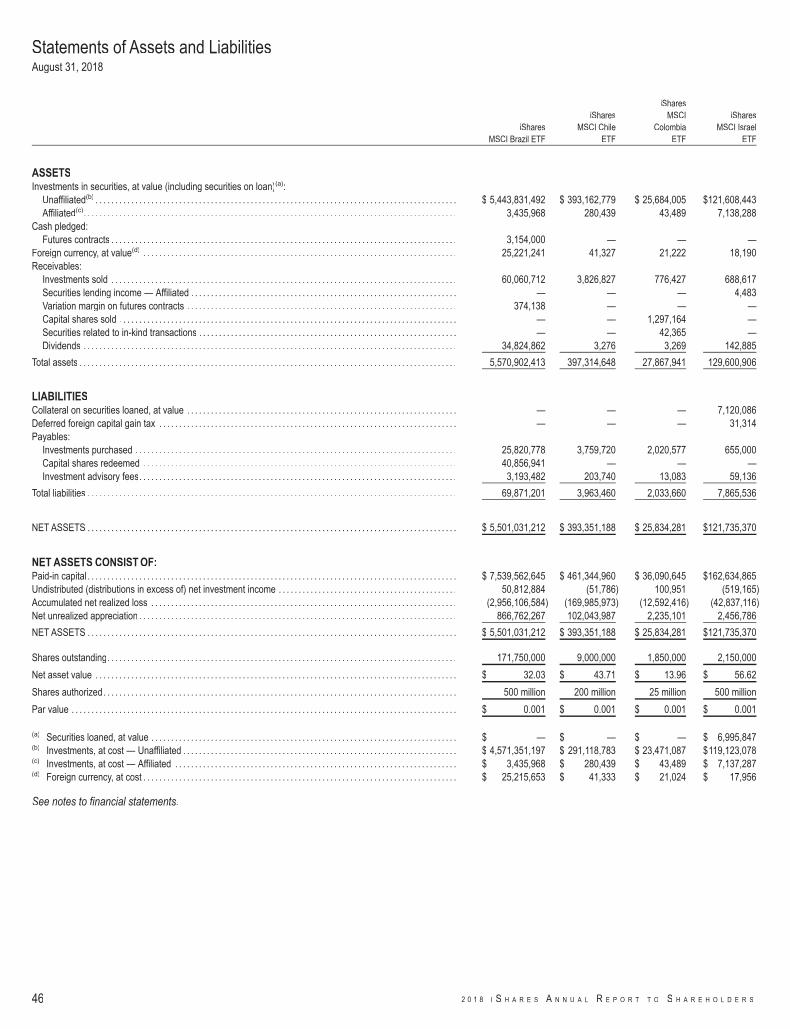
iSharesMSCI Brazil ETF
iSharesMSCI Chile
ETF
iSharesMSCI
ColombiaETF
iSharesMSCI Israel
ETF
ASSETSInvestments in securities, at value (including securities on loan)(a):
Unaffiliated(b) . . . . . . . . . . . . . . . . . . . . . . . . . . . . . . . . . . . . . . . . . . . . . . . . . . . . . . . . . . . . . . . . . . . . . . . . . . . . . . . . . . . . . . . . . . . $ 5,443,831,492 $ 393,162,779 $ 25,684,005 $121,608,443Affiliated(c). . . . . . . . . . . . . . . . . . . . . . . . . . . . . . . . . . . . . . . . . . . . . . . . . . . . . . . . . . . . . . . . . . . . . . . . . . . . . . . . . . . . . . . . . . . . . . 3,435,968 280,439 43,489 7,138,288
Cash pledged:Futures contracts . . . . . . . . . . . . . . . . . . . . . . . . . . . . . . . . . . . . . . . . . . . . . . . . . . . . . . . . . . . . . . . . . . . . . . . . . . . . . . . . . . . . . . . 3,154,000 — — —
Foreign currency, at value(d) . . . . . . . . . . . . . . . . . . . . . . . . . . . . . . . . . . . . . . . . . . . . . . . . . . . . . . . . . . . . . . . . . . . . . . . . . . . . . . . 25,221,241 41,327 21,222 18,190Receivables:
Investments sold . . . . . . . . . . . . . . . . . . . . . . . . . . . . . . . . . . . . . . . . . . . . . . . . . . . . . . . . . . . . . . . . . . . . . . . . . . . . . . . . . . . . . . . 60,060,712 3,826,827 776,427 688,617Securities lending income — Affiliated . . . . . . . . . . . . . . . . . . . . . . . . . . . . . . . . . . . . . . . . . . . . . . . . . . . . . . . . . . . . . . . . . . . — — — 4,483Variation margin on futures contracts . . . . . . . . . . . . . . . . . . . . . . . . . . . . . . . . . . . . . . . . . . . . . . . . . . . . . . . . . . . . . . . . . . . . 374,138 — — —Capital shares sold . . . . . . . . . . . . . . . . . . . . . . . . . . . . . . . . . . . . . . . . . . . . . . . . . . . . . . . . . . . . . . . . . . . . . . . . . . . . . . . . . . . . . — — 1,297,164 —Securities related to in-kind transactions . . . . . . . . . . . . . . . . . . . . . . . . . . . . . . . . . . . . . . . . . . . . . . . . . . . . . . . . . . . . . . . . . — — 42,365 —Dividends . . . . . . . . . . . . . . . . . . . . . . . . . . . . . . . . . . . . . . . . . . . . . . . . . . . . . . . . . . . . . . . . . . . . . . . . . . . . . . . . . . . . . . . . . . . . . . 34,824,862 3,276 3,269 142,885
Total assets . . . . . . . . . . . . . . . . . . . . . . . . . . . . . . . . . . . . . . . . . . . . . . . . . . . . . . . . . . . . . . . . . . . . . . . . . . . . . . . . . . . . . . . . . . . . . . . 5,570,902,413 397,314,648 27,867,941 129,600,906
LIABILITIESCollateral on securities loaned, at value . . . . . . . . . . . . . . . . . . . . . . . . . . . . . . . . . . . . . . . . . . . . . . . . . . . . . . . . . . . . . . . . . . . . — — — 7,120,086Deferred foreign capital gain tax . . . . . . . . . . . . . . . . . . . . . . . . . . . . . . . . . . . . . . . . . . . . . . . . . . . . . . . . . . . . . . . . . . . . . . . . . . . — — — 31,314Payables:
Investments purchased . . . . . . . . . . . . . . . . . . . . . . . . . . . . . . . . . . . . . . . . . . . . . . . . . . . . . . . . . . . . . . . . . . . . . . . . . . . . . . . . . 25,820,778 3,759,720 2,020,577 655,000Capital shares redeemed . . . . . . . . . . . . . . . . . . . . . . . . . . . . . . . . . . . . . . . . . . . . . . . . . . . . . . . . . . . . . . . . . . . . . . . . . . . . . . . 40,856,941 — — —Investment advisory fees. . . . . . . . . . . . . . . . . . . . . . . . . . . . . . . . . . . . . . . . . . . . . . . . . . . . . . . . . . . . . . . . . . . . . . . . . . . . . . . . 3,193,482 203,740 13,083 59,136
Total liabilities . . . . . . . . . . . . . . . . . . . . . . . . . . . . . . . . . . . . . . . . . . . . . . . . . . . . . . . . . . . . . . . . . . . . . . . . . . . . . . . . . . . . . . . . . . . . . 69,871,201 3,963,460 2,033,660 7,865,536
NET ASSETS . . . . . . . . . . . . . . . . . . . . . . . . . . . . . . . . . . . . . . . . . . . . . . . . . . . . . . . . . . . . . . . . . . . . . . . . . . . . . . . . . . . . . . . . . . . . . $ 5,501,031,212 $ 393,351,188 $ 25,834,281 $121,735,370
NET ASSETS CONSIST OF:Paid-in capital . . . . . . . . . . . . . . . . . . . . . . . . . . . . . . . . . . . . . . . . . . . . . . . . . . . . . . . . . . . . . . . . . . . . . . . . . . . . . . . . . . . . . . . . . . . . . $ 7,539,562,645 $ 461,344,960 $ 36,090,645 $162,634,865Undistributed (distributions in excess of) net investment income . . . . . . . . . . . . . . . . . . . . . . . . . . . . . . . . . . . . . . . . . . . . . 50,812,884 (51,786) 100,951 (519,165)Accumulated net realized loss . . . . . . . . . . . . . . . . . . . . . . . . . . . . . . . . . . . . . . . . . . . . . . . . . . . . . . . . . . . . . . . . . . . . . . . . . . . . . (2,956,106,584) (169,985,973) (12,592,416) (42,837,116)Net unrealized appreciation . . . . . . . . . . . . . . . . . . . . . . . . . . . . . . . . . . . . . . . . . . . . . . . . . . . . . . . . . . . . . . . . . . . . . . . . . . . . . . . . 866,762,267 102,043,987 2,235,101 2,456,786
NET ASSETS . . . . . . . . . . . . . . . . . . . . . . . . . . . . . . . . . . . . . . . . . . . . . . . . . . . . . . . . . . . . . . . . . . . . . . . . . . . . . . . . . . . . . . . . . . . . . $ 5,501,031,212 $ 393,351,188 $ 25,834,281 $121,735,370
Shares outstanding. . . . . . . . . . . . . . . . . . . . . . . . . . . . . . . . . . . . . . . . . . . . . . . . . . . . . . . . . . . . . . . . . . . . . . . . . . . . . . . . . . . . . . . . 171,750,000 9,000,000 1,850,000 2,150,000
Net asset value . . . . . . . . . . . . . . . . . . . . . . . . . . . . . . . . . . . . . . . . . . . . . . . . . . . . . . . . . . . . . . . . . . . . . . . . . . . . . . . . . . . . . . . . . . . $ 32.03 $ 43.71 $ 13.96 $ 56.62
Shares authorized. . . . . . . . . . . . . . . . . . . . . . . . . . . . . . . . . . . . . . . . . . . . . . . . . . . . . . . . . . . . . . . . . . . . . . . . . . . . . . . . . . . . . . . . . 500 million 200 million 25 million 500 million
Par value . . . . . . . . . . . . . . . . . . . . . . . . . . . . . . . . . . . . . . . . . . . . . . . . . . . . . . . . . . . . . . . . . . . . . . . . . . . . . . . . . . . . . . . . . . . . . . . . . $ 0.001 $ 0.001 $ 0.001 $ 0.001
(a) Securities loaned, at value . . . . . . . . . . . . . . . . . . . . . . . . . . . . . . . . . . . . . . . . . . . . . . . . . . . . . . . . . . . . . . . . . . . . . . . . . . . . . $ — $ — $ — $ 6,995,847(b) Investments, at cost — Unaffiliated . . . . . . . . . . . . . . . . . . . . . . . . . . . . . . . . . . . . . . . . . . . . . . . . . . . . . . . . . . . . . . . . . . . . . $ 4,571,351,197 $ 291,118,783 $ 23,471,087 $119,123,078(c) Investments, at cost — Affiliated . . . . . . . . . . . . . . . . . . . . . . . . . . . . . . . . . . . . . . . . . . . . . . . . . . . . . . . . . . . . . . . . . . . . . . . $ 3,435,968 $ 280,439 $ 43,489 $ 7,137,287(d) Foreign currency, at cost . . . . . . . . . . . . . . . . . . . . . . . . . . . . . . . . . . . . . . . . . . . . . . . . . . . . . . . . . . . . . . . . . . . . . . . . . . . . . . . $ 25,215,653 $ 41,333 $ 21,024 $ 17,956
See notes to financial statements.
Statements of Assets and LiabilitiesAugust 31, 2018
46 2 0 1 8 I S H A R E S A N N U A L R E P O R T T O S H A R E H O L D E R S
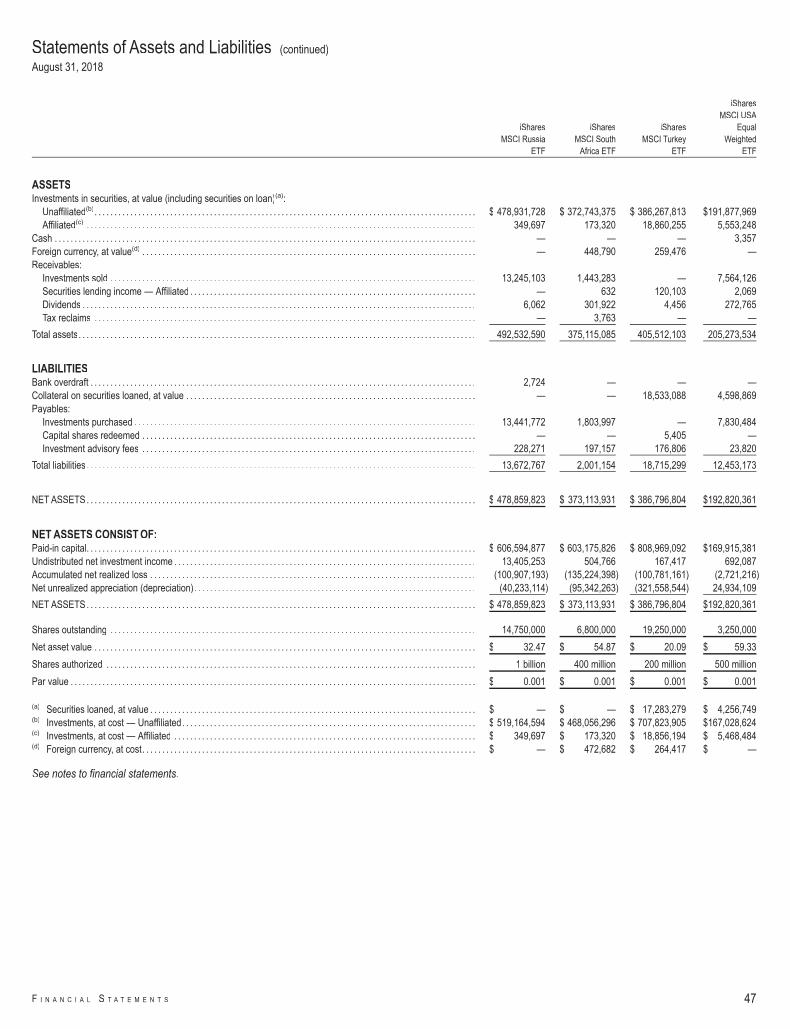
iSharesMSCI Russia
ETF
iSharesMSCI South
Africa ETF
iSharesMSCI Turkey
ETF
iSharesMSCI USA
EqualWeighted
ETF
ASSETSInvestments in securities, at value (including securities on loan)(a):
Unaffiliated(b). . . . . . . . . . . . . . . . . . . . . . . . . . . . . . . . . . . . . . . . . . . . . . . . . . . . . . . . . . . . . . . . . . . . . . . . . . . . . . . . . . . . . . . . . . . . . . . . $ 478,931,728 $ 372,743,375 $ 386,267,813 $191,877,969Affiliated(c) . . . . . . . . . . . . . . . . . . . . . . . . . . . . . . . . . . . . . . . . . . . . . . . . . . . . . . . . . . . . . . . . . . . . . . . . . . . . . . . . . . . . . . . . . . . . . . . . . . 349,697 173,320 18,860,255 5,553,248
Cash . . . . . . . . . . . . . . . . . . . . . . . . . . . . . . . . . . . . . . . . . . . . . . . . . . . . . . . . . . . . . . . . . . . . . . . . . . . . . . . . . . . . . . . . . . . . . . . . . . . . . . . . . . — — — 3,357Foreign currency, at value(d) . . . . . . . . . . . . . . . . . . . . . . . . . . . . . . . . . . . . . . . . . . . . . . . . . . . . . . . . . . . . . . . . . . . . . . . . . . . . . . . . . . . . — 448,790 259,476 —Receivables:
Investments sold . . . . . . . . . . . . . . . . . . . . . . . . . . . . . . . . . . . . . . . . . . . . . . . . . . . . . . . . . . . . . . . . . . . . . . . . . . . . . . . . . . . . . . . . . . . . 13,245,103 1,443,283 — 7,564,126Securities lending income — Affiliated . . . . . . . . . . . . . . . . . . . . . . . . . . . . . . . . . . . . . . . . . . . . . . . . . . . . . . . . . . . . . . . . . . . . . . . . — 632 120,103 2,069Dividends . . . . . . . . . . . . . . . . . . . . . . . . . . . . . . . . . . . . . . . . . . . . . . . . . . . . . . . . . . . . . . . . . . . . . . . . . . . . . . . . . . . . . . . . . . . . . . . . . . . 6,062 301,922 4,456 272,765Tax reclaims . . . . . . . . . . . . . . . . . . . . . . . . . . . . . . . . . . . . . . . . . . . . . . . . . . . . . . . . . . . . . . . . . . . . . . . . . . . . . . . . . . . . . . . . . . . . . . . . — 3,763 — —
Total assets. . . . . . . . . . . . . . . . . . . . . . . . . . . . . . . . . . . . . . . . . . . . . . . . . . . . . . . . . . . . . . . . . . . . . . . . . . . . . . . . . . . . . . . . . . . . . . . . . . . . 492,532,590 375,115,085 405,512,103 205,273,534
LIABILITIESBank overdraft . . . . . . . . . . . . . . . . . . . . . . . . . . . . . . . . . . . . . . . . . . . . . . . . . . . . . . . . . . . . . . . . . . . . . . . . . . . . . . . . . . . . . . . . . . . . . . . . . 2,724 — — —Collateral on securities loaned, at value . . . . . . . . . . . . . . . . . . . . . . . . . . . . . . . . . . . . . . . . . . . . . . . . . . . . . . . . . . . . . . . . . . . . . . . . . — — 18,533,088 4,598,869Payables:
Investments purchased . . . . . . . . . . . . . . . . . . . . . . . . . . . . . . . . . . . . . . . . . . . . . . . . . . . . . . . . . . . . . . . . . . . . . . . . . . . . . . . . . . . . . . 13,441,772 1,803,997 — 7,830,484Capital shares redeemed . . . . . . . . . . . . . . . . . . . . . . . . . . . . . . . . . . . . . . . . . . . . . . . . . . . . . . . . . . . . . . . . . . . . . . . . . . . . . . . . . . . . — — 5,405 —Investment advisory fees . . . . . . . . . . . . . . . . . . . . . . . . . . . . . . . . . . . . . . . . . . . . . . . . . . . . . . . . . . . . . . . . . . . . . . . . . . . . . . . . . . . . 228,271 197,157 176,806 23,820
Total liabilities . . . . . . . . . . . . . . . . . . . . . . . . . . . . . . . . . . . . . . . . . . . . . . . . . . . . . . . . . . . . . . . . . . . . . . . . . . . . . . . . . . . . . . . . . . . . . . . . . . 13,672,767 2,001,154 18,715,299 12,453,173
NET ASSETS. . . . . . . . . . . . . . . . . . . . . . . . . . . . . . . . . . . . . . . . . . . . . . . . . . . . . . . . . . . . . . . . . . . . . . . . . . . . . . . . . . . . . . . . . . . . . . . . . . $ 478,859,823 $ 373,113,931 $ 386,796,804 $192,820,361
NET ASSETS CONSIST OF:Paid-in capital. . . . . . . . . . . . . . . . . . . . . . . . . . . . . . . . . . . . . . . . . . . . . . . . . . . . . . . . . . . . . . . . . . . . . . . . . . . . . . . . . . . . . . . . . . . . . . . . . . $ 606,594,877 $ 603,175,826 $ 808,969,092 $169,915,381Undistributed net investment income . . . . . . . . . . . . . . . . . . . . . . . . . . . . . . . . . . . . . . . . . . . . . . . . . . . . . . . . . . . . . . . . . . . . . . . . . . . . 13,405,253 504,766 167,417 692,087Accumulated net realized loss . . . . . . . . . . . . . . . . . . . . . . . . . . . . . . . . . . . . . . . . . . . . . . . . . . . . . . . . . . . . . . . . . . . . . . . . . . . . . . . . . . (100,907,193) (135,224,398) (100,781,161) (2,721,216)Net unrealized appreciation (depreciation). . . . . . . . . . . . . . . . . . . . . . . . . . . . . . . . . . . . . . . . . . . . . . . . . . . . . . . . . . . . . . . . . . . . . . . (40,233,114) (95,342,263) (321,558,544) 24,934,109
NET ASSETS. . . . . . . . . . . . . . . . . . . . . . . . . . . . . . . . . . . . . . . . . . . . . . . . . . . . . . . . . . . . . . . . . . . . . . . . . . . . . . . . . . . . . . . . . . . . . . . . . . $ 478,859,823 $ 373,113,931 $ 386,796,804 $192,820,361
Shares outstanding . . . . . . . . . . . . . . . . . . . . . . . . . . . . . . . . . . . . . . . . . . . . . . . . . . . . . . . . . . . . . . . . . . . . . . . . . . . . . . . . . . . . . . . . . . . . 14,750,000 6,800,000 19,250,000 3,250,000
Net asset value . . . . . . . . . . . . . . . . . . . . . . . . . . . . . . . . . . . . . . . . . . . . . . . . . . . . . . . . . . . . . . . . . . . . . . . . . . . . . . . . . . . . . . . . . . . . . . . . $ 32.47 $ 54.87 $ 20.09 $ 59.33
Shares authorized . . . . . . . . . . . . . . . . . . . . . . . . . . . . . . . . . . . . . . . . . . . . . . . . . . . . . . . . . . . . . . . . . . . . . . . . . . . . . . . . . . . . . . . . . . . . . 1 billion 400 million 200 million 500 million
Par value . . . . . . . . . . . . . . . . . . . . . . . . . . . . . . . . . . . . . . . . . . . . . . . . . . . . . . . . . . . . . . . . . . . . . . . . . . . . . . . . . . . . . . . . . . . . . . . . . . . . . . $ 0.001 $ 0.001 $ 0.001 $ 0.001
(a) Securities loaned, at value . . . . . . . . . . . . . . . . . . . . . . . . . . . . . . . . . . . . . . . . . . . . . . . . . . . . . . . . . . . . . . . . . . . . . . . . . . . . . . . . . . $ — $ — $ 17,283,279 $ 4,256,749(b) Investments, at cost — Unaffiliated. . . . . . . . . . . . . . . . . . . . . . . . . . . . . . . . . . . . . . . . . . . . . . . . . . . . . . . . . . . . . . . . . . . . . . . . . . $ 519,164,594 $ 468,056,296 $ 707,823,905 $167,028,624(c) Investments, at cost — Affiliated . . . . . . . . . . . . . . . . . . . . . . . . . . . . . . . . . . . . . . . . . . . . . . . . . . . . . . . . . . . . . . . . . . . . . . . . . . . . $ 349,697 $ 173,320 $ 18,856,194 $ 5,468,484(d) Foreign currency, at cost. . . . . . . . . . . . . . . . . . . . . . . . . . . . . . . . . . . . . . . . . . . . . . . . . . . . . . . . . . . . . . . . . . . . . . . . . . . . . . . . . . . . $ — $ 472,682 $ 264,417 $ —
See notes to financial statements.
Statements of Assets and Liabilities (continued)
August 31, 2018
F I N A N C I A L S T A T E M E N T S 47
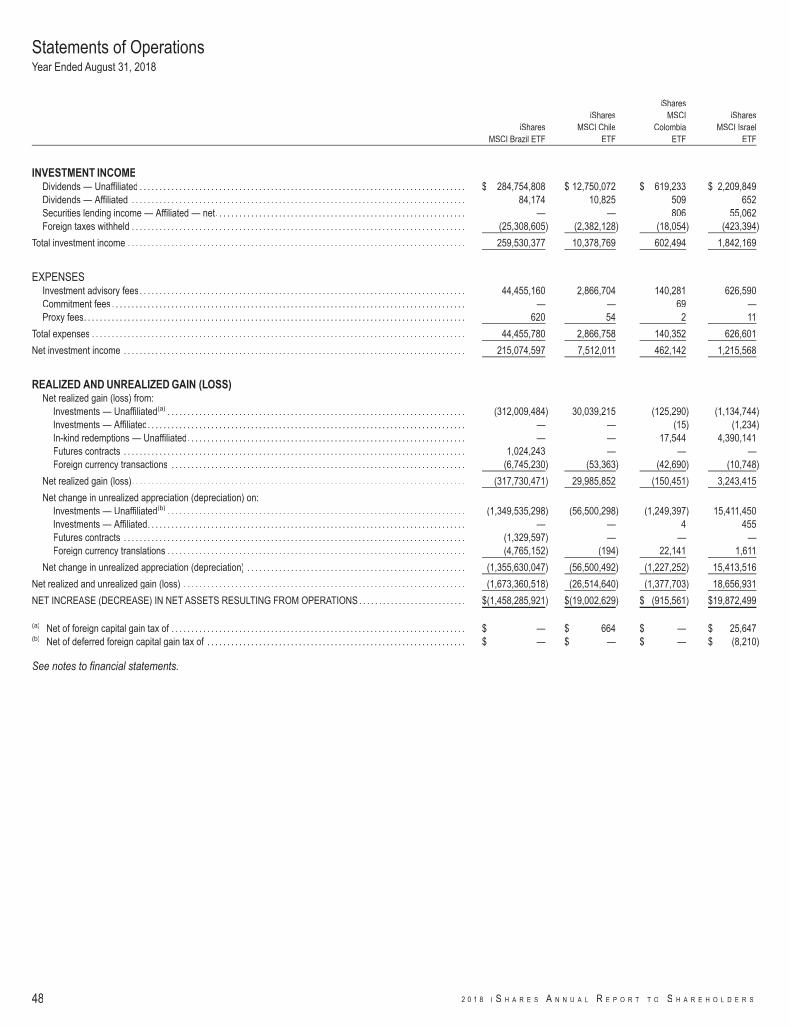
iSharesMSCI Brazil ETF
iSharesMSCI Chile
ETF
iSharesMSCI
ColombiaETF
iSharesMSCI Israel
ETF
INVESTMENT INCOMEDividends — Unaffiliated . . . . . . . . . . . . . . . . . . . . . . . . . . . . . . . . . . . . . . . . . . . . . . . . . . . . . . . . . . . . . . . . . . . . . . . . . . . . . . . . . . $ 284,754,808 $ 12,750,072 $ 619,233 $ 2,209,849Dividends — Affiliated . . . . . . . . . . . . . . . . . . . . . . . . . . . . . . . . . . . . . . . . . . . . . . . . . . . . . . . . . . . . . . . . . . . . . . . . . . . . . . . . . . . . 84,174 10,825 509 652Securities lending income — Affiliated — net. . . . . . . . . . . . . . . . . . . . . . . . . . . . . . . . . . . . . . . . . . . . . . . . . . . . . . . . . . . . . . . — — 806 55,062Foreign taxes withheld . . . . . . . . . . . . . . . . . . . . . . . . . . . . . . . . . . . . . . . . . . . . . . . . . . . . . . . . . . . . . . . . . . . . . . . . . . . . . . . . . . . . (25,308,605) (2,382,128) (18,054) (423,394)
Total investment income . . . . . . . . . . . . . . . . . . . . . . . . . . . . . . . . . . . . . . . . . . . . . . . . . . . . . . . . . . . . . . . . . . . . . . . . . . . . . . . . . . . . . 259,530,377 10,378,769 602,494 1,842,169
EXPENSESInvestment advisory fees. . . . . . . . . . . . . . . . . . . . . . . . . . . . . . . . . . . . . . . . . . . . . . . . . . . . . . . . . . . . . . . . . . . . . . . . . . . . . . . . . . 44,455,160 2,866,704 140,281 626,590Commitment fees . . . . . . . . . . . . . . . . . . . . . . . . . . . . . . . . . . . . . . . . . . . . . . . . . . . . . . . . . . . . . . . . . . . . . . . . . . . . . . . . . . . . . . . . . — — 69 —Proxy fees. . . . . . . . . . . . . . . . . . . . . . . . . . . . . . . . . . . . . . . . . . . . . . . . . . . . . . . . . . . . . . . . . . . . . . . . . . . . . . . . . . . . . . . . . . . . . . . . 620 54 2 11
Total expenses . . . . . . . . . . . . . . . . . . . . . . . . . . . . . . . . . . . . . . . . . . . . . . . . . . . . . . . . . . . . . . . . . . . . . . . . . . . . . . . . . . . . . . . . . . . . . . 44,455,780 2,866,758 140,352 626,601
Net investment income . . . . . . . . . . . . . . . . . . . . . . . . . . . . . . . . . . . . . . . . . . . . . . . . . . . . . . . . . . . . . . . . . . . . . . . . . . . . . . . . . . . . . . 215,074,597 7,512,011 462,142 1,215,568
REALIZED AND UNREALIZED GAIN (LOSS)Net realized gain (loss) from:
Investments — Unaffiliated(a) . . . . . . . . . . . . . . . . . . . . . . . . . . . . . . . . . . . . . . . . . . . . . . . . . . . . . . . . . . . . . . . . . . . . . . . . . . . (312,009,484) 30,039,215 (125,290) (1,134,744)Investments — Affiliated. . . . . . . . . . . . . . . . . . . . . . . . . . . . . . . . . . . . . . . . . . . . . . . . . . . . . . . . . . . . . . . . . . . . . . . . . . . . . . . . — — (15) (1,234)In-kind redemptions — Unaffiliated. . . . . . . . . . . . . . . . . . . . . . . . . . . . . . . . . . . . . . . . . . . . . . . . . . . . . . . . . . . . . . . . . . . . . . — — 17,544 4,390,141Futures contracts . . . . . . . . . . . . . . . . . . . . . . . . . . . . . . . . . . . . . . . . . . . . . . . . . . . . . . . . . . . . . . . . . . . . . . . . . . . . . . . . . . . . . . 1,024,243 — — —Foreign currency transactions . . . . . . . . . . . . . . . . . . . . . . . . . . . . . . . . . . . . . . . . . . . . . . . . . . . . . . . . . . . . . . . . . . . . . . . . . . (6,745,230) (53,363) (42,690) (10,748)
Net realized gain (loss). . . . . . . . . . . . . . . . . . . . . . . . . . . . . . . . . . . . . . . . . . . . . . . . . . . . . . . . . . . . . . . . . . . . . . . . . . . . . . . . . . . . (317,730,471) 29,985,852 (150,451) 3,243,415
Net change in unrealized appreciation (depreciation) on:Investments — Unaffiliated(b) . . . . . . . . . . . . . . . . . . . . . . . . . . . . . . . . . . . . . . . . . . . . . . . . . . . . . . . . . . . . . . . . . . . . . . . . . . . (1,349,535,298) (56,500,298) (1,249,397) 15,411,450Investments — Affiliated. . . . . . . . . . . . . . . . . . . . . . . . . . . . . . . . . . . . . . . . . . . . . . . . . . . . . . . . . . . . . . . . . . . . . . . . . . . . . . . . — — 4 455Futures contracts . . . . . . . . . . . . . . . . . . . . . . . . . . . . . . . . . . . . . . . . . . . . . . . . . . . . . . . . . . . . . . . . . . . . . . . . . . . . . . . . . . . . . . (1,329,597) — — —Foreign currency translations . . . . . . . . . . . . . . . . . . . . . . . . . . . . . . . . . . . . . . . . . . . . . . . . . . . . . . . . . . . . . . . . . . . . . . . . . . . (4,765,152) (194) 22,141 1,611
Net change in unrealized appreciation (depreciation) . . . . . . . . . . . . . . . . . . . . . . . . . . . . . . . . . . . . . . . . . . . . . . . . . . . . . . . (1,355,630,047) (56,500,492) (1,227,252) 15,413,516
Net realized and unrealized gain (loss) . . . . . . . . . . . . . . . . . . . . . . . . . . . . . . . . . . . . . . . . . . . . . . . . . . . . . . . . . . . . . . . . . . . . . . . (1,673,360,518) (26,514,640) (1,377,703) 18,656,931
NET INCREASE (DECREASE) IN NET ASSETS RESULTING FROM OPERATIONS . . . . . . . . . . . . . . . . . . . . . . . . . . . $(1,458,285,921) $(19,002,629) $ (915,561) $19,872,499
(a) Net of foreign capital gain tax of . . . . . . . . . . . . . . . . . . . . . . . . . . . . . . . . . . . . . . . . . . . . . . . . . . . . . . . . . . . . . . . . . . . . . . . . . . $ — $ 664 $ — $ 25,647(b) Net of deferred foreign capital gain tax of . . . . . . . . . . . . . . . . . . . . . . . . . . . . . . . . . . . . . . . . . . . . . . . . . . . . . . . . . . . . . . . . . $ — $ — $ — $ (8,210)
See notes to financial statements.
Statements of OperationsYear Ended August 31, 2018
48 2 0 1 8 I S H A R E S A N N U A L R E P O R T T O S H A R E H O L D E R S
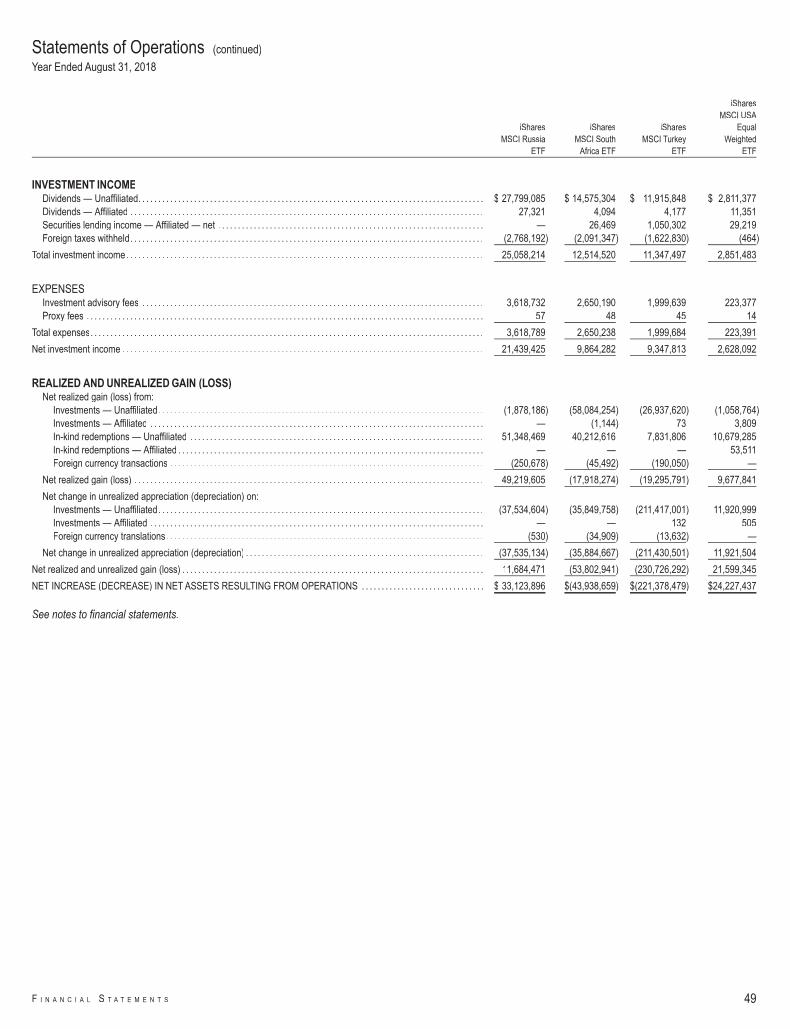
iSharesMSCI Russia
ETF
iSharesMSCI South
Africa ETF
iSharesMSCI Turkey
ETF
iSharesMSCI USA
EqualWeighted
ETF
INVESTMENT INCOMEDividends — Unaffiliated. . . . . . . . . . . . . . . . . . . . . . . . . . . . . . . . . . . . . . . . . . . . . . . . . . . . . . . . . . . . . . . . . . . . . . . . . . . . . . . . . . . . . . . $ 27,799,085 $ 14,575,304 $ 11,915,848 $ 2,811,377Dividends — Affiliated . . . . . . . . . . . . . . . . . . . . . . . . . . . . . . . . . . . . . . . . . . . . . . . . . . . . . . . . . . . . . . . . . . . . . . . . . . . . . . . . . . . . . . . . . 27,321 4,094 4,177 11,351Securities lending income — Affiliated — net . . . . . . . . . . . . . . . . . . . . . . . . . . . . . . . . . . . . . . . . . . . . . . . . . . . . . . . . . . . . . . . . . . . — 26,469 1,050,302 29,219Foreign taxes withheld. . . . . . . . . . . . . . . . . . . . . . . . . . . . . . . . . . . . . . . . . . . . . . . . . . . . . . . . . . . . . . . . . . . . . . . . . . . . . . . . . . . . . . . . . (2,768,192) (2,091,347) (1,622,830) (464)
Total investment income. . . . . . . . . . . . . . . . . . . . . . . . . . . . . . . . . . . . . . . . . . . . . . . . . . . . . . . . . . . . . . . . . . . . . . . . . . . . . . . . . . . . . . . . . . 25,058,214 12,514,520 11,347,497 2,851,483
EXPENSESInvestment advisory fees . . . . . . . . . . . . . . . . . . . . . . . . . . . . . . . . . . . . . . . . . . . . . . . . . . . . . . . . . . . . . . . . . . . . . . . . . . . . . . . . . . . . . . 3,618,732 2,650,190 1,999,639 223,377Proxy fees . . . . . . . . . . . . . . . . . . . . . . . . . . . . . . . . . . . . . . . . . . . . . . . . . . . . . . . . . . . . . . . . . . . . . . . . . . . . . . . . . . . . . . . . . . . . . . . . . . . . 57 48 45 14
Total expenses. . . . . . . . . . . . . . . . . . . . . . . . . . . . . . . . . . . . . . . . . . . . . . . . . . . . . . . . . . . . . . . . . . . . . . . . . . . . . . . . . . . . . . . . . . . . . . . . . . . 3,618,789 2,650,238 1,999,684 223,391
Net investment income . . . . . . . . . . . . . . . . . . . . . . . . . . . . . . . . . . . . . . . . . . . . . . . . . . . . . . . . . . . . . . . . . . . . . . . . . . . . . . . . . . . . . . . . . . . 21,439,425 9,864,282 9,347,813 2,628,092
REALIZED AND UNREALIZED GAIN (LOSS)Net realized gain (loss) from:
Investments — Unaffiliated. . . . . . . . . . . . . . . . . . . . . . . . . . . . . . . . . . . . . . . . . . . . . . . . . . . . . . . . . . . . . . . . . . . . . . . . . . . . . . . . . . (1,878,186) (58,084,254) (26,937,620) (1,058,764)Investments — Affiliated . . . . . . . . . . . . . . . . . . . . . . . . . . . . . . . . . . . . . . . . . . . . . . . . . . . . . . . . . . . . . . . . . . . . . . . . . . . . . . . . . . . . — (1,144) 73 3,809In-kind redemptions — Unaffiliated . . . . . . . . . . . . . . . . . . . . . . . . . . . . . . . . . . . . . . . . . . . . . . . . . . . . . . . . . . . . . . . . . . . . . . . . . . 51,348,469 40,212,616 7,831,806 10,679,285In-kind redemptions — Affiliated . . . . . . . . . . . . . . . . . . . . . . . . . . . . . . . . . . . . . . . . . . . . . . . . . . . . . . . . . . . . . . . . . . . . . . . . . . . . . — — — 53,511Foreign currency transactions . . . . . . . . . . . . . . . . . . . . . . . . . . . . . . . . . . . . . . . . . . . . . . . . . . . . . . . . . . . . . . . . . . . . . . . . . . . . . . . (250,678) (45,492) (190,050) —
Net realized gain (loss) . . . . . . . . . . . . . . . . . . . . . . . . . . . . . . . . . . . . . . . . . . . . . . . . . . . . . . . . . . . . . . . . . . . . . . . . . . . . . . . . . . . . . . . . 49,219,605 (17,918,274) (19,295,791) 9,677,841
Net change in unrealized appreciation (depreciation) on:Investments — Unaffiliated. . . . . . . . . . . . . . . . . . . . . . . . . . . . . . . . . . . . . . . . . . . . . . . . . . . . . . . . . . . . . . . . . . . . . . . . . . . . . . . . . . (37,534,604) (35,849,758) (211,417,001) 11,920,999Investments — Affiliated . . . . . . . . . . . . . . . . . . . . . . . . . . . . . . . . . . . . . . . . . . . . . . . . . . . . . . . . . . . . . . . . . . . . . . . . . . . . . . . . . . . . — — 132 505Foreign currency translations. . . . . . . . . . . . . . . . . . . . . . . . . . . . . . . . . . . . . . . . . . . . . . . . . . . . . . . . . . . . . . . . . . . . . . . . . . . . . . . . (530) (34,909) (13,632) —
Net change in unrealized appreciation (depreciation) . . . . . . . . . . . . . . . . . . . . . . . . . . . . . . . . . . . . . . . . . . . . . . . . . . . . . . . . . . . . (37,535,134) (35,884,667) (211,430,501) 11,921,504
Net realized and unrealized gain (loss) . . . . . . . . . . . . . . . . . . . . . . . . . . . . . . . . . . . . . . . . . . . . . . . . . . . . . . . . . . . . . . . . . . . . . . . . . . . . 11,684,471 (53,802,941) (230,726,292) 21,599,345
NET INCREASE (DECREASE) IN NET ASSETS RESULTING FROM OPERATIONS . . . . . . . . . . . . . . . . . . . . . . . . . . . . . . . $ 33,123,896 $(43,938,659) $(221,378,479) $24,227,437
See notes to financial statements.
Statements of Operations (continued)
Year Ended August 31, 2018
F I N A N C I A L S T A T E M E N T S 49
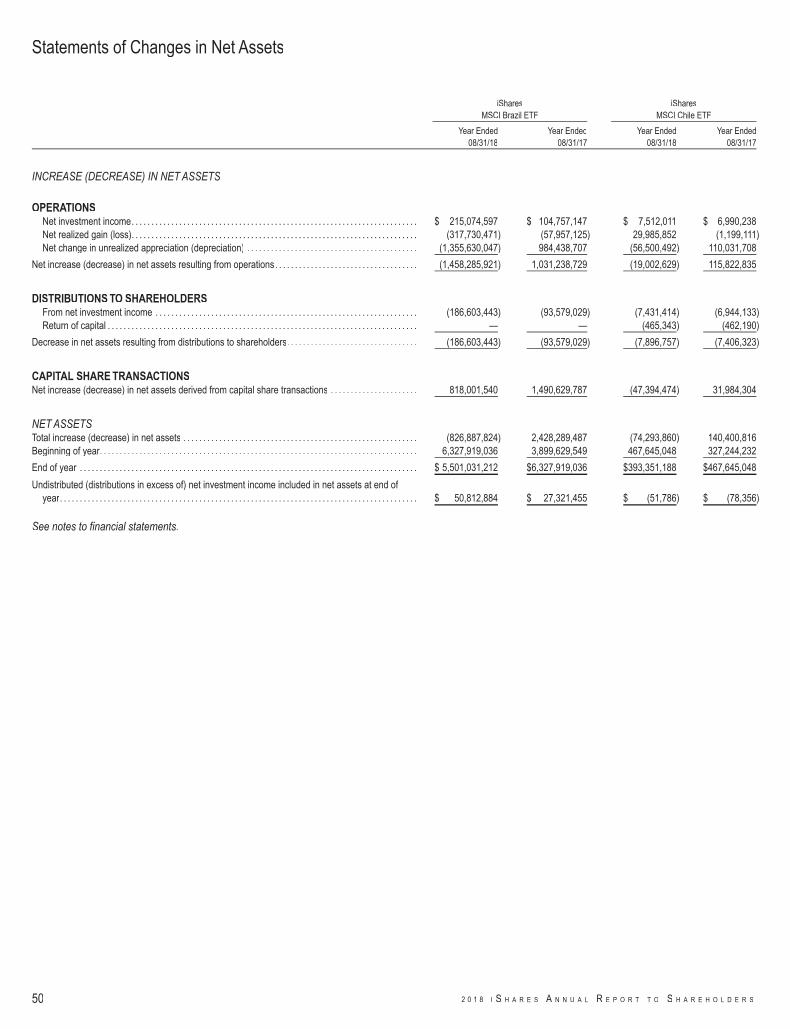
iSharesMSCI Brazil ETF
iSharesMSCI Chile ETF
Year Ended08/31/18
Year Ended08/31/17
Year Ended08/31/18
Year Ended08/31/17
INCREASE (DECREASE) IN NET ASSETS
OPERATIONSNet investment income. . . . . . . . . . . . . . . . . . . . . . . . . . . . . . . . . . . . . . . . . . . . . . . . . . . . . . . . . . . . . . . . . . . . . . . . $ 215,074,597 $ 104,757,147 $ 7,512,011 $ 6,990,238Net realized gain (loss). . . . . . . . . . . . . . . . . . . . . . . . . . . . . . . . . . . . . . . . . . . . . . . . . . . . . . . . . . . . . . . . . . . . . . . . (317,730,471) (57,957,125) 29,985,852 (1,199,111)Net change in unrealized appreciation (depreciation) . . . . . . . . . . . . . . . . . . . . . . . . . . . . . . . . . . . . . . . . . . . (1,355,630,047) 984,438,707 (56,500,492) 110,031,708
Net increase (decrease) in net assets resulting from operations. . . . . . . . . . . . . . . . . . . . . . . . . . . . . . . . . . . . (1,458,285,921) 1,031,238,729 (19,002,629) 115,822,835
DISTRIBUTIONS TO SHAREHOLDERSFrom net investment income . . . . . . . . . . . . . . . . . . . . . . . . . . . . . . . . . . . . . . . . . . . . . . . . . . . . . . . . . . . . . . . . . . (186,603,443) (93,579,029) (7,431,414) (6,944,133)Return of capital . . . . . . . . . . . . . . . . . . . . . . . . . . . . . . . . . . . . . . . . . . . . . . . . . . . . . . . . . . . . . . . . . . . . . . . . . . . . . . — — (465,343) (462,190)
Decrease in net assets resulting from distributions to shareholders. . . . . . . . . . . . . . . . . . . . . . . . . . . . . . . . . (186,603,443) (93,579,029) (7,896,757) (7,406,323)
CAPITAL SHARE TRANSACTIONSNet increase (decrease) in net assets derived from capital share transactions . . . . . . . . . . . . . . . . . . . . . . 818,001,540 1,490,629,787 (47,394,474) 31,984,304
NET ASSETSTotal increase (decrease) in net assets . . . . . . . . . . . . . . . . . . . . . . . . . . . . . . . . . . . . . . . . . . . . . . . . . . . . . . . . . . . (826,887,824) 2,428,289,487 (74,293,860) 140,400,816Beginning of year. . . . . . . . . . . . . . . . . . . . . . . . . . . . . . . . . . . . . . . . . . . . . . . . . . . . . . . . . . . . . . . . . . . . . . . . . . . . . . . . 6,327,919,036 3,899,629,549 467,645,048 327,244,232
End of year . . . . . . . . . . . . . . . . . . . . . . . . . . . . . . . . . . . . . . . . . . . . . . . . . . . . . . . . . . . . . . . . . . . . . . . . . . . . . . . . . . . . . $ 5,501,031,212 $6,327,919,036 $393,351,188 $467,645,048
Undistributed (distributions in excess of) net investment income included in net assets at end ofyear. . . . . . . . . . . . . . . . . . . . . . . . . . . . . . . . . . . . . . . . . . . . . . . . . . . . . . . . . . . . . . . . . . . . . . . . . . . . . . . . . . . . . . . . . . $ 50,812,884 $ 27,321,455 $ (51,786) $ (78,356)
See notes to financial statements.
Statements of Changes in Net Assets
50 2 0 1 8 I S H A R E S A N N U A L R E P O R T T O S H A R E H O L D E R S

iSharesMSCI Colombia ETF
iSharesMSCI Israel ETF
Year Ended08/31/18
Year Ended08/31/17
Year Ended08/31/18
Year Ended08/31/17
INCREASE (DECREASE) IN NET ASSETS
OPERATIONSNet investment income . . . . . . . . . . . . . . . . . . . . . . . . . . . . . . . . . . . . . . . . . . . . . . . . . . . . . . . . . . . . . . . . . . . . . . . . . . . . . . . . . $ 462,142 $ 309,200 $ 1,215,568 $ 1,230,124Net realized gain (loss) . . . . . . . . . . . . . . . . . . . . . . . . . . . . . . . . . . . . . . . . . . . . . . . . . . . . . . . . . . . . . . . . . . . . . . . . . . . . . . . . . (150,451) (151,505) 3,243,415 2,010,978Net change in unrealized appreciation (depreciation). . . . . . . . . . . . . . . . . . . . . . . . . . . . . . . . . . . . . . . . . . . . . . . . . . . . . (1,227,252) 1,966,444 15,413,516 (2,512,946)
Net increase (decrease) in net assets resulting from operations . . . . . . . . . . . . . . . . . . . . . . . . . . . . . . . . . . . . . . . . . . . . . (915,561) 2,124,139 19,872,499 728,156
DISTRIBUTIONS TO SHAREHOLDERSFrom net investment income. . . . . . . . . . . . . . . . . . . . . . . . . . . . . . . . . . . . . . . . . . . . . . . . . . . . . . . . . . . . . . . . . . . . . . . . . . . . (365,825) (229,358) (2,219,395) (1,597,362)
Decrease in net assets resulting from distributions to shareholders . . . . . . . . . . . . . . . . . . . . . . . . . . . . . . . . . . . . . . . . . . (365,825) (229,358) (2,219,395) (1,597,362)
CAPITAL SHARE TRANSACTIONSNet increase (decrease) in net assets derived from capital share transactions. . . . . . . . . . . . . . . . . . . . . . . . . . . . . . . . 4,521,784 3,562,888 14,930,276 (3,771,367)
NET ASSETSTotal increase (decrease) in net assets. . . . . . . . . . . . . . . . . . . . . . . . . . . . . . . . . . . . . . . . . . . . . . . . . . . . . . . . . . . . . . . . . . . . . 3,240,398 5,457,669 32,583,380 (4,640,573)Beginning of year . . . . . . . . . . . . . . . . . . . . . . . . . . . . . . . . . . . . . . . . . . . . . . . . . . . . . . . . . . . . . . . . . . . . . . . . . . . . . . . . . . . . . . . . . 22,593,883 17,136,214 89,151,990 93,792,563
End of year . . . . . . . . . . . . . . . . . . . . . . . . . . . . . . . . . . . . . . . . . . . . . . . . . . . . . . . . . . . . . . . . . . . . . . . . . . . . . . . . . . . . . . . . . . . . . . . $25,834,281 $22,593,883 $121,735,370 $89,151,990
Undistributed (distributions in excess of) net investment income included in net assets at end of year . . . . . . . . . $ 100,951 $ 47,324 $ (519,165) $ (39,108)
See notes to financial statements.
Statements of Changes in Net Assets (continued)
F I N A N C I A L S T A T E M E N T S 51
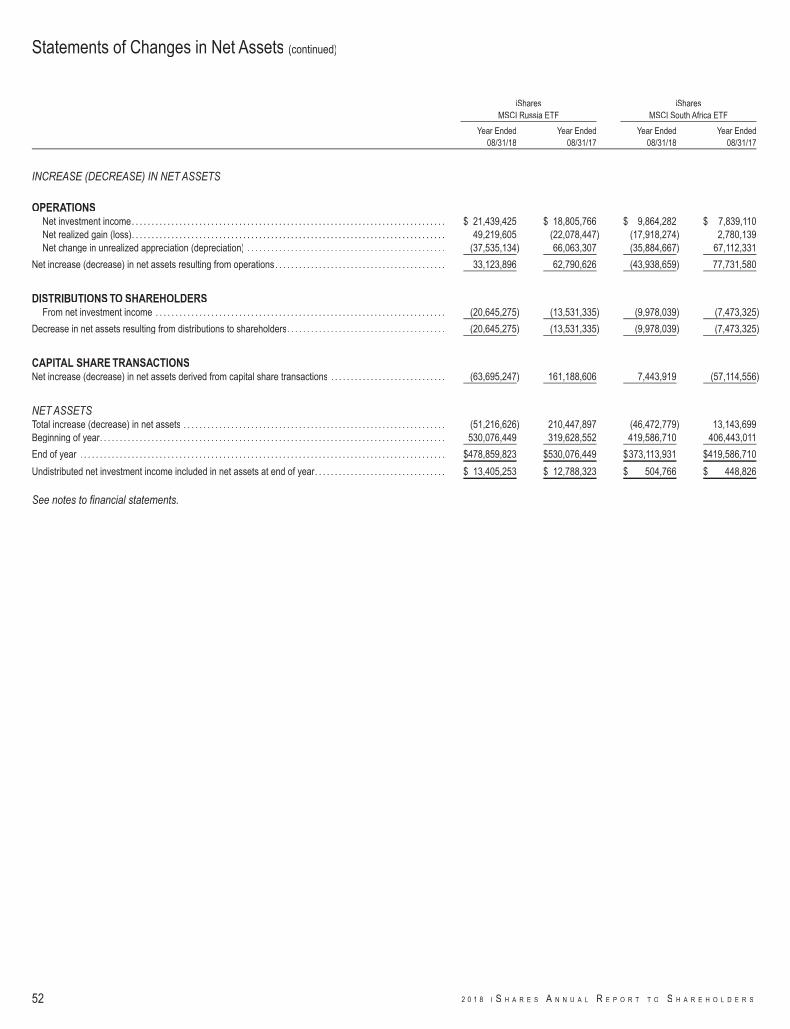
iSharesMSCI Russia ETF
iSharesMSCI South Africa ETF
Year Ended08/31/18
Year Ended08/31/17
Year Ended08/31/18
Year Ended08/31/17
INCREASE (DECREASE) IN NET ASSETS
OPERATIONSNet investment income. . . . . . . . . . . . . . . . . . . . . . . . . . . . . . . . . . . . . . . . . . . . . . . . . . . . . . . . . . . . . . . . . . . . . . . . . . . . . . . $ 21,439,425 $ 18,805,766 $ 9,864,282 $ 7,839,110Net realized gain (loss). . . . . . . . . . . . . . . . . . . . . . . . . . . . . . . . . . . . . . . . . . . . . . . . . . . . . . . . . . . . . . . . . . . . . . . . . . . . . . . 49,219,605 (22,078,447) (17,918,274) 2,780,139Net change in unrealized appreciation (depreciation) . . . . . . . . . . . . . . . . . . . . . . . . . . . . . . . . . . . . . . . . . . . . . . . . . . (37,535,134) 66,063,307 (35,884,667) 67,112,331
Net increase (decrease) in net assets resulting from operations. . . . . . . . . . . . . . . . . . . . . . . . . . . . . . . . . . . . . . . . . . . 33,123,896 62,790,626 (43,938,659) 77,731,580
DISTRIBUTIONS TO SHAREHOLDERSFrom net investment income . . . . . . . . . . . . . . . . . . . . . . . . . . . . . . . . . . . . . . . . . . . . . . . . . . . . . . . . . . . . . . . . . . . . . . . . . (20,645,275) (13,531,335) (9,978,039) (7,473,325)
Decrease in net assets resulting from distributions to shareholders. . . . . . . . . . . . . . . . . . . . . . . . . . . . . . . . . . . . . . . . (20,645,275) (13,531,335) (9,978,039) (7,473,325)
CAPITAL SHARE TRANSACTIONSNet increase (decrease) in net assets derived from capital share transactions . . . . . . . . . . . . . . . . . . . . . . . . . . . . . (63,695,247) 161,188,606 7,443,919 (57,114,556)
NET ASSETSTotal increase (decrease) in net assets . . . . . . . . . . . . . . . . . . . . . . . . . . . . . . . . . . . . . . . . . . . . . . . . . . . . . . . . . . . . . . . . . . (51,216,626) 210,447,897 (46,472,779) 13,143,699Beginning of year. . . . . . . . . . . . . . . . . . . . . . . . . . . . . . . . . . . . . . . . . . . . . . . . . . . . . . . . . . . . . . . . . . . . . . . . . . . . . . . . . . . . . . . 530,076,449 319,628,552 419,586,710 406,443,011
End of year . . . . . . . . . . . . . . . . . . . . . . . . . . . . . . . . . . . . . . . . . . . . . . . . . . . . . . . . . . . . . . . . . . . . . . . . . . . . . . . . . . . . . . . . . . . . $478,859,823 $530,076,449 $373,113,931 $419,586,710
Undistributed net investment income included in net assets at end of year. . . . . . . . . . . . . . . . . . . . . . . . . . . . . . . . . $ 13,405,253 $ 12,788,323 $ 504,766 $ 448,826
See notes to financial statements.
Statements of Changes in Net Assets (continued)
52 2 0 1 8 I S H A R E S A N N U A L R E P O R T T O S H A R E H O L D E R S
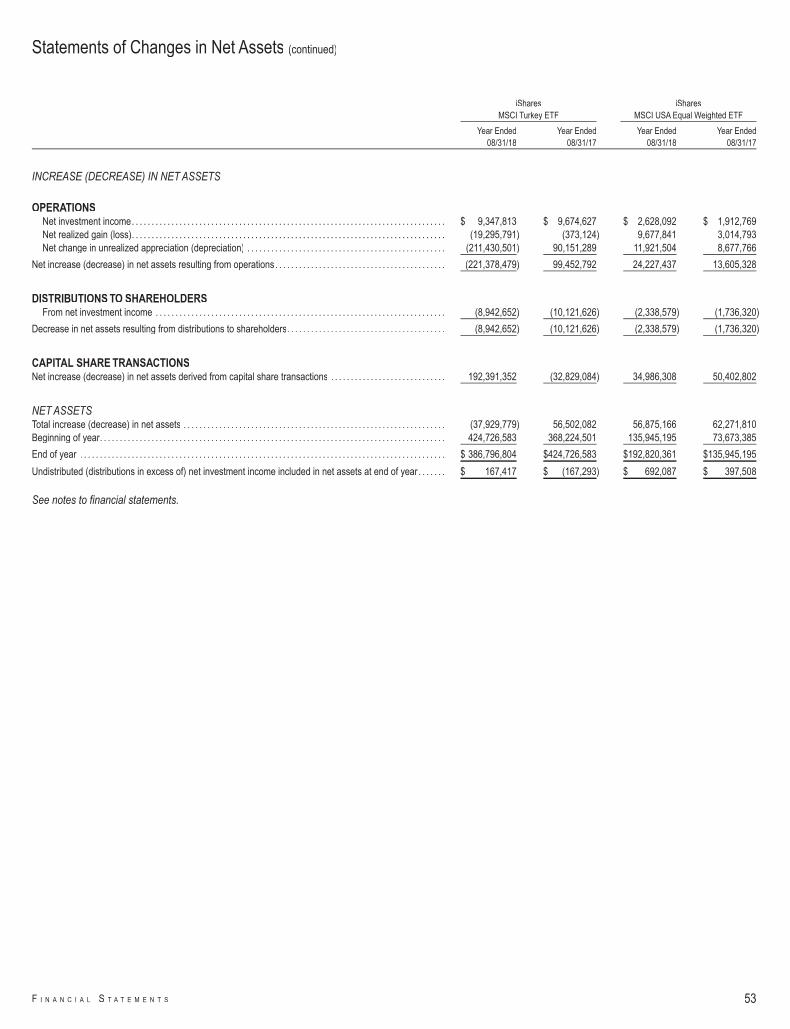
iSharesMSCI Turkey ETF
iSharesMSCI USA Equal Weighted ETF
Year Ended08/31/18
Year Ended08/31/17
Year Ended08/31/18
Year Ended08/31/17
INCREASE (DECREASE) IN NET ASSETS
OPERATIONSNet investment income. . . . . . . . . . . . . . . . . . . . . . . . . . . . . . . . . . . . . . . . . . . . . . . . . . . . . . . . . . . . . . . . . . . . . . . . . . . . . . . $ 9,347,813 $ 9,674,627 $ 2,628,092 $ 1,912,769Net realized gain (loss). . . . . . . . . . . . . . . . . . . . . . . . . . . . . . . . . . . . . . . . . . . . . . . . . . . . . . . . . . . . . . . . . . . . . . . . . . . . . . . (19,295,791) (373,124) 9,677,841 3,014,793Net change in unrealized appreciation (depreciation) . . . . . . . . . . . . . . . . . . . . . . . . . . . . . . . . . . . . . . . . . . . . . . . . . . (211,430,501) 90,151,289 11,921,504 8,677,766
Net increase (decrease) in net assets resulting from operations. . . . . . . . . . . . . . . . . . . . . . . . . . . . . . . . . . . . . . . . . . . (221,378,479) 99,452,792 24,227,437 13,605,328
DISTRIBUTIONS TO SHAREHOLDERSFrom net investment income . . . . . . . . . . . . . . . . . . . . . . . . . . . . . . . . . . . . . . . . . . . . . . . . . . . . . . . . . . . . . . . . . . . . . . . . . (8,942,652) (10,121,626) (2,338,579) (1,736,320)
Decrease in net assets resulting from distributions to shareholders. . . . . . . . . . . . . . . . . . . . . . . . . . . . . . . . . . . . . . . . (8,942,652) (10,121,626) (2,338,579) (1,736,320)
CAPITAL SHARE TRANSACTIONSNet increase (decrease) in net assets derived from capital share transactions . . . . . . . . . . . . . . . . . . . . . . . . . . . . . 192,391,352 (32,829,084) 34,986,308 50,402,802
NET ASSETSTotal increase (decrease) in net assets . . . . . . . . . . . . . . . . . . . . . . . . . . . . . . . . . . . . . . . . . . . . . . . . . . . . . . . . . . . . . . . . . . (37,929,779) 56,502,082 56,875,166 62,271,810Beginning of year. . . . . . . . . . . . . . . . . . . . . . . . . . . . . . . . . . . . . . . . . . . . . . . . . . . . . . . . . . . . . . . . . . . . . . . . . . . . . . . . . . . . . . . 424,726,583 368,224,501 135,945,195 73,673,385
End of year . . . . . . . . . . . . . . . . . . . . . . . . . . . . . . . . . . . . . . . . . . . . . . . . . . . . . . . . . . . . . . . . . . . . . . . . . . . . . . . . . . . . . . . . . . . . $ 386,796,804 $424,726,583 $192,820,361 $135,945,195
Undistributed (distributions in excess of) net investment income included in net assets at end of year . . . . . . . $ 167,417 $ (167,293) $ 692,087 $ 397,508
See notes to financial statements.
Statements of Changes in Net Assets (continued)
F I N A N C I A L S T A T E M E N T S 53
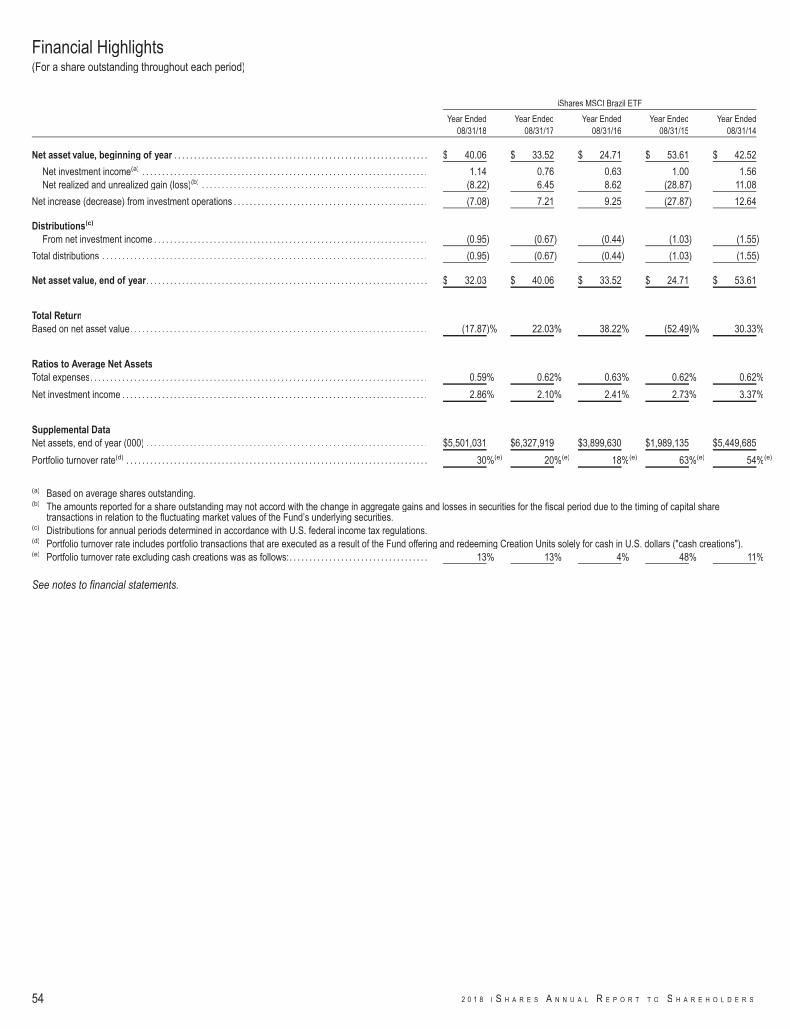
iShares MSCI Brazil ETF
Year Ended08/31/18
Year Ended08/31/17
Year Ended08/31/16
Year Ended08/31/15
Year Ended08/31/14
Net asset value, beginning of year . . . . . . . . . . . . . . . . . . . . . . . . . . . . . . . . . . . . . . . . . . . . . . . . . . . . . . . . . . . . . . . . $ 40.06 $ 33.52 $ 24.71 $ 53.61 $ 42.52
Net investment income(a) . . . . . . . . . . . . . . . . . . . . . . . . . . . . . . . . . . . . . . . . . . . . . . . . . . . . . . . . . . . . . . . . . . . . . . . . 1.14 0.76 0.63 1.00 1.56Net realized and unrealized gain (loss)(b) . . . . . . . . . . . . . . . . . . . . . . . . . . . . . . . . . . . . . . . . . . . . . . . . . . . . . . . . . (8.22) 6.45 8.62 (28.87) 11.08
Net increase (decrease) from investment operations . . . . . . . . . . . . . . . . . . . . . . . . . . . . . . . . . . . . . . . . . . . . . . . . . (7.08) 7.21 9.25 (27.87) 12.64
Distributions(c)
From net investment income . . . . . . . . . . . . . . . . . . . . . . . . . . . . . . . . . . . . . . . . . . . . . . . . . . . . . . . . . . . . . . . . . . . . . (0.95) (0.67) (0.44) (1.03) (1.55)
Total distributions . . . . . . . . . . . . . . . . . . . . . . . . . . . . . . . . . . . . . . . . . . . . . . . . . . . . . . . . . . . . . . . . . . . . . . . . . . . . . . . . . . (0.95) (0.67) (0.44) (1.03) (1.55)
Net asset value, end of year. . . . . . . . . . . . . . . . . . . . . . . . . . . . . . . . . . . . . . . . . . . . . . . . . . . . . . . . . . . . . . . . . . . . . . . $ 32.03 $ 40.06 $ 33.52 $ 24.71 $ 53.61
Total ReturnBased on net asset value. . . . . . . . . . . . . . . . . . . . . . . . . . . . . . . . . . . . . . . . . . . . . . . . . . . . . . . . . . . . . . . . . . . . . . . . . . . (17.87)% 22.03% 38.22% (52.49)% 30.33%
Ratios to Average Net AssetsTotal expenses. . . . . . . . . . . . . . . . . . . . . . . . . . . . . . . . . . . . . . . . . . . . . . . . . . . . . . . . . . . . . . . . . . . . . . . . . . . . . . . . . . . . . 0.59% 0.62% 0.63% 0.62% 0.62%
Net investment income . . . . . . . . . . . . . . . . . . . . . . . . . . . . . . . . . . . . . . . . . . . . . . . . . . . . . . . . . . . . . . . . . . . . . . . . . . . . . 2.86% 2.10% 2.41% 2.73% 3.37%
Supplemental DataNet assets, end of year (000) . . . . . . . . . . . . . . . . . . . . . . . . . . . . . . . . . . . . . . . . . . . . . . . . . . . . . . . . . . . . . . . . . . . . . . . $5,501,031 $6,327,919 $3,899,630 $1,989,135 $5,449,685
Portfolio turnover rate(d) . . . . . . . . . . . . . . . . . . . . . . . . . . . . . . . . . . . . . . . . . . . . . . . . . . . . . . . . . . . . . . . . . . . . . . . . . . . . 30%(e) 20%(e) 18%(e) 63%(e) 54%(e)
(a) Based on average shares outstanding.(b) The amounts reported for a share outstanding may not accord with the change in aggregate gains and losses in securities for the fiscal period due to the timing of capital share
transactions in relation to the fluctuating market values of the Fund’s underlying securities.(c) Distributions for annual periods determined in accordance with U.S. federal income tax regulations.(d) Portfolio turnover rate includes portfolio transactions that are executed as a result of the Fund offering and redeeming Creation Units solely for cash in U.S. dollars ("cash creations").(e) Portfolio turnover rate excluding cash creations was as follows:. . . . . . . . . . . . . . . . . . . . . . . . . . . . . . . . . . . 13% 13% 4% 48% 11%
See notes to financial statements.
Financial Highlights(For a share outstanding throughout each period)
54 2 0 1 8 I S H A R E S A N N U A L R E P O R T T O S H A R E H O L D E R S
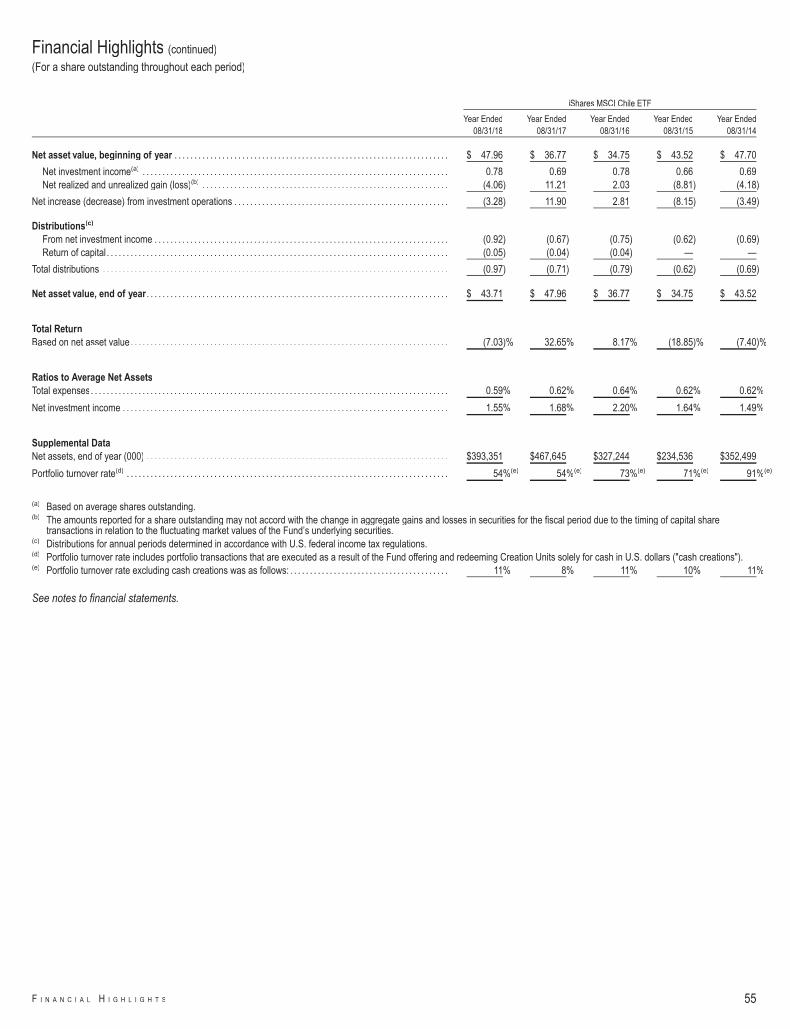
iShares MSCI Chile ETF
Year Ended08/31/18
Year Ended08/31/17
Year Ended08/31/16
Year Ended08/31/15
Year Ended08/31/14
Net asset value, beginning of year . . . . . . . . . . . . . . . . . . . . . . . . . . . . . . . . . . . . . . . . . . . . . . . . . . . . . . . . . . . . . . . . . . . . . $ 47.96 $ 36.77 $ 34.75 $ 43.52 $ 47.70
Net investment income(a) . . . . . . . . . . . . . . . . . . . . . . . . . . . . . . . . . . . . . . . . . . . . . . . . . . . . . . . . . . . . . . . . . . . . . . . . . . . . . 0.78 0.69 0.78 0.66 0.69Net realized and unrealized gain (loss)(b) . . . . . . . . . . . . . . . . . . . . . . . . . . . . . . . . . . . . . . . . . . . . . . . . . . . . . . . . . . . . . . (4.06) 11.21 2.03 (8.81) (4.18)
Net increase (decrease) from investment operations . . . . . . . . . . . . . . . . . . . . . . . . . . . . . . . . . . . . . . . . . . . . . . . . . . . . . . (3.28) 11.90 2.81 (8.15) (3.49)
Distributions(c)
From net investment income . . . . . . . . . . . . . . . . . . . . . . . . . . . . . . . . . . . . . . . . . . . . . . . . . . . . . . . . . . . . . . . . . . . . . . . . . . (0.92) (0.67) (0.75) (0.62) (0.69)Return of capital . . . . . . . . . . . . . . . . . . . . . . . . . . . . . . . . . . . . . . . . . . . . . . . . . . . . . . . . . . . . . . . . . . . . . . . . . . . . . . . . . . . . . . (0.05) (0.04) (0.04) — —
Total distributions . . . . . . . . . . . . . . . . . . . . . . . . . . . . . . . . . . . . . . . . . . . . . . . . . . . . . . . . . . . . . . . . . . . . . . . . . . . . . . . . . . . . . . . (0.97) (0.71) (0.79) (0.62) (0.69)
Net asset value, end of year . . . . . . . . . . . . . . . . . . . . . . . . . . . . . . . . . . . . . . . . . . . . . . . . . . . . . . . . . . . . . . . . . . . . . . . . . . . . $ 43.71 $ 47.96 $ 36.77 $ 34.75 $ 43.52
Total ReturnBased on net asset value. . . . . . . . . . . . . . . . . . . . . . . . . . . . . . . . . . . . . . . . . . . . . . . . . . . . . . . . . . . . . . . . . . . . . . . . . . . . . . . . (7.03)% 32.65% 8.17% (18.85)% (7.40)%
Ratios to Average Net AssetsTotal expenses. . . . . . . . . . . . . . . . . . . . . . . . . . . . . . . . . . . . . . . . . . . . . . . . . . . . . . . . . . . . . . . . . . . . . . . . . . . . . . . . . . . . . . . . . . 0.59% 0.62% 0.64% 0.62% 0.62%
Net investment income . . . . . . . . . . . . . . . . . . . . . . . . . . . . . . . . . . . . . . . . . . . . . . . . . . . . . . . . . . . . . . . . . . . . . . . . . . . . . . . . . . 1.55% 1.68% 2.20% 1.64% 1.49%
Supplemental DataNet assets, end of year (000) . . . . . . . . . . . . . . . . . . . . . . . . . . . . . . . . . . . . . . . . . . . . . . . . . . . . . . . . . . . . . . . . . . . . . . . . . . . . $393,351 $467,645 $327,244 $234,536 $352,499
Portfolio turnover rate(d) . . . . . . . . . . . . . . . . . . . . . . . . . . . . . . . . . . . . . . . . . . . . . . . . . . . . . . . . . . . . . . . . . . . . . . . . . . . . . . . . . 54%(e) 54%(e) 73%(e) 71%(e) 91%(e)
(a) Based on average shares outstanding.(b) The amounts reported for a share outstanding may not accord with the change in aggregate gains and losses in securities for the fiscal period due to the timing of capital share
transactions in relation to the fluctuating market values of the Fund’s underlying securities.(c) Distributions for annual periods determined in accordance with U.S. federal income tax regulations.(d) Portfolio turnover rate includes portfolio transactions that are executed as a result of the Fund offering and redeeming Creation Units solely for cash in U.S. dollars ("cash creations").(e) Portfolio turnover rate excluding cash creations was as follows: . . . . . . . . . . . . . . . . . . . . . . . . . . . . . . . . . . . . . . . . 11% 8% 11% 10% 11%
See notes to financial statements.
Financial Highlights (continued)
(For a share outstanding throughout each period)
F I N A N C I A L H I G H L I G H T S 55
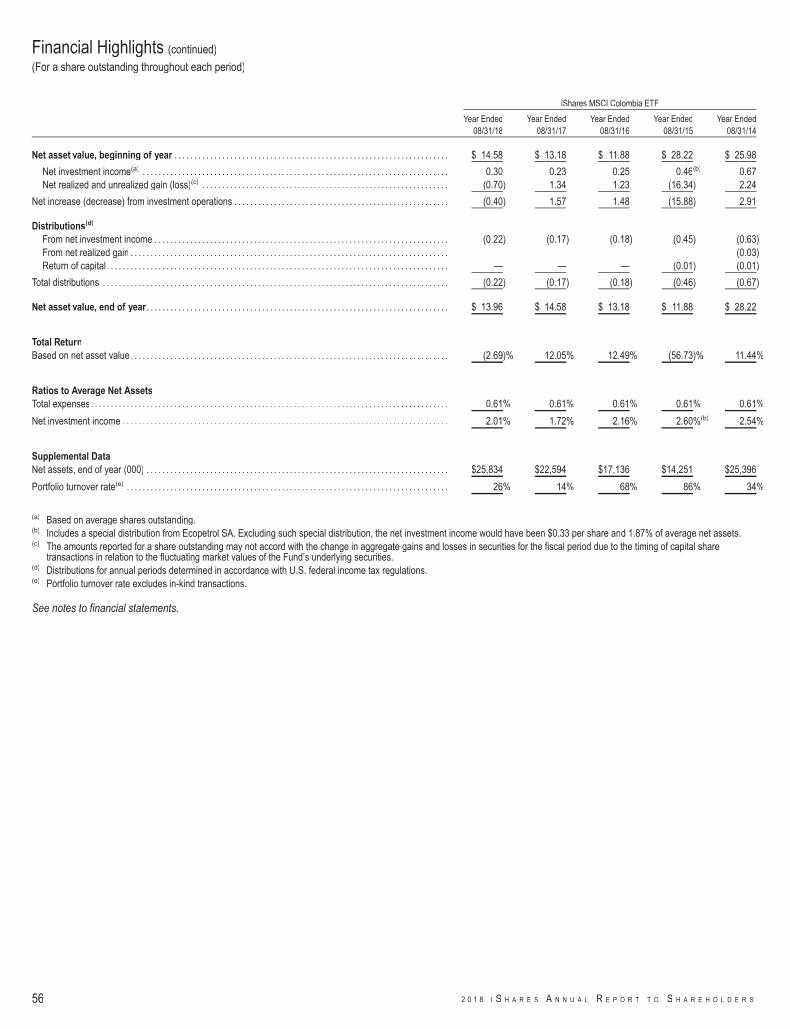
iShares MSCI Colombia ETF
Year Ended08/31/18
Year Ended08/31/17
Year Ended08/31/16
Year Ended08/31/15
Year Ended08/31/14
Net asset value, beginning of year . . . . . . . . . . . . . . . . . . . . . . . . . . . . . . . . . . . . . . . . . . . . . . . . . . . . . . . . . . . . . . . . . . . . . $ 14.58 $ 13.18 $ 11.88 $ 28.22 $ 25.98
Net investment income(a) . . . . . . . . . . . . . . . . . . . . . . . . . . . . . . . . . . . . . . . . . . . . . . . . . . . . . . . . . . . . . . . . . . . . . . . . . . . . . 0.30 0.23 0.25 0.46(b) 0.67Net realized and unrealized gain (loss)(c) . . . . . . . . . . . . . . . . . . . . . . . . . . . . . . . . . . . . . . . . . . . . . . . . . . . . . . . . . . . . . . (0.70) 1.34 1.23 (16.34) 2.24
Net increase (decrease) from investment operations . . . . . . . . . . . . . . . . . . . . . . . . . . . . . . . . . . . . . . . . . . . . . . . . . . . . . . (0.40) 1.57 1.48 (15.88) 2.91
Distributions(d)
From net investment income . . . . . . . . . . . . . . . . . . . . . . . . . . . . . . . . . . . . . . . . . . . . . . . . . . . . . . . . . . . . . . . . . . . . . . . . . . (0.22) (0.17) (0.18) (0.45) (0.63)From net realized gain . . . . . . . . . . . . . . . . . . . . . . . . . . . . . . . . . . . . . . . . . . . . . . . . . . . . . . . . . . . . . . . . . . . . . . . . . . . . . . . . — — — — (0.03)Return of capital . . . . . . . . . . . . . . . . . . . . . . . . . . . . . . . . . . . . . . . . . . . . . . . . . . . . . . . . . . . . . . . . . . . . . . . . . . . . . . . . . . . . . . — — — (0.01) (0.01)
Total distributions . . . . . . . . . . . . . . . . . . . . . . . . . . . . . . . . . . . . . . . . . . . . . . . . . . . . . . . . . . . . . . . . . . . . . . . . . . . . . . . . . . . . . . . (0.22) (0.17) (0.18) (0.46) (0.67)
Net asset value, end of year . . . . . . . . . . . . . . . . . . . . . . . . . . . . . . . . . . . . . . . . . . . . . . . . . . . . . . . . . . . . . . . . . . . . . . . . . . . . $ 13.96 $ 14.58 $ 13.18 $ 11.88 $ 28.22
Total ReturnBased on net asset value. . . . . . . . . . . . . . . . . . . . . . . . . . . . . . . . . . . . . . . . . . . . . . . . . . . . . . . . . . . . . . . . . . . . . . . . . . . . . . . . (2.69)% 12.05% 12.49% (56.73)% 11.44%
Ratios to Average Net AssetsTotal expenses. . . . . . . . . . . . . . . . . . . . . . . . . . . . . . . . . . . . . . . . . . . . . . . . . . . . . . . . . . . . . . . . . . . . . . . . . . . . . . . . . . . . . . . . . . 0.61% 0.61% 0.61% 0.61% 0.61%
Net investment income . . . . . . . . . . . . . . . . . . . . . . . . . . . . . . . . . . . . . . . . . . . . . . . . . . . . . . . . . . . . . . . . . . . . . . . . . . . . . . . . . . 2.01% 1.72% 2.16% 2.60%(b) 2.54%
Supplemental DataNet assets, end of year (000) . . . . . . . . . . . . . . . . . . . . . . . . . . . . . . . . . . . . . . . . . . . . . . . . . . . . . . . . . . . . . . . . . . . . . . . . . . . . $25,834 $22,594 $17,136 $14,251 $25,396
Portfolio turnover rate(e) . . . . . . . . . . . . . . . . . . . . . . . . . . . . . . . . . . . . . . . . . . . . . . . . . . . . . . . . . . . . . . . . . . . . . . . . . . . . . . . . . 26% 14% 68% 86% 34%
(a) Based on average shares outstanding.(b) Includes a special distribution from Ecopetrol SA. Excluding such special distribution, the net investment income would have been $0.33 per share and 1.87% of average net assets.(c) The amounts reported for a share outstanding may not accord with the change in aggregate gains and losses in securities for the fiscal period due to the timing of capital share
transactions in relation to the fluctuating market values of the Fund’s underlying securities.(d) Distributions for annual periods determined in accordance with U.S. federal income tax regulations.(e) Portfolio turnover rate excludes in-kind transactions.
See notes to financial statements.
Financial Highlights (continued)
(For a share outstanding throughout each period)
56 2 0 1 8 I S H A R E S A N N U A L R E P O R T T O S H A R E H O L D E R S

iShares MSCI Israel ETF
Year Ended08/31/18
Year Ended08/31/17
Year Ended08/31/16
Year Ended08/31/15
Year Ended08/31/14
Net asset value, beginning of year . . . . . . . . . . . . . . . . . . . . . . . . . . . . . . . . . . . . . . . . . . . . . . . . . . . . . . . . . . . . . . . . . . . . . $ 48.19 $ 49.36 $ 50.51 $ 50.69 $ 42.85
Net investment income(a) . . . . . . . . . . . . . . . . . . . . . . . . . . . . . . . . . . . . . . . . . . . . . . . . . . . . . . . . . . . . . . . . . . . . . . . . . . . . . 0.59 0.62 0.71 1.23 0.87Net realized and unrealized gain (loss)(b) . . . . . . . . . . . . . . . . . . . . . . . . . . . . . . . . . . . . . . . . . . . . . . . . . . . . . . . . . . . . . . 8.88 (0.98) (0.87) (0.34) 7.95
Net increase (decrease) from investment operations . . . . . . . . . . . . . . . . . . . . . . . . . . . . . . . . . . . . . . . . . . . . . . . . . . . . . . 9.47 (0.36) (0.16) 0.89 8.82
Distributions(c)
From net investment income . . . . . . . . . . . . . . . . . . . . . . . . . . . . . . . . . . . . . . . . . . . . . . . . . . . . . . . . . . . . . . . . . . . . . . . . . . (1.04) (0.81) (0.99) (1.07) (0.98)
Total distributions . . . . . . . . . . . . . . . . . . . . . . . . . . . . . . . . . . . . . . . . . . . . . . . . . . . . . . . . . . . . . . . . . . . . . . . . . . . . . . . . . . . . . . . (1.04) (0.81) (0.99) (1.07) (0.98)
Net asset value, end of year . . . . . . . . . . . . . . . . . . . . . . . . . . . . . . . . . . . . . . . . . . . . . . . . . . . . . . . . . . . . . . . . . . . . . . . . . . . . $ 56.62 $ 48.19 $ 49.36 $ 50.51 $ 50.69
Total ReturnBased on net asset value. . . . . . . . . . . . . . . . . . . . . . . . . . . . . . . . . . . . . . . . . . . . . . . . . . . . . . . . . . . . . . . . . . . . . . . . . . . . . . . . 19.91% (0.77)% (0.23)% 1.80% 20.67%
Ratios to Average Net AssetsTotal expenses. . . . . . . . . . . . . . . . . . . . . . . . . . . . . . . . . . . . . . . . . . . . . . . . . . . . . . . . . . . . . . . . . . . . . . . . . . . . . . . . . . . . . . . . . . 0.59% 0.62% 0.64% 0.62% 0.62%
Net investment income . . . . . . . . . . . . . . . . . . . . . . . . . . . . . . . . . . . . . . . . . . . . . . . . . . . . . . . . . . . . . . . . . . . . . . . . . . . . . . . . . . 1.15% 1.25% 1.46% 2.45% 1.74%
Supplemental DataNet assets, end of year (000) . . . . . . . . . . . . . . . . . . . . . . . . . . . . . . . . . . . . . . . . . . . . . . . . . . . . . . . . . . . . . . . . . . . . . . . . . . . . $121,735 $89,152 $93,793 $126,285 $121,645
Portfolio turnover rate(d) . . . . . . . . . . . . . . . . . . . . . . . . . . . . . . . . . . . . . . . . . . . . . . . . . . . . . . . . . . . . . . . . . . . . . . . . . . . . . . . . . 6% 28% 46% 14% 15%
(a) Based on average shares outstanding.(b) The amounts reported for a share outstanding may not accord with the change in aggregate gains and losses in securities for the fiscal period due to the timing of capital share
transactions in relation to the fluctuating market values of the Fund’s underlying securities.(c) Distributions for annual periods determined in accordance with U.S. federal income tax regulations.(d) Portfolio turnover rate excludes in-kind transactions.
See notes to financial statements.
Financial Highlights (continued)
(For a share outstanding throughout each period)
F I N A N C I A L H I G H L I G H T S 57
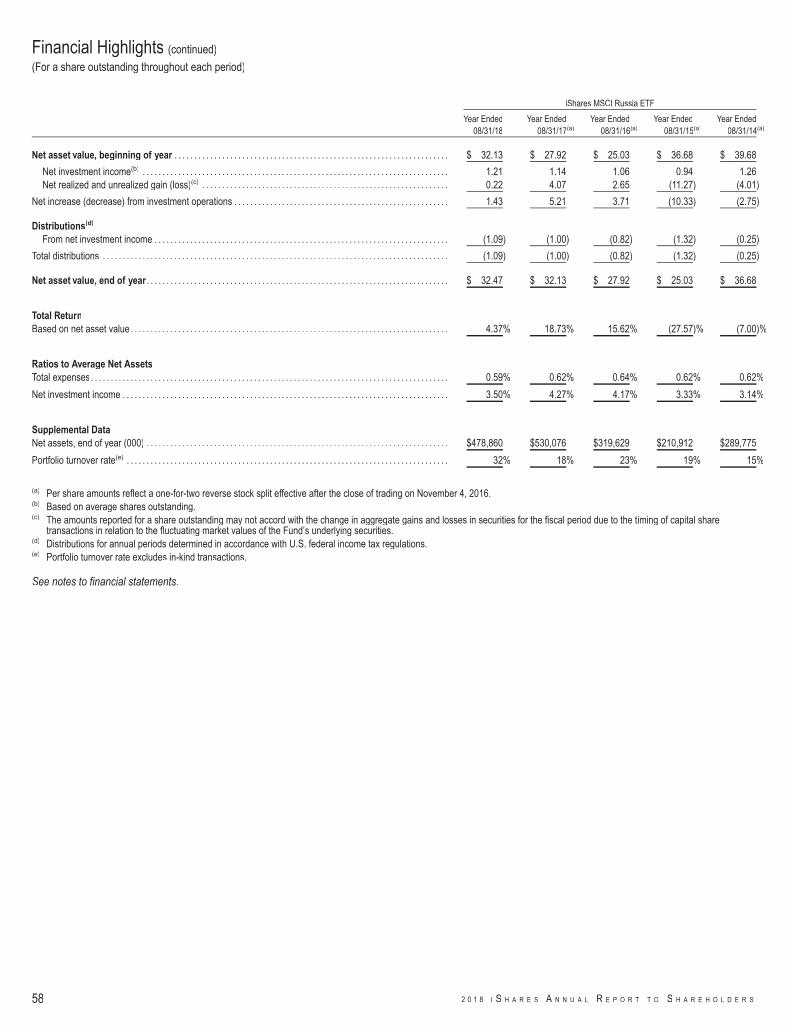
iShares MSCI Russia ETF
Year Ended08/31/18
Year Ended08/31/17(a)
Year Ended08/31/16(a)
Year Ended08/31/15(a)
Year Ended08/31/14(a)
Net asset value, beginning of year . . . . . . . . . . . . . . . . . . . . . . . . . . . . . . . . . . . . . . . . . . . . . . . . . . . . . . . . . . . . . . . . . . . . . $ 32.13 $ 27.92 $ 25.03 $ 36.68 $ 39.68
Net investment income(b) . . . . . . . . . . . . . . . . . . . . . . . . . . . . . . . . . . . . . . . . . . . . . . . . . . . . . . . . . . . . . . . . . . . . . . . . . . . . . 1.21 1.14 1.06 0.94 1.26Net realized and unrealized gain (loss)(c) . . . . . . . . . . . . . . . . . . . . . . . . . . . . . . . . . . . . . . . . . . . . . . . . . . . . . . . . . . . . . . 0.22 4.07 2.65 (11.27) (4.01)
Net increase (decrease) from investment operations . . . . . . . . . . . . . . . . . . . . . . . . . . . . . . . . . . . . . . . . . . . . . . . . . . . . . . 1.43 5.21 3.71 (10.33) (2.75)
Distributions(d)
From net investment income . . . . . . . . . . . . . . . . . . . . . . . . . . . . . . . . . . . . . . . . . . . . . . . . . . . . . . . . . . . . . . . . . . . . . . . . . . (1.09) (1.00) (0.82) (1.32) (0.25)
Total distributions . . . . . . . . . . . . . . . . . . . . . . . . . . . . . . . . . . . . . . . . . . . . . . . . . . . . . . . . . . . . . . . . . . . . . . . . . . . . . . . . . . . . . . . (1.09) (1.00) (0.82) (1.32) (0.25)
Net asset value, end of year . . . . . . . . . . . . . . . . . . . . . . . . . . . . . . . . . . . . . . . . . . . . . . . . . . . . . . . . . . . . . . . . . . . . . . . . . . . . $ 32.47 $ 32.13 $ 27.92 $ 25.03 $ 36.68
Total ReturnBased on net asset value. . . . . . . . . . . . . . . . . . . . . . . . . . . . . . . . . . . . . . . . . . . . . . . . . . . . . . . . . . . . . . . . . . . . . . . . . . . . . . . . 4.37% 18.73% 15.62% (27.57)% (7.00)%
Ratios to Average Net AssetsTotal expenses. . . . . . . . . . . . . . . . . . . . . . . . . . . . . . . . . . . . . . . . . . . . . . . . . . . . . . . . . . . . . . . . . . . . . . . . . . . . . . . . . . . . . . . . . . 0.59% 0.62% 0.64% 0.62% 0.62%
Net investment income . . . . . . . . . . . . . . . . . . . . . . . . . . . . . . . . . . . . . . . . . . . . . . . . . . . . . . . . . . . . . . . . . . . . . . . . . . . . . . . . . . 3.50% 4.27% 4.17% 3.33% 3.14%
Supplemental DataNet assets, end of year (000) . . . . . . . . . . . . . . . . . . . . . . . . . . . . . . . . . . . . . . . . . . . . . . . . . . . . . . . . . . . . . . . . . . . . . . . . . . . . $478,860 $530,076 $319,629 $210,912 $289,775
Portfolio turnover rate(e) . . . . . . . . . . . . . . . . . . . . . . . . . . . . . . . . . . . . . . . . . . . . . . . . . . . . . . . . . . . . . . . . . . . . . . . . . . . . . . . . . 32% 18% 23% 19% 15%
(a) Per share amounts reflect a one-for-two reverse stock split effective after the close of trading on November 4, 2016.(b) Based on average shares outstanding.(c) The amounts reported for a share outstanding may not accord with the change in aggregate gains and losses in securities for the fiscal period due to the timing of capital share
transactions in relation to the fluctuating market values of the Fund’s underlying securities.(d) Distributions for annual periods determined in accordance with U.S. federal income tax regulations.(e) Portfolio turnover rate excludes in-kind transactions.
See notes to financial statements.
Financial Highlights (continued)
(For a share outstanding throughout each period)
58 2 0 1 8 I S H A R E S A N N U A L R E P O R T T O S H A R E H O L D E R S
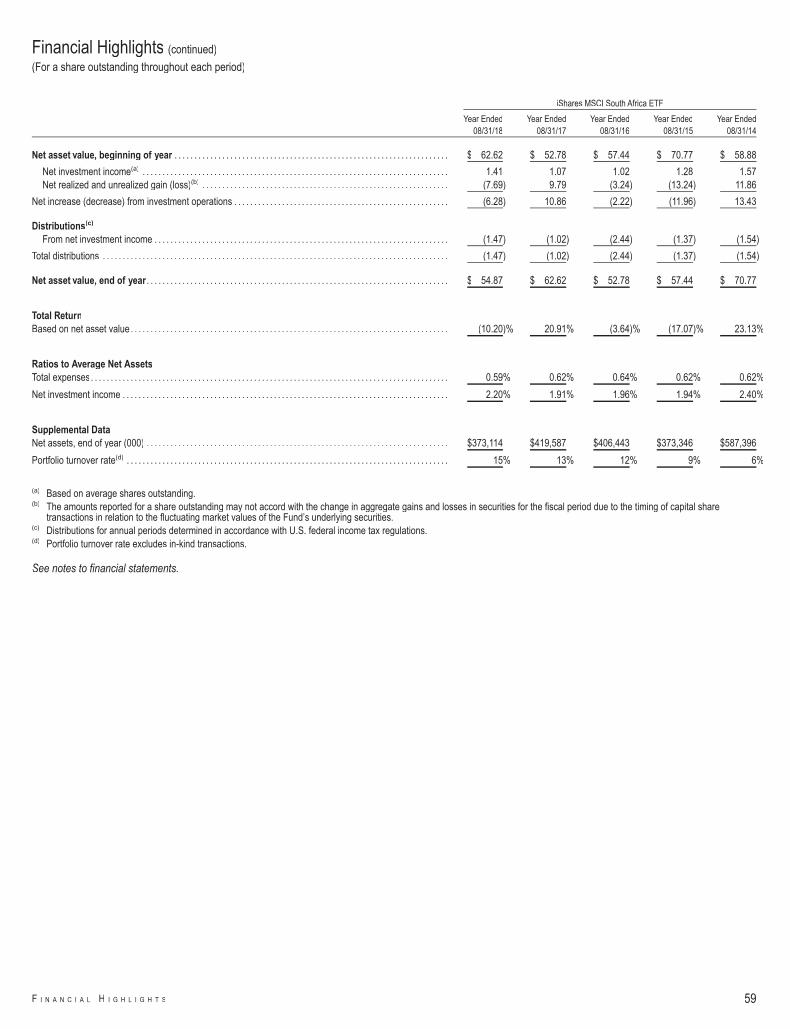
iShares MSCI South Africa ETF
Year Ended08/31/18
Year Ended08/31/17
Year Ended08/31/16
Year Ended08/31/15
Year Ended08/31/14
Net asset value, beginning of year . . . . . . . . . . . . . . . . . . . . . . . . . . . . . . . . . . . . . . . . . . . . . . . . . . . . . . . . . . . . . . . . . . . . . $ 62.62 $ 52.78 $ 57.44 $ 70.77 $ 58.88
Net investment income(a) . . . . . . . . . . . . . . . . . . . . . . . . . . . . . . . . . . . . . . . . . . . . . . . . . . . . . . . . . . . . . . . . . . . . . . . . . . . . . 1.41 1.07 1.02 1.28 1.57Net realized and unrealized gain (loss)(b) . . . . . . . . . . . . . . . . . . . . . . . . . . . . . . . . . . . . . . . . . . . . . . . . . . . . . . . . . . . . . . (7.69) 9.79 (3.24) (13.24) 11.86
Net increase (decrease) from investment operations . . . . . . . . . . . . . . . . . . . . . . . . . . . . . . . . . . . . . . . . . . . . . . . . . . . . . . (6.28) 10.86 (2.22) (11.96) 13.43
Distributions(c)
From net investment income . . . . . . . . . . . . . . . . . . . . . . . . . . . . . . . . . . . . . . . . . . . . . . . . . . . . . . . . . . . . . . . . . . . . . . . . . . (1.47) (1.02) (2.44) (1.37) (1.54)
Total distributions . . . . . . . . . . . . . . . . . . . . . . . . . . . . . . . . . . . . . . . . . . . . . . . . . . . . . . . . . . . . . . . . . . . . . . . . . . . . . . . . . . . . . . . (1.47) (1.02) (2.44) (1.37) (1.54)
Net asset value, end of year . . . . . . . . . . . . . . . . . . . . . . . . . . . . . . . . . . . . . . . . . . . . . . . . . . . . . . . . . . . . . . . . . . . . . . . . . . . . $ 54.87 $ 62.62 $ 52.78 $ 57.44 $ 70.77
Total ReturnBased on net asset value. . . . . . . . . . . . . . . . . . . . . . . . . . . . . . . . . . . . . . . . . . . . . . . . . . . . . . . . . . . . . . . . . . . . . . . . . . . . . . . . (10.20)% 20.91% (3.64)% (17.07)% 23.13%
Ratios to Average Net AssetsTotal expenses. . . . . . . . . . . . . . . . . . . . . . . . . . . . . . . . . . . . . . . . . . . . . . . . . . . . . . . . . . . . . . . . . . . . . . . . . . . . . . . . . . . . . . . . . . 0.59% 0.62% 0.64% 0.62% 0.62%
Net investment income . . . . . . . . . . . . . . . . . . . . . . . . . . . . . . . . . . . . . . . . . . . . . . . . . . . . . . . . . . . . . . . . . . . . . . . . . . . . . . . . . . 2.20% 1.91% 1.96% 1.94% 2.40%
Supplemental DataNet assets, end of year (000) . . . . . . . . . . . . . . . . . . . . . . . . . . . . . . . . . . . . . . . . . . . . . . . . . . . . . . . . . . . . . . . . . . . . . . . . . . . . $373,114 $419,587 $406,443 $373,346 $587,396
Portfolio turnover rate(d) . . . . . . . . . . . . . . . . . . . . . . . . . . . . . . . . . . . . . . . . . . . . . . . . . . . . . . . . . . . . . . . . . . . . . . . . . . . . . . . . . 15% 13% 12% 9% 6%
(a) Based on average shares outstanding.(b) The amounts reported for a share outstanding may not accord with the change in aggregate gains and losses in securities for the fiscal period due to the timing of capital share
transactions in relation to the fluctuating market values of the Fund’s underlying securities.(c) Distributions for annual periods determined in accordance with U.S. federal income tax regulations.(d) Portfolio turnover rate excludes in-kind transactions.
See notes to financial statements.
Financial Highlights (continued)
(For a share outstanding throughout each period)
F I N A N C I A L H I G H L I G H T S 59
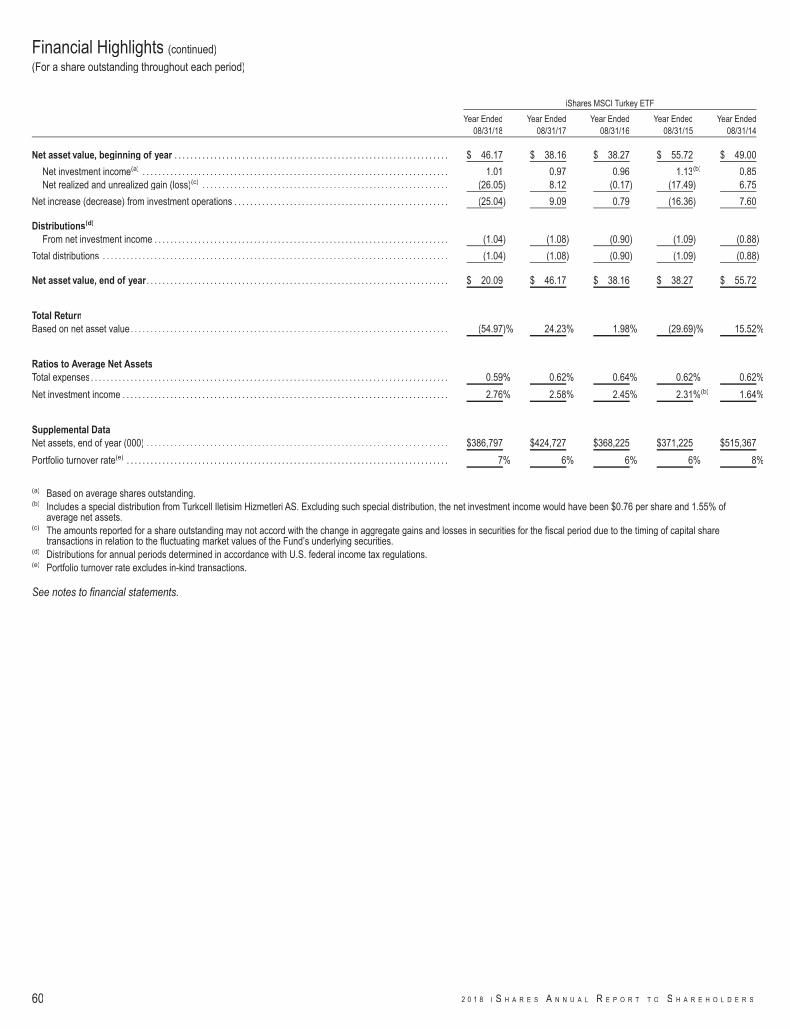
iShares MSCI Turkey ETF
Year Ended08/31/18
Year Ended08/31/17
Year Ended08/31/16
Year Ended08/31/15
Year Ended08/31/14
Net asset value, beginning of year . . . . . . . . . . . . . . . . . . . . . . . . . . . . . . . . . . . . . . . . . . . . . . . . . . . . . . . . . . . . . . . . . . . . . $ 46.17 $ 38.16 $ 38.27 $ 55.72 $ 49.00
Net investment income(a) . . . . . . . . . . . . . . . . . . . . . . . . . . . . . . . . . . . . . . . . . . . . . . . . . . . . . . . . . . . . . . . . . . . . . . . . . . . . . 1.01 0.97 0.96 1.13(b) 0.85Net realized and unrealized gain (loss)(c) . . . . . . . . . . . . . . . . . . . . . . . . . . . . . . . . . . . . . . . . . . . . . . . . . . . . . . . . . . . . . . (26.05) 8.12 (0.17) (17.49) 6.75
Net increase (decrease) from investment operations . . . . . . . . . . . . . . . . . . . . . . . . . . . . . . . . . . . . . . . . . . . . . . . . . . . . . . (25.04) 9.09 0.79 (16.36) 7.60
Distributions(d)
From net investment income . . . . . . . . . . . . . . . . . . . . . . . . . . . . . . . . . . . . . . . . . . . . . . . . . . . . . . . . . . . . . . . . . . . . . . . . . . (1.04) (1.08) (0.90) (1.09) (0.88)
Total distributions . . . . . . . . . . . . . . . . . . . . . . . . . . . . . . . . . . . . . . . . . . . . . . . . . . . . . . . . . . . . . . . . . . . . . . . . . . . . . . . . . . . . . . . (1.04) (1.08) (0.90) (1.09) (0.88)
Net asset value, end of year . . . . . . . . . . . . . . . . . . . . . . . . . . . . . . . . . . . . . . . . . . . . . . . . . . . . . . . . . . . . . . . . . . . . . . . . . . . . $ 20.09 $ 46.17 $ 38.16 $ 38.27 $ 55.72
Total ReturnBased on net asset value. . . . . . . . . . . . . . . . . . . . . . . . . . . . . . . . . . . . . . . . . . . . . . . . . . . . . . . . . . . . . . . . . . . . . . . . . . . . . . . . (54.97)% 24.23% 1.98% (29.69)% 15.52%
Ratios to Average Net AssetsTotal expenses. . . . . . . . . . . . . . . . . . . . . . . . . . . . . . . . . . . . . . . . . . . . . . . . . . . . . . . . . . . . . . . . . . . . . . . . . . . . . . . . . . . . . . . . . . 0.59% 0.62% 0.64% 0.62% 0.62%
Net investment income . . . . . . . . . . . . . . . . . . . . . . . . . . . . . . . . . . . . . . . . . . . . . . . . . . . . . . . . . . . . . . . . . . . . . . . . . . . . . . . . . . 2.76% 2.58% 2.45% 2.31%(b) 1.64%
Supplemental DataNet assets, end of year (000) . . . . . . . . . . . . . . . . . . . . . . . . . . . . . . . . . . . . . . . . . . . . . . . . . . . . . . . . . . . . . . . . . . . . . . . . . . . . $386,797 $424,727 $368,225 $371,225 $515,367
Portfolio turnover rate(e) . . . . . . . . . . . . . . . . . . . . . . . . . . . . . . . . . . . . . . . . . . . . . . . . . . . . . . . . . . . . . . . . . . . . . . . . . . . . . . . . . 7% 6% 6% 6% 8%
(a) Based on average shares outstanding.(b) Includes a special distribution from Turkcell Iletisim Hizmetleri AS. Excluding such special distribution, the net investment income would have been $0.76 per share and 1.55% of
average net assets.(c) The amounts reported for a share outstanding may not accord with the change in aggregate gains and losses in securities for the fiscal period due to the timing of capital share
transactions in relation to the fluctuating market values of the Fund’s underlying securities.(d) Distributions for annual periods determined in accordance with U.S. federal income tax regulations.(e) Portfolio turnover rate excludes in-kind transactions.
See notes to financial statements.
Financial Highlights (continued)
(For a share outstanding throughout each period)
60 2 0 1 8 I S H A R E S A N N U A L R E P O R T T O S H A R E H O L D E R S

iShares MSCI USA Equal Weighted ETF
Year Ended08/31/18
Year Ended08/31/17
Year Ended08/31/16
Year Ended08/31/15
Year Ended08/31/14
Net asset value, beginning of year . . . . . . . . . . . . . . . . . . . . . . . . . . . . . . . . . . . . . . . . . . . . . . . . . . . . . . . . . . . . . . . . . . . . . $ 51.30 $ 46.05 $ 42.51 $ 43.08 $ 35.26
Net investment income(a) . . . . . . . . . . . . . . . . . . . . . . . . . . . . . . . . . . . . . . . . . . . . . . . . . . . . . . . . . . . . . . . . . . . . . . . . . . . . . 0.98 0.85 0.77 0.80 0.71Net realized and unrealized gain (loss)(b) . . . . . . . . . . . . . . . . . . . . . . . . . . . . . . . . . . . . . . . . . . . . . . . . . . . . . . . . . . . . . . 7.94 5.18 3.63 (0.57) 8.01
Net increase from investment operations . . . . . . . . . . . . . . . . . . . . . . . . . . . . . . . . . . . . . . . . . . . . . . . . . . . . . . . . . . . . . . . . . 8.92 6.03 4.40 0.23 8.72
Distributions(c)
From net investment income . . . . . . . . . . . . . . . . . . . . . . . . . . . . . . . . . . . . . . . . . . . . . . . . . . . . . . . . . . . . . . . . . . . . . . . . . . (0.89) (0.78) (0.86) (0.80) (0.90)
Total distributions . . . . . . . . . . . . . . . . . . . . . . . . . . . . . . . . . . . . . . . . . . . . . . . . . . . . . . . . . . . . . . . . . . . . . . . . . . . . . . . . . . . . . . . (0.89) (0.78) (0.86) (0.80) (0.90)
Net asset value, end of year . . . . . . . . . . . . . . . . . . . . . . . . . . . . . . . . . . . . . . . . . . . . . . . . . . . . . . . . . . . . . . . . . . . . . . . . . . . . $ 59.33 $ 51.30 $ 46.05 $ 42.51 $ 43.08
Total ReturnBased on net asset value. . . . . . . . . . . . . . . . . . . . . . . . . . . . . . . . . . . . . . . . . . . . . . . . . . . . . . . . . . . . . . . . . . . . . . . . . . . . . . . . 17.55% 13.22% 10.54% 0.48% 24.98%
Ratios to Average Net AssetsTotal expenses. . . . . . . . . . . . . . . . . . . . . . . . . . . . . . . . . . . . . . . . . . . . . . . . . . . . . . . . . . . . . . . . . . . . . . . . . . . . . . . . . . . . . . . . . . 0.15% 0.15% 0.15% 0.15% 0.15%
Net investment income . . . . . . . . . . . . . . . . . . . . . . . . . . . . . . . . . . . . . . . . . . . . . . . . . . . . . . . . . . . . . . . . . . . . . . . . . . . . . . . . . . 1.76% 1.72% 1.79% 1.82% 1.82%
Supplemental DataNet assets, end of year (000) . . . . . . . . . . . . . . . . . . . . . . . . . . . . . . . . . . . . . . . . . . . . . . . . . . . . . . . . . . . . . . . . . . . . . . . . . . . . $192,820 $135,945 $73,673 $44,632 $47,391
Portfolio turnover rate(d) . . . . . . . . . . . . . . . . . . . . . . . . . . . . . . . . . . . . . . . . . . . . . . . . . . . . . . . . . . . . . . . . . . . . . . . . . . . . . . . . . 23% 27% 28% 39% 6%
(a) Based on average shares outstanding.(b) The amounts reported for a share outstanding may not accord with the change in aggregate gains and losses in securities for the fiscal period due to the timing of capital share
transactions in relation to the fluctuating market values of the Fund’s underlying securities.(c) Distributions for annual periods determined in accordance with U.S. federal income tax regulations.(d) Portfolio turnover rate excludes in-kind transactions.
See notes to financial statements.
Financial Highlights (continued)
(For a share outstanding throughout each period)
F I N A N C I A L H I G H L I G H T S 61
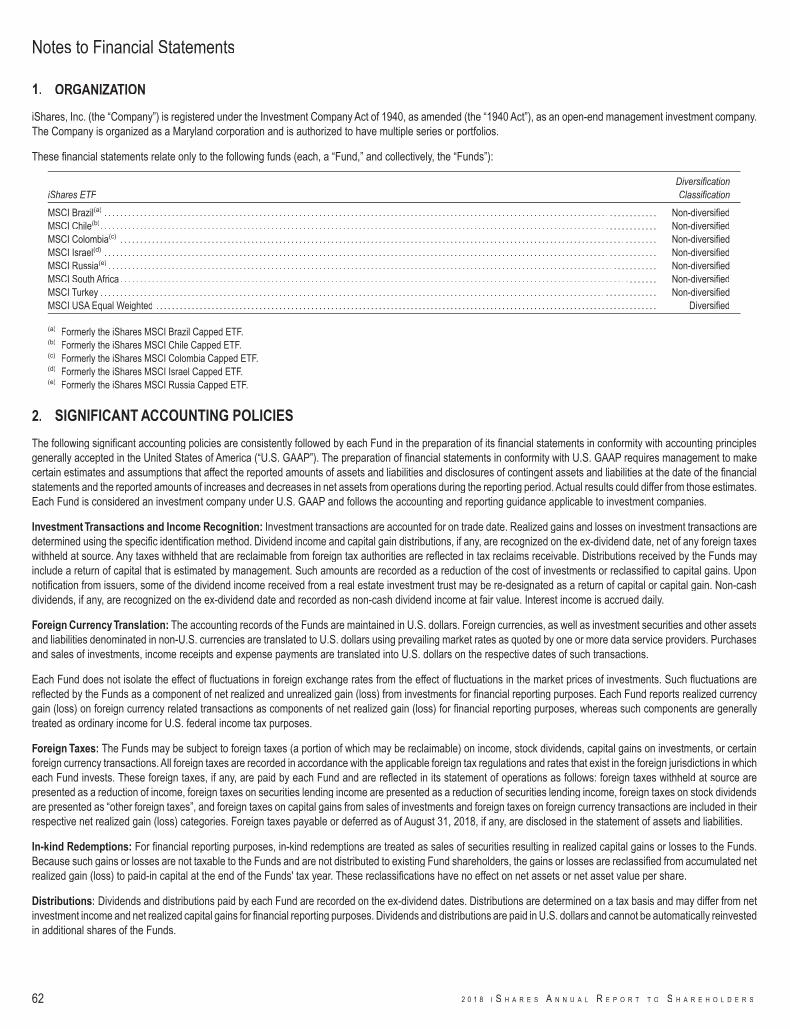
1. ORGANIZATION
iShares, Inc. (the “Company”) is registered under the Investment Company Act of 1940, as amended (the “1940 Act”), as an open-end management investment company.The Company is organized as a Maryland corporation and is authorized to have multiple series or portfolios.
These financial statements relate only to the following funds (each, a “Fund,” and collectively, the “Funds”):
iShares ETFDiversificationClassification
MSCI Brazil(a) . . . . . . . . . . . . . . . . . . . . . . . . . . . . . . . . . . . . . . . . . . . . . . . . . . . . . . . . . . . . . . . . . . . . . . . . . . . . . . . . . . . . . . . . . . . . . . . . . . . . . . . . . . . . . . . . . . . . . . . . . . . . . . . . . . . . . . . . . . . Non-diversifiedMSCI Chile(b). . . . . . . . . . . . . . . . . . . . . . . . . . . . . . . . . . . . . . . . . . . . . . . . . . . . . . . . . . . . . . . . . . . . . . . . . . . . . . . . . . . . . . . . . . . . . . . . . . . . . . . . . . . . . . . . . . . . . . . . . . . . . . . . . . . . . . . . . . . . Non-diversifiedMSCI Colombia(c) . . . . . . . . . . . . . . . . . . . . . . . . . . . . . . . . . . . . . . . . . . . . . . . . . . . . . . . . . . . . . . . . . . . . . . . . . . . . . . . . . . . . . . . . . . . . . . . . . . . . . . . . . . . . . . . . . . . . . . . . . . . . . . . . . . . . . . . Non-diversifiedMSCI Israel(d) . . . . . . . . . . . . . . . . . . . . . . . . . . . . . . . . . . . . . . . . . . . . . . . . . . . . . . . . . . . . . . . . . . . . . . . . . . . . . . . . . . . . . . . . . . . . . . . . . . . . . . . . . . . . . . . . . . . . . . . . . . . . . . . . . . . . . . . . . . . Non-diversifiedMSCI Russia(e) . . . . . . . . . . . . . . . . . . . . . . . . . . . . . . . . . . . . . . . . . . . . . . . . . . . . . . . . . . . . . . . . . . . . . . . . . . . . . . . . . . . . . . . . . . . . . . . . . . . . . . . . . . . . . . . . . . . . . . . . . . . . . . . . . . . . . . . . . . Non-diversifiedMSCI South Africa . . . . . . . . . . . . . . . . . . . . . . . . . . . . . . . . . . . . . . . . . . . . . . . . . . . . . . . . . . . . . . . . . . . . . . . . . . . . . . . . . . . . . . . . . . . . . . . . . . . . . . . . . . . . . . . . . . . . . . . . . . . . . . . . . . . . . . . Non-diversifiedMSCI Turkey . . . . . . . . . . . . . . . . . . . . . . . . . . . . . . . . . . . . . . . . . . . . . . . . . . . . . . . . . . . . . . . . . . . . . . . . . . . . . . . . . . . . . . . . . . . . . . . . . . . . . . . . . . . . . . . . . . . . . . . . . . . . . . . . . . . . . . . . . . . . Non-diversifiedMSCI USA Equal Weighted . . . . . . . . . . . . . . . . . . . . . . . . . . . . . . . . . . . . . . . . . . . . . . . . . . . . . . . . . . . . . . . . . . . . . . . . . . . . . . . . . . . . . . . . . . . . . . . . . . . . . . . . . . . . . . . . . . . . . . . . . . . . . . Diversified
(a) Formerly the iShares MSCI Brazil Capped ETF.(b) Formerly the iShares MSCI Chile Capped ETF.(c) Formerly the iShares MSCI Colombia Capped ETF.(d) Formerly the iShares MSCI Israel Capped ETF.(e) Formerly the iShares MSCI Russia Capped ETF.
2. SIGNIFICANT ACCOUNTING POLICIES
The following significant accounting policies are consistently followed by each Fund in the preparation of its financial statements in conformity with accounting principlesgenerally accepted in the United States of America (“U.S. GAAP”). The preparation of financial statements in conformity with U.S. GAAP requires management to makecertain estimates and assumptions that affect the reported amounts of assets and liabilities and disclosures of contingent assets and liabilities at the date of the financialstatements and the reported amounts of increases and decreases in net assets from operations during the reporting period. Actual results could differ from those estimates.Each Fund is considered an investment company under U.S. GAAP and follows the accounting and reporting guidance applicable to investment companies.
Investment Transactions and Income Recognition: Investment transactions are accounted for on trade date. Realized gains and losses on investment transactions aredetermined using the specific identification method. Dividend income and capital gain distributions, if any, are recognized on the ex-dividend date, net of any foreign taxeswithheld at source. Any taxes withheld that are reclaimable from foreign tax authorities are reflected in tax reclaims receivable. Distributions received by the Funds mayinclude a return of capital that is estimated by management. Such amounts are recorded as a reduction of the cost of investments or reclassified to capital gains. Uponnotification from issuers, some of the dividend income received from a real estate investment trust may be re-designated as a return of capital or capital gain. Non-cashdividends, if any, are recognized on the ex-dividend date and recorded as non-cash dividend income at fair value. Interest income is accrued daily.
Foreign CurrencyTranslation: The accounting records of the Funds are maintained in U.S. dollars. Foreign currencies, as well as investment securities and other assetsand liabilities denominated in non-U.S. currencies are translated to U.S. dollars using prevailing market rates as quoted by one or more data service providers. Purchasesand sales of investments, income receipts and expense payments are translated into U.S. dollars on the respective dates of such transactions.
Each Fund does not isolate the effect of fluctuations in foreign exchange rates from the effect of fluctuations in the market prices of investments. Such fluctuations arereflected by the Funds as a component of net realized and unrealized gain (loss) from investments for financial reporting purposes. Each Fund reports realized currencygain (loss) on foreign currency related transactions as components of net realized gain (loss) for financial reporting purposes, whereas such components are generallytreated as ordinary income for U.S. federal income tax purposes.
Foreign Taxes: The Funds may be subject to foreign taxes (a portion of which may be reclaimable) on income, stock dividends, capital gains on investments, or certainforeign currency transactions. All foreign taxes are recorded in accordance with the applicable foreign tax regulations and rates that exist in the foreign jurisdictions in whicheach Fund invests. These foreign taxes, if any, are paid by each Fund and are reflected in its statement of operations as follows: foreign taxes withheld at source arepresented as a reduction of income, foreign taxes on securities lending income are presented as a reduction of securities lending income, foreign taxes on stock dividendsare presented as “other foreign taxes”, and foreign taxes on capital gains from sales of investments and foreign taxes on foreign currency transactions are included in theirrespective net realized gain (loss) categories. Foreign taxes payable or deferred as of August 31, 2018, if any, are disclosed in the statement of assets and liabilities.
In-kind Redemptions: For financial reporting purposes, in-kind redemptions are treated as sales of securities resulting in realized capital gains or losses to the Funds.Because such gains or losses are not taxable to the Funds and are not distributed to existing Fund shareholders, the gains or losses are reclassified from accumulated netrealized gain (loss) to paid-in capital at the end of the Funds' tax year. These reclassifications have no effect on net assets or net asset value per share.
Distributions: Dividends and distributions paid by each Fund are recorded on the ex-dividend dates. Distributions are determined on a tax basis and may differ from netinvestment income and net realized capital gains for financial reporting purposes. Dividends and distributions are paid in U.S. dollars and cannot be automatically reinvestedin additional shares of the Funds.
Notes to Financial Statements
62 2 0 1 8 I S H A R E S A N N U A L R E P O R T T O S H A R E H O L D E R S
Recent Accounting Standards: In August 2018, the Financial Accounting Standards Board issued Accounting Standards Update 2018-13 “Changes to the DisclosureRequirements for Fair Value Measurement” which modifies disclosure requirements for fair value measurements. The guidance is effective for fiscal years beginning afterDecember 15, 2019 and for interim periods within those fiscal years. Management is currently evaluating the impact of this guidance to the Funds.
Indemnifications: In the normal course of business, each Fund enters into contracts that contain a variety of representations that provide general indemnification. TheFunds' maximum exposure under these arrangements is unknown because it involves future potential claims against the Funds, which cannot be predicted with anycertainty.
3. INVESTMENT VALUATION AND FAIR VALUE MEASUREMENTS
Investment Valuation Policies: Each Fund’s investments are valued at fair value (also referred to as “market value” within the financial statements) each day that theFund’s listing exchange is open and, for financial reporting purposes, as of the report date should the reporting period end on a day that the Fund’s listing exchange is notopen. U.S. GAAP defines fair value as the price a fund would receive to sell an asset or pay to transfer a liability in an orderly transaction between market participants atthe measurement date. A fund determines the fair value of its financial instruments using various independent dealers or pricing services under policies approved by theBoard of Directors of the Company (the “Board”). The BlackRock Global Valuation Methodologies Committee (the “Global Valuation Committee”) is the committee formedby management to develop global pricing policies and procedures and to oversee the pricing function for all financial instruments.
Fair Value Inputs and Methodologies: The following methods and inputs are used to establish the fair value of each Fund’s assets and liabilities:• Equity investments traded on a recognized securities exchange are valued at that day’s last traded price or official closing price, as applicable, on the exchange where
the stock is primarily traded. Equity investments traded on a recognized exchange for which there were no sales on that day are valued at the last traded price.• Investments in open-end U.S. mutual funds (including money market funds) are valued at that day’s published net asset value (“NAV”).• Futures contract notional values are determined based on that day’s last reported settlement price on the exchange where the contract is traded.
If events (e.g., a company announcement, market volatility or a natural disaster) occur that are expected to materially affect the value of an investment, or in the event thatapplication of these methods of valuation results in a price for an investment that is deemed not to be representative of the market value of such investment, or if a priceis not available, the investment will be valued by the Global Valuation Committee, in accordance with policies approved by the Board as reflecting fair value (“Fair ValuedInvestments”). The fair valuation approaches that may be used by the Global Valuation Committee include market approach, income approach and the cost approach.Valuation techniques used under these approaches take into consideration inputs that include but are not limited to (i) attributes specific to the investment; (ii) the principalmarket for the investment; (iii) the customary participants in the principal market for the investment; (iv) data assumptions by market participants for the investment, ifreasonably available; (v) quoted prices for similar investments in active markets; and (vi) other inputs, such as future cash flows, interest rates, yield curves, volatilities,prepayment speeds, loss severities, credit risks and/or default rates.
The Global Valuation Committee employs various methods for calibrating valuation approaches for investments where an active market does not exist, including regulardue diligence of the Company's pricing vendors, regular reviews of key inputs and assumptions, transactional back-testing or disposition analysis to compare unrealizedgains and losses to realized gains and losses, reviews of missing or stale prices and large movements in market values, and reviews of any market related activity. Thepricing of all Fair Valued Investments is subsequently reported to the Board on a quarterly basis.
Fair value pricing could result in a difference between the prices used to calculate a fund’s NAV and the prices used by the fund’s underlying index, which in turn could resultin a difference between the fund’s performance and the performance of the fund’s underlying index.
Fair Value Hierarchy: Various inputs are used in determining the fair value of financial instruments. These inputs to valuation techniques are categorized into a fair valuehierarchy consisting of three broad levels for financial reporting purposes as follows:
• Level 1 – Unadjusted price quotations in active markets for identical assets or liabilities;• Level 2 – Inputs other than quoted prices included within Level 1 that are observable for the asset or liability either directly or indirectly, including, but not limited to,
quoted prices for similar assets or liabilities in markets that are active, quoted prices for identical or similar assets or liabilities in markets that are not considered tobe active, inputs other than quoted prices that are observable for the asset or liability (such as interest rates, yield curves, volatilities, prepayment speeds, lossseverities, credit risks and default rates) or other market-corroborated inputs; and
• Level 3 – Unobservable inputs based on the best information available in the circumstances, to the extent observable inputs are not available, (including the GlobalValuation Committee’s assumptions used in determining the fair value of financial instruments).
The hierarchy gives the highest priority to unadjusted quoted prices in active markets for identical assets or liabilities (Level 1 measurements) and the lowest priority tounobservable inputs (Level 3 measurements). Accordingly, the degree of judgement exercised in determining fair value is greatest for instruments categorized in Level 3.The inputs used to measure fair value may fall into different levels of the fair value hierarchy. In such cases, for disclosure purposes, the fair value hierarchy classificationis determined based on the lowest level input that is significant to the fair value measurement in its entirety. The fair value hierarchy for each Fund’s investments is includedin its schedule of investments.
Changes in valuation techniques may result in transfers into or out of an assigned level within the hierarchy. In accordance with the Company's policy, transfers betweendifferent levels of the fair value hierarchy are deemed to have occurred as of the beginning of the reporting period. The categorization of a value determined for financialinstruments is based on the pricing transparency of the financial instruments and is not necessarily an indication of the risks associated with investing in those securities.
Notes to Financial Statements (continued)
N O T E S T O F I N A N C I A L S T A T E M E N T S 63
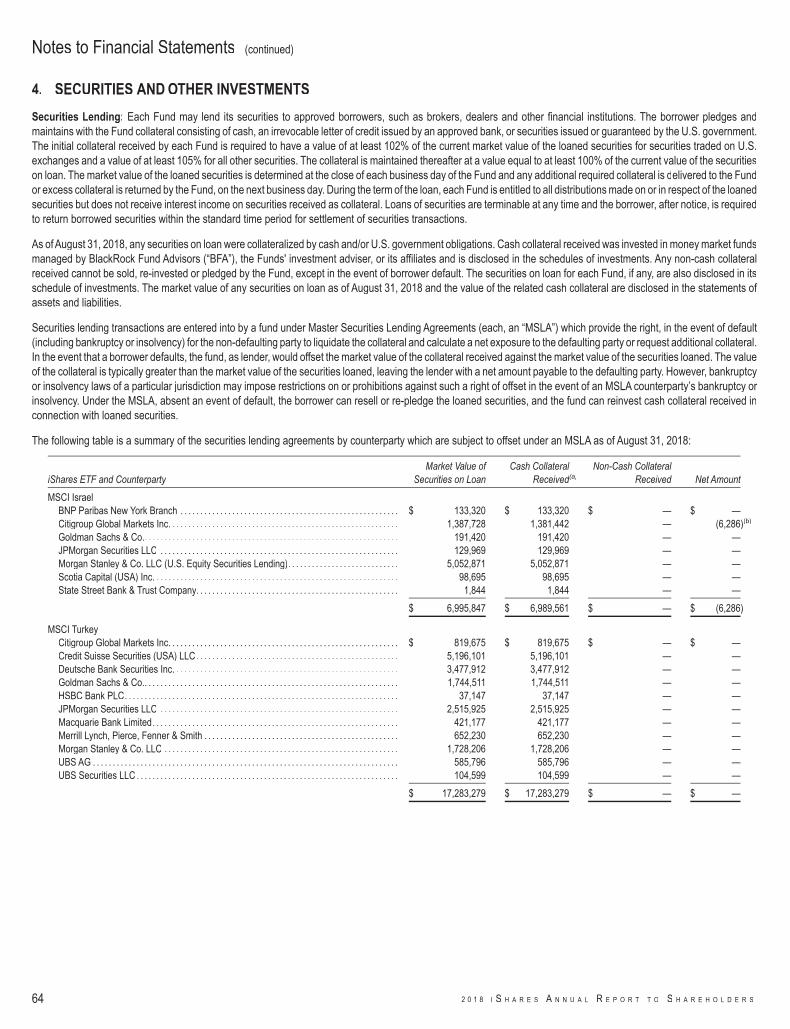
4. SECURITIES AND OTHER INVESTMENTS
Securities Lending: Each Fund may lend its securities to approved borrowers, such as brokers, dealers and other financial institutions. The borrower pledges andmaintains with the Fund collateral consisting of cash, an irrevocable letter of credit issued by an approved bank, or securities issued or guaranteed by the U.S. government.The initial collateral received by each Fund is required to have a value of at least 102% of the current market value of the loaned securities for securities traded on U.S.exchanges and a value of at least 105% for all other securities. The collateral is maintained thereafter at a value equal to at least 100% of the current value of the securitieson loan. The market value of the loaned securities is determined at the close of each business day of the Fund and any additional required collateral is delivered to the Fundor excess collateral is returned by the Fund, on the next business day. During the term of the loan, each Fund is entitled to all distributions made on or in respect of the loanedsecurities but does not receive interest income on securities received as collateral. Loans of securities are terminable at any time and the borrower, after notice, is requiredto return borrowed securities within the standard time period for settlement of securities transactions.
As of August 31, 2018, any securities on loan were collateralized by cash and/or U.S. government obligations. Cash collateral received was invested in money market fundsmanaged by BlackRock Fund Advisors (“BFA”), the Funds' investment adviser, or its affiliates and is disclosed in the schedules of investments. Any non-cash collateralreceived cannot be sold, re-invested or pledged by the Fund, except in the event of borrower default. The securities on loan for each Fund, if any, are also disclosed in itsschedule of investments. The market value of any securities on loan as of August 31, 2018 and the value of the related cash collateral are disclosed in the statements ofassets and liabilities.
Securities lending transactions are entered into by a fund under Master Securities Lending Agreements (each, an “MSLA”) which provide the right, in the event of default(including bankruptcy or insolvency) for the non-defaulting party to liquidate the collateral and calculate a net exposure to the defaulting party or request additional collateral.In the event that a borrower defaults, the fund, as lender, would offset the market value of the collateral received against the market value of the securities loaned. The valueof the collateral is typically greater than the market value of the securities loaned, leaving the lender with a net amount payable to the defaulting party. However, bankruptcyor insolvency laws of a particular jurisdiction may impose restrictions on or prohibitions against such a right of offset in the event of an MSLA counterparty’s bankruptcy orinsolvency. Under the MSLA, absent an event of default, the borrower can resell or re-pledge the loaned securities, and the fund can reinvest cash collateral received inconnection with loaned securities.
The following table is a summary of the securities lending agreements by counterparty which are subject to offset under an MSLA as of August 31, 2018:
iShares ETF and CounterpartyMarket Value of
Securities on LoanCash Collateral
Received(a)Non-Cash Collateral
Received Net Amount
MSCI IsraelBNP Paribas New York Branch . . . . . . . . . . . . . . . . . . . . . . . . . . . . . . . . . . . . . . . . . . . . . . . . . . . . . . . $ 133,320 $ 133,320 $ — $ —Citigroup Global Markets Inc. . . . . . . . . . . . . . . . . . . . . . . . . . . . . . . . . . . . . . . . . . . . . . . . . . . . . . . . . . 1,387,728 1,381,442 — (6,286)(b)
Goldman Sachs & Co.. . . . . . . . . . . . . . . . . . . . . . . . . . . . . . . . . . . . . . . . . . . . . . . . . . . . . . . . . . . . . . . . 191,420 191,420 — —JPMorgan Securities LLC . . . . . . . . . . . . . . . . . . . . . . . . . . . . . . . . . . . . . . . . . . . . . . . . . . . . . . . . . . . . 129,969 129,969 — —Morgan Stanley & Co. LLC (U.S. Equity Securities Lending). . . . . . . . . . . . . . . . . . . . . . . . . . . . 5,052,871 5,052,871 — —Scotia Capital (USA) Inc. . . . . . . . . . . . . . . . . . . . . . . . . . . . . . . . . . . . . . . . . . . . . . . . . . . . . . . . . . . . . . 98,695 98,695 — —State Street Bank & Trust Company. . . . . . . . . . . . . . . . . . . . . . . . . . . . . . . . . . . . . . . . . . . . . . . . . . . 1,844 1,844 — —
$ 6,995,847 $ 6,989,561 $ — $ (6,286)
MSCI TurkeyCitigroup Global Markets Inc. . . . . . . . . . . . . . . . . . . . . . . . . . . . . . . . . . . . . . . . . . . . . . . . . . . . . . . . . . $ 819,675 $ 819,675 $ — $ —Credit Suisse Securities (USA) LLC. . . . . . . . . . . . . . . . . . . . . . . . . . . . . . . . . . . . . . . . . . . . . . . . . . . 5,196,101 5,196,101 — —Deutsche Bank Securities Inc. . . . . . . . . . . . . . . . . . . . . . . . . . . . . . . . . . . . . . . . . . . . . . . . . . . . . . . . . 3,477,912 3,477,912 — —Goldman Sachs & Co.. . . . . . . . . . . . . . . . . . . . . . . . . . . . . . . . . . . . . . . . . . . . . . . . . . . . . . . . . . . . . . . . 1,744,511 1,744,511 — —HSBC Bank PLC. . . . . . . . . . . . . . . . . . . . . . . . . . . . . . . . . . . . . . . . . . . . . . . . . . . . . . . . . . . . . . . . . . . . . 37,147 37,147 — —JPMorgan Securities LLC . . . . . . . . . . . . . . . . . . . . . . . . . . . . . . . . . . . . . . . . . . . . . . . . . . . . . . . . . . . . 2,515,925 2,515,925 — —Macquarie Bank Limited. . . . . . . . . . . . . . . . . . . . . . . . . . . . . . . . . . . . . . . . . . . . . . . . . . . . . . . . . . . . . . 421,177 421,177 — —Merrill Lynch, Pierce, Fenner & Smith . . . . . . . . . . . . . . . . . . . . . . . . . . . . . . . . . . . . . . . . . . . . . . . . . 652,230 652,230 — —Morgan Stanley & Co. LLC . . . . . . . . . . . . . . . . . . . . . . . . . . . . . . . . . . . . . . . . . . . . . . . . . . . . . . . . . . . 1,728,206 1,728,206 — —UBS AG . . . . . . . . . . . . . . . . . . . . . . . . . . . . . . . . . . . . . . . . . . . . . . . . . . . . . . . . . . . . . . . . . . . . . . . . . . . . . 585,796 585,796 — —UBS Securities LLC . . . . . . . . . . . . . . . . . . . . . . . . . . . . . . . . . . . . . . . . . . . . . . . . . . . . . . . . . . . . . . . . . . 104,599 104,599 — —
$ 17,283,279 $ 17,283,279 $ — $ —
Notes to Financial Statements (continued)
64 2 0 1 8 I S H A R E S A N N U A L R E P O R T T O S H A R E H O L D E R S
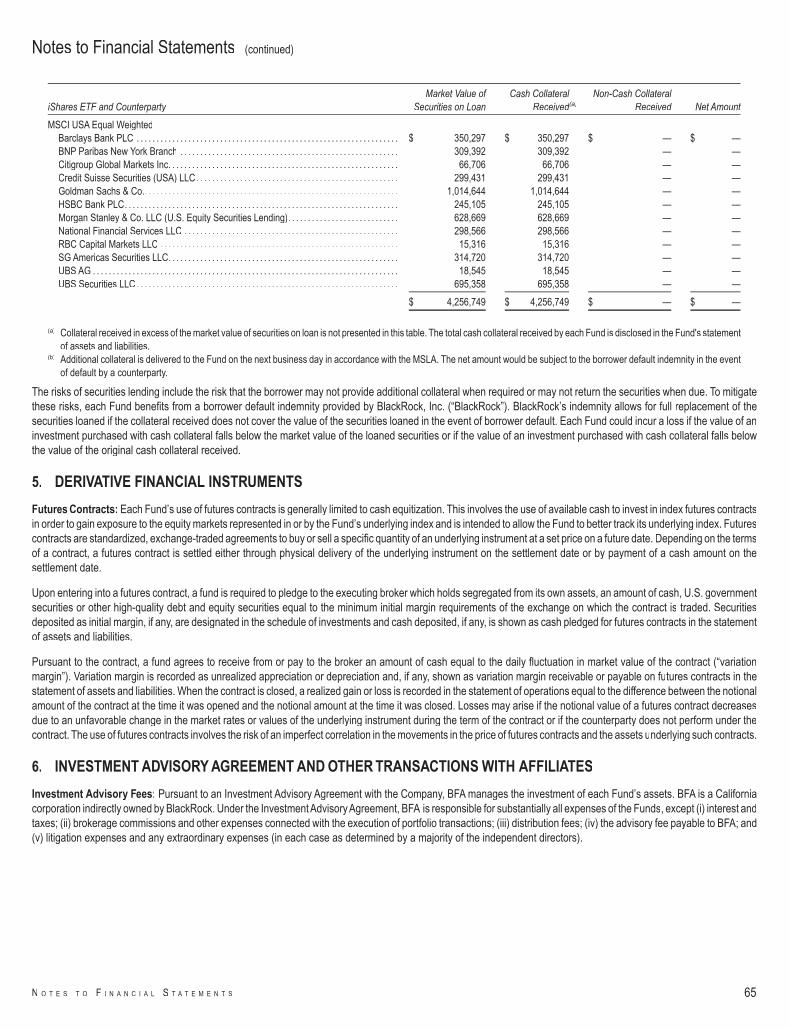
iShares ETF and CounterpartyMarket Value of
Securities on LoanCash Collateral
Received(a)Non-Cash Collateral
Received Net Amount
MSCI USA Equal WeightedBarclays Bank PLC . . . . . . . . . . . . . . . . . . . . . . . . . . . . . . . . . . . . . . . . . . . . . . . . . . . . . . . . . . . . . . . . . . $ 350,297 $ 350,297 $ — $ —BNP Paribas New York Branch . . . . . . . . . . . . . . . . . . . . . . . . . . . . . . . . . . . . . . . . . . . . . . . . . . . . . . . 309,392 309,392 — —Citigroup Global Markets Inc. . . . . . . . . . . . . . . . . . . . . . . . . . . . . . . . . . . . . . . . . . . . . . . . . . . . . . . . . . 66,706 66,706 — —Credit Suisse Securities (USA) LLC. . . . . . . . . . . . . . . . . . . . . . . . . . . . . . . . . . . . . . . . . . . . . . . . . . . 299,431 299,431 — —Goldman Sachs & Co.. . . . . . . . . . . . . . . . . . . . . . . . . . . . . . . . . . . . . . . . . . . . . . . . . . . . . . . . . . . . . . . . 1,014,644 1,014,644 — —HSBC Bank PLC. . . . . . . . . . . . . . . . . . . . . . . . . . . . . . . . . . . . . . . . . . . . . . . . . . . . . . . . . . . . . . . . . . . . . 245,105 245,105 — —Morgan Stanley & Co. LLC (U.S. Equity Securities Lending). . . . . . . . . . . . . . . . . . . . . . . . . . . . 628,669 628,669 — —National Financial Services LLC . . . . . . . . . . . . . . . . . . . . . . . . . . . . . . . . . . . . . . . . . . . . . . . . . . . . . . 298,566 298,566 — —RBC Capital Markets LLC . . . . . . . . . . . . . . . . . . . . . . . . . . . . . . . . . . . . . . . . . . . . . . . . . . . . . . . . . . . . 15,316 15,316 — —SG Americas Securities LLC. . . . . . . . . . . . . . . . . . . . . . . . . . . . . . . . . . . . . . . . . . . . . . . . . . . . . . . . . . 314,720 314,720 — —UBS AG . . . . . . . . . . . . . . . . . . . . . . . . . . . . . . . . . . . . . . . . . . . . . . . . . . . . . . . . . . . . . . . . . . . . . . . . . . . . . 18,545 18,545 — —UBS Securities LLC . . . . . . . . . . . . . . . . . . . . . . . . . . . . . . . . . . . . . . . . . . . . . . . . . . . . . . . . . . . . . . . . . . 695,358 695,358 — —
$ 4,256,749 $ 4,256,749 $ — $ —
(a) Collateral received in excess of the market value of securities on loan is not presented in this table. The total cash collateral received by each Fund is disclosed in the Fund's statementof assets and liabilities.
(b) Additional collateral is delivered to the Fund on the next business day in accordance with the MSLA. The net amount would be subject to the borrower default indemnity in the eventof default by a counterparty.
The risks of securities lending include the risk that the borrower may not provide additional collateral when required or may not return the securities when due. To mitigatethese risks, each Fund benefits from a borrower default indemnity provided by BlackRock, Inc. (“BlackRock”). BlackRock’s indemnity allows for full replacement of thesecurities loaned if the collateral received does not cover the value of the securities loaned in the event of borrower default. Each Fund could incur a loss if the value of aninvestment purchased with cash collateral falls below the market value of the loaned securities or if the value of an investment purchased with cash collateral falls belowthe value of the original cash collateral received.
5. DERIVATIVE FINANCIAL INSTRUMENTS
Futures Contracts: Each Fund’s use of futures contracts is generally limited to cash equitization. This involves the use of available cash to invest in index futures contractsin order to gain exposure to the equity markets represented in or by the Fund’s underlying index and is intended to allow the Fund to better track its underlying index. Futurescontracts are standardized, exchange-traded agreements to buy or sell a specific quantity of an underlying instrument at a set price on a future date. Depending on the termsof a contract, a futures contract is settled either through physical delivery of the underlying instrument on the settlement date or by payment of a cash amount on thesettlement date.
Upon entering into a futures contract, a fund is required to pledge to the executing broker which holds segregated from its own assets, an amount of cash, U.S. governmentsecurities or other high-quality debt and equity securities equal to the minimum initial margin requirements of the exchange on which the contract is traded. Securitiesdeposited as initial margin, if any, are designated in the schedule of investments and cash deposited, if any, is shown as cash pledged for futures contracts in the statementof assets and liabilities.
Pursuant to the contract, a fund agrees to receive from or pay to the broker an amount of cash equal to the daily fluctuation in market value of the contract (“variationmargin”). Variation margin is recorded as unrealized appreciation or depreciation and, if any, shown as variation margin receivable or payable on futures contracts in thestatement of assets and liabilities. When the contract is closed, a realized gain or loss is recorded in the statement of operations equal to the difference between the notionalamount of the contract at the time it was opened and the notional amount at the time it was closed. Losses may arise if the notional value of a futures contract decreasesdue to an unfavorable change in the market rates or values of the underlying instrument during the term of the contract or if the counterparty does not perform under thecontract. The use of futures contracts involves the risk of an imperfect correlation in the movements in the price of futures contracts and the assets underlying such contracts.
6. INVESTMENT ADVISORY AGREEMENT AND OTHER TRANSACTIONS WITH AFFILIATES
Investment Advisory Fees: Pursuant to an Investment Advisory Agreement with the Company, BFA manages the investment of each Fund’s assets. BFA is a Californiacorporation indirectly owned by BlackRock. Under the InvestmentAdvisoryAgreement, BFA is responsible for substantially all expenses of the Funds, except (i) interest andtaxes; (ii) brokerage commissions and other expenses connected with the execution of portfolio transactions; (iii) distribution fees; (iv) the advisory fee payable to BFA; and(v) litigation expenses and any extraordinary expenses (in each case as determined by a majority of the independent directors).
Notes to Financial Statements (continued)
N O T E S T O F I N A N C I A L S T A T E M E N T S 65
For its investment advisory services to each of the iShares MSCI Brazil, iShares MSCI Chile, iShares MSCI Israel, iShares MSCI Russia, iShares MSCI South Africa andiShares MSCI Turkey ETFs, BFA is entitled to an annual investment advisory fee, accrued daily and paid monthly by the Funds, based on each Fund’s allocable portion ofthe aggregate of the average daily net assets of the Fund and certain other iShares funds, as follows:
Aggregate Average Daily Net Assets Investment Advisory Fee
First $2 billion . . . . . . . . . . . . . . . . . . . . . . . . . . . . . . . . . . . . . . . . . . . . . . . . . . . . . . . . . . . . . . . . . . . . . . . . . . . . . . . . . . . . . . . . . . . . . . . . . . . . . . . . . . . . . . . . . . . . . . . . . . . . . . . . . . 0.74%Over $2 billion, up to and including $4 billion. . . . . . . . . . . . . . . . . . . . . . . . . . . . . . . . . . . . . . . . . . . . . . . . . . . . . . . . . . . . . . . . . . . . . . . . . . . . . . . . . . . . . . . . . . . . . . . . . . . . . 0.69Over $4 billion, up to and including $8 billion. . . . . . . . . . . . . . . . . . . . . . . . . . . . . . . . . . . . . . . . . . . . . . . . . . . . . . . . . . . . . . . . . . . . . . . . . . . . . . . . . . . . . . . . . . . . . . . . . . . . . 0.64Over $8 billion, up to and including $16 billion . . . . . . . . . . . . . . . . . . . . . . . . . . . . . . . . . . . . . . . . . . . . . . . . . . . . . . . . . . . . . . . . . . . . . . . . . . . . . . . . . . . . . . . . . . . . . . . . . . . 0.57Over $16 billion, up to and including $24 billion . . . . . . . . . . . . . . . . . . . . . . . . . . . . . . . . . . . . . . . . . . . . . . . . . . . . . . . . . . . . . . . . . . . . . . . . . . . . . . . . . . . . . . . . . . . . . . . . . . 0.51Over $24 billion, up to and including $32 billion . . . . . . . . . . . . . . . . . . . . . . . . . . . . . . . . . . . . . . . . . . . . . . . . . . . . . . . . . . . . . . . . . . . . . . . . . . . . . . . . . . . . . . . . . . . . . . . . . . 0.48Over $32 billion . . . . . . . . . . . . . . . . . . . . . . . . . . . . . . . . . . . . . . . . . . . . . . . . . . . . . . . . . . . . . . . . . . . . . . . . . . . . . . . . . . . . . . . . . . . . . . . . . . . . . . . . . . . . . . . . . . . . . . . . . . . . . . . . 0.45
For its investment advisory services to each of the following Funds, BFA is entitled to an annual investment advisory fee, accrued daily and paid monthly by the Funds, basedon the average daily net assets of each Fund as follows:
iShares ETF Investment Advisory Fee
MSCI Colombia . . . . . . . . . . . . . . . . . . . . . . . . . . . . . . . . . . . . . . . . . . . . . . . . . . . . . . . . . . . . . . . . . . . . . . . . . . . . . . . . . . . . . . . . . . . . . . . . . . . . . . . . . . . . . . . . . . . . . . . . . . . . . . . . 0.61%MSCI USA Equal Weighted . . . . . . . . . . . . . . . . . . . . . . . . . . . . . . . . . . . . . . . . . . . . . . . . . . . . . . . . . . . . . . . . . . . . . . . . . . . . . . . . . . . . . . . . . . . . . . . . . . . . . . . . . . . . . . . . . . . . . 0.15
Distributor: BlackRock Investments, LLC, an affiliate of BFA, is the distributor for each Fund. Pursuant to the distribution agreement, BFA is responsible for any fees orexpenses for distribution services provided to the Funds.
Securities Lending: The U.S. Securities and Exchange Commission (the “SEC”) has issued an exemptive order which permits BlackRock Institutional Trust Company,N.A. (“BTC”), an affiliate of BFA, to serve as securities lending agent for the Funds, subject to applicable conditions. As securities lending agent, BTC bears all operationalcosts directly related to securities lending. Each Fund is responsible for fees in connection with the investment of cash collateral received for securities on loan in a moneymarket fund managed by BFA, or its affiliates, however, BTC has agreed to reduce the amount of securities lending income it receives in order to effectively limit the collateralinvestment fees each Fund bears to an annual rate of 0.04% (the “collateral investment fees”). Securities lending income is equal to the total of income earned from thereinvestment of cash collateral (excluding collateral investment fees), net of fees and other payments to and from borrowers of securities. Each Fund retains a portion ofsecurities lending income and remits the remaining portion to BTC as compensation for its services as securities lending agent.
Pursuant to a securities lending agreement, the iShares MSCI USA Equal Weighted ETF (the “Group 1 Fund”), retains 71.5% of securities lending income (which excludescollateral investment fees) and the amount retained can never be less than 65% of the total of securities lending income plus the collateral investment fees.
Pursuant to a securities lending agreement, each of iShares MSCI Brazil ETF, iShares MSCI Chile ETF, iShares MSCI Colombia ETF, iShares MSCI Israel ETF, iSharesMSCI Russia ETF, iShares MSCI SouthAfrica ETF and iShares MSCI Turkey ETF (the “Group 2 Funds”), retains 80% of securities lending income (which excludes collateralinvestment fees) and the amount retained can never be less than 70% of the total of securities lending income plus the collateral investment fees.
In addition, commencing the business day following the date that the aggregate securities lending income plus the collateral investment fees generated across all 1940 ActiShares exchange-traded funds (the “iShares ETF Complex”) in a given calendar year exceeds the aggregate securities lending income generated across the iShares ETFComplex in the calendar year 2013, the Group 1 Fund, pursuant to a securities lending agreement, will retain for the remainder of that calendar year 75% of securitieslending income and the amount retained can never be less than 65% of the total of securities lending income plus the collateral investment fees. Each Group 2 Fund willreceive for the remainder of that calendar year 85% of securities lending income and the amount retained can never be less than 70% of the total of securities lending incomeplus the collateral investment fees.
The share of securities lending income earned by each Fund is shown as securities lending income – affiliated – net in its statement of operations. For the year endedAugust 31, 2018, the Funds paid BTC the following amounts for securities lending agent services:
iShares ETFFees Paid
to BTC
MSCI Colombia . . . . . . . . . . . . . . . . . . . . . . . . . . . . . . . . . . . . . . . . . . . . . . . . . . . . . . . . . . . . . . . . . . . . . . . . . . . . . . . . . . . . . . . . . . . . . . . . . . . . . . . . . . . . . . . . . . . . . . . . . . . . . . . . . . . . . . . . . . . . . . $ 154MSCI Israel . . . . . . . . . . . . . . . . . . . . . . . . . . . . . . . . . . . . . . . . . . . . . . . . . . . . . . . . . . . . . . . . . . . . . . . . . . . . . . . . . . . . . . . . . . . . . . . . . . . . . . . . . . . . . . . . . . . . . . . . . . . . . . . . . . . . . . . . . . . . . . . . . . 17,527MSCI South Africa. . . . . . . . . . . . . . . . . . . . . . . . . . . . . . . . . . . . . . . . . . . . . . . . . . . . . . . . . . . . . . . . . . . . . . . . . . . . . . . . . . . . . . . . . . . . . . . . . . . . . . . . . . . . . . . . . . . . . . . . . . . . . . . . . . . . . . . . . . . . 6,671MSCI Turkey . . . . . . . . . . . . . . . . . . . . . . . . . . . . . . . . . . . . . . . . . . . . . . . . . . . . . . . . . . . . . . . . . . . . . . . . . . . . . . . . . . . . . . . . . . . . . . . . . . . . . . . . . . . . . . . . . . . . . . . . . . . . . . . . . . . . . . . . . . . . . . . . . 233,777MSCI USA Equal Weighted . . . . . . . . . . . . . . . . . . . . . . . . . . . . . . . . . . . . . . . . . . . . . . . . . . . . . . . . . . . . . . . . . . . . . . . . . . . . . . . . . . . . . . . . . . . . . . . . . . . . . . . . . . . . . . . . . . . . . . . . . . . . . . . . . . . 12,969
Officers and Trustees: Certain officers and/or trustees of the Company are officers and/or trustees of BlackRock or its affiliates.
Other Transactions: The PNC Financial Services Group, Inc. is the largest stockholder and an affiliate of BlackRock for 1940 Act purposes.
Cross trading is the buying or selling of portfolio securities between funds to which BFA (or an affiliate) serves as investment adviser. At its regularly scheduled quarterlymeetings, the Board reviews such transactions as of the most recent calendar quarter for compliance with the requirements and restrictions set forth by Rule 17a-7.
Notes to Financial Statements (continued)
66 2 0 1 8 I S H A R E S A N N U A L R E P O R T T O S H A R E H O L D E R S
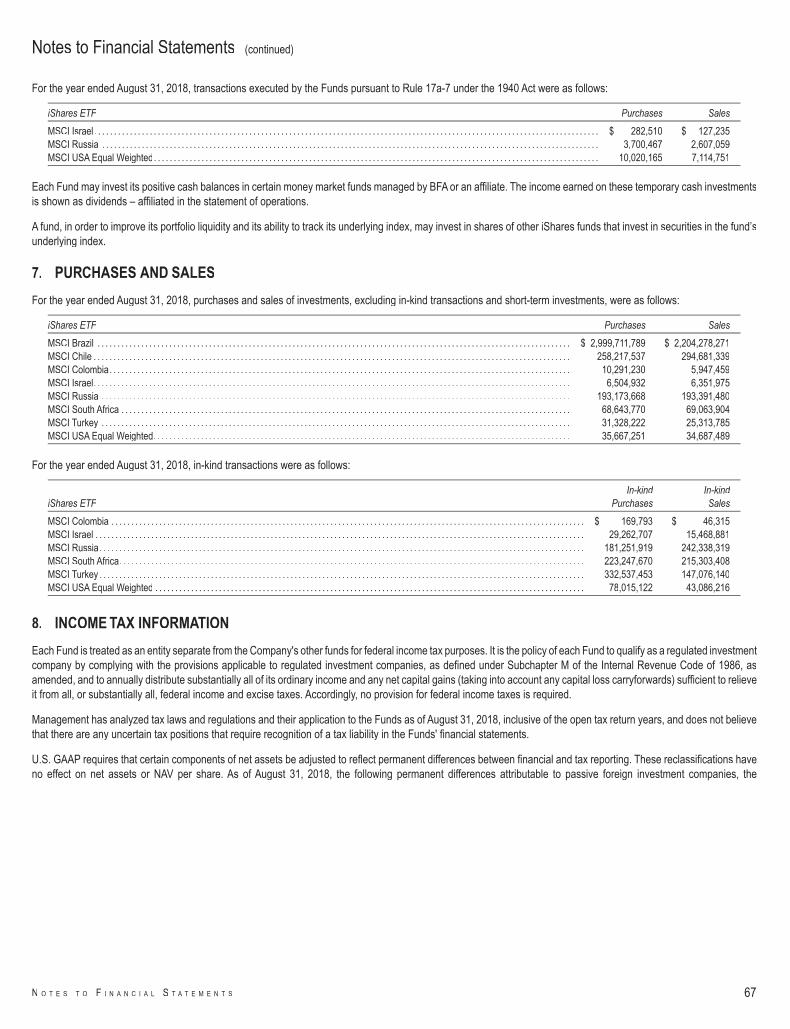
For the year ended August 31, 2018, transactions executed by the Funds pursuant to Rule 17a-7 under the 1940 Act were as follows:
iShares ETF Purchases Sales
MSCI Israel . . . . . . . . . . . . . . . . . . . . . . . . . . . . . . . . . . . . . . . . . . . . . . . . . . . . . . . . . . . . . . . . . . . . . . . . . . . . . . . . . . . . . . . . . . . . . . . . . . . . . . . . . . . . . . . . . . . . . . . . . . . . . . . $ 282,510 $ 127,235MSCI Russia . . . . . . . . . . . . . . . . . . . . . . . . . . . . . . . . . . . . . . . . . . . . . . . . . . . . . . . . . . . . . . . . . . . . . . . . . . . . . . . . . . . . . . . . . . . . . . . . . . . . . . . . . . . . . . . . . . . . . . . . . . . . . 3,700,467 2,607,059MSCI USA Equal Weighted. . . . . . . . . . . . . . . . . . . . . . . . . . . . . . . . . . . . . . . . . . . . . . . . . . . . . . . . . . . . . . . . . . . . . . . . . . . . . . . . . . . . . . . . . . . . . . . . . . . . . . . . . . . . . . . . 10,020,165 7,114,751
Each Fund may invest its positive cash balances in certain money market funds managed by BFA or an affiliate. The income earned on these temporary cash investmentsis shown as dividends – affiliated in the statement of operations.
A fund, in order to improve its portfolio liquidity and its ability to track its underlying index, may invest in shares of other iShares funds that invest in securities in the fund’sunderlying index.
7. PURCHASES AND SALES
For the year ended August 31, 2018, purchases and sales of investments, excluding in-kind transactions and short-term investments, were as follows:
iShares ETF Purchases Sales
MSCI Brazil . . . . . . . . . . . . . . . . . . . . . . . . . . . . . . . . . . . . . . . . . . . . . . . . . . . . . . . . . . . . . . . . . . . . . . . . . . . . . . . . . . . . . . . . . . . . . . . . . . . . . . . . . . . . . . . . . . . . . . . $ 2,999,711,789 $ 2,204,278,271MSCI Chile . . . . . . . . . . . . . . . . . . . . . . . . . . . . . . . . . . . . . . . . . . . . . . . . . . . . . . . . . . . . . . . . . . . . . . . . . . . . . . . . . . . . . . . . . . . . . . . . . . . . . . . . . . . . . . . . . . . . . . . . 258,217,537 294,681,339MSCI Colombia. . . . . . . . . . . . . . . . . . . . . . . . . . . . . . . . . . . . . . . . . . . . . . . . . . . . . . . . . . . . . . . . . . . . . . . . . . . . . . . . . . . . . . . . . . . . . . . . . . . . . . . . . . . . . . . . . . . . 10,291,230 5,947,459MSCI Israel. . . . . . . . . . . . . . . . . . . . . . . . . . . . . . . . . . . . . . . . . . . . . . . . . . . . . . . . . . . . . . . . . . . . . . . . . . . . . . . . . . . . . . . . . . . . . . . . . . . . . . . . . . . . . . . . . . . . . . . . 6,504,932 6,351,975MSCI Russia . . . . . . . . . . . . . . . . . . . . . . . . . . . . . . . . . . . . . . . . . . . . . . . . . . . . . . . . . . . . . . . . . . . . . . . . . . . . . . . . . . . . . . . . . . . . . . . . . . . . . . . . . . . . . . . . . . . . . . 193,173,668 193,391,480MSCI South Africa . . . . . . . . . . . . . . . . . . . . . . . . . . . . . . . . . . . . . . . . . . . . . . . . . . . . . . . . . . . . . . . . . . . . . . . . . . . . . . . . . . . . . . . . . . . . . . . . . . . . . . . . . . . . . . . . . 68,643,770 69,063,904MSCI Turkey . . . . . . . . . . . . . . . . . . . . . . . . . . . . . . . . . . . . . . . . . . . . . . . . . . . . . . . . . . . . . . . . . . . . . . . . . . . . . . . . . . . . . . . . . . . . . . . . . . . . . . . . . . . . . . . . . . . . . . 31,328,222 25,313,785MSCI USA Equal Weighted. . . . . . . . . . . . . . . . . . . . . . . . . . . . . . . . . . . . . . . . . . . . . . . . . . . . . . . . . . . . . . . . . . . . . . . . . . . . . . . . . . . . . . . . . . . . . . . . . . . . . . . . . 35,667,251 34,687,489
For the year ended August 31, 2018, in-kind transactions were as follows:
iShares ETFIn-kind
PurchasesIn-kindSales
MSCI Colombia . . . . . . . . . . . . . . . . . . . . . . . . . . . . . . . . . . . . . . . . . . . . . . . . . . . . . . . . . . . . . . . . . . . . . . . . . . . . . . . . . . . . . . . . . . . . . . . . . . . . . . . . . . . . . . . . . . . . . . . $ 169,793 $ 46,315MSCI Israel . . . . . . . . . . . . . . . . . . . . . . . . . . . . . . . . . . . . . . . . . . . . . . . . . . . . . . . . . . . . . . . . . . . . . . . . . . . . . . . . . . . . . . . . . . . . . . . . . . . . . . . . . . . . . . . . . . . . . . . . . . . 29,262,707 15,468,881MSCI Russia. . . . . . . . . . . . . . . . . . . . . . . . . . . . . . . . . . . . . . . . . . . . . . . . . . . . . . . . . . . . . . . . . . . . . . . . . . . . . . . . . . . . . . . . . . . . . . . . . . . . . . . . . . . . . . . . . . . . . . . . . . 181,251,919 242,338,319MSCI South Africa. . . . . . . . . . . . . . . . . . . . . . . . . . . . . . . . . . . . . . . . . . . . . . . . . . . . . . . . . . . . . . . . . . . . . . . . . . . . . . . . . . . . . . . . . . . . . . . . . . . . . . . . . . . . . . . . . . . . . 223,247,670 215,303,408MSCI Turkey . . . . . . . . . . . . . . . . . . . . . . . . . . . . . . . . . . . . . . . . . . . . . . . . . . . . . . . . . . . . . . . . . . . . . . . . . . . . . . . . . . . . . . . . . . . . . . . . . . . . . . . . . . . . . . . . . . . . . . . . . . 332,537,453 147,076,140MSCI USA Equal Weighted . . . . . . . . . . . . . . . . . . . . . . . . . . . . . . . . . . . . . . . . . . . . . . . . . . . . . . . . . . . . . . . . . . . . . . . . . . . . . . . . . . . . . . . . . . . . . . . . . . . . . . . . . . . . 78,015,122 43,086,216
8. INCOME TAX INFORMATION
Each Fund is treated as an entity separate from the Company's other funds for federal income tax purposes. It is the policy of each Fund to qualify as a regulated investmentcompany by complying with the provisions applicable to regulated investment companies, as defined under Subchapter M of the Internal Revenue Code of 1986, asamended, and to annually distribute substantially all of its ordinary income and any net capital gains (taking into account any capital loss carryforwards) sufficient to relieveit from all, or substantially all, federal income and excise taxes. Accordingly, no provision for federal income taxes is required.
Management has analyzed tax laws and regulations and their application to the Funds as of August 31, 2018, inclusive of the open tax return years, and does not believethat there are any uncertain tax positions that require recognition of a tax liability in the Funds' financial statements.
U.S. GAAP requires that certain components of net assets be adjusted to reflect permanent differences between financial and tax reporting. These reclassifications haveno effect on net assets or NAV per share. As of August 31, 2018, the following permanent differences attributable to passive foreign investment companies, the
Notes to Financial Statements (continued)
N O T E S T O F I N A N C I A L S T A T E M E N T S 67
characterization of corporate actions, the expiration of capital loss carryforwards, distributions paid in excess of taxable income, foreign currency transactions, realizedgains (losses) from in-kind redemptions and the characterization of expenses, were reclassified to the following accounts:
iShares ETF Paid-in Capital
Undistributed(Distributionsin Excess of)
Net InvestmentIncome
AccumulatedNet Realized
Gain (Loss)
MSCI Brazil . . . . . . . . . . . . . . . . . . . . . . . . . . . . . . . . . . . . . . . . . . . . . . . . . . . . . . . . . . . . . . . . . . . . . . . . . . . . . . . . . . . . . . . . . . . . . . . . . . . . . $ (198,226,310) $ (4,979,725) $ 203,206,035MSCI Chile . . . . . . . . . . . . . . . . . . . . . . . . . . . . . . . . . . . . . . . . . . . . . . . . . . . . . . . . . . . . . . . . . . . . . . . . . . . . . . . . . . . . . . . . . . . . . . . . . . . . . . (11,712,090) (54,027) 11,766,117MSCI Colombia. . . . . . . . . . . . . . . . . . . . . . . . . . . . . . . . . . . . . . . . . . . . . . . . . . . . . . . . . . . . . . . . . . . . . . . . . . . . . . . . . . . . . . . . . . . . . . . . . . 17,544 (42,690) 25,146MSCI Israel. . . . . . . . . . . . . . . . . . . . . . . . . . . . . . . . . . . . . . . . . . . . . . . . . . . . . . . . . . . . . . . . . . . . . . . . . . . . . . . . . . . . . . . . . . . . . . . . . . . . . . (7,306,232) 523,770 6,782,462MSCI Russia . . . . . . . . . . . . . . . . . . . . . . . . . . . . . . . . . . . . . . . . . . . . . . . . . . . . . . . . . . . . . . . . . . . . . . . . . . . . . . . . . . . . . . . . . . . . . . . . . . . . 41,212,910 (177,220) (41,035,690)MSCI South Africa . . . . . . . . . . . . . . . . . . . . . . . . . . . . . . . . . . . . . . . . . . . . . . . . . . . . . . . . . . . . . . . . . . . . . . . . . . . . . . . . . . . . . . . . . . . . . . . 14,319,324 169,697 (14,489,021)MSCI Turkey . . . . . . . . . . . . . . . . . . . . . . . . . . . . . . . . . . . . . . . . . . . . . . . . . . . . . . . . . . . . . . . . . . . . . . . . . . . . . . . . . . . . . . . . . . . . . . . . . . . . (8,926,253) (70,451) 8,996,704MSCI USA Equal Weighted. . . . . . . . . . . . . . . . . . . . . . . . . . . . . . . . . . . . . . . . . . . . . . . . . . . . . . . . . . . . . . . . . . . . . . . . . . . . . . . . . . . . . . . 10,273,255 5,066 (10,278,321)
The tax character of distributions paid was as follows:
iShares ETFYear Ended
08/31/18Year Ended
08/31/17
MSCI BrazilOrdinary income. . . . . . . . . . . . . . . . . . . . . . . . . . . . . . . . . . . . . . . . . . . . . . . . . . . . . . . . . . . . . . . . . . . . . . . . . . . . . . . . . . . . . . . . . . . . . . . . . . . . . . . . . . . . . . . . . . . . . . . . $ 186,603,443 $ 93,579,029
MSCI ChileOrdinary income. . . . . . . . . . . . . . . . . . . . . . . . . . . . . . . . . . . . . . . . . . . . . . . . . . . . . . . . . . . . . . . . . . . . . . . . . . . . . . . . . . . . . . . . . . . . . . . . . . . . . . . . . . . . . . . . . . . . . . . . $ 7,431,414 $ 6,944,133Return of capital . . . . . . . . . . . . . . . . . . . . . . . . . . . . . . . . . . . . . . . . . . . . . . . . . . . . . . . . . . . . . . . . . . . . . . . . . . . . . . . . . . . . . . . . . . . . . . . . . . . . . . . . . . . . . . . . . . . . . . . . 465,343 462,190
$ 7,896,757 $ 7,406,323
MSCI ColombiaOrdinary income. . . . . . . . . . . . . . . . . . . . . . . . . . . . . . . . . . . . . . . . . . . . . . . . . . . . . . . . . . . . . . . . . . . . . . . . . . . . . . . . . . . . . . . . . . . . . . . . . . . . . . . . . . . . . . . . . . . . . . . . $ 365,825 $ 229,358
MSCI IsraelOrdinary income. . . . . . . . . . . . . . . . . . . . . . . . . . . . . . . . . . . . . . . . . . . . . . . . . . . . . . . . . . . . . . . . . . . . . . . . . . . . . . . . . . . . . . . . . . . . . . . . . . . . . . . . . . . . . . . . . . . . . . . . $ 2,219,395 $ 1,597,362
MSCI RussiaOrdinary income. . . . . . . . . . . . . . . . . . . . . . . . . . . . . . . . . . . . . . . . . . . . . . . . . . . . . . . . . . . . . . . . . . . . . . . . . . . . . . . . . . . . . . . . . . . . . . . . . . . . . . . . . . . . . . . . . . . . . . . . $ 20,645,275 $ 13,531,335
MSCI South AfricaOrdinary income. . . . . . . . . . . . . . . . . . . . . . . . . . . . . . . . . . . . . . . . . . . . . . . . . . . . . . . . . . . . . . . . . . . . . . . . . . . . . . . . . . . . . . . . . . . . . . . . . . . . . . . . . . . . . . . . . . . . . . . . $ 9,978,039 $ 7,473,325
MSCI TurkeyOrdinary income. . . . . . . . . . . . . . . . . . . . . . . . . . . . . . . . . . . . . . . . . . . . . . . . . . . . . . . . . . . . . . . . . . . . . . . . . . . . . . . . . . . . . . . . . . . . . . . . . . . . . . . . . . . . . . . . . . . . . . . . $ 8,942,652 $ 10,121,626
MSCI USA Equal WeightedOrdinary income. . . . . . . . . . . . . . . . . . . . . . . . . . . . . . . . . . . . . . . . . . . . . . . . . . . . . . . . . . . . . . . . . . . . . . . . . . . . . . . . . . . . . . . . . . . . . . . . . . . . . . . . . . . . . . . . . . . . . . . . $ 2,338,579 $ 1,736,320
As of August 31, 2018, the tax components of accumulated net earnings (losses) were as follows:
iShares ETFUndistributed
Ordinary IncomeCapital Loss
CarryforwardsNet UnrealizedGains (Losses)(a)
QualifiedLate-Year Losses(b) Total
MSCI Brazil . . . . . . . . . . . . . . . . . . . . . . . . . . . . . . . . . . . . . . . . . . . . . . . . . . . . $ 52,048,706 $ (2,448,185,257) $ 357,605,118 $ — $ (2,038,531,433)MSCI Chile. . . . . . . . . . . . . . . . . . . . . . . . . . . . . . . . . . . . . . . . . . . . . . . . . . . . . — (126,780,629) 58,838,643 (51,786) (67,993,772)MSCI Colombia . . . . . . . . . . . . . . . . . . . . . . . . . . . . . . . . . . . . . . . . . . . . . . . . 100,951 (8,968,691) (1,388,624) — (10,256,364)MSCI Israel . . . . . . . . . . . . . . . . . . . . . . . . . . . . . . . . . . . . . . . . . . . . . . . . . . . . — (40,534,147) (365,348) — (40,899,495)MSCI Russia . . . . . . . . . . . . . . . . . . . . . . . . . . . . . . . . . . . . . . . . . . . . . . . . . . . 13,766,934 (83,968,805) (57,533,183) — (127,735,054)MSCI South Africa . . . . . . . . . . . . . . . . . . . . . . . . . . . . . . . . . . . . . . . . . . . . . . 566,892 (114,190,385) (116,438,402) — (230,061,895)MSCI Turkey . . . . . . . . . . . . . . . . . . . . . . . . . . . . . . . . . . . . . . . . . . . . . . . . . . . 239,499 (85,583,816) (336,827,971) — (422,172,288)MSCI USA Equal Weighted . . . . . . . . . . . . . . . . . . . . . . . . . . . . . . . . . . . . . 692,087 (950,870) 23,163,763 — 22,904,980
(a) The difference between book-basis and tax-basis unrealized gains (losses) was attributable primarily to the tax deferral of losses on wash sales, the realization for tax purposes ofunrealized gains (losses) on certain futures contracts, the realization for tax purposes of unrealized gains on investments in passive foreign investment companies and thecharacterization of corporate actions.
(b) The Funds elected to defer certain qualified late-year losses and recognize such losses in the year ending next taxable year.
Notes to Financial Statements (continued)
68 2 0 1 8 I S H A R E S A N N U A L R E P O R T T O S H A R E H O L D E R S
As of August 31, 2018, the Funds had capital loss carryforwards available to offset future realized capital gains through the indicated expiration dates as follows:
iShares ETF Non-Expiring(a) Expiring 2019 Total
MSCI Brazil . . . . . . . . . . . . . . . . . . . . . . . . . . . . . . . . . . . . . . . . . . . . . . . . . . . . . . . . . . . . . . . . . . . . . . . . . . . . . . . . . . . . . . . . . . . . . . . . . . . . $ 2,448,185,257 $ — $ 2,448,185,257MSCI Chile . . . . . . . . . . . . . . . . . . . . . . . . . . . . . . . . . . . . . . . . . . . . . . . . . . . . . . . . . . . . . . . . . . . . . . . . . . . . . . . . . . . . . . . . . . . . . . . . . . . . 125,803,638 976,991 126,780,629MSCI Colombia . . . . . . . . . . . . . . . . . . . . . . . . . . . . . . . . . . . . . . . . . . . . . . . . . . . . . . . . . . . . . . . . . . . . . . . . . . . . . . . . . . . . . . . . . . . . . . . . 8,968,691 — 8,968,691MSCI Israel . . . . . . . . . . . . . . . . . . . . . . . . . . . . . . . . . . . . . . . . . . . . . . . . . . . . . . . . . . . . . . . . . . . . . . . . . . . . . . . . . . . . . . . . . . . . . . . . . . . . 33,403,898 7,130,249 40,534,147MSCI Russia. . . . . . . . . . . . . . . . . . . . . . . . . . . . . . . . . . . . . . . . . . . . . . . . . . . . . . . . . . . . . . . . . . . . . . . . . . . . . . . . . . . . . . . . . . . . . . . . . . . 83,968,805 — 83,968,805MSCI South Africa. . . . . . . . . . . . . . . . . . . . . . . . . . . . . . . . . . . . . . . . . . . . . . . . . . . . . . . . . . . . . . . . . . . . . . . . . . . . . . . . . . . . . . . . . . . . . . 108,053,243 6,137,142 114,190,385MSCI Turkey . . . . . . . . . . . . . . . . . . . . . . . . . . . . . . . . . . . . . . . . . . . . . . . . . . . . . . . . . . . . . . . . . . . . . . . . . . . . . . . . . . . . . . . . . . . . . . . . . . . 81,724,632 3,859,184 85,583,816MSCI USA Equal Weighted . . . . . . . . . . . . . . . . . . . . . . . . . . . . . . . . . . . . . . . . . . . . . . . . . . . . . . . . . . . . . . . . . . . . . . . . . . . . . . . . . . . . . 950,870 — 950,870
(a) Must be utilized prior to losses subject to expiration.
For the year ended August 31, 2018, the iShares MSCI Chile ETF utilized $24,596,626 of its capital loss carryforwards.
A fund may own shares in certain foreign investment entities, referred to, under U.S. tax law, as “passive foreign investment companies.” Such fund may elect tomark-to-market annually the shares of each passive foreign investment company and would be required to distribute to shareholders any such marked-to-market gains.
As of August 31, 2018, gross unrealized appreciation and depreciation based on cost of investments (including short positions and derivatives, if any) for U.S. federalincome tax purposes were as follows:
iShares ETF Tax CostGross Unrealized
AppreciationGross Unrealized
Depreciation
Net UnrealizedAppreciation
(Depreciation)
MSCI Brazil . . . . . . . . . . . . . . . . . . . . . . . . . . . . . . . . . . . . . . . . . . . . . . . . . . . . . . . . . . . . . . . . . . . . . . . . . . $ 5,085,273,911 $ 1,192,466,324 $ (830,472,775) $ 361,993,549MSCI Chile . . . . . . . . . . . . . . . . . . . . . . . . . . . . . . . . . . . . . . . . . . . . . . . . . . . . . . . . . . . . . . . . . . . . . . . . . . . 334,604,566 107,497,625 (48,658,973) 58,838,652MSCI Colombia. . . . . . . . . . . . . . . . . . . . . . . . . . . . . . . . . . . . . . . . . . . . . . . . . . . . . . . . . . . . . . . . . . . . . . . 27,138,301 3,374,693 (4,785,500) (1,410,807)MSCI Israel. . . . . . . . . . . . . . . . . . . . . . . . . . . . . . . . . . . . . . . . . . . . . . . . . . . . . . . . . . . . . . . . . . . . . . . . . . . 129,082,499 23,748,703 (24,084,471) (335,768)MSCI Russia . . . . . . . . . . . . . . . . . . . . . . . . . . . . . . . . . . . . . . . . . . . . . . . . . . . . . . . . . . . . . . . . . . . . . . . . . 536,814,360 36,078,352 (93,611,287) (57,532,935)MSCI South Africa . . . . . . . . . . . . . . . . . . . . . . . . . . . . . . . . . . . . . . . . . . . . . . . . . . . . . . . . . . . . . . . . . . . . 489,325,755 20,626,073 (137,035,133) (116,409,060)MSCI Turkey . . . . . . . . . . . . . . . . . . . . . . . . . . . . . . . . . . . . . . . . . . . . . . . . . . . . . . . . . . . . . . . . . . . . . . . . . 741,949,526 4,061 (336,825,519) (336,821,458)MSCI USA Equal Weighted. . . . . . . . . . . . . . . . . . . . . . . . . . . . . . . . . . . . . . . . . . . . . . . . . . . . . . . . . . . . 174,267,454 29,231,082 (6,067,319) 23,163,763
The Tax Cuts and Jobs Act (the “Act”) was enacted on December 22, 2017. Certain provisions of the Act were effective upon enactment with the remainder becomingeffective for tax years beginning after December 31, 2017. Although the Act does not amend any provisions directly related to the qualification or taxation of regulatedinvestment companies (“RICs”), the Act does change the taxation of entities in which some RICs invest, the tax treatment of income derived from those entities and thetaxation of RIC shareholders. While management does not anticipate significant impact to the funds or to their shareholders, there is uncertainty in the application of certainprovisions in the Act. Specifically, provisions in the Act may increase the amount of or accelerate the recognition of taxable income and may limit the deductibility of certainexpenses by RICs. Until full clarity around these provisions is obtained, the impact on the Funds' financial statements, if any, cannot be fully determined.
9. LINE OFCREDIT
The iShares MSCI Colombia ETF, along with certain other iShares funds, is a party to a $275 million credit agreement with State Street Bank and Trust Company, whichexpires on October 24, 2018. The line of credit may be used for temporary or emergency purposes, including redemptions, settlement of trades and rebalancing of portfolioholdings. The credit agreement has the following terms: a commitment fee of 0.20% per annum on the unused portion of the credit agreement and interest at a rate equalto the higher of (a) the one-month LIBOR (not less than zero) plus 1.00% per annum or (b) the U.S. Federal Funds rate (not less than zero) plus 1.00% per annum onamounts borrowed. The commitment fee is allocated to each fund participating in the credit agreement based on each fund’s pro-rata share of the aggregate average dailyvalue of assets invested in local securities of certain foreign markets.
The Fund did not borrow under the credit agreement during the year ended August 31, 2018.
At a meeting held on September 12-13, 2018, the Board approved the amendment of certain terms of the credit agreement including (i) increasing the maximum borrowingamount to $300 million and (ii) extending the expiration date to October 23, 2019. These changes to the credit agreement are expected to be effective on or aroundOctober 25, 2018.
10. PRINCIPAL RISKS
In the normal course of business, each Fund invests in securities or other instruments and may enter into certain transactions, and such activities subject the Fund to variousrisks, including, among others, fluctuations in the market (market risk) or failure of an issuer to meet all of its obligations. The value of securities or other instruments mayalso be affected by various factors, including, without limitation: (i) the general economy; (ii) the overall market as well as local, regional or global political and/or socialinstability; (iii) regulation, taxation or international tax treaties between various countries; or (iv) currency, interest rate or price fluctuations. Each Fund’s prospectus providesdetails of the risks to which the Fund is subject.
Notes to Financial Statements (continued)
N O T E S T O F I N A N C I A L S T A T E M E N T S 69
BFA uses a “passive” or index approach to try to achieve each Fund’s investment objective following the securities included in its underlying index during upturns as wellas downturns. BFA does not take steps to reduce market exposure or to lessen the effects of a declining market. Divergence from the underlying index and the compositionof the portfolio is monitored by BFA.
Market Risk: Market risk arises mainly from uncertainty about future values of financial instruments influenced by price, currency and interest rate movements. It representsthe potential loss a fund may suffer through holding market positions in the face of market movements. A fund is exposed to market risk by its investment in equity, fixedincome and/or financial derivative instruments or by its investment in underlying funds. The fair value of securities held by a fund may decline due to general marketconditions, economic trends or events that are not specifically related to the issuers of the securities including local, regional or global political, social or economic instabilityor to factors that affect a particular industry or group of industries. The extent of a fund’s exposure to market risk is the market value of the investments held as shown inthe fund’s schedule of investments.
Investing in the securities of non-U.S. issuers involves certain considerations and risks not typically associated with securities of U.S. issuers. Such risks include, but arenot limited to: differences in accounting, auditing and financial reporting standards; more substantial governmental involvement in the economy; higher inflation rates,greater social, economic and political uncertainties; possible nationalization or expropriation of assets; less availability of public information about issuers; imposition ofwithholding or other taxes; higher transaction and custody costs and delays in settlement procedures; and lower level of regulation of the securities markets and issuers.Non-U.S. securities may be less liquid, more difficult to value, and have greater price volatility due to exchange rate fluctuations. These and other risks are heightened forinvestments in issuers from countries with less developed capital markets.
Credit Risk: Credit risk is the risk that an issuer or guarantor of debt instruments or the counterparty to a financial transaction, including derivatives contracts, repurchaseagreements or loans of portfolio securities, is unable or unwilling to make timely interest and/or principal payments or to otherwise honor its obligations. BFA and its affiliatesmanage counterparty credit risk by entering into transactions only with counterparties that they believe have the financial resources to honor their obligations and bymonitoring the financial stability of those counterparties. Financial assets, which potentially expose a fund to issuer and counterparty credit risks, consist principally offinancial instruments and receivables due from counterparties. The extent of a fund’s exposure to credit and counterparty risks with respect to those financial assets isapproximated by their value recorded in its statement of assets and liabilities.
Concentration Risk: A diversified portfolio, where this is appropriate and consistent with a fund’s objectives, minimizes the risk that a price change of a particularinvestment will have a material impact on the NAV of a fund. The investment concentrations within each Fund’s portfolio are disclosed in its schedule of investments.
When a fund concentrates its investments in issuers located in a single country or a limited number of countries, it assumes the risk that economic, regulatory, political andsocial conditions in that country or those countries may have a significant impact on the fund and could affect the income from, or the value or liquidity of, the fund’s portfolio.
The United States and the European Union, along with the regulatory bodies of a number of countries including Japan, Australia, Norway, Switzerland and Canada, haveimposed economic sanctions, which can consist of prohibiting certain securities trades, prohibiting certain private transactions in the energy sector, asset freezes andprohibition of all business, on certain Russian individuals and Russian corporate entities. Broader sanctions on Russia could also be instituted. These sanctions, or eventhe threat of further sanctions, may result in the decline of the value and liquidity of Russian securities, a weakening of the ruble or other adverse consequences to theRussian economy, and may negatively impact a fund. Current or future sanctions may result in Russia taking counter measures or retaliatory actions, which may furtherimpair the value and liquidity of Russian securities. These retaliatory measures may include the immediate freeze of Russian assets held by a fund.
When a fund concentrates its investments in securities within a single or limited number of market sectors, it assumes the risk that economic, regulatory, political and socialconditions affecting such sectors may have a significant impact on the fund and could affect the income from, or the value or liquidity of, the fund’s portfolio.
11. CAPITAL SHARE TRANSACTIONS
Capital shares are issued and redeemed by each Fund only in aggregations of a specified number of shares or multiples thereof (“Creation Units”) at NAV. Except whenaggregated in Creation Units, shares of each Fund are not redeemable.
Transactions in capital shares were as follows:
Year Ended08/31/18
Year Ended08/31/17
iShares ETF Shares Amount Shares Amount
MSCI BrazilShares sold . . . . . . . . . . . . . . . . . . . . . . . . . . . . . . . . . . . . . . . . . . . . . . . . . . . . . . . . . . . . . . . . . . . . . . . . . . . . . . . . . . . . 51,100,000 $ 2,106,146,096 50,950,000 $1,830,568,929Shares redeemed . . . . . . . . . . . . . . . . . . . . . . . . . . . . . . . . . . . . . . . . . . . . . . . . . . . . . . . . . . . . . . . . . . . . . . . . . . . . . . (37,300,000) (1,288,144,556) (9,350,000) (339,939,142)
Net increase. . . . . . . . . . . . . . . . . . . . . . . . . . . . . . . . . . . . . . . . . . . . . . . . . . . . . . . . . . . . . . . . . . . . . . . . . . . . . . . . . 13,800,000 $ 818,001,540 41,600,000 $1,490,629,787
MSCI ChileShares sold . . . . . . . . . . . . . . . . . . . . . . . . . . . . . . . . . . . . . . . . . . . . . . . . . . . . . . . . . . . . . . . . . . . . . . . . . . . . . . . . . . . . 4,200,000 $ 204,165,240 5,400,000 $ 222,913,747Shares redeemed . . . . . . . . . . . . . . . . . . . . . . . . . . . . . . . . . . . . . . . . . . . . . . . . . . . . . . . . . . . . . . . . . . . . . . . . . . . . . . (4,950,000) (251,559,714) (4,550,000) (190,929,443)
Net increase (decrease). . . . . . . . . . . . . . . . . . . . . . . . . . . . . . . . . . . . . . . . . . . . . . . . . . . . . . . . . . . . . . . . . . . . . . (750,000) $ (47,394,474) 850,000 $ 31,984,304
Notes to Financial Statements (continued)
70 2 0 1 8 I S H A R E S A N N U A L R E P O R T T O S H A R E H O L D E R S
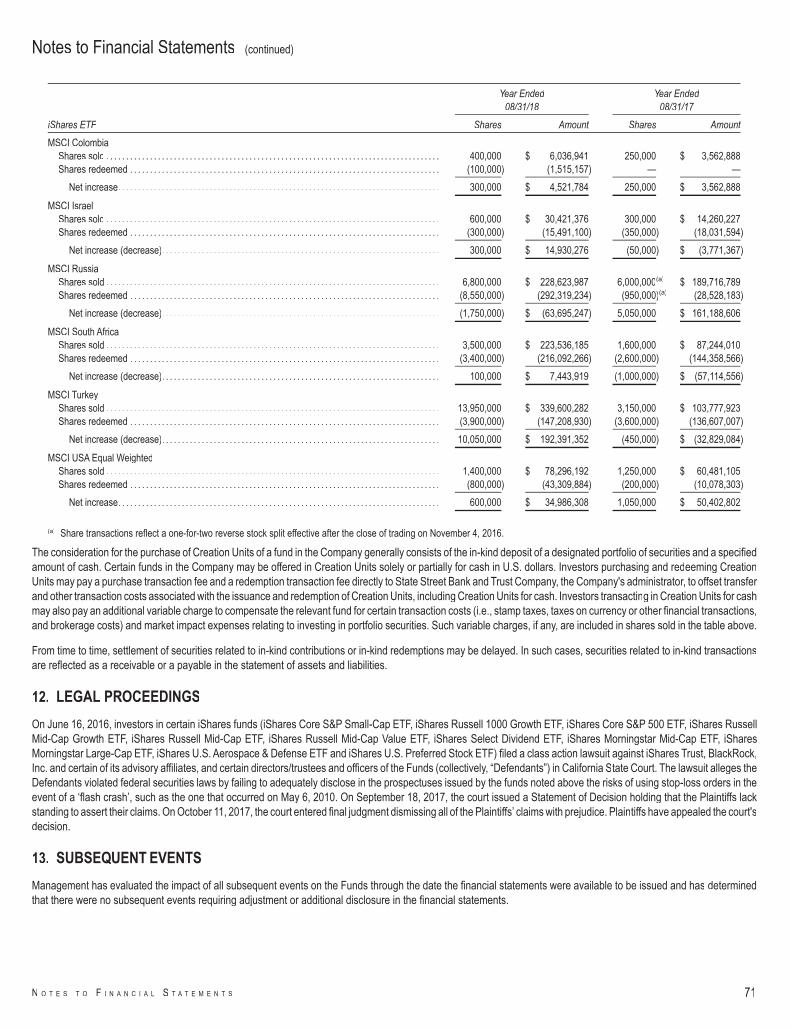
Year Ended08/31/18
Year Ended08/31/17
iShares ETF Shares Amount Shares Amount
MSCI ColombiaShares sold . . . . . . . . . . . . . . . . . . . . . . . . . . . . . . . . . . . . . . . . . . . . . . . . . . . . . . . . . . . . . . . . . . . . . . . . . . . . . . . . . . . . 400,000 $ 6,036,941 250,000 $ 3,562,888Shares redeemed . . . . . . . . . . . . . . . . . . . . . . . . . . . . . . . . . . . . . . . . . . . . . . . . . . . . . . . . . . . . . . . . . . . . . . . . . . . . . . (100,000) (1,515,157) — —
Net increase. . . . . . . . . . . . . . . . . . . . . . . . . . . . . . . . . . . . . . . . . . . . . . . . . . . . . . . . . . . . . . . . . . . . . . . . . . . . . . . . . 300,000 $ 4,521,784 250,000 $ 3,562,888
MSCI IsraelShares sold . . . . . . . . . . . . . . . . . . . . . . . . . . . . . . . . . . . . . . . . . . . . . . . . . . . . . . . . . . . . . . . . . . . . . . . . . . . . . . . . . . . . 600,000 $ 30,421,376 300,000 $ 14,260,227Shares redeemed . . . . . . . . . . . . . . . . . . . . . . . . . . . . . . . . . . . . . . . . . . . . . . . . . . . . . . . . . . . . . . . . . . . . . . . . . . . . . . (300,000) (15,491,100) (350,000) (18,031,594)
Net increase (decrease). . . . . . . . . . . . . . . . . . . . . . . . . . . . . . . . . . . . . . . . . . . . . . . . . . . . . . . . . . . . . . . . . . . . . . 300,000 $ 14,930,276 (50,000) $ (3,771,367)
MSCI RussiaShares sold . . . . . . . . . . . . . . . . . . . . . . . . . . . . . . . . . . . . . . . . . . . . . . . . . . . . . . . . . . . . . . . . . . . . . . . . . . . . . . . . . . . . 6,800,000 $ 228,623,987 6,000,000(a) $ 189,716,789Shares redeemed . . . . . . . . . . . . . . . . . . . . . . . . . . . . . . . . . . . . . . . . . . . . . . . . . . . . . . . . . . . . . . . . . . . . . . . . . . . . . . (8,550,000) (292,319,234) (950,000)(a) (28,528,183)
Net increase (decrease). . . . . . . . . . . . . . . . . . . . . . . . . . . . . . . . . . . . . . . . . . . . . . . . . . . . . . . . . . . . . . . . . . . . . . (1,750,000) $ (63,695,247) 5,050,000 $ 161,188,606
MSCI South AfricaShares sold . . . . . . . . . . . . . . . . . . . . . . . . . . . . . . . . . . . . . . . . . . . . . . . . . . . . . . . . . . . . . . . . . . . . . . . . . . . . . . . . . . . . 3,500,000 $ 223,536,185 1,600,000 $ 87,244,010Shares redeemed . . . . . . . . . . . . . . . . . . . . . . . . . . . . . . . . . . . . . . . . . . . . . . . . . . . . . . . . . . . . . . . . . . . . . . . . . . . . . . (3,400,000) (216,092,266) (2,600,000) (144,358,566)
Net increase (decrease). . . . . . . . . . . . . . . . . . . . . . . . . . . . . . . . . . . . . . . . . . . . . . . . . . . . . . . . . . . . . . . . . . . . . . 100,000 $ 7,443,919 (1,000,000) $ (57,114,556)
MSCI TurkeyShares sold . . . . . . . . . . . . . . . . . . . . . . . . . . . . . . . . . . . . . . . . . . . . . . . . . . . . . . . . . . . . . . . . . . . . . . . . . . . . . . . . . . . . 13,950,000 $ 339,600,282 3,150,000 $ 103,777,923Shares redeemed . . . . . . . . . . . . . . . . . . . . . . . . . . . . . . . . . . . . . . . . . . . . . . . . . . . . . . . . . . . . . . . . . . . . . . . . . . . . . . (3,900,000) (147,208,930) (3,600,000) (136,607,007)
Net increase (decrease). . . . . . . . . . . . . . . . . . . . . . . . . . . . . . . . . . . . . . . . . . . . . . . . . . . . . . . . . . . . . . . . . . . . . . 10,050,000 $ 192,391,352 (450,000) $ (32,829,084)
MSCI USA Equal WeightedShares sold . . . . . . . . . . . . . . . . . . . . . . . . . . . . . . . . . . . . . . . . . . . . . . . . . . . . . . . . . . . . . . . . . . . . . . . . . . . . . . . . . . . . 1,400,000 $ 78,296,192 1,250,000 $ 60,481,105Shares redeemed . . . . . . . . . . . . . . . . . . . . . . . . . . . . . . . . . . . . . . . . . . . . . . . . . . . . . . . . . . . . . . . . . . . . . . . . . . . . . . (800,000) (43,309,884) (200,000) (10,078,303)
Net increase. . . . . . . . . . . . . . . . . . . . . . . . . . . . . . . . . . . . . . . . . . . . . . . . . . . . . . . . . . . . . . . . . . . . . . . . . . . . . . . . . 600,000 $ 34,986,308 1,050,000 $ 50,402,802
(a) Share transactions reflect a one-for-two reverse stock split effective after the close of trading on November 4, 2016.
The consideration for the purchase of Creation Units of a fund in the Company generally consists of the in-kind deposit of a designated portfolio of securities and a specifiedamount of cash. Certain funds in the Company may be offered in Creation Units solely or partially for cash in U.S. dollars. Investors purchasing and redeeming CreationUnits may pay a purchase transaction fee and a redemption transaction fee directly to State Street Bank and Trust Company, the Company's administrator, to offset transferand other transaction costs associated with the issuance and redemption of Creation Units, including Creation Units for cash. Investors transacting in Creation Units for cashmay also pay an additional variable charge to compensate the relevant fund for certain transaction costs (i.e., stamp taxes, taxes on currency or other financial transactions,and brokerage costs) and market impact expenses relating to investing in portfolio securities. Such variable charges, if any, are included in shares sold in the table above.
From time to time, settlement of securities related to in-kind contributions or in-kind redemptions may be delayed. In such cases, securities related to in-kind transactionsare reflected as a receivable or a payable in the statement of assets and liabilities.
12. LEGAL PROCEEDINGS
On June 16, 2016, investors in certain iShares funds (iShares Core S&P Small-Cap ETF, iShares Russell 1000 Growth ETF, iShares Core S&P 500 ETF, iShares RussellMid-Cap Growth ETF, iShares Russell Mid-Cap ETF, iShares Russell Mid-Cap Value ETF, iShares Select Dividend ETF, iShares Morningstar Mid-Cap ETF, iSharesMorningstar Large-Cap ETF, iShares U.S. Aerospace & Defense ETF and iShares U.S. Preferred Stock ETF) filed a class action lawsuit against iShares Trust, BlackRock,Inc. and certain of its advisory affiliates, and certain directors/trustees and officers of the Funds (collectively, “Defendants”) in California State Court. The lawsuit alleges theDefendants violated federal securities laws by failing to adequately disclose in the prospectuses issued by the funds noted above the risks of using stop-loss orders in theevent of a ‘flash crash’, such as the one that occurred on May 6, 2010. On September 18, 2017, the court issued a Statement of Decision holding that the Plaintiffs lackstanding to assert their claims. On October 11, 2017, the court entered final judgment dismissing all of the Plaintiffs’ claims with prejudice. Plaintiffs have appealed the court'sdecision.
13. SUBSEQUENT EVENTS
Management has evaluated the impact of all subsequent events on the Funds through the date the financial statements were available to be issued and has determinedthat there were no subsequent events requiring adjustment or additional disclosure in the financial statements.
Notes to Financial Statements (continued)
N O T E S T O F I N A N C I A L S T A T E M E N T S 71
To the Board of Directors of iShares, Inc. andShareholders of iShares MSCI Brazil ETF, iShares MSCI Chile ETF, iShares MSCI Colombia ETF,iShares MSCI Israel ETF, iShares MSCI Russia ETF, iShares MSCI South Africa ETF,iShares MSCI Turkey ETF and iShares MSCI USA Equal Weighted ETF
Opinions on the Financial Statements
We have audited the accompanying statements of assets and liabilities, including the schedules of investments, of iShares MSCI Brazil ETF, iShares MSCI Chile ETF,iShares MSCI Colombia ETF, iShares MSCI Israel ETF, iShares MSCI Russia ETF, iShares MSCI South Africa ETF, iShares MSCI Turkey ETF and iShares MSCI USAEqual Weighted ETF (eight of the funds constituting iShares, Inc., hereafter collectively referred to as the "Funds") as of August 31, 2018, the related statements ofoperations for the year ended August 31, 2018, the statements of changes in net assets for each of the two years in the period ended August 31, 2018, including the relatednotes, and the financial highlights for each of the five years in the period ended August 31, 2018 (collectively referred to as the “financial statements”). In our opinion, thefinancial statements present fairly, in all material respects, the financial position of each of the Funds as of August 31, 2018, the results of each of their operations for theyear then ended, the changes in each of their net assets for each of the two years in the period ended August 31, 2018 and each of the financial highlights for each of thefive years in the period ended August 31, 2018 in conformity with accounting principles generally accepted in the United States of America.
Basis for Opinions
These financial statements are the responsibility of the Funds' management. Our responsibility is to express an opinion on the Funds' financial statements based on ouraudits. We are a public accounting firm registered with the Public Company Accounting Oversight Board (United States) (“PCAOB”) and are required to be independent withrespect to the Funds in accordance with the U.S. federal securities laws and the applicable rules and regulations of the Securities and Exchange Commission and thePCAOB.
We conducted our audits of these financial statements in accordance with the standards of the PCAOB. Those standards require that we plan and perform the audit to obtainreasonable assurance about whether the financial statements are free of material misstatement, whether due to error or fraud.
Our audits included performing procedures to assess the risks of material misstatement of the financial statements, whether due to error or fraud, and performingprocedures that respond to those risks. Such procedures included examining, on a test basis, evidence regarding the amounts and disclosures in the financial statements.Our audits also included evaluating the accounting principles used and significant estimates made by management, as well as evaluating the overall presentation of thefinancial statements. Our procedures included confirmation of securities owned as of August 31, 2018 by correspondence with the custodian, transfer agent and brokers;when replies were not received from brokers, we performed other auditing procedures. We believe that our audits provide a reasonable basis for our opinions.
PricewaterhouseCoopers LLPSan Francisco, CaliforniaOctober 22, 2018
We have served as the auditor of one or more BlackRock investment companies since 2000.
Report of Independent Registered Public Accounting Firm
72 2 0 1 8 I S H A R E S A N N U A L R E P O R T T O S H A R E H O L D E R S
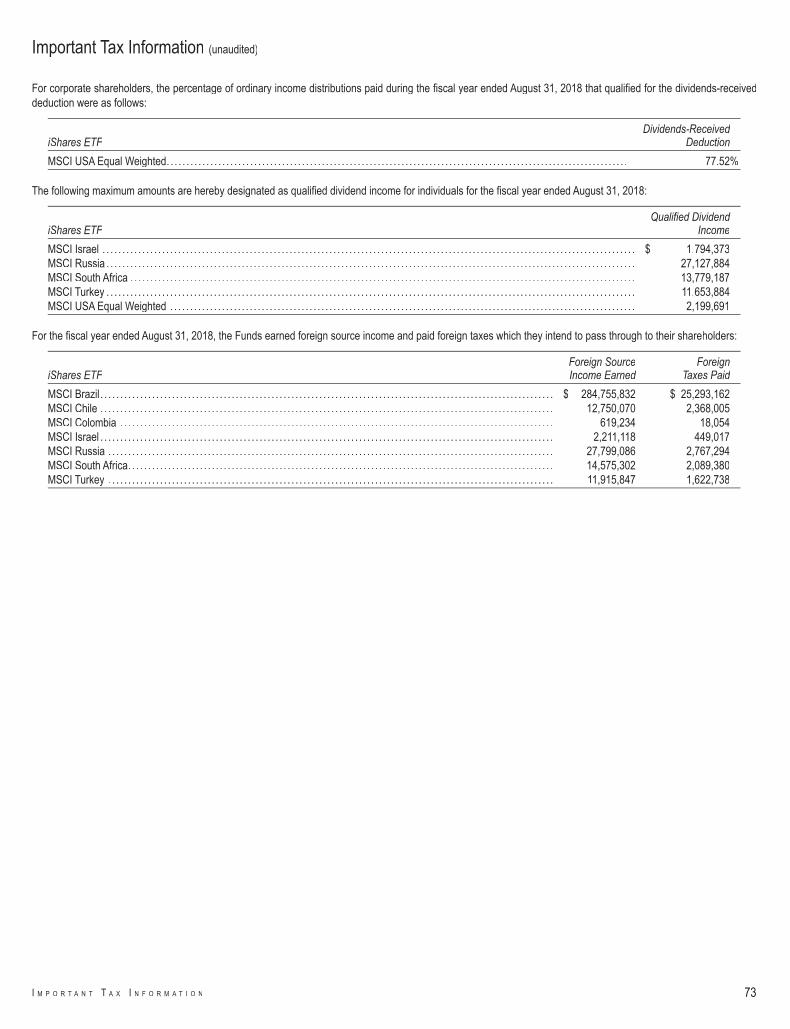
For corporate shareholders, the percentage of ordinary income distributions paid during the fiscal year ended August 31, 2018 that qualified for the dividends-receiveddeduction were as follows:
iShares ETFDividends-Received
Deduction
MSCI USA Equal Weighted. . . . . . . . . . . . . . . . . . . . . . . . . . . . . . . . . . . . . . . . . . . . . . . . . . . . . . . . . . . . . . . . . . . . . . . . . . . . . . . . . . . . . . . . . . . . . . . . . . . . . . . . . . . . . . . . . . . . 77.52%
The following maximum amounts are hereby designated as qualified dividend income for individuals for the fiscal year ended August 31, 2018:
iShares ETFQualified Dividend
Income
MSCI Israel . . . . . . . . . . . . . . . . . . . . . . . . . . . . . . . . . . . . . . . . . . . . . . . . . . . . . . . . . . . . . . . . . . . . . . . . . . . . . . . . . . . . . . . . . . . . . . . . . . . . . . . . . . . . . . . . . . . . . . . . . . . . . . . . . . . . . . $ 1,794,373MSCI Russia . . . . . . . . . . . . . . . . . . . . . . . . . . . . . . . . . . . . . . . . . . . . . . . . . . . . . . . . . . . . . . . . . . . . . . . . . . . . . . . . . . . . . . . . . . . . . . . . . . . . . . . . . . . . . . . . . . . . . . . . . . . . . . . . . . . . . 27,127,884MSCI South Africa . . . . . . . . . . . . . . . . . . . . . . . . . . . . . . . . . . . . . . . . . . . . . . . . . . . . . . . . . . . . . . . . . . . . . . . . . . . . . . . . . . . . . . . . . . . . . . . . . . . . . . . . . . . . . . . . . . . . . . . . . . . . . . . 13,779,187MSCI Turkey . . . . . . . . . . . . . . . . . . . . . . . . . . . . . . . . . . . . . . . . . . . . . . . . . . . . . . . . . . . . . . . . . . . . . . . . . . . . . . . . . . . . . . . . . . . . . . . . . . . . . . . . . . . . . . . . . . . . . . . . . . . . . . . . . . . . . 11,653,884MSCI USA Equal Weighted . . . . . . . . . . . . . . . . . . . . . . . . . . . . . . . . . . . . . . . . . . . . . . . . . . . . . . . . . . . . . . . . . . . . . . . . . . . . . . . . . . . . . . . . . . . . . . . . . . . . . . . . . . . . . . . . . . . . . 2,199,691
For the fiscal year ended August 31, 2018, the Funds earned foreign source income and paid foreign taxes which they intend to pass through to their shareholders:
iShares ETFForeign SourceIncome Earned
ForeignTaxes Paid
MSCI Brazil . . . . . . . . . . . . . . . . . . . . . . . . . . . . . . . . . . . . . . . . . . . . . . . . . . . . . . . . . . . . . . . . . . . . . . . . . . . . . . . . . . . . . . . . . . . . . . . . . . . . . . . . . . . . . . . . . . $ 284,755,832 $ 25,293,162MSCI Chile . . . . . . . . . . . . . . . . . . . . . . . . . . . . . . . . . . . . . . . . . . . . . . . . . . . . . . . . . . . . . . . . . . . . . . . . . . . . . . . . . . . . . . . . . . . . . . . . . . . . . . . . . . . . . . . . . . 12,750,070 2,368,005MSCI Colombia . . . . . . . . . . . . . . . . . . . . . . . . . . . . . . . . . . . . . . . . . . . . . . . . . . . . . . . . . . . . . . . . . . . . . . . . . . . . . . . . . . . . . . . . . . . . . . . . . . . . . . . . . . . . . 619,234 18,054MSCI Israel . . . . . . . . . . . . . . . . . . . . . . . . . . . . . . . . . . . . . . . . . . . . . . . . . . . . . . . . . . . . . . . . . . . . . . . . . . . . . . . . . . . . . . . . . . . . . . . . . . . . . . . . . . . . . . . . . . 2,211,118 449,017MSCI Russia . . . . . . . . . . . . . . . . . . . . . . . . . . . . . . . . . . . . . . . . . . . . . . . . . . . . . . . . . . . . . . . . . . . . . . . . . . . . . . . . . . . . . . . . . . . . . . . . . . . . . . . . . . . . . . . . 27,799,086 2,767,294MSCI South Africa. . . . . . . . . . . . . . . . . . . . . . . . . . . . . . . . . . . . . . . . . . . . . . . . . . . . . . . . . . . . . . . . . . . . . . . . . . . . . . . . . . . . . . . . . . . . . . . . . . . . . . . . . . . 14,575,302 2,089,380MSCI Turkey . . . . . . . . . . . . . . . . . . . . . . . . . . . . . . . . . . . . . . . . . . . . . . . . . . . . . . . . . . . . . . . . . . . . . . . . . . . . . . . . . . . . . . . . . . . . . . . . . . . . . . . . . . . . . . . . 11,915,847 1,622,738
Important Tax Information (unaudited)
I M P O R T A N T T A X I N F O R M A T I O N 73
I. iShares MSCI Brazil ETF and iShares MSCI Chile ETF
Under Section 15(c) of the Investment Company Act of 1940 (the “1940 Act”), the Company's Board of Directors (the “Board”), including a majority of Directors who are not“interested persons” of the Company (as that term is defined in the 1940 Act) (the “Independent Directors”), is required annually to consider and approve the InvestmentAdvisory Contract between the Company and BFA (the “Advisory Contract”) on behalf of the Funds. The Independent Directors requested, and BFA provided, suchinformation as the Independent Directors, with advice from independent counsel, deemed reasonably necessary to evaluate the Advisory Contract. At a meeting on May 11,2018, a committee composed of all of the Independent Directors (the “15(c) Committee”), with independent counsel, met with management and reviewed and discussedinformation provided in response to initial requests of the 15(c) Committee and/or their independent counsel, and requested certain additional information, whichmanagement agreed to provide. At these meetings, the 15(c) Committee reviewed and discussed information provided in response to the 15(c) Committee’s initial requests,and requested certain additional information, which management agreed to provide. At a meeting held on May 24, 2018, management presented additional information tothe Board relating to the continuance of the Advisory Contract, including information requested by the 15(c) Committee during its initial meeting. The Board, including theIndependent Directors, reviewed and discussed such information at length. The Independent Directors requested from management certain additional information, whichmanagement agreed to provide. At a meeting held on June 12-14, 2018, the Board, including the Independent Directors, reviewed the additional information provided bymanagement in response to these requests. After extensive discussions, the Board, including all of the Independent Directors, approved the continuance of the AdvisoryContract for the Funds, based on a review of qualitative and quantitative information provided by BFA. The Board noted its satisfaction with the extent and quality ofinformation provided and its frequent interactions with management, as well as the detailed responses and other information provided by BFA. The Independent Directorswere advised by their independent counsel throughout the process, including about the legal standards applicable to their review. In approving the Advisory Contract for theFunds, the Board, including the Independent Directors, considered various factors, including: (i) the expenses and performance of each Fund; (ii) the nature, extent andquality of the services provided by BFA; (iii) the costs of services provided to each Fund and profits realized by BFA and its affiliates; (iv) economies of scale; (v) the feesand services provided for other comparable funds/accounts managed by BFA and its affiliates; and (vi) other benefits to BFA and/or its affiliates. The material factors, noone of which was controlling, and conclusions that formed the basis for the Board, including the Independent Directors, to approve the Advisory Contract are discussedbelow.
Expenses and Performance of the Funds - The Board reviewed statistical information prepared by Broadridge Financial Solutions Inc. (“Broadridge”), an independentprovider of investment company data, regarding the expense ratio components, including gross and net total expenses, fees and expenses of another fund in which eachFund invests (if applicable), and waivers/reimbursements (if applicable) of each Fund in comparison with the same information for other ETFs (including, where applicable,funds sponsored by an “at cost” service provider), objectively selected by Broadridge as comprising such Fund’s applicable peer group pursuant to Broadridge’s proprietaryETF methodology (the “Peer Group”). The Board was provided with a detailed description of the proprietary ETF methodology used by Broadridge to determine theapplicable Peer Groups. The Board further noted that due to the limitations in providing comparable funds in the various Peer Groups, the statistical information providedin Broadridge’s report may or may not provide meaningful direct comparisons to the Funds in all instances.
The Board also noted that the investment advisory fee rates and overall expenses (net of waivers and reimbursements) for the Funds were within range of the median ofthe investment advisory fee rates and overall expenses (net of waivers and reimbursements) of the funds in their respective Peer Group, excluding iShares funds.
In addition, to the extent that any of the comparison funds included in the Peer Group, excluding iShares funds, track the same index as any particular Fund, Broadridgealso provided, and the Board reviewed, a comparison of such Fund’s performance for the one-, three-, five-, ten-year, and since inception periods, as applicable, and forthe quarter ended December 31, 2017, to that of relevant comparison fund(s) for the same periods.
The Board noted that each Fund seeks to track its specified underlying index and that, during the year, the Board received periodic reports on each Fund’s short- andlonger-term performance in comparison with its underlying index. Such periodic comparative performance information, including additional detailed information asrequested by the Board, was also considered. The Board noted that each Fund generally performed in line with its underlying index over the relevant periods.
Based on this review, the other factors considered at the meeting, and their general knowledge of ETF pricing, the Board concluded that the investment advisory fee rateand expense level and the historical performance of each Fund supported the Board’s approval of the continuance of the Advisory Contract for the coming year.
Nature, Extent and Quality of Services Provided by BFA - Based on management’s representations, including information about recent and proposed enhancementsto the iShares business, including with respect to capital markets support and analysis, technology, portfolio management, product design and quality, compliance and riskmanagement, global public policy and other services, the Board expected that there would be no diminution in the scope of services required of or provided by BFA underthe Advisory Contract for the coming year as compared to the scope of services provided by BFA during prior years. In reviewing the scope of these services, the Boardconsidered BFA’s investment philosophy and experience, noting that BFA and its affiliates have committed significant resources over time, including during the past year,to support the iShares funds and their shareholders. The Board also considered BFA’s compliance program and its compliance record with respect to the Funds. In thatregard, the Board noted that BFA reports to the Board about portfolio management and compliance matters on a periodic basis in connection with regularly scheduledmeetings of the Board, and on other occasions as necessary and appropriate, and has provided information and made relevant officers and other employees of BFA (andits affiliates) available as needed to provide further assistance with these matters. The Board also reviewed the background and experience of the persons responsible forthe day-to-day management of the Funds, as well as the resources available to them in managing the Funds. In addition to the above considerations, the Board reviewedand considered detailed presentations regarding BFA’s investment performance, investment and risk management processes and strategies provided at the June 12-14,2018 meeting and throughout the year, and matters related to BFA’s portfolio compliance policies and procedures.
Based on review of this information, and the performance information discussed above, the Board concluded that the nature, extent and quality of services provided to theFunds under the Advisory Contract supported the Board’s approval of the continuance of the Advisory Contract for the coming year.
Board Review and Approval of Investment Advisory Contract
74 2 0 1 8 I S H A R E S A N N U A L R E P O R T T O S H A R E H O L D E R S
Costs of Services Provided to Fund and Profits Realized by BFA and its Affiliates - The Board reviewed information about the profitability to BlackRock in managingthe Funds, based on the fees payable to BFAand its affiliates (including fees under theAdvisory Contract), and other sources of revenue and expense to BFAand its affiliatesfrom the Funds’ operations for the last calendar year. The Board reviewed BlackRock’s profitability methodology for the iShares funds, noting that the 15(c) Committee andthe Board had focused on the methodology and profitability presentation during their meetings. The Board further noted that it considered the supplemental information the15(c) Committee requested, which BlackRock provided, regarding the methodology. The Board discussed the sources of direct and ancillary revenue with management,including the revenues to BTC, a BlackRock affiliate, from securities lending by the Funds. The Board also discussed BFA’s profit margin as reflected in the Funds’profitability analysis and reviewed information regarding potential economies of scale (as discussed below).
Based on this review, the Board concluded that the profits realized by BFA and its affiliates under the Advisory Contract and from other relationships between the Funds andBFA and/or its affiliates, if any, were within a reasonable range in light of the factors and other information considered.
Economies of Scale - The Board reviewed information regarding potential economies of scale or other efficiencies that may result from increases in the Funds’ assets,noting that the issue of economies of scale had been focused on by the 15(c) Committee and the Board during their meetings and addressed by management. The 15(c)Committee and the Board received information regarding BlackRock’s historical profitability, including BFA’s and its affiliates’ costs in providing services. The costinformation distinguished, among other things, between fixed and variable costs, and showed how the level of fixed and variable costs, as well as the nature of such costs,may impact the existence or size of scale benefits. The 15(c) Committee and the Board reviewed information provided by BFA regarding the sharing of scale benefits withthe iShares funds through various means, including, as applicable, through relatively low fee rates established at inception, breakpoints, waivers, or other fee reductions,as well as through additional investment in the iShares business and the provision of improved or additional infrastructure and services to the iShares funds and theirshareholders. The Board noted that the Advisory Contract for the Funds already provided for breakpoints in the Funds’ investment advisory fee rate as the assets of theFunds, on an aggregated basis with the assets of certain other iShares funds, increase. The Board noted that it would continue to monitor the sharing of economies of scaleto determine the appropriateness of adding new or revised breakpoints in the future.
Based on this review of the sharing of scale benefits, as well as the other factors considered at the meeting, the Board concluded that the information concerning the sharingof scale benefits supported the Board’s approval of the continuance of the Advisory Contract for the coming year.
Fees and Services Provided for Other Comparable Funds/Accounts Managed by BFA and its Affiliates - The Board received and considered information regardingthe investment advisory/management fee rates for other funds/accounts in the U.S. for which BFA (or its affiliates) provides investment advisory/man management services,including open-end funds registered under the 1940 Act (including sub-advised funds), collective trust funds, and institutional separate accounts (collectively, the “OtherAccounts”), and acknowledged BFA’s assertion that the iShares funds are fundamentally different investment vehicles from the Other Accounts. The Board noted that BFAand its affiliates do not manage OtherAccounts with substantially the same investment objectives and strategies as the Funds and that track the same indexes as the Funds.The Board further noted that BFA provided the Board with detailed information regarding how the Other Accounts generally differ from the Funds, including in terms of thedifferent and generally more extensive services provided to the Funds, as well as other significant differences. In that regard, the Board considered that the pricing ofservices to institutional clients is typically based on a number of factors beyond the nature and extent of the specific services to be provided and often depends on the overallrelationship between the client and its affiliates and the adviser and its affiliates. In addition, the Board considered the relative complexity and inherent risks and challengesof managing and providing other services to the Funds, as publicly traded ETFs, as compared to the Other Accounts, particularly those that are institutional clients, in lightof differing regulatory requirements and client-imposed mandates. The Board also acknowledged management’s assertion that, for certain iShares funds, and for clientsegmentation purposes, BlackRock has launched an iShares fund that may provide a similar investment exposure at a lower investment advisory fee rate. The Board alsoconsidered the “all-inclusive” nature of the Funds’ advisory fee structure, and the Funds’ expenses borne by BFA under this arrangement. The Board noted that theinvestment advisory fee rates under the Advisory Contract for the Funds was generally higher than the investment advisory/management fee rates for certain of the OtherAccounts (particularly institutional clients) and concluded that the differences appeared to be consistent with the factors discussed.
Other Benefits to BFA and/or its Affiliates - The Board reviewed the “fallout” benefits or ancillary revenue received by BFA and/or its affiliates in connection with theservices provided to the Funds by BFA, such as payment of revenue to BTC, the Funds’ securities lending agent, for loaning portfolio securities (which was included in theprofit margins reviewed by the Board pursuant to BFA’s profitability methodology), and payment of advisory fees and/or administration fees to BFA (or its affiliates) inconnection with any investments by the Funds in other funds for which BFA(or its affiliates) provides investment advisory services and/or administration services. The Boardalso noted the revenue received by BFA and/or its affiliates pursuant to an agreement that permits a service provider to use certain portions of BlackRock’s technologyplatform to service accounts managed by BFA and/or its affiliates, including the iShares funds. The Board noted that BFA generally does not use soft dollars or consider thevalue of research or other services that may be provided to BFA (including its affiliates) in selecting brokers for portfolio transactions for the Funds. The Board further notedthat any portfolio transactions on behalf of the Funds placed through a BFA affiliate or purchased from an underwriting syndicate in which a BFA affiliate participates(including associated commissions) are reported to the Board pursuant to Rule 17e-1 or Rule 10f-3, as applicable, under the 1940 Act. The Board concluded that any suchancillary benefits would not be disadvantageous to the Funds and thus would not alter the Board’s conclusion with respect to the appropriateness of approving thecontinuance of the Advisory Contract for the coming year.
Conclusion - Based on a review of the factors described above, as well as such other factors as deemed appropriate by the Board, the Board, including all of theIndependent Directors, determined that the Funds’ investment advisory fee rates under the Advisory Contract do not constitute fees that are so disproportionately large asto bear no reasonable relationship to the services rendered and that could not have been the product of arm’s-length bargaining, and concluded to approve the continuanceof the Advisory Contract for the coming year.
II. iShares MSCI Colombia ETF
Under Section 15(c) of the Investment Company Act of 1940 (the “1940 Act”), the Company's Board of Directors (the “Board”), including a majority of Directors who are not“interested persons” of the Company (as that term is defined in the 1940 Act) (the “Independent Directors”), is required annually to consider and approve the Investment
Board Review and Approval of Investment Advisory Contract (continued)
B O A R D R E V I E W A N D A P P R O V A L O F I N V E S T M E N T A D V I S O R Y C O N T R A C T 75
Advisory Contract between the Company and BFA (the “Advisory Contract”) on behalf of the Fund. The Independent Directors requested, and BFA provided, suchinformation as the Independent Directors, with advice from independent counsel, deemed reasonably necessary to evaluate the Advisory Contract. At a meeting on May 11,2018, a committee composed of all of the Independent Directors (the “15(c) Committee”), with independent counsel, met with management and reviewed and discussedinformation provided in response to initial requests of the 15(c) Committee and/or their independent counsel, and requested certain additional information, whichmanagement agreed to provide. At these meetings, the 15(c) Committee reviewed and discussed information provided in response to the 15(c) Committee’s initial requests,and requested certain additional information, which management agreed to provide. At a meeting held on May 24, 2018, management presented additional information tothe Board relating to the continuance of the Advisory Contract, including information requested by the 15(c) Committee during its initial meeting. The Board, including theIndependent Directors, reviewed and discussed such information at length. The Independent Directors requested from management certain additional information, whichmanagement agreed to provide. At a meeting held on June 12-14, 2018, the Board, including the Independent Directors, reviewed the additional information provided bymanagement in response to these requests. After extensive discussions, the Board, including all of the Independent Directors, approved the continuance of the AdvisoryContract for the Fund, based on a review of qualitative and quantitative information provided by BFA. The Board noted its satisfaction with the extent and quality ofinformation provided and its frequent interactions with management, as well as the detailed responses and other information provided by BFA. The Independent Directorswere advised by their independent counsel throughout the process, including about the legal standards applicable to their review. In approving the Advisory Contract for theFund, the Board, including the Independent Directors, considered various factors, including: (i) the expenses and performance of the Fund; (ii) the nature, extent and qualityof the services provided by BFA; (iii) the costs of services provided to the Fund and profits realized by BFA and its affiliates; (iv) economies of scale; (v) the fees and servicesprovided for other comparable funds/accounts managed by BFA and its affiliates; and (vi) other benefits to BFA and/or its affiliates. The material factors, no one of whichwas controlling, and conclusions that formed the basis for the Board, including the Independent Directors, to approve the Advisory Contract are discussed below.
Expenses and Performance of the Fund - The Board reviewed statistical information prepared by Broadridge Financial Solutions Inc. (“Broadridge”), an independentprovider of investment company data, regarding the expense ratio components, including gross and net total expenses, fees and expenses of another fund in which theFund invests (if applicable), and waivers/reimbursements (if applicable) of the Fund in comparison with the same information for other ETFs (including, where applicable,funds sponsored by an “at cost” service provider), objectively selected by Broadridge as comprising the Fund’s applicable peer group pursuant to Broadridge’s proprietaryETF methodology (the “Peer Group”). The Board was provided with a detailed description of the proprietary ETF methodology used by Broadridge to determine the Fund’sPeer Group. The Board further noted that due to the limitations in providing comparable funds in the Peer Group, the statistical information provided in Broadridge’s reportmay or may not provide meaningful direct comparisons to the Fund in all instances.
The Board also noted that the investment advisory fee rate and overall expenses (net of waivers and reimbursements) for the Fund were within range of the median of theinvestment advisory fee rates and overall expenses (net of waivers and reimbursements) of the funds in its Peer Group, excluding iShares funds.
In addition, to the extent that any of the comparison funds included in the Peer Group, excluding iShares funds, track the same index as the Fund, Broadridge also provided,and the Board reviewed, a comparison of the Fund’s performance for the one-, three-, five-, ten-year, and since inception periods, as applicable, and for the quarter endedDecember 31, 2017, to that of relevant comparison fund(s) for the same periods.
The Board noted that the Fund seeks to track its specified underlying index and that, during the year, the Board received periodic reports on the Fund’s short- andlonger-term performance in comparison with its underlying index. Such periodic comparative performance information, including additional detailed information asrequested by the Board, was also considered. The Board noted that the Fund generally performed in line with its underlying index over the relevant periods.
Based on this review, the other factors considered at the meeting, and their general knowledge of ETF pricing, the Board concluded that the investment advisory fee rateand expense level and the historical performance of the Fund supported the Board’s approval of the continuance of the Advisory Contract for the coming year.
Nature, Extent and Quality of Services Provided by BFA - Based on management’s representations, including information about recent and proposed enhancementsto the iShares business, including with respect to capital markets support and analysis, technology, portfolio management, product design and quality, compliance and riskmanagement, global public policy and other services, the Board expected that there would be no diminution in the scope of services required of or provided by BFA underthe Advisory Contract for the coming year as compared to the scope of services provided by BFA during prior years. In reviewing the scope of these services, the Boardconsidered BFA’s investment philosophy and experience, noting that BFA and its affiliates have committed significant resources over time, including during the past year,to support the iShares funds and their shareholders. The Board also considered BFA’s compliance program and its compliance record with respect to the Fund. In thatregard, the Board noted that BFA reports to the Board about portfolio management and compliance matters on a periodic basis in connection with regularly scheduledmeetings of the Board, and on other occasions as necessary and appropriate, and has provided information and made relevant officers and other employees of BFA (andits affiliates) available as needed to provide further assistance with these matters. The Board also reviewed the background and experience of the persons responsible forthe day-to-day management of the Fund, as well as the resources available to them in managing the Fund. In addition to the above considerations, the Board reviewed andconsidered detailed presentations regarding BFA’s investment performance, investment and risk management processes and strategies provided at the June 12-14, 2018meeting and throughout the year, and matters related to BFA’s portfolio compliance policies and procedures.
Based on review of this information, and the performance information discussed above, the Board concluded that the nature, extent and quality of services provided to theFund under the Advisory Contract supported the Board’s approval of the continuance of the Advisory Contract for the coming year.
Costs of Services Provided to Fund and Profits Realized by BFA and its Affiliates - The Board reviewed information about the profitability to BlackRock in managingthe Fund, based on the fees payable to BFA and its affiliates (including fees under the Advisory Contract), and other sources of revenue and expense to BFA and its affiliatesfrom the Fund’s operations for the last calendar year. The Board reviewed BlackRock’s profitability methodology for the iShares funds, noting that the 15(c) Committee andthe Board had focused on the methodology and profitability presentation during their meetings. The Board further noted that it considered the supplemental information the15(c) Committee requested, which BlackRock provided, regarding the methodology. The Board discussed the sources of direct and ancillary revenue with management,
Board Review and Approval of Investment Advisory Contract (continued)
76 2 0 1 8 I S H A R E S A N N U A L R E P O R T T O S H A R E H O L D E R S
including the revenues to BTC, a BlackRock affiliate, from securities lending by the Fund. The Board also discussed BFA’s profit margin as reflected in the Fund’s profitabilityanalysis and reviewed information regarding potential economies of scale (as discussed below).
Based on this review, the Board concluded that the profits realized by BFA and its affiliates under the Advisory Contract and from other relationships between the Fund andBFA and/or its affiliates, if any, were within a reasonable range in light of the factors and other information considered.
Economies of Scale - The Board reviewed information regarding potential economies of scale or other efficiencies that may result from increases in the Fund’s assets,noting that the issue of economies of scale had been focused on by the 15(c) Committee and the Board during their meetings and addressed by management. The 15(c)Committee and the Board received information regarding BlackRock’s historical profitability, including BFA’s and its affiliates’ costs in providing services. The costinformation distinguished, among other things, between fixed and variable costs, and showed how the level of fixed and variable costs, as well as the nature of such costs,may impact the existence or size of scale benefits. The 15(c) Committee and the Board reviewed information provided by BFA regarding the sharing of scale benefits withthe iShares funds through various means, including, as applicable, through relatively low fee rates established at inception, breakpoints, waivers, or other fee reductions,as well as through additional investment in the iShares business and the provision of improved or additional infrastructure and services to the iShares funds and theirshareholders. The Board noted that the Advisory Contract for the Fund did not provide for breakpoints in the Fund’s investment advisory fee rate as the assets of the Fundincrease. However, the Board noted that a breakpoint structure for the Fund may be appropriate should material economies of scale exist in the future that are not otherwiseshared, and that it would continue to monitor the sharing of economies of scale to determine the appropriateness of adding breakpoints in the future.
Based on this review of the sharing of scale benefits, as well as the other factors considered at the meeting, the Board concluded that the information concerning the sharingof scale benefits supported the Board’s approval of the continuance of the Advisory Contract for the coming year.
Fees and Services Provided for Other Comparable Funds/Accounts Managed by BFA and its Affiliates - The Board received and considered information regardingthe investment advisory/management fee rates for other funds/accounts in the U.S. for which BFA (or its affiliates) provides investment advisory/management services,including open-end funds registered under the 1940 Act (including sub-advised funds), collective trust funds, and institutional separate accounts (collectively, the “OtherAccounts”), and acknowledged BFA’s assertion that the iShares funds are fundamentally different investment vehicles from the Other Accounts. The Board noted that BFAand its affiliates do not manage Other Accounts with substantially the same investment objective and strategy as the Fund and that track the same index as the Fund. TheBoard further noted that BFA provided the Board with detailed information regarding how the Other Accounts generally differ from the Fund, including in terms of the differentand generally more extensive services provided to the Fund, as well as other significant differences. In that regard, the Board considered that the pricing of services toinstitutional clients is typically based on a number of factors beyond the nature and extent of the specific services to be provided and often depends on the overallrelationship between the client and its affiliates and the adviser and its affiliates. In addition, the Board considered the relative complexity and inherent risks and challengesof managing and providing other services to the Fund, as a publicly traded ETF, as compared to the Other Accounts, particularly those that are institutional clients, in lightof differing regulatory requirements and client-imposed mandates. The Board also acknowledged management’s assertion that, for certain iShares funds, and for clientsegmentation purposes, BlackRock has launched an iShares fund that may provide a similar investment exposure at a lower investment advisory fee rate. The Board alsoconsidered the “all-inclusive” nature of the Fund’s advisory fee structure, and the Fund’s expenses borne by BFA under this arrangement. The Board noted that theinvestment advisory fee rate under the Advisory Contract for the Fund was generally higher than the investment advisory/management fee rates for certain of the OtherAccounts (particularly institutional clients) and concluded that the differences appeared to be consistent with the factors discussed.
Other Benefits to BFA and/or its Affiliates - The Board reviewed the “fallout” benefits or ancillary revenue received by BFA and/or its affiliates in connection with theservices provided to the Fund by BFA, such as payment of revenue to BTC, the Fund’s securities lending agent, for loaning portfolio securities (which was included in theprofit margins reviewed by the Board pursuant to BFA’s profitability methodology), and payment of advisory fees and/or administration fees to BFA (or its affiliates) inconnection with any investments by the Fund in other funds for which BFA (or its affiliates) provides investment advisory services and/or administration services. The Boardalso noted the revenue received by BFA and/or its affiliates pursuant to an agreement that permits a service provider to use certain portions of BlackRock’s technologyplatform to service accounts managed by BFA and/or its affiliates, including the iShares funds. The Board noted that BFA generally does not use soft dollars or consider thevalue of research or other services that may be provided to BFA (including its affiliates) in selecting brokers for portfolio transactions for the Fund. The Board further notedthat any portfolio transactions on behalf of the Fund placed through a BFAaffiliate or purchased from an underwriting syndicate in which a BFAaffiliate participates (includingassociated commissions) are reported to the Board pursuant to Rule 17e-1 or Rule 10f-3, as applicable, under the 1940 Act. The Board concluded that any such ancillarybenefits would not be disadvantageous to the Fund and thus would not alter the Board’s conclusion with respect to the appropriateness of approving the continuance of theAdvisory Contract for the coming year.
Conclusion - Based on a review of the factors described above, as well as such other factors as deemed appropriate by the Board, the Board, including all of theIndependent Directors, determined that the Fund’s investment advisory fee rate under the Advisory Contract does not constitute a fee that is so disproportionately large asto bear no reasonable relationship to the services rendered and that could not have been the product of arm’s-length bargaining, and concluded to approve the continuanceof the Advisory Contract for the coming year.
III. iShares MSCI Israel ETF
Under Section 15(c) of the Investment Company Act of 1940 (the “1940 Act”), the Company's Board of Directors (the “Board”), including a majority of Directors who are not“interested persons” of the Company (as that term is defined in the 1940 Act) (the “Independent Directors”), is required annually to consider and approve the InvestmentAdvisory Contract between the Company and BFA (the “Advisory Contract”) on behalf of the Fund. The Independent Directors requested, and BFA provided, suchinformation as the Independent Directors, with advice from independent counsel, deemed reasonably necessary to evaluate the Advisory Contract. At a meeting on May 11,2018, a committee composed of all of the Independent Directors (the “15(c) Committee”), with independent counsel, met with management and reviewed and discussedinformation provided in response to initial requests of the 15(c) Committee and/or their independent counsel, and requested certain additional information, whichmanagement agreed to provide. At these meetings, the 15(c) Committee reviewed and discussed information provided in response to the 15(c) Committee’s initial requests,
Board Review and Approval of Investment Advisory Contract (continued)
B O A R D R E V I E W A N D A P P R O V A L O F I N V E S T M E N T A D V I S O R Y C O N T R A C T 77
and requested certain additional information, which management agreed to provide. At a meeting held on May 24, 2018, management presented additional information tothe Board relating to the continuance of the Advisory Contract, including information requested by the 15(c) Committee during its initial meeting. The Board, including theIndependent Directors, reviewed and discussed such information at length. The Independent Directors requested from management certain additional information, whichmanagement agreed to provide. At a meeting held on June 12-14, 2018, the Board, including the Independent Directors, reviewed the additional information provided bymanagement in response to these requests. After extensive discussions, the Board, including all of the Independent Directors, approved the continuance of the AdvisoryContract for the Fund, based on a review of qualitative and quantitative information provided by BFA. The Board noted its satisfaction with the extent and quality ofinformation provided and its frequent interactions with management, as well as the detailed responses and other information provided by BFA. The Independent Directorswere advised by their independent counsel throughout the process, including about the legal standards applicable to their review. In approving the Advisory Contract for theFund, the Board, including the Independent Directors, considered various factors, including: (i) the expenses and performance of the Fund; (ii) the nature, extent and qualityof the services provided by BFA; (iii) the costs of services provided to the Fund and profits realized by BFA and its affiliates; (iv) economies of scale; (v) the fees and servicesprovided for other comparable funds/accounts managed by BFA and its affiliates; and (vi) other benefits to BFA and/or its affiliates. The material factors, no one of whichwas controlling, and conclusions that formed the basis for the Board, including the Independent Directors, to approve the Advisory Contract are discussed below.
Expenses and Performance of the Fund - The Board reviewed statistical information prepared by Broadridge Financial Solutions Inc. (“Broadridge”), an independentprovider of investment company data, regarding the expense ratio components, including gross and net total expenses, fees and expenses of another fund in which theFund invests (if applicable), and waivers/reimbursements (if applicable) of the Fund in comparison with the same information for other ETFs (including, where applicable,funds sponsored by an “at cost” service provider), objectively selected by Broadridge as comprising the Fund’s applicable peer group pursuant to Broadridge’s proprietaryETF methodology (the “Peer Group”). The Board was provided with a detailed description of the proprietary ETF methodology used by Broadridge to determine the Fund’sPeer Group. The Board further noted that due to the limitations in providing comparable funds in the Peer Group, the statistical information provided in Broadridge’s reportmay or may not provide meaningful direct comparisons to the Fund in all instances.
The Board also noted that the investment advisory fee rate and overall expenses (net of waivers and reimbursements) for the Fund were lower than the median of theinvestment advisory fee rates and overall expenses (net of waivers and reimbursements) of the funds in its Peer Group, excluding iShares funds.
In addition, to the extent that any of the comparison funds included in the Peer Group, excluding iShares funds, track the same index as the Fund, Broadridge also provided,and the Board reviewed, a comparison of the Fund’s performance for the one-, three-, five-, ten-year, and since inception periods, as applicable, and for the quarter endedDecember 31, 2017, to that of relevant comparison fund(s) for the same periods.
The Board noted that the Fund seeks to track its specified underlying index and that, during the year, the Board received periodic reports on the Fund’s short- andlonger-term performance in comparison with its underlying index. Such periodic comparative performance information, including additional detailed information asrequested by the Board, was also considered. The Board noted that the Fund generally performed in line with its underlying index over the relevant periods.
Based on this review, the other factors considered at the meeting, and their general knowledge of ETF pricing, the Board concluded that the investment advisory fee rateand expense level and the historical performance of the Fund supported the Board’s approval of the continuance of the Advisory Contract for the coming year.
Nature, Extent and Quality of Services Provided by BFA - Based on management’s representations, including information about recent and proposed enhancementsto the iShares business, including with respect to capital markets support and analysis, technology, portfolio management, product design and quality, compliance and riskmanagement, global public policy and other services, the Board expected that there would be no diminution in the scope of services required of or provided by BFA underthe Advisory Contract for the coming year as compared to the scope of services provided by BFA during prior years. In reviewing the scope of these services, the Boardconsidered BFA’s investment philosophy and experience, noting that BFA and its affiliates have committed significant resources over time, including during the past year,to support the iShares funds and their shareholders. The Board also considered BFA’s compliance program and its compliance record with respect to the Fund. In thatregard, the Board noted that BFA reports to the Board about portfolio management and compliance matters on a periodic basis in connection with regularly scheduledmeetings of the Board, and on other occasions as necessary and appropriate, and has provided information and made relevant officers and other employees of BFA (andits affiliates) available as needed to provide further assistance with these matters. The Board also reviewed the background and experience of the persons responsible forthe day-to-day management of the Fund, as well as the resources available to them in managing the Fund. In addition to the above considerations, the Board reviewed andconsidered detailed presentations regarding BFA’s investment performance, investment and risk management processes and strategies provided at the June 12-14, 2018meeting and throughout the year, and matters related to BFA’s portfolio compliance policies and procedures.
Based on review of this information, and the performance information discussed above, the Board concluded that the nature, extent and quality of services provided to theFund under the Advisory Contract supported the Board’s approval of the continuance of the Advisory Contract for the coming year.
Costs of Services Provided to Fund and Profits Realized by BFA and its Affiliates - The Board reviewed information about the profitability to BlackRock in managingthe Fund, based on the fees payable to BFA and its affiliates (including fees under the Advisory Contract), and other sources of revenue and expense to BFA and its affiliatesfrom the Fund’s operations for the last calendar year. The Board reviewed BlackRock’s profitability methodology for the iShares funds, noting that the 15(c) Committee andthe Board had focused on the methodology and profitability presentation during their meetings. The Board further noted that it considered the supplemental information the15(c) Committee requested, which BlackRock provided, regarding the methodology. The Board discussed the sources of direct and ancillary revenue with management,including the revenues to BTC, a BlackRock affiliate, from securities lending by the Fund. The Board also discussed BFA’s profit margin as reflected in the Fund’s profitabilityanalysis and reviewed information regarding potential economies of scale (as discussed below).
Based on this review, the Board concluded that the profits realized by BFA and its affiliates under the Advisory Contract and from other relationships between the Fund andBFA and/or its affiliates, if any, were within a reasonable range in light of the factors and other information considered.
Board Review and Approval of Investment Advisory Contract (continued)
78 2 0 1 8 I S H A R E S A N N U A L R E P O R T T O S H A R E H O L D E R S
Economies of Scale - The Board reviewed information regarding potential economies of scale or other efficiencies that may result from increases in the Fund’s assets,noting that the issue of economies of scale had been focused on by the 15(c) Committee and the Board during their meetings and addressed by management. The 15(c)Committee and the Board received information regarding BlackRock’s historical profitability, including BFA’s and its affiliates’ costs in providing services. The costinformation distinguished, among other things, between fixed and variable costs, and showed how the level of fixed and variable costs, as well as the nature of such costs,may impact the existence or size of scale benefits. The 15(c) Committee and the Board reviewed information provided by BFA regarding the sharing of scale benefits withthe iShares funds through various means, including, as applicable, through relatively low fee rates established at inception, breakpoints, waivers, or other fee reductions,as well as through additional investment in the iShares business and the provision of improved or additional infrastructure and services to the iShares funds and theirshareholders. The Board noted that the Advisory Contract for the Fund already provided for breakpoints in the Fund’s investment advisory fee rate as the assets of the Fund,on an aggregated basis with the assets of certain other iShares funds, increase. The Board noted that it would continue to monitor the sharing of economies of scale todetermine the appropriateness of adding new or revised breakpoints in the future.
Based on this review of the sharing of scale benefits, as well as the other factors considered at the meeting, the Board concluded that the information concerning the sharingof scale benefits supported the Board’s approval of the continuance of the Advisory Contract for the coming year.
Fees and Services Provided for Other Comparable Funds/Accounts Managed by BFA and its Affiliates - The Board received and considered information regardingthe investment advisory/management fee rates for other funds/accounts in the U.S. for which BFA (or its affiliates) provides investment advisory/management services,including open-end funds registered under the 1940 Act (including sub-advised funds), collective trust funds, and institutional separate accounts (collectively, the “OtherAccounts”), and acknowledged BFA’s assertion that the iShares funds are fundamentally different investment vehicles from the Other Accounts. The Board noted that BFAand its affiliates do manage Other Accounts with substantially the same investment objective and strategy as the Fund and that track the same index as the Fund. The Boardfurther noted that BFA provided the Board with detailed information regarding how the Other Accounts generally differ from the Fund, including in terms of the different andgenerally more extensive services provided to the Fund, as well as other significant differences. In that regard, the Board considered that the pricing of services toinstitutional clients is typically based on a number of factors beyond the nature and extent of the specific services to be provided and often depends on the overallrelationship between the client and its affiliates and the adviser and its affiliates. In addition, the Board considered the relative complexity and inherent risks and challengesof managing and providing other services to the Fund, as a publicly traded ETF, as compared to the Other Accounts, particularly those that are institutional clients, in lightof differing regulatory requirements and client-imposed mandates. The Board also acknowledged management’s assertion that, for certain iShares funds, and for clientsegmentation purposes, BlackRock has launched an iShares fund that may provide a similar investment exposure at a lower investment advisory fee rate. The Board alsoconsidered the “all-inclusive” nature of the Fund’s advisory fee structure, and the Fund’s expenses borne by BFA under this arrangement. The Board noted that theinvestment advisory fee rate under the Advisory Contract for the Fund was generally higher than the investment advisory/management fee rates for certain of the OtherAccounts (particularly institutional clients) and concluded that the differences appeared to be consistent with the factors discussed.
Other Benefits to BFA and/or its Affiliates - The Board reviewed the “fallout” benefits or ancillary revenue received by BFA and/or its affiliates in connection with theservices provided to the Fund by BFA, such as payment of revenue to BTC, the Fund’s securities lending agent, for loaning portfolio securities (which was included in theprofit margins reviewed by the Board pursuant to BFA’s profitability methodology), and payment of advisory fees and/or administration fees to BFA (or its affiliates) inconnection with any investments by the Fund in other funds for which BFA (or its affiliates) provides investment advisory services and/or administration services. The Boardalso noted the revenue received by BFA and/or its affiliates pursuant to an agreement that permits a service provider to use certain portions of BlackRock’s technologyplatform to service accounts managed by BFA and/or its affiliates, including the iShares funds. The Board noted that BFA generally does not use soft dollars or consider thevalue of research or other services that may be provided to BFA (including its affiliates) in selecting brokers for portfolio transactions for the Fund. The Board further notedthat any portfolio transactions on behalf of the Fund placed through a BFAaffiliate or purchased from an underwriting syndicate in which a BFAaffiliate participates (includingassociated commissions) are reported to the Board pursuant to Rule 17e-1 or Rule 10f-3, as applicable, under the 1940 Act. The Board concluded that any such ancillarybenefits would not be disadvantageous to the Fund and thus would not alter the Board’s conclusion with respect to the appropriateness of approving the continuance of theAdvisory Contract for the coming year.
Conclusion - Based on a review of the factors described above, as well as such other factors as deemed appropriate by the Board, the Board, including all of theIndependent Directors, determined that the Fund’s investment advisory fee rate under the Advisory Contract does not constitute a fee that is so disproportionately large asto bear no reasonable relationship to the services rendered and that could not have been the product of arm’s-length bargaining, and concluded to approve the continuanceof the Advisory Contract for the coming year.
IV. iShares MSCI Russia ETF
Under Section 15(c) of the Investment Company Act of 1940 (the “1940 Act”), the Company's Board of Directors (the “Board”), including a majority of Directors who are not“interested persons” of the Company (as that term is defined in the 1940 Act) (the “Independent Directors”), is required annually to consider and approve the InvestmentAdvisory Contract between the Company and BFA (the “Advisory Contract”) on behalf of the Fund. The Independent Directors requested, and BFA provided, suchinformation as the Independent Directors, with advice from independent counsel, deemed reasonably necessary to evaluate the Advisory Contract. At a meeting on May 11,2018, a committee composed of all of the Independent Directors (the “15(c) Committee”), with independent counsel, met with management and reviewed and discussedinformation provided in response to initial requests of the 15(c) Committee and/or their independent counsel, and requested certain additional information, whichmanagement agreed to provide. At these meetings, the 15(c) Committee reviewed and discussed information provided in response to the 15(c) Committee’s initial requests,and requested certain additional information, which management agreed to provide. At a meeting held on May 24, 2018, management presented additional information tothe Board relating to the continuance of the Advisory Contract, including information requested by the 15(c) Committee during its initial meeting. The Board, including theIndependent Directors, reviewed and discussed such information at length. The Independent Directors requested from management certain additional information, whichmanagement agreed to provide. At a meeting held on June 12-14, 2018, the Board, including the Independent Directors, reviewed the additional information provided bymanagement in response to these requests. After extensive discussions, the Board, including all of the Independent Directors, approved the continuance of the Advisory
Board Review and Approval of Investment Advisory Contract (continued)
B O A R D R E V I E W A N D A P P R O V A L O F I N V E S T M E N T A D V I S O R Y C O N T R A C T 79
Contract for the Fund, based on a review of qualitative and quantitative information provided by BFA. The Board noted its satisfaction with the extent and quality ofinformation provided and its frequent interactions with management, as well as the detailed responses and other information provided by BFA. The Independent Directorswere advised by their independent counsel throughout the process, including about the legal standards applicable to their review. In approving the Advisory Contract for theFund, the Board, including the Independent Directors, considered various factors, including: (i) the expenses and performance of the Fund; (ii) the nature, extent and qualityof the services provided by BFA; (iii) the costs of services provided to the Fund and profits realized by BFA and its affiliates; (iv) economies of scale; (v) the fees and servicesprovided for other comparable funds/accounts managed by BFA and its affiliates; and (vi) other benefits to BFA and/or its affiliates. The material factors, no one of whichwas controlling, and conclusions that formed the basis for the Board, including the Independent Directors, to approve the Advisory Contract are discussed below.
Expenses and Performance of the Fund - The Board reviewed statistical information prepared by Broadridge Financial Solutions Inc. (“Broadridge”), an independentprovider of investment company data, regarding the expense ratio components, including gross and net total expenses, fees and expenses of another fund in which theFund invests (if applicable), and waivers/reimbursements (if applicable) of the Fund in comparison with the same information for other ETFs (including, where applicable,funds sponsored by an “at cost” service provider), objectively selected by Broadridge as comprising the Fund’s applicable peer group pursuant to Broadridge’s proprietaryETF methodology (the “Peer Group”). The Board was provided with a detailed description of the proprietary ETF methodology used by Broadridge to determine the Fund’sPeer Group. The Board further noted that due to the limitations in providing comparable funds in the Peer Group, the statistical information provided in Broadridge’s reportmay or may not provide meaningful direct comparisons to the Fund in all instances.
The Board also noted that the investment advisory fee rate and overall expenses (net of waivers and reimbursements) for the Fund were higher than the median of theinvestment advisory fee rates and overall expenses (net of waivers and reimbursements) of the funds in its Peer Group, excluding iShares funds.
In addition, to the extent that any of the comparison funds included in the Peer Group, excluding iShares funds, track the same index as the Fund, Broadridge also provided,and the Board reviewed, a comparison of the Fund’s performance for the one-, three-, five-, ten-year, and since inception periods, as applicable, and for the quarter endedDecember 31, 2017, to that of relevant comparison fund(s) for the same periods.
The Board noted that the Fund seeks to track its specified underlying index and that, during the year, the Board received periodic reports on the Fund’s short- andlonger-term performance in comparison with its underlying index. Such periodic comparative performance information, including additional detailed information asrequested by the Board, was also considered. The Board noted that the Fund generally performed in line with its underlying index over the relevant periods.
Based on this review, the other factors considered at the meeting, and their general knowledge of ETF pricing, the Board concluded that the investment advisory fee rateand expense level and the historical performance of the Fund supported the Board’s approval of the continuance of the Advisory Contract for the coming year.
Nature, Extent and Quality of Services Provided by BFA - Based on management’s representations, including information about recent and proposed enhancementsto the iShares business, including with respect to capital markets support and analysis, technology, portfolio management, product design and quality, compliance and riskmanagement, global public policy and other services, the Board expected that there would be no diminution in the scope of services required of or provided by BFA underthe Advisory Contract for the coming year as compared to the scope of services provided by BFA during prior years. In reviewing the scope of these services, the Boardconsidered BFA’s investment philosophy and experience, noting that BFA and its affiliates have committed significant resources over time, including during the past year,to support the iShares funds and their shareholders. The Board also considered BFA’s compliance program and its compliance record with respect to the Fund. In thatregard, the Board noted that BFA reports to the Board about portfolio management and compliance matters on a periodic basis in connection with regularly scheduledmeetings of the Board, and on other occasions as necessary and appropriate, and has provided information and made relevant officers and other employees of BFA (andits affiliates) available as needed to provide further assistance with these matters. The Board also reviewed the background and experience of the persons responsible forthe day-to-day management of the Fund, as well as the resources available to them in managing the Fund. In addition to the above considerations, the Board reviewed andconsidered detailed presentations regarding BFA’s investment performance, investment and risk management processes and strategies provided at the June 12-14, 2018meeting and throughout the year, and matters related to BFA’s portfolio compliance policies and procedures.
Based on review of this information, and the performance information discussed above, the Board concluded that the nature, extent and quality of services provided to theFund under the Advisory Contract supported the Board’s approval of the continuance of the Advisory Contract for the coming year.
Costs of Services Provided to Fund and Profits Realized by BFA and its Affiliates - The Board reviewed information about the profitability to BlackRock in managingthe Fund, based on the fees payable to BFA and its affiliates (including fees under the Advisory Contract), and other sources of revenue and expense to BFA and its affiliatesfrom the Fund’s operations for the last calendar year. The Board reviewed BlackRock’s profitability methodology for the iShares funds, noting that the 15(c) Committee andthe Board had focused on the methodology and profitability presentation during their meetings. The Board further noted that it considered the supplemental information the15(c) Committee requested, which BlackRock provided, regarding the methodology. The Board discussed the sources of direct and ancillary revenue with management,including the revenues to BTC, a BlackRock affiliate, from securities lending by the Fund. The Board also discussed BFA’s profit margin as reflected in the Fund’s profitabilityanalysis and reviewed information regarding potential economies of scale (as discussed below).
Based on this review, the Board concluded that the profits realized by BFA and its affiliates under the Advisory Contract and from other relationships between the Fund andBFA and/or its affiliates, if any, were within a reasonable range in light of the factors and other information considered.
Economies of Scale - The Board reviewed information regarding potential economies of scale or other efficiencies that may result from increases in the Fund’s assets,noting that the issue of economies of scale had been focused on by the 15(c) Committee and the Board during their meetings and addressed by management. The 15(c)Committee and the Board received information regarding BlackRock’s historical profitability, including BFA’s and its affiliates’ costs in providing services. The costinformation distinguished, among other things, between fixed and variable costs, and showed how the level of fixed and variable costs, as well as the nature of such costs,may impact the existence or size of scale benefits. The 15(c) Committee and the Board reviewed information provided by BFA regarding the sharing of scale benefits with
Board Review and Approval of Investment Advisory Contract (continued)
80 2 0 1 8 I S H A R E S A N N U A L R E P O R T T O S H A R E H O L D E R S
the iShares funds through various means, including, as applicable, through relatively low fee rates established at inception, breakpoints, waivers, or other fee reductions,as well as through additional investment in the iShares business and the provision of improved or additional infrastructure and services to the iShares funds and theirshareholders. The Board noted that the Advisory Contract for the Fund already provided for breakpoints in the Fund’s investment advisory fee rate as the assets of the Fund,on an aggregated basis with the assets of certain other iShares funds, increase. The Board noted that it would continue to monitor the sharing of economies of scale todetermine the appropriateness of adding new or revised breakpoints in the future.
Based on this review of the sharing of scale benefits, as well as the other factors considered at the meeting, the Board concluded that the information concerning the sharingof scale benefits supported the Board’s approval of the continuance of the Advisory Contract for the coming year.
Fees and Services Provided for Other Comparable Funds/Accounts Managed by BFA and its Affiliates - The Board received and considered information regardingthe investment advisory/management fee rates for other funds/accounts in the U.S. for which BFA (or its affiliates) provides investment advisory/management services,including open-end funds registered under the 1940 Act (including sub-advised funds), collective trust funds, and institutional separate accounts (collectively, the “OtherAccounts”), and acknowledged BFA’s assertion that the iShares funds are fundamentally different investment vehicles from the Other Accounts. The Board noted that BFAand its affiliates do not manage Other Accounts with substantially the same investment objective and strategy as the Fund and that track the same index as the Fund. TheBoard further noted that BFA provided the Board with detailed information regarding how the Other Accounts generally differ from the Fund, including in terms of the differentand generally more extensive services provided to the Fund, as well as other significant differences. In that regard, the Board considered that the pricing of services toinstitutional clients is typically based on a number of factors beyond the nature and extent of the specific services to be provided and often depends on the overallrelationship between the client and its affiliates and the adviser and its affiliates. In addition, the Board considered the relative complexity and inherent risks and challengesof managing and providing other services to the Fund, as a publicly traded ETF, as compared to the Other Accounts, particularly those that are institutional clients, in lightof differing regulatory requirements and client-imposed mandates. The Board also acknowledged management’s assertion that, for certain iShares funds, and for clientsegmentation purposes, BlackRock has launched an iShares fund that may provide a similar investment exposure at a lower investment advisory fee rate. The Board alsoconsidered the “all-inclusive” nature of the Fund’s advisory fee structure, and the Fund’s expenses borne by BFA under this arrangement. The Board noted that theinvestment advisory fee rate under the Advisory Contract for the Fund was generally higher than the investment advisory/management fee rates for certain of the OtherAccounts (particularly institutional clients) and concluded that the differences appeared to be consistent with the factors discussed.
Other Benefits to BFA and/or its Affiliates - The Board reviewed the “fallout” benefits or ancillary revenue received by BFA and/or its affiliates in connection with theservices provided to the Fund by BFA, such as payment of revenue to BTC, the Fund’s securities lending agent, for loaning portfolio securities (which was included in theprofit margins reviewed by the Board pursuant to BFA’s profitability methodology), and payment of advisory fees and/or administration fees to BFA (or its affiliates) inconnection with any investments by the Fund in other funds for which BFA (or its affiliates) provides investment advisory services and/or administration services. The Boardalso noted the revenue received by BFA and/or its affiliates pursuant to an agreement that permits a service provider to use certain portions of BlackRock’s technologyplatform to service accounts managed by BFA and/or its affiliates, including the iShares funds. The Board noted that BFA generally does not use soft dollars or consider thevalue of research or other services that may be provided to BFA (including its affiliates) in selecting brokers for portfolio transactions for the Fund. The Board further notedthat any portfolio transactions on behalf of the Fund placed through a BFAaffiliate or purchased from an underwriting syndicate in which a BFAaffiliate participates (includingassociated commissions) are reported to the Board pursuant to Rule 17e-1 or Rule 10f-3, as applicable, under the 1940 Act. The Board concluded that any such ancillarybenefits would not be disadvantageous to the Fund and thus would not alter the Board’s conclusion with respect to the appropriateness of approving the continuance of theAdvisory Contract for the coming year.
Conclusion - Based on a review of the factors described above, as well as such other factors as deemed appropriate by the Board, the Board, including all of theIndependent Directors, determined that the Fund’s investment advisory fee rate under the Advisory Contract does not constitute a fee that is so disproportionately large asto bear no reasonable relationship to the services rendered and that could not have been the product of arm’s-length bargaining, and concluded to approve the continuanceof the Advisory Contract for the coming year.
V. iShares MSCI South Africa ETF and iShares MSCI Turkey ETF
Under Section 15(c) of the Investment Company Act of 1940 (the “1940 Act”), the Company's Board of Directors (the “Board”), including a majority of Directors who are not“interested persons” of the Company (as that term is defined in the 1940 Act) (the “Independent Directors”), is required annually to consider and approve the InvestmentAdvisory Contract between the Company and BFA (the “Advisory Contract”) on behalf of the Funds. The Independent Directors requested, and BFA provided, suchinformation as the Independent Directors, with advice from independent counsel, deemed reasonably necessary to evaluate the Advisory Contract. At a meeting on May 11,2018, a committee composed of all of the Independent Directors (the “15(c) Committee”), with independent counsel, met with management and reviewed and discussedinformation provided in response to initial requests of the 15(c) Committee and/or their independent counsel, and requested certain additional information, whichmanagement agreed to provide. At these meetings, the 15(c) Committee reviewed and discussed information provided in response to the 15(c) Committee’s initial requests,and requested certain additional information, which management agreed to provide. At a meeting held on May 24, 2018, management presented additional information tothe Board relating to the continuance of the Advisory Contract, including information requested by the 15(c) Committee during its initial meeting. The Board, including theIndependent Directors, reviewed and discussed such information at length. The Independent Directors requested from management certain additional information, whichmanagement agreed to provide. At a meeting held on June 12-14, 2018, the Board, including the Independent Directors, reviewed the additional information provided bymanagement in response to these requests. After extensive discussions, the Board, including all of the Independent Directors, approved the continuance of the AdvisoryContract for the Funds, based on a review of qualitative and quantitative information provided by BFA. The Board noted its satisfaction with the extent and quality ofinformation provided and its frequent interactions with management, as well as the detailed responses and other information provided by BFA. The Independent Directorswere advised by their independent counsel throughout the process, including about the legal standards applicable to their review. In approving the Advisory Contract for theFunds, the Board, including the Independent Directors, considered various factors, including: (i) the expenses and performance of each Fund; (ii) the nature, extent andquality of the services provided by BFA; (iii) the costs of services provided to each Fund and profits realized by BFA and its affiliates; (iv) economies of scale; (v) the fees
Board Review and Approval of Investment Advisory Contract (continued)
B O A R D R E V I E W A N D A P P R O V A L O F I N V E S T M E N T A D V I S O R Y C O N T R A C T 81
and services provided for other comparable funds/accounts managed by BFA and its affiliates; and (vi) other benefits to BFA and/or its affiliates. The material factors, noone of which was controlling, and conclusions that formed the basis for the Board, including the Independent Directors, to approve the Advisory Contract are discussedbelow.
Expenses and Performance of the Funds - The Board reviewed statistical information prepared by Broadridge Financial Solutions Inc. (“Broadridge”), an independentprovider of investment company data, regarding the expense ratio components, including gross and net total expenses, fees and expenses of another fund in which eachFund invests (if applicable), and waivers/reimbursements (if applicable) of each Fund in comparison with the same information for other ETFs (including, where applicable,funds sponsored by an “at cost” service provider), objectively selected by Broadridge as comprising such Fund’s applicable peer group pursuant to Broadridge’s proprietaryETF methodology (the “Peer Group”). The Board was provided with a detailed description of the proprietary ETF methodology used by Broadridge to determine theapplicable Peer Groups. The Board further noted that due to the limitations in providing comparable funds in the various Peer Groups, the statistical information providedin Broadridge’s report may or may not provide meaningful direct comparisons to the Funds in all instances.
The Board also noted that the investment advisory fee rates and overall expenses (net of waivers and reimbursements) for the Funds were lower than the median of theinvestment advisory fee rates and overall expenses (net of waivers and reimbursements) of the funds in their respective Peer Group, excluding iShares funds.
In addition, to the extent that any of the comparison funds included in the Peer Group, excluding iShares funds, track the same index as any particular Fund, Broadridgealso provided, and the Board reviewed, a comparison of such Fund’s performance for the one-, three-, five-, ten-year, and since inception periods, as applicable, and forthe quarter ended December 31, 2017, to that of relevant comparison fund(s) for the same periods.
The Board noted that each Fund seeks to track its specified underlying index and that, during the year, the Board received periodic reports on each Fund’s short- andlonger-term performance in comparison with its underlying index. Such periodic comparative performance information, including additional detailed information asrequested by the Board, was also considered. The Board noted that each Fund generally performed in line with its underlying index over the relevant periods.
Based on this review, the other factors considered at the meeting, and their general knowledge of ETF pricing, the Board concluded that the investment advisory fee rateand expense level and the historical performance of each Fund supported the Board’s approval of the continuance of the Advisory Contract for the coming year.
Nature, Extent and Quality of Services Provided by BFA - Based on management’s representations, including information about recent and proposed enhancementsto the iShares business, including with respect to capital markets support and analysis, technology, portfolio management, product design and quality, compliance and riskmanagement, global public policy and other services, the Board expected that there would be no diminution in the scope of services required of or provided by BFA underthe Advisory Contract for the coming year as compared to the scope of services provided by BFA during prior years. In reviewing the scope of these services, the Boardconsidered BFA’s investment philosophy and experience, noting that BFA and its affiliates have committed significant resources over time, including during the past year,to support the iShares funds and their shareholders. The Board also considered BFA’s compliance program and its compliance record with respect to the Funds. In thatregard, the Board noted that BFA reports to the Board about portfolio management and compliance matters on a periodic basis in connection with regularly scheduledmeetings of the Board, and on other occasions as necessary and appropriate, and has provided information and made relevant officers and other employees of BFA (andits affiliates) available as needed to provide further assistance with these matters. The Board also reviewed the background and experience of the persons responsible forthe day-to-day management of the Funds, as well as the resources available to them in managing the Funds. In addition to the above considerations, the Board reviewedand considered detailed presentations regarding BFA’s investment performance, investment and risk management processes and strategies provided at the June 12-14,2018 meeting and throughout the year, and matters related to BFA’s portfolio compliance policies and procedures.
Based on review of this information, and the performance information discussed above, the Board concluded that the nature, extent and quality of services provided to theFunds under the Advisory Contract supported the Board’s approval of the continuance of the Advisory Contract for the coming year.
Costs of Services Provided to Fund and Profits Realized by BFA and its Affiliates - The Board reviewed information about the profitability to BlackRock in managingthe Funds, based on the fees payable to BFAand its affiliates (including fees under theAdvisory Contract), and other sources of revenue and expense to BFAand its affiliatesfrom the Funds’ operations for the last calendar year. The Board reviewed BlackRock’s profitability methodology for the iShares funds, noting that the 15(c) Committee andthe Board had focused on the methodology and profitability presentation during their meetings. The Board further noted that it considered the supplemental information the15(c) Committee requested, which BlackRock provided, regarding the methodology. The Board discussed the sources of direct and ancillary revenue with management,including the revenues to BTC, a BlackRock affiliate, from securities lending by the Funds. The Board also discussed BFA’s profit margin as reflected in the Funds’profitability analysis and reviewed information regarding potential economies of scale (as discussed below).
Based on this review, the Board concluded that the profits realized by BFA and its affiliates under the Advisory Contract and from other relationships between the Funds andBFA and/or its affiliates, if any, were within a reasonable range in light of the factors and other information considered.
Economies of Scale - The Board reviewed information regarding potential economies of scale or other efficiencies that may result from increases in the Funds’ assets,noting that the issue of economies of scale had been focused on by the 15(c) Committee and the Board during their meetings and addressed by management. The 15(c)Committee and the Board received information regarding BlackRock’s historical profitability, including BFA’s and its affiliates’ costs in providing services. The costinformation distinguished, among other things, between fixed and variable costs, and showed how the level of fixed and variable costs, as well as the nature of such costs,may impact the existence or size of scale benefits. The 15(c) Committee and the Board reviewed information provided by BFA regarding the sharing of scale benefits withthe iShares funds through various means, including, as applicable, through relatively low fee rates established at inception, breakpoints, waivers, or other fee reductions,as well as through additional investment in the iShares business and the provision of improved or additional infrastructure and services to the iShares funds and theirshareholders. The Board noted that the Advisory Contract for the Funds already provided for breakpoints in the Funds’ investment advisory fee rate as the assets of the
Board Review and Approval of Investment Advisory Contract (continued)
82 2 0 1 8 I S H A R E S A N N U A L R E P O R T T O S H A R E H O L D E R S
Funds, on an aggregated basis with the assets of certain other iShares funds, increase. The Board noted that it would continue to monitor the sharing of economies of scaleto determine the appropriateness of adding new or revised breakpoints in the future.
Based on this review of the sharing of scale benefits, as well as the other factors considered at the meeting, the Board concluded that the information concerning the sharingof scale benefits supported the Board’s approval of the continuance of the Advisory Contract for the coming year.
Fees and Services Provided for Other Comparable Funds/Accounts Managed by BFA and its Affiliates - The Board received and considered information regardingthe investment advisory/management fee rates for other funds/accounts in the U.S. for which BFA (or its affiliates) provides investment advisory/management services,including open-end funds registered under the 1940 Act (including sub-advised funds), collective trust funds, and institutional separate accounts (collectively, the “OtherAccounts”), and acknowledged BFA’s assertion that the iShares funds are fundamentally different investment vehicles from the Other Accounts. The Board noted that BFAand its affiliates do not manage OtherAccounts with substantially the same investment objectives and strategies as the Funds and that track the same indexes as the Funds.The Board further noted that BFA provided the Board with detailed information regarding how the Other Accounts generally differ from the Funds, including in terms of thedifferent and generally more extensive services provided to the Funds, as well as other significant differences. In that regard, the Board considered that the pricing ofservices to institutional clients is typically based on a number of factors beyond the nature and extent of the specific services to be provided and often depends on the overallrelationship between the client and its affiliates and the adviser and its affiliates. In addition, the Board considered the relative complexity and inherent risks and challengesof managing and providing other services to the Funds, as publicly traded ETFs, as compared to the Other Accounts, particularly those that are institutional clients, in lightof differing regulatory requirements and client-imposed mandates. The Board also acknowledged management’s assertion that, for certain iShares funds, and for clientsegmentation purposes, BlackRock has launched an iShares fund that may provide a similar investment exposure at a lower investment advisory fee rate. The Board alsoconsidered the “all-inclusive” nature of the Funds’ advisory fee structure, and the Funds’ expenses borne by BFA under this arrangement. The Board noted that theinvestment advisory fee rates under the Advisory Contract for the Funds was generally higher than the investment advisory/management fee rates for certain of the OtherAccounts (particularly institutional clients) and concluded that the differences appeared to be consistent with the factors discussed.
Other Benefits to BFA and/or its Affiliates - The Board reviewed the “fallout” benefits or ancillary revenue received by BFA and/or its affiliates in connection with theservices provided to the Funds by BFA, such as payment of revenue to BTC, the Funds’ securities lending agent, for loaning portfolio securities (which was included in theprofit margins reviewed by the Board pursuant to BFA’s profitability methodology), and payment of advisory fees and/or administration fees to BFA (or its affiliates) inconnection with any investments by the Funds in other funds for which BFA (or its affiliates) provides investment advisory services and/or administration services. The Boardalso noted the revenue received by BFA and/or its affiliates pursuant to an agreement that permits a service provider to use certain portions of BlackRock’s technologyplatform to service accounts managed by BFA and/or its affiliates, including the iShares funds. The Board noted that BFA generally does not use soft dollars or consider thevalue of research or other services that may be provided to BFA (including its affiliates) in selecting brokers for portfolio transactions for the Funds. The Board further notedthat any portfolio transactions on behalf of the Funds placed through a BFA affiliate or purchased from an underwriting syndicate in which a BFA affiliate participates(including associated commissions) are reported to the Board pursuant to Rule 17e-1 or Rule 10f-3, as applicable, under the 1940 Act. The Board concluded that any suchancillary benefits would not be disadvantageous to the Funds and thus would not alter the Board’s conclusion with respect to the appropriateness of approving thecontinuance of the Advisory Contract for the coming year.
Conclusion - Based on a review of the factors described above, as well as such other factors as deemed appropriate by the Board, the Board, including all of theIndependent Directors, determined that the Funds’ investment advisory fee rates under the Advisory Contract do not constitute fees that are so disproportionately large asto bear no reasonable relationship to the services rendered and that could not have been the product of arm’s-length bargaining, and concluded to approve the continuanceof the Advisory Contract for the coming year.
VI. iShares MSCI USA Equal Weighted ETF
Under Section 15(c) of the Investment Company Act of 1940 (the “1940 Act”), the Company's Board of Directors (the “Board”), including a majority of Directors who are not“interested persons” of the Company (as that term is defined in the 1940 Act) (the “Independent Directors”), is required annually to consider and approve the InvestmentAdvisory Contract between the Company and BFA (the “Advisory Contract”) on behalf of the Fund. The Independent Directors requested, and BFA provided, suchinformation as the Independent Directors, with advice from independent counsel, deemed reasonably necessary to evaluate the Advisory Contract. At a meeting on May 11,2018, a committee composed of all of the Independent Directors (the “15(c) Committee”), with independent counsel, met with management and reviewed and discussedinformation provided in response to initial requests of the 15(c) Committee and/or their independent counsel, and requested certain additional information, whichmanagement agreed to provide. At these meetings, the 15(c) Committee reviewed and discussed information provided in response to the 15(c) Committee’s initial requests,and requested certain additional information, which management agreed to provide. At a meeting held on May 24, 2018, management presented additional information tothe Board relating to the continuance of the Advisory Contract, including information requested by the 15(c) Committee during its initial meeting. The Board, including theIndependent Directors, reviewed and discussed such information at length. The Independent Directors requested from management certain additional information, whichmanagement agreed to provide. At a meeting held on June 12-14, 2018, the Board, including the Independent Directors, reviewed the additional information provided bymanagement in response to these requests. After extensive discussions, the Board, including all of the Independent Directors, approved the continuance of the AdvisoryContract for the Fund, based on a review of qualitative and quantitative information provided by BFA. The Board noted its satisfaction with the extent and quality ofinformation provided and its frequent interactions with management, as well as the detailed responses and other information provided by BFA. The Independent Directorswere advised by their independent counsel throughout the process, including about the legal standards applicable to their review. In approving the Advisory Contract for theFund, the Board, including the Independent Directors, considered various factors, including: (i) the expenses and performance of the Fund; (ii) the nature, extent and qualityof the services provided by BFA; (iii) the costs of services provided to the Fund and profits realized by BFA and its affiliates; (iv) economies of scale; (v) the fees and servicesprovided for other comparable funds/accounts managed by BFA and its affiliates; and (vi) other benefits to BFA and/or its affiliates. The material factors, no one of whichwas controlling, and conclusions that formed the basis for the Board, including the Independent Directors, to approve the Advisory Contract are discussed below.
Board Review and Approval of Investment Advisory Contract (continued)
B O A R D R E V I E W A N D A P P R O V A L O F I N V E S T M E N T A D V I S O R Y C O N T R A C T 83
Expenses and Performance of the Fund - The Board reviewed statistical information prepared by Broadridge Financial Solutions Inc. (“Broadridge”), an independentprovider of investment company data, regarding the expense ratio components, including gross and net total expenses, fees and expenses of another fund in which theFund invests (if applicable), and waivers/reimbursements (if applicable) of the Fund in comparison with the same information for other ETFs (including, where applicable,funds sponsored by an “at cost” service provider), objectively selected by Broadridge as comprising the Fund’s applicable peer group pursuant to Broadridge’s proprietaryETF methodology (the “Peer Group”). The Board was provided with a detailed description of the proprietary ETF methodology used by Broadridge to determine the Fund’sPeer Group. The Board further noted that due to the limitations in providing comparable funds in the Peer Group, the statistical information provided in Broadridge’s reportmay or may not provide meaningful direct comparisons to the Fund in all instances.
The Board also noted that the investment advisory fee rate and overall expenses (net of waivers and reimbursements) for the Fund were lower than the median of theinvestment advisory fee rates and overall expenses (net of waivers and reimbursements) of the funds in its Peer Group, excluding iShares funds.
In addition, to the extent that any of the comparison funds included in the Peer Group, excluding iShares funds, track the same index as the Fund, Broadridge also provided,and the Board reviewed, a comparison of the Fund’s performance for the one-, three-, five-, ten-year, and since inception periods, as applicable, and for the quarter endedDecember 31, 2017, to that of relevant comparison fund(s) for the same periods.
The Board noted that the Fund seeks to track its specified underlying index and that, during the year, the Board received periodic reports on the Fund’s short- andlonger-term performance in comparison with its underlying index. Such periodic comparative performance information, including additional detailed information asrequested by the Board, was also considered. The Board noted that the Fund generally performed in line with its underlying index over the relevant periods.
Based on this review, the other factors considered at the meeting, and their general knowledge of ETF pricing, the Board concluded that the investment advisory fee rateand expense level and the historical performance of the Fund supported the Board’s approval of the continuance of the Advisory Contract for the coming year.
Nature, Extent and Quality of Services Provided by BFA - Based on management’s representations, including information about recent and proposed enhancementsto the iShares business, including with respect to capital markets support and analysis, technology, portfolio management, product design and quality, compliance and riskmanagement, global public policy and other services, the Board expected that there would be no diminution in the scope of services required of or provided by BFA underthe Advisory Contract for the coming year as compared to the scope of services provided by BFA during prior years. In reviewing the scope of these services, the Boardconsidered BFA’s investment philosophy and experience, noting that BFA and its affiliates have committed significant resources over time, including during the past year,to support the iShares funds and their shareholders. The Board also considered BFA’s compliance program and its compliance record with respect to the Fund. In thatregard, the Board noted that BFA reports to the Board about portfolio management and compliance matters on a periodic basis in connection with regularly scheduledmeetings of the Board, and on other occasions as necessary and appropriate, and has provided information and made relevant officers and other employees of BFA (andits affiliates) available as needed to provide further assistance with these matters. The Board also reviewed the background and experience of the persons responsible forthe day-to-day management of the Fund, as well as the resources available to them in managing the Fund. In addition to the above considerations, the Board reviewed andconsidered detailed presentations regarding BFA’s investment performance, investment and risk management processes and strategies provided at the June 12-14, 2018meeting and throughout the year, and matters related to BFA’s portfolio compliance policies and procedures.
Based on review of this information, and the performance information discussed above, the Board concluded that the nature, extent and quality of services provided to theFund under the Advisory Contract supported the Board’s approval of the continuance of the Advisory Contract for the coming year.
Costs of Services Provided to Fund and Profits Realized by BFA and its Affiliates - The Board reviewed information about the profitability to BlackRock in managingthe Fund, based on the fees payable to BFA and its affiliates (including fees under the Advisory Contract), and other sources of revenue and expense to BFA and its affiliatesfrom the Fund’s operations for the last calendar year. The Board reviewed BlackRock’s profitability methodology for the iShares funds, noting that the 15(c) Committee andthe Board had focused on the methodology and profitability presentation during their meetings. The Board further noted that it considered the supplemental information the15(c) Committee requested, which BlackRock provided, regarding the methodology. The Board discussed the sources of direct and ancillary revenue with management,including the revenues to BTC, a BlackRock affiliate, from securities lending by the Fund. The Board also discussed BFA’s profit margin as reflected in the Fund’s profitabilityanalysis and reviewed information regarding potential economies of scale (as discussed below).
Based on this review, the Board concluded that the profits realized by BFA and its affiliates under the Advisory Contract and from other relationships between the Fund andBFA and/or its affiliates, if any, were within a reasonable range in light of the factors and other information considered.
Economies of Scale - The Board reviewed information regarding potential economies of scale or other efficiencies that may result from increases in the Fund’s assets,noting that the issue of economies of scale had been focused on by the 15(c) Committee and the Board during their meetings and addressed by management. The 15(c)Committee and the Board received information regarding BlackRock’s historical profitability, including BFA’s and its affiliates’ costs in providing services. The costinformation distinguished, among other things, between fixed and variable costs, and showed how the level of fixed and variable costs, as well as the nature of such costs,may impact the existence or size of scale benefits. The 15(c) Committee and the Board reviewed information provided by BFA regarding the sharing of scale benefits withthe iShares funds through various means, including, as applicable, through relatively low fee rates established at inception, breakpoints, waivers, or other fee reductions,as well as through additional investment in the iShares business and the provision of improved or additional infrastructure and services to the iShares funds and theirshareholders. The Board noted that the Advisory Contract for the Fund did not provide for breakpoints in the Fund’s investment advisory fee rate as the assets of the Fundincrease. However, the Board noted that a breakpoint structure for the Fund may be appropriate should material economies of scale exist in the future that are not otherwiseshared, and that it would continue to monitor the sharing of economies of scale to determine the appropriateness of adding breakpoints in the future.
Based on this review of the sharing of scale benefits, as well as the other factors considered at the meeting, the Board concluded that the information concerning the sharingof scale benefits supported the Board’s approval of the continuance of the Advisory Contract for the coming year.
Board Review and Approval of Investment Advisory Contract (continued)
84 2 0 1 8 I S H A R E S A N N U A L R E P O R T T O S H A R E H O L D E R S
Fees and Services Provided for Other Comparable Funds/Accounts Managed by BFA and its Affiliates - The Board received and considered information regardingthe investment advisory/management fee rates for other funds/accounts in the U.S. for which BFA (or its affiliates) provides investment advisory/management services,including open-end funds registered under the 1940 Act (including sub-advised funds), collective trust funds, and institutional separate accounts (collectively, the “OtherAccounts”), and acknowledged BFA’s assertion that the iShares funds are fundamentally different investment vehicles from the Other Accounts. The Board noted that BFAand its affiliates do not manage Other Accounts with substantially the same investment objective and strategy as the Fund and that track the same index as the Fund. TheBoard further noted that BFA provided the Board with detailed information regarding how the Other Accounts generally differ from the Fund, including in terms of the differentand generally more extensive services provided to the Fund, as well as other significant differences. In that regard, the Board considered that the pricing of services toinstitutional clients is typically based on a number of factors beyond the nature and extent of the specific services to be provided and often depends on the overallrelationship between the client and its affiliates and the adviser and its affiliates. In addition, the Board considered the relative complexity and inherent risks and challengesof managing and providing other services to the Fund, as a publicly traded ETF, as compared to the Other Accounts, particularly those that are institutional clients, in lightof differing regulatory requirements and client-imposed mandates. The Board also acknowledged management’s assertion that, for certain iShares funds, and for clientsegmentation purposes, BlackRock has launched an iShares fund that may provide a similar investment exposure at a lower investment advisory fee rate. The Board alsoconsidered the “all-inclusive” nature of the Fund’s advisory fee structure, and the Fund’s expenses borne by BFA under this arrangement. The Board noted that theinvestment advisory fee rate under the Advisory Contract for the Fund was generally higher than the investment advisory/management fee rates for certain of the OtherAccounts (particularly institutional clients) and concluded that the differences appeared to be consistent with the factors discussed.
Other Benefits to BFA and/or its Affiliates - The Board reviewed the “fallout” benefits or ancillary revenue received by BFA and/or its affiliates in connection with theservices provided to the Fund by BFA, such as payment of revenue to BTC, the Fund’s securities lending agent, for loaning portfolio securities (which was included in theprofit margins reviewed by the Board pursuant to BFA’s profitability methodology), and payment of advisory fees and/or administration fees to BFA (or its affiliates) inconnection with any investments by the Fund in other funds for which BFA (or its affiliates) provides investment advisory services and/or administration services. The Boardalso noted the revenue received by BFA and/or its affiliates pursuant to an agreement that permits a service provider to use certain portions of BlackRock’s technologyplatform to service accounts managed by BFA and/or its affiliates, including the iShares funds. The Board noted that BFA generally does not use soft dollars or consider thevalue of research or other services that may be provided to BFA (including its affiliates) in selecting brokers for portfolio transactions for the Fund. The Board further notedthat any portfolio transactions on behalf of the Fund placed through a BFAaffiliate or purchased from an underwriting syndicate in which a BFAaffiliate participates (includingassociated commissions) are reported to the Board pursuant to Rule 17e-1 or Rule 10f-3, as applicable, under the 1940 Act. The Board concluded that any such ancillarybenefits would not be disadvantageous to the Fund and thus would not alter the Board’s conclusion with respect to the appropriateness of approving the continuance of theAdvisory Contract for the coming year.
Conclusion - Based on a review of the factors described above, as well as such other factors as deemed appropriate by the Board, the Board, including all of theIndependent Directors, determined that the Fund’s investment advisory fee rate under the Advisory Contract does not constitute a fee that is so disproportionately large asto bear no reasonable relationship to the services rendered and that could not have been the product of arm’s-length bargaining, and concluded to approve the continuanceof the Advisory Contract for the coming year.
Board Review and Approval of Investment Advisory Contract (continued)
B O A R D R E V I E W A N D A P P R O V A L O F I N V E S T M E N T A D V I S O R Y C O N T R A C T 85
Section 19(a) Notices
The amounts and sources of distributions reported are estimates and are provided pursuant to regulatory requirements and are not being provided for tax reportingpurposes. The actual amounts and sources for tax reporting purposes will depend upon each fund's investment experience during the year and may be subject to changesbased on the tax regulations. Shareholders will receive a Form 1099-DIV each calendar year that will inform them how to report these distributions for federal income taxpurposes.
Total Cumulative Distributionsfor the Fiscal Year
% Breakdown of the Total CumulativeDistributions for the Fiscal Year
iShares ETF
NetInvestment
IncomeNet Realized
Capital GainsReturn of
CapitalTotal Per
Share
NetInvestment
IncomeNet Realized
Capital GainsReturn of
CapitalTotal Per
Share
MSCI Brazil . . . . . . . . . . . . . . . . . . . . . . . . . . . . . . . . . . . . . . . $ 0.946484 $ — $ — $ 0.946484 100% —% —% 100%MSCI Chile. . . . . . . . . . . . . . . . . . . . . . . . . . . . . . . . . . . . . . . . 0.969565 — — 0.969565 100 — — 100MSCI Colombia . . . . . . . . . . . . . . . . . . . . . . . . . . . . . . . . . . . 0.224757 — — 0.224757 100 — — 100MSCI Israel . . . . . . . . . . . . . . . . . . . . . . . . . . . . . . . . . . . . . . . 0.914589 — 0.125666 1.040255 88 — 12 100MSCI Russia . . . . . . . . . . . . . . . . . . . . . . . . . . . . . . . . . . . . . . 1.072472 — 0.016387 1.088859 98 — 2 100MSCI South Africa. . . . . . . . . . . . . . . . . . . . . . . . . . . . . . . . . 1.474424 — — 1.474424 100 — — 100MSCI USA Equal Weighted . . . . . . . . . . . . . . . . . . . . . . . . 0.868036 — 0.023149 0.891185 97 — 3 100
Premium/Discount Information
The Premium/Discount Information section is intended to present information about the differences between the daily market price on secondary markets for shares of afund and that fund’s NAV. NAV is the price at which a fund issues and redeems shares. It is calculated in accordance with the standard formula for valuing mutual fundshares. The “Market Price” of a fund generally is determined using the midpoint between the highest bid and the lowest ask on the primary securities exchange on whichshares of such fund are listed for trading, as of the time that the fund’s NAV is calculated. A fund’s Market Price may be at, above or below its NAV. The NAV of a fund willfluctuate with changes in the value of its portfolio holdings. The Market Price of a fund will fluctuate in accordance with changes in its NAV, as well as market supply anddemand.
Premiums or discounts are the differences (expressed as a percentage) between the NAV and Market Price of a fund on a given day, generally at the time the NAV iscalculated. A premium is the amount that a fund is trading above the reported NAV, expressed as a percentage of the NAV. A discount is the amount that a fund is tradingbelow the reported NAV, expressed as a percentage of the NAV.
Premium/discount information for the Funds covering the most recently completed calendar year and the most recently completed calendar quarters since that year (orsince the Fund began trading, if shorter) is publicly accessible, free of charge, at www.iShares.com.
The following information shows the frequency of distributions of premiums and discounts for the Funds for the immediately preceding five calendar years (or from the datea Fund began trading on the secondary market, if less than five years) through the date of the most recent calendar quarter-end. Each line in each table shows the numberof trading days in which the Fund traded within the premium/discount range indicated. Premium/discount ranges with no trading days are omitted. The number of tradingdays in each premium/discount range is also shown as a percentage of the total number of trading days in the period covered by each table. All data presented hererepresents past performance, which cannot be used to predict future results.
Supplemental Information (unaudited)
86 2 0 1 8 I S H A R E S A N N U A L R E P O R T T O S H A R E H O L D E R S
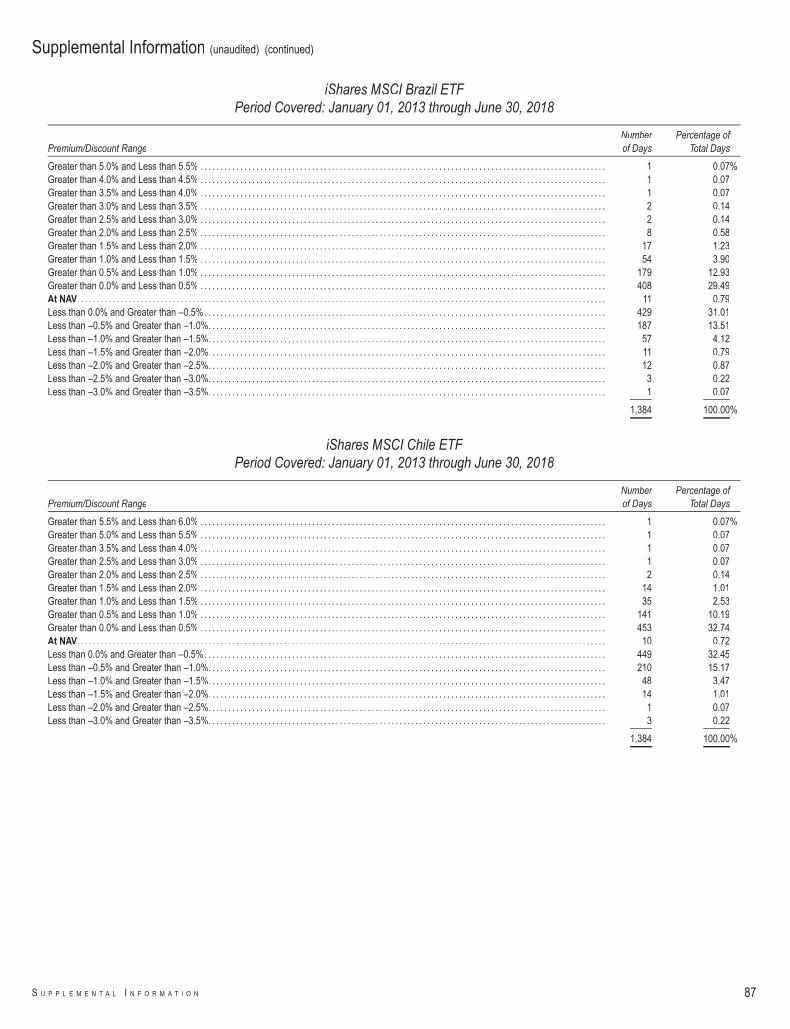
iShares MSCI Brazil ETFPeriod Covered: January 01, 2013 through June 30, 2018
Premium/Discount RangeNumberof Days
Percentage ofTotal Days
Greater than 5.0% and Less than 5.5% . . . . . . . . . . . . . . . . . . . . . . . . . . . . . . . . . . . . . . . . . . . . . . . . . . . . . . . . . . . . . . . . . . . . . . . . . . . . . . . . . . . . . . . . . . . . . . . . . . . . . . 1 0.07%Greater than 4.0% and Less than 4.5% . . . . . . . . . . . . . . . . . . . . . . . . . . . . . . . . . . . . . . . . . . . . . . . . . . . . . . . . . . . . . . . . . . . . . . . . . . . . . . . . . . . . . . . . . . . . . . . . . . . . . . 1 0.07Greater than 3.5% and Less than 4.0% . . . . . . . . . . . . . . . . . . . . . . . . . . . . . . . . . . . . . . . . . . . . . . . . . . . . . . . . . . . . . . . . . . . . . . . . . . . . . . . . . . . . . . . . . . . . . . . . . . . . . . 1 0.07Greater than 3.0% and Less than 3.5% . . . . . . . . . . . . . . . . . . . . . . . . . . . . . . . . . . . . . . . . . . . . . . . . . . . . . . . . . . . . . . . . . . . . . . . . . . . . . . . . . . . . . . . . . . . . . . . . . . . . . . 2 0.14Greater than 2.5% and Less than 3.0% . . . . . . . . . . . . . . . . . . . . . . . . . . . . . . . . . . . . . . . . . . . . . . . . . . . . . . . . . . . . . . . . . . . . . . . . . . . . . . . . . . . . . . . . . . . . . . . . . . . . . . 2 0.14Greater than 2.0% and Less than 2.5% . . . . . . . . . . . . . . . . . . . . . . . . . . . . . . . . . . . . . . . . . . . . . . . . . . . . . . . . . . . . . . . . . . . . . . . . . . . . . . . . . . . . . . . . . . . . . . . . . . . . . . 8 0.58Greater than 1.5% and Less than 2.0% . . . . . . . . . . . . . . . . . . . . . . . . . . . . . . . . . . . . . . . . . . . . . . . . . . . . . . . . . . . . . . . . . . . . . . . . . . . . . . . . . . . . . . . . . . . . . . . . . . . . . . 17 1.23Greater than 1.0% and Less than 1.5% . . . . . . . . . . . . . . . . . . . . . . . . . . . . . . . . . . . . . . . . . . . . . . . . . . . . . . . . . . . . . . . . . . . . . . . . . . . . . . . . . . . . . . . . . . . . . . . . . . . . . . 54 3.90Greater than 0.5% and Less than 1.0% . . . . . . . . . . . . . . . . . . . . . . . . . . . . . . . . . . . . . . . . . . . . . . . . . . . . . . . . . . . . . . . . . . . . . . . . . . . . . . . . . . . . . . . . . . . . . . . . . . . . . . 179 12.93Greater than 0.0% and Less than 0.5% . . . . . . . . . . . . . . . . . . . . . . . . . . . . . . . . . . . . . . . . . . . . . . . . . . . . . . . . . . . . . . . . . . . . . . . . . . . . . . . . . . . . . . . . . . . . . . . . . . . . . . 408 29.49At NAV. . . . . . . . . . . . . . . . . . . . . . . . . . . . . . . . . . . . . . . . . . . . . . . . . . . . . . . . . . . . . . . . . . . . . . . . . . . . . . . . . . . . . . . . . . . . . . . . . . . . . . . . . . . . . . . . . . . . . . . . . . . . . . . . . . . . . 11 0.79Less than 0.0% and Greater than –0.5%. . . . . . . . . . . . . . . . . . . . . . . . . . . . . . . . . . . . . . . . . . . . . . . . . . . . . . . . . . . . . . . . . . . . . . . . . . . . . . . . . . . . . . . . . . . . . . . . . . . . . 429 31.01Less than –0.5% and Greater than –1.0%. . . . . . . . . . . . . . . . . . . . . . . . . . . . . . . . . . . . . . . . . . . . . . . . . . . . . . . . . . . . . . . . . . . . . . . . . . . . . . . . . . . . . . . . . . . . . . . . . . . . 187 13.51Less than –1.0% and Greater than –1.5%. . . . . . . . . . . . . . . . . . . . . . . . . . . . . . . . . . . . . . . . . . . . . . . . . . . . . . . . . . . . . . . . . . . . . . . . . . . . . . . . . . . . . . . . . . . . . . . . . . . . 57 4.12Less than –1.5% and Greater than –2.0%. . . . . . . . . . . . . . . . . . . . . . . . . . . . . . . . . . . . . . . . . . . . . . . . . . . . . . . . . . . . . . . . . . . . . . . . . . . . . . . . . . . . . . . . . . . . . . . . . . . . 11 0.79Less than –2.0% and Greater than –2.5%. . . . . . . . . . . . . . . . . . . . . . . . . . . . . . . . . . . . . . . . . . . . . . . . . . . . . . . . . . . . . . . . . . . . . . . . . . . . . . . . . . . . . . . . . . . . . . . . . . . . 12 0.87Less than –2.5% and Greater than –3.0%. . . . . . . . . . . . . . . . . . . . . . . . . . . . . . . . . . . . . . . . . . . . . . . . . . . . . . . . . . . . . . . . . . . . . . . . . . . . . . . . . . . . . . . . . . . . . . . . . . . . 3 0.22Less than –3.0% and Greater than –3.5%. . . . . . . . . . . . . . . . . . . . . . . . . . . . . . . . . . . . . . . . . . . . . . . . . . . . . . . . . . . . . . . . . . . . . . . . . . . . . . . . . . . . . . . . . . . . . . . . . . . . 1 0.07
1,384 100.00%
iShares MSCI Chile ETFPeriod Covered: January 01, 2013 through June 30, 2018
Premium/Discount RangeNumberof Days
Percentage ofTotal Days
Greater than 5.5% and Less than 6.0% . . . . . . . . . . . . . . . . . . . . . . . . . . . . . . . . . . . . . . . . . . . . . . . . . . . . . . . . . . . . . . . . . . . . . . . . . . . . . . . . . . . . . . . . . . . . . . . . . . . . . . 1 0.07%Greater than 5.0% and Less than 5.5% . . . . . . . . . . . . . . . . . . . . . . . . . . . . . . . . . . . . . . . . . . . . . . . . . . . . . . . . . . . . . . . . . . . . . . . . . . . . . . . . . . . . . . . . . . . . . . . . . . . . . . 1 0.07Greater than 3.5% and Less than 4.0% . . . . . . . . . . . . . . . . . . . . . . . . . . . . . . . . . . . . . . . . . . . . . . . . . . . . . . . . . . . . . . . . . . . . . . . . . . . . . . . . . . . . . . . . . . . . . . . . . . . . . . 1 0.07Greater than 2.5% and Less than 3.0% . . . . . . . . . . . . . . . . . . . . . . . . . . . . . . . . . . . . . . . . . . . . . . . . . . . . . . . . . . . . . . . . . . . . . . . . . . . . . . . . . . . . . . . . . . . . . . . . . . . . . . 1 0.07Greater than 2.0% and Less than 2.5% . . . . . . . . . . . . . . . . . . . . . . . . . . . . . . . . . . . . . . . . . . . . . . . . . . . . . . . . . . . . . . . . . . . . . . . . . . . . . . . . . . . . . . . . . . . . . . . . . . . . . . 2 0.14Greater than 1.5% and Less than 2.0% . . . . . . . . . . . . . . . . . . . . . . . . . . . . . . . . . . . . . . . . . . . . . . . . . . . . . . . . . . . . . . . . . . . . . . . . . . . . . . . . . . . . . . . . . . . . . . . . . . . . . . 14 1.01Greater than 1.0% and Less than 1.5% . . . . . . . . . . . . . . . . . . . . . . . . . . . . . . . . . . . . . . . . . . . . . . . . . . . . . . . . . . . . . . . . . . . . . . . . . . . . . . . . . . . . . . . . . . . . . . . . . . . . . . 35 2.53Greater than 0.5% and Less than 1.0% . . . . . . . . . . . . . . . . . . . . . . . . . . . . . . . . . . . . . . . . . . . . . . . . . . . . . . . . . . . . . . . . . . . . . . . . . . . . . . . . . . . . . . . . . . . . . . . . . . . . . . 141 10.19Greater than 0.0% and Less than 0.5% . . . . . . . . . . . . . . . . . . . . . . . . . . . . . . . . . . . . . . . . . . . . . . . . . . . . . . . . . . . . . . . . . . . . . . . . . . . . . . . . . . . . . . . . . . . . . . . . . . . . . . 453 32.74At NAV. . . . . . . . . . . . . . . . . . . . . . . . . . . . . . . . . . . . . . . . . . . . . . . . . . . . . . . . . . . . . . . . . . . . . . . . . . . . . . . . . . . . . . . . . . . . . . . . . . . . . . . . . . . . . . . . . . . . . . . . . . . . . . . . . . . . . 10 0.72Less than 0.0% and Greater than –0.5%. . . . . . . . . . . . . . . . . . . . . . . . . . . . . . . . . . . . . . . . . . . . . . . . . . . . . . . . . . . . . . . . . . . . . . . . . . . . . . . . . . . . . . . . . . . . . . . . . . . . . 449 32.45Less than –0.5% and Greater than –1.0%. . . . . . . . . . . . . . . . . . . . . . . . . . . . . . . . . . . . . . . . . . . . . . . . . . . . . . . . . . . . . . . . . . . . . . . . . . . . . . . . . . . . . . . . . . . . . . . . . . . . 210 15.17Less than –1.0% and Greater than –1.5%. . . . . . . . . . . . . . . . . . . . . . . . . . . . . . . . . . . . . . . . . . . . . . . . . . . . . . . . . . . . . . . . . . . . . . . . . . . . . . . . . . . . . . . . . . . . . . . . . . . . 48 3.47Less than –1.5% and Greater than –2.0%. . . . . . . . . . . . . . . . . . . . . . . . . . . . . . . . . . . . . . . . . . . . . . . . . . . . . . . . . . . . . . . . . . . . . . . . . . . . . . . . . . . . . . . . . . . . . . . . . . . . 14 1.01Less than –2.0% and Greater than –2.5%. . . . . . . . . . . . . . . . . . . . . . . . . . . . . . . . . . . . . . . . . . . . . . . . . . . . . . . . . . . . . . . . . . . . . . . . . . . . . . . . . . . . . . . . . . . . . . . . . . . . 1 0.07Less than –3.0% and Greater than –3.5%. . . . . . . . . . . . . . . . . . . . . . . . . . . . . . . . . . . . . . . . . . . . . . . . . . . . . . . . . . . . . . . . . . . . . . . . . . . . . . . . . . . . . . . . . . . . . . . . . . . . 3 0.22
1,384 100.00%
Supplemental Information (unaudited) (continued)
S U P P L E M E N T A L I N F O R M A T I O N 87
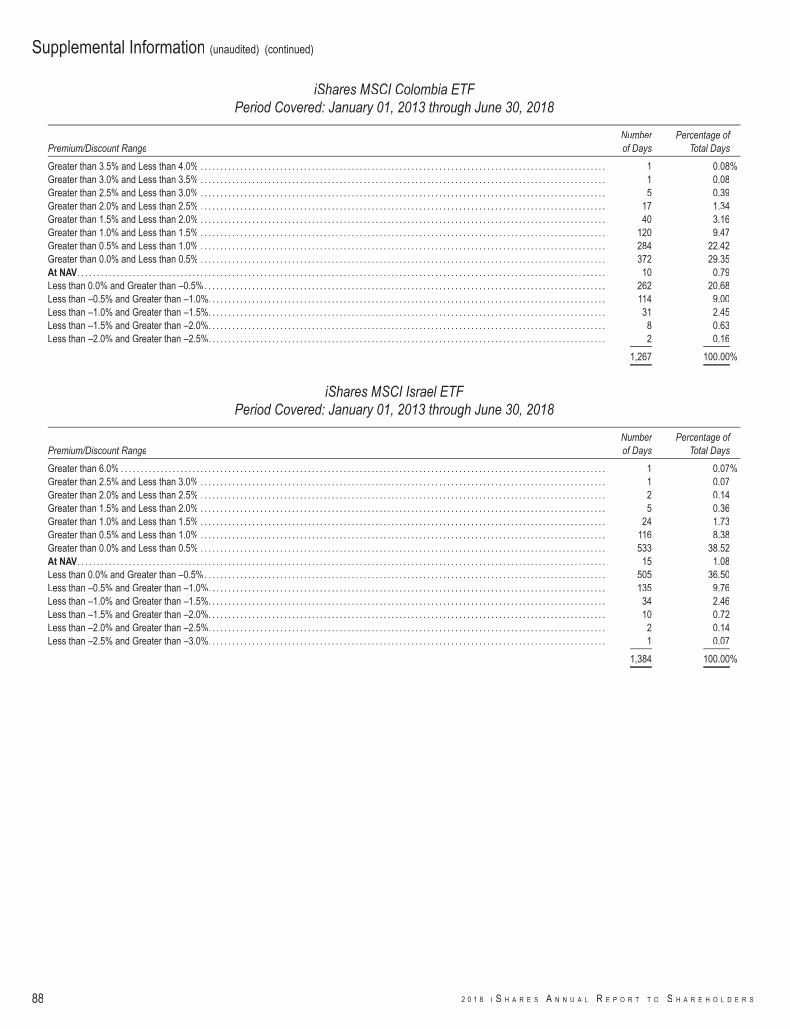
iShares MSCI Colombia ETFPeriod Covered: January 01, 2013 through June 30, 2018
Premium/Discount RangeNumberof Days
Percentage ofTotal Days
Greater than 3.5% and Less than 4.0% . . . . . . . . . . . . . . . . . . . . . . . . . . . . . . . . . . . . . . . . . . . . . . . . . . . . . . . . . . . . . . . . . . . . . . . . . . . . . . . . . . . . . . . . . . . . . . . . . . . . . . 1 0.08%Greater than 3.0% and Less than 3.5% . . . . . . . . . . . . . . . . . . . . . . . . . . . . . . . . . . . . . . . . . . . . . . . . . . . . . . . . . . . . . . . . . . . . . . . . . . . . . . . . . . . . . . . . . . . . . . . . . . . . . . 1 0.08Greater than 2.5% and Less than 3.0% . . . . . . . . . . . . . . . . . . . . . . . . . . . . . . . . . . . . . . . . . . . . . . . . . . . . . . . . . . . . . . . . . . . . . . . . . . . . . . . . . . . . . . . . . . . . . . . . . . . . . . 5 0.39Greater than 2.0% and Less than 2.5% . . . . . . . . . . . . . . . . . . . . . . . . . . . . . . . . . . . . . . . . . . . . . . . . . . . . . . . . . . . . . . . . . . . . . . . . . . . . . . . . . . . . . . . . . . . . . . . . . . . . . . 17 1.34Greater than 1.5% and Less than 2.0% . . . . . . . . . . . . . . . . . . . . . . . . . . . . . . . . . . . . . . . . . . . . . . . . . . . . . . . . . . . . . . . . . . . . . . . . . . . . . . . . . . . . . . . . . . . . . . . . . . . . . . 40 3.16Greater than 1.0% and Less than 1.5% . . . . . . . . . . . . . . . . . . . . . . . . . . . . . . . . . . . . . . . . . . . . . . . . . . . . . . . . . . . . . . . . . . . . . . . . . . . . . . . . . . . . . . . . . . . . . . . . . . . . . . 120 9.47Greater than 0.5% and Less than 1.0% . . . . . . . . . . . . . . . . . . . . . . . . . . . . . . . . . . . . . . . . . . . . . . . . . . . . . . . . . . . . . . . . . . . . . . . . . . . . . . . . . . . . . . . . . . . . . . . . . . . . . . 284 22.42Greater than 0.0% and Less than 0.5% . . . . . . . . . . . . . . . . . . . . . . . . . . . . . . . . . . . . . . . . . . . . . . . . . . . . . . . . . . . . . . . . . . . . . . . . . . . . . . . . . . . . . . . . . . . . . . . . . . . . . . 372 29.35At NAV. . . . . . . . . . . . . . . . . . . . . . . . . . . . . . . . . . . . . . . . . . . . . . . . . . . . . . . . . . . . . . . . . . . . . . . . . . . . . . . . . . . . . . . . . . . . . . . . . . . . . . . . . . . . . . . . . . . . . . . . . . . . . . . . . . . . . 10 0.79Less than 0.0% and Greater than –0.5%. . . . . . . . . . . . . . . . . . . . . . . . . . . . . . . . . . . . . . . . . . . . . . . . . . . . . . . . . . . . . . . . . . . . . . . . . . . . . . . . . . . . . . . . . . . . . . . . . . . . . 262 20.68Less than –0.5% and Greater than –1.0%. . . . . . . . . . . . . . . . . . . . . . . . . . . . . . . . . . . . . . . . . . . . . . . . . . . . . . . . . . . . . . . . . . . . . . . . . . . . . . . . . . . . . . . . . . . . . . . . . . . . 114 9.00Less than –1.0% and Greater than –1.5%. . . . . . . . . . . . . . . . . . . . . . . . . . . . . . . . . . . . . . . . . . . . . . . . . . . . . . . . . . . . . . . . . . . . . . . . . . . . . . . . . . . . . . . . . . . . . . . . . . . . 31 2.45Less than –1.5% and Greater than –2.0%. . . . . . . . . . . . . . . . . . . . . . . . . . . . . . . . . . . . . . . . . . . . . . . . . . . . . . . . . . . . . . . . . . . . . . . . . . . . . . . . . . . . . . . . . . . . . . . . . . . . 8 0.63Less than –2.0% and Greater than –2.5%. . . . . . . . . . . . . . . . . . . . . . . . . . . . . . . . . . . . . . . . . . . . . . . . . . . . . . . . . . . . . . . . . . . . . . . . . . . . . . . . . . . . . . . . . . . . . . . . . . . . 2 0.16
1,267 100.00%
iShares MSCI Israel ETFPeriod Covered: January 01, 2013 through June 30, 2018
Premium/Discount RangeNumberof Days
Percentage ofTotal Days
Greater than 6.0% . . . . . . . . . . . . . . . . . . . . . . . . . . . . . . . . . . . . . . . . . . . . . . . . . . . . . . . . . . . . . . . . . . . . . . . . . . . . . . . . . . . . . . . . . . . . . . . . . . . . . . . . . . . . . . . . . . . . . . . . . . 1 0.07%Greater than 2.5% and Less than 3.0% . . . . . . . . . . . . . . . . . . . . . . . . . . . . . . . . . . . . . . . . . . . . . . . . . . . . . . . . . . . . . . . . . . . . . . . . . . . . . . . . . . . . . . . . . . . . . . . . . . . . . . 1 0.07Greater than 2.0% and Less than 2.5% . . . . . . . . . . . . . . . . . . . . . . . . . . . . . . . . . . . . . . . . . . . . . . . . . . . . . . . . . . . . . . . . . . . . . . . . . . . . . . . . . . . . . . . . . . . . . . . . . . . . . . 2 0.14Greater than 1.5% and Less than 2.0% . . . . . . . . . . . . . . . . . . . . . . . . . . . . . . . . . . . . . . . . . . . . . . . . . . . . . . . . . . . . . . . . . . . . . . . . . . . . . . . . . . . . . . . . . . . . . . . . . . . . . . 5 0.36Greater than 1.0% and Less than 1.5% . . . . . . . . . . . . . . . . . . . . . . . . . . . . . . . . . . . . . . . . . . . . . . . . . . . . . . . . . . . . . . . . . . . . . . . . . . . . . . . . . . . . . . . . . . . . . . . . . . . . . . 24 1.73Greater than 0.5% and Less than 1.0% . . . . . . . . . . . . . . . . . . . . . . . . . . . . . . . . . . . . . . . . . . . . . . . . . . . . . . . . . . . . . . . . . . . . . . . . . . . . . . . . . . . . . . . . . . . . . . . . . . . . . . 116 8.38Greater than 0.0% and Less than 0.5% . . . . . . . . . . . . . . . . . . . . . . . . . . . . . . . . . . . . . . . . . . . . . . . . . . . . . . . . . . . . . . . . . . . . . . . . . . . . . . . . . . . . . . . . . . . . . . . . . . . . . . 533 38.52At NAV. . . . . . . . . . . . . . . . . . . . . . . . . . . . . . . . . . . . . . . . . . . . . . . . . . . . . . . . . . . . . . . . . . . . . . . . . . . . . . . . . . . . . . . . . . . . . . . . . . . . . . . . . . . . . . . . . . . . . . . . . . . . . . . . . . . . . 15 1.08Less than 0.0% and Greater than –0.5%. . . . . . . . . . . . . . . . . . . . . . . . . . . . . . . . . . . . . . . . . . . . . . . . . . . . . . . . . . . . . . . . . . . . . . . . . . . . . . . . . . . . . . . . . . . . . . . . . . . . . 505 36.50Less than –0.5% and Greater than –1.0%. . . . . . . . . . . . . . . . . . . . . . . . . . . . . . . . . . . . . . . . . . . . . . . . . . . . . . . . . . . . . . . . . . . . . . . . . . . . . . . . . . . . . . . . . . . . . . . . . . . . 135 9.76Less than –1.0% and Greater than –1.5%. . . . . . . . . . . . . . . . . . . . . . . . . . . . . . . . . . . . . . . . . . . . . . . . . . . . . . . . . . . . . . . . . . . . . . . . . . . . . . . . . . . . . . . . . . . . . . . . . . . . 34 2.46Less than –1.5% and Greater than –2.0%. . . . . . . . . . . . . . . . . . . . . . . . . . . . . . . . . . . . . . . . . . . . . . . . . . . . . . . . . . . . . . . . . . . . . . . . . . . . . . . . . . . . . . . . . . . . . . . . . . . . 10 0.72Less than –2.0% and Greater than –2.5%. . . . . . . . . . . . . . . . . . . . . . . . . . . . . . . . . . . . . . . . . . . . . . . . . . . . . . . . . . . . . . . . . . . . . . . . . . . . . . . . . . . . . . . . . . . . . . . . . . . . 2 0.14Less than –2.5% and Greater than –3.0%. . . . . . . . . . . . . . . . . . . . . . . . . . . . . . . . . . . . . . . . . . . . . . . . . . . . . . . . . . . . . . . . . . . . . . . . . . . . . . . . . . . . . . . . . . . . . . . . . . . . 1 0.07
1,384 100.00%
Supplemental Information (unaudited) (continued)
88 2 0 1 8 I S H A R E S A N N U A L R E P O R T T O S H A R E H O L D E R S
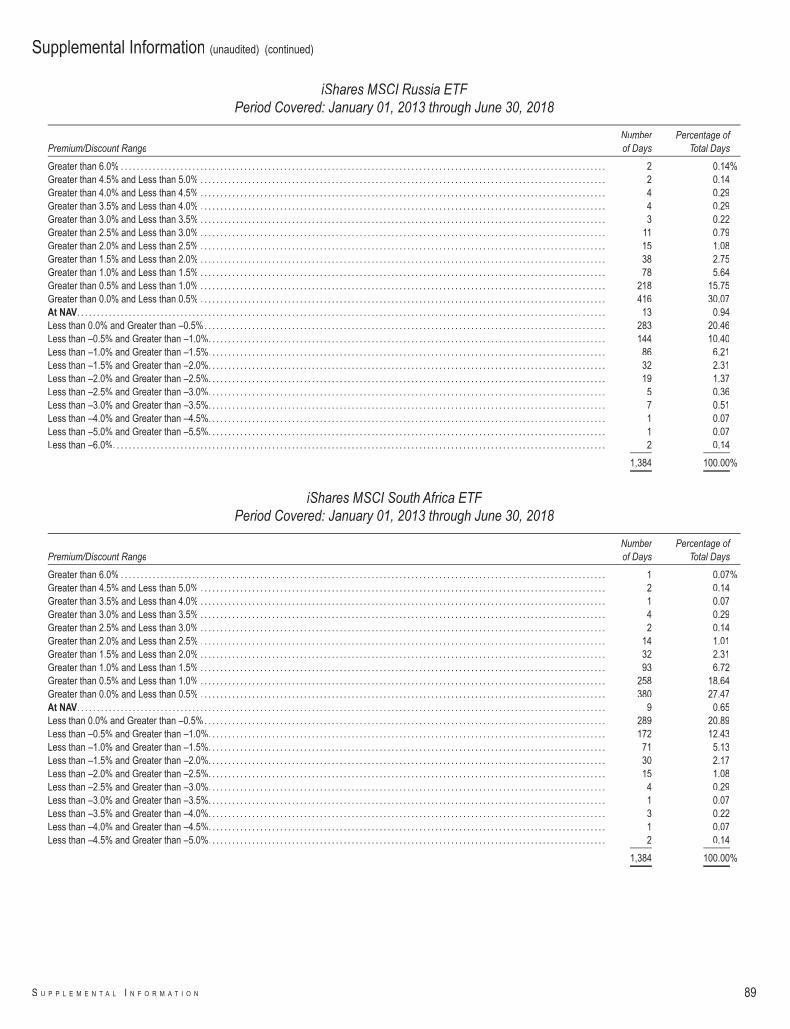
iShares MSCI Russia ETFPeriod Covered: January 01, 2013 through June 30, 2018
Premium/Discount RangeNumberof Days
Percentage ofTotal Days
Greater than 6.0% . . . . . . . . . . . . . . . . . . . . . . . . . . . . . . . . . . . . . . . . . . . . . . . . . . . . . . . . . . . . . . . . . . . . . . . . . . . . . . . . . . . . . . . . . . . . . . . . . . . . . . . . . . . . . . . . . . . . . . . . . . 2 0.14%Greater than 4.5% and Less than 5.0% . . . . . . . . . . . . . . . . . . . . . . . . . . . . . . . . . . . . . . . . . . . . . . . . . . . . . . . . . . . . . . . . . . . . . . . . . . . . . . . . . . . . . . . . . . . . . . . . . . . . . . 2 0.14Greater than 4.0% and Less than 4.5% . . . . . . . . . . . . . . . . . . . . . . . . . . . . . . . . . . . . . . . . . . . . . . . . . . . . . . . . . . . . . . . . . . . . . . . . . . . . . . . . . . . . . . . . . . . . . . . . . . . . . . 4 0.29Greater than 3.5% and Less than 4.0% . . . . . . . . . . . . . . . . . . . . . . . . . . . . . . . . . . . . . . . . . . . . . . . . . . . . . . . . . . . . . . . . . . . . . . . . . . . . . . . . . . . . . . . . . . . . . . . . . . . . . . 4 0.29Greater than 3.0% and Less than 3.5% . . . . . . . . . . . . . . . . . . . . . . . . . . . . . . . . . . . . . . . . . . . . . . . . . . . . . . . . . . . . . . . . . . . . . . . . . . . . . . . . . . . . . . . . . . . . . . . . . . . . . . 3 0.22Greater than 2.5% and Less than 3.0% . . . . . . . . . . . . . . . . . . . . . . . . . . . . . . . . . . . . . . . . . . . . . . . . . . . . . . . . . . . . . . . . . . . . . . . . . . . . . . . . . . . . . . . . . . . . . . . . . . . . . . 11 0.79Greater than 2.0% and Less than 2.5% . . . . . . . . . . . . . . . . . . . . . . . . . . . . . . . . . . . . . . . . . . . . . . . . . . . . . . . . . . . . . . . . . . . . . . . . . . . . . . . . . . . . . . . . . . . . . . . . . . . . . . 15 1.08Greater than 1.5% and Less than 2.0% . . . . . . . . . . . . . . . . . . . . . . . . . . . . . . . . . . . . . . . . . . . . . . . . . . . . . . . . . . . . . . . . . . . . . . . . . . . . . . . . . . . . . . . . . . . . . . . . . . . . . . 38 2.75Greater than 1.0% and Less than 1.5% . . . . . . . . . . . . . . . . . . . . . . . . . . . . . . . . . . . . . . . . . . . . . . . . . . . . . . . . . . . . . . . . . . . . . . . . . . . . . . . . . . . . . . . . . . . . . . . . . . . . . . 78 5.64Greater than 0.5% and Less than 1.0% . . . . . . . . . . . . . . . . . . . . . . . . . . . . . . . . . . . . . . . . . . . . . . . . . . . . . . . . . . . . . . . . . . . . . . . . . . . . . . . . . . . . . . . . . . . . . . . . . . . . . . 218 15.75Greater than 0.0% and Less than 0.5% . . . . . . . . . . . . . . . . . . . . . . . . . . . . . . . . . . . . . . . . . . . . . . . . . . . . . . . . . . . . . . . . . . . . . . . . . . . . . . . . . . . . . . . . . . . . . . . . . . . . . . 416 30.07At NAV. . . . . . . . . . . . . . . . . . . . . . . . . . . . . . . . . . . . . . . . . . . . . . . . . . . . . . . . . . . . . . . . . . . . . . . . . . . . . . . . . . . . . . . . . . . . . . . . . . . . . . . . . . . . . . . . . . . . . . . . . . . . . . . . . . . . . 13 0.94Less than 0.0% and Greater than –0.5%. . . . . . . . . . . . . . . . . . . . . . . . . . . . . . . . . . . . . . . . . . . . . . . . . . . . . . . . . . . . . . . . . . . . . . . . . . . . . . . . . . . . . . . . . . . . . . . . . . . . . 283 20.46Less than –0.5% and Greater than –1.0%. . . . . . . . . . . . . . . . . . . . . . . . . . . . . . . . . . . . . . . . . . . . . . . . . . . . . . . . . . . . . . . . . . . . . . . . . . . . . . . . . . . . . . . . . . . . . . . . . . . . 144 10.40Less than –1.0% and Greater than –1.5%. . . . . . . . . . . . . . . . . . . . . . . . . . . . . . . . . . . . . . . . . . . . . . . . . . . . . . . . . . . . . . . . . . . . . . . . . . . . . . . . . . . . . . . . . . . . . . . . . . . . 86 6.21Less than –1.5% and Greater than –2.0%. . . . . . . . . . . . . . . . . . . . . . . . . . . . . . . . . . . . . . . . . . . . . . . . . . . . . . . . . . . . . . . . . . . . . . . . . . . . . . . . . . . . . . . . . . . . . . . . . . . . 32 2.31Less than –2.0% and Greater than –2.5%. . . . . . . . . . . . . . . . . . . . . . . . . . . . . . . . . . . . . . . . . . . . . . . . . . . . . . . . . . . . . . . . . . . . . . . . . . . . . . . . . . . . . . . . . . . . . . . . . . . . 19 1.37Less than –2.5% and Greater than –3.0%. . . . . . . . . . . . . . . . . . . . . . . . . . . . . . . . . . . . . . . . . . . . . . . . . . . . . . . . . . . . . . . . . . . . . . . . . . . . . . . . . . . . . . . . . . . . . . . . . . . . 5 0.36Less than –3.0% and Greater than –3.5%. . . . . . . . . . . . . . . . . . . . . . . . . . . . . . . . . . . . . . . . . . . . . . . . . . . . . . . . . . . . . . . . . . . . . . . . . . . . . . . . . . . . . . . . . . . . . . . . . . . . 7 0.51Less than –4.0% and Greater than –4.5%. . . . . . . . . . . . . . . . . . . . . . . . . . . . . . . . . . . . . . . . . . . . . . . . . . . . . . . . . . . . . . . . . . . . . . . . . . . . . . . . . . . . . . . . . . . . . . . . . . . . 1 0.07Less than –5.0% and Greater than –5.5%. . . . . . . . . . . . . . . . . . . . . . . . . . . . . . . . . . . . . . . . . . . . . . . . . . . . . . . . . . . . . . . . . . . . . . . . . . . . . . . . . . . . . . . . . . . . . . . . . . . . 1 0.07Less than –6.0%. . . . . . . . . . . . . . . . . . . . . . . . . . . . . . . . . . . . . . . . . . . . . . . . . . . . . . . . . . . . . . . . . . . . . . . . . . . . . . . . . . . . . . . . . . . . . . . . . . . . . . . . . . . . . . . . . . . . . . . . . . . . 2 0.14
1,384 100.00%
iShares MSCI South Africa ETFPeriod Covered: January 01, 2013 through June 30, 2018
Premium/Discount RangeNumberof Days
Percentage ofTotal Days
Greater than 6.0% . . . . . . . . . . . . . . . . . . . . . . . . . . . . . . . . . . . . . . . . . . . . . . . . . . . . . . . . . . . . . . . . . . . . . . . . . . . . . . . . . . . . . . . . . . . . . . . . . . . . . . . . . . . . . . . . . . . . . . . . . . 1 0.07%Greater than 4.5% and Less than 5.0% . . . . . . . . . . . . . . . . . . . . . . . . . . . . . . . . . . . . . . . . . . . . . . . . . . . . . . . . . . . . . . . . . . . . . . . . . . . . . . . . . . . . . . . . . . . . . . . . . . . . . . 2 0.14Greater than 3.5% and Less than 4.0% . . . . . . . . . . . . . . . . . . . . . . . . . . . . . . . . . . . . . . . . . . . . . . . . . . . . . . . . . . . . . . . . . . . . . . . . . . . . . . . . . . . . . . . . . . . . . . . . . . . . . . 1 0.07Greater than 3.0% and Less than 3.5% . . . . . . . . . . . . . . . . . . . . . . . . . . . . . . . . . . . . . . . . . . . . . . . . . . . . . . . . . . . . . . . . . . . . . . . . . . . . . . . . . . . . . . . . . . . . . . . . . . . . . . 4 0.29Greater than 2.5% and Less than 3.0% . . . . . . . . . . . . . . . . . . . . . . . . . . . . . . . . . . . . . . . . . . . . . . . . . . . . . . . . . . . . . . . . . . . . . . . . . . . . . . . . . . . . . . . . . . . . . . . . . . . . . . 2 0.14Greater than 2.0% and Less than 2.5% . . . . . . . . . . . . . . . . . . . . . . . . . . . . . . . . . . . . . . . . . . . . . . . . . . . . . . . . . . . . . . . . . . . . . . . . . . . . . . . . . . . . . . . . . . . . . . . . . . . . . . 14 1.01Greater than 1.5% and Less than 2.0% . . . . . . . . . . . . . . . . . . . . . . . . . . . . . . . . . . . . . . . . . . . . . . . . . . . . . . . . . . . . . . . . . . . . . . . . . . . . . . . . . . . . . . . . . . . . . . . . . . . . . . 32 2.31Greater than 1.0% and Less than 1.5% . . . . . . . . . . . . . . . . . . . . . . . . . . . . . . . . . . . . . . . . . . . . . . . . . . . . . . . . . . . . . . . . . . . . . . . . . . . . . . . . . . . . . . . . . . . . . . . . . . . . . . 93 6.72Greater than 0.5% and Less than 1.0% . . . . . . . . . . . . . . . . . . . . . . . . . . . . . . . . . . . . . . . . . . . . . . . . . . . . . . . . . . . . . . . . . . . . . . . . . . . . . . . . . . . . . . . . . . . . . . . . . . . . . . 258 18.64Greater than 0.0% and Less than 0.5% . . . . . . . . . . . . . . . . . . . . . . . . . . . . . . . . . . . . . . . . . . . . . . . . . . . . . . . . . . . . . . . . . . . . . . . . . . . . . . . . . . . . . . . . . . . . . . . . . . . . . . 380 27.47At NAV. . . . . . . . . . . . . . . . . . . . . . . . . . . . . . . . . . . . . . . . . . . . . . . . . . . . . . . . . . . . . . . . . . . . . . . . . . . . . . . . . . . . . . . . . . . . . . . . . . . . . . . . . . . . . . . . . . . . . . . . . . . . . . . . . . . . . 9 0.65Less than 0.0% and Greater than –0.5%. . . . . . . . . . . . . . . . . . . . . . . . . . . . . . . . . . . . . . . . . . . . . . . . . . . . . . . . . . . . . . . . . . . . . . . . . . . . . . . . . . . . . . . . . . . . . . . . . . . . . 289 20.89Less than –0.5% and Greater than –1.0%. . . . . . . . . . . . . . . . . . . . . . . . . . . . . . . . . . . . . . . . . . . . . . . . . . . . . . . . . . . . . . . . . . . . . . . . . . . . . . . . . . . . . . . . . . . . . . . . . . . . 172 12.43Less than –1.0% and Greater than –1.5%. . . . . . . . . . . . . . . . . . . . . . . . . . . . . . . . . . . . . . . . . . . . . . . . . . . . . . . . . . . . . . . . . . . . . . . . . . . . . . . . . . . . . . . . . . . . . . . . . . . . 71 5.13Less than –1.5% and Greater than –2.0%. . . . . . . . . . . . . . . . . . . . . . . . . . . . . . . . . . . . . . . . . . . . . . . . . . . . . . . . . . . . . . . . . . . . . . . . . . . . . . . . . . . . . . . . . . . . . . . . . . . . 30 2.17Less than –2.0% and Greater than –2.5%. . . . . . . . . . . . . . . . . . . . . . . . . . . . . . . . . . . . . . . . . . . . . . . . . . . . . . . . . . . . . . . . . . . . . . . . . . . . . . . . . . . . . . . . . . . . . . . . . . . . 15 1.08Less than –2.5% and Greater than –3.0%. . . . . . . . . . . . . . . . . . . . . . . . . . . . . . . . . . . . . . . . . . . . . . . . . . . . . . . . . . . . . . . . . . . . . . . . . . . . . . . . . . . . . . . . . . . . . . . . . . . . 4 0.29Less than –3.0% and Greater than –3.5%. . . . . . . . . . . . . . . . . . . . . . . . . . . . . . . . . . . . . . . . . . . . . . . . . . . . . . . . . . . . . . . . . . . . . . . . . . . . . . . . . . . . . . . . . . . . . . . . . . . . 1 0.07Less than –3.5% and Greater than –4.0%. . . . . . . . . . . . . . . . . . . . . . . . . . . . . . . . . . . . . . . . . . . . . . . . . . . . . . . . . . . . . . . . . . . . . . . . . . . . . . . . . . . . . . . . . . . . . . . . . . . . 3 0.22Less than –4.0% and Greater than –4.5%. . . . . . . . . . . . . . . . . . . . . . . . . . . . . . . . . . . . . . . . . . . . . . . . . . . . . . . . . . . . . . . . . . . . . . . . . . . . . . . . . . . . . . . . . . . . . . . . . . . . 1 0.07Less than –4.5% and Greater than –5.0%. . . . . . . . . . . . . . . . . . . . . . . . . . . . . . . . . . . . . . . . . . . . . . . . . . . . . . . . . . . . . . . . . . . . . . . . . . . . . . . . . . . . . . . . . . . . . . . . . . . . 2 0.14
1,384 100.00%
Supplemental Information (unaudited) (continued)
S U P P L E M E N T A L I N F O R M A T I O N 89
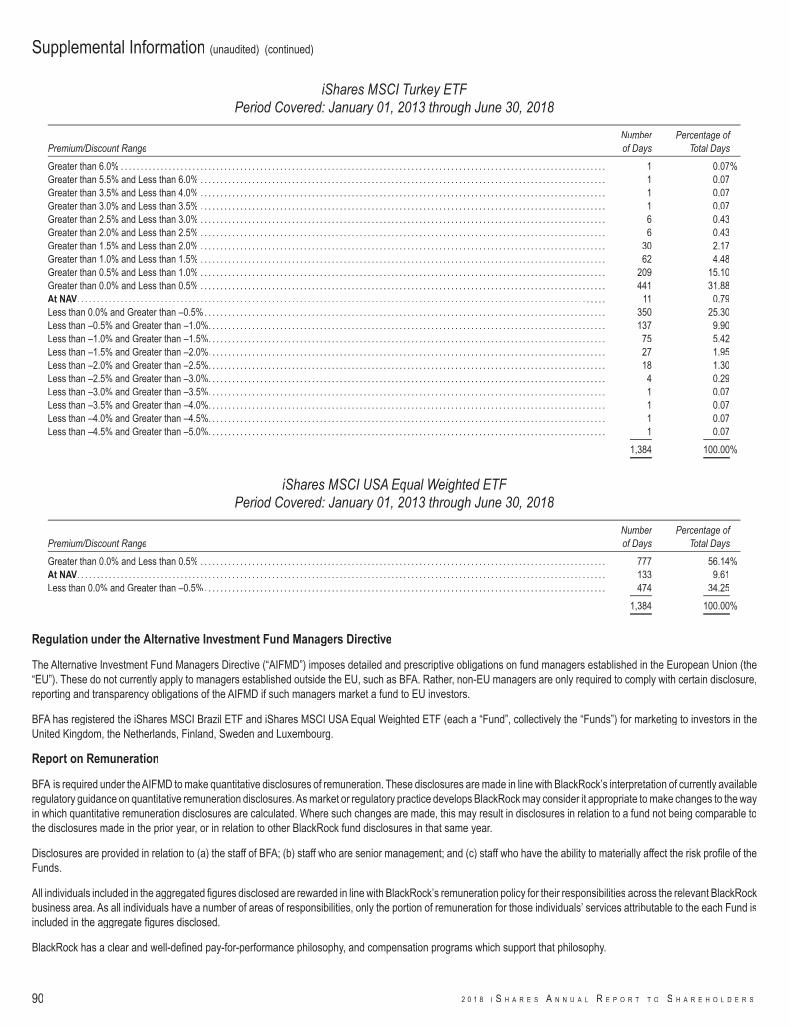
iShares MSCI Turkey ETFPeriod Covered: January 01, 2013 through June 30, 2018
Premium/Discount RangeNumberof Days
Percentage ofTotal Days
Greater than 6.0% . . . . . . . . . . . . . . . . . . . . . . . . . . . . . . . . . . . . . . . . . . . . . . . . . . . . . . . . . . . . . . . . . . . . . . . . . . . . . . . . . . . . . . . . . . . . . . . . . . . . . . . . . . . . . . . . . . . . . . . . . . 1 0.07%Greater than 5.5% and Less than 6.0% . . . . . . . . . . . . . . . . . . . . . . . . . . . . . . . . . . . . . . . . . . . . . . . . . . . . . . . . . . . . . . . . . . . . . . . . . . . . . . . . . . . . . . . . . . . . . . . . . . . . . . 1 0.07Greater than 3.5% and Less than 4.0% . . . . . . . . . . . . . . . . . . . . . . . . . . . . . . . . . . . . . . . . . . . . . . . . . . . . . . . . . . . . . . . . . . . . . . . . . . . . . . . . . . . . . . . . . . . . . . . . . . . . . . 1 0.07Greater than 3.0% and Less than 3.5% . . . . . . . . . . . . . . . . . . . . . . . . . . . . . . . . . . . . . . . . . . . . . . . . . . . . . . . . . . . . . . . . . . . . . . . . . . . . . . . . . . . . . . . . . . . . . . . . . . . . . . 1 0.07Greater than 2.5% and Less than 3.0% . . . . . . . . . . . . . . . . . . . . . . . . . . . . . . . . . . . . . . . . . . . . . . . . . . . . . . . . . . . . . . . . . . . . . . . . . . . . . . . . . . . . . . . . . . . . . . . . . . . . . . 6 0.43Greater than 2.0% and Less than 2.5% . . . . . . . . . . . . . . . . . . . . . . . . . . . . . . . . . . . . . . . . . . . . . . . . . . . . . . . . . . . . . . . . . . . . . . . . . . . . . . . . . . . . . . . . . . . . . . . . . . . . . . 6 0.43Greater than 1.5% and Less than 2.0% . . . . . . . . . . . . . . . . . . . . . . . . . . . . . . . . . . . . . . . . . . . . . . . . . . . . . . . . . . . . . . . . . . . . . . . . . . . . . . . . . . . . . . . . . . . . . . . . . . . . . . 30 2.17Greater than 1.0% and Less than 1.5% . . . . . . . . . . . . . . . . . . . . . . . . . . . . . . . . . . . . . . . . . . . . . . . . . . . . . . . . . . . . . . . . . . . . . . . . . . . . . . . . . . . . . . . . . . . . . . . . . . . . . . 62 4.48Greater than 0.5% and Less than 1.0% . . . . . . . . . . . . . . . . . . . . . . . . . . . . . . . . . . . . . . . . . . . . . . . . . . . . . . . . . . . . . . . . . . . . . . . . . . . . . . . . . . . . . . . . . . . . . . . . . . . . . . 209 15.10Greater than 0.0% and Less than 0.5% . . . . . . . . . . . . . . . . . . . . . . . . . . . . . . . . . . . . . . . . . . . . . . . . . . . . . . . . . . . . . . . . . . . . . . . . . . . . . . . . . . . . . . . . . . . . . . . . . . . . . . 441 31.88At NAV. . . . . . . . . . . . . . . . . . . . . . . . . . . . . . . . . . . . . . . . . . . . . . . . . . . . . . . . . . . . . . . . . . . . . . . . . . . . . . . . . . . . . . . . . . . . . . . . . . . . . . . . . . . . . . . . . . . . . . . . . . . . . . . . . . . . . 11 0.79Less than 0.0% and Greater than –0.5%. . . . . . . . . . . . . . . . . . . . . . . . . . . . . . . . . . . . . . . . . . . . . . . . . . . . . . . . . . . . . . . . . . . . . . . . . . . . . . . . . . . . . . . . . . . . . . . . . . . . . 350 25.30Less than –0.5% and Greater than –1.0%. . . . . . . . . . . . . . . . . . . . . . . . . . . . . . . . . . . . . . . . . . . . . . . . . . . . . . . . . . . . . . . . . . . . . . . . . . . . . . . . . . . . . . . . . . . . . . . . . . . . 137 9.90Less than –1.0% and Greater than –1.5%. . . . . . . . . . . . . . . . . . . . . . . . . . . . . . . . . . . . . . . . . . . . . . . . . . . . . . . . . . . . . . . . . . . . . . . . . . . . . . . . . . . . . . . . . . . . . . . . . . . . 75 5.42Less than –1.5% and Greater than –2.0%. . . . . . . . . . . . . . . . . . . . . . . . . . . . . . . . . . . . . . . . . . . . . . . . . . . . . . . . . . . . . . . . . . . . . . . . . . . . . . . . . . . . . . . . . . . . . . . . . . . . 27 1.95Less than –2.0% and Greater than –2.5%. . . . . . . . . . . . . . . . . . . . . . . . . . . . . . . . . . . . . . . . . . . . . . . . . . . . . . . . . . . . . . . . . . . . . . . . . . . . . . . . . . . . . . . . . . . . . . . . . . . . 18 1.30Less than –2.5% and Greater than –3.0%. . . . . . . . . . . . . . . . . . . . . . . . . . . . . . . . . . . . . . . . . . . . . . . . . . . . . . . . . . . . . . . . . . . . . . . . . . . . . . . . . . . . . . . . . . . . . . . . . . . . 4 0.29Less than –3.0% and Greater than –3.5%. . . . . . . . . . . . . . . . . . . . . . . . . . . . . . . . . . . . . . . . . . . . . . . . . . . . . . . . . . . . . . . . . . . . . . . . . . . . . . . . . . . . . . . . . . . . . . . . . . . . 1 0.07Less than –3.5% and Greater than –4.0%. . . . . . . . . . . . . . . . . . . . . . . . . . . . . . . . . . . . . . . . . . . . . . . . . . . . . . . . . . . . . . . . . . . . . . . . . . . . . . . . . . . . . . . . . . . . . . . . . . . . 1 0.07Less than –4.0% and Greater than –4.5%. . . . . . . . . . . . . . . . . . . . . . . . . . . . . . . . . . . . . . . . . . . . . . . . . . . . . . . . . . . . . . . . . . . . . . . . . . . . . . . . . . . . . . . . . . . . . . . . . . . . 1 0.07Less than –4.5% and Greater than –5.0%. . . . . . . . . . . . . . . . . . . . . . . . . . . . . . . . . . . . . . . . . . . . . . . . . . . . . . . . . . . . . . . . . . . . . . . . . . . . . . . . . . . . . . . . . . . . . . . . . . . . 1 0.07
1,384 100.00%
iShares MSCI USA Equal Weighted ETFPeriod Covered: January 01, 2013 through June 30, 2018
Premium/Discount RangeNumberof Days
Percentage ofTotal Days
Greater than 0.0% and Less than 0.5% . . . . . . . . . . . . . . . . . . . . . . . . . . . . . . . . . . . . . . . . . . . . . . . . . . . . . . . . . . . . . . . . . . . . . . . . . . . . . . . . . . . . . . . . . . . . . . . . . . . . . . 777 56.14%At NAV. . . . . . . . . . . . . . . . . . . . . . . . . . . . . . . . . . . . . . . . . . . . . . . . . . . . . . . . . . . . . . . . . . . . . . . . . . . . . . . . . . . . . . . . . . . . . . . . . . . . . . . . . . . . . . . . . . . . . . . . . . . . . . . . . . . . . 133 9.61Less than 0.0% and Greater than –0.5%. . . . . . . . . . . . . . . . . . . . . . . . . . . . . . . . . . . . . . . . . . . . . . . . . . . . . . . . . . . . . . . . . . . . . . . . . . . . . . . . . . . . . . . . . . . . . . . . . . . . . 474 34.25
1,384 100.00%
Regulation under the Alternative Investment Fund Managers Directive
The Alternative Investment Fund Managers Directive (“AIFMD”) imposes detailed and prescriptive obligations on fund managers established in the European Union (the“EU”). These do not currently apply to managers established outside the EU, such as BFA. Rather, non-EU managers are only required to comply with certain disclosure,reporting and transparency obligations of the AIFMD if such managers market a fund to EU investors.
BFA has registered the iShares MSCI Brazil ETF and iShares MSCI USA Equal Weighted ETF (each a “Fund”, collectively the “Funds”) for marketing to investors in theUnited Kingdom, the Netherlands, Finland, Sweden and Luxembourg.
Report on Remuneration
BFA is required under the AIFMD to make quantitative disclosures of remuneration. These disclosures are made in line with BlackRock’s interpretation of currently availableregulatory guidance on quantitative remuneration disclosures.As market or regulatory practice develops BlackRock may consider it appropriate to make changes to the wayin which quantitative remuneration disclosures are calculated. Where such changes are made, this may result in disclosures in relation to a fund not being comparable tothe disclosures made in the prior year, or in relation to other BlackRock fund disclosures in that same year.
Disclosures are provided in relation to (a) the staff of BFA; (b) staff who are senior management; and (c) staff who have the ability to materially affect the risk profile of theFunds.
All individuals included in the aggregated figures disclosed are rewarded in line with BlackRock’s remuneration policy for their responsibilities across the relevant BlackRockbusiness area. As all individuals have a number of areas of responsibilities, only the portion of remuneration for those individuals’ services attributable to the each Fund isincluded in the aggregate figures disclosed.
BlackRock has a clear and well-defined pay-for-performance philosophy, and compensation programs which support that philosophy.
Supplemental Information (unaudited) (continued)
90 2 0 1 8 I S H A R E S A N N U A L R E P O R T T O S H A R E H O L D E R S
BlackRock operates a total compensation model for remuneration which includes a base salary, which is contractual, and a discretionary bonus scheme. Although allemployees are eligible to receive a discretionary bonus, there is no contractual obligation to make a discretionary bonus award to any employees. For senior management,a significant percentage of variable remuneration is deferred over time. All employees are subject to a claw-back policy.
Remuneration decisions for employees are made once annually in January following the end of the performance year, based on BlackRock’s full-year financial results andother non-financial goals and objectives. Alongside financial performance, individual total compensation is also based on strategic and operating results and otherconsiderations such as management and leadership capabilities. No set formulas are established and no fixed benchmarks are used in determining annual incentiveawards.
Annual incentive awards are paid from a bonus pool which is reviewed throughout the year by BlackRock's independent compensation committee, taking into account bothactual and projected financial information together with information provided by the Enterprise Risk and Regulatory Compliance departments in relation to any activities,incidents or events that warrant consideration in making compensation decisions. Individuals are not involved in setting their own remuneration.
Each of the control functions (Enterprise Risk, Legal & Compliance, and Internal Audit) each have their own organizational structures which are independent of the businessunits. Functional bonus pools for those control functions are determined with reference to the performance of each individual function and the remuneration of the seniormembers of control functions is directly overseen by BlackRock's independent compensation committee.
Members of staff and senior management of BFA typically provide both AIFMD and non-AIFMD related services in respect of multiple funds, clients and functions of BFAand across the broader BlackRock group. Therefore, the figures disclosed are a sum of each individual’s portion of remuneration attributable to the each Fund accordingto an objective apportionment methodology which acknowledges the multiple-service nature of BFA. Accordingly the figures are not representative of any individual’s actualremuneration or their remuneration structure.
The amount of the total remuneration awarded by BFA to its staff which has been attributed to the iShares MSCI Brazil ETF in respect of BFA’s financial year endingDecember 31, 2017 was USD 720.72 thousand. This figure is comprised of fixed remuneration of USD 287.27 thousand and variable remuneration of USD433.45 thousand. There were a total of 417 beneficiaries of the remuneration described above.
The amount of the aggregate remuneration awarded by BFA, which has been attributed to the iShares MSCI Brazil ETF in respect of BFA’s financial year endingDecember 31, 2017, to its senior management was USD 100.83 thousand, and to members of its staff whose actions have a material impact on the risk profile of the Fundwas USD 18.78 thousand.
The amount of the total remuneration awarded by BFA to its staff which has been attributed to the iShares MSCI USA Equal Weighted ETF in respect of BFA’s financial yearending December 31, 2017 was USD 12.56 thousand. This figure is comprised of fixed remuneration of USD 5.01 thousand and variable remuneration of USD7.55 thousand. There were a total of 417 beneficiaries of the remuneration described above.
The amount of the aggregate remuneration awarded by BFA, which has been attributed to the iShares MSCI USA Equal Weighted ETF in respect of BFA’s financial yearending December 31, 2017, to its senior management was USD 1.76 thousand, and to members of its staff whose actions have a material impact on the risk profile of theFund was USD 0.33 thousand.
Supplemental Information (unaudited) (continued)
S U P P L E M E N T A L I N F O R M A T I O N 91
The Board of Directors has responsibility for the overall management and operations of the Funds, including general supervision of the duties performed by BFA and otherservice providers. Each Director serves until he or she resigns, is removed, dies, retires or becomes incapacitated. Each officer shall hold office until his or her successoris elected and qualifies or until his or her death, resignation or removal. Directors who are not “interested persons” (as defined in the 1940 Act) of the Company are referredto as independent directors (“Independent Directors”).
The registered investment companies advised by BFA or its affiliates (the “BlackRock-advised Funds”) are organized into one complex of closed-end funds, two complexesof open-end funds and one complex of exchange-traded funds (“Exchange-Traded Fund Complex”) (each, a “BlackRock Fund Complex”). Each Fund is included in theBlackRock Fund Complex referred to as the Exchange-Traded Fund Complex. Each Director also serves as a Trustee of iShares Trust and a Trustee of iShares U.S. ETFTrust and, as a result, oversees all of the funds within the Exchange-Traded Fund Complex, which consists of 343 funds as of August 31, 2018. With the exception of RobertS. Kapito, Mark K. Wiedman, Charles Park, Martin Small and Benjamin Archibald, the address of each Director and officer is c/o BlackRock, Inc., 400 Howard Street, SanFrancisco, CA 94105. The address of Mr. Kapito, Mr. Wiedman, Mr. Park, Mr. Small and Mr. Archibald is c/o BlackRock, Inc., Park Avenue Plaza, 55 East 52nd Street, NewYork, NY 10055. The Board has designated Cecilia H. Herbert as its Independent Board Chair. Additional information about the Funds’ Directors and officers may be foundin the Funds’ combined Statement of Additional Information, which is available without charge, upon request, by calling toll-free 1-800-iShares (1-800-474-2737).
Interested Directors
Name (Age) Position(s)Principal Occupation(s)During the Past 5 Years Other Directorships Held by Director
Robert S. Kapito(a) (61) Director (since 2009). President, BlackRock, Inc. (since 2006); Vice Chairmanof BlackRock, Inc. and Head of BlackRock’s PortfolioManagement Group (since its formation in 1998) andBlackRock, Inc.’s predecessor entities (since 1988);Trustee, University of Pennsylvania (since 2009);President of Board of Directors, Hope & HeroesChildren’s Cancer Fund (since 2002).
Director of BlackRock, Inc. (since 2006); Trustee ofiShares Trust (since 2009); Trustee of iShares U.S. ETFTrust (since 2011).
Mark K. Wiedman(b) (47) Director (since 2013). Senior Managing Director, BlackRock, Inc. (since 2014);Managing Director, BlackRock, Inc. (2007-2014); GlobalHead of BlackRock’s ETF and Index InvestmentsBusiness (since 2016); Global Head of iShares(2011-2016); Head of Corporate Strategy, BlackRock, Inc.(2009-2011).
Trustee of iShares Trust (since 2013); Trustee of iSharesU.S. ETF Trust (since 2013); Director of PennyMacFinancial Services, Inc. (since 2008).
(a) Robert S. Kapito is deemed to be an “interested person” (as defined in the 1940 Act) of the Company due to his affiliations with BlackRock, Inc. and its affiliates.ff(b) Mark K. Wiedman is deemed to be an “interested person” (as defined in the 1940 Act) of the Company due to his affiliations with BlackRock, Inc. and its affiliates.
Independent Directors
Name (Age) Position(s)Principal Occupation(s)During the Past 5 Years Other Directorships Held by Director
Cecilia H. Herbert (69) Director (since 2005);Independent BoardChair (since 2016).
Trustee and Member of the Finance, Technology andQuality Committee of Stanford Health Care (since 2016);Trustee and Member of the Investment Committee,WNET, a New York public media company (since 2011);Chair (1994-2005) and Member (since 1992) of theInvestment Committee, Archdiocese of San Francisco;Director (1998-2013) and President (2007-2011) of theBoard of Directors, Catholic Charities CYO; Trustee(2002-2011) and Chair of the Finance and InvestmentCommittee (2006-2010) of the Thacher School.
Trustee of iShares Trust (since 2005); Trustee of iSharesU.S. ETF Trust (since 2011); Independent Board Chair ofiShares Trust and iShares U.S. ETF Trust (since 2016);Trustee of Forward Funds (14 portfolios) (since 2009);Trustee of Salient MF Trust (4 portfolios) (since 2015).
Jane D. Carlin (62) Director (since 2015);Risk Committee Chair(since 2016).
Consultant (since 2012); Managing Director and GlobalHead of Financial Holding Company Governance &Assurance and the Global Head of Operational RiskManagement of Morgan Stanley (2006-2012).
Trustee of iShares Trust (since 2015); Trustee of iSharesU.S. ETF Trust (since 2015); Director of PHH Corporation(mortgage solutions) (since 2012); Director of TheHanover Insurance Group, Inc. (since 2016).
Richard L. Fagnani (63) Director (since 2017);Equity PlusCommittee Chair(since 2017).
Partner, KPMG LLP (2002-2016). Trustee of iShares Trust (since 2017); Trustee of iSharesU.S. ETF Trust (since 2017).
Director and Officer Information
92 2 0 1 8 I S H A R E S A N N U A L R E P O R T T O S H A R E H O L D E R S
Independent Directors (continued)
Name (Age) Position(s)Principal Occupation(s)During the Past 5 Years Other Directorships Held by Director
Charles A. Hurty (74) Director (since 2005);Audit Committee Chair(since 2006).
Retired; Partner, KPMG LLP (1968-2001). Trustee of iShares Trust (since 2005); Trustee of iSharesU.S. ETF Trust (since 2011); Director of SkyBridgeAlternative Investments Multi-Adviser Hedge FundPortfolios LLC (2 portfolios) (since 2002).
John E. Kerrigan (63) Director (since 2005);Securities LendingCommittee Chair(since 2016).
Chief Investment Officer, Santa Clara University (since2002).
Trustee of iShares Trust (since 2005); Trustee of iSharesU.S. ETF Trust (since 2011).
Drew E. Lawton (59) Director (since 2017);15(c) Committee Chair(since 2017)
Senior Managing Director of New York Life InsuranceCompany (2010-2015).
Trustee of iShares Trust (since 2017); Trustee of iSharesU.S. ETF Trust (since 2017).
John E. Martinez (57) Director (since 2003);Fixed Income PlusCommittee Chair(since 2016).
Director of Real Estate Equity Exchange, Inc. (since2005).
Trustee of iShares Trust (since 2003); Trustee of iSharesU.S. ETF Trust (since 2011).
Madhav V. Rajan (54) Director (since 2011);Nominating andGovernanceCommittee Chair(since 2017).
Dean, and George Pratt Shultz Professor of Accounting,University of Chicago Booth School of Business (since2017); Robert K. Jaedicke Professor of Accounting,Stanford University Graduate School of Business(2001-2017); Professor of Law (by courtesy), StanfordLaw School (2005-2017); Senior Associate Dean forAcademic Affairs and Head of MBA Program, StanfordUniversity Graduate School of Business (2010-2016).
Trustee of iShares Trust (since 2011); Trustee of iSharesU.S. ETF Trust (since 2011).
Officers
Name (Age) Position(s)Principal Occupation(s)During the Past 5 Years
Martin Small (43) President (since2016).
Managing Director, BlackRock, Inc. (since 2010); Head of U.S. iShares (since 2015); Co-Head of the U.S. FinancialMarkets Advisory Group, BlackRock, Inc. (2008-2014).
Jack Gee (58) Treasurer and ChiefFinancial Officer(since 2008).
Managing Director, BlackRock, Inc. (since 2009); Senior Director of Fund Administration of Intermediary InvestorBusiness, BGI (2009).
Charles Park (51) Chief ComplianceOfficer (since 2006).
Chief Compliance Officer of BlackRock Advisors, LLC and the BlackRock-advised Funds in the Equity-Bond Complex,the Equity-Liquidity Complex and the Closed-End Complex (since 2014); Chief Compliance Officer of BFA (since 2006).
Benjamin Archibald (43) Secretary (since2015).
Managing Director, BlackRock, Inc. (since 2014); Director, BlackRock, Inc. (2010-2013); Secretary of theBlackRock-advised Mutual Funds (since 2012).
Steve Messinger (56) Executive VicePresident (since2016).
Managing Director, BlackRock, Inc. (2007-2014 and since 2016); Managing Director, Beacon Consulting Group(2014-2016).
Scott Radell (49) Executive VicePresident (since2012).
Managing Director, BlackRock, Inc. (since 2009); Head of Portfolio Solutions, BlackRock, Inc. (since 2009).
Alan Mason (57) Executive VicePresident (since2016).
Managing Director, BlackRock, Inc. (since 2009).
Director and Officer Information (continued)
D I R E C T O R A N D O F F I C E R I N F O R M A T I O N 93
Electronic Delivery
Shareholders can sign up for email notifications announcing that the shareholder report or prospectus has been posted on the iShares website at www.iShares.com. Onceyou have enrolled, you will no longer receive prospectuses and shareholder reports in the mail.
To enroll in electronic delivery
• Go to www.icsdelivery.com.• If your brokerage firm is not listed, electronic delivery may not be available. Please contact your broker-dealer or financial advisor.
Householding
Householding is an option available to certain fund investors. Householding is a method of delivery, based on the preference of the individual investor, in which a single copyof certain shareholder documents can be delivered to investors who share the same address, even if their accounts are registered under different names. Please contactyour broker-dealer if you are interested in enrolling in householding and receiving a single copy of prospectuses and other shareholder documents, or if you are currentlyenrolled in householding and wish to change your householding status.
Availability of Quarterly Schedule of Investments
The iShares Funds file their complete schedule of portfolio holdings with the SEC for the first and third quarters of each fiscal year on Form N-Q. The iShares Funds’ FormsN-Q are available on the SEC’s website at www.sec.gov and may be reviewed and copied at the SEC’s Public Reference Room in Washington, D.C. Information on theoperation of the Public Reference Room may be obtained by calling 1-800-SEC-0330. The iShares Funds also disclose their complete schedule of portfolio holdings on adaily basis on the iShares website at www.iShares.com.
Availability of Proxy Voting Policies and Proxy Voting Records
A description of the policies and procedures that iShares Funds use to determine how to vote proxies relating to portfolio securities and information about how the iSharesFunds voted proxies relating to portfolio securities during the most recent twelve-month period ending June 30 is available without charge, upon request (1) by callingtoll-free 1-800-474-2737; (2) on the iShares website at www.iShares.com; and (3) on the SEC website at www.sec.gov.
General Information
94 2 0 1 8 I S H A R E S A N N U A L R E P O R T T O S H A R E H O L D E R S
Portfolio Abbreviations - Equity
ADR American Depositary Receipt
GDR Global Depositary Receipt
NVS Non-Voting Shares
Glossary of Terms Used in this Report
G L O S S A R Y O F T E R M S U S E D I N T H I S R E P O R T 95

THIS PAGE INTENTIONALLY LEFT BLANK.

THIS PAGE INTENTIONALLY LEFT BLANK.

THIS PAGE INTENTIONALLY LEFT BLANK.

This report is intended for the Funds’ shareholders. It may not be distributed to prospective investors unless it is preceded or accompanied by thecurrent prospectus.
Investing involves risk, including possible loss of principal.
The iShares Funds are distributed by BlackRock Investments, LLC (together with its affiliates, “BlackRock”).
The iShares Funds are not sponsored, endorsed, issued, sold or promoted by MSCI Inc., nor does this company make any representation regarding the ad-visability of investing in the iShares Funds. BlackRock is not affiliated with the company listed above.
©2018 BlackRock, Inc. All rights reserved. iSHARES and BLACKROCK are registered trademarks of BlackRock, Inc. or its subsidiaries. All other marks arethe property of their respective owners.
For more information visit www.iShares.com or call 1-800-iShares (1-800-474-2737)
iS-A
R-8
04-0
818