Embed Size (px)
Citation preview
2018 Cattle Market Situation and Outlook - August 9, 2018
Josh Maples - Assistant ProfessorLivestock Extension Economist
Overview
• Market Conditions• Beef Cattle Market Fundamentals
-Supply and Demand• Beef Demand & Consumption• International Trade• Questions/Discussion

Market Conditions
C-P-4910/10/17
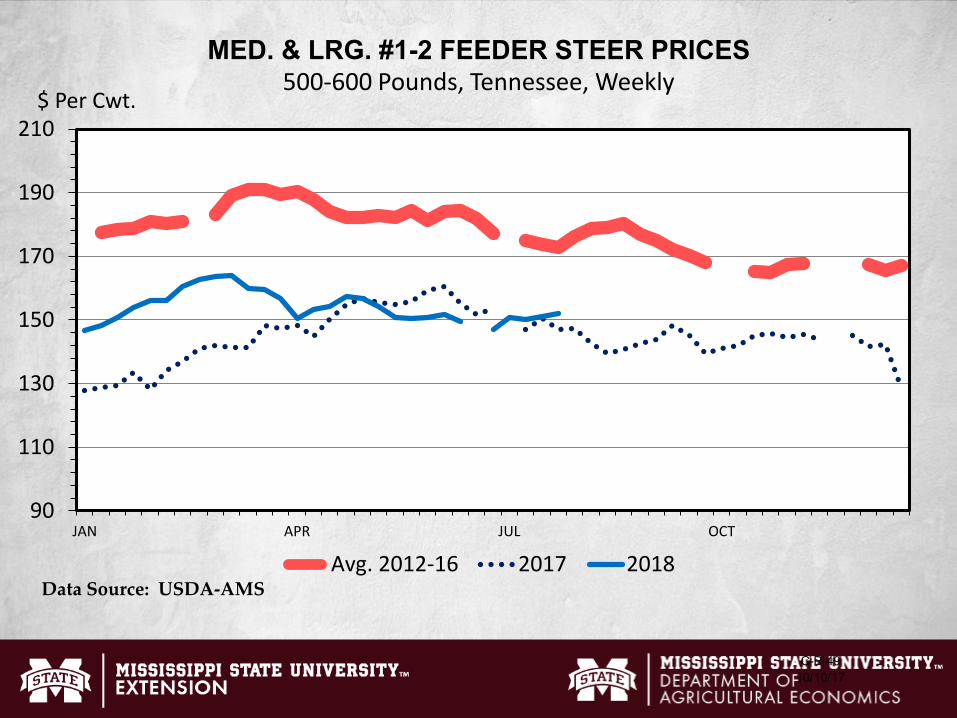
90
110
130
150
170
190
210
JAN APR JUL OCT
$ Per Cwt.
MED. & LRG. #1-2 FEEDER STEER PRICES500-600 Pounds, Tennessee, Weekly
Avg. 2012-16 2017 2018Data Source: USDA-AMS
C-P-4910/10/17
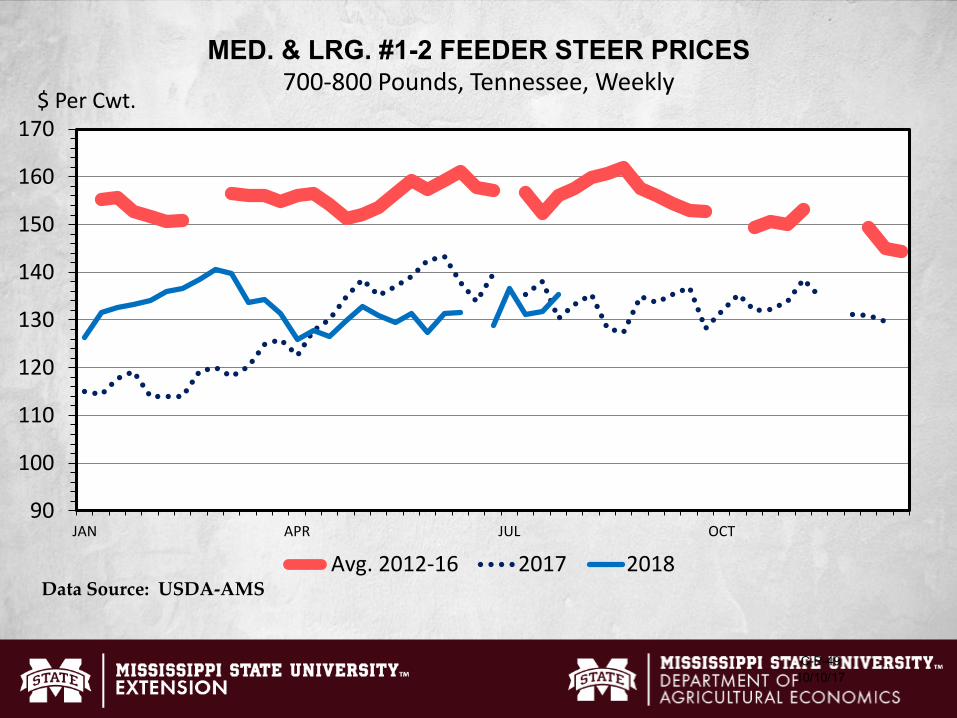
90
100
110
120
130
140
150
160
170
JAN APR JUL OCT
$ Per Cwt.
MED. & LRG. #1-2 FEEDER STEER PRICES700-800 Pounds, Tennessee, Weekly
Avg. 2012-16 2017 2018Data Source: USDA-AMS
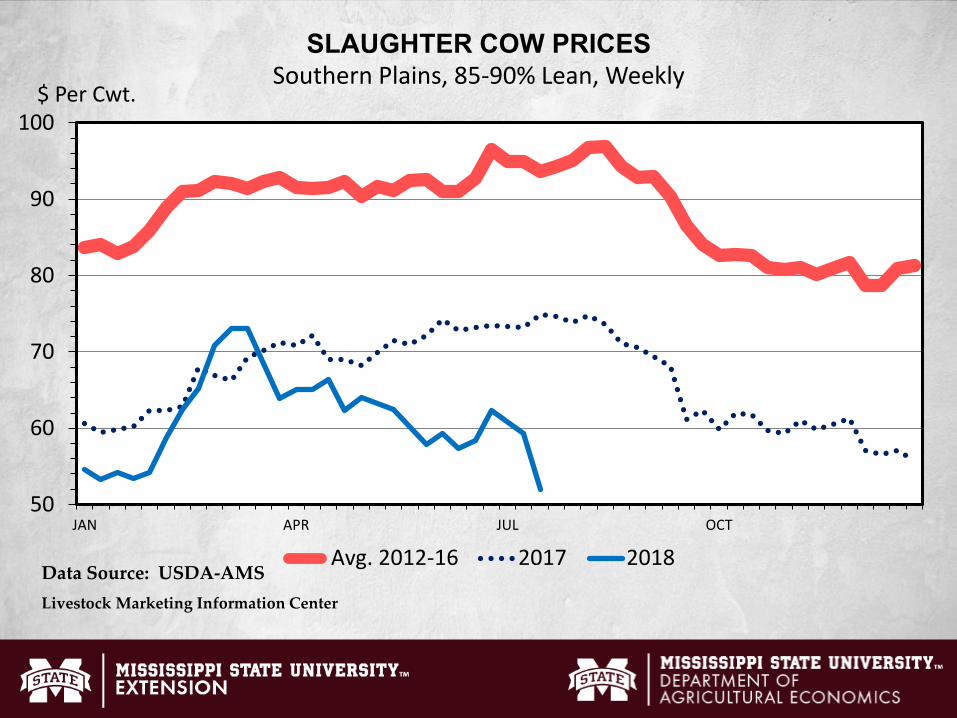
50
60
70
80
90
100
JAN APR JUL OCT
$ Per Cwt.
SLAUGHTER COW PRICESSouthern Plains, 85-90% Lean, Weekly
Avg. 2012-16 2017 2018Data Source: USDA-AMSLivestock Marketing Information Center
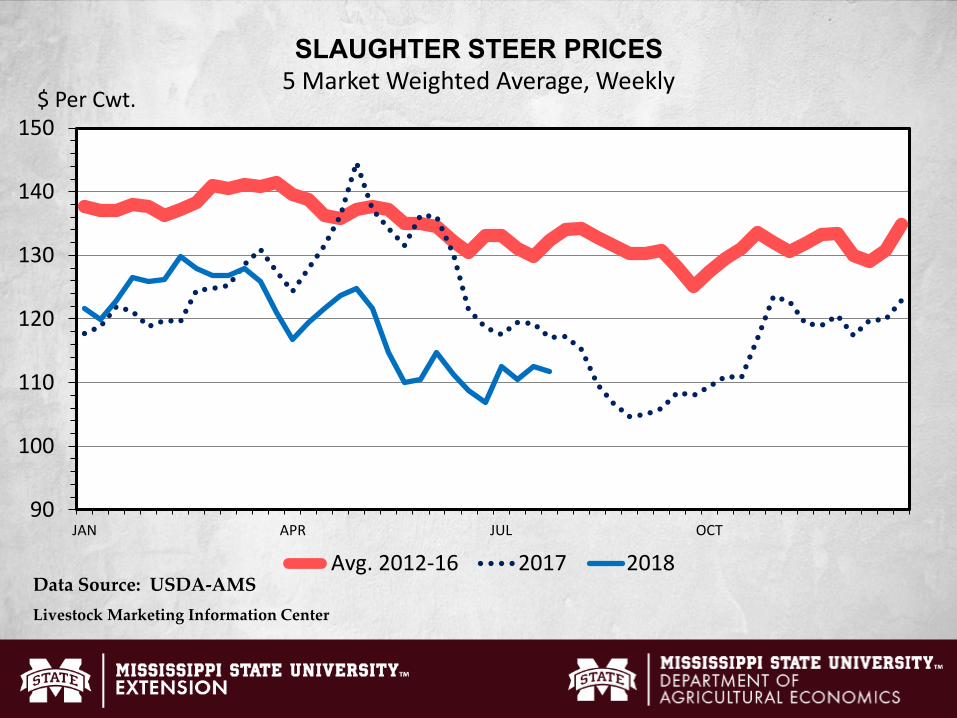
90
100
110
120
130
140
150
JAN APR JUL OCT
$ Per Cwt.
SLAUGHTER STEER PRICES5 Market Weighted Average, Weekly
Avg. 2012-16 2017 2018Data Source: USDA-AMSLivestock Marketing Information Center
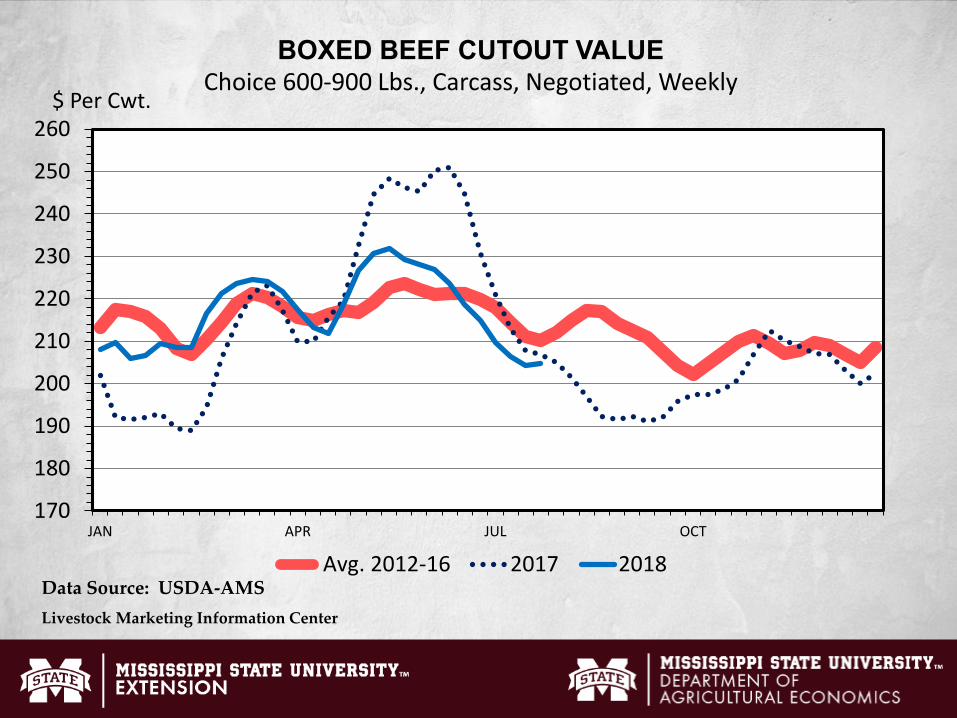
170
180
190
200
210
220
230
240
250
260
JAN APR JUL OCT
$ Per Cwt.
BOXED BEEF CUTOUT VALUEChoice 600-900 Lbs., Carcass, Negotiated, Weekly
Avg. 2012-16 2017 2018Data Source: USDA-AMSLivestock Marketing Information Center

Supply
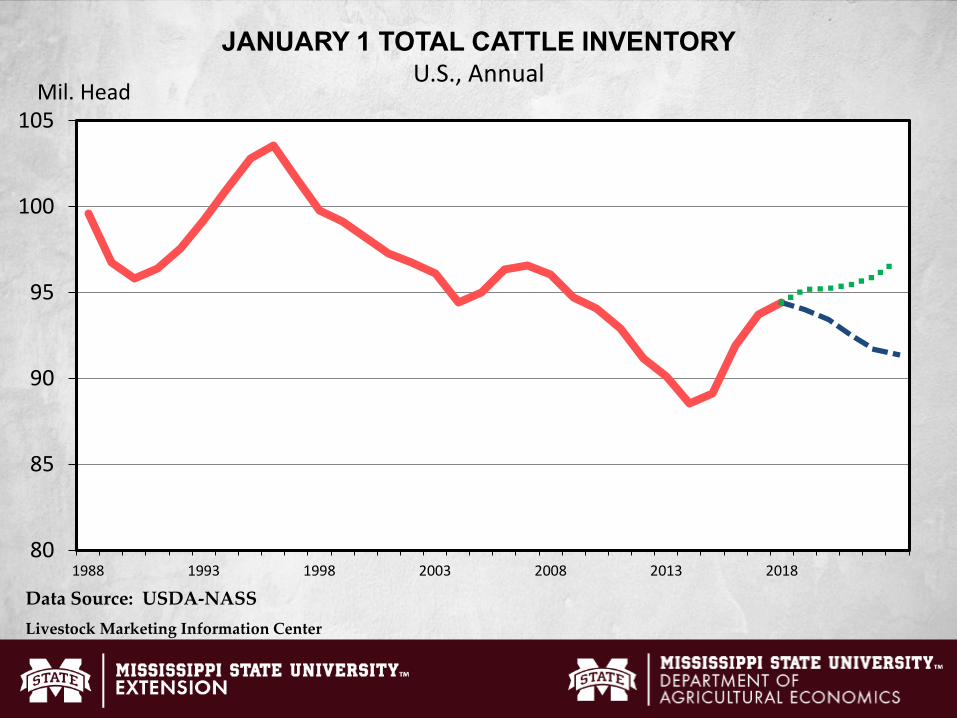
80
85
90
95
100
105
1988 1993 1998 2003 2008 2013 2018
Mil. Head
JANUARY 1 TOTAL CATTLE INVENTORYU.S., Annual
Data Source: USDA-NASSLivestock Marketing Information Center
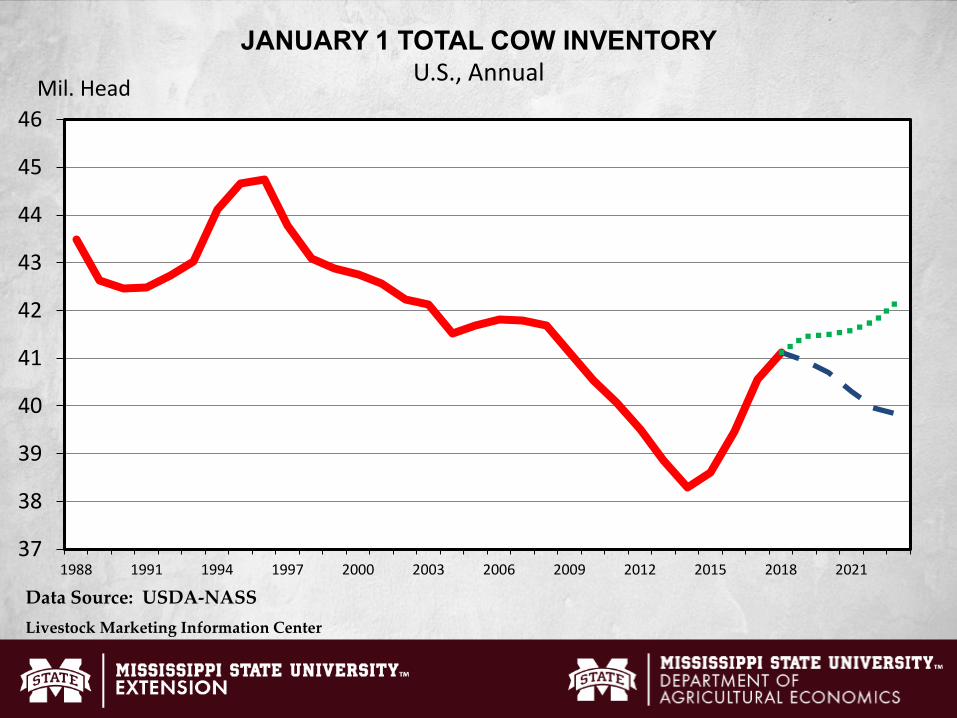
37
38
39
40
41
42
43
44
45
46
1988 1991 1994 1997 2000 2003 2006 2009 2012 2015 2018 2021
Mil. Head
JANUARY 1 TOTAL COW INVENTORYU.S., Annual
Data Source: USDA-NASSLivestock Marketing Information Center
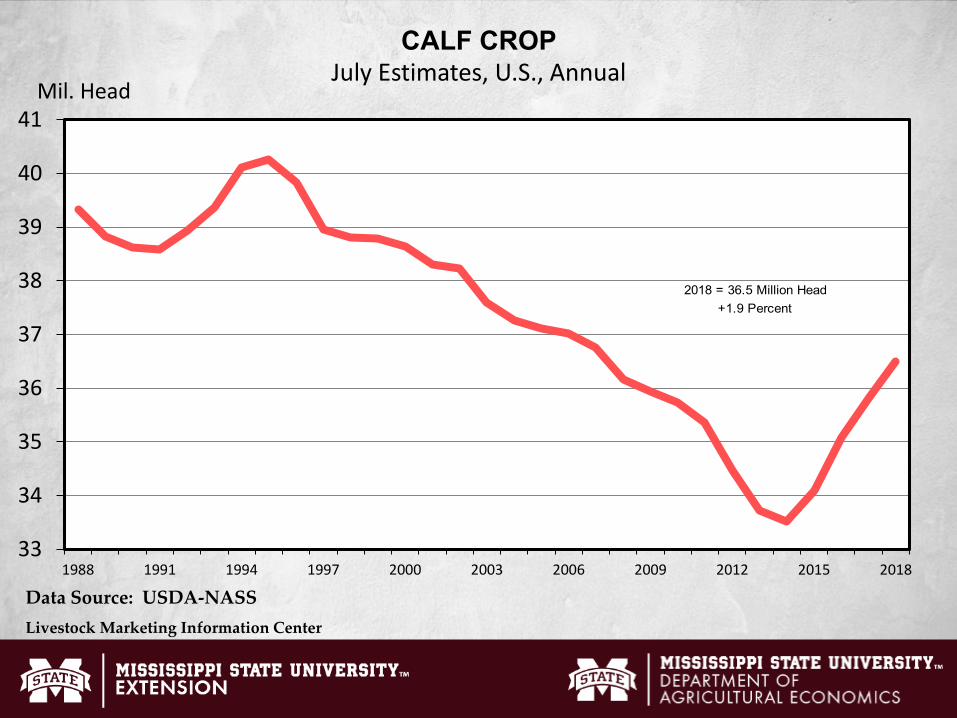
33
34
35
36
37
38
39
40
41
1988 1991 1994 1997 2000 2003 2006 2009 2012 2015 2018
Mil. Head
CALF CROPJuly Estimates, U.S., Annual
Data Source: USDA-NASSLivestock Marketing Information Center
+1.9 Percent2018 = 36.5 Million Head
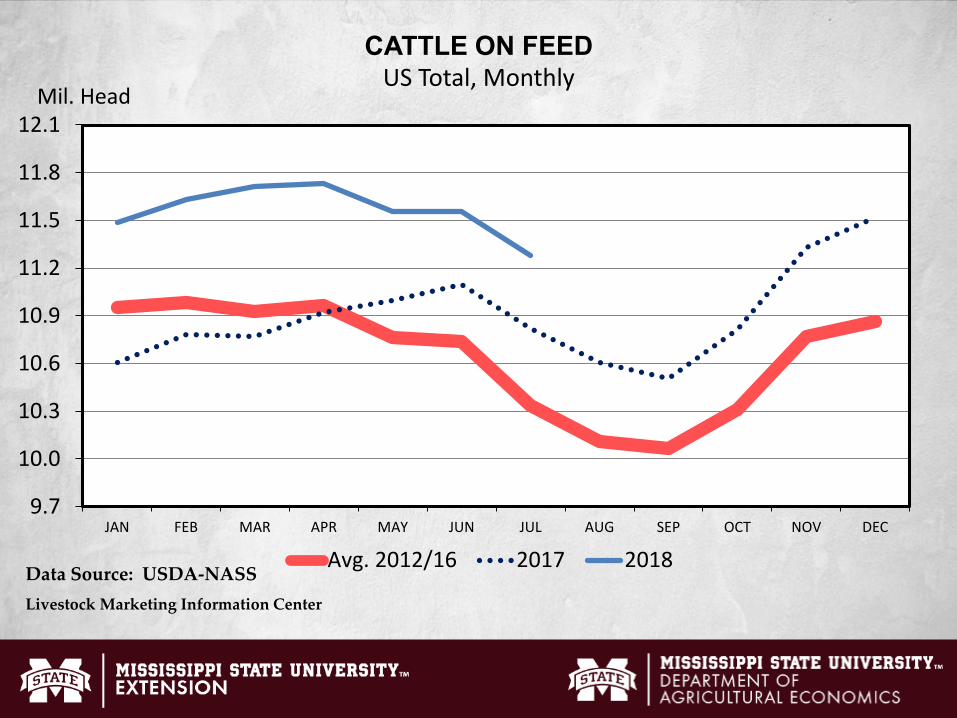
9.7
10.0
10.3
10.6
10.9
11.2
11.5
11.8
12.1
JAN FEB MAR APR MAY JUN JUL AUG SEP OCT NOV DEC
Mil. Head
CATTLE ON FEEDUS Total, Monthly
Avg. 2012/16 2017 2018Data Source: USDA-NASSLivestock Marketing Information Center
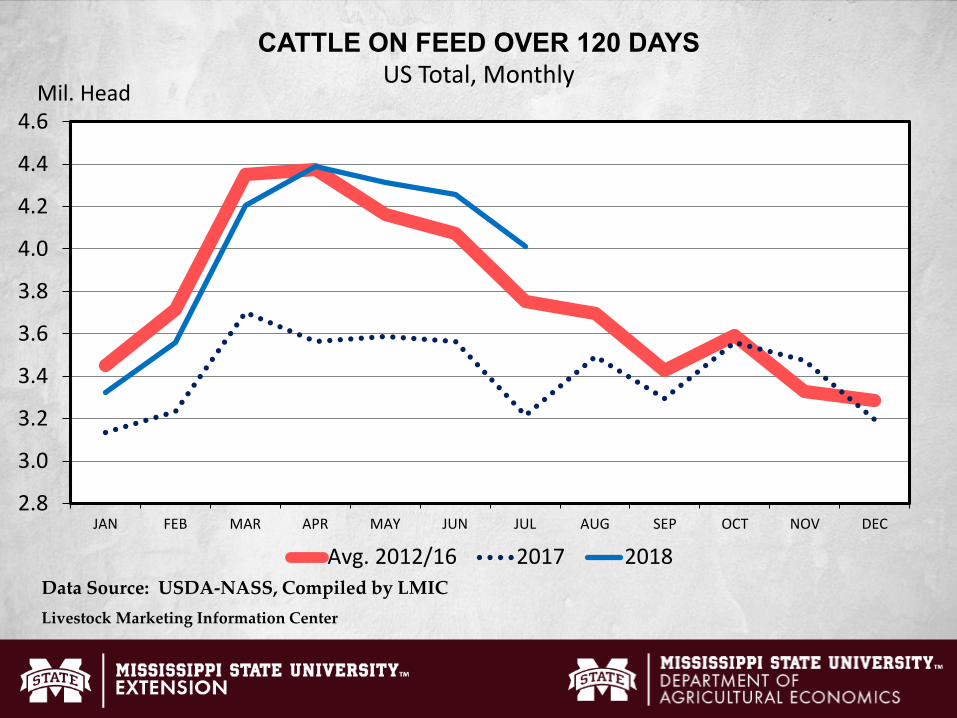
2.8
3.0
3.2
3.4
3.6
3.8
4.0
4.2
4.4
4.6
JAN FEB MAR APR MAY JUN JUL AUG SEP OCT NOV DEC
Mil. Head
CATTLE ON FEED OVER 120 DAYSUS Total, Monthly
Avg. 2012/16 2017 2018Data Source: USDA-NASS, Compiled by LMICLivestock Marketing Information Center
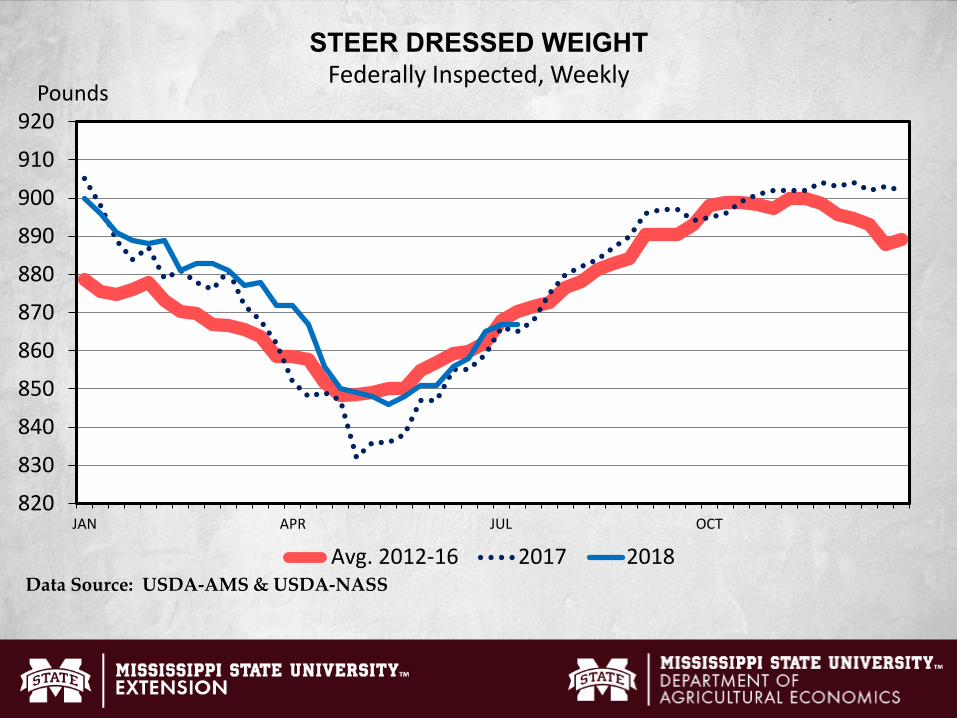
820
830
840
850
860
870
880
890
900
910
920
JAN APR JUL OCT
Pounds
STEER DRESSED WEIGHTFederally Inspected, Weekly
Avg. 2012-16 2017 2018Data Source: USDA-AMS & USDA-NASS
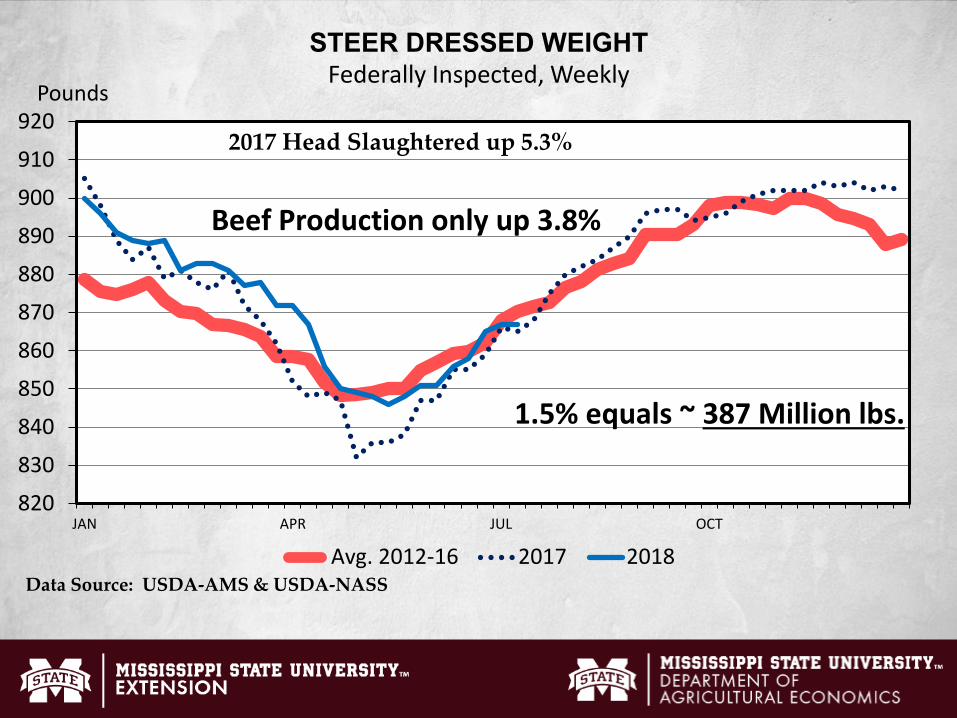
820
830
840
850
860
870
880
890
900
910
920
JAN APR JUL OCT
Pounds
STEER DRESSED WEIGHTFederally Inspected, Weekly
Avg. 2012-16 2017 2018
1.5% equals ~ 387 Million lbs.
Data Source: USDA-AMS & USDA-NASS
2017 Head Slaughtered up 5.3%
Beef Production only up 3.8%
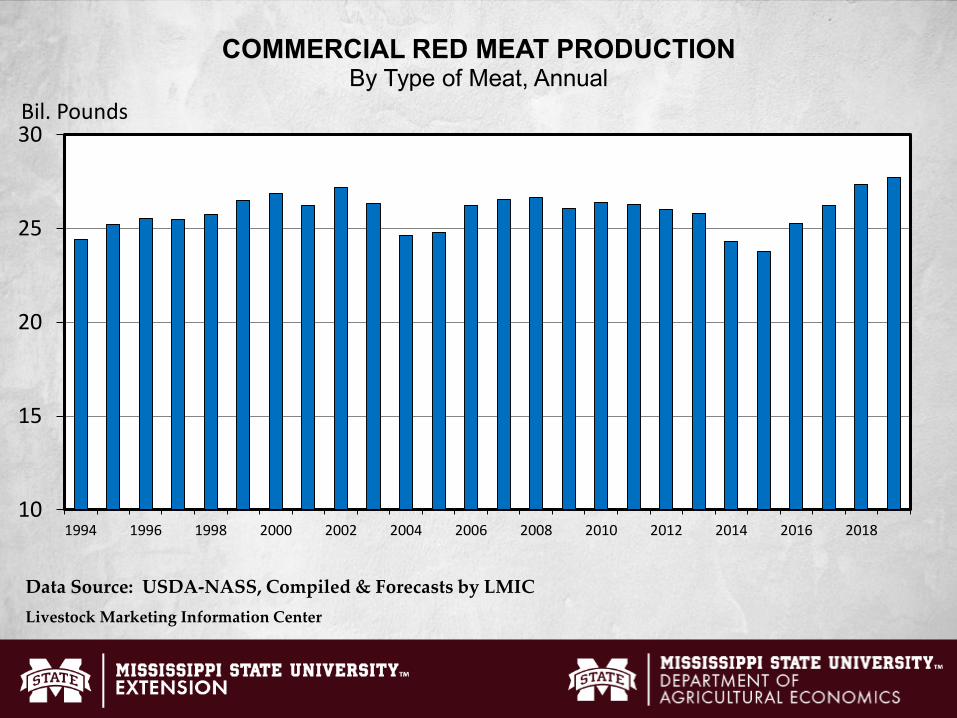
10
15
20
25
30
1994 1996 1998 2000 2002 2004 2006 2008 2010 2012 2014 2016 2018
Bil. Pounds
COMMERCIAL RED MEAT PRODUCTIONBy Type of Meat, Annual
Data Source: USDA-NASS, Compiled & Forecasts by LMICLivestock Marketing Information Center
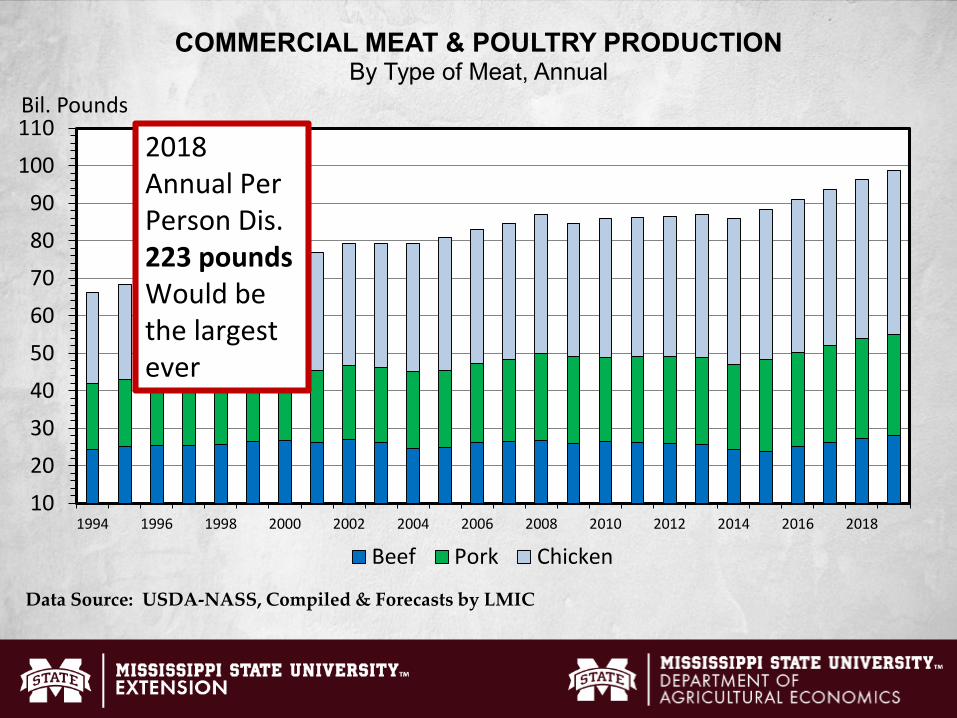
102030405060708090
100110
1994 1996 1998 2000 2002 2004 2006 2008 2010 2012 2014 2016 2018
Bil. Pounds
COMMERCIAL MEAT & POULTRY PRODUCTIONBy Type of Meat, Annual
Beef Pork Chicken
2018 Annual Per Person Dis. 223 poundsWould be the largest ever
Data Source: USDA-NASS, Compiled & Forecasts by LMIC

The Cattle Cycle
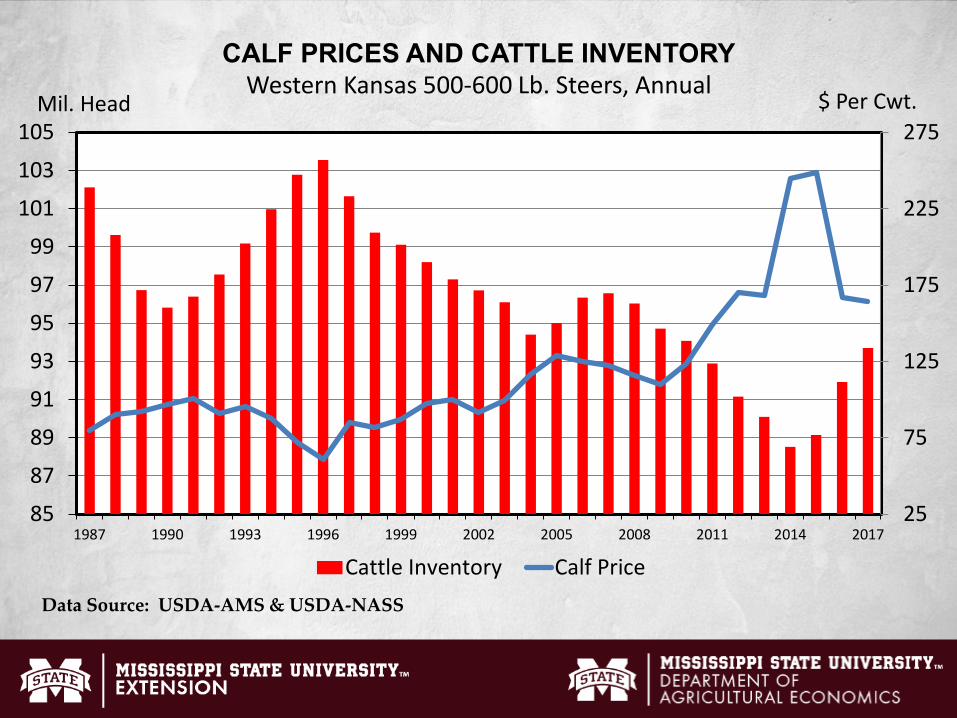
25
75
125
175
225
275
85
87
89
91
93
95
97
99
101
103
105
1987 1990 1993 1996 1999 2002 2005 2008 2011 2014 2017
$ Per Cwt.Mil. Head
CALF PRICES AND CATTLE INVENTORYWestern Kansas 500-600 Lb. Steers, Annual
Cattle Inventory Calf PriceData Source: USDA-AMS & USDA-NASS
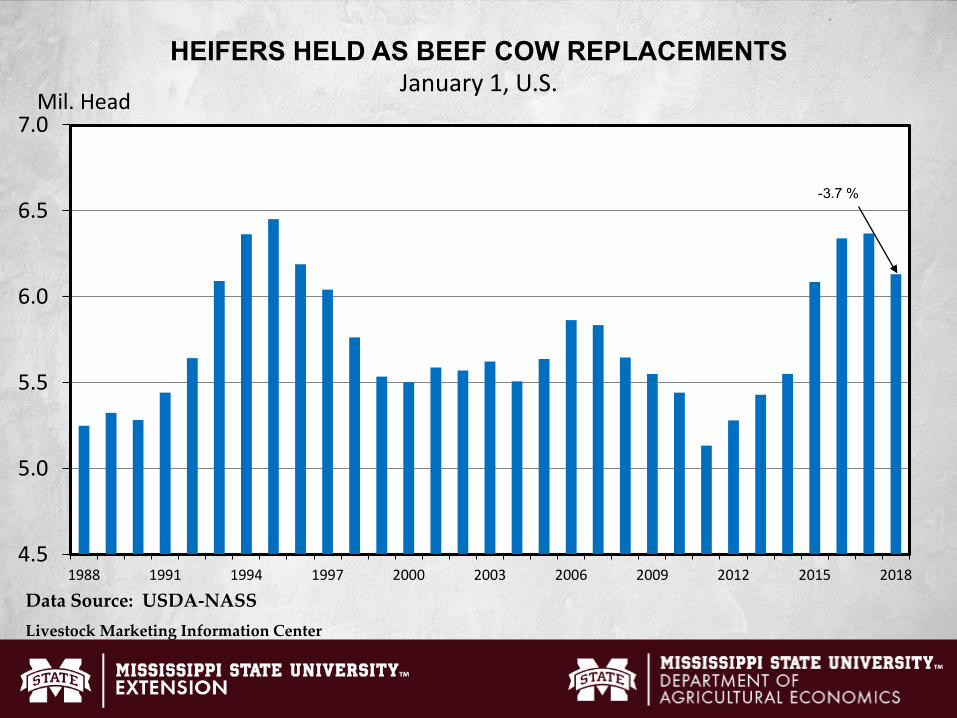
4.5
5.0
5.5
6.0
6.5
7.0
1988 1991 1994 1997 2000 2003 2006 2009 2012 2015 2018
Mil. Head
HEIFERS HELD AS BEEF COW REPLACEMENTSJanuary 1, U.S.
-3.7 %
Data Source: USDA-NASSLivestock Marketing Information Center
60
70
80
90
100
110
120
130
140
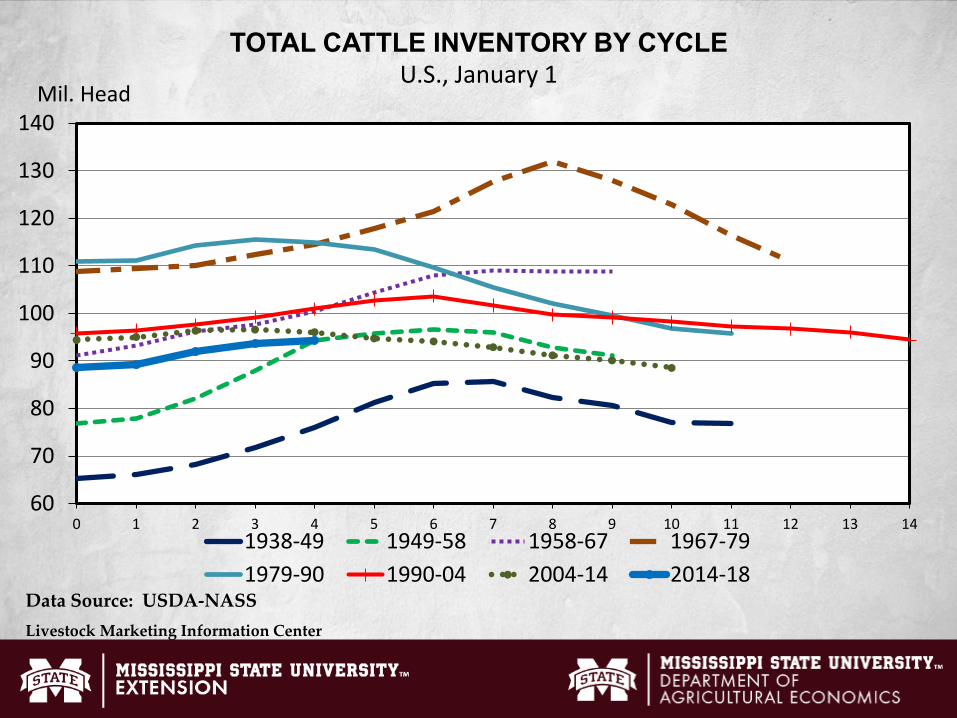
0 1 2 3 4 5 6 7 8 9 10 11 12 13 14
Mil. Head
TOTAL CATTLE INVENTORY BY CYCLEU.S., January 1
1938-49 1949-58 1958-67 1967-791979-90 1990-04 2004-14 2014-18
Data Source: USDA-NASSLivestock Marketing Information Center
60
70
80
90
100
110
120
130
140
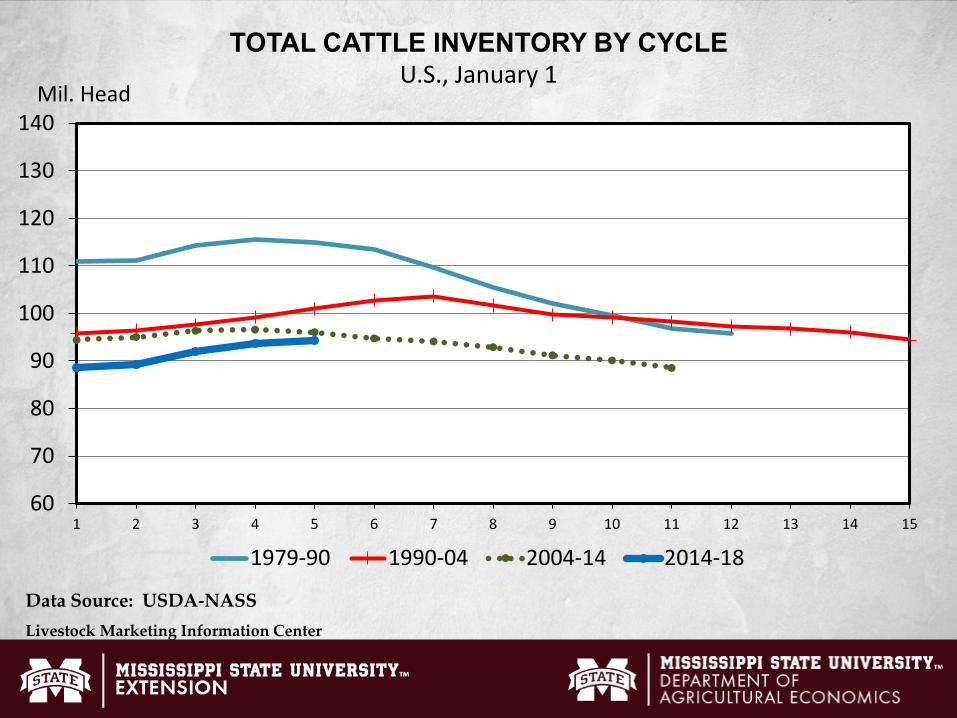
1 2 3 4 5 6 7 8 9 10 11 12 13 14 15
Mil. Head
TOTAL CATTLE INVENTORY BY CYCLEU.S., January 1
1979-90 1990-04 2004-14 2014-18
Data Source: USDA-NASSLivestock Marketing Information Center
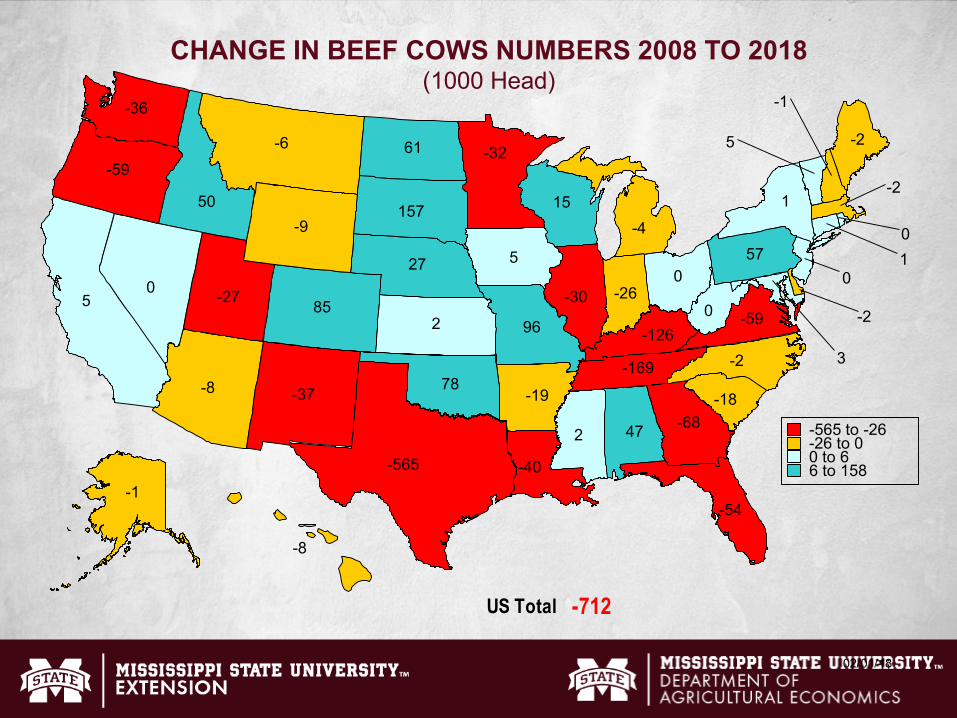
CHANGE IN BEEF COWS NUMBERS 2008 TO 2018(1000 Head)
US Total -712
02/01/18
-565
-169
-126
-68
-59
-59
-54
-40
-37
-36
-32
-30-27 -26
-19 -18
-9
-8
-8
-6
-4
-2
-2
-2
-2
-1
-1
000
0
01
1
2
2
3
5
5
5
15
27
47
50
57
61
78
8596
157
-565 to -26-26 to 00 to 66 to 158
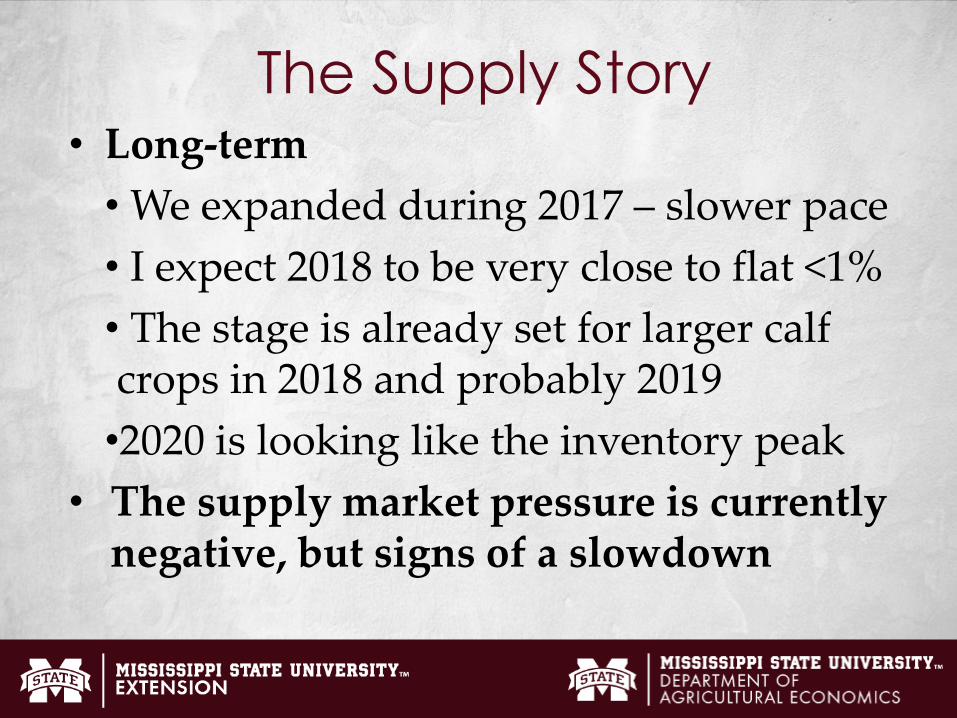
The Supply Story• Long-term
• We expanded during 2017 – slower pace• I expect 2018 to be very close to flat <1% • The stage is already set for larger calf crops in 2018 and probably 2019
•2020 is looking like the inventory peak• The supply market pressure is currently
negative, but signs of a slowdown

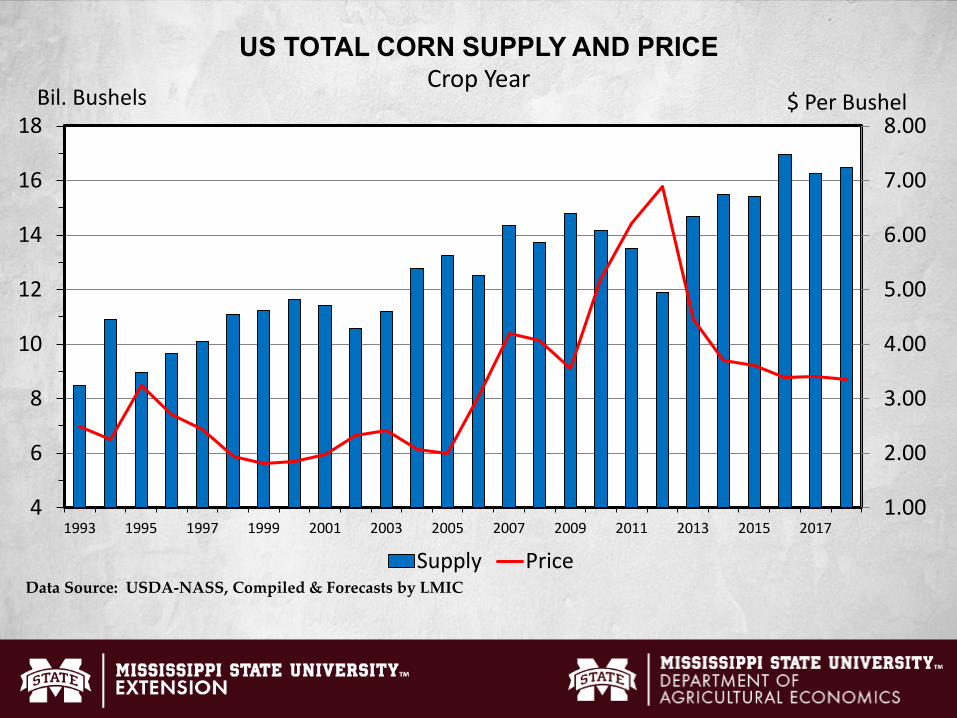
Feedstuffs
1.00
2.00
3.00
4.00
5.00
6.00
7.00
8.00
4
6
8
10
12
14
16
18
1993 1995 1997 1999 2001 2003 2005 2007 2009 2011 2013 2015 2017
$ Per BushelBil. Bushels
US TOTAL CORN SUPPLY AND PRICECrop Year
Supply PriceData Source: USDA-NASS, Compiled & Forecasts by LMIC

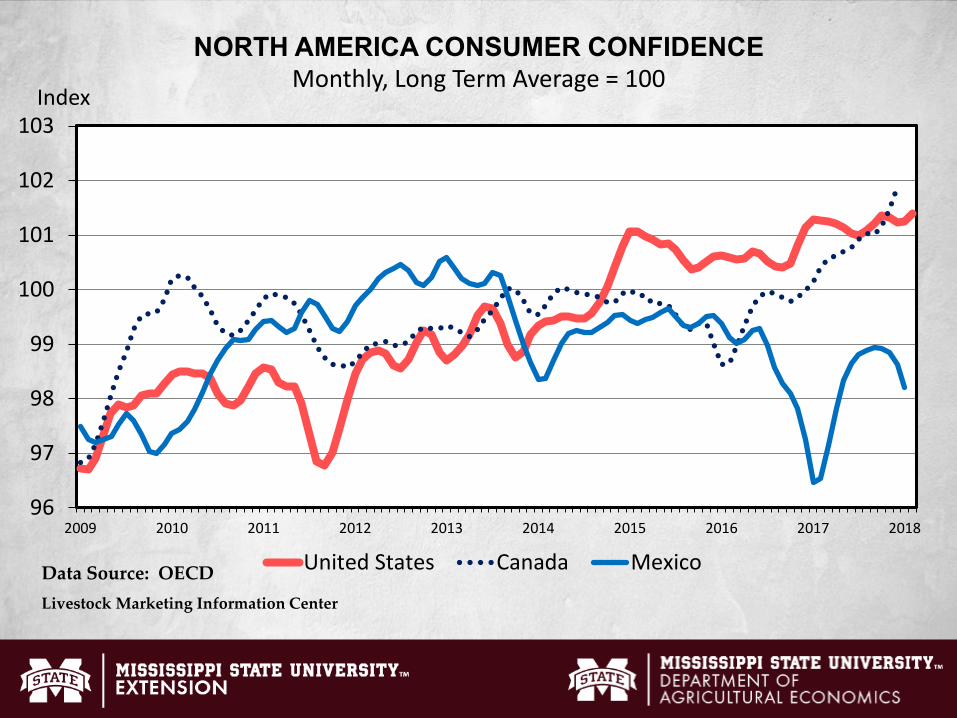
DemandPart 1: Domestic
96
97
98
99
100
101
102
103
2009 2010 2011 2012 2013 2014 2015 2016 2017 2018
Index
NORTH AMERICA CONSUMER CONFIDENCE Monthly, Long Term Average = 100
United States Canada MexicoData Source: OECDLivestock Marketing Information Center
50
55
60
65
70
1994 1996 1998 2000 2002 2004 2006 2008 2010 2012 2014 2016 2018
Pounds
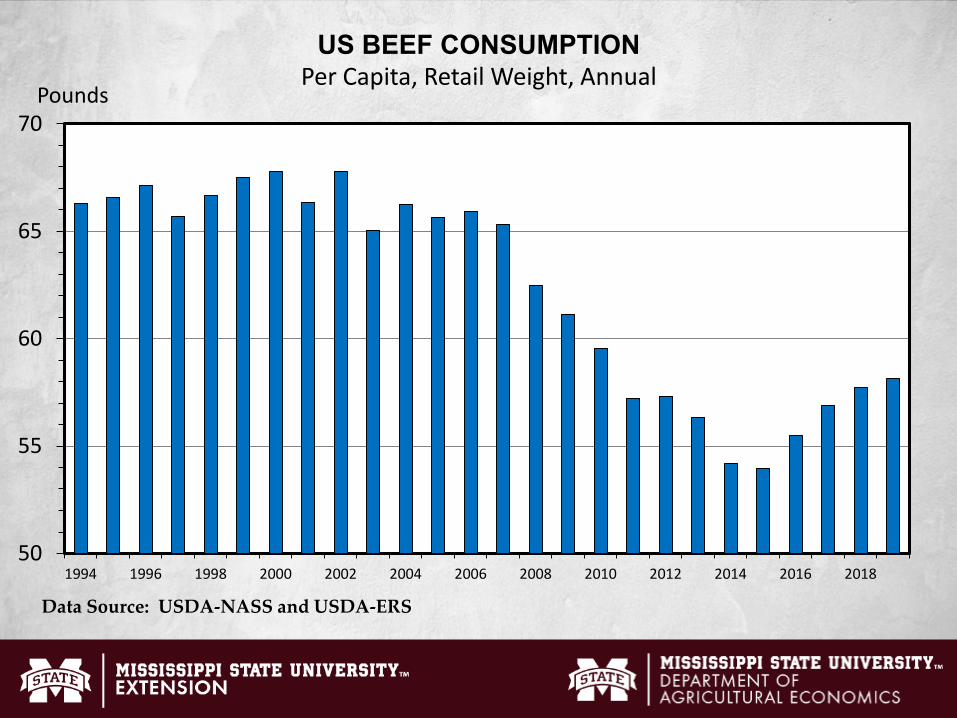
US BEEF CONSUMPTIONPer Capita, Retail Weight, Annual
Data Source: USDA-NASS and USDA-ERS
200
250
300
350
400
450
500
550
600
650
700
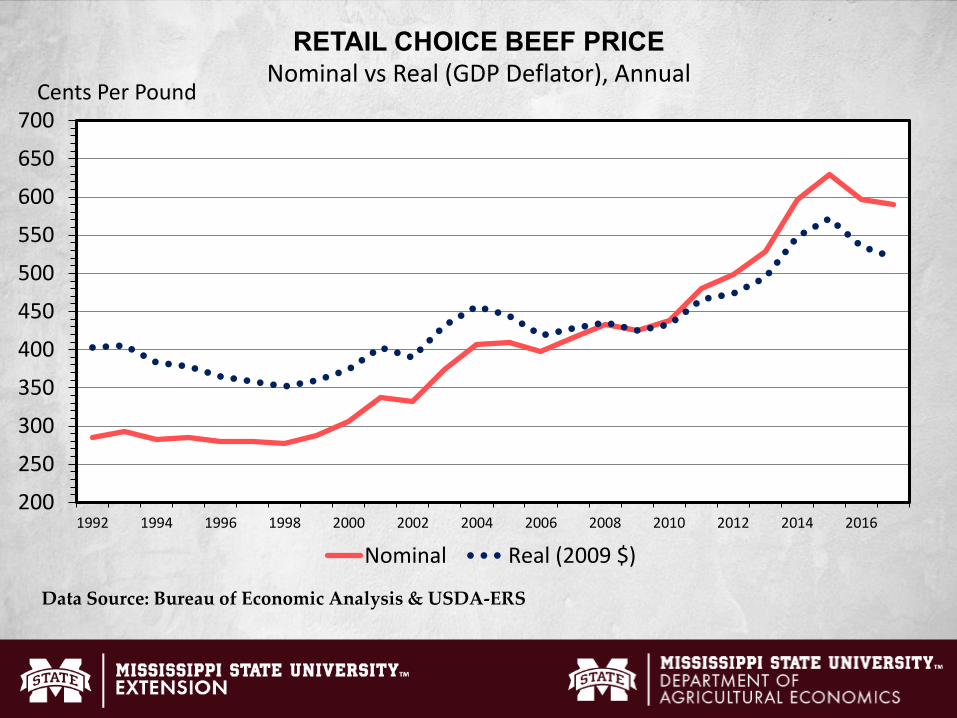
1992 1994 1996 1998 2000 2002 2004 2006 2008 2010 2012 2014 2016
Cents Per Pound
RETAIL CHOICE BEEF PRICENominal vs Real (GDP Deflator), Annual
Nominal Real (2009 $)
Data Source: Bureau of Economic Analysis & USDA-ERS
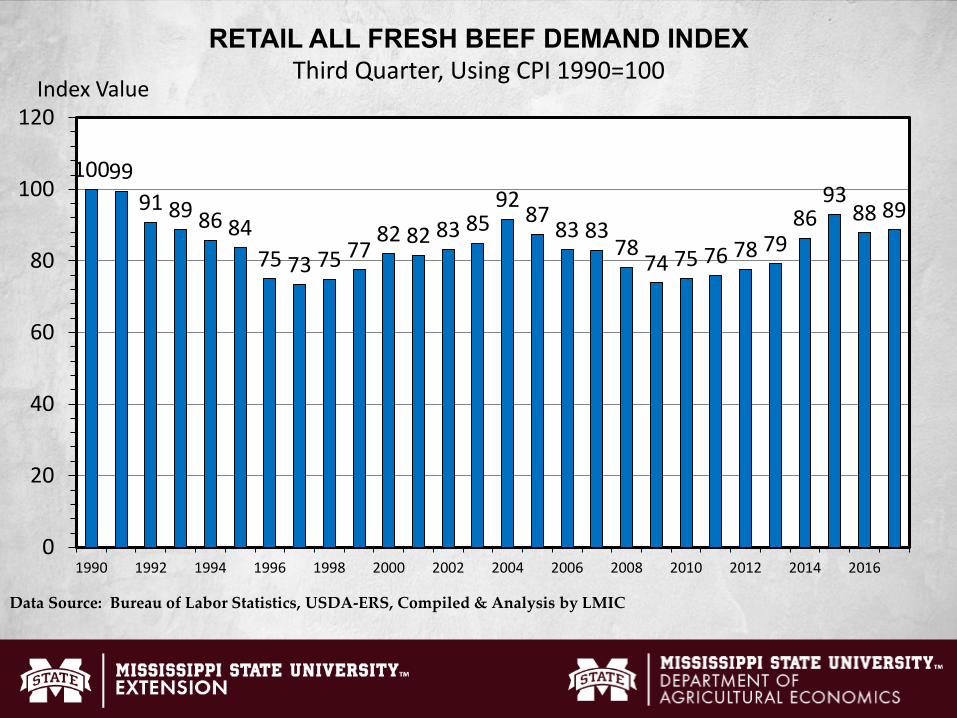
1009991 89 86 84
75 73 75 7782 82 83 85
92 8783 83
7874 75 76 78 79
8693
88 89
0
20
40
60
80
100
120
1990 1992 1994 1996 1998 2000 2002 2004 2006 2008 2010 2012 2014 2016
Index Value
RETAIL ALL FRESH BEEF DEMAND INDEXThird Quarter, Using CPI 1990=100
Data Source: Bureau of Labor Statistics, USDA-ERS, Compiled & Analysis by LMIC
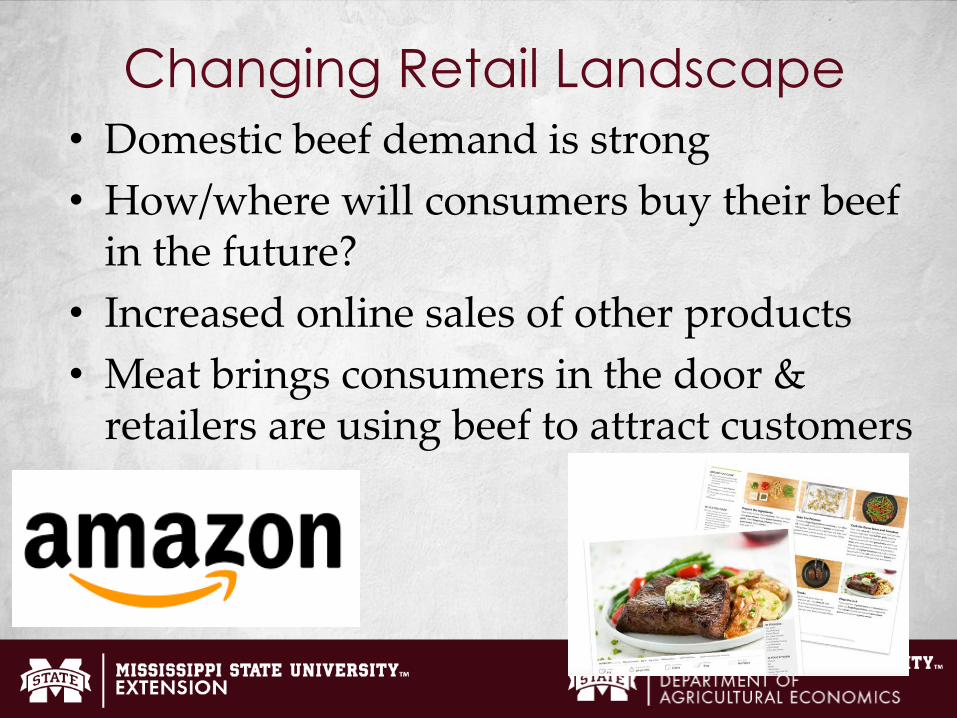
Changing Retail Landscape• Domestic beef demand is strong• How/where will consumers buy their beef
in the future?• Increased online sales of other products• Meat brings consumers in the door &
retailers are using beef to attract customers
DemandPart 2: International Trade
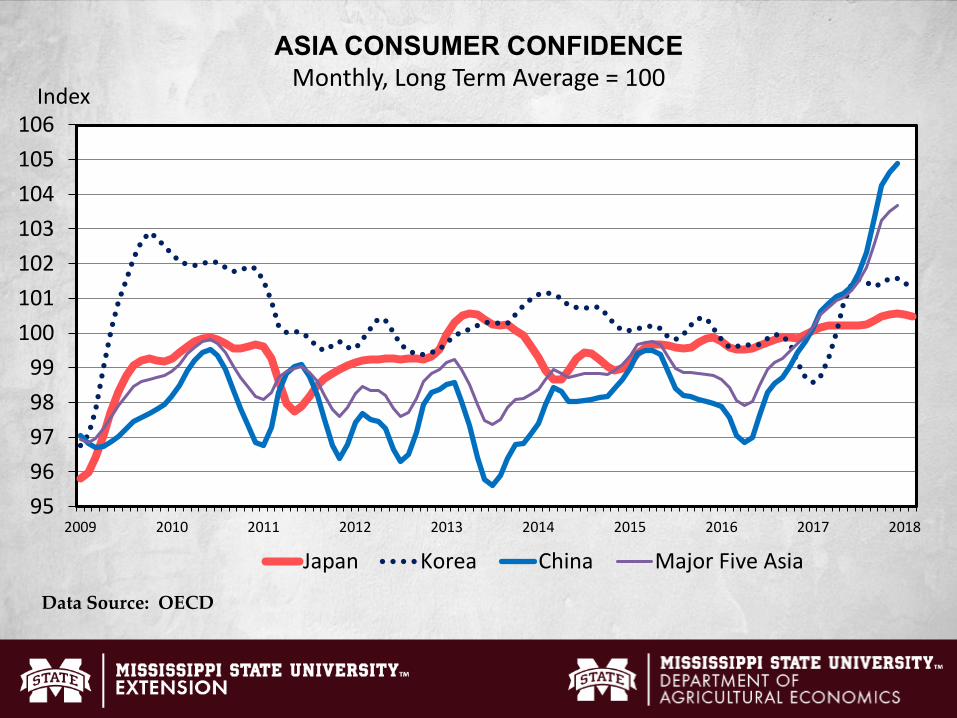
9596979899
100101102103104105106
2009 2010 2011 2012 2013 2014 2015 2016 2017 2018
Index
ASIA CONSUMER CONFIDENCE Monthly, Long Term Average = 100
Japan Korea China Major Five Asia
Data Source: OECD
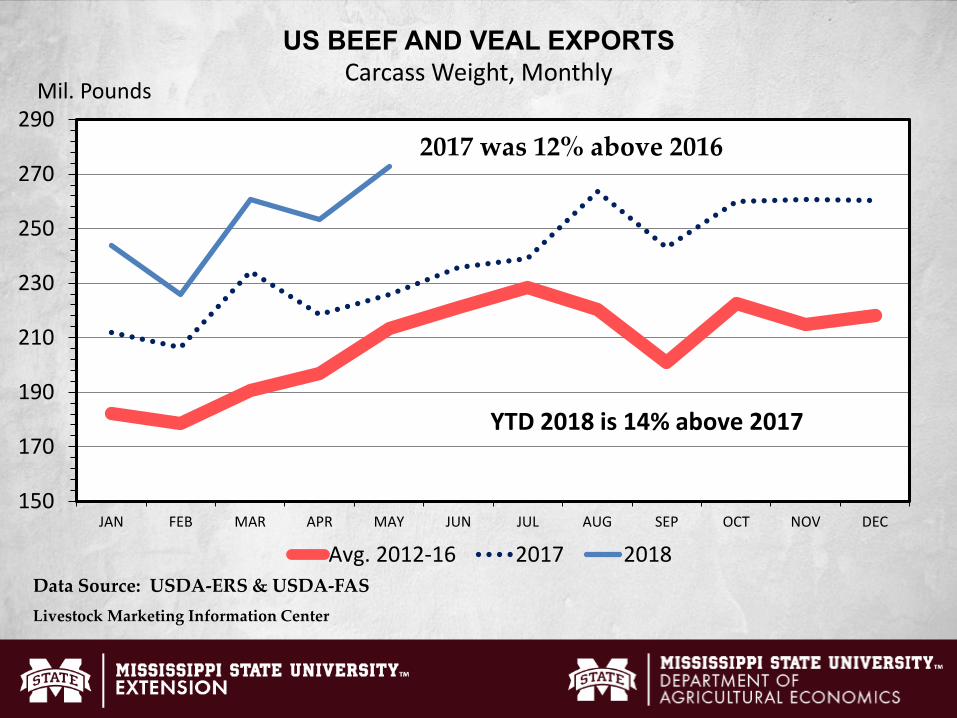
150
170
190
210
230
250
270
290
JAN FEB MAR APR MAY JUN JUL AUG SEP OCT NOV DEC
Mil. Pounds
US BEEF AND VEAL EXPORTSCarcass Weight, Monthly
Avg. 2012-16 2017 2018
YTD 2018 is 14% above 2017
Data Source: USDA-ERS & USDA-FASLivestock Marketing Information Center
2017 was 12% above 2016
I-N-0602/07/18
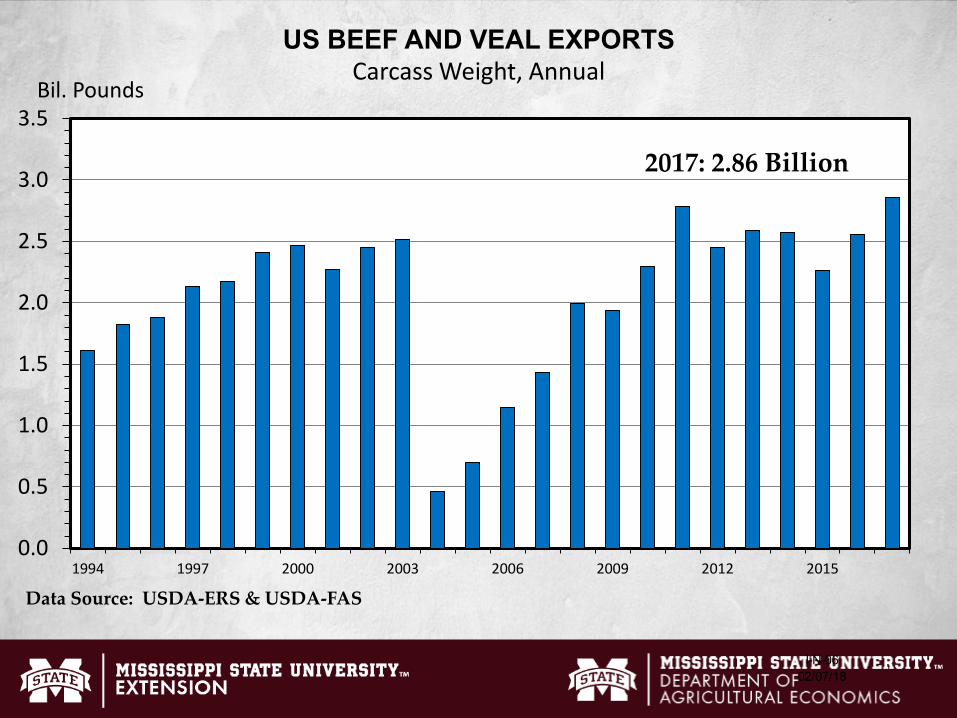
0.0
0.5
1.0
1.5
2.0
2.5
3.0
3.5
1994 1997 2000 2003 2006 2009 2012 2015
Bil. Pounds
US BEEF AND VEAL EXPORTSCarcass Weight, Annual
Data Source: USDA-ERS & USDA-FAS
2017: 2.86 Billion
I-N-1802/07/18
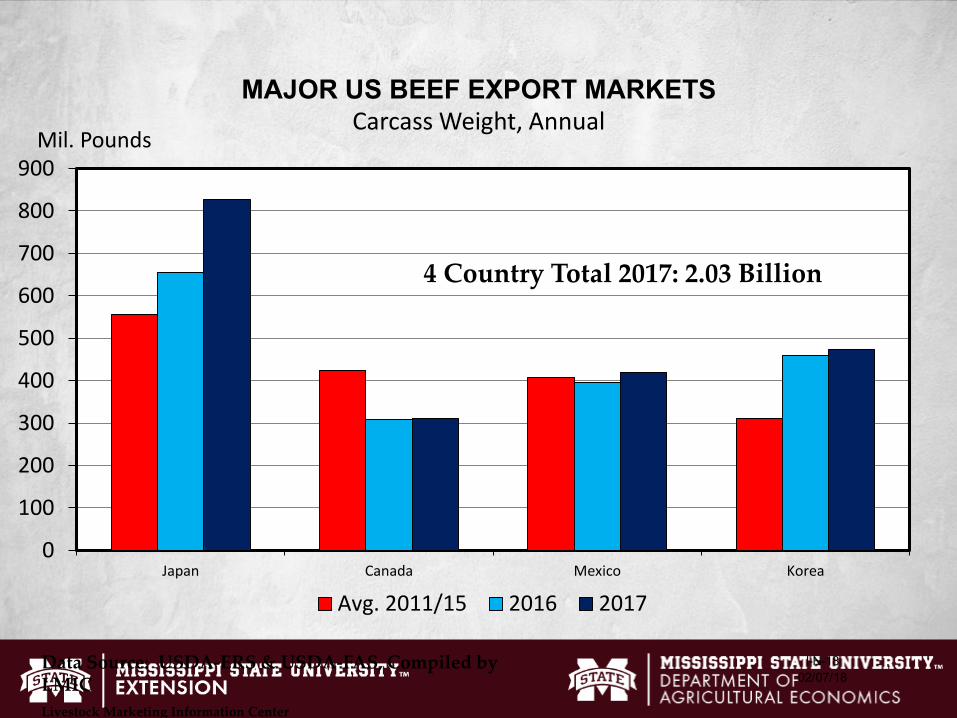
0
100
200
300
400
500
600
700
800
900
Japan Canada Mexico Korea
Mil. Pounds
MAJOR US BEEF EXPORT MARKETSCarcass Weight, Annual
Avg. 2011/15 2016 2017
Data Source: USDA-ERS & USDA-FAS, Compiled by LMICLivestock Marketing Information Center
4 Country Total 2017: 2.03 Billion
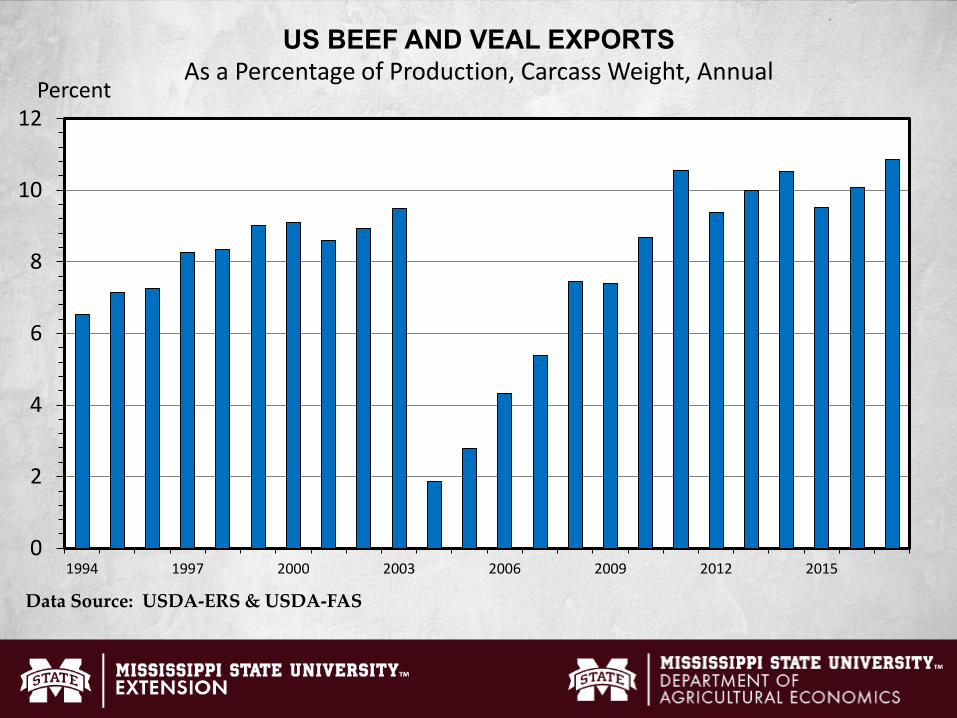
0
2
4
6
8
10
12
1994 1997 2000 2003 2006 2009 2012 2015
Percent
US BEEF AND VEAL EXPORTSAs a Percentage of Production, Carcass Weight, Annual
Data Source: USDA-ERS & USDA-FAS
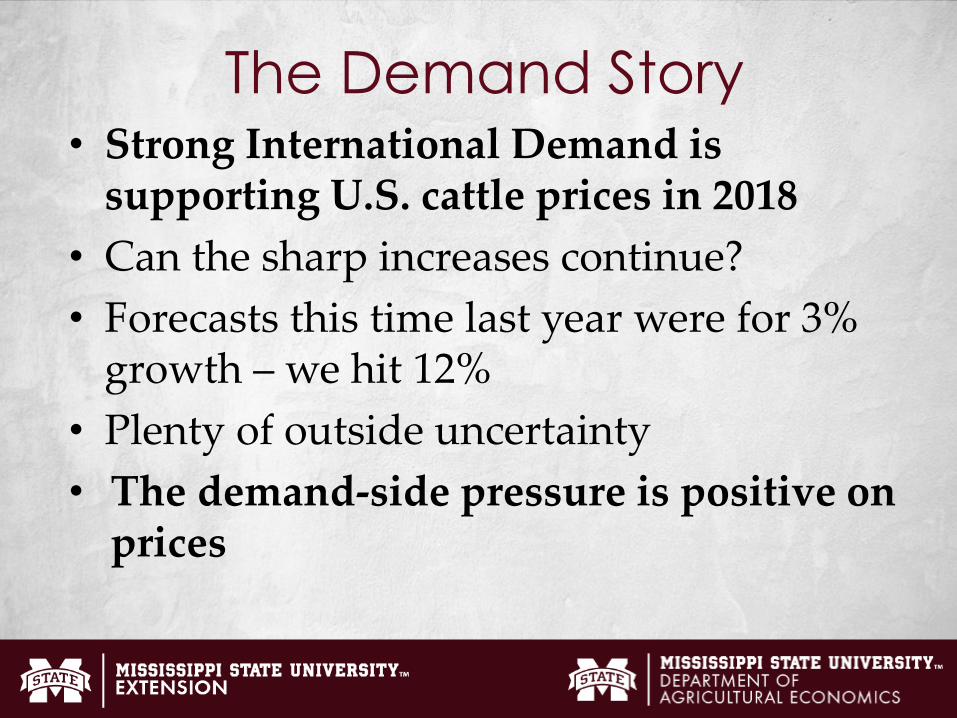
The Demand Story• Strong International Demand is
supporting U.S. cattle prices in 2018• Can the sharp increases continue?• Forecasts this time last year were for 3%
growth – we hit 12%• Plenty of outside uncertainty• The demand-side pressure is positive on
prices

Forecasts
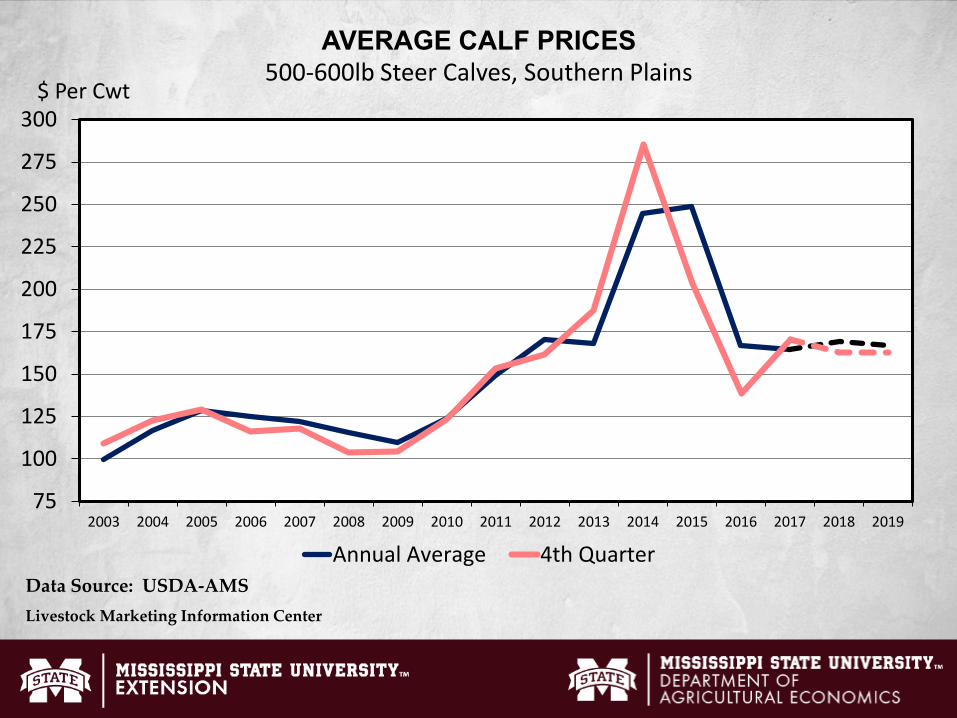
75
100
125
150
175
200
225
250
275
300
2003 2004 2005 2006 2007 2008 2009 2010 2011 2012 2013 2014 2015 2016 2017 2018 2019
$ Per Cwt
AVERAGE CALF PRICES500-600lb Steer Calves, Southern Plains
Annual Average 4th QuarterData Source: USDA-AMSLivestock Marketing Information Center
Conclusions
• We’re in a demand-driven environment • Domestic and International demand are
supporting prices despite supply• Larger beef supplies in 2019• Supply pressure on prices in 2019, but 2020
could bring some relief• Plenty of uncertainty from outside