Embed Size (px)
Citation preview
UBS Indonesia Conference 2018
Jakarta - March 6th, 2018
Company Presentation
1. Company Overview
2. Business Updates
3. Growth Projects
4. Financial Highlights
5. Appendix
Key Investment Highlights
Petrochemicals Industry Outlook
Table of Contents
1
1. Company Overview
2
Olefin, 33%
Polyolefin, 39%
Butadiene, 10%
Styrene Monomer,
18%Olefin, 32%
Polyolefin, 46%
Butadiene, 7%
Styrene Monomer,
15%
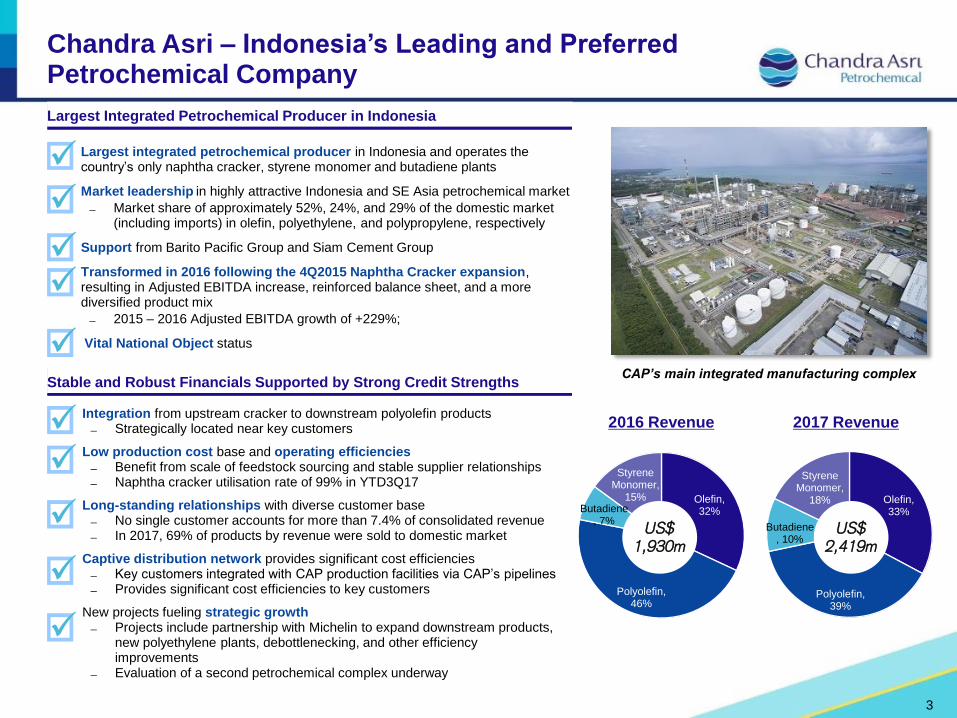
Chandra Asri – Indonesia’s Leading and Preferred Petrochemical Company
2017 Revenue
CAP’s main integrated manufacturing complex
2016 Revenue
US$1,930m
US$2,419m
Largest Integrated Petrochemical Producer in Indonesia
Stable and Robust Financials Supported by Strong Credit Strengths
Integration from upstream cracker to downstream polyolefin products Strategically located near key customers
Low production cost base and operating efficiencies Benefit from scale of feedstock sourcing and stable supplier relationships Naphtha cracker utilisation rate of 99% in YTD3Q17
Long-standing relationships with diverse customer base No single customer accounts for more than 7.4% of consolidated revenue In 2017, 69% of products by revenue were sold to domestic market
Captive distribution network provides significant cost efficiencies Key customers integrated with CAP production facilities via CAP’s pipelines Provides significant cost efficiencies to key customers
New projects fueling strategic growth Projects include partnership with Michelin to expand downstream products,
new polyethylene plants, debottlenecking, and other efficiency improvements
Evaluation of a second petrochemical complex underway
3
Largest integrated petrochemical producer in Indonesia and operates the country’s only naphtha cracker, styrene monomer and butadiene plants
Market leadership in highly attractive Indonesia and SE Asia petrochemical market
Market share of approximately 52%, 24%, and 29% of the domestic market (including imports) in olefin, polyethylene, and polypropylene, respectively
Support from Barito Pacific Group and Siam Cement Group
Transformed in 2016 following the 4Q2015 Naphtha Cracker expansion, resulting in Adjusted EBITDA increase, reinforced balance sheet, and a more diversified product mix
2015 – 2016 Adjusted EBITDA growth of +229%;
Vital National Object status
CAP
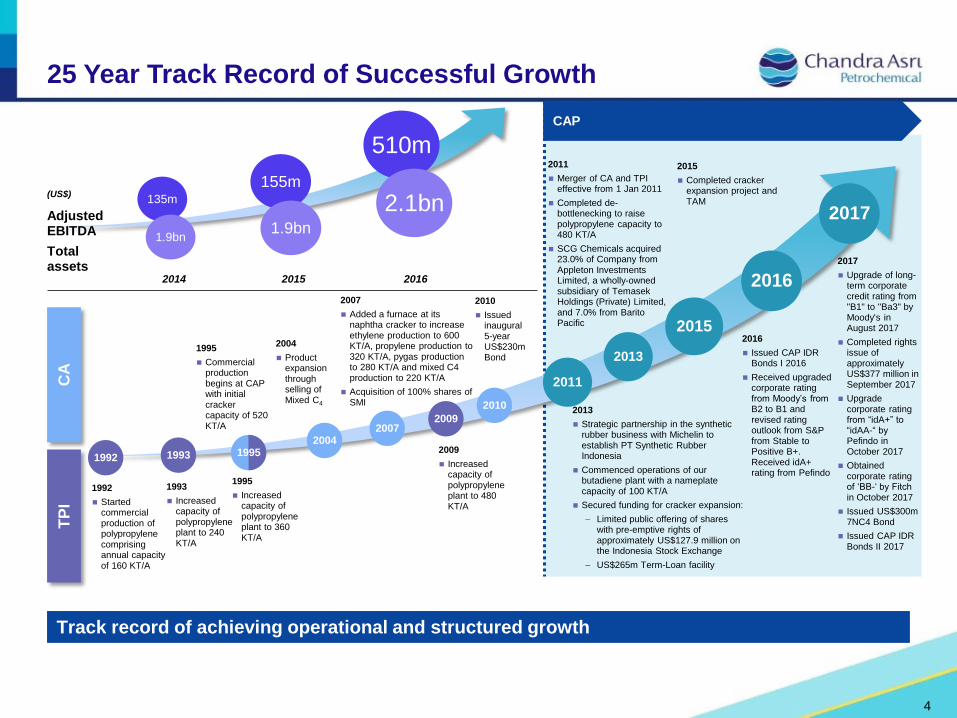
Track record of achieving operational and structured growth
25 Year Track Record of Successful Growth
Adjusted EBITDA
Total assets
1992
TP
IC
A
1992
Started commercial production of polypropylene comprising annual capacity of 160 KT/A
1993
1993
Increased capacity of polypropylene plant to 240 KT/A
1995
1995
Increased capacity of polypropylene plant to 360 KT/A
2009
2009
Increased capacity of polypropylene plant to 480 KT/A
1995
Commercial production begins at CAP with initial cracker capacity of 520 KT/A
2004
2004
Product expansion through selling of Mixed C4
2007
2007
Added a furnace at its naphtha cracker to increase ethylene production to 600 KT/A, propylene production to 320 KT/A, pygas production to 280 KT/A and mixed C4 production to 220 KT/A
Acquisition of 100% shares of SMI 2010
2010
Issued inaugural 5-year US$230m Bond
2011
2015
2016
2015
Completed cracker expansion project and TAM
2013
Strategic partnership in the synthetic rubber business with Michelin to establish PT Synthetic Rubber Indonesia
Commenced operations of our butadiene plant with a nameplate capacity of 100 KT/A
Secured funding for cracker expansion:
− Limited public offering of shares with pre-emptive rights of approximately US$127.9 million on the Indonesia Stock Exchange
− US$265m Term-Loan facility
2011
Merger of CA and TPI effective from 1 Jan 2011
Completed de-bottlenecking to raise polypropylene capacity to 480 KT/A
SCG Chemicals acquired 23.0% of Company from Appleton Investments Limited, a wholly-owned subsidiary of Temasek Holdings (Private) Limited, and 7.0% from Barito Pacific
2014
135m
1.9bn
2015
155m
1.9bn
2016
510m
2.1bn(US$)
4
2016
Issued CAP IDR Bonds I 2016
Received upgraded corporate rating from Moody’s from B2 to B1 and revised rating outlook from S&P from Stable to Positive B+. Received idA+ rating from Pefindo
2017
2013
2017
Upgrade of long-term corporate credit rating from "B1" to "Ba3" by Moody's in August 2017
Completed rights issue of approximately US$377 million in September 2017
Upgrade corporate rating from “idA+” to “idAA-“ by Pefindo in October 2017
Obtained corporate rating of ‘BB-‘ by Fitch in October 2017
Issued US$300m 7NC4 Bond
Issued CAP IDR Bonds II 2017
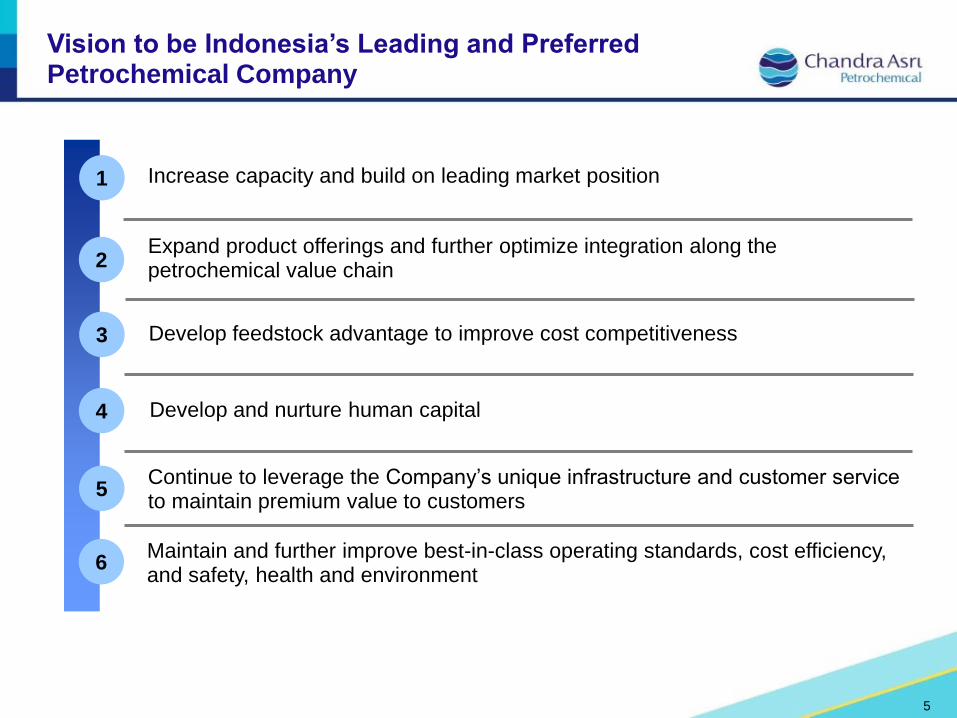
Vision to be Indonesia’s Leading and Preferred Petrochemical Company
5
Continue to leverage the Company’s unique infrastructure and customer service to maintain premium value to customers
1
4
2Expand product offerings and further optimize integration along the petrochemical value chain
3
Maintain and further improve best-in-class operating standards, cost efficiency, and safety, health and environment
Increase capacity and build on leading market position
Develop feedstock advantage to improve cost competitiveness
Develop and nurture human capital
5
6
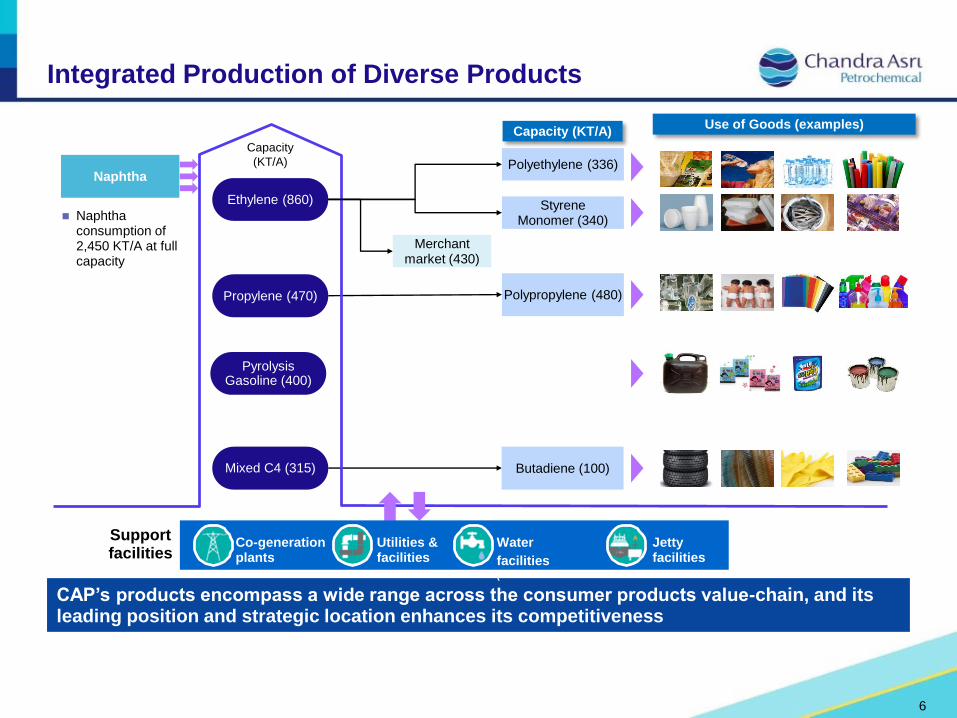
CAP’s products encompass a wide range across the consumer products value-chain, and its leading position and strategic location enhances its competitiveness
Integrated Production of Diverse Products
Ethylene (860)
Propylene (470)
PyrolysisGasoline (400)
Mixed C4 (315)
Polypropylene (480)
Capacity (KT/A)Use of Goods (examples)
Naphtha consumption of 2,450 KT/A at full capacity
Polyethylene (336)
Styrene Monomer (340)
Naphtha
Co-generation plants
Utilities & facilities
Water
facilities(
Jetty facilities
Support facilities
Butadiene (100)
(KT/A)
Merchant market (430)
Capacity
6
CapacityPolytama Others Total('000 tons per year)
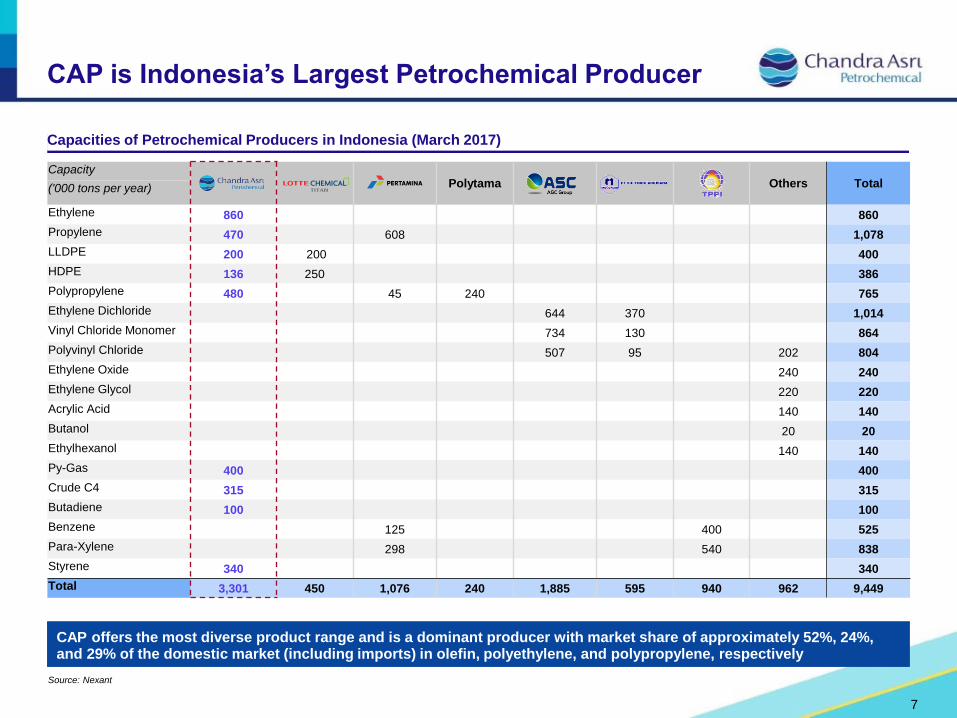
Ethylene 860 860
Propylene 470 608 1,078
LLDPE 200 200 400
HDPE 136 250 386
Polypropylene 480 45 240 765
Ethylene Dichloride 644 370 1,014
Vinyl Chloride Monomer 734 130 864
Polyvinyl Chloride 507 95 202 804
Ethylene Oxide 240 240
Ethylene Glycol 220 220
Acrylic Acid 140 140
Butanol 20 20
Ethylhexanol 140 140
Py-Gas 400 400
Crude C4 315 315
Butadiene 100 100
Benzene 125 400 525
Para-Xylene 298 540 838
Styrene 340 340
Total 3,301 450 1,076 240 1,885 595 940 962 9,449
CAP is Indonesia’s Largest Petrochemical Producer
7
Source: Nexant
Capacities of Petrochemical Producers in Indonesia (March 2017)
CAP offers the most diverse product range and is a dominant producer with market share of approximately 52%, 24%, and 29% of the domestic market (including imports) in olefin, polyethylene, and polypropylene, respectively

Strategically Located to Supply Key Customers
8
CAP’s Integrated Petrochemical Complexes
Cilegon
Merak
Jetty CAP PipelineToll Road Road
Puloampel-
Serang
Styrene Monomer Plant
Capacity 340 KT/A
Sriwie
DongjinLautan Otsuka
AsahimasPolypet PET
Polyprima PTAARCO PPG
Amoco Mitsui
TITAN PE
Mitsubishi KaseiPIPI PS and SBL
Unggul Indah ABProintail
Statomer PVC
Buana Sulfindo
Santa Fe
Rhone Poulenc SBLSulfindo Adiusaha
NAOH, CL2
Golden Key ABSMultisidia
Risjad BrasaliEPS, SAN
Trans BakrieCont Carbon CB
Indochlor
Sintetikajaya
Showa Esterindo Sulfindo Adi. PVC
PolychemRedeco
Cabot
Siemens
Hoechst
KS
Dow Chemical
Air Liquide
UAP
Customers with pipeline access
NSI
Sulfindo Adi. EDC, VCM
Indonesia
Cilegon
Integrated Complex
Anyer
NIntegrated Complex
Main Plant Capacity (KT/A)
− Ethylene: 860
− Propylene: 470
− Py-Gas: 400
− Mixed C4: 315
− Polyethylene: 336
− Polypropylene: 480
Butadiene Plant: 100 KT/A
On-Site Power
Jakarta
Location proximity and well established pipeline ensures excellent connectivity to key customers. This coupled with reliability of supply lead to premium pricing, with integration of facilities creating significant barriers to entry.
CAP52%
24%
24%
Import
Pertamina
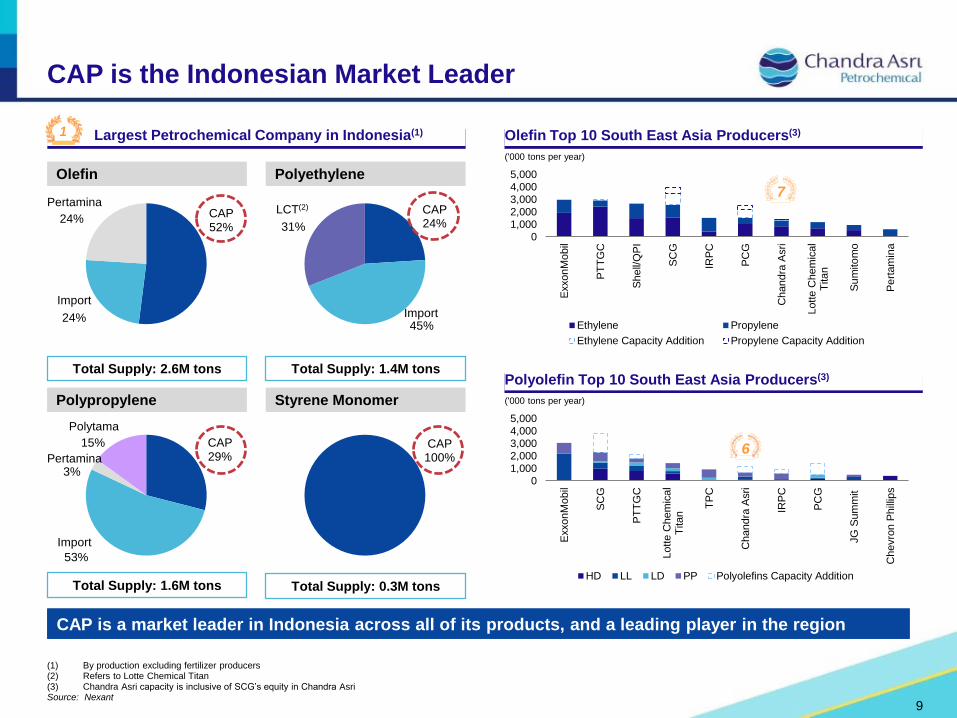
CAP is the Indonesian Market Leader
9
Polyolefin Top 10 South East Asia Producers(3)
Largest Petrochemical Company in Indonesia(1)1 Olefin Top 10 South East Asia Producers(3)
CAP is a market leader in Indonesia across all of its products, and a leading player in the region
Olefin Polyethylene
Polypropylene Styrene Monomer
Total Supply: 1.4M tons
Total Supply: 1.6M tons Total Supply: 0.3M tons
Total Supply: 2.6M tons
CAP24%
45%
31%
Import
LCT(2)
CAP29%
53%
3%
15%
Import
Polytama
Pertamina
CAP100%
(1) By production excluding fertilizer producers(2) Refers to Lotte Chemical Titan(3) Chandra Asri capacity is inclusive of SCG’s equity in Chandra AsriSource: Nexant
01,0002,0003,0004,0005,000
ExxonM
obil
PT
TG
C
Sh
ell/
QP
I
SC
G
IRP
C
PC
G
Chandra
Asri
Lotte C
hem
ical
Titan
Su
mito
mo
Pe
rtam
ina
Ethylene Propylene
Ethylene Capacity Addition Propylene Capacity Addition
('000 tons per year)
7
01,0002,0003,0004,0005,000
ExxonM
obil
SC
G
PT
TG
C
Lotte C
hem
ical
Titan
TP
C
Chandra
Asri
IRP
C
PC
G
JG
Sum
mit
Chevro
n P
hill
ips
HD LL LD PP Polyolefins Capacity Addition
('000 tons per year)
6
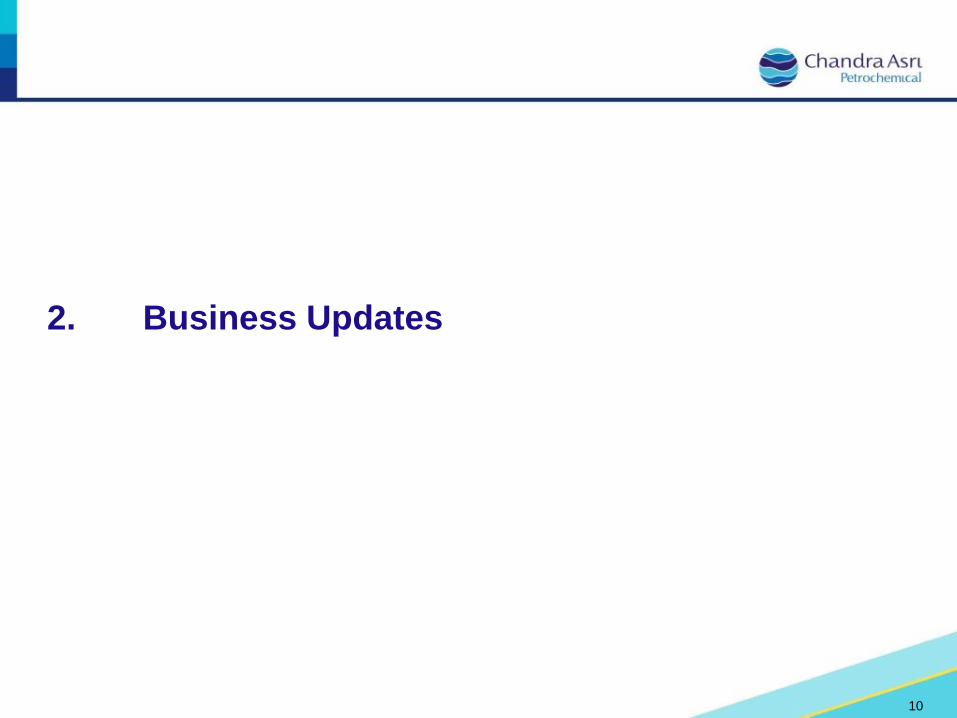
2. Business Updates
10
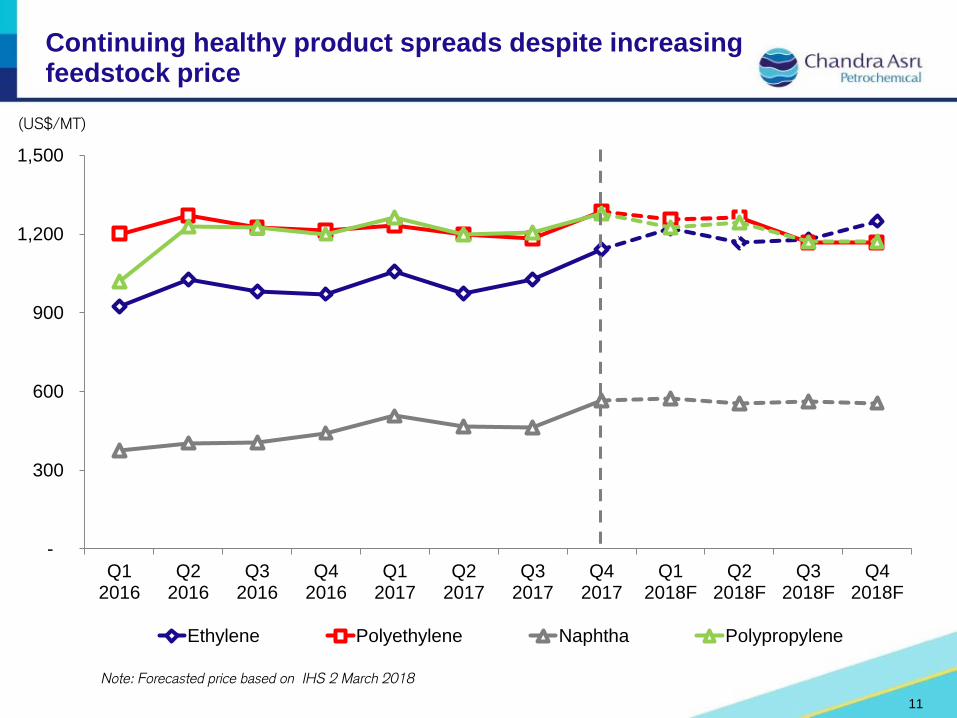
Continuing healthy product spreads despite increasing feedstock price
-
300
600
900
1,200
1,500
Q12016
Q22016
Q32016
Q42016
Q12017
Q22017
Q32017
Q42017
Q12018F
Q22018F
Q32018F
Q42018F
Ethylene Polyethylene Naphtha Polypropylene
Note: Forecasted price based on IHS 2 March 2018
(US$/MT)
11
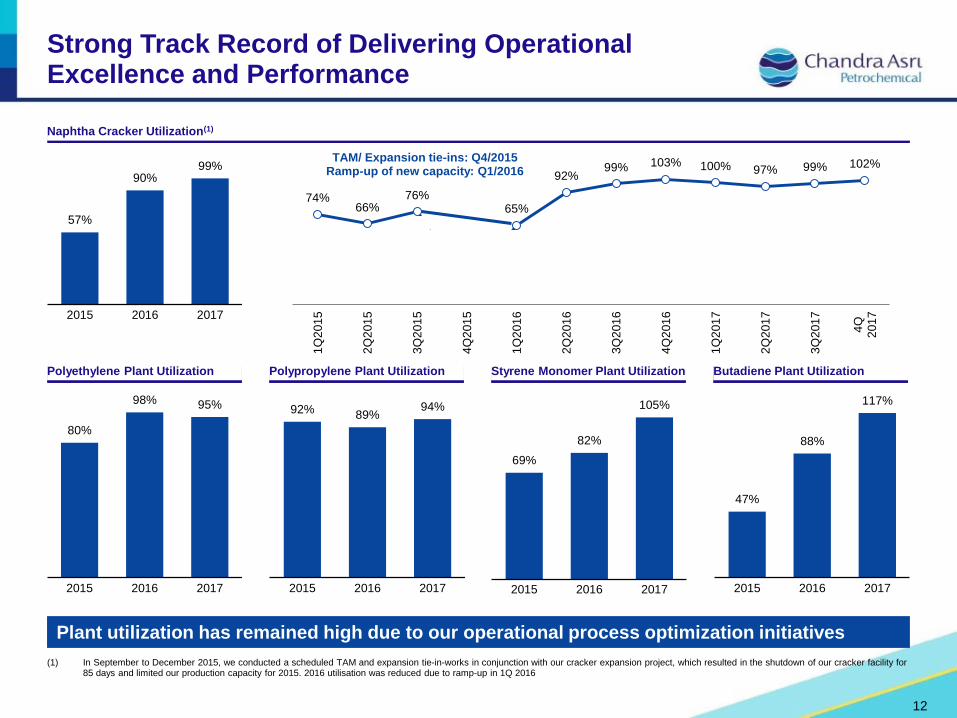
Plant utilization has remained high due to our operational process optimization initiatives
Polyethylene Plant Utilization
Naphtha Cracker Utilization(1)
Strong Track Record of Delivering Operational Excellence and Performance
Polypropylene Plant Utilization Styrene Monomer Plant Utilization Butadiene Plant Utilization
80%
98% 95%
2015 2016 2017
92% 89%94%
2015 2016 2017
69%
82%
105%
2015 2016 2017
47%
88%
117%
2015 2016 2017
(1) In September to December 2015, we conducted a scheduled TAM and expansion tie-in-works in conjunction with our cracker expansion project, which resulted in the shutdown of our cracker facility for 85 days and limited our production capacity for 2015. 2016 utilisation was reduced due to ramp-up in 1Q 2016
74%66%
76%
11%
65%
92%99% 103% 100% 97% 99% 102%
1Q
201
5
2Q
201
5
3Q
201
5
4Q
201
5
1Q
201
6
2Q
201
6
3Q
201
6
4Q
201
6
1Q
201
7
2Q
201
7
3Q
201
7
4Q
201
7
TAM/ Expansion tie-ins: Q4/2015Ramp-up of new capacity: Q1/2016
57%
90%99%
2015 2016 2017
12
Polypropylene Plant
Naphtha Cracker
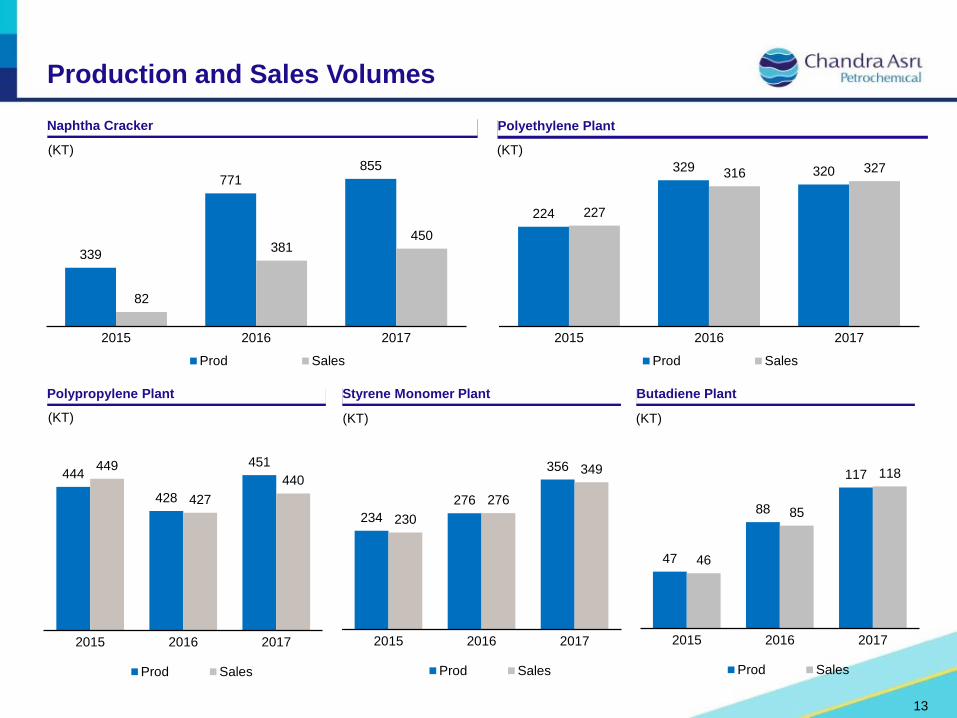
Production and Sales Volumes
Polyethylene Plant
Styrene Monomer Plant Butadiene Plant
339
771855
82
381450
2015 2016 2017
Prod Sales
224
329 320
227
316 327
2015 2016 2017
Prod Sales
444
428
451449
427
440
2015 2016 2017
Prod Sales
234
276
356
230
276
349
2015 2016 2017
Prod Sales
47
88
117
46
85
118
2015 2016 2017
Prod Sales
(KT) (KT)
(KT) (KT) (KT)
13
3. Growth Projects
14
15
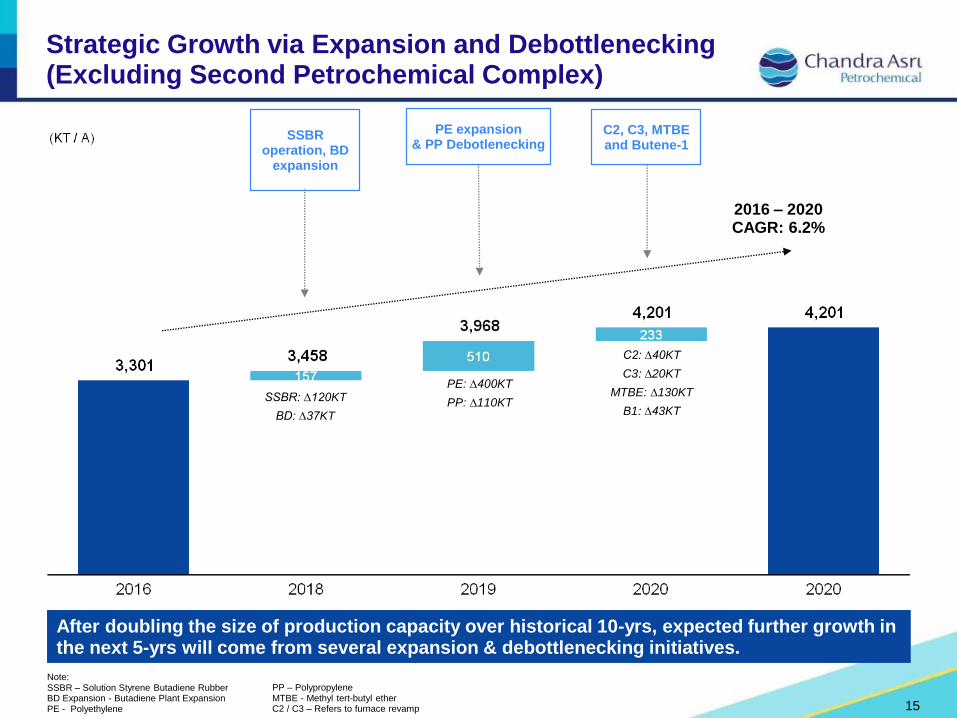
2016 – 2020 CAGR: 6.2%
SSBR: ∆120KT
BD: ∆37KT
C2: ∆40KT
C3: ∆20KT
MTBE: ∆130KT
B1: ∆43KT
SSBR operation, BD
expansion
C2, C3, MTBE and Butene-1
Strategic Growth via Expansion and Debottlenecking (Excluding Second Petrochemical Complex)
PE: ∆400KT
PP: ∆110KT
PE expansion& PP Debotlenecking
After doubling the size of production capacity over historical 10-yrs, expected further growth in the next 5-yrs will come from several expansion & debottlenecking initiatives.
Note: SSBR – Solution Styrene Butadiene RubberBD Expansion - Butadiene Plant ExpansionPE - Polyethylene
PP – PolypropyleneMTBE - Methyl tert-butyl ether C2 / C3 – Refers to furnace revamp
Furnace Revamp
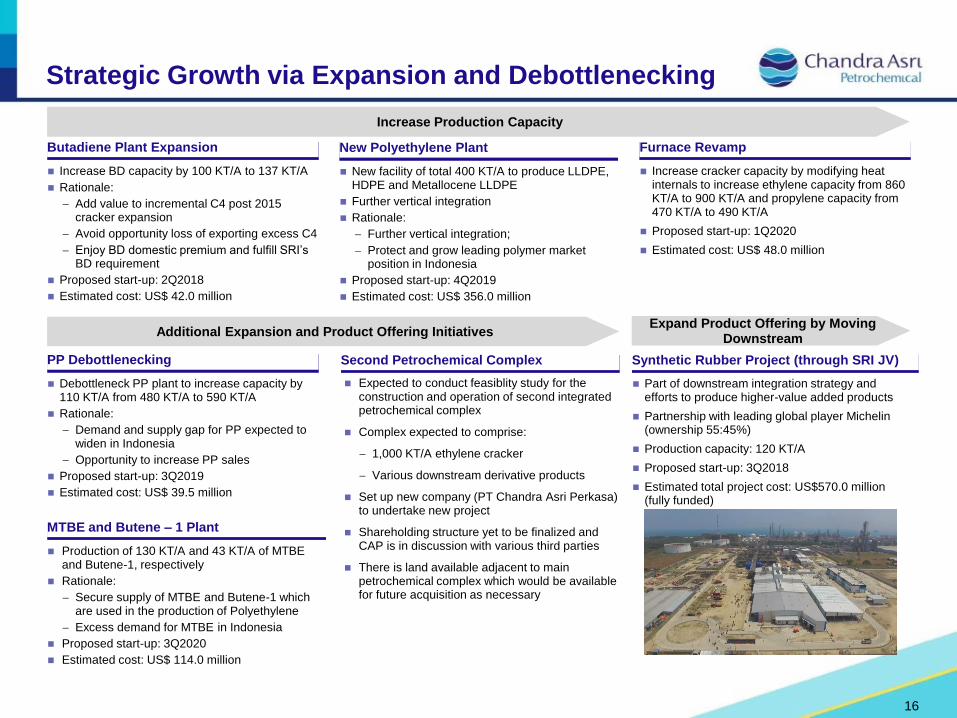
Increase BD capacity by 100 KT/A to 137 KT/A
Rationale:
− Add value to incremental C4 post 2015 cracker expansion
− Avoid opportunity loss of exporting excess C4
− Enjoy BD domestic premium and fulfill SRI’s BD requirement
Proposed start-up: 2Q2018
Estimated cost: US$ 42.0 million
Butadiene Plant Expansion
Strategic Growth via Expansion and Debottlenecking
Increase cracker capacity by modifying heat internals to increase ethylene capacity from 860 KT/A to 900 KT/A and propylene capacity from 470 KT/A to 490 KT/A
Proposed start-up: 1Q2020
Estimated cost: US$ 48.0 million
New facility of total 400 KT/A to produce LLDPE, HDPE and Metallocene LLDPE
Further vertical integration
Rationale:
− Further vertical integration;
− Protect and grow leading polymer market position in Indonesia
Proposed start-up: 4Q2019
Estimated cost: US$ 356.0 million
New Polyethylene Plant
Increase Production Capacity
Additional Expansion and Product Offering Initiatives
Expected to conduct feasiblity study for the construction and operation of second integrated petrochemical complex
Complex expected to comprise:
− 1,000 KT/A ethylene cracker
− Various downstream derivative products
Set up new company (PT Chandra Asri Perkasa) to undertake new project
Shareholding structure yet to be finalized and CAP is in discussion with various third parties
There is land available adjacent to main petrochemical complex which would be available for future acquisition as necessary
Second Petrochemical Complex
Production of 130 KT/A and 43 KT/A of MTBE and Butene-1, respectively
Rationale:
− Secure supply of MTBE and Butene-1 which are used in the production of Polyethylene
− Excess demand for MTBE in Indonesia
Proposed start-up: 3Q2020
Estimated cost: US$ 114.0 million
MTBE and Butene – 1 Plant
PP Debottlenecking
Debottleneck PP plant to increase capacity by 110 KT/A from 480 KT/A to 590 KT/A
Rationale:
− Demand and supply gap for PP expected to widen in Indonesia
− Opportunity to increase PP sales
Proposed start-up: 3Q2019
Estimated cost: US$ 39.5 million
Expand Product Offering by Moving Downstream
Synthetic Rubber Project (through SRI JV)
Part of downstream integration strategy and efforts to produce higher-value added products
Partnership with leading global player Michelin (ownership 55:45%)
Production capacity: 120 KT/A
Proposed start-up: 3Q2018
Estimated total project cost: US$570.0 million (fully funded)
16
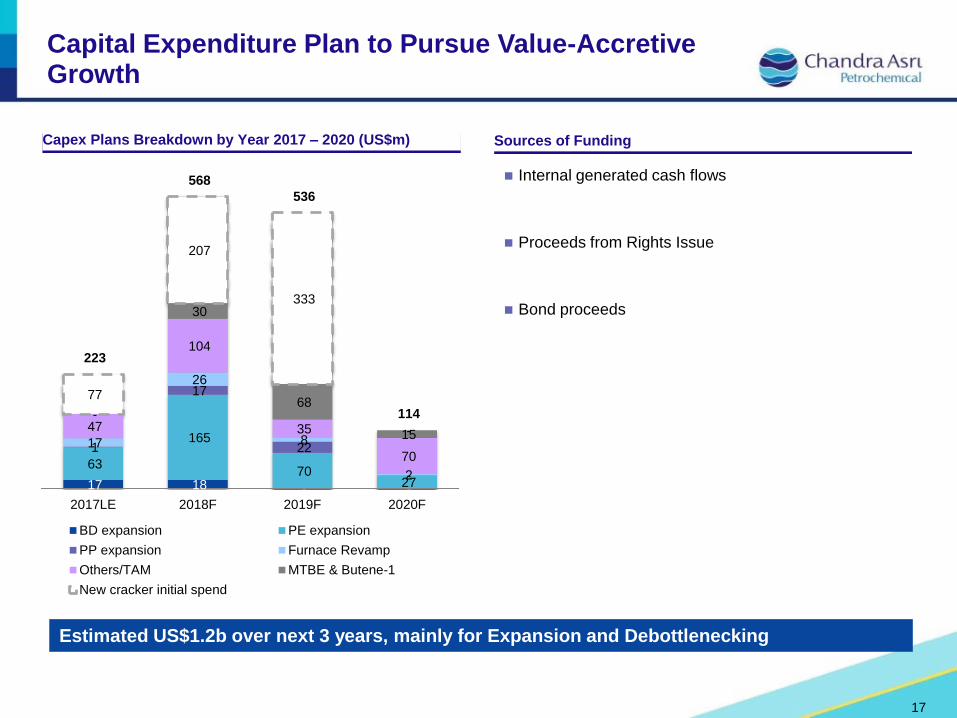
Estimated US$1.2b over next 3 years, mainly for Expansion and Debottlenecking
Capital Expenditure Plan to Pursue Value-Accretive Growth
Capex Plans Breakdown by Year 2017 – 2020 (US$m)
17 18 - -
63
165
70 27
1
17
22
-
17
26
8
2
47
104
35
70
-
30
68
15
77
207
333
-
223
568
536
114
2017LE 2018F 2019F 2020F
BD expansion PE expansion
PP expansion Furnace Revamp
Others/TAM MTBE & Butene-1
New cracker initial spend
Internal generated cash flows
Proceeds from Rights Issue
Bond proceeds
Sources of Funding
17
4. Financial Highlights
18
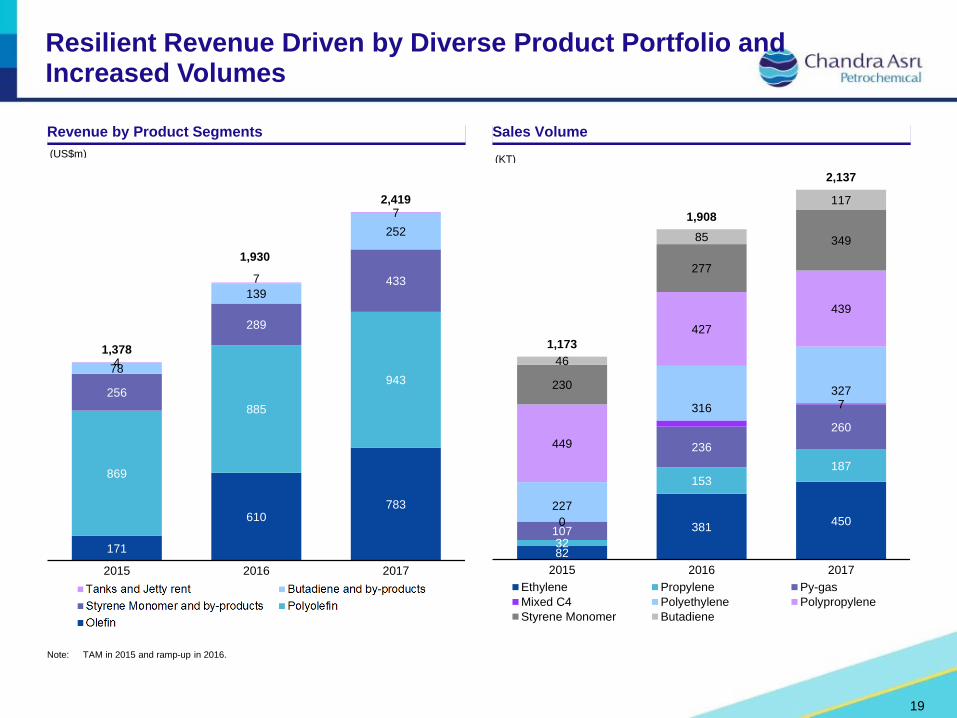
Sales VolumeRevenue by Product Segments
Resilient Revenue Driven by Diverse Product Portfolio and Increased Volumes
171
610 783
869
885
943 256
289
433
78
139
252
4
7
7
1,378
1,930
2,419
2015 2016 2017
(US$m)
82
381450
32
153
187
107
236
260
0
7
227
316
327
449
427
439
230
277
349
46
85
117
1,173
1,908
2,137
2015 2016 2017
Ethylene Propylene Py-gas
Mixed C4 Polyethylene Polypropylene
Styrene Monomer Butadiene
(KT)
Note: TAM in 2015 and ramp-up in 2016.
19
26
300 319
2015 2016 2017
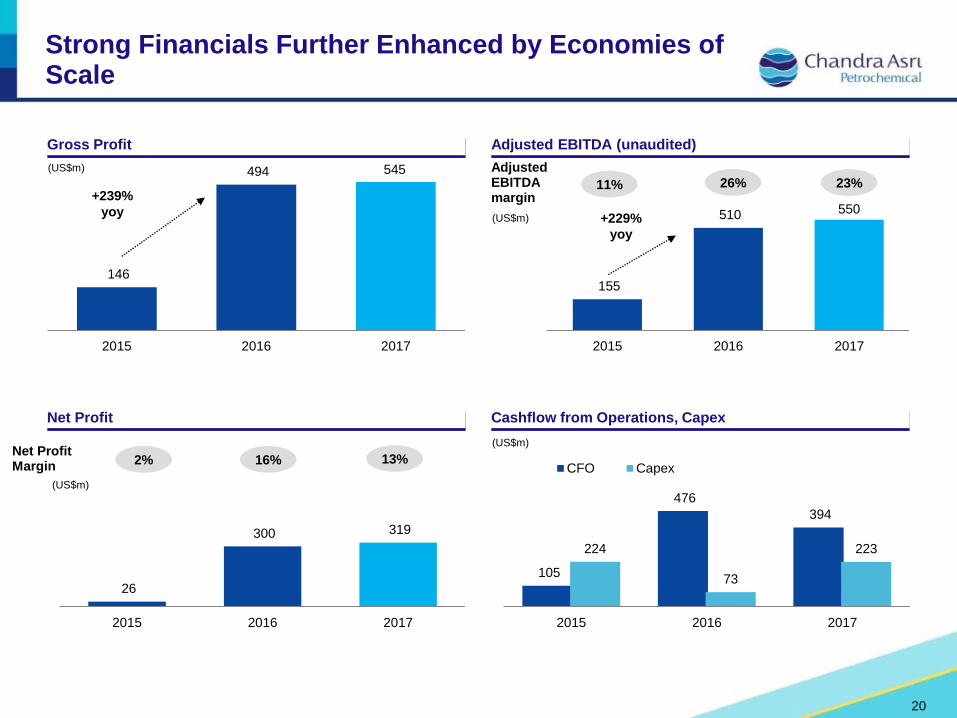
Strong Financials Further Enhanced by Economies of Scale
146
494
2015 2016 2017
155
510
2015 2016 2017
Gross Profit Adjusted EBITDA (unaudited)
Net Profit Cashflow from Operations, Capex
+239%
yoy+229%
yoy
Adjusted EBITDA margin
23%26%11%
Net ProfitMargin
20
105
476
394
224
73
223
2015 2016 2017
CFO Capex13%16%2%
(US$m)
(US$m)
(US$m)
(US$m)
545
550
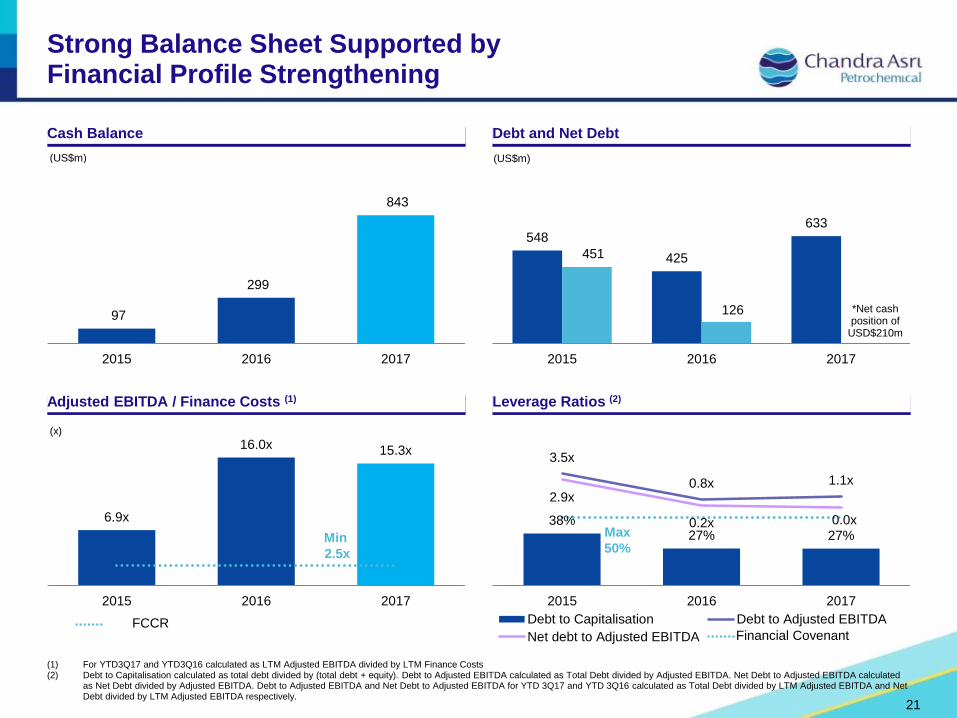
6.9x
16.0x 15.3x
2015 2016 2017
(x)
Strong Balance Sheet Supported byFinancial Profile Strengthening
Cash Balance Debt and Net Debt
Adjusted EBITDA / Finance Costs (1) Leverage Ratios (2)
97
299
843
2015 2016 2017
(US$m)
548
425
633
451
126
2015 2016 2017
(US$m)
Min
2.5x
21
38%27% 27%
3.5x
0.8x 1.1x
2.9x
0.2x 0.0x
2015 2016 2017
Debt to Capitalisation Debt to Adjusted EBITDA
Net debt to Adjusted EBITDA
Max
50%
(1) For YTD3Q17 and YTD3Q16 calculated as LTM Adjusted EBITDA divided by LTM Finance Costs(2) Debt to Capitalisation calculated as total debt divided by (total debt + equity). Debt to Adjusted EBITDA calculated as Total Debt divided by Adjusted EBITDA. Net Debt to Adjusted EBITDA calculated
as Net Debt divided by Adjusted EBITDA. Debt to Adjusted EBITDA and Net Debt to Adjusted EBITDA for YTD 3Q17 and YTD 3Q16 calculated as Total Debt divided by LTM Adjusted EBITDA and Net Debt divided by LTM Adjusted EBITDA respectively.
FCCRFinancial Covenant
*Net cash position of
USD$210m
Appendix
22
Key Investment Highlights
23
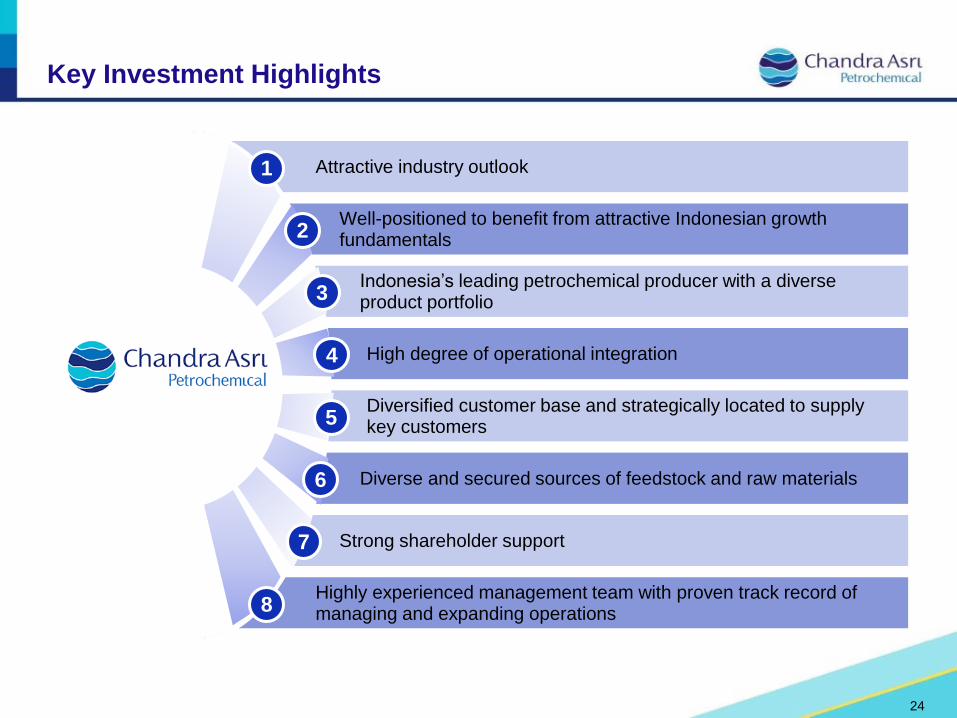
Key Investment Highlights
24
Well-positioned to benefit from attractive Indonesian growth fundamentals
Indonesia’s leading petrochemical producer with a diverse product portfolio
High degree of operational integration
Diversified customer base and strategically located to supply key customers
Diverse and secured sources of feedstock and raw materials
Strong shareholder support
Highly experienced management team with proven track record of managing and expanding operations
Attractive industry outlook
2
3
4
5
6
7
8
1
350
400
450
500
550
600
650
700
750
800
850
2009 2011 2013 2015 2017F 2019F 2021F 2023F
LDPE - Naphtha LLDPE - NaphthaHDPE - Naphtha PP - Naphtha
(US$/t)
300
600
900
1200
2009 2011 2013 2015 2017F 2019F 2021F 2023F
(US$/t, real prices)
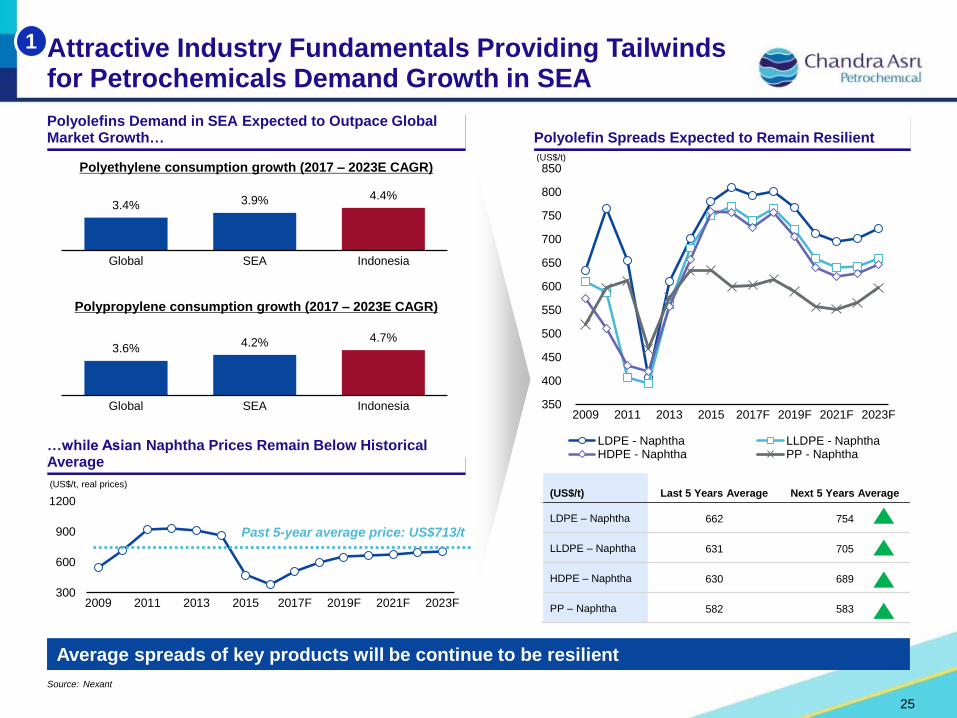
Attractive Industry Fundamentals Providing Tailwinds for Petrochemicals Demand Growth in SEA
25
…while Asian Naphtha Prices Remain Below Historical Average
Past 5-year average price: US$713/t
Polyethylene consumption growth (2017 – 2023E CAGR)
Polypropylene consumption growth (2017 – 2023E CAGR)
Polyolefins Demand in SEA Expected to Outpace Global Market Growth… Polyolefin Spreads Expected to Remain Resilient
Source: Nexant
1
3.4% 3.9% 4.4%
Global SEA Indonesia
3.6% 4.2% 4.7%
Global SEA Indonesia
(US$/t) Last 5 Years Average Next 5 Years Average
LDPE – Naphtha 662 754
LLDPE – Naphtha 631 705
HDPE – Naphtha 630 689
PP – Naphtha 582 583
Average spreads of key products will be continue to be resilient
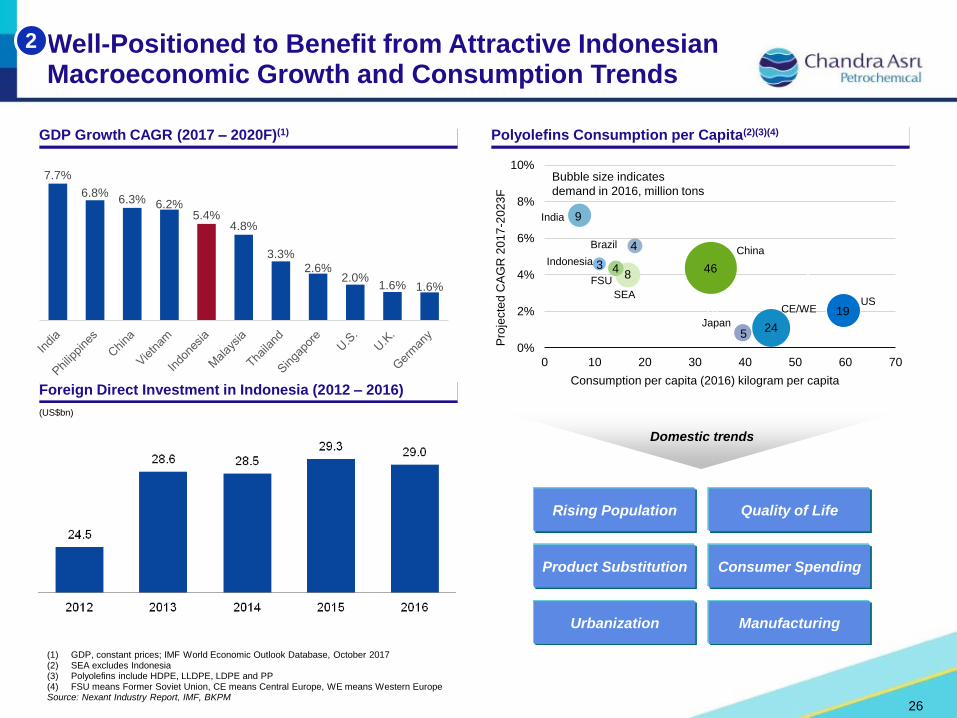
Well-Positioned to Benefit from Attractive Indonesian Macroeconomic Growth and Consumption Trends
26
(1) GDP, constant prices; IMF World Economic Outlook Database, October 2017(2) SEA excludes Indonesia(3) Polyolefins include HDPE, LLDPE, LDPE and PP(4) FSU means Former Soviet Union, CE means Central Europe, WE means Western EuropeSource: Nexant Industry Report, IMF, BKPM
2
Polyolefins Consumption per Capita(2)(3)(4)GDP Growth CAGR (2017 – 2020F)(1)
Foreign Direct Investment in Indonesia (2012 – 2016)
(US$bn)
Product Substitution Consumer Spending
Quality of LifeRising Population
Domestic trends
0%
2%
4%
6%
8%
10%
0 10 20 30 40 50 60 70
Pro
jecte
d C
AG
R 2
01
7-2
02
3F
Consumption per capita (2016) kilogram per capita
Bubble size indicates
demand in 2016, million tons
9
46
19
24
4
8
5
3
2
28
4FSU
SEA
Indonesia
India
BrazilChina
Japan
CE/WEUS
Urbanization Manufacturing
7.7%
6.8%6.3% 6.2%
5.4%4.8%
3.3%
2.6%2.0%
1.6% 1.6%
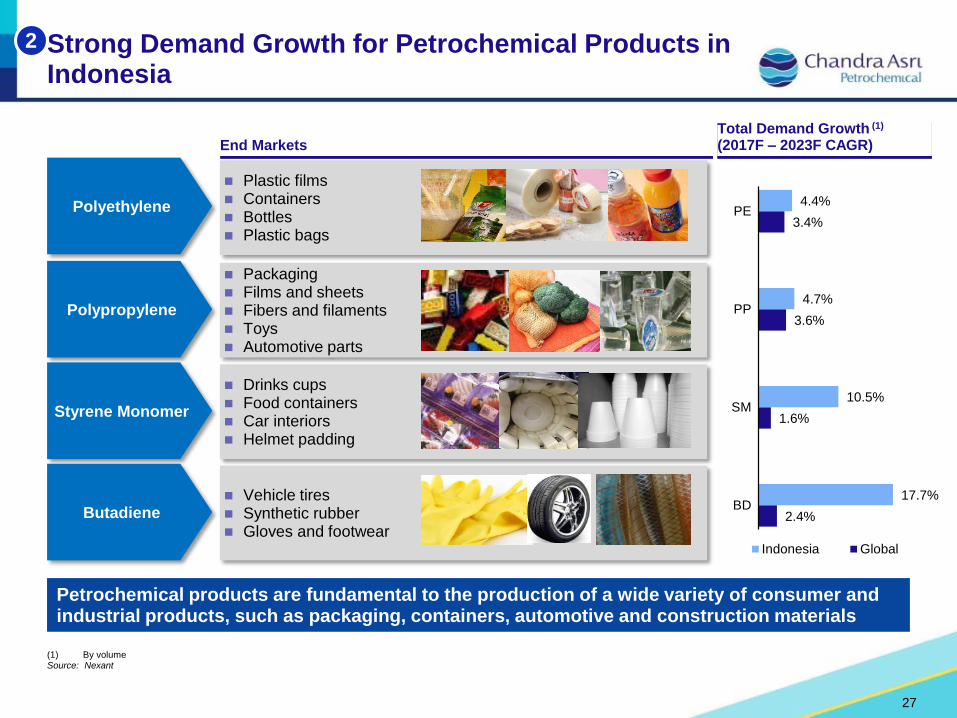
Strong Demand Growth for Petrochemical Products in Indonesia
27
2
2.4%
1.6%
3.6%
3.4%
17.7%
10.5%
4.7%
4.4%
BD
SM
PP
PE
Indonesia Global
Petrochemical products are fundamental to the production of a wide variety of consumer and industrial products, such as packaging, containers, automotive and construction materials
Packaging Films and sheets Fibers and filaments Toys Automotive parts
Polyethylene
Plastic films Containers Bottles Plastic bags
Drinks cups Food containers Car interiors Helmet padding
Vehicle tires Synthetic rubber Gloves and footwear
End MarketsTotal Demand Growth (1)
(2017F – 2023F CAGR)
Polypropylene
Styrene Monomer
Butadiene
(1) By volumeSource: Nexant
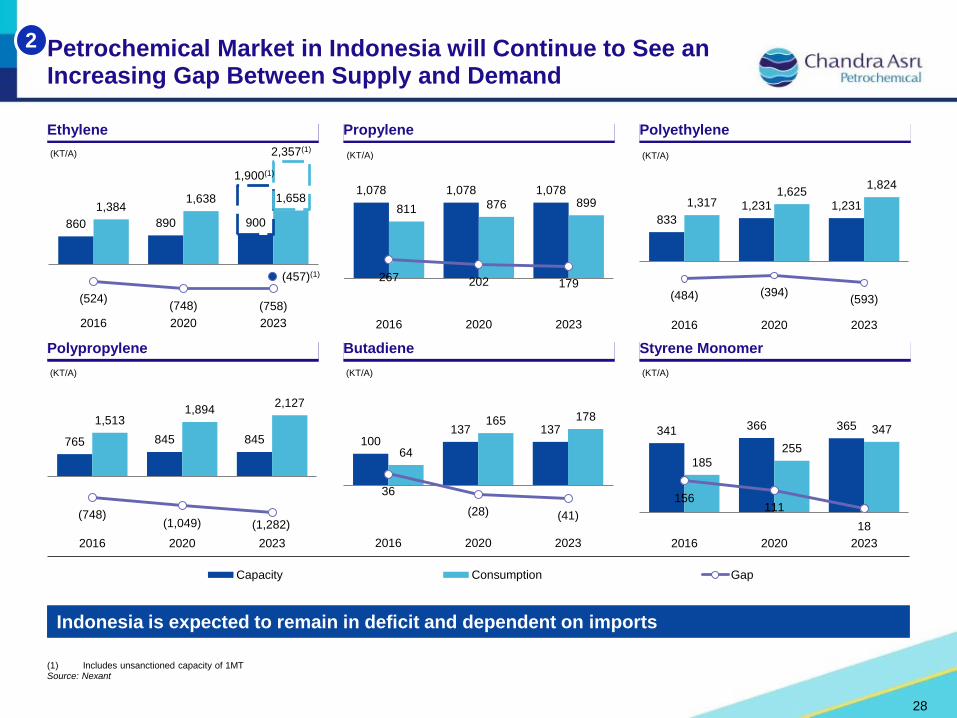
Indonesia is expected to remain in deficit and dependent on imports
Styrene MonomerButadienePolypropylene
PolyethylenePropyleneEthylene
Petrochemical Market in Indonesia will Continue to See an Increasing Gap Between Supply and Demand
(1) Includes unsanctioned capacity of 1MTSource: Nexant
2
860 890 900
1,384 1,638 1,658
(524)(748) (758)
2016 2020 2023
(KT/A)
1,078 1,078 1,078
811 876 899
267 202 179
2016 2020 2023
(KT/A)
833
1,231 1,231 1,317 1,625
1,824
(484) (394)(593)
2016 2020 2023
(KT/A)
765 845 845
1,513 1,894
2,127
(748)(1,049) (1,282)
2016 2020 2023
(KT/A)
100 137 137
64
165 178
36
(28) (41)
2016 2020 2023
(KT/A)
341 366 365
185
255
347
156 111
18
2016 2020 2023
(KT/A)
Capacity Consumption Gap
1,900(1)
2,357(1)
(457)(1)
28

CAP52%
24%
24%
Import
Pertamina
CAP is the Indonesian Market Leader
29
3
Polyolefin Top 10 South East Asia Producers(3)
Largest Petrochemical Company in Indonesia(1)1 Olefin Top 10 South East Asia Producers(3)
CAP is a market leader in Indonesia across all of its products, and a leading player in the region
Olefin Polyethylene
Polypropylene Styrene Monomer
Total Supply: 1.4M tons
Total Supply: 1.6M tons Total Supply: 0.3M tons
Total Supply: 2.6M tons
CAP24%
45%
31%
Import
LCT(2)
CAP29%
53%
3%
15%
Import
Polytama
Pertamina
CAP100%
(1) By production excluding fertilizer producers(2) Refers to Lotte Chemical Titan(3) Chandra Asri capacity is inclusive of SCG’s equity in Chandra AsriSource: Nexant
01,0002,0003,0004,0005,000
ExxonM
obil
PT
TG
C
Sh
ell/
QP
I
SC
G
IRP
C
PC
G
Chandra
Asri
Lotte C
hem
ical
Titan
Su
mito
mo
Pe
rtam
ina
Ethylene Propylene
Ethylene Capacity Addition Propylene Capacity Addition
('000 tons per year)
7
01,0002,0003,0004,0005,000
ExxonM
obil
SC
G
PT
TG
C
Lotte C
hem
ical
Titan
TP
C
Chandra
Asri
IRP
C
PC
G
JG
Sum
mit
Chevro
n P
hill
ips
HD LL LD PP Polyolefins Capacity Addition
('000 tons per year)
6
Highly Integrated Production Process with Operational Flexibility
30
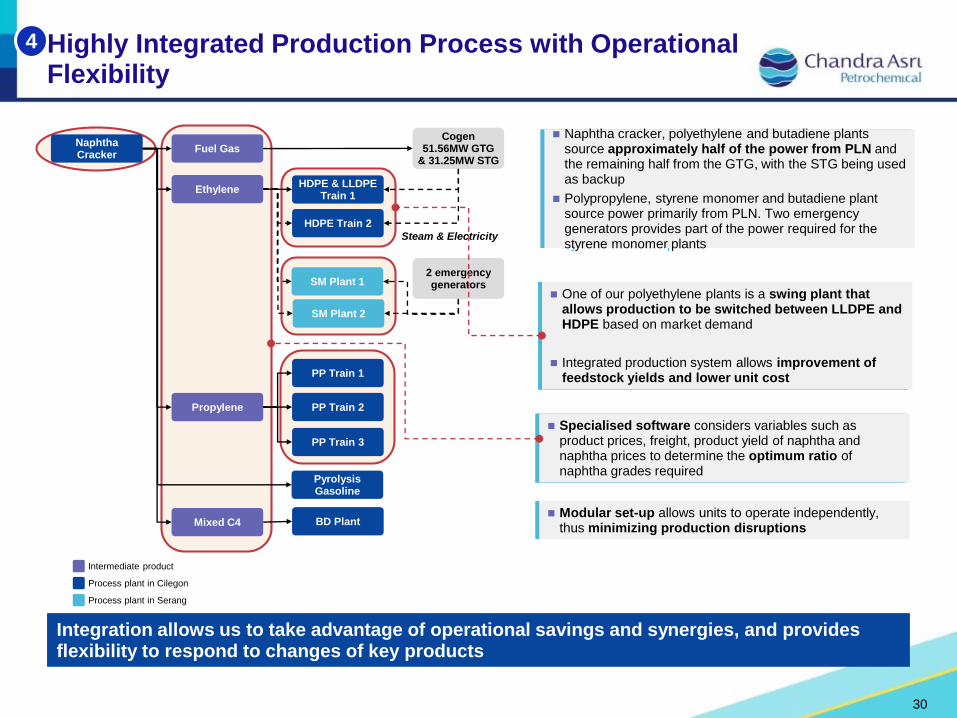
Specialised software considers variables such as product prices, freight, product yield of naphtha and naphtha prices to determine the optimum ratio of naphtha grades required
Naphtha cracker, polyethylene and butadiene plants source approximately half of the power from PLN and the remaining half from the GTG, with the STG being used as backup
Polypropylene, styrene monomer and butadiene plant source power primarily from PLN. Two emergency generators provides part of the power required for the styrene monomer plants
One of our polyethylene plants is a swing plant that allows production to be switched between LLDPE and HDPE based on market demand
Integrated production system allows improvement of feedstock yields and lower unit cost
Naphtha Cracker
Fuel GasCogen
51.56MW GTG & 31.25MW STG
EthyleneHDPE & LLDPE
Train 1
HDPE Train 2
PP Train 1
PP Train 2Propylene
PP Train 3
Pyrolysis Gasoline
Mixed C4 BD Plant
Process plant in Cilegon
Intermediate product
Process plant in Serang
Steam & Electricity
Modular set-up allows units to operate independently, thus minimizing production disruptions
SM Plant 1
SM Plant 2
2 emergency generators
4
Integration allows us to take advantage of operational savings and synergies, and provides flexibility to respond to changes of key products
Strategically Located to Supply Key Customers
31
5
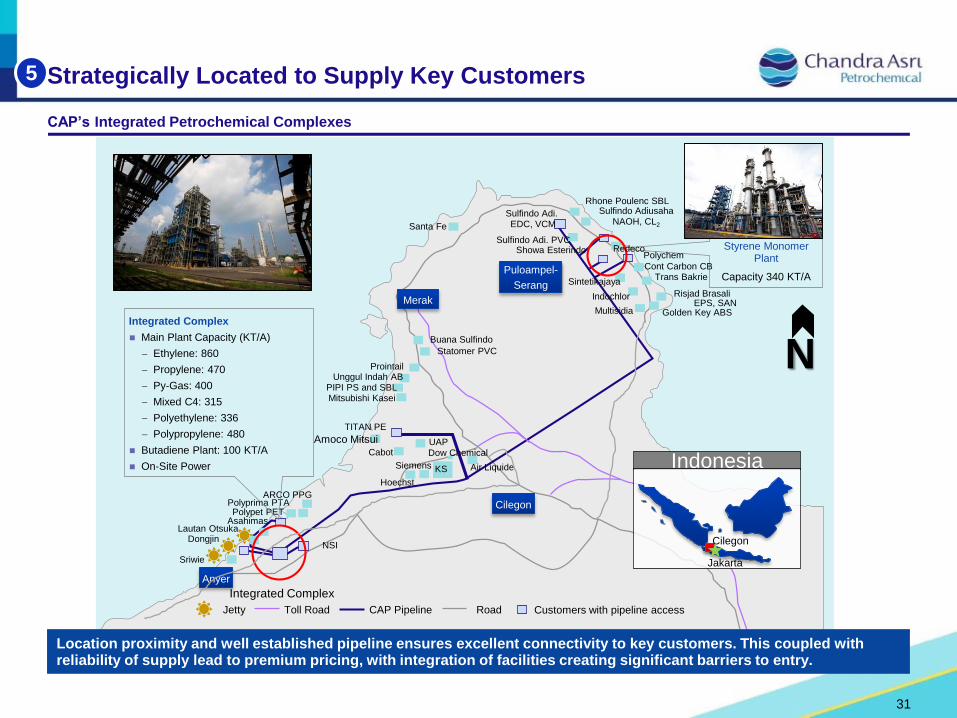
CAP’s Integrated Petrochemical Complexes
Cilegon
Merak
Jetty CAP PipelineToll Road Road
Puloampel-
Serang
Styrene Monomer Plant
Capacity 340 KT/A
Sriwie
DongjinLautan Otsuka
AsahimasPolypet PET
Polyprima PTAARCO PPG
Amoco Mitsui
TITAN PE
Mitsubishi KaseiPIPI PS and SBL
Unggul Indah ABProintail
Statomer PVC
Buana Sulfindo
Santa Fe
Rhone Poulenc SBLSulfindo Adiusaha
NAOH, CL2
Golden Key ABSMultisidia
Risjad BrasaliEPS, SAN
Trans BakrieCont Carbon CB
Indochlor
Sintetikajaya
Showa Esterindo Sulfindo Adi. PVC
PolychemRedeco
Cabot
Siemens
Hoechst
KS
Dow Chemical
Air Liquide
UAP
Customers with pipeline access
NSI
Sulfindo Adi. EDC, VCM
Indonesia
Cilegon
Integrated Complex
Anyer
NIntegrated Complex
Main Plant Capacity (KT/A)
− Ethylene: 860
− Propylene: 470
− Py-Gas: 400
− Mixed C4: 315
− Polyethylene: 336
− Polypropylene: 480
Butadiene Plant: 100 KT/A
On-Site Power
Jakarta
Location proximity and well established pipeline ensures excellent connectivity to key customers. This coupled with reliability of supply lead to premium pricing, with integration of facilities creating significant barriers to entry.
Diversified Client Base of Industry Leaders
32
Sales Breakdown (2015 – 2017)
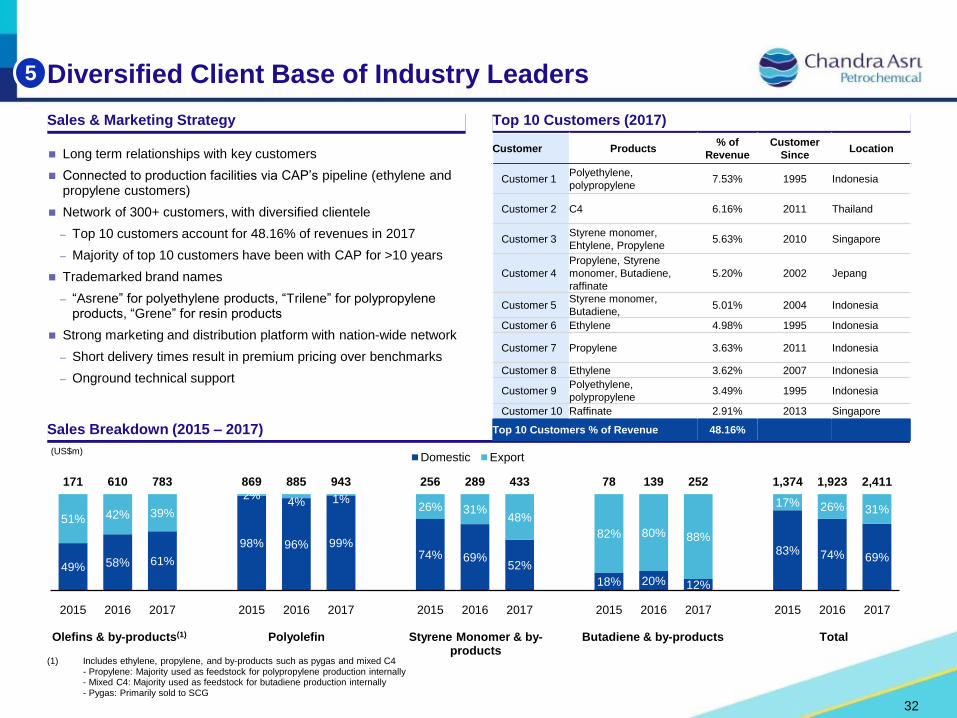
Top 10 Customers (2017)Sales & Marketing Strategy
Customer Products% of
Revenue
Customer
SinceLocation
Customer 1 Polyethylene,
polypropylene7.53% 1995 Indonesia
Customer 2 C4 6.16% 2011 Thailand
Customer 3 Styrene monomer,
Ehtylene, Propylene5.63% 2010 Singapore
Customer 4
Propylene, Styrene
monomer, Butadiene,
raffinate
5.20% 2002 Jepang
Customer 5 Styrene monomer,
Butadiene,5.01% 2004 Indonesia
Customer 6 Ethylene 4.98% 1995 Indonesia
Customer 7 Propylene 3.63% 2011 Indonesia
Customer 8 Ethylene 3.62% 2007 Indonesia
Customer 9 Polyethylene,
polypropylene3.49% 1995 Indonesia
Customer 10 Raffinate 2.91% 2013 Singapore
Top 10 Customers % of Revenue 48.16%
49% 58% 61%
98% 96% 99% 74% 69%
52%
18% 20% 12%
83% 74% 69%
51% 42% 39%
2% 4% 1%
26% 31% 48%
82% 80% 88%
17% 26% 31%
171 610 783 869 885 943 256 289 433 78 139 252 1,374 1,923 2,411
2015 2016 2017 2015 2016 2017 2015 2016 2017 2015 2016 2017 2015 2016 2017
Domestic Export(US$m)
Olefins & by-products(1) Polyolefin Styrene Monomer & by-products
Butadiene & by-products
(1) Includes ethylene, propylene, and by-products such as pygas and mixed C4- Propylene: Majority used as feedstock for polypropylene production internally- Mixed C4: Majority used as feedstock for butadiene production internally- Pygas: Primarily sold to SCG
Total
5
Long term relationships with key customers
Connected to production facilities via CAP’s pipeline (ethylene and propylene customers)
Network of 300+ customers, with diversified clientele
– Top 10 customers account for 48.16% of revenues in 2017
– Majority of top 10 customers have been with CAP for >10 years
Trademarked brand names
– “Asrene” for polyethylene products, “Trilene” for polypropylene products, “Grene” for resin products
Strong marketing and distribution platform with nation-wide network
– Short delivery times result in premium pricing over benchmarks
– Onground technical support
Stable and Flexible Feedstock Supply
33
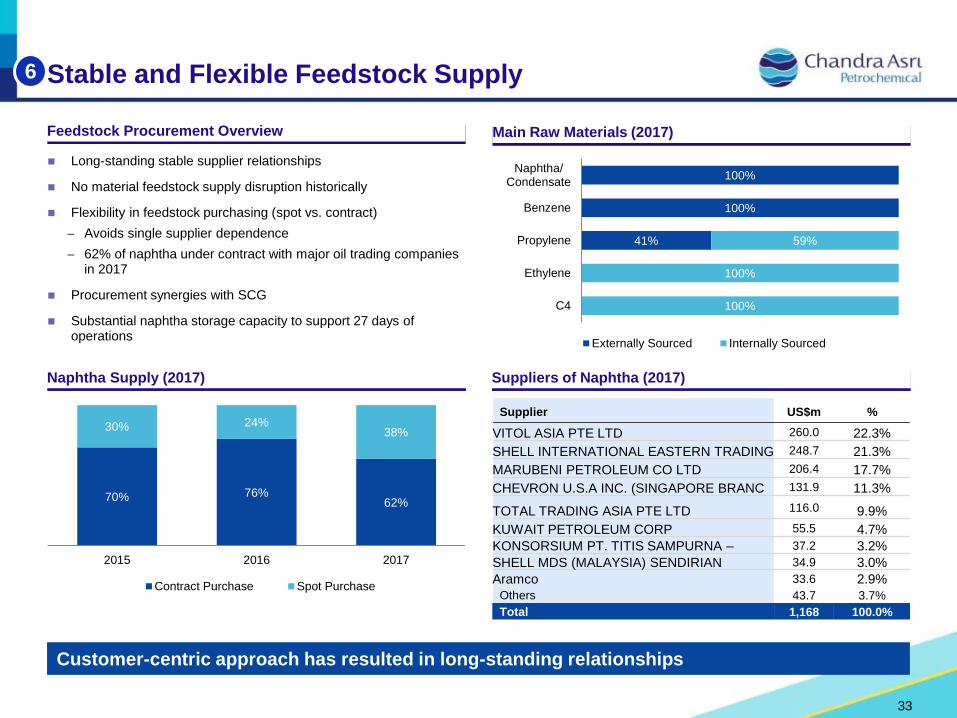
Long-standing stable supplier relationships
No material feedstock supply disruption historically
Flexibility in feedstock purchasing (spot vs. contract)
− Avoids single supplier dependence
− 62% of naphtha under contract with major oil trading companies in 2017
Procurement synergies with SCG
Substantial naphtha storage capacity to support 27 days of operations
Feedstock Procurement Overview Main Raw Materials (2017)
Suppliers of Naphtha (2017)
41%
100%
100%
100%
100%
59%
C4
Ethylene
Propylene
Benzene
Naphtha/Condensate
Externally Sourced Internally Sourced
6
Customer-centric approach has resulted in long-standing relationships
Naphtha Supply (2017)
70% 76%62%
30% 24%38%
2015 2016 2017
Contract Purchase Spot Purchase
Supplier US$m %
VITOL ASIA PTE LTD 260.0 22.3%
SHELL INTERNATIONAL EASTERN TRADING 248.7 21.3%
MARUBENI PETROLEUM CO LTD 206.4 17.7%
CHEVRON U.S.A INC. (SINGAPORE BRANC 131.9 11.3%
TOTAL TRADING ASIA PTE LTD 116.0 9.9%
KUWAIT PETROLEUM CORP 55.5 4.7%
KONSORSIUM PT. TITIS SAMPURNA – 37.2 3.2%
SHELL MDS (MALAYSIA) SENDIRIAN 34.9 3.0%
Aramco 33.6 2.9%
Others 43.7 3.7%
Total 1,168 100.0%
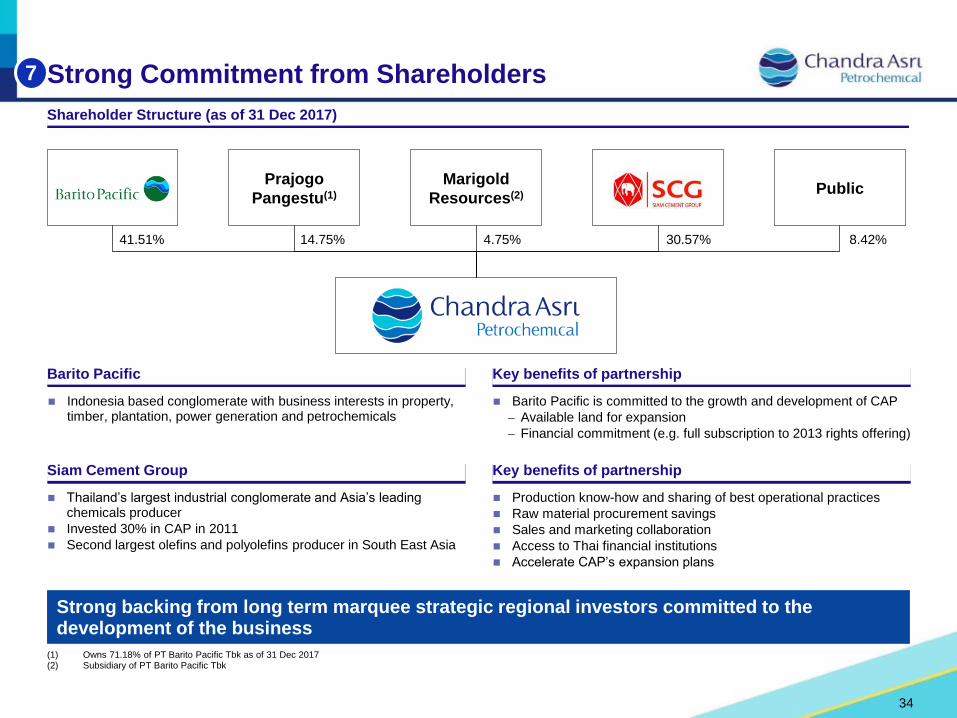
Strong Commitment from Shareholders
34
7
Thailand’s largest industrial conglomerate and Asia’s leading chemicals producer
Invested 30% in CAP in 2011
Second largest olefins and polyolefins producer in South East Asia
Shareholder Structure (as of 31 Dec 2017)
Siam Cement Group Key benefits of partnership
Production know-how and sharing of best operational practices
Raw material procurement savings
Sales and marketing collaboration
Access to Thai financial institutions
Accelerate CAP’s expansion plans
41.51% 8.42%30.57%
PublicPrajogo
Pangestu(1)
Marigold
Resources(2)
4.75%14.75%
(1) Owns 71.18% of PT Barito Pacific Tbk as of 31 Dec 2017 (2) Subsidiary of PT Barito Pacific Tbk
Strong backing from long term marquee strategic regional investors committed to the development of the business
Indonesia based conglomerate with business interests in property, timber, plantation, power generation and petrochemicals
Barito Pacific Key benefits of partnership
Barito Pacific is committed to the growth and development of CAP
− Available land for expansion
− Financial commitment (e.g. full subscription to 2013 rights offering)
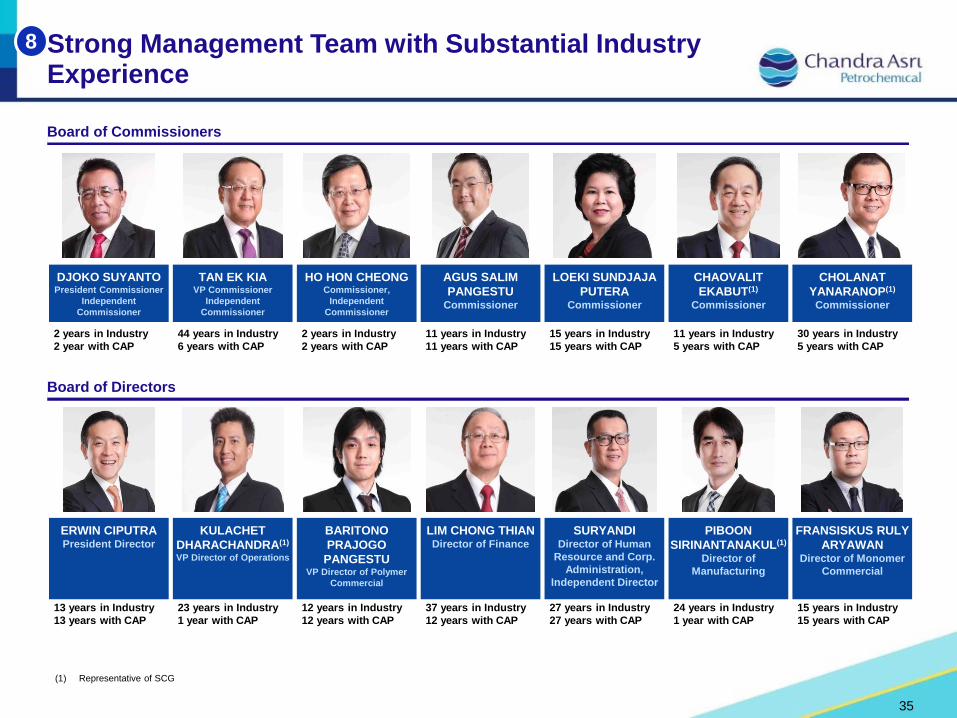
Strong Management Team with Substantial Industry Experience
35
8
(1) Representative of SCG
DJOKO SUYANTOPresident Commissioner
Independent
Commissioner
2 years in Industry
2 year with CAP
TAN EK KIAVP Commissioner
Independent
Commissioner
44 years in Industry
6 years with CAP
HO HON CHEONGCommissioner,
Independent
Commissioner
2 years in Industry
2 years with CAP
LOEKI SUNDJAJA
PUTERACommissioner
15 years in Industry
15 years with CAP
AGUS SALIM
PANGESTUCommissioner
11 years in Industry
11 years with CAP
CHAOVALIT
EKABUT(1)
Commissioner
11 years in Industry
5 years with CAP
CHOLANAT
YANARANOP(1)
Commissioner
30 years in Industry
5 years with CAP
ERWIN CIPUTRAPresident Director
13 years in Industry
13 years with CAP
KULACHET
DHARACHANDRA(1)
VP Director of Operations
23 years in Industry
1 year with CAP
BARITONO
PRAJOGO
PANGESTUVP Director of Polymer
Commercial
12 years in Industry
12 years with CAP
LIM CHONG THIANDirector of Finance
37 years in Industry
12 years with CAP
PIBOON
SIRINANTANAKUL(1)
Director of
Manufacturing
24 years in Industry
1 year with CAP
FRANSISKUS RULY
ARYAWANDirector of Monomer
Commercial
15 years in Industry
15 years with CAP
SURYANDIDirector of Human
Resource and Corp.
Administration,
Independent Director
27 years in Industry
27 years with CAP
Board of Directors
Board of Commissioners
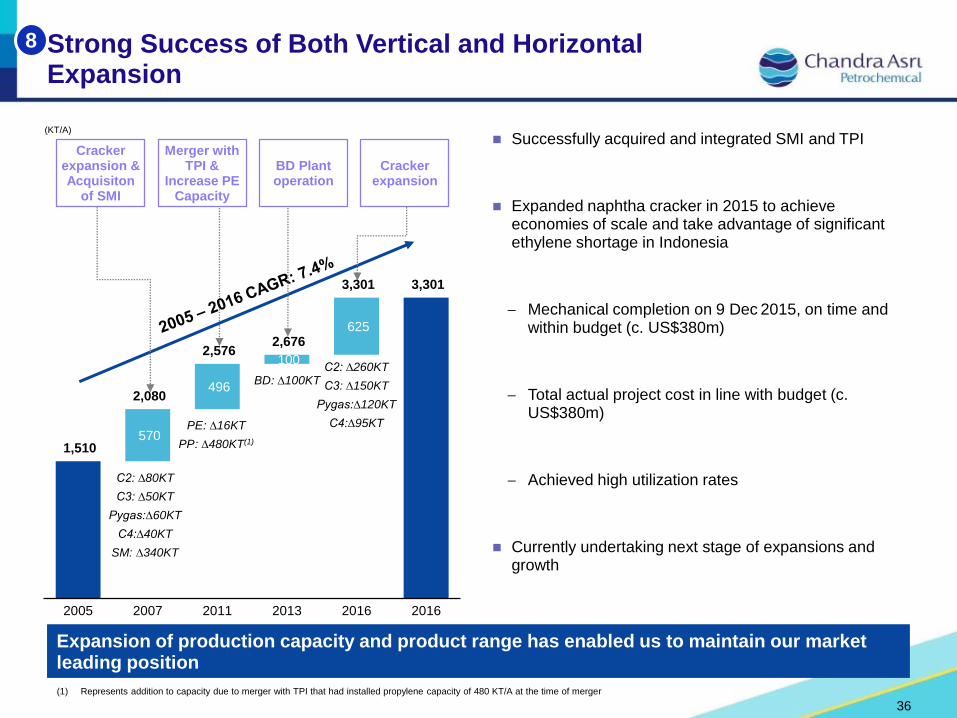
Strong Success of Both Vertical and Horizontal Expansion
36
570
496
100
625
1,510
2,080
2,576 2,676
3,301 3,301
2005 2007 2011 2013 2016 2016
(KT/A)
Successfully acquired and integrated SMI and TPI
Expanded naphtha cracker in 2015 to achieve economies of scale and take advantage of significant ethylene shortage in Indonesia
− Mechanical completion on 9 Dec 2015, on time and within budget (c. US$380m)
− Total actual project cost in line with budget (c. US$380m)
− Achieved high utilization rates
Currently undertaking next stage of expansions and growth
C2: ∆260KT
C3: ∆150KT
Pygas:∆120KT
C4:∆95KT
Cracker expansion & Acquisiton
of SMI
Merger with TPI &
Increase PE Capacity
BD Plant operation
Cracker expansion
BD: ∆100KT
PE: ∆16KT
PP: ∆480KT(1)
C2: ∆80KT
C3: ∆50KT
Pygas:∆60KT
C4:∆40KT
SM: ∆340KT
8
Expansion of production capacity and product range has enabled us to maintain our market leading position
(1) Represents addition to capacity due to merger with TPI that had installed propylene capacity of 480 KT/A at the time of merger
Petrochemicals Industry Outlook
37
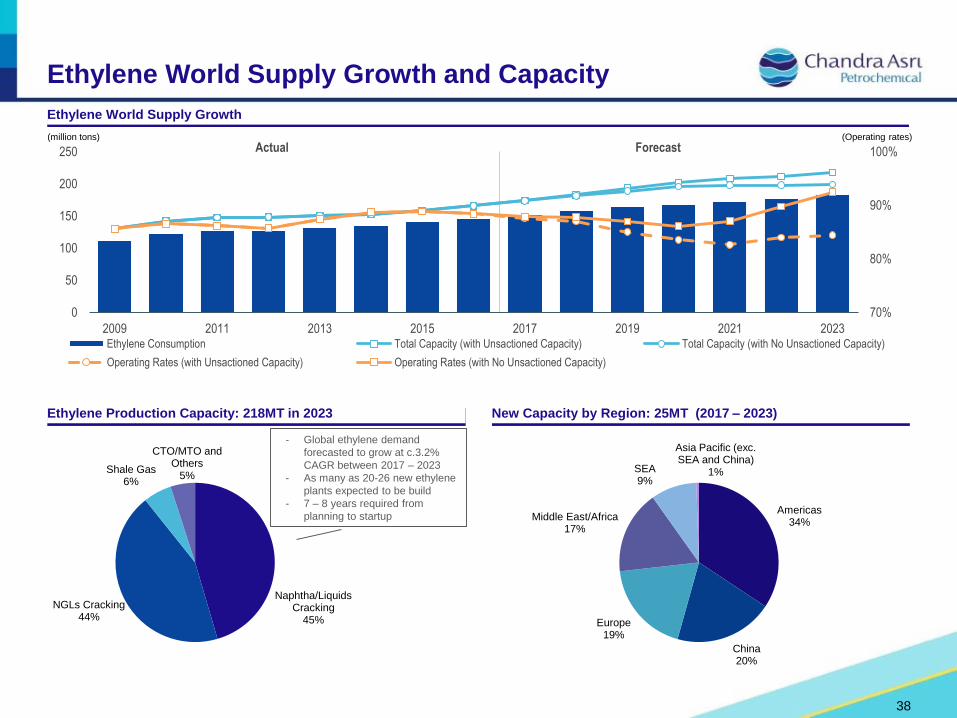
Naphtha/Liquids Cracking
45%
NGLs Cracking44%
Shale Gas6%
CTO/MTO and Others
5%
Ethylene World Supply Growth
Ethylene World Supply Growth and Capacity
New Capacity by Region: 25MT (2017 – 2023) Ethylene Production Capacity: 218MT in 2023
Naphtha
- Global ethylene demand
forecasted to grow at c.3.2%
CAGR between 2017 – 2023
- As many as 20-26 new ethylene
plants expected to be build
- 7 – 8 years required from
planning to startup
70%
80%
90%
100%
0
50
100
150
200
250
2009 2011 2013 2015 2017 2019 2021 2023Ethylene Consumption Total Capacity (with Unsactioned Capacity) Total Capacity (with No Unsactioned Capacity)
Operating Rates (with Unsactioned Capacity) Operating Rates (with No Unsactioned Capacity)
Actual Forecast(million tons) (Operating rates)
Americas34%
China20%
Europe19%
Middle East/Africa17%
SEA9%
Asia Pacific (exc. SEA and China)
1%
38
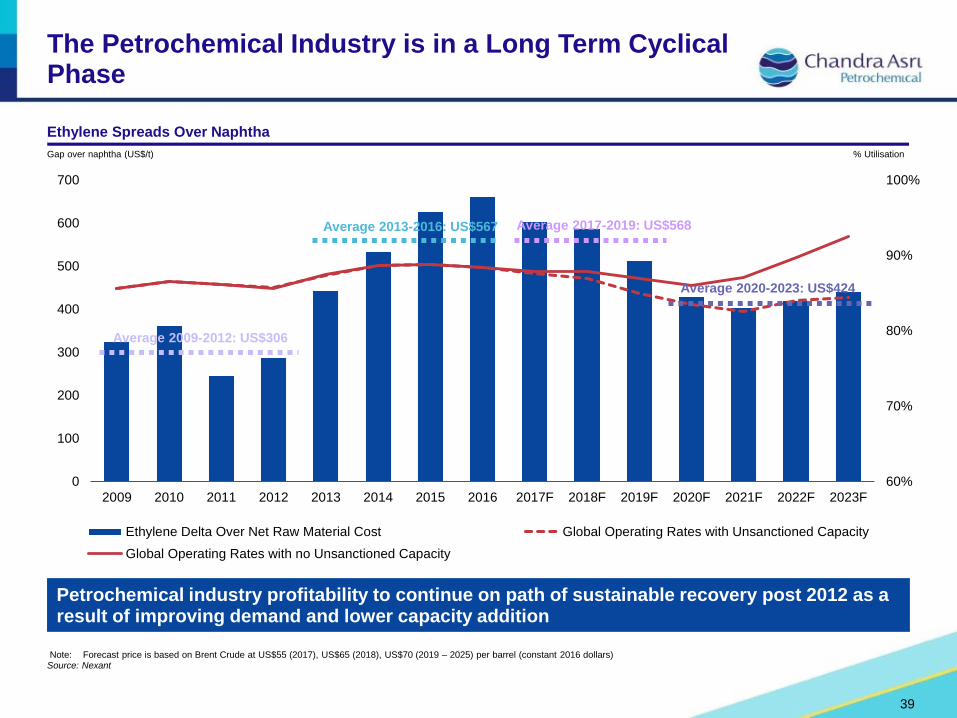
The Petrochemical Industry is in a Long Term Cyclical Phase
39
Note: Forecast price is based on Brent Crude at US$55 (2017), US$65 (2018), US$70 (2019 – 2025) per barrel (constant 2016 dollars)Source: Nexant
60%
70%
80%
90%
100%
0
100
200
300
400
500
600
700
2009 2010 2011 2012 2013 2014 2015 2016 2017F 2018F 2019F 2020F 2021F 2022F 2023F
Ethylene Delta Over Net Raw Material Cost Global Operating Rates with Unsanctioned Capacity
Global Operating Rates with no Unsanctioned Capacity
Average 2013-2016: US$567
Average 2020-2023: US$424
Ethylene Spreads Over Naphtha
Petrochemical industry profitability to continue on path of sustainable recovery post 2012 as a result of improving demand and lower capacity addition
Gap over naphtha (US$/t) % Utilisation
Average 2017-2019: US$568
Average 2009-2012: US$306
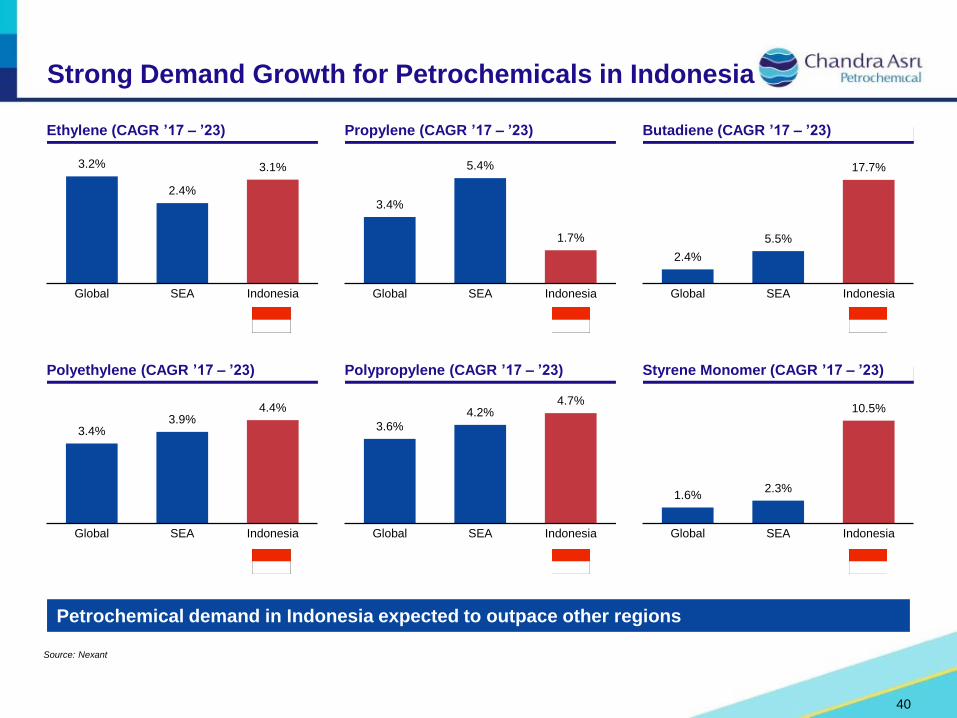
Strong Demand Growth for Petrochemicals in Indonesia
40
Source: Nexant
Styrene Monomer (CAGR ’17 – ’23)Polypropylene (CAGR ’17 – ’23)Polyethylene (CAGR ’17 – ’23)
Butadiene (CAGR ’17 – ’23)Propylene (CAGR ’17 – ’23)Ethylene (CAGR ’17 – ’23)
3.2%
2.4%
3.1%
Global SEA Indonesia
3.4%
5.4%
1.7%
Global SEA Indonesia
2.4%
5.5%
17.7%
Global SEA Indonesia
3.4% 3.9%
4.4%
Global SEA Indonesia
3.6%
4.2% 4.7%
Global SEA Indonesia
1.6% 2.3%
10.5%
Global SEA Indonesia
Petrochemical demand in Indonesia expected to outpace other regions
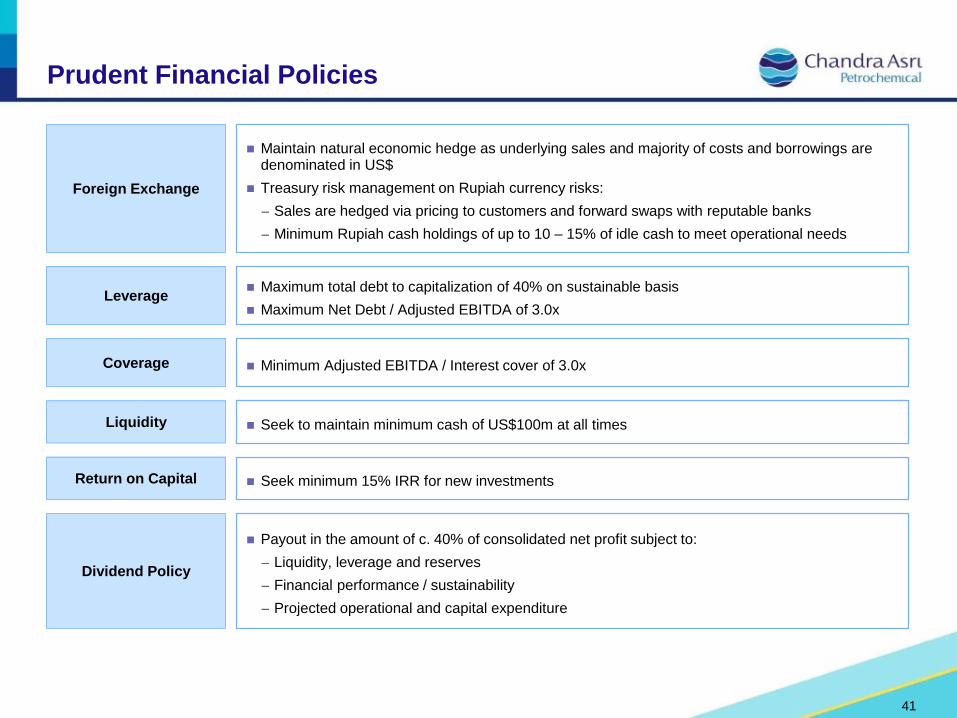
Prudent Financial Policies
Foreign Exchange
Maintain natural economic hedge as underlying sales and majority of costs and borrowings are denominated in US$
Treasury risk management on Rupiah currency risks:
− Sales are hedged via pricing to customers and forward swaps with reputable banks
− Minimum Rupiah cash holdings of up to 10 – 15% of idle cash to meet operational needs
Leverage Maximum total debt to capitalization of 40% on sustainable basis
Maximum Net Debt / Adjusted EBITDA of 3.0x
Coverage Minimum Adjusted EBITDA / Interest cover of 3.0x
Dividend Policy
Payout in the amount of c. 40% of consolidated net profit subject to:
− Liquidity, leverage and reserves
− Financial performance / sustainability
− Projected operational and capital expenditure
41
Liquidity
Return on Capital
Seek to maintain minimum cash of US$100m at all times
Seek minimum 15% IRR for new investments