Embed Size (px)
Citation preview
EMAIL MARKETING STUDY2018
HOW 100 OF THE TOP RETAILERSEngage Shoppers in the First 45 Days and Beyond
59%
EMAIL FREQUENCY
PURCHASER EXPERIENCE
CATALOG EXPOSURE
EMAIL CONTENT
42%
37%
Introduction
Top Retailers are Missing the Mark on Personalization
Methodology
Results
Summary of Overall Scores
Part 1: Purchaser Experience
• Non-purchasers receive more email than purchasers
• Retailers sent same emails to purchasers and non-purchasers on same day
• Purchasers are receiving same discounts as non-purchasers
• Most emails for purchasers are not different from non-purchaser emails
Part 2: Peer Comparison
• Email Frequency
• Catalog Exposure
• Email Content
Conclusion
Using email subscriber data to convert consumers into loyal customers
Appendix A – 100 Retailers Evaluated
2
2
3
4
4
7
8
9
10
11
12
13
16
20
25
25
27
1
CONTENTS
Retailers work hard to acquire new customers. But what happens when a consumer finally makes that long-awaited purchase? And how do retailers entice them to make a second or third purchase?
While many retailers are using email marketing in hopes of creating loyal customers, our latest study found that most enterprise retailers are missing an opportunity to use their customer data to engage and learn more about their customers.
This study looks at what happens in the first 45 days after acquiring a new customer to see how retailers use the valuable purchase information a customer has given them. Based on our analysis of 100 top retailers, we then scored each retailer and vertical on the level of personalization in emails to customers who have just made their first purchase. We also gave each retailer an overall score that took into consideration how each retailer compares to its peers for the amount and types of emails they are sending.
By looking at this study, we're hoping to give retailers visibility into how their peers are performing and to facilitate a discussion on optimal email marketing programs in retail.
INTRODUCTIONTop Retailers are Missing the Mark on Personalization
22018 Email Marketing Study
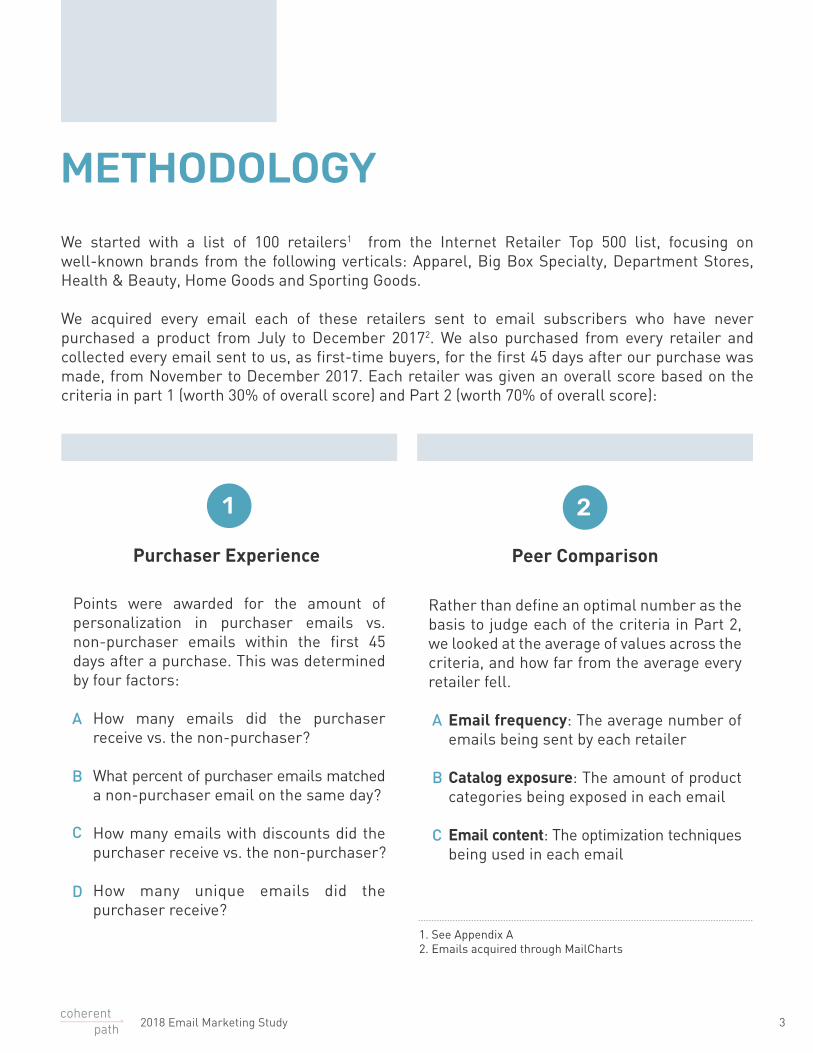
We started with a list of 100 retailers1 from the Internet Retailer Top 500 list, focusing on well-known brands from the following verticals: Apparel, Big Box Specialty, Department Stores, Health & Beauty, Home Goods and Sporting Goods.
We acquired every email each of these retailers sent to email subscribers who have never purchased a product from July to December 20172. We also purchased from every retailer and collected every email sent to us, as first-time buyers, for the first 45 days after our purchase was made, from November to December 2017. Each retailer was given an overall score based on the criteria in part 1 (worth 30% of overall score) and Part 2 (worth 70% of overall score):
METHODOLOGY
Points were awarded for the amount of personalization in purchaser emails vs. non-purchaser emails within the first 45 days after a purchase. This was determined by four factors:
How many emails did the purchaser receive vs. the non-purchaser?
What percent of purchaser emails matched a non-purchaser email on the same day?
How many emails with discounts did the purchaser receive vs. the non-purchaser?
How many unique emails did the purchaser receive?
Rather than define an optimal number as the basis to judge each of the criteria in Part 2, we looked at the average of values across the criteria, and how far from the average every retailer fell.
Email frequency: The average number of emails being sent by each retailer
Catalog exposure: The amount of product categories being exposed in each email
Email content: The optimization techniques being used in each email
1 2
Peer ComparisonPurchaser Experience
3
A
B
C
A
B
C
D
1. See Appendix A2. Emails acquired through MailCharts
2018 Email Marketing Study
Peer Comparison
PurchaserExperience
70.8
40.2 50.1
45.3
58.8
43.3
52.2
43.2
52.1
46.4
50.5
42.4
45.5
31.8
Apparel
54.2
Health & Beauty
46.7
Home Goods& Furnishings
48.2
Department Store
48.642.4
Big Box & GeneralMerchandise
51.2
Sporting Goods
49.5
Average
OVERALL SCORE
VERTICAL
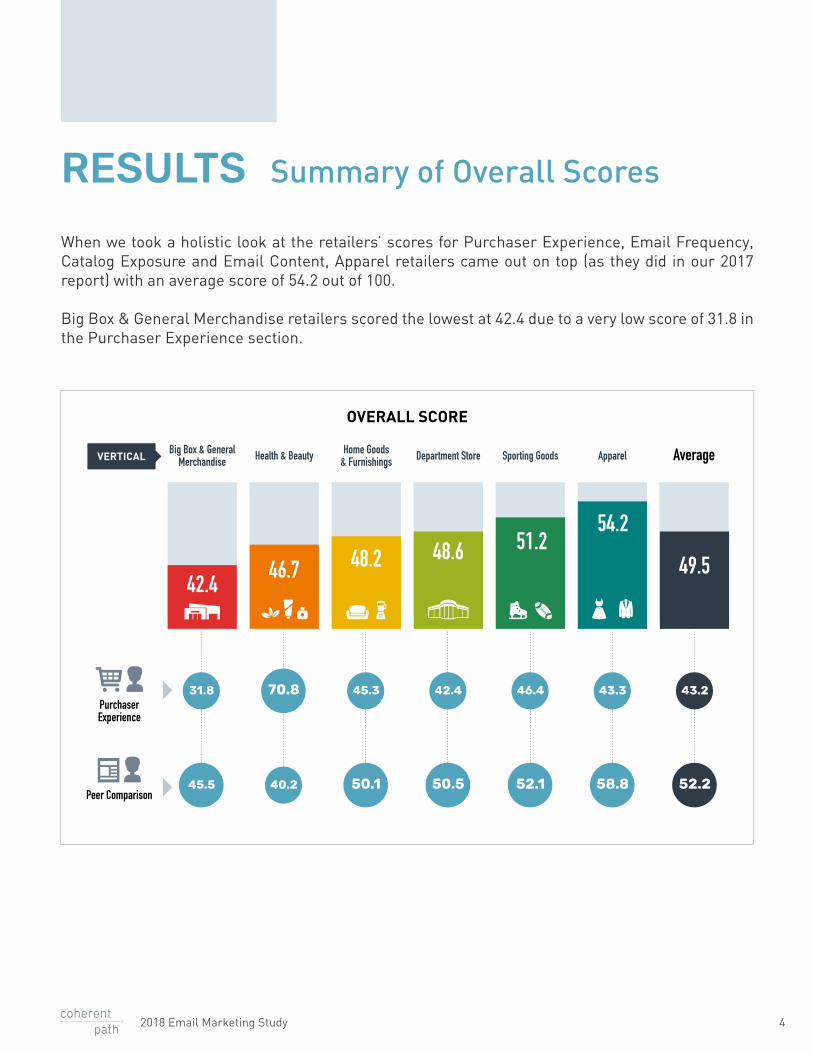
RESULTS
When we took a holistic look at the retailers’ scores for Purchaser Experience, Email Frequency, Catalog Exposure and Email Content, Apparel retailers came out on top (as they did in our 2017 report) with an average score of 54.2 out of 100.
Big Box & General Merchandise retailers scored the lowest at 42.4 due to a very low score of 31.8 in the Purchaser Experience section.
4
Summary of Overall Scores
2018 Email Marketing Study
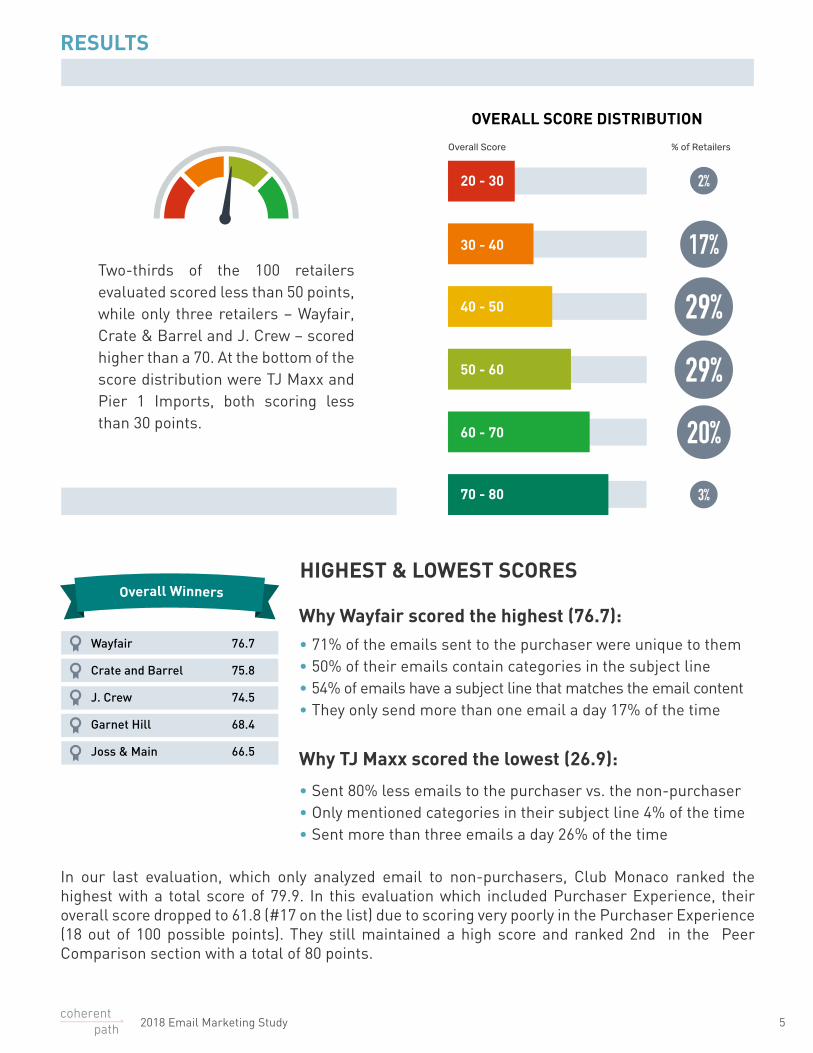
Two-thirds of the 100 retailers evaluated scored less than 50 points, while only three retailers – Wayfair, Crate & Barrel and J. Crew – scored higher than a 70. At the bottom of the score distribution were TJ Maxx and Pier 1 Imports, both scoring less than 30 points.
OVERALL SCORE DISTRIBUTION
29%
29%
20%
3%
2%
17%
20 - 30
30 - 40
40 - 50
50 - 60
60 - 70
70 - 80
Overall Score % of Retailers
5
Why Wayfair scored the highest (76.7):• 71% of the emails sent to the purchaser were unique to them • 50% of their emails contain categories in the subject line• 54% of emails have a subject line that matches the email content• They only send more than one email a day 17% of the time
Why TJ Maxx scored the lowest (26.9):
• Sent 80% less emails to the purchaser vs. the non-purchaser• Only mentioned categories in their subject line 4% of the time• Sent more than three emails a day 26% of the time
Wayfair
Crate and Barrel
J. Crew
Garnet Hill
Joss & Main
76.7
75.8
74.5
68.4
66.5
HIGHEST & LOWEST SCORES
In our last evaluation, which only analyzed email to non-purchasers, Club Monaco ranked the highest with a total score of 79.9. In this evaluation which included Purchaser Experience, their overall score dropped to 61.8 (#17 on the list) due to scoring very poorly in the Purchaser Experience (18 out of 100 possible points). They still maintained a high score and ranked 2nd in the Peer Comparison section with a total of 80 points.
RESULTS
2018 Email Marketing Study 5
Online Retailers Take the Lead
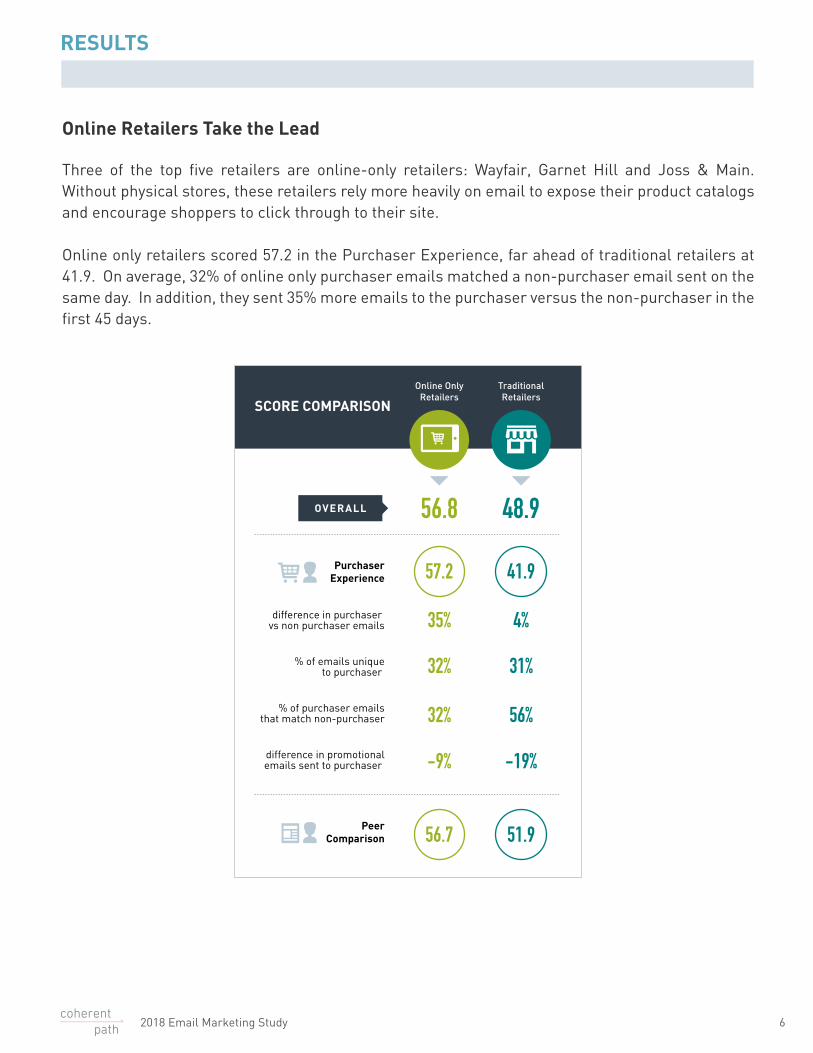
Three of the top five retailers are online-only retailers: Wayfair, Garnet Hill and Joss & Main. Without physical stores, these retailers rely more heavily on email to expose their product catalogs and encourage shoppers to click through to their site.
Online only retailers scored 57.2 in the Purchaser Experience, far ahead of traditional retailers at 41.9. On average, 32% of online only purchaser emails matched a non-purchaser email sent on the same day. In addition, they sent 35% more emails to the purchaser versus the non-purchaser in the first 45 days.
SCORE COMPARISON
PurchaserExperience
difference in purchaser vs non purchaser emails
% of emails uniqueto purchaser
% of purchaser emailsthat match non-purchaser
difference in promotionalemails sent to purchaser
PeerComparison
57.2 41.9
56.8 48.9
35%
32%
32%
-9%
4%
31%
56%
-19%
56.7 51.9
OVERALL
Online OnlyRetailers
TraditionalRetailers
6
RESULTS
2018 Email Marketing Study
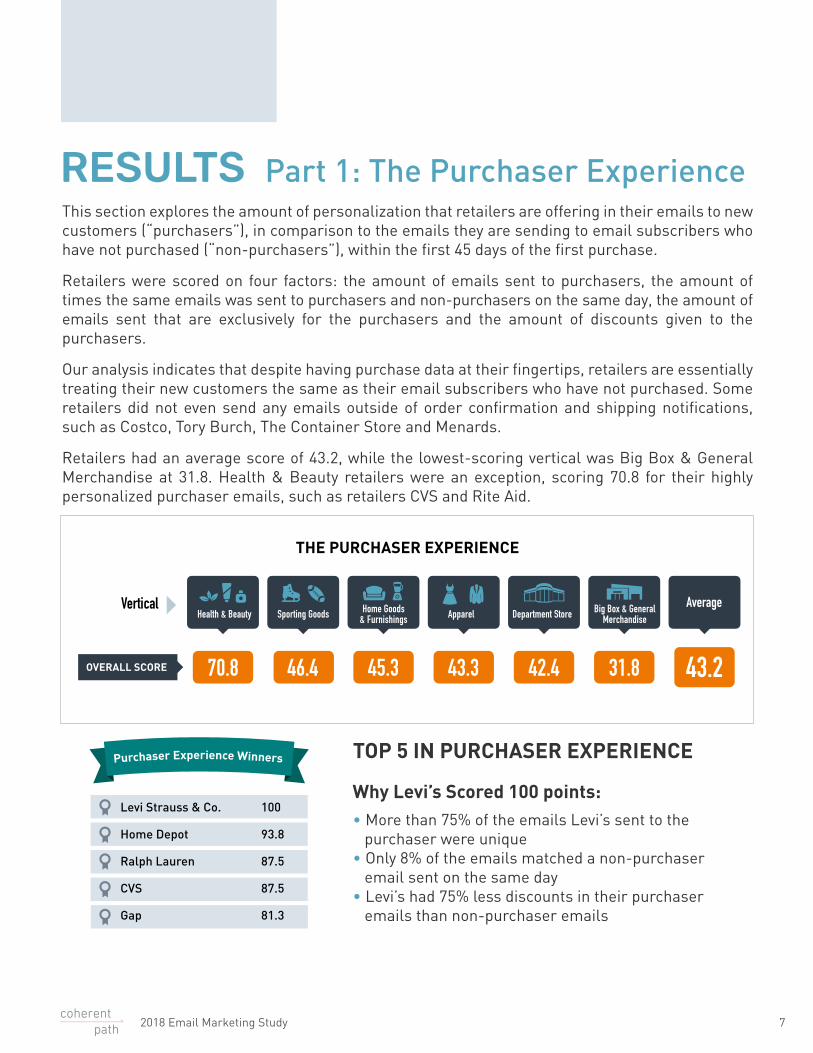
This section explores the amount of personalization that retailers are offering in their emails to new customers (“purchasers”), in comparison to the emails they are sending to email subscribers who have not purchased (“non-purchasers”), within the first 45 days of the first purchase.
Retailers were scored on four factors: the amount of emails sent to purchasers, the amount of times the same emails was sent to purchasers and non-purchasers on the same day, the amount of emails sent that are exclusively for the purchasers and the amount of discounts given to the purchasers.
Our analysis indicates that despite having purchase data at their fingertips, retailers are essentially treating their new customers the same as their email subscribers who have not purchased. Some retailers did not even send any emails outside of order confirmation and shipping notifications, such as Costco, Tory Burch, The Container Store and Menards.
Retailers had an average score of 43.2, while the lowest-scoring vertical was Big Box & General Merchandise at 31.8. Health & Beauty retailers were an exception, scoring 70.8 for their highly personalized purchaser emails, such as retailers CVS and Rite Aid.
Why Levi’s Scored 100 points: • More than 75% of the emails Levi’s sent to the purchaser were unique• Only 8% of the emails matched a non-purchaser email sent on the same day• Levi’s had 75% less discounts in their purchaser emails than non-purchaser emails
70.8 46.4 45.3 43.3 42.4 31.8
THE PURCHASER EXPERIENCE
OVERALL SCORE 43.2
VerticalApparelHealth & Beauty Home Goods
& Furnishings Department Store Big Box & GeneralMerchandiseSporting Goods
Average
Levi Strauss & Co.
Home Depot
Ralph Lauren
CVS
Gap
100
93.8
87.5
87.5
81.3
7
Part 1: The Purchaser Experience
TOP 5 IN PURCHASER EXPERIENCE
RESULTS
2018 Email Marketing Study
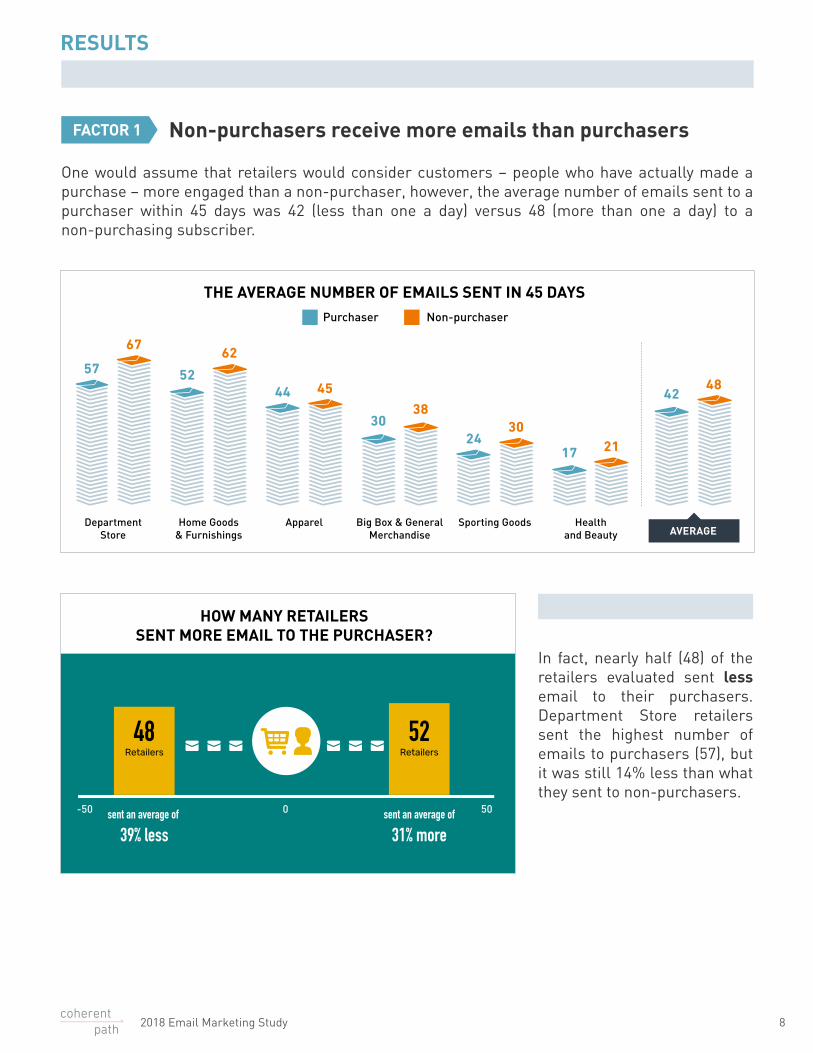
One would assume that retailers would consider customers – people who have actually made a purchase – more engaged than a non-purchaser, however, the average number of emails sent to a purchaser within 45 days was 42 (less than one a day) versus 48 (more than one a day) to a non-purchasing subscriber.
In fact, nearly half (48) of the retailers evaluated sent less email to their purchasers. Department Store retailers sent the highest number of emails to purchasers (57), but it was still 14% less than what they sent to non-purchasers.
2417 21
AVERAGEApparelHome Goods
& FurnishingsDepartment
StoreHealth
and BeautyBig Box & General
MerchandiseSporting Goods
THE AVERAGE NUMBER OF EMAILS SENT IN 45 DAYS
57
67
52
62
44 45
3038
30
4248
Purchaser Non-purchaser
HOW MANY RETAILERSSENT MORE EMAIL TO THE PURCHASER?
sent an average of
31% more
52Retailers
sent an average of
39% less
Retailers
48
0 50-50
8
Non-purchasers receive more emails than purchasers
RESULTS
2018 Email Marketing Study
FACTOR 1
FACTOR 2
9
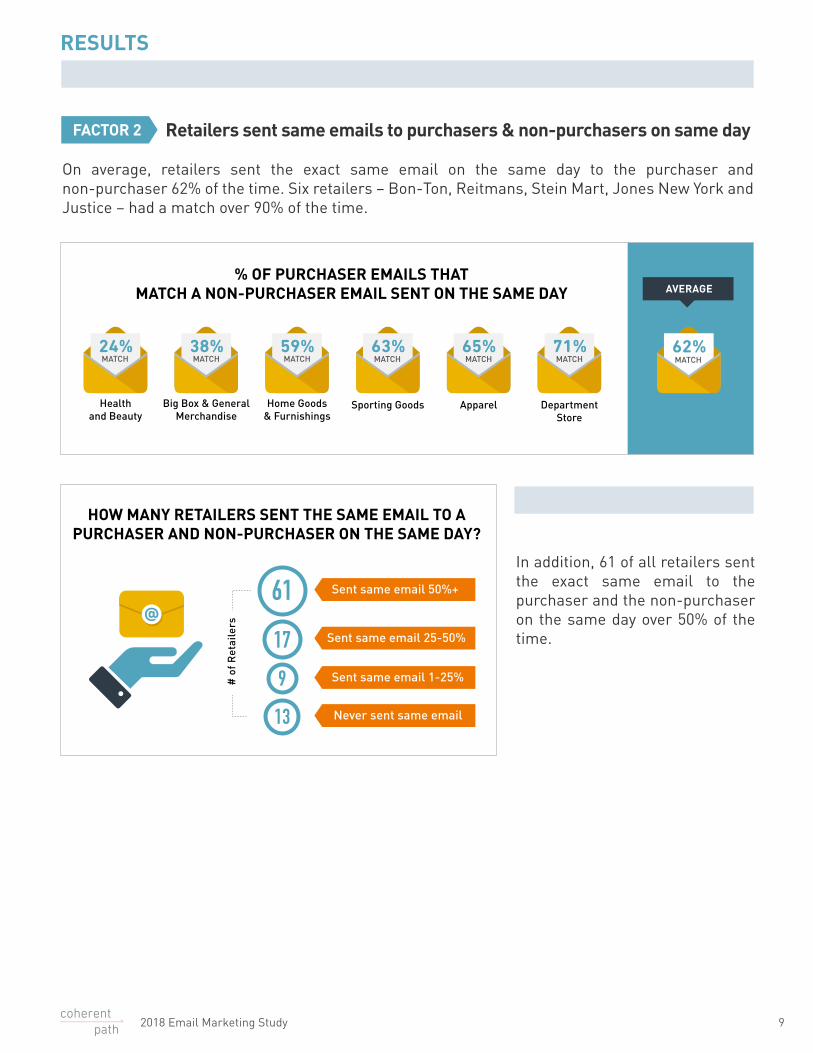
Retailers sent same emails to purchasers & non-purchasers on same day
On average, retailers sent the exact same email on the same day to the purchaser and non-purchaser 62% of the time. Six retailers – Bon-Ton, Reitmans, Stein Mart, Jones New York and Justice – had a match over 90% of the time.
AVERAGE
62%MATCH
Sporting Goods
63%MATCH
Healthand Beauty
24%MATCH
Apparel
65%MATCH
Big Box & GeneralMerchandise
38%MATCH
DepartmentStore
71%MATCH
Home Goods& Furnishings
59%MATCH
% OF PURCHASER EMAILS THATMATCH A NON-PURCHASER EMAIL SENT ON THE SAME DAY
In addition, 61 of all retailers sent the exact same email to the purchaser and the non-purchaser on the same day over 50% of the time.
61
179
13
Sent same email 25-50%
Sent same email 50%+
Sent same email 1-25%
Never sent same email
# o
f R
etai
lers
HOW MANY RETAILERS SENT THE SAME EMAIL TO A PURCHASER AND NON-PURCHASER ON THE SAME DAY?
RESULTS
2018 Email Marketing Study
FACTOR 3
10
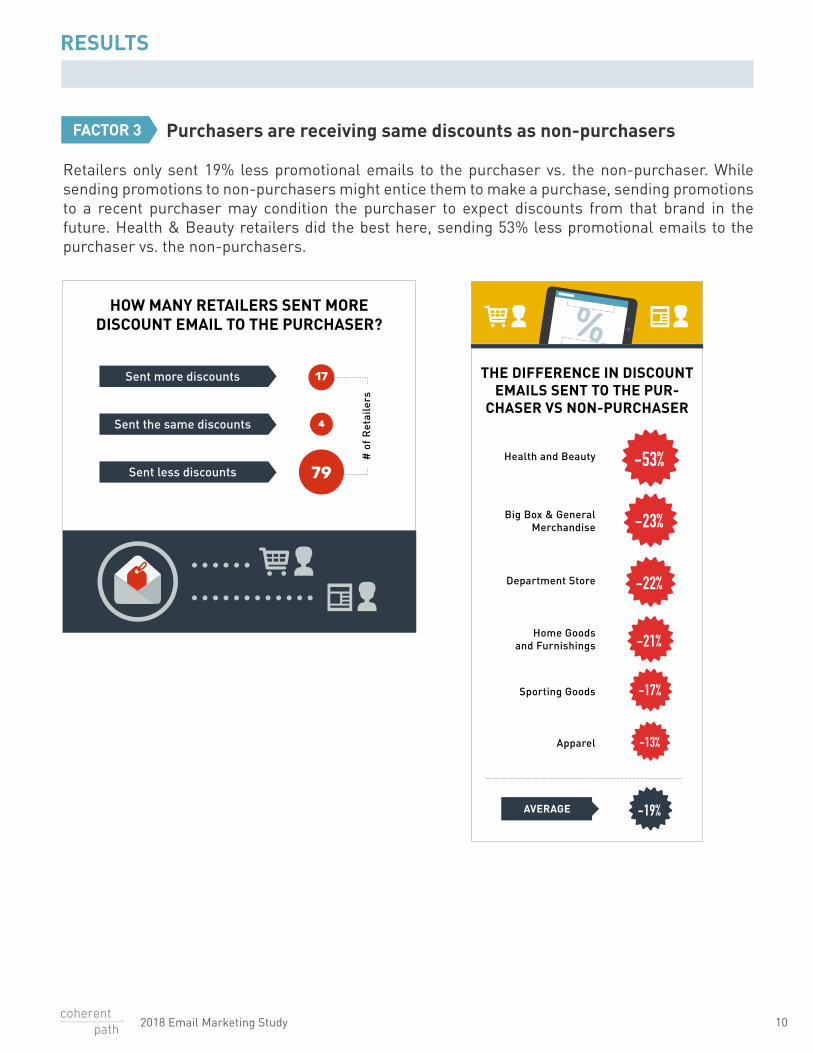
Purchasers are receiving same discounts as non-purchasers
Retailers only sent 19% less promotional emails to the purchaser vs. the non-purchaser. While sending promotions to non-purchasers might entice them to make a purchase, sending promotions to a recent purchaser may condition the purchaser to expect discounts from that brand in the future. Health & Beauty retailers did the best here, sending 53% less promotional emails to the purchaser vs. the non-purchasers.
# o
f R
etai
lers
Sent more discounts
Sent the same discounts
Sent less discounts
17
4
79
HOW MANY RETAILERS SENT MOREDISCOUNT EMAIL TO THE PURCHASER?
Apparel
Home Goodsand Furnishings
Department Store
Health and Beauty
Big Box & GeneralMerchandise
Sporting Goods
-53%
-23%
-13%
-22%
-21%
-19%
-17%
THE DIFFERENCE IN DISCOUNT EMAILS SENT TO THE PUR-
CHASER VS NON-PURCHASER
AVERAGE
RESULTS
2018 Email Marketing Study
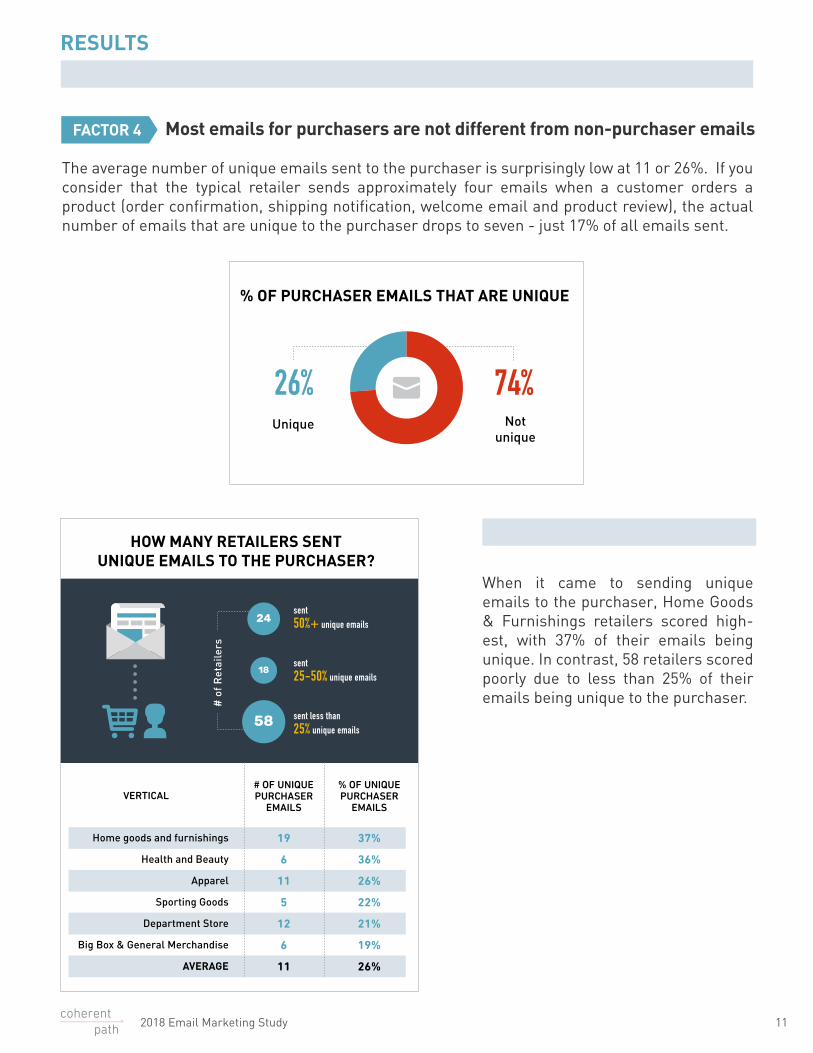
FACTOR 4 Most emails for purchasers are not different from non-purchaser emails
The average number of unique emails sent to the purchaser is surprisingly low at 11 or 26%. If you consider that the typical retailer sends approximately four emails when a customer orders a product (order confirmation, shipping notification, welcome email and product review), the actual number of emails that are unique to the purchaser drops to seven - just 17% of all emails sent.
When it came to sending unique emails to the purchaser, Home Goods & Furnishings retailers scored high-est, with 37% of their emails being unique. In contrast, 58 retailers scored poorly due to less than 25% of their emails being unique to the purchaser.
% OF PURCHASER EMAILS THAT ARE UNIQUE
Notunique
Unique
74%26%
Home goods and furnishings
Health and Beauty
Apparel
Sporting Goods
Department Store
Big Box & General Merchandise
AVERAGE
VERTICAL
HOW MANY RETAILERS SENTUNIQUE EMAILS TO THE PURCHASER?
sent 25-50% unique emails
sent 50%+ unique emails
sent less than 25% unique emails
24
18
58
19
6
11
5
12
6
11
# OF UNIQUE PURCHASER
EMAILS
37%
36%
26%
22%
21%
19%
26%
% OF UNIQUEPURCHASER
EMAILS
# o
f R
etai
lers
11
RESULTS
2018 Email Marketing Study
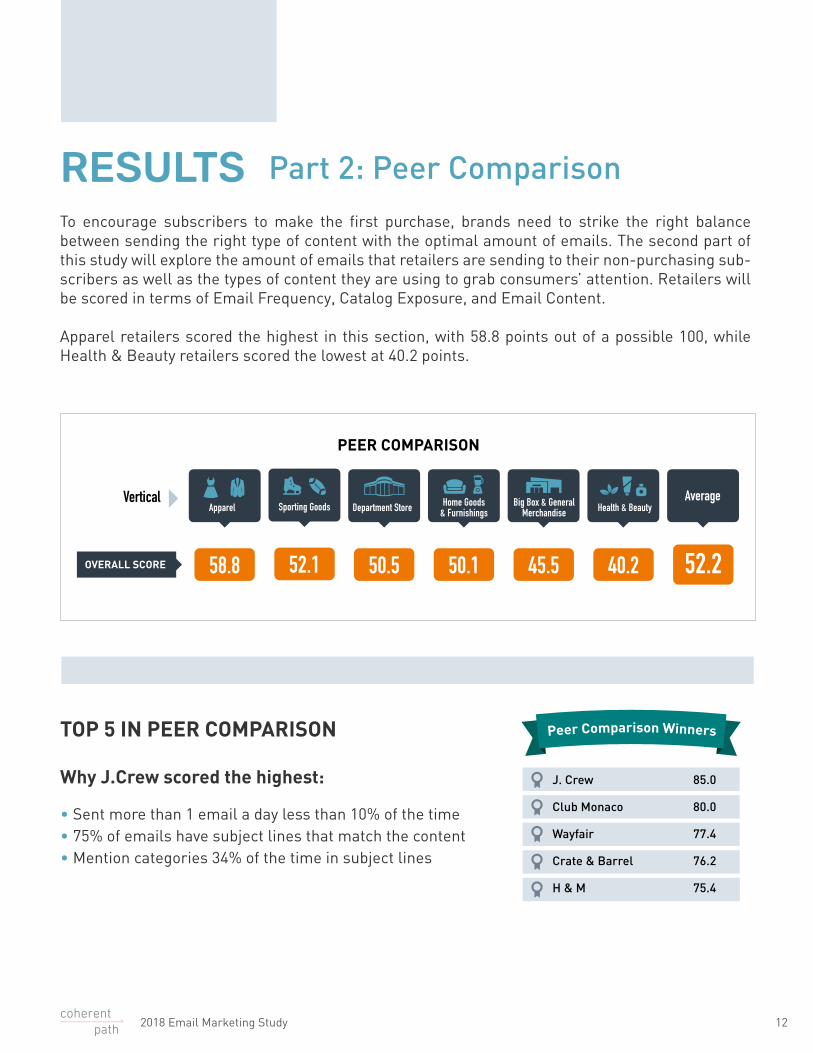
To encourage subscribers to make the first purchase, brands need to strike the right balance between sending the right type of content with the optimal amount of emails. The second part of this study will explore the amount of emails that retailers are sending to their non-purchasing sub-scribers as well as the types of content they are using to grab consumers’ attention. Retailers will be scored in terms of Email Frequency, Catalog Exposure, and Email Content.
Apparel retailers scored the highest in this section, with 58.8 points out of a possible 100, while Health & Beauty retailers scored the lowest at 40.2 points.
12
Part 2: Peer Comparison
J. Crew
Club Monaco
Wayfair
Crate & Barrel
H & M
85.0
80.0
77.4
76.2
75.4
Why J.Crew scored the highest:
• Sent more than 1 email a day less than 10% of the time• 75% of emails have subject lines that match the content• Mention categories 34% of the time in subject lines
TOP 5 IN PEER COMPARISON
PEER COMPARISON
OVERALL SCORE
VerticalApparel
58.8
Big Box & GeneralMerchandise
45.5
Department Store
50.5
Health & Beauty
40.2
Home Goods& Furnishings
50.1
Sporting Goods
52.1
Average
52.2
RESULTS
2018 Email Marketing Study
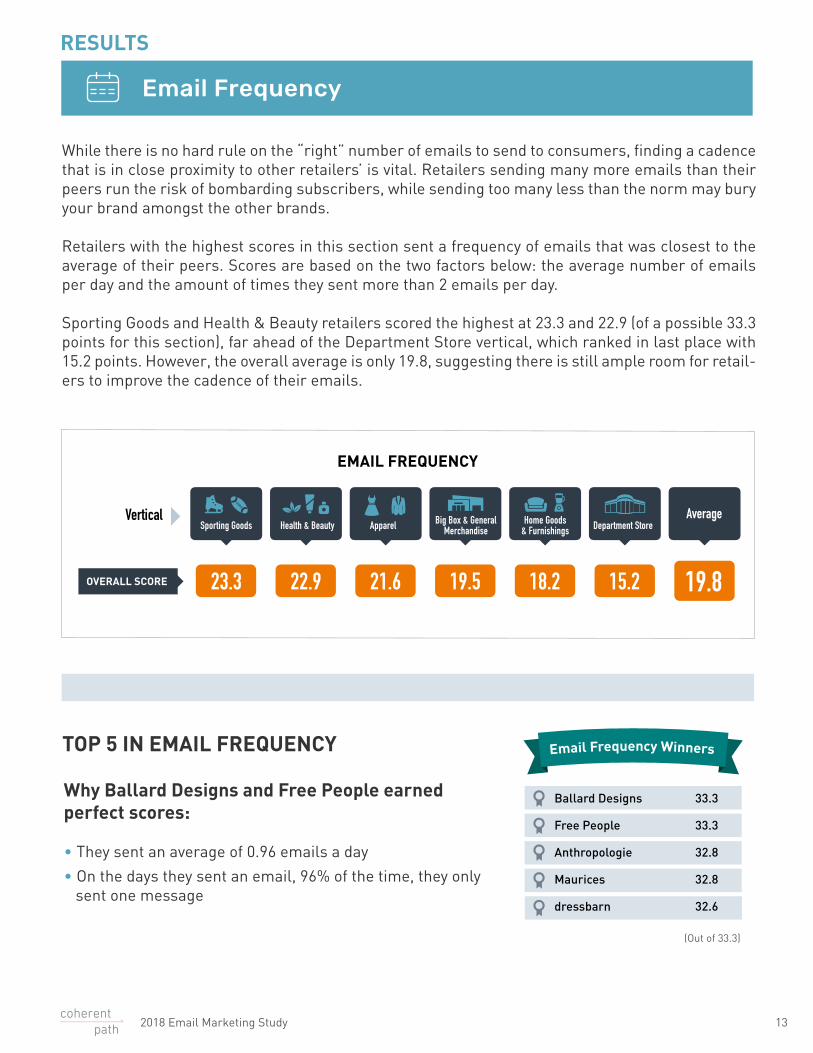
Why Ballard Designs and Free People earned perfect scores:
• They sent an average of 0.96 emails a day
• On the days they sent an email, 96% of the time, they only sent one message
While there is no hard rule on the “right” number of emails to send to consumers, finding a cadence that is in close proximity to other retailers’ is vital. Retailers sending many more emails than their peers run the risk of bombarding subscribers, while sending too many less than the norm may bury your brand amongst the other brands.
Retailers with the highest scores in this section sent a frequency of emails that was closest to the average of their peers. Scores are based on the two factors below: the average number of emails per day and the amount of times they sent more than 2 emails per day.
Sporting Goods and Health & Beauty retailers scored the highest at 23.3 and 22.9 (of a possible 33.3 points for this section), far ahead of the Department Store vertical, which ranked in last place with 15.2 points. However, the overall average is only 19.8, suggesting there is still ample room for retail-ers to improve the cadence of their emails.
OVERALL SCORE 23.3 22.9 21.6 19.5 18.2 15.2
EMAIL FREQUENCY
19.8
VerticalApparelHealth & Beauty Home Goods
& Furnishings Department StoreBig Box & GeneralMerchandiseSporting Goods
Average
13
Email Frequency
TOP 5 IN EMAIL FREQUENCY
RESULTS
2018 Email Marketing Study
Ballard Designs
Free People
Anthropologie
Maurices
dressbarn
33.3
33.3
32.8
32.8
32.6
(Out of 33.3)

The average number of emails sent to non-purchasers was 1.09. Almost half of all retailers (45) send between .75 and 1.5 emails a day. Eight retailers are sending on average over two emails a day while twelve are sending on average every other day. Of the 100 retailers evaluated, Williams-Sonoma had the highest average email sends per day at 3.14.
The Big Box & Merchandise and Apparel verticals were the closest to delivering the average cadence of 1.09 emails, offering their non-purchasers 1.09 and 1.04 emails, respectively. However, after taking into consideration that both these verticals sent more than 2 emails per day many times during the 6-month evaluation, both received point reductions which lowered their overall scores.
AVERAGE EMAILS PER DAY
21 20 25 14
# of Retailers
lessthan 0.5
0.5 - 0.750.75 - 1
1 - 1.5
1.5 - 2
over 2
12 8
AVERAGE EMAILS PER DAY BY VERTICAL
1.09 1.05
Department Store
Home Goods & Furnishings
Big Box & General Merchandise
Apparel
Sporting Goods
Health and Beauty
AVERAGE
1.38
1.33
1.09
1.04
0.72
0.49
1.23
1.39
1.31
0.97
0.65
0.39
2018 STUDY 2017 STUDY
14
Retailers sent an average of one email per day
RESULTS
2018 Email Marketing Study
FACTOR 1
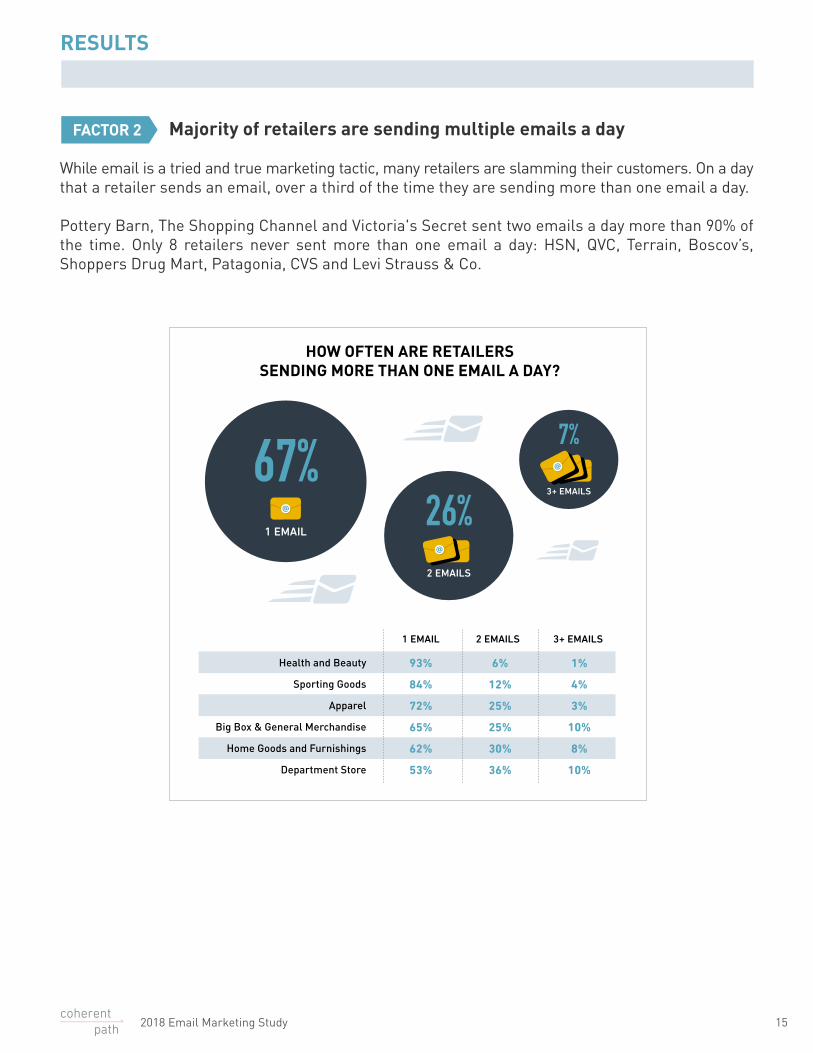
2 Majority of retailers are sending multiple emails a day
While email is a tried and true marketing tactic, many retailers are slamming their customers. On a day that a retailer sends an email, over a third of the time they are sending more than one email a day.
Pottery Barn, The Shopping Channel and Victoria's Secret sent two emails a day more than 90% of the time. Only 8 retailers never sent more than one email a day: HSN, QVC, Terrain, Boscov’s, Shoppers Drug Mart, Patagonia, CVS and Levi Strauss & Co.
HOW OFTEN ARE RETAILERSSENDING MORE THAN ONE EMAIL A DAY?
3+ EMAILS2 EMAILS1 EMAIL
Health and Beauty
Sporting Goods
Apparel
Big Box & General Merchandise
Home Goods and Furnishings
Department Store
93%
84%
72%
65%
62%
53%
6%
12%
25%
25%
30%
36%
1%
4%
3%
10%
8%
10%
1 EMAIL
2 EMAILS
3+ EMAILS67%
26%
7%
15
RESULTS
2018 Email Marketing Study
FACTOR 2
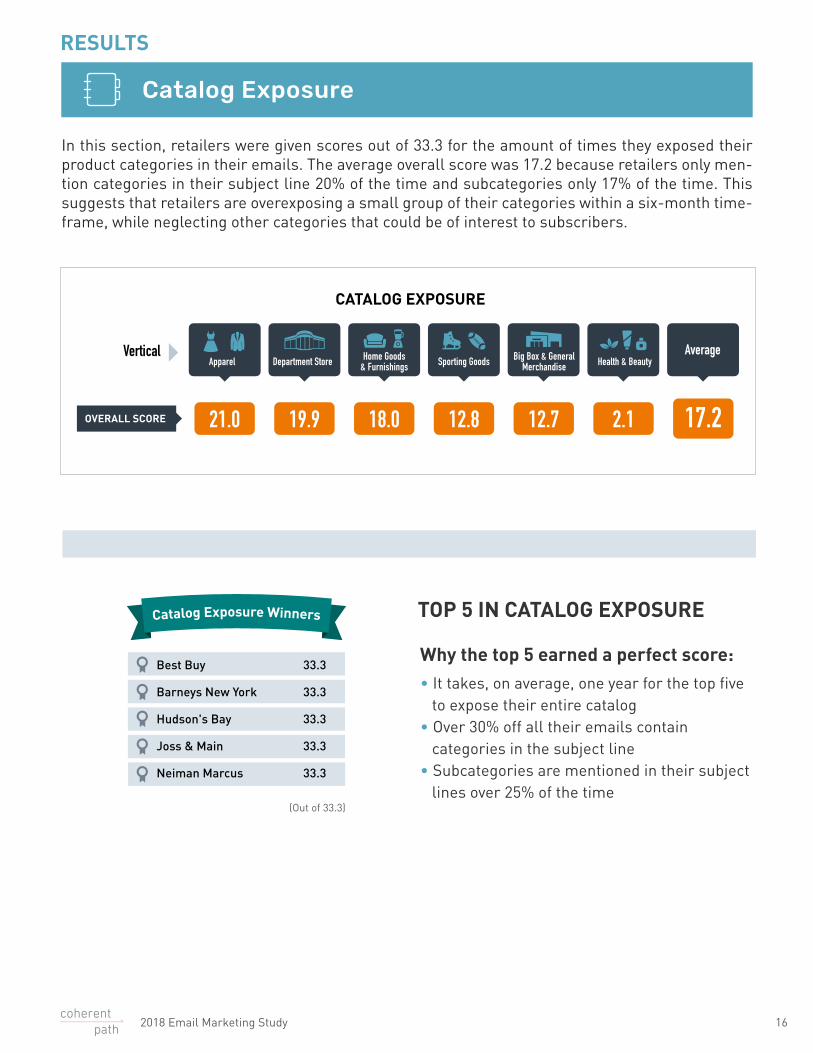
In this section, retailers were given scores out of 33.3 for the amount of times they exposed their product categories in their emails. The average overall score was 17.2 because retailers only men-tion categories in their subject line 20% of the time and subcategories only 17% of the time. This suggests that retailers are overexposing a small group of their categories within a six-month time-frame, while neglecting other categories that could be of interest to subscribers.
Why the top 5 earned a perfect score:• It takes, on average, one year for the top five to expose their entire catalog• Over 30% off all their emails contain categories in the subject line• Subcategories are mentioned in their subject lines over 25% of the time
CATALOG EXPOSURE
OVERALL SCORE
VerticalApparel Health & BeautyHome Goods
& FurnishingsDepartment Store Big Box & GeneralMerchandiseSporting Goods
Average
21.0 12.719.9 2.118.0 12.8 17.2
16
Catalog Exposure
TOP 5 IN CATALOG EXPOSURE
RESULTS
2018 Email Marketing Study
Best Buy
Barneys New York
Hudson's Bay
Joss & Main
Neiman Marcus
33.3
33.3
33.3
33.3
33.3
(Out of 33.3)
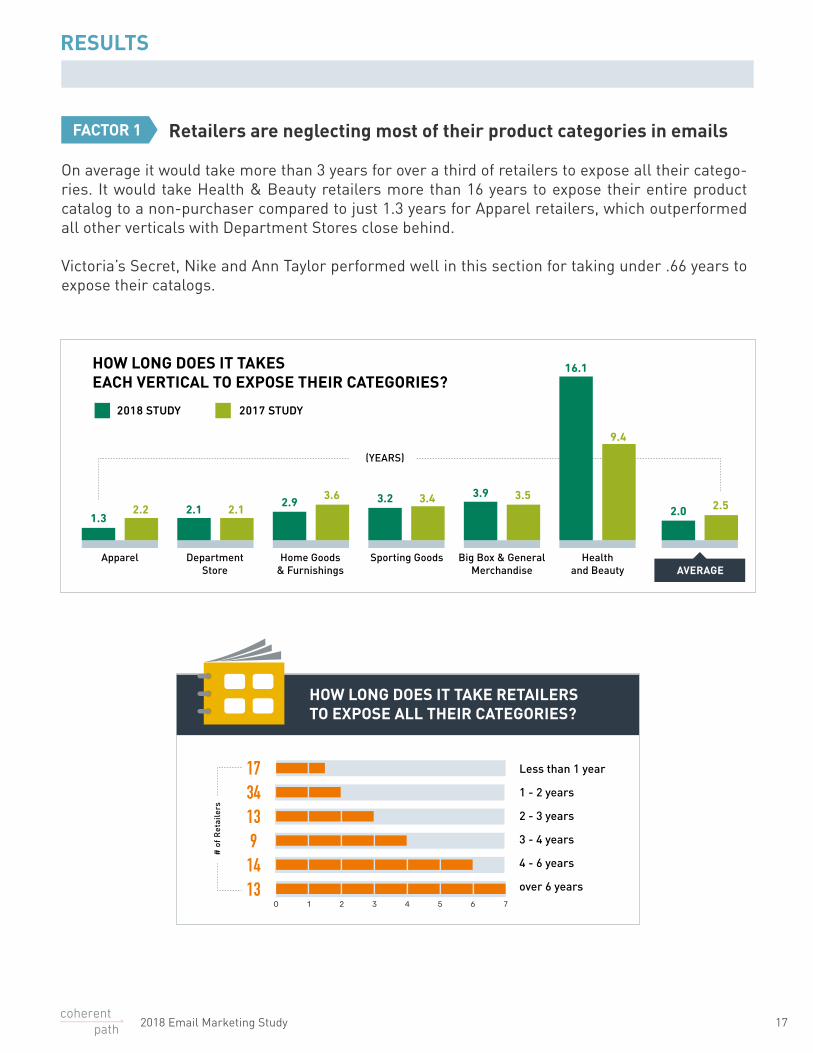
Retailers are neglecting most of their product categories in emails
On average it would take more than 3 years for over a third of retailers to expose all their catego-ries. It would take Health & Beauty retailers more than 16 years to expose their entire product catalog to a non-purchaser compared to just 1.3 years for Apparel retailers, which outperformed all other verticals with Department Stores close behind.
Victoria’s Secret, Nike and Ann Taylor performed well in this section for taking under .66 years to expose their catalogs.
Apparel Home Goods& Furnishings
DepartmentStore
Healthand Beauty
Big Box & GeneralMerchandise
Sporting Goods
HOW LONG DOES IT TAKESEACH VERTICAL TO EXPOSE THEIR CATEGORIES?
1.32.2 2.1 2.1
2.93.6 3.2 3.4 3.9 3.5
16.1
9.4
2.0 2.5
2018 STUDY 2017 STUDY
AVERAGE
(YEARS)
HOW LONG DOES IT TAKE RETAILERS TO EXPOSE ALL THEIR CATEGORIES?
17341391413
Less than 1 year
1 - 2 years
2 - 3 years
3 - 4 years
4 - 6 years
over 6 years0 1 2 3 4 5 6 7
# o
f R
etai
lers
17
RESULTS
2018 Email Marketing Study
FACTOR 1
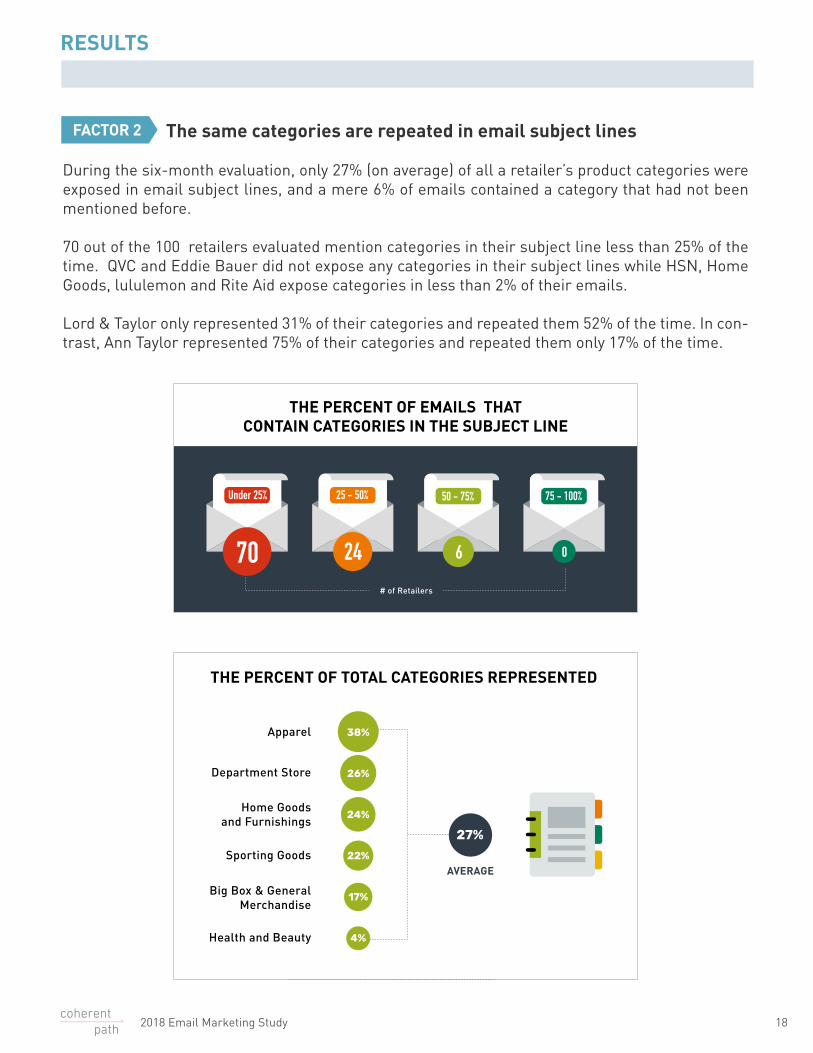
The same categories are repeated in email subject lines
During the six-month evaluation, only 27% (on average) of all a retailer’s product categories were exposed in email subject lines, and a mere 6% of emails contained a category that had not been mentioned before.
70 out of the 100 retailers evaluated mention categories in their subject line less than 25% of the time. QVC and Eddie Bauer did not expose any categories in their subject lines while HSN, Home Goods, lululemon and Rite Aid expose categories in less than 2% of their emails.
Lord & Taylor only represented 31% of their categories and repeated them 52% of the time. In con-trast, Ann Taylor represented 75% of their categories and repeated them only 17% of the time.
THE PERCENT OF EMAILS THATCONTAIN CATEGORIES IN THE SUBJECT LINE
Under 25%
70
25 - 50%
24
75 - 100%
0
50 - 75%
6
# of Retailers
38%
26%
24%
17%
4%
27%22%
Apparel
Home Goodsand Furnishings
Department Store
Health and Beauty
Big Box & GeneralMerchandise
Sporting GoodsAVERAGE
THE PERCENT OF TOTAL CATEGORIES REPRESENTED
18
RESULTS
2018 Email Marketing Study
FACTOR 2
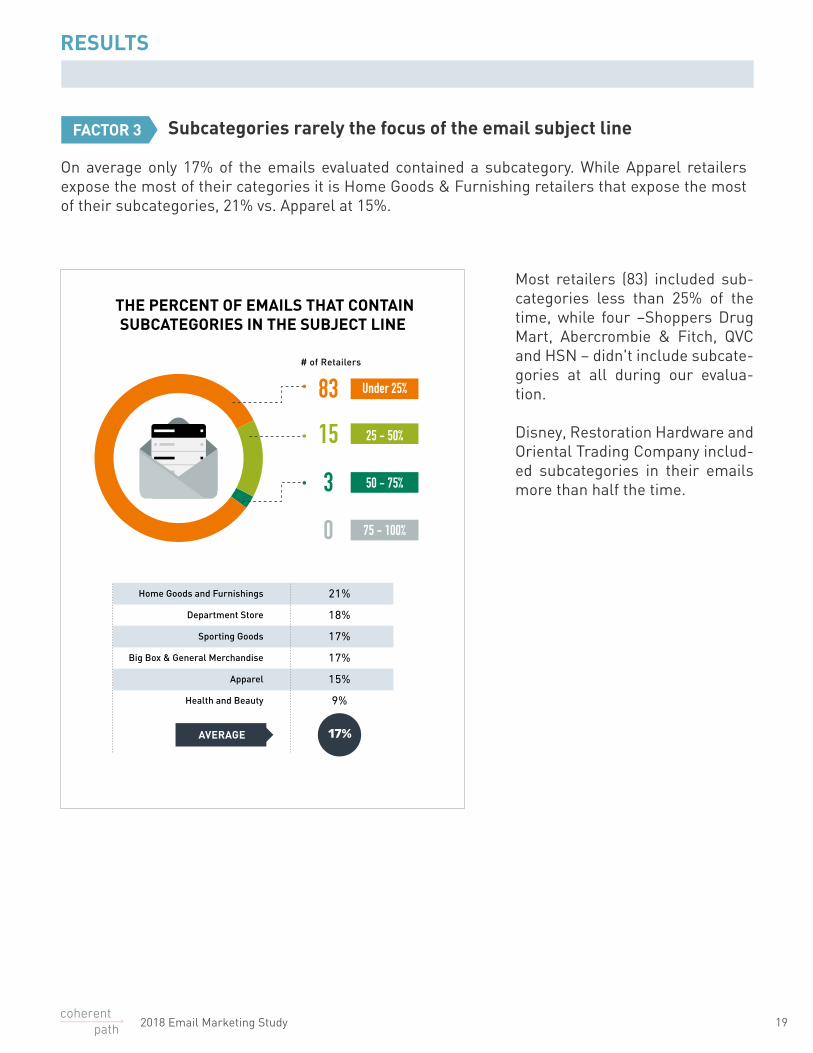
Subcategories rarely the focus of the email subject line
On average only 17% of the emails evaluated contained a subcategory. While Apparel retailers expose the most of their categories it is Home Goods & Furnishing retailers that expose the most of their subcategories, 21% vs. Apparel at 15%.
THE PERCENT OF EMAILS THAT CONTAINSUBCATEGORIES IN THE SUBJECT LINE
21%
18%
17%
17%
15%
9%
Home Goods and Furnishings
Department Store
Sporting Goods
Big Box & General Merchandise
Apparel
Health and Beauty
Under 25%
25 - 50%
50 - 75%
75 - 100%
83
15
3
0
17%
# of Retailers
AVERAGE
19
Most retailers (83) included sub-categories less than 25% of the time, while four –Shoppers Drug Mart, Abercrombie & Fitch, QVC and HSN – didn't include subcate-gories at all during our evalua-tion.
Disney, Restoration Hardware and Oriental Trading Company includ-ed subcategories in their emails more than half the time.
RESULTS
2018 Email Marketing Study
FACTOR 3
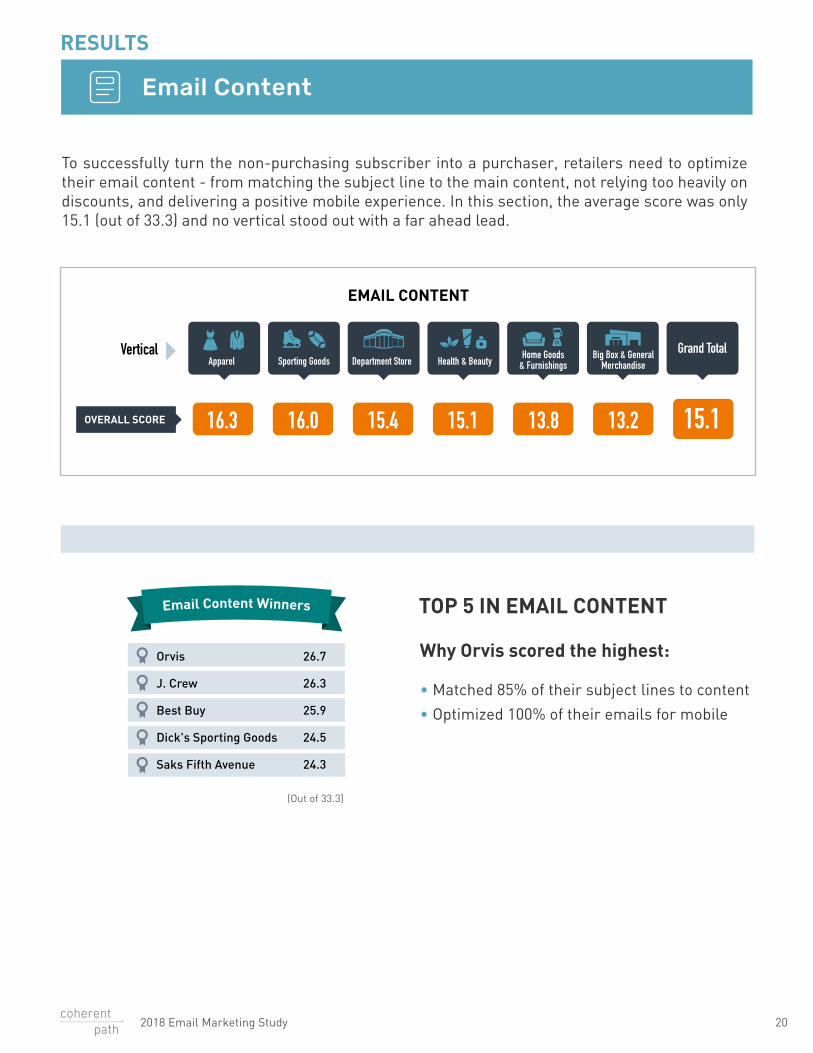
To successfully turn the non-purchasing subscriber into a purchaser, retailers need to optimize their email content - from matching the subject line to the main content, not relying too heavily on discounts, and delivering a positive mobile experience. In this section, the average score was only 15.1 (out of 33.3) and no vertical stood out with a far ahead lead.
Why Orvis scored the highest:
• Matched 85% of their subject lines to content
• Optimized 100% of their emails for mobile
20
Email Content
TOP 5 IN EMAIL CONTENT
EMAIL CONTENT
16.3 13.215.4 15.1 13.816.0 15.1OVERALL SCORE
VerticalApparel Health & BeautyDepartment StoreSporting Goods
Grand Total
OVERALL SCORE
Home Goods& Furnishings
Big Box & GeneralMerchandise
RESULTS
2018 Email Marketing Study
Orvis
J. Crew
Best Buy
Dick's Sporting Goods
Saks Fifth Avenue
26.7
26.3
25.9
24.5
24.3
(Out of 33.3)
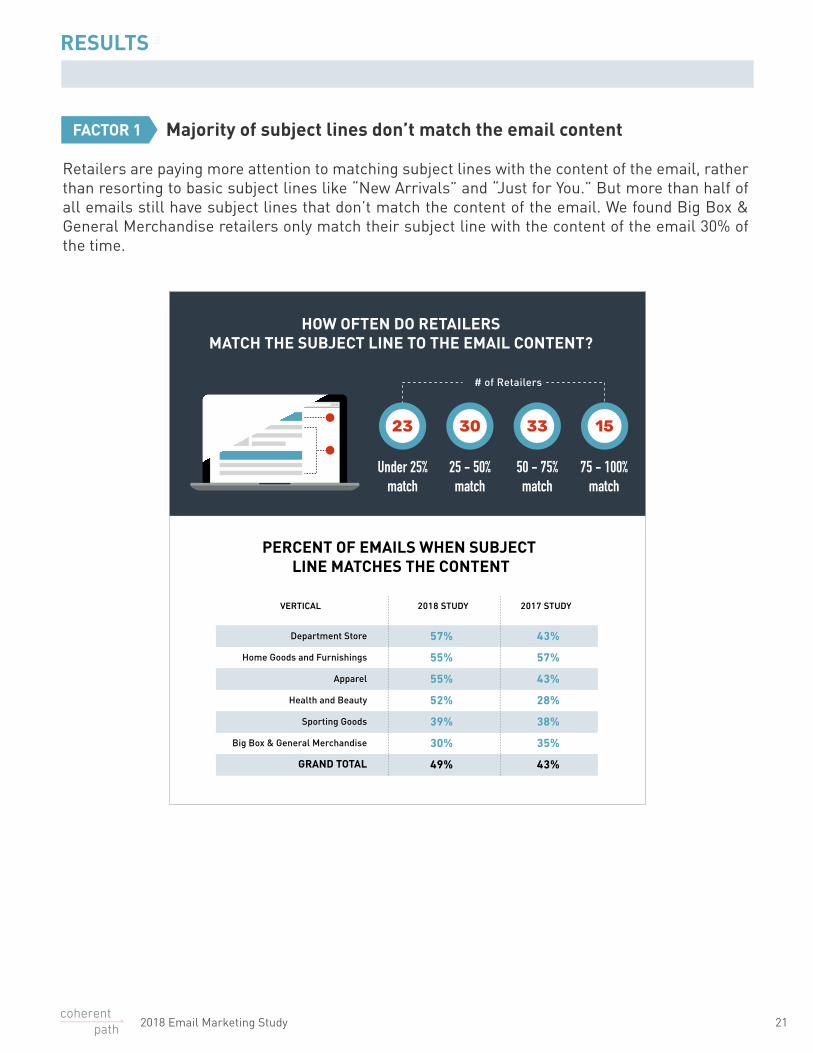
Majority of subject lines don’t match the email content
Retailers are paying more attention to matching subject lines with the content of the email, rather than resorting to basic subject lines like “New Arrivals” and “Just for You.” But more than half of all emails still have subject lines that don’t match the content of the email. We found Big Box & General Merchandise retailers only match their subject line with the content of the email 30% of the time.
% OF ANIMATIONIN EMAILS
HOW OFTEN DO RETAILERSMATCH THE SUBJECT LINE TO THE EMAIL CONTENT?
PERCENT OF EMAILS WHEN SUBJECT LINE MATCHES THE CONTENT
57%
55%
55%
52%
39%
30%
49%
43%
57%
43%
28%
38%
35%
43%
Department Store
Home Goods and Furnishings
Apparel
Health and Beauty
Sporting Goods
Big Box & General Merchandise
GRAND TOTAL
2018 STUDY 2017 STUDYVERTICAL
Under 25%match
25 - 50%match
50 - 75%match
75 - 100%match
# of Retailers
30 33 1523
21
RESULTS
2018 Email Marketing Study
FACTOR 1

Retailers sending less discounts in subject lines
While it appears retailers are working to reduce their reliance on discounts, we found discount or promotional language in 39% of all emails (compared to 43% in our previous evaluation). Health & Beauty and Home Goods & Furnishings retailers have the highest use of promotional language (51% and 48%, respectively). Four retailers – Frontgate, Lands’ End, West Elm and CVS – mention a discount or promotion in their email subject lines more than 75% of the time.
2726 44
Under 25% 25 - 50% 50 - 75% 75 - 100%
3
HOW OFTEN AREDISCOUNTS OR PROMOTIONS IN THE SUBJECT LINE?
# of Retailers
Apparel
Sporting Goods
Home Goods& Furnishings
Department Store
Health & Beauty
Big Box & GeneralMerchandise
AVERAGE
51%
39% 43%
48%
42%
42%
34%
26%
55%
60%
52%
37%
26%
42%
% OF EMAILS WITH DISCOUNTS ORPROMOTIONS IN THE SUBJECT LINE
2018 STUDY 2017 STUDY
22
RESULTS
2018 Email Marketing Study
FACTOR 2
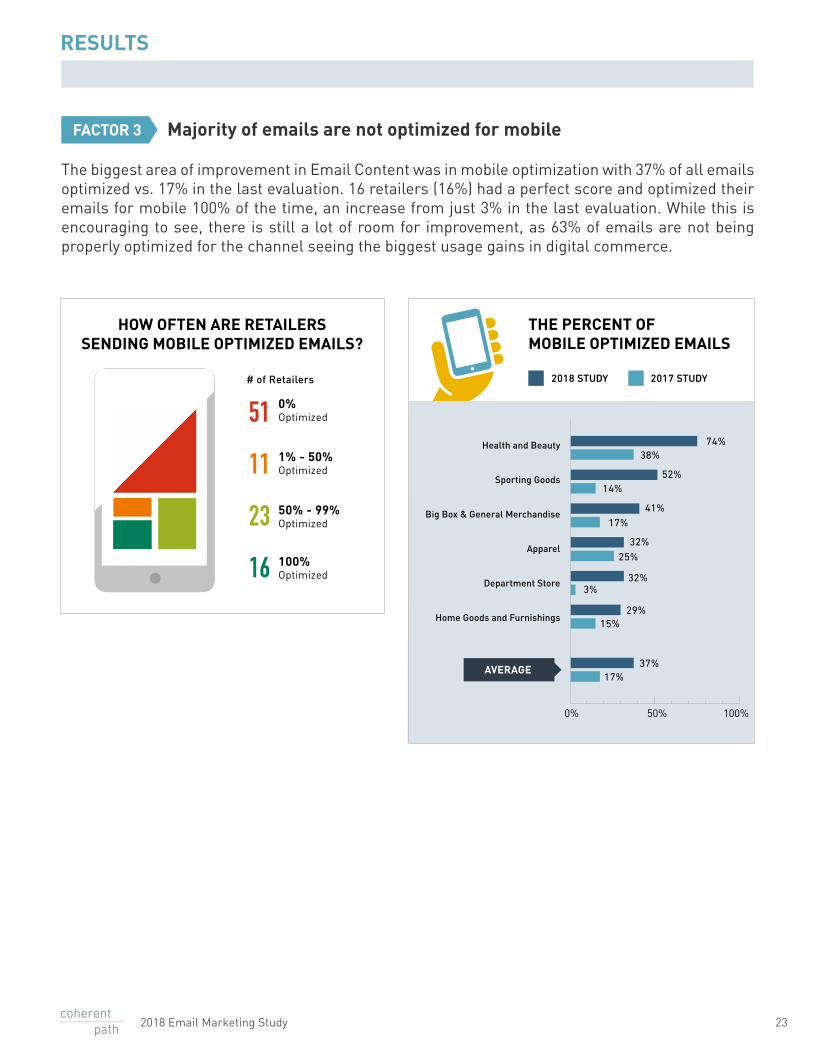
The biggest area of improvement in Email Content was in mobile optimization with 37% of all emails optimized vs. 17% in the last evaluation. 16 retailers (16%) had a perfect score and optimized their emails for mobile 100% of the time, an increase from just 3% in the last evaluation. While this is encouraging to see, there is still a lot of room for improvement, as 63% of emails are not being properly optimized for the channel seeing the biggest usage gains in digital commerce.
0%Optimized
1% - 50%Optimized
50% - 99%Optimized
100%Optimized
51
11
23
16
HOW OFTEN ARE RETAILERSSENDING MOBILE OPTIMIZED EMAILS?
# of Retailers
Health and Beauty
Sporting Goods
Big Box & General Merchandise
Apparel
Department Store
Home Goods and Furnishings
2018 STUDY 2017 STUDY
THE PERCENT OF MOBILE OPTIMIZED EMAILS
AVERAGE
0% 50% 100%
74%38%
52%14%
41%17%
32%25%
32%3%
29%15%
37%17%
23
Majority of emails are not optimized for mobile
RESULTS
2018 Email Marketing Study
FACTOR 3
24
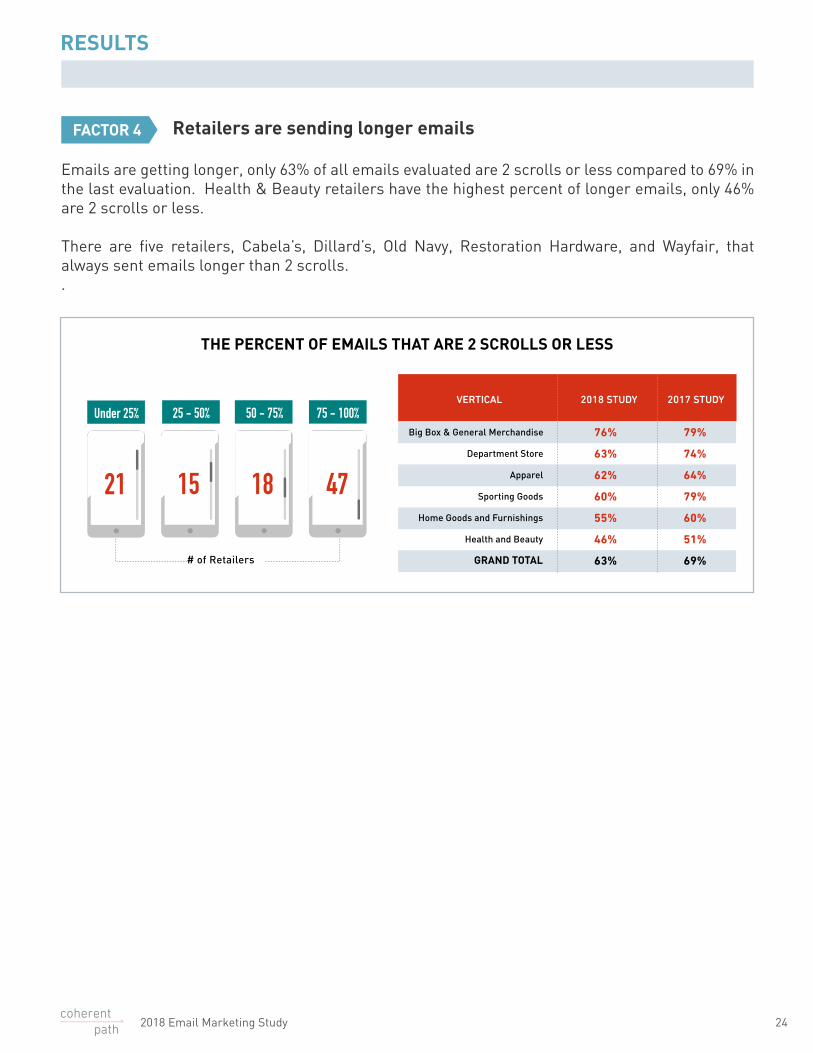
Emails are getting longer, only 63% of all emails evaluated are 2 scrolls or less compared to 69% in the last evaluation. Health & Beauty retailers have the highest percent of longer emails, only 46% are 2 scrolls or less.
There are five retailers, Cabela’s, Dillard’s, Old Navy, Restoration Hardware, and Wayfair, that always sent emails longer than 2 scrolls. .
Retailers are sending longer emails
76%
63%
62%
60%
55%
46%
63%
79%
74%
64%
79%
60%
51%
69%
Big Box & General Merchandise
Department Store
Apparel
Sporting Goods
Home Goods and Furnishings
Health and Beauty
GRAND TOTAL
VERTICAL 2018 STUDY 2017 STUDYUnder 25% 25 - 50% 50 - 75% 75 - 100%
21 15 18 47
# of Retailers
THE PERCENT OF EMAILS THAT ARE 2 SCROLLS OR LESS
RESULTS
2018 Email Marketing Study
FACTOR 4
Retailers spend a lot of time and resources trying to acquire new customers, but most are not using their purchase data to get the highest return on their investment.
Our study found that a majority of top retailers are failing to use their data to personalize emails to email subscribers who have purchased, instead choosing to send them the same emails as the email subscribers who have not purchased. In fact, retailers are typically sending more emails to their non-purchasing subscribers.
The good news? Since so many retailers are missing the mark on their email campaigns, any retailer who is optimizing their Purchaser Experience, Email Frequency, Catalog Exposure and Email Content will be far ahead of its competitors.
More specifically, retailers can benefit greatly from creating email content based on what they have learned from their subscriber data. They can also explore a larger variety of categories and subcategories in their emails as a way to better ascertain which catalog items are engaging for subscribers.
Even when purchase data does not exist for subscribers, retailers can get to know them faster by considering any open and click data from their emails. When you pay close attention to your data, you’ll be one step closer to converting your subscribers into repeat customers, and ultimately, into your loyal brand ambassadors.
25
CONCLUSION Using email subscriber datato convert consumers into loyal customers
2018 Email Marketing Study
26
About Coherent Path:
Coherent Path is the email marketing calendar company for top retailers seeking to transform their email program into a modern data-driven channel focused on revenue. The company's machine learning solution empowers retailers with the relevant themes and categories they should feature in today’s campaigns while continuously learning to inform the campaigns of tomorrow. By creating an optimized email diet that caters to each customer's evolving tastes and moods, Coherent Path helps retailers quickly engage and cross-sell customers and promote strategic product categories while reducing email fatigue. Headquartered in Boston, Mass. with an office in Toronto, Coherent Path works with retail leaders including Neiman Marcus and Staples.
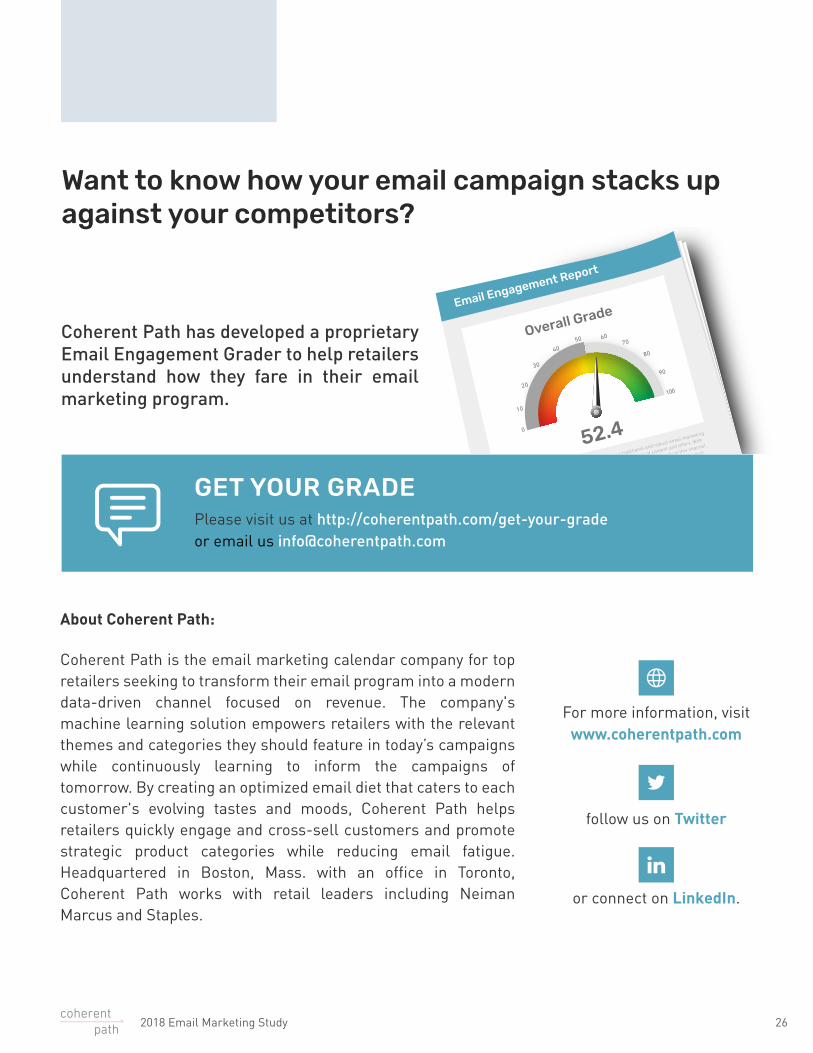
Want to know how your email campaign stacks up against your competitors?
Please visit us at http://coherentpath.com/get-your-grade or email us [email protected]
Coherent Path has developed a proprietary Email Engagement Grader to help retailers understand how they fare in their email marketing program.
GET YOUR GRADE
For more information, visitwww.coherentpath.com
follow us on Twitter
or connect on LinkedIn.
Overall Grade
0
50
30
20
10
4070
80
90
60
100
52.4
In our initial findings, Bloomingdale’s appears to have a traditional and robust email marketing
program that engages customers on a regular basis with a variety of content and o�ers. With
more than 540 emails sent in 2016, the Company is obviously investing heavily in this channel.
The average overall score across a competitive set of retailers is 62. Bloomingdale's score is
slightly below the average and there is room for improvement in one or more key dimensions of
the program, details follow.
Email Engagement Report
2018 Email Marketing Study
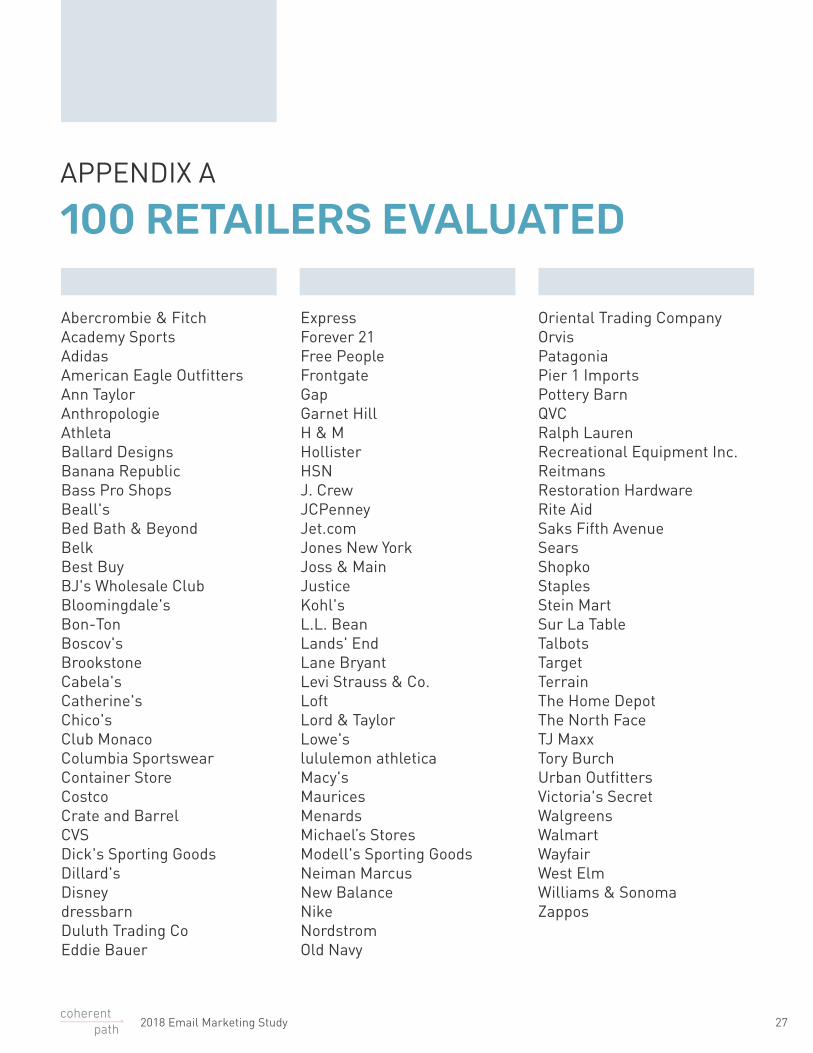
Abercrombie & FitchAcademy SportsAdidasAmerican Eagle OutfittersAnn TaylorAnthropologieAthletaBallard DesignsBanana RepublicBass Pro ShopsBeall'sBed Bath & BeyondBelkBest BuyBJ's Wholesale ClubBloomingdale'sBon-TonBoscov'sBrookstoneCabela'sCatherine'sChico'sClub MonacoColumbia SportswearContainer StoreCostcoCrate and BarrelCVSDick's Sporting GoodsDillard'sDisneydressbarnDuluth Trading CoEddie Bauer
ExpressForever 21Free PeopleFrontgateGapGarnet HillH & MHollisterHSNJ. CrewJCPenneyJet.comJones New YorkJoss & MainJusticeKohl'sL.L. BeanLands' EndLane BryantLevi Strauss & Co.LoftLord & TaylorLowe'slululemon athleticaMacy's MauricesMenardsMichael’s StoresModell's Sporting GoodsNeiman MarcusNew BalanceNikeNordstromOld Navy
Oriental Trading CompanyOrvisPatagoniaPier 1 ImportsPottery BarnQVCRalph LaurenRecreational Equipment Inc. ReitmansRestoration HardwareRite AidSaks Fifth AvenueSearsShopkoStaplesStein MartSur La TableTalbotsTargetTerrainThe Home DepotThe North FaceTJ MaxxTory BurchUrban OutfittersVictoria's SecretWalgreensWalmart WayfairWest ElmWilliams & SonomaZappos
27
APPENDIX A
100 RETAILERS EVALUATED
2018 Email Marketing Study