Embed Size (px)
Citation preview
2018 FINANCIAL COMPENSATION SURVEY F I N D I N G S A N D R E S U LT S
NOVEMBER 2018
1
Dear Colleagues,
I am pleased to present the findings from the 2018 CFA Societies Financial Compensation Survey. This research initiative, now in its fifth iteration, continues to provide unique insights for a wide range of financial and investment professionals. With multiple years of survey results under our belts, we have built a robust dataset that continues to yield meaningful insights.
Our Society strives to be a trusted resource for the finance industry, providing services, education and information that can assist both Charterholders and non-Charterholders alike. I encourage you to review the findings on the following pages and make your own interpretations of the data. Be sure to examine all the information presented – such as ranges, sample sizes and other criteria — and do not rely on just one number (such as a median or maximum) when interpreting the results.
Whether you have participated in every survey since we started in 2013, or this is your first time, I personally want to thank you. Your willingness to take the time is what enables us to provide this indispensable resource for our entire industry. We truly appreciate your support.
Mark Peiler, CFA President, CFA Society Minnesota
2018 FINANCIAL COMPENSATION REPORTL E T T E R F R O M S O C I E T Y L E A D E R S H I P
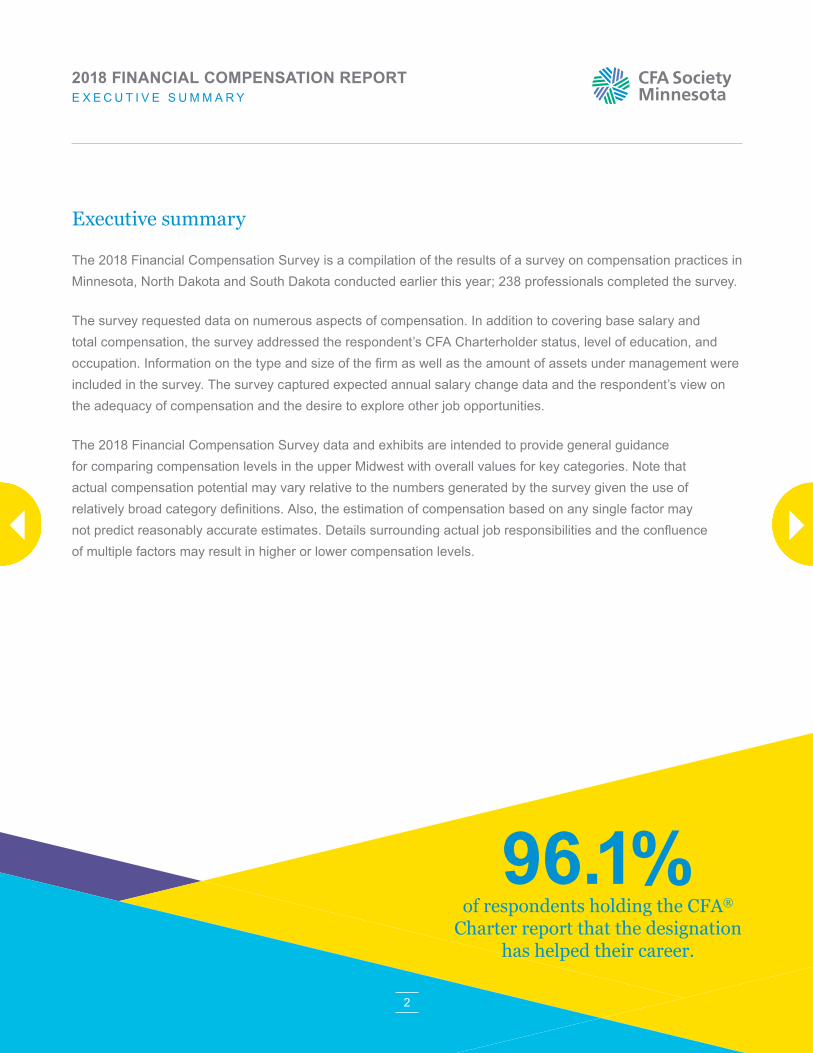
Executive summary
The 2018 Financial Compensation Survey is a compilation of the results of a survey on compensation practices in Minnesota, North Dakota and South Dakota conducted earlier this year; 238 professionals completed the survey.
The survey requested data on numerous aspects of compensation. In addition to covering base salary and total compensation, the survey addressed the respondent’s CFA Charterholder status, level of education, and occupation. Information on the type and size of the firm as well as the amount of assets under management were included in the survey. The survey captured expected annual salary change data and the respondent’s view on the adequacy of compensation and the desire to explore other job opportunities.
The 2018 Financial Compensation Survey data and exhibits are intended to provide general guidance for comparing compensation levels in the upper Midwest with overall values for key categories. Note that actual compensation potential may vary relative to the numbers generated by the survey given the use of relatively broad category definitions. Also, the estimation of compensation based on any single factor may not predict reasonably accurate estimates. Details surrounding actual job responsibilities and the confluence of multiple factors may result in higher or lower compensation levels.
2
96.1%of respondents holding the CFA®
Charter report that the designation has helped their career.
2018 FINANCIAL COMPENSATION REPORTE X E C U T I V E S U M M A R Y
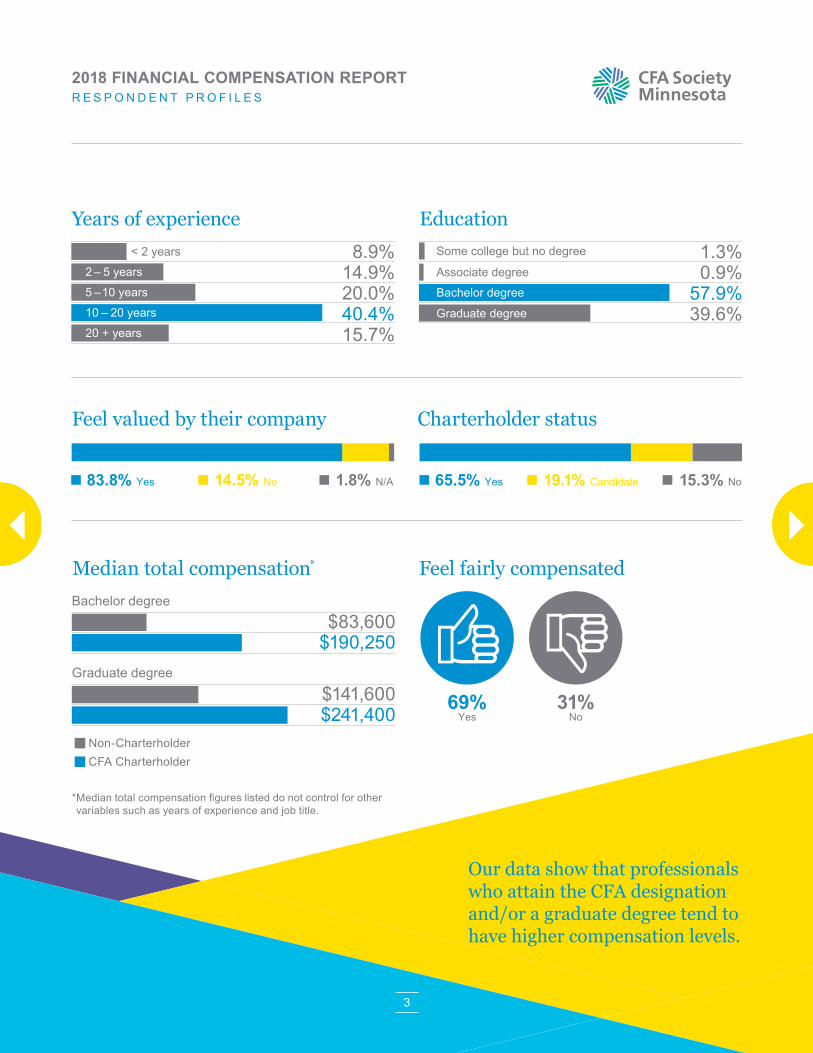
Years of experience< 2 years
2 – 5 years
5 –10 years
10 – 20 years
20 + years
8.9%14.9%20.0%40.4%15.7%
EducationSome college but no degree
Associate degree
Bachelor degree
Graduate degree
1.3%0.9%
57.9%39.6%
Feel fairly compensated
69%Yes
31%No
3
Median total compensation*
Non-Charterholder CFA Charterholder
$83,600$190,250
$141,600$241,400
Bachelor degree
Graduate degree
Our data show that professionals who attain the CFA designation and/or a graduate degree tend to have higher compensation levels.
* Median total compensation figures listed do not control for othervariables such as years of experience and job title.
Feel valued by their company
83.8% Yes 14.5% No 1.8% N/A
Charterholder status
65.5% Yes 19.1% Candidate 15.3% No
2018 FINANCIAL COMPENSATION REPORTR E S P O N D E N T P R O F I L E S
4
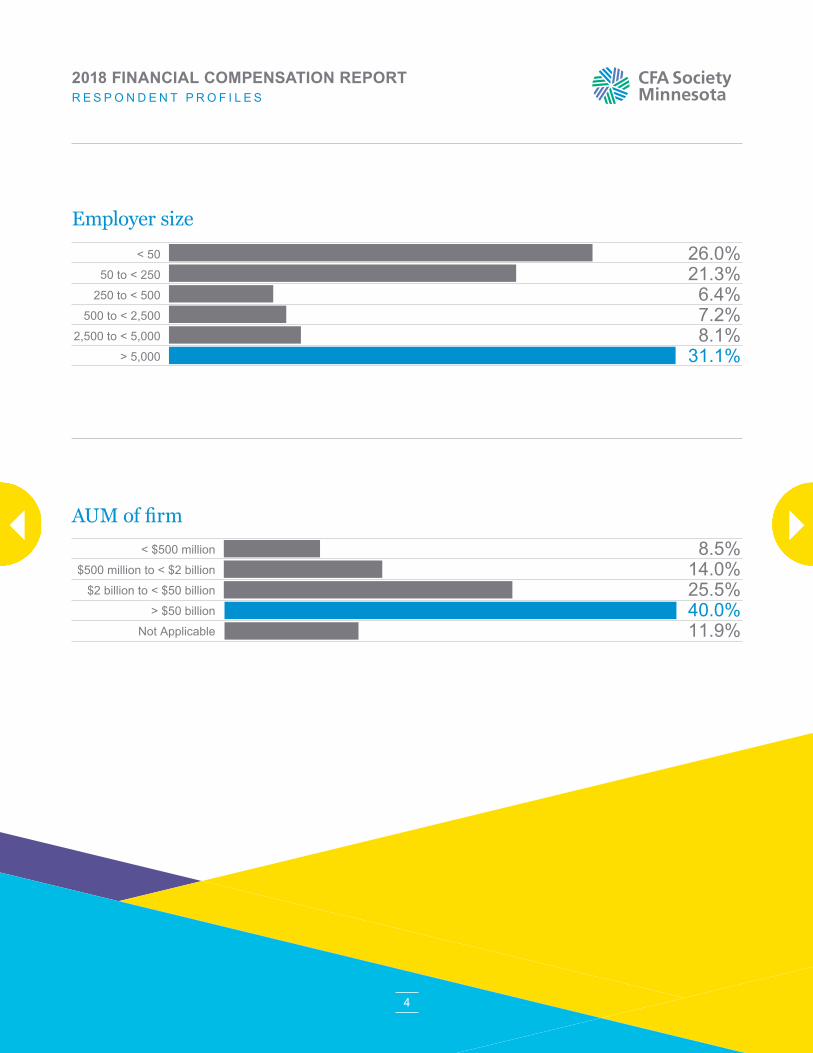
Employer size< 50
50 to < 250
250 to < 500
500 to < 2,500
2,500 to < 5,000
> 5,000
26.0%21.3%6.4%7.2%8.1%
31.1%
AUM of firm< $500 million
$500 million to < $2 billion
$2 billion to < $50 billion
> $50 billion
Not Applicable
8.5%14.0%25.5%40.0%11.9%
2018 FINANCIAL COMPENSATION REPORTR E S P O N D E N T P R O F I L E S
5
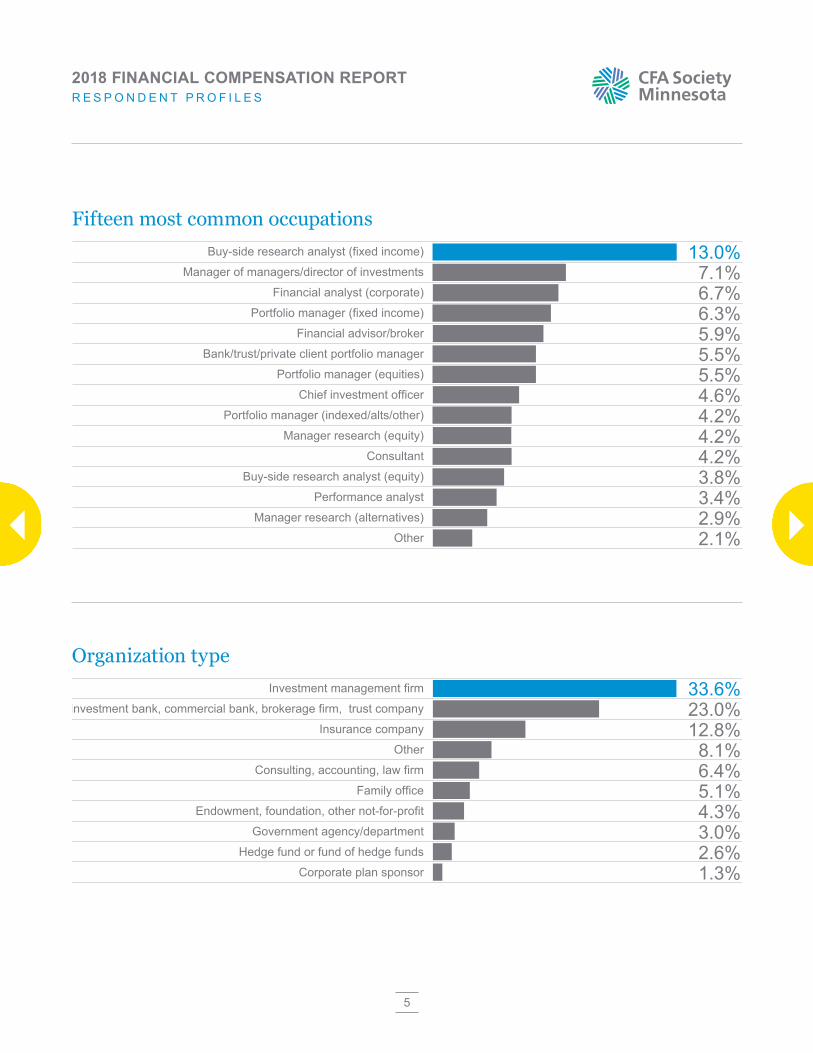
Fifteen most common occupationsBuy-side research analyst (fixed income)
Manager of managers/director of investments
Financial analyst (corporate)
Portfolio manager (fixed income)
Financial advisor/broker
Bank/trust/private client portfolio manager
Portfolio manager (equities)
Chief investment officer
Portfolio manager (indexed/alts/other)
Manager research (equity)
Consultant
Buy-side research analyst (equity)
Performance analyst
Manager research (alternatives)
Other
13.0%7.1%6.7%6.3%5.9%5.5%5.5%4.6%4.2%4.2%4.2%3.8%3.4%2.9%2.1%
Organization typeInvestment management firm
Investment bank, commercial bank, brokerage firm, trust company
Insurance company
Other
Consulting, accounting, law firm
Family office
Endowment, foundation, other not-for-profit
Government agency/department
Hedge fund or fund of hedge funds
Corporate plan sponsor
33.6%23.0%12.8%8.1%6.4%5.1%4.3%3.0%2.6%1.3%
2018 FINANCIAL COMPENSATION REPORTR E S P O N D E N T P R O F I L E S
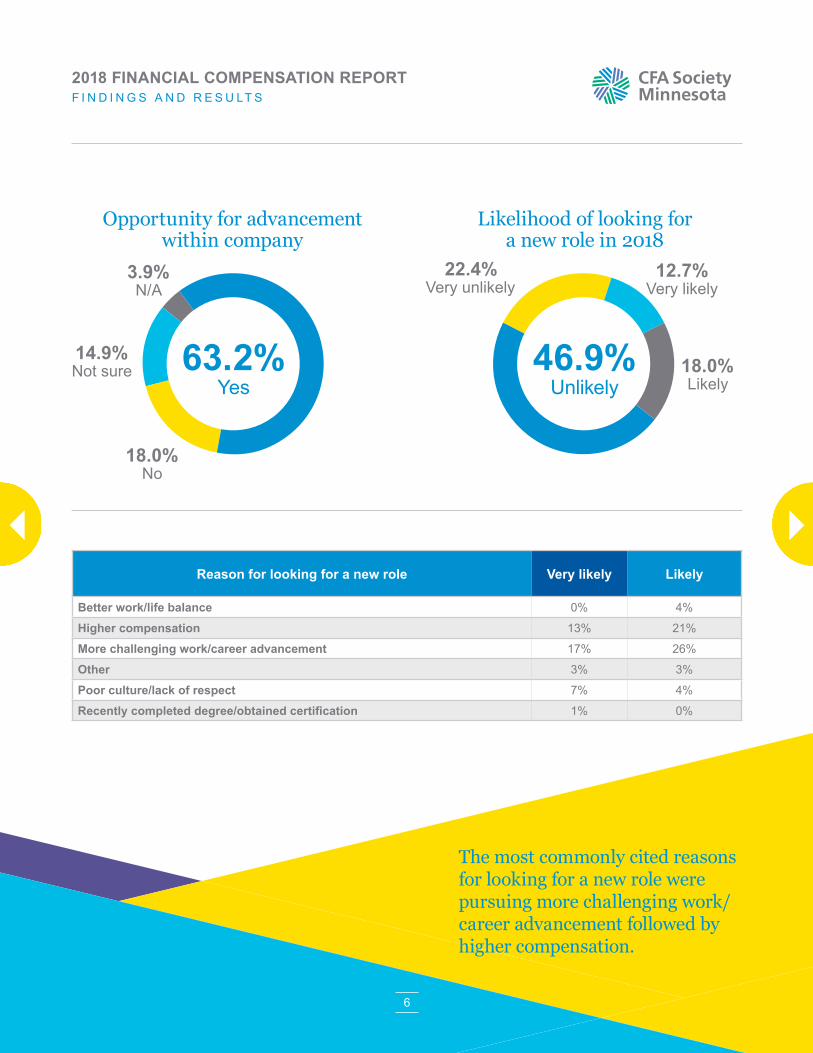
The most commonly cited reasons for looking for a new role were pursuing more challenging work/career advancement followed by higher compensation.
Reason for looking for a new role Very likely Likely
Better work/life balance 0% 4%
Higher compensation 13% 21%
More challenging work/career advancement 17% 26%
Other 3% 3%
Poor culture/lack of respect 7% 4%
Recently completed degree/obtained certification 1% 0%
6
Opportunity for advancement within company
3.9% N/A
18.0% No
14.9% Not sure 63.2%
Yes
Likelihood of looking for a new role in 2018
46.9%Unlikely
18.0% Likely
22.4% Very unlikely
12.7% Very likely
2018 FINANCIAL COMPENSATION REPORTF I N D I N G S A N D R E S U LT S
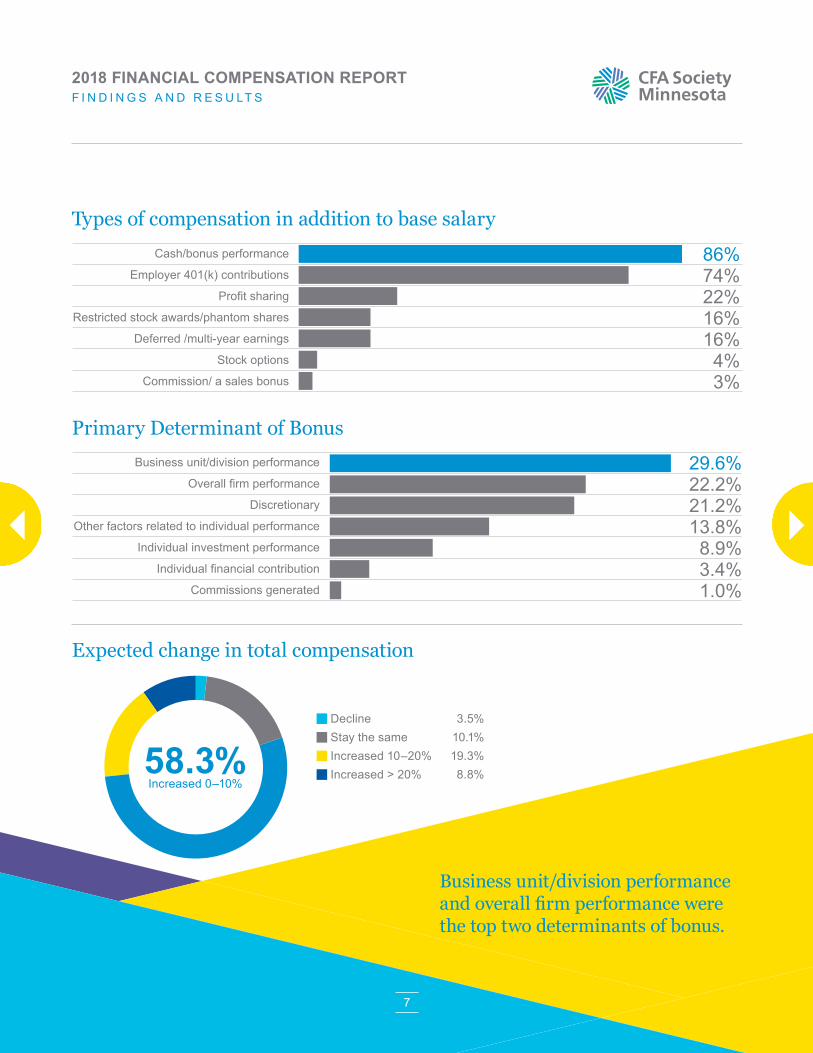
Types of compensation in addition to base salary
Primary Determinant of Bonus
Cash/bonus performance
Employer 401(k) contributions
Profit sharing
Restricted stock awards/phantom shares
Deferred /multi-year earnings
Stock options
Commission/ a sales bonus
86%74%22%16%16%4%3%
Business unit/division performance
Overall firm performance
Discretionary
Other factors related to individual performance
Individual investment performance
Individual financial contribution
Commissions generated
29.6%22.2%21.2%13.8%8.9%3.4%1.0%
Expected change in total compensation
Decline 3.5% Stay the same 10.1%
Increased 10–20% 19.3%
Increased > 20% 8.8%58.3%Increased 0–10%
Business unit/division performance and overall firm performance were the top two determinants of bonus.
7
2018 FINANCIAL COMPENSATION REPORTF I N D I N G S A N D R E S U LT S
8
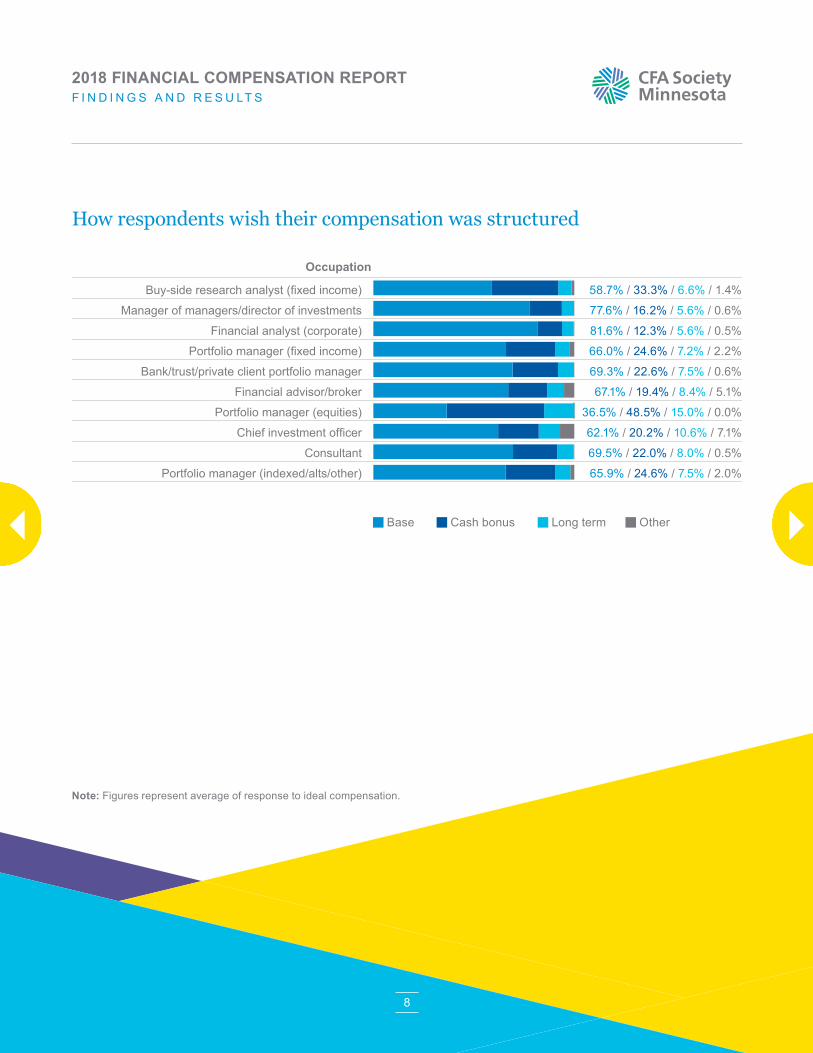
How respondents wish their compensation was structured
Occupation
Buy-side research analyst (fixed income)
Manager of managers/director of investments
Financial analyst (corporate)
Portfolio manager (fixed income)
Bank/trust/private client portfolio manager
Financial advisor/broker
Portfolio manager (equities)
Chief investment officer
Consultant
Portfolio manager (indexed/alts/other)
58.7% / 33.3% / 6.6% / 1.4%
77.6% / 16.2% / 5.6% / 0.6%
81.6% / 12.3% / 5.6% / 0.5%
66.0% / 24.6% / 7.2% / 2.2%
69.3% / 22.6% / 7.5% / 0.6%
67.1% / 19.4% / 8.4% / 5.1%
36.5% / 48.5% / 15.0% / 0.0%
62.1% / 20.2% / 10.6% / 7.1%
69.5% / 22.0% / 8.0% / 0.5%
65.9% / 24.6% / 7.5% / 2.0%
Base Cash bonus Long term Other
Note: Figures represent average of response to ideal compensation.
2018 FINANCIAL COMPENSATION REPORTF I N D I N G S A N D R E S U LT S
9
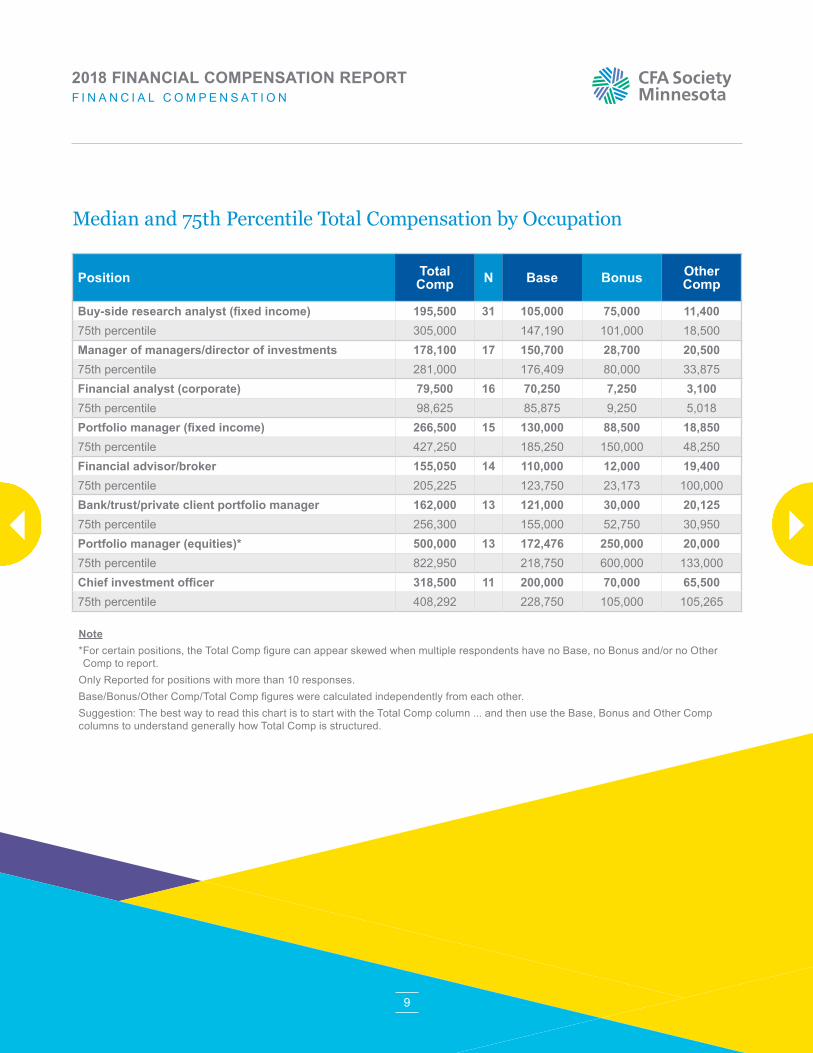
Median and 75th Percentile Total Compensation by Occupation
Position Total Comp N Base Bonus Other
Comp
Buy-side research analyst (fixed income) 195,500 31 105,000 75,000 11,40075th percentile 305,000 147,190 101,000 18,500Manager of managers/director of investments 178,100 17 150,700 28,700 20,50075th percentile 281,000 176,409 80,000 33,875Financial analyst (corporate) 79,500 16 70,250 7,250 3,10075th percentile 98,625 85,875 9,250 5,018Portfolio manager (fixed income) 266,500 15 130,000 88,500 18,85075th percentile 427,250 185,250 150,000 48,250Financial advisor/broker 155,050 14 110,000 12,000 19,40075th percentile 205,225 123,750 23,173 100,000Bank/trust/private client portfolio manager 162,000 13 121,000 30,000 20,12575th percentile 256,300 155,000 52,750 30,950Portfolio manager (equities)* 500,000 13 172,476 250,000 20,00075th percentile 822,950 218,750 600,000 133,000Chief investment officer 318,500 11 200,000 70,000 65,50075th percentile 408,292 228,750 105,000 105,265
Note* For certain positions, the Total Comp figure can appear skewed when multiple respondents have no Base, no Bonus and/or no Other Comp to report.
Only Reported for positions with more than 10 responses. Base/Bonus/Other Comp/Total Comp figures were calculated independently from each other.Suggestion: The best way to read this chart is to start with the Total Comp column ... and then use the Base, Bonus and Other Comp columns to understand generally how Total Comp is structured.
2018 FINANCIAL COMPENSATION REPORTF I N A N C I A L C O M P E N S AT I O N
10
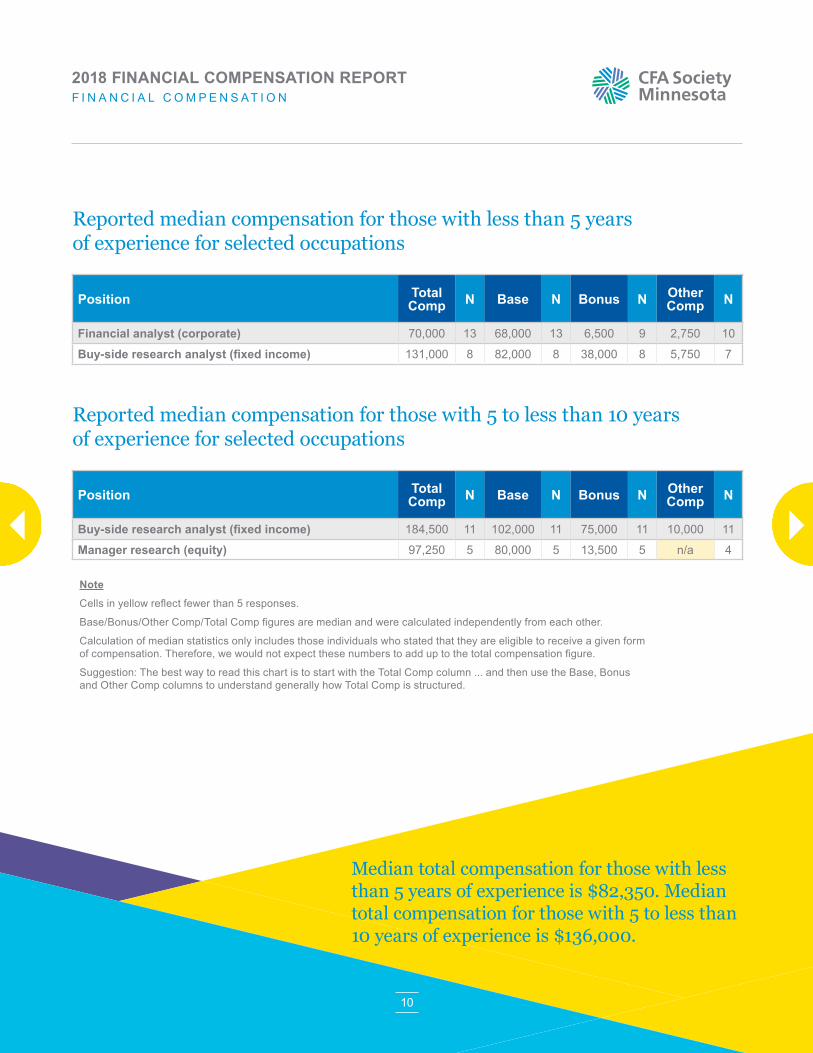
Reported median compensation for those with less than 5 years of experience for selected occupations
Position Total Comp N Base N Bonus N Other
Comp N
Financial analyst (corporate) 70,000 13 68,000 13 6,500 9 2,750 10
Buy-side research analyst (fixed income) 131,000 8 82,000 8 38,000 8 5,750 7
Reported median compensation for those with 5 to less than 10 years of experience for selected occupations
Position Total Comp N Base N Bonus N Other
Comp N
Buy-side research analyst (fixed income) 184,500 11 102,000 11 75,000 11 10,000 11
Manager research (equity) 97,250 5 80,000 5 13,500 5 n/a 4
Median total compensation for those with less than 5 years of experience is $82,350. Median total compensation for those with 5 to less than 10 years of experience is $136,000.
Note
Cells in yellow reflect fewer than 5 responses.
Base/Bonus/Other Comp/Total Comp figures are median and were calculated independently from each other.
Calculation of median statistics only includes those individuals who stated that they are eligible to receive a given form of compensation. Therefore, we would not expect these numbers to add up to the total compensation figure.
Suggestion: The best way to read this chart is to start with the Total Comp column ... and then use the Base, Bonus and Other Comp columns to understand generally how Total Comp is structured.
2018 FINANCIAL COMPENSATION REPORTF I N A N C I A L C O M P E N S AT I O N
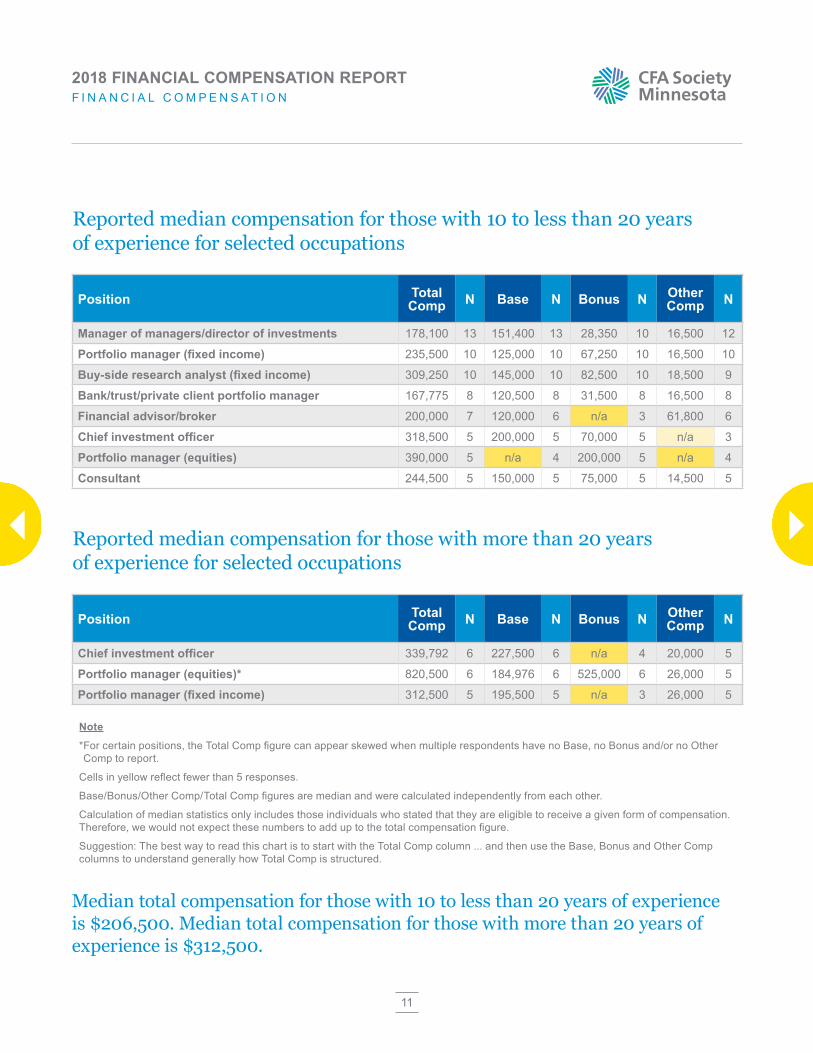
Reported median compensation for those with 10 to less than 20 years of experience for selected occupations
Position Total Comp N Base N Bonus N Other
Comp N
Manager of managers/director of investments 178,100 13 151,400 13 28,350 10 16,500 12
Portfolio manager (fixed income) 235,500 10 125,000 10 67,250 10 16,500 10
Buy-side research analyst (fixed income) 309,250 10 145,000 10 82,500 10 18,500 9
Bank/trust/private client portfolio manager 167,775 8 120,500 8 31,500 8 16,500 8
Financial advisor/broker 200,000 7 120,000 6 n/a 3 61,800 6
Chief investment officer 318,500 5 200,000 5 70,000 5 n/a 3
Portfolio manager (equities) 390,000 5 n/a 4 200,000 5 n/a 4
Consultant 244,500 5 150,000 5 75,000 5 14,500 5
Reported median compensation for those with more than 20 years of experience for selected occupations
Position Total Comp N Base N Bonus N Other
Comp N
Chief investment officer 339,792 6 227,500 6 n/a 4 20,000 5
Portfolio manager (equities)* 820,500 6 184,976 6 525,000 6 26,000 5
Portfolio manager (fixed income) 312,500 5 195,500 5 n/a 3 26,000 5
11
Median total compensation for those with 10 to less than 20 years of experience is $206,500. Median total compensation for those with more than 20 years of experience is $312,500.
Note
* For certain positions, the Total Comp figure can appear skewed when multiple respondents have no Base, no Bonus and/or no Other Comp to report.
Cells in yellow reflect fewer than 5 responses.
Base/Bonus/Other Comp/Total Comp figures are median and were calculated independently from each other.
Calculation of median statistics only includes those individuals who stated that they are eligible to receive a given form of compensation. Therefore, we would not expect these numbers to add up to the total compensation figure.
Suggestion: The best way to read this chart is to start with the Total Comp column ... and then use the Base, Bonus and Other Comp columns to understand generally how Total Comp is structured.
2018 FINANCIAL COMPENSATION REPORTF I N A N C I A L C O M P E N S AT I O N
12
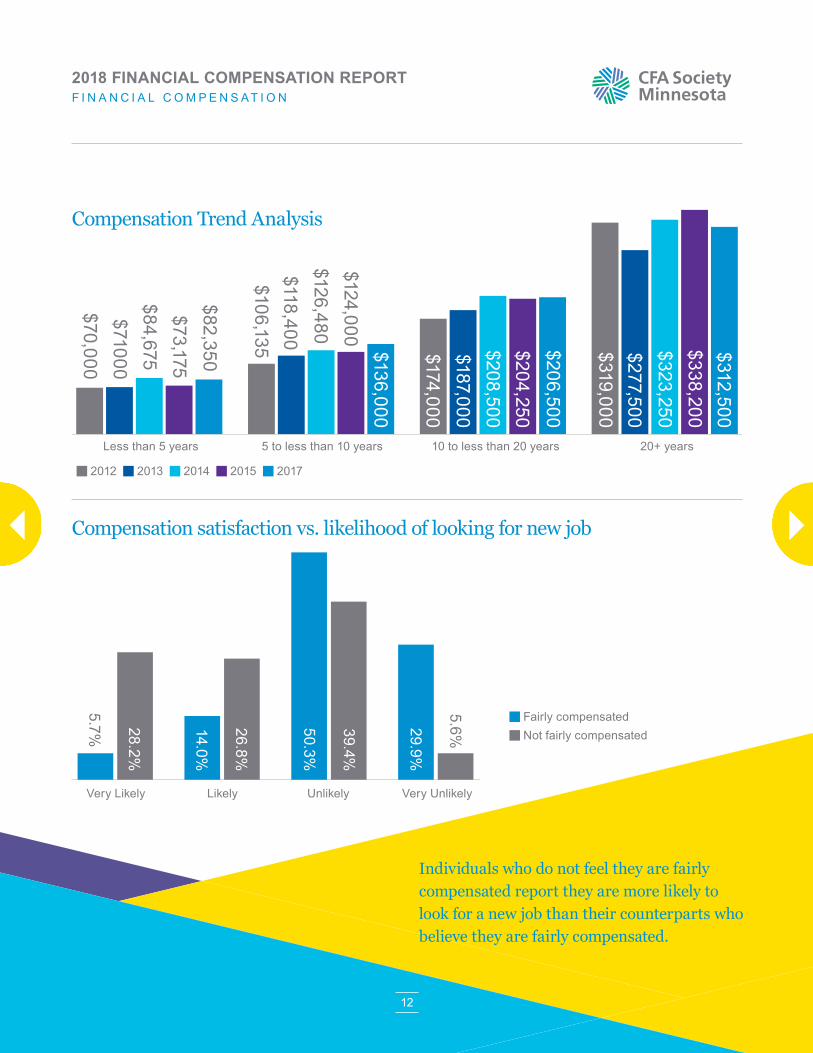
Individuals who do not feel they are fairly compensated report they are more likely to look for a new job than their counterparts who believe they are fairly compensated.
Compensation satisfaction vs. likelihood of looking for new job
Compensation Trend Analysis
Fairly compensated Not fairly compensated
2012 2013 2014 2015 2017
$70,000
$84,675$73,175
$82,350
$71000
$106,135
$126,480$124,000
$136,000
$118,400
$174,000
$208,500$204,250$206,500
$187,000
$319,000
$323,250$338,200$312,500
$277,500
Less than 5 years 10 to less than 20 years 20+ years5 to less than 10 years
5.7% 28.2%
14.0%
26.8%
50.3%
39.4%
29.9%
5.6%
Very Likely Likely Unlikely Very Unlikely
2018 FINANCIAL COMPENSATION REPORTF I N A N C I A L C O M P E N S AT I O N

13
Survey methodology
MethodAn online survey was deployed to known financial professionals in the region represented by CFA Society Minnesota. Email subscribers of the Society and members of its social media platforms were specifically targeted. The survey was not limited to just these audiences. In addition, this survey was structured so all data gathered was anonymous, with no identifiable information requested.
RespondentsRespondents were financial and investment professionals and totaled 238 unique and completed responses.
TimingThe survey was active from May 14 – June 22, 2018.
AssumptionsThe findings from this survey were derived from self-reported data. Because the survey used sampling methodology and broadly defined positions, survey findings are not necessarily representative of the total population. The survey is designed to provide general information about pay levels within the industry. Earning any degree or professional designation is no guarantee of employment or compensation.
2018 FINANCIAL COMPENSATION REPORTS U R V E Y M E T H O D O L O G Y
14
About the CFA Society
CFA Society Minnesota is the premier professional organization for investment professionals to connect with Chartered Financial Analysts in the Twin Cities area and throughout the Upper Midwest. With members in five states and a wide variety of industries, CFA Society Minnesota strives to serve its broad membership through relevant educational programming, membership support services and opportunities for advancement such as networking events and discounts on educational materials.
If you are interested in learning more about earning your charter, or to learn more about CFA Society Minnesota, contact [email protected].
Follow CFA Society Minnesota at:
2018 FINANCIAL COMPENSATION REPORTA B O U T T H E C F A S O C I E T Y


![---------------------------------------------------------- · Babanaft v Bassatne [1990] Ch 13, it was not possible to obtain any freezing injunction regarding assets located abroad:](https://img.pdfslide.net/doc/110x75/6114495526d09b48c076d8f4/babanaft-v-bassatne-1990-ch-13-it-was-not-possible-to-obtain-any-freezing-injunction.jpg)