Embed Size (px)
Citation preview
Underlying sales growth (USG), underlying volume growth (UVG), underlying price growth (UPG), underlying operating profit (UOP), underlying operating margin (UOM), underlying earnings per share
(underlying EPS), constant underlying EPS, underlying effective tax rate, free cash flow (FCF) and net debt are non-GAAP measures (see pages 6 to 9)
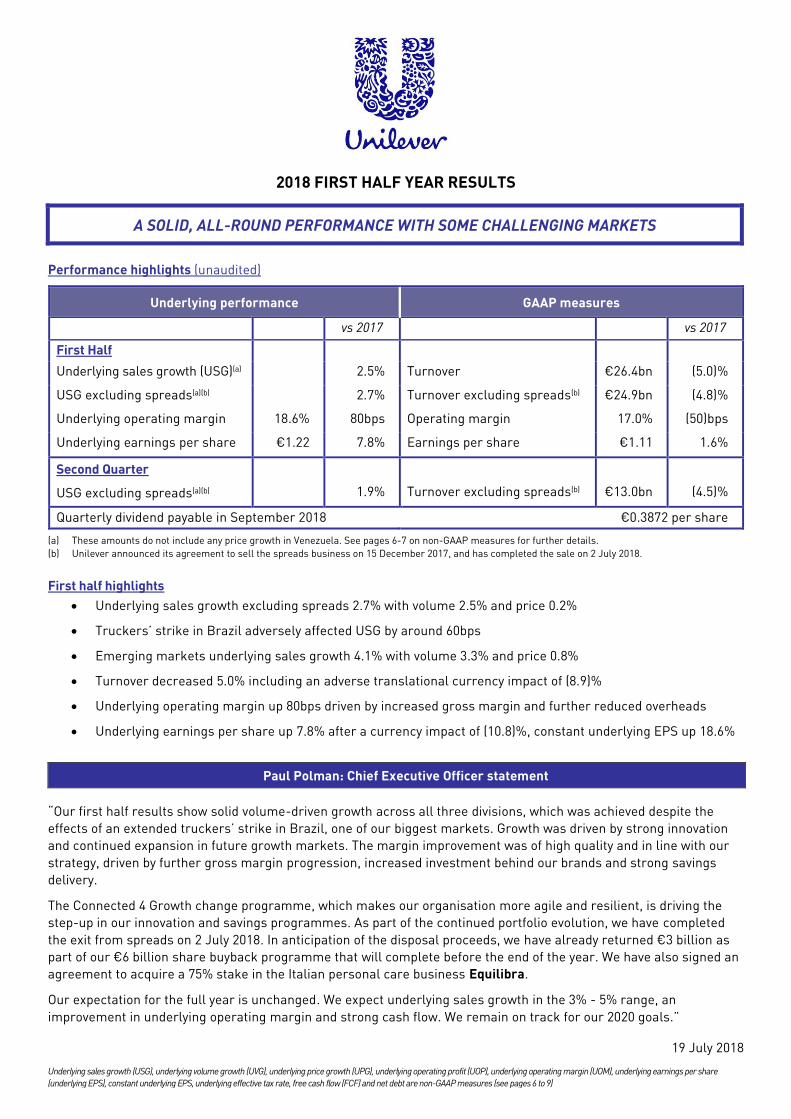
2018 FIRST HALF YEAR RESULTS
A SOLID, ALL-ROUND PERFORMANCE WITH SOME CHALLENGING MARKETS
Performance highlights (unaudited)
Underlying performance GAAP measures
vs 2017 vs 2017
First Half
Underlying sales growth (USG)(a) 2.5% Turnover €26.4bn (5.0)%
USG excluding spreads(a)(b) 2.7% Turnover excluding spreads(b) €24.9bn (4.8)%
Underlying operating margin 18.6% 80bps Operating margin 17.0% (50)bps
Underlying earnings per share €1.22 7.8% Earnings per share €1.11 1.6%
Second Quarter
USG excluding spreads(a)(b) 1.9% Turnover excluding spreads(b) €13.0bn (4.5)%
Quarterly dividend payable in September 2018 €0.3872 per share
(a) These amounts do not include any price growth in Venezuela. See pages 6-7 on non-GAAP measures for further details.
(b) Unilever announced its agreement to sell the spreads business on 15 December 2017, and has completed the sale on 2 July 2018.
First half highlights
• Underlying sales growth excluding spreads 2.7% with volume 2.5% and price 0.2%
• Truckers’ strike in Brazil adversely affected USG by around 60bps
• Emerging markets underlying sales growth 4.1% with volume 3.3% and price 0.8%
• Turnover decreased 5.0% including an adverse translational currency impact of (8.9)%
• Underlying operating margin up 80bps driven by increased gross margin and further reduced overheads
• Underlying earnings per share up 7.8% after a currency impact of (10.8)%, constant underlying EPS up 18.6%
Paul Polman: Chief Executive Officer statement
“Our first half results show solid volume-driven growth across all three divisions, which was achieved despite the
effects of an extended truckers’ strike in Brazil, one of our biggest markets. Growth was driven by strong innovation
and continued expansion in future growth markets. The margin improvement was of high quality and in line with our
strategy, driven by further gross margin progression, increased investment behind our brands and strong savings
delivery.
The Connected 4 Growth change programme, which makes our organisation more agile and resilient, is driving the
step-up in our innovation and savings programmes. As part of the continued portfolio evolution, we have completed
the exit from spreads on 2 July 2018. In anticipation of the disposal proceeds, we have already returned €3 billion as
part of our €6 billion share buyback programme that will complete before the end of the year. We have also signed an
agreement to acquire a 75% stake in the Italian personal care business Equilibra.
Our expectation for the full year is unchanged. We expect underlying sales growth in the 3% - 5% range, an
improvement in underlying operating margin and strong cash flow. We remain on track for our 2020 goals.”
19 July 2018
USG, UVG, UPG, UOP, UOM, underlying EPS, constant underlying EPS, underlying effective tax rate, FCF and net debt are non-GAAP measures (see pages 6 to 9) 2
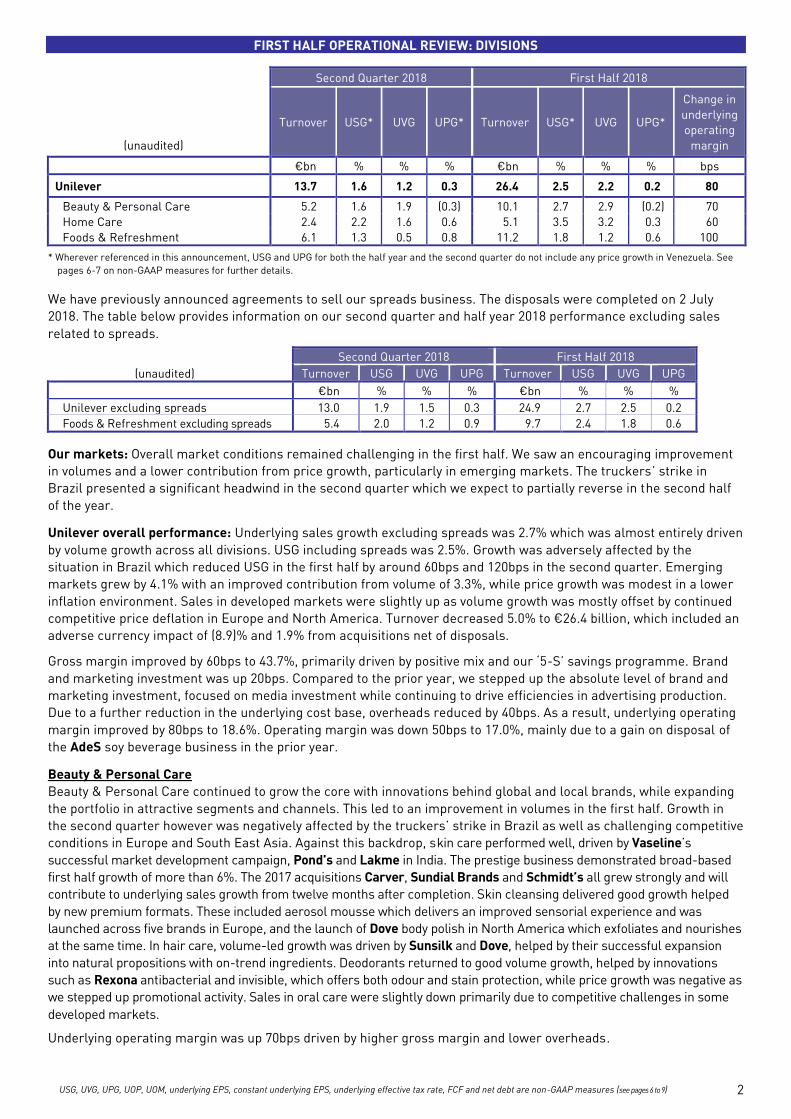
FIRST HALF OPERATIONAL REVIEW: DIVISIONS
Second Quarter 2018 First Half 2018
(unaudited)
Turnover USG* UVG UPG* Turnover USG* UVG UPG*
Change in
underlying
operating
margin
€bn % % % €bn % % % bps
Unilever 13.7 1.6 1.2 0.3 26.4 2.5 2.2 0.2 80
Beauty & Personal Care 5.2 1.6 1.9 (0.3) 10.1 2.7 2.9 (0.2) 70
Home Care 2.4 2.2 1.6 0.6 5.1 3.5 3.2 0.3 60
Foods & Refreshment 6.1 1.3 0.5 0.8 11.2 1.8 1.2 0.6 100
* Wherever referenced in this announcement, USG and UPG for both the half year and the second quarter do not include any price growth in Venezuela. See
pages 6-7 on non-GAAP measures for further details.
We have previously announced agreements to sell our spreads business. The disposals were completed on 2 July
2018. The table below provides information on our second quarter and half year 2018 performance excluding sales
related to spreads.
Second Quarter 2018 First Half 2018
(unaudited) Turnover USG UVG UPG Turnover USG UVG UPG
€bn % % % €bn % % %
Unilever excluding spreads 13.0 1.9 1.5 0.3 24.9 2.7 2.5 0.2
Foods & Refreshment excluding spreads 5.4 2.0 1.2 0.9 9.7 2.4 1.8 0.6
Our markets: Overall market conditions remained challenging in the first half. We saw an encouraging improvement
in volumes and a lower contribution from price growth, particularly in emerging markets. The truckers’ strike in
Brazil presented a significant headwind in the second quarter which we expect to partially reverse in the second half
of the year.
Unilever overall performance: Underlying sales growth excluding spreads was 2.7% which was almost entirely driven
by volume growth across all divisions. USG including spreads was 2.5%. Growth was adversely affected by the
situation in Brazil which reduced USG in the first half by around 60bps and 120bps in the second quarter. Emerging
markets grew by 4.1% with an improved contribution from volume of 3.3%, while price growth was modest in a lower
inflation environment. Sales in developed markets were slightly up as volume growth was mostly offset by continued
competitive price deflation in Europe and North America. Turnover decreased 5.0% to €26.4 billion, which included an
adverse currency impact of (8.9)% and 1.9% from acquisitions net of disposals.
Gross margin improved by 60bps to 43.7%, primarily driven by positive mix and our ‘5-S’ savings programme. Brand
and marketing investment was up 20bps. Compared to the prior year, we stepped up the absolute level of brand and
marketing investment, focused on media investment while continuing to drive efficiencies in advertising production.
Due to a further reduction in the underlying cost base, overheads reduced by 40bps. As a result, underlying operating
margin improved by 80bps to 18.6%. Operating margin was down 50bps to 17.0%, mainly due to a gain on disposal of
the AdeS soy beverage business in the prior year.
Beauty & Personal Care
Beauty & Personal Care continued to grow the core with innovations behind global and local brands, while expanding
the portfolio in attractive segments and channels. This led to an improvement in volumes in the first half. Growth in
the second quarter however was negatively affected by the truckers’ strike in Brazil as well as challenging competitive
conditions in Europe and South East Asia. Against this backdrop, skin care performed well, driven by Vaseline’s
successful market development campaign, Pond’s and Lakme in India. The prestige business demonstrated broad-based
first half growth of more than 6%. The 2017 acquisitions Carver, Sundial Brands and Schmidt’s all grew strongly and will
contribute to underlying sales growth from twelve months after completion. Skin cleansing delivered good growth helped
by new premium formats. These included aerosol mousse which delivers an improved sensorial experience and was
launched across five brands in Europe, and the launch of Dove body polish in North America which exfoliates and nourishes
at the same time. In hair care, volume-led growth was driven by Sunsilk and Dove, helped by their successful expansion
into natural propositions with on-trend ingredients. Deodorants returned to good volume growth, helped by innovations
such as Rexona antibacterial and invisible, which offers both odour and stain protection, while price growth was negative as
we stepped up promotional activity. Sales in oral care were slightly down primarily due to competitive challenges in some
developed markets.
Underlying operating margin was up 70bps driven by higher gross margin and lower overheads.
3
Home Care
Home Care increased its strong emerging market footprint with its proven market development model and benefit-led
innovations. Growth was broad-based with the exception of Latin America. Fabric solutions continued to successfully
expand its core brands in fast-growing segments, such as natural products with the premium Omo Naturals range in
China. We are also uptrading consumers into the liquids segment in emerging markets, for example with Surf Excel
Matics in India, and into premium formats in developed markets, such as the launch of Persil triple chamber liquid
capsules in the United Kingdom. Comfort delivered double-digit growth, helped by the roll-out of the ultra-concentrated
Comfort Perfume Deluxe from South East Asia to the United Kingdom and the extension of the sensitive Comfort Pure
range into India. Home and hygiene remained a strong growth contributor to Home Care. This was helped by continued
double-digit growth of Domestos toilet blocks and bleaches, the launch of Sunlight dishwash in Indonesia with improved
formulation that allows 5x faster degreasing, and the launch of Cif premium sprays, with specialist care and cleaning, in
23 European markets. Our water purification business performed well, while in air purification Blueair declined sharply
in China, the brand’s biggest market.
Underlying operating margin improved by 60bps mainly reflecting strong savings delivery and an improvement in
overheads.
Foods & Refreshment
The division continued to build its presence in emerging markets and sustained a strong performance in food service
channels. At the same time, we continued to modernise the portfolio by responding to consumer needs in fast-
growing segments such as organic, natural, vegan, health and wellness. Ice cream delivered strong growth driven by
innovations behind our premium brands. These included the launch of Magnum Core & Praliné variant, which
provides our most indulgent ice cream experience yet, and the roll-out of the successful Ben & Jerry’s non-dairy
platform from the United States into Europe. The new Kinder® ice cream, launched after partnering with an Italian
confectioner, had a very promising start in Germany and France. In leaf tea, volume-led growth continued to be driven
by strong innovations in India, where we extended our market leadership. We continued to transform our portfolio in
Europe and North America, but growth was held back by a decline of our black tea business. The recent acquisitions
Pukka Herbs organic herbal tea and TAZO had a good first half in Europe and North America. In foods, Knorr grew
ahead of the Group average, primarily driven by cooking products in emerging markets, as well as innovations in on-
trend segments in developed markets. These included the launch of Knorr mini meals in Europe, snack products with
natural and nutritious ingredients, and Knorr Selects side dishes in the United States. Hellmann’s continued to
communicate strong natural claims and in the United States launched Hellmann’s Real Ketchup, made with six
ingredients and sweetened only with honey. However, sales in dressings were slightly down in an intense promotional
environment.
Underlying operating margin was up 100bps as a result of strongly improved gross margin and lower overheads.
4
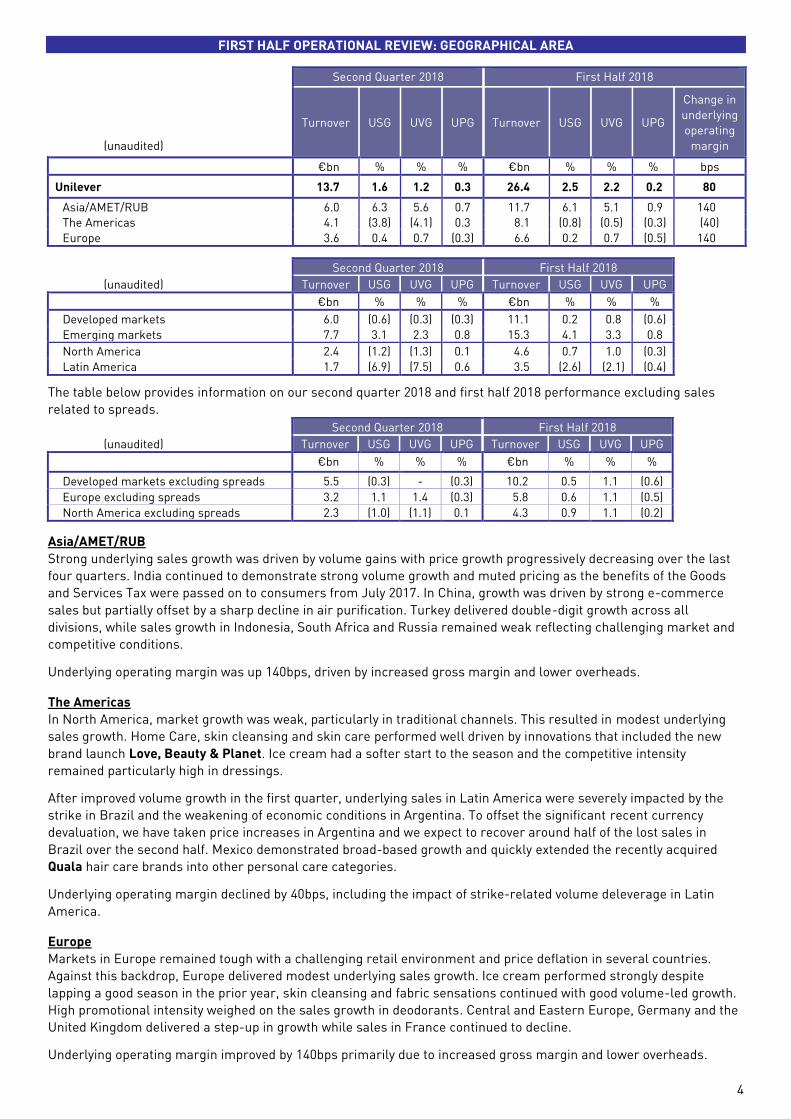
FIRST HALF OPERATIONAL REVIEW: GEOGRAPHICAL AREA
Second Quarter 2018 First Half 2018
(unaudited)
Turnover USG UVG UPG Turnover USG UVG UPG
Change in
underlying
operating
margin
€bn % % % €bn % % % bps
Unilever 13.7 1.6 1.2 0.3 26.4 2.5 2.2 0.2 80
Asia/AMET/RUB 6.0 6.3 5.6 0.7 11.7 6.1 5.1 0.9 140
The Americas 4.1 (3.8) (4.1) 0.3 8.1 (0.8) (0.5) (0.3) (40)
Europe 3.6 0.4 0.7 (0.3) 6.6 0.2 0.7 (0.5) 140
Second Quarter 2018 First Half 2018
(unaudited) Turnover USG UVG UPG Turnover USG UVG UPG
€bn % % % €bn % % %
Developed markets 6.0 (0.6) (0.3) (0.3) 11.1 0.2 0.8 (0.6)
Emerging markets 7.7 3.1 2.3 0.8 15.3 4.1 3.3 0.8
North America 2.4 (1.2) (1.3) 0.1 4.6 0.7 1.0 (0.3)
Latin America 1.7 (6.9) (7.5) 0.6 3.5 (2.6) (2.1) (0.4)
The table below provides information on our second quarter 2018 and first half 2018 performance excluding sales
related to spreads.
Second Quarter 2018 First Half 2018
(unaudited) Turnover USG UVG UPG Turnover USG UVG UPG
€bn % % % €bn % % %
Developed markets excluding spreads 5.5 (0.3) - (0.3) 10.2 0.5 1.1 (0.6)
Europe excluding spreads 3.2 1.1 1.4 (0.3) 5.8 0.6 1.1 (0.5)
North America excluding spreads 2.3 (1.0) (1.1) 0.1 4.3 0.9 1.1 (0.2)
Asia/AMET/RUB
Strong underlying sales growth was driven by volume gains with price growth progressively decreasing over the last
four quarters. India continued to demonstrate strong volume growth and muted pricing as the benefits of the Goods
and Services Tax were passed on to consumers from July 2017. In China, growth was driven by strong e-commerce
sales but partially offset by a sharp decline in air purification. Turkey delivered double-digit growth across all
divisions, while sales growth in Indonesia, South Africa and Russia remained weak reflecting challenging market and
competitive conditions.
Underlying operating margin was up 140bps, driven by increased gross margin and lower overheads.
The Americas
In North America, market growth was weak, particularly in traditional channels. This resulted in modest underlying
sales growth. Home Care, skin cleansing and skin care performed well driven by innovations that included the new
brand launch Love, Beauty & Planet. Ice cream had a softer start to the season and the competitive intensity
remained particularly high in dressings.
After improved volume growth in the first quarter, underlying sales in Latin America were severely impacted by the
strike in Brazil and the weakening of economic conditions in Argentina. To offset the significant recent currency
devaluation, we have taken price increases in Argentina and we expect to recover around half of the lost sales in
Brazil over the second half. Mexico demonstrated broad-based growth and quickly extended the recently acquired
Quala hair care brands into other personal care categories.
Underlying operating margin declined by 40bps, including the impact of strike-related volume deleverage in Latin
America.
Europe
Markets in Europe remained tough with a challenging retail environment and price deflation in several countries.
Against this backdrop, Europe delivered modest underlying sales growth. Ice cream performed strongly despite
lapping a good season in the prior year, skin cleansing and fabric sensations continued with good volume-led growth.
High promotional intensity weighed on the sales growth in deodorants. Central and Eastern Europe, Germany and the
United Kingdom delivered a step-up in growth while sales in France continued to decline.
Underlying operating margin improved by 140bps primarily due to increased gross margin and lower overheads.
5
ADDITIONAL COMMENTARY ON THE FINANCIAL STATEMENTS – FIRST HALF 2018
Finance costs and tax
Net finance costs decreased by €67 million to €223 million in the first half of 2018. Despite an increase in net debt, the cost
of financing net borrowings at €208 million was €33 million lower than in the prior year. Included within this was a €48
million reduction in other interest costs, largely reflecting one-off provision releases related to indirect taxes. The impact of
the higher levels of borrowing was offset by benefits from lower rates, resulting in the average interest rate on net debt
falling to 1.9% from 3.1% in 2017. Pensions financing was a charge of €15 million compared to €49 million in the prior year.
The effective tax rate was 25.9% versus 28.9% in the same period last year. The change was mainly driven by the tax impact
of acquisition and disposal related costs in 2018 and the AdeS disposal in 2017. The effective tax rate on underlying profit
was 26.5% compared to 27.9% in the prior year.
Joint ventures, associates and other income from non-current investments
Net profit from joint ventures and associates contributed €83 million compared with €75 million in the first half of
2017 mainly due to growth in profits from our joint venture in Portugal.
Earnings per share
Underlying earnings per share in the first half increased by 7.8% to €1.22 after an adverse currency impact of 10.8%.
Constant underlying earnings per share increased by 18.6% primarily driven by underlying sales growth, improved
underlying operating margin, and a lower share count as a result of the share buyback programme. These underlying
measures exclude the post-tax impact of business disposals, acquisition and disposal-related costs, restructuring
costs, impairments, one-off items within operating profit and any other significant unusual items within net profit but
not operating profit.
Diluted earnings per share for the first half was up 1.6% at €1.11. In the prior year, we recorded a gain on disposal of
€0.3 billion for the AdeS soy beverage business in Latin America. In 2018, a credit to acquisition and disposal related
costs of €277 million was taken as a result of the early settlement of the contingent consideration for Blueair. This
credit more than offset an impairment charge of €208 million related to a Blueair intangible asset following the sharp
decline in China.
Free cash flow
Free cash flow in the first half of 2018, which included the usual seasonal increase in inventory and receivables, improved
by €0.4 billion to €1.8 billion. The step-up was primarily driven by lower cash contributions to our pension funds.
Net debt
Closing net debt increased to €24.8 billion compared with €20.3 billion as at 31 December 2017, mainly reflecting the
share buybacks of €2.5 billion we have undertaken until 30 June 2018, €1.1 billion from acquisitions and disposals as
well as an adverse currency impact of €0.4 billion. Total financial liabilities amounted to €29.6 billion compared to
€24.4 billion at the year-end. Cash and other current financial assets increased by €0.8 billion to €4.9 billion
compared to 31 December 2017.
Pensions
The pension liability net of assets reduced to €0.3 billion at the end of June 2018 versus €0.6 billion as at 31
December 2017. The decrease primarily reflects the impact of lower liabilities due to higher discount rates.
Finance and liquidity
In first half year 2018, we announced the issuance of the following bonds:
• 5 February 2018: Triple-tranche €2.0 billion bond, comprising of fixed rate notes of €500 million at 0.5% due
August 2023, €700 million at 1.125% due February 2027, and €800 million at 1.625% due February 2033
• 19 March 2018: Quadruple-tranche $2.1 billion bond, comprising of fixed rate notes of $400 million at 2.75% due
March 2021, $550 million at 3.125% due March 2023, $350 million at 3.375% due March 2025, $800 million at
3.5% due March 2028
In June 2018, €750 million floating rate notes matured and were repaid.
Share buyback programme
On 19 April 2018, Unilever announced the intention to start a share buyback programme of up to €6 billion. As at 30
June 2018, the Group has repurchased 53,040,783 ordinary shares as part of the first tranche of the programme. Total
consideration for the repurchase of shares was €2.5 billion which is recorded within other reserves. The first tranche
of €3 billion will complete on 19 July 2018.
We intend to start the remaining share buyback, for an aggregate market value equivalent to €3 billion, on 20 July
2018.
Spreads business
On 2 July 2018, Unilever announced it has completed the sale of its Spreads business to KKR and has completed the sale of
its Spreads business in Southern Africa to Remgro and the related acquisition of Remgro’s interest in Unilever South Africa.
6
SIMPLIFICATION OF UNILEVER’S DUAL-HEADED LEGAL STRUCTURE
Further to the announcement of the proposal by the Board on 15 March 2018, Unilever plans to hold general meetings for
Unilever NV and for Unilever PLC shareholders on 25 and 26 October 2018 respectively. Documentation will be made
available to shareholders at least six weeks ahead of the shareholder meetings.
COMPETITION INVESTIGATIONS
As previously disclosed, along with other consumer products companies and retail customers, Unilever is involved in
a number of ongoing investigations by national competition authorities, including those within Italy and South Africa.
These proceedings and investigations are at various stages and concern a variety of product markets. Where
appropriate, provisions are made and contingent liabilities disclosed in relation to such matters.
Ongoing compliance with competition laws is of key importance to Unilever. It is Unilever’s policy to co-operate fully
with competition authorities whenever questions or issues arise. In addition, the Group continues to reinforce and
enhance its internal competition law training and compliance programme on an ongoing basis.
NON-GAAP MEASURES
Certain discussions and analyses set out in this announcement include measures which are not defined by generally
accepted accounting principles (GAAP) such as IFRS. We believe this information, along with comparable GAAP
measures, is useful to investors because it provides a basis for measuring our operating performance, ability to retire
debt and invest in new business opportunities. Our management uses these financial measures, along with the most
directly comparable GAAP financial measures, in evaluating our operating performance and value creation. Non-
GAAP financial measures should not be considered in isolation from, or as a substitute for, financial information
presented in compliance with GAAP. Wherever appropriate and practical, we provide reconciliations to relevant GAAP
measures.
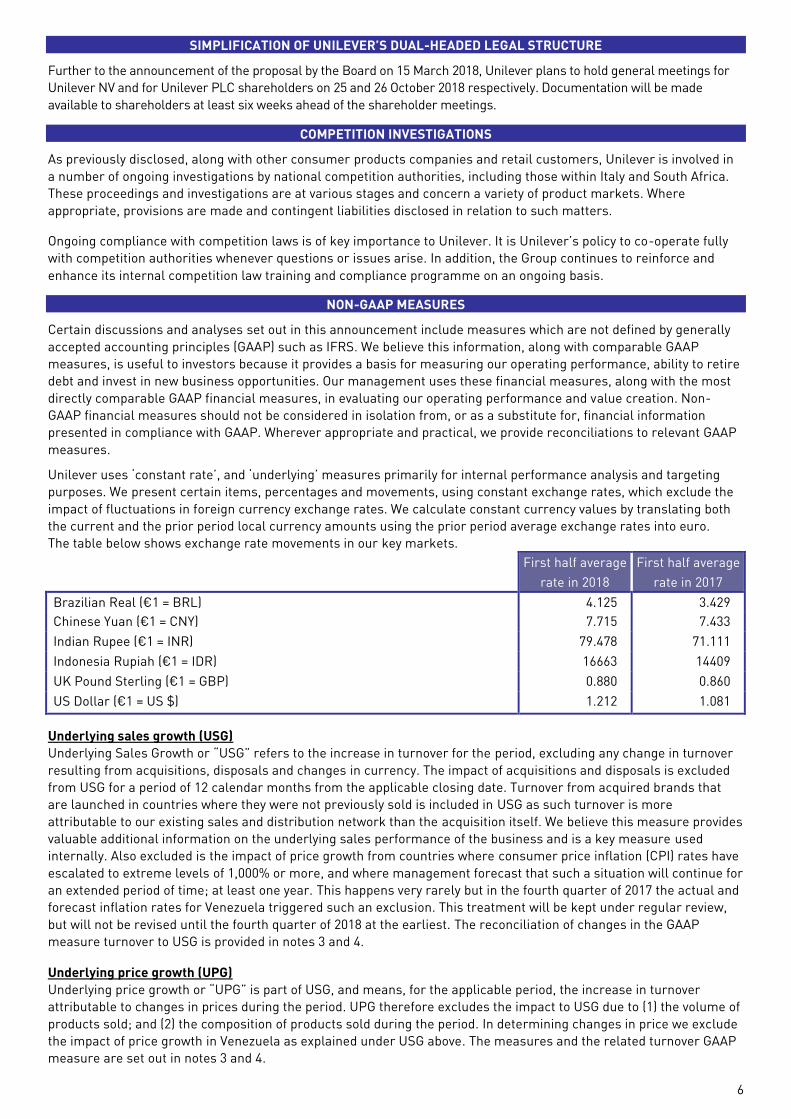
Unilever uses ‘constant rate’, and ‘underlying’ measures primarily for internal performance analysis and targeting
purposes. We present certain items, percentages and movements, using constant exchange rates, which exclude the
impact of fluctuations in foreign currency exchange rates. We calculate constant currency values by translating both
the current and the prior period local currency amounts using the prior period average exchange rates into euro.
The table below shows exchange rate movements in our key markets.
First half average
rate in 2018
First half average
rate in 2017
Brazilian Real (€1 = BRL) 4.125 3.429
Chinese Yuan (€1 = CNY) 7.715 7.433
Indian Rupee (€1 = INR) 79.478 71.111
Indonesia Rupiah (€1 = IDR) 16663 14409
UK Pound Sterling (€1 = GBP) 0.880 0.860
US Dollar (€1 = US $) 1.212 1.081
Underlying sales growth (USG)
Underlying Sales Growth or “USG” refers to the increase in turnover for the period, excluding any change in turnover
resulting from acquisitions, disposals and changes in currency. The impact of acquisitions and disposals is excluded
from USG for a period of 12 calendar months from the applicable closing date. Turnover from acquired brands that
are launched in countries where they were not previously sold is included in USG as such turnover is more
attributable to our existing sales and distribution network than the acquisition itself. We believe this measure provides
valuable additional information on the underlying sales performance of the business and is a key measure used
internally. Also excluded is the impact of price growth from countries where consumer price inflation (CPI) rates have
escalated to extreme levels of 1,000% or more, and where management forecast that such a situation will continue for
an extended period of time; at least one year. This happens very rarely but in the fourth quarter of 2017 the actual and
forecast inflation rates for Venezuela triggered such an exclusion. This treatment will be kept under regular review,
but will not be revised until the fourth quarter of 2018 at the earliest. The reconciliation of changes in the GAAP
measure turnover to USG is provided in notes 3 and 4.
Underlying price growth (UPG)
Underlying price growth or “UPG” is part of USG, and means, for the applicable period, the increase in turnover
attributable to changes in prices during the period. UPG therefore excludes the impact to USG due to (1) the volume of
products sold; and (2) the composition of products sold during the period. In determining changes in price we exclude
the impact of price growth in Venezuela as explained under USG above. The measures and the related turnover GAAP
measure are set out in notes 3 and 4.
7
NON-GAAP MEASURES (continued)
Underlying volume growth (UVG)
Underlying Volume Growth or “UVG” is part of USG and means, for the applicable period, the increase in turnover in
such period calculated as the sum of (1) the increase in turnover attributable to the volume of products sold; and (2)
the increase in turnover attributable to the composition of products sold during such period. UVG therefore excludes
any impact to USG due to changes in prices. The measures and the related turnover GAAP measure are set out in
notes 3 and 4.
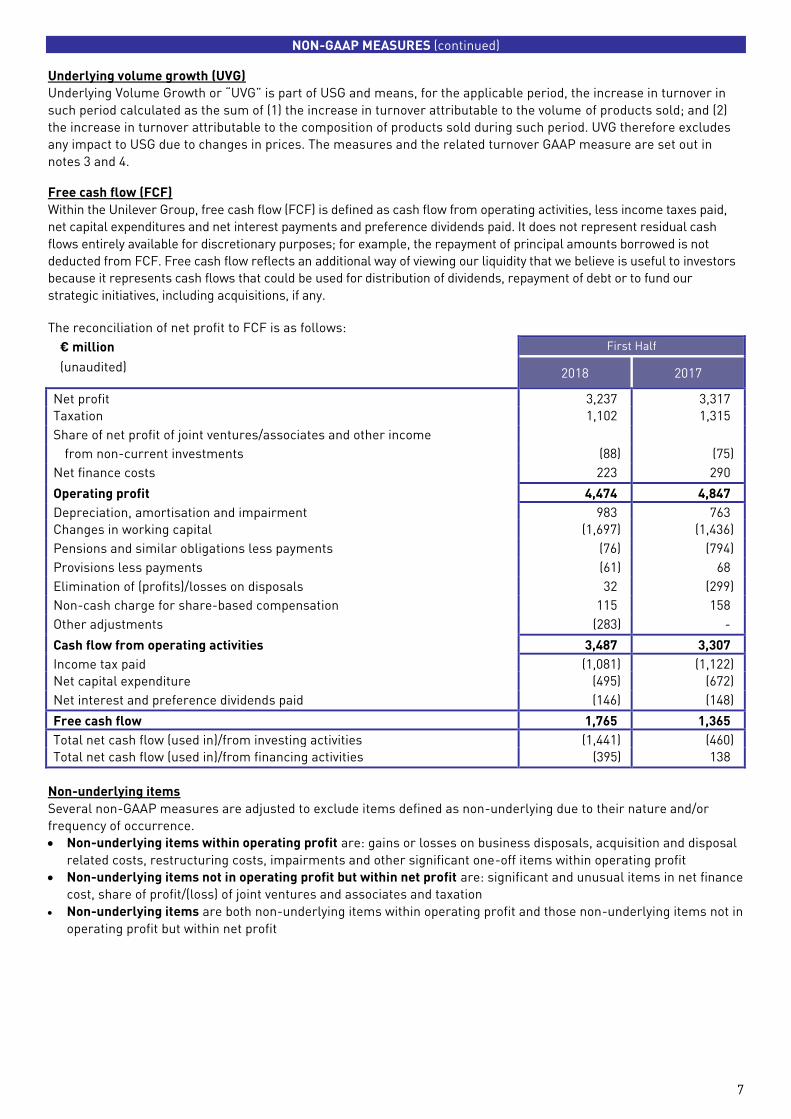
Free cash flow (FCF)
Within the Unilever Group, free cash flow (FCF) is defined as cash flow from operating activities, less income taxes paid,
net capital expenditures and net interest payments and preference dividends paid. It does not represent residual cash
flows entirely available for discretionary purposes; for example, the repayment of principal amounts borrowed is not
deducted from FCF. Free cash flow reflects an additional way of viewing our liquidity that we believe is useful to investors
because it represents cash flows that could be used for distribution of dividends, repayment of debt or to fund our
strategic initiatives, including acquisitions, if any.
The reconciliation of net profit to FCF is as follows:
€ million First Half
(unaudited) 2018 2017
Net profit 3,237 3,317
Taxation 1,102 1,315
Share of net profit of joint ventures/associates and other income
from non-current investments (88) (75)
Net finance costs 223 290
Operating profit 4,474 4,847
Depreciation, amortisation and impairment 983 763
Changes in working capital (1,697) (1,436)
Pensions and similar obligations less payments (76) (794)
Provisions less payments (61) 68
Elimination of (profits)/losses on disposals 32 (299)
Non-cash charge for share-based compensation 115 158
Other adjustments (283) -
Cash flow from operating activities 3,487 3,307
Income tax paid (1,081) (1,122)
Net capital expenditure (495) (672)
Net interest and preference dividends paid (146) (148)
Free cash flow 1,765 1,365
Total net cash flow (used in)/from investing activities (1,441) (460)
Total net cash flow (used in)/from financing activities (395) 138
Non-underlying items
Several non-GAAP measures are adjusted to exclude items defined as non-underlying due to their nature and/or
frequency of occurrence.
• Non-underlying items within operating profit are: gains or losses on business disposals, acquisition and disposal
related costs, restructuring costs, impairments and other significant one-off items within operating profit
• Non-underlying items not in operating profit but within net profit are: significant and unusual items in net finance
cost, share of profit/(loss) of joint ventures and associates and taxation
• Non-underlying items are both non-underlying items within operating profit and those non-underlying items not in
operating profit but within net profit
8
NON-GAAP MEASURES (continued)
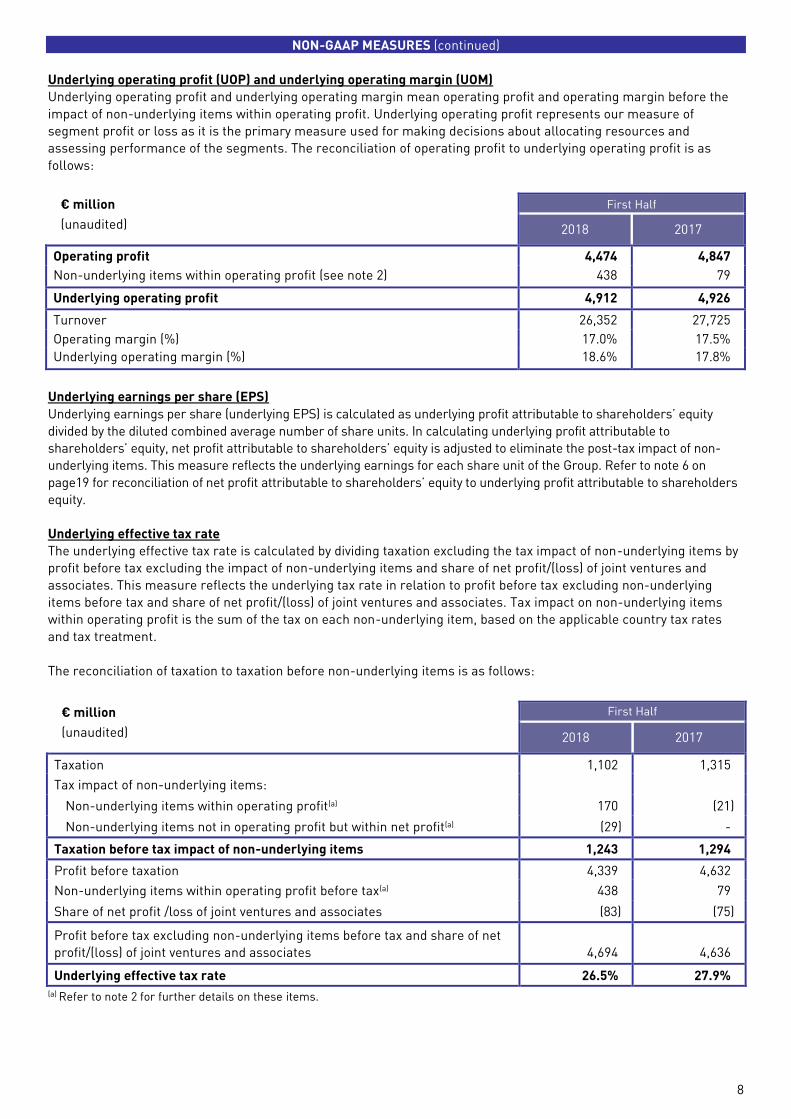
Underlying operating profit (UOP) and underlying operating margin (UOM)
Underlying operating profit and underlying operating margin mean operating profit and operating margin before the
impact of non-underlying items within operating profit. Underlying operating profit represents our measure of
segment profit or loss as it is the primary measure used for making decisions about allocating resources and
assessing performance of the segments. The reconciliation of operating profit to underlying operating profit is as
follows:
€ million First Half
(unaudited) 2018 2017
Operating profit 4,474 4,847
Non-underlying items within operating profit (see note 2) 438 79
Underlying operating profit 4,912 4,926
Turnover 26,352 27,725
Operating margin (%) 17.0% 17.5%
Underlying operating margin (%) 18.6% 17.8%
Underlying earnings per share (EPS)
Underlying earnings per share (underlying EPS) is calculated as underlying profit attributable to shareholders’ equity
divided by the diluted combined average number of share units. In calculating underlying profit attributable to
shareholders’ equity, net profit attributable to shareholders’ equity is adjusted to eliminate the post-tax impact of non-
underlying items. This measure reflects the underlying earnings for each share unit of the Group. Refer to note 6 on
page19 for reconciliation of net profit attributable to shareholders’ equity to underlying profit attributable to shareholders
equity.
Underlying effective tax rate
The underlying effective tax rate is calculated by dividing taxation excluding the tax impact of non-underlying items by
profit before tax excluding the impact of non-underlying items and share of net profit/(loss) of joint ventures and
associates. This measure reflects the underlying tax rate in relation to profit before tax excluding non-underlying
items before tax and share of net profit/(loss) of joint ventures and associates. Tax impact on non-underlying items
within operating profit is the sum of the tax on each non-underlying item, based on the applicable country tax rates
and tax treatment.
The reconciliation of taxation to taxation before non-underlying items is as follows:
€ million First Half
(unaudited) 2018 2017
Taxation 1,102 1,315
Tax impact of non-underlying items:
Non-underlying items within operating profit(a) 170 (21)
Non-underlying items not in operating profit but within net profit(a) (29) -
Taxation before tax impact of non-underlying items 1,243 1,294
Profit before taxation 4,339 4,632
Non-underlying items within operating profit before tax(a) 438 79
Share of net profit /loss of joint ventures and associates (83) (75)
Profit before tax excluding non-underlying items before tax and share of net
profit/(loss) of joint ventures and associates
4,694
4,636
Underlying effective tax rate 26.5% 27.9%
(a) Refer to note 2 for further details on these items.
9
NON-GAAP MEASURES (continued)
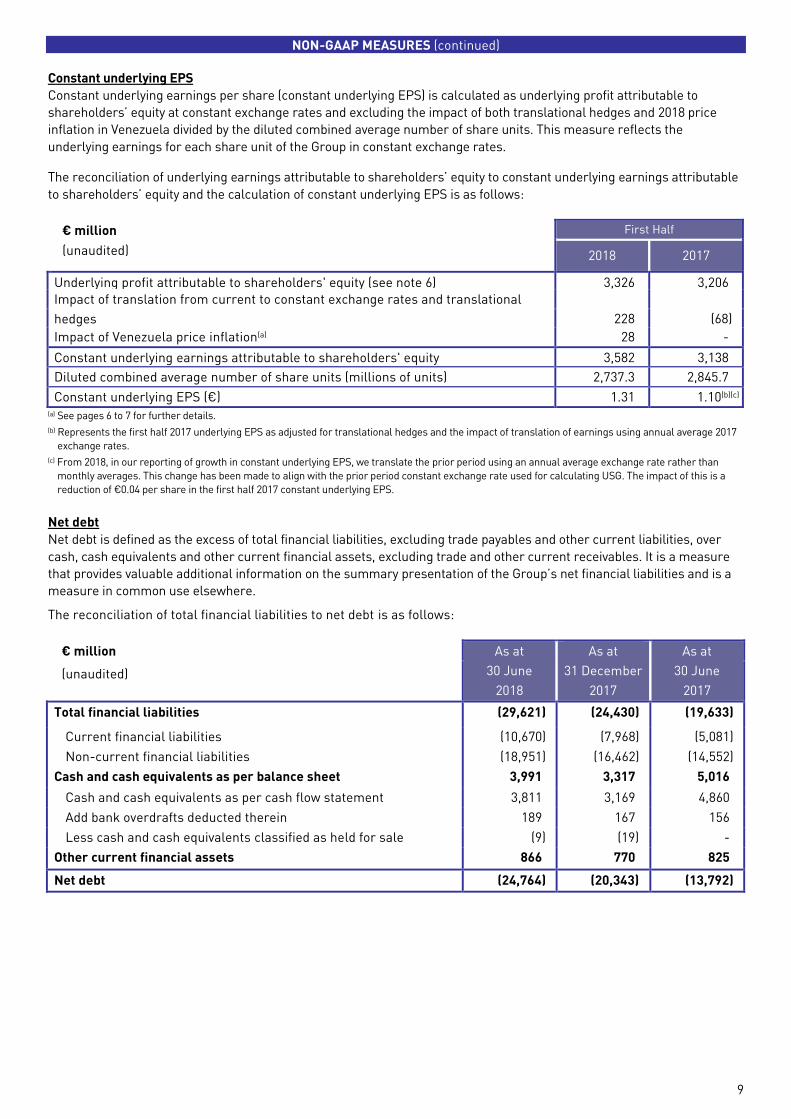
Constant underlying EPS
Constant underlying earnings per share (constant underlying EPS) is calculated as underlying profit attributable to
shareholders’ equity at constant exchange rates and excluding the impact of both translational hedges and 2018 price
inflation in Venezuela divided by the diluted combined average number of share units. This measure reflects the
underlying earnings for each share unit of the Group in constant exchange rates.
The reconciliation of underlying earnings attributable to shareholders’ equity to constant underlying earnings attributable
to shareholders’ equity and the calculation of constant underlying EPS is as follows:
€ million First Half
(unaudited) 2018 2017
Underlying profit attributable to shareholders' equity (see note 6) 3,326 3,206
Impact of translation from current to constant exchange rates and translational
hedges
and translational hedges
228 (68)
Impact of Venezuela price inflation(a) 28 -
Constant underlying earnings attributable to shareholders' equity 3,582 3,138
Diluted combined average number of share units (millions of units) 2,737.3 2,845.7
Constant underlying EPS (€) 1.31 1.10(b)(c) (a) See pages 6 to 7 for further details.
(b) Represents the first half 2017 underlying EPS as adjusted for translational hedges and the impact of translation of earnings using annual average 2017
exchange rates.
(c) From 2018, in our reporting of growth in constant underlying EPS, we translate the prior period using an annual average exchange rate rather than
monthly averages. This change has been made to align with the prior period constant exchange rate used for calculating USG. The impact of this is a
reduction of €0.04 per share in the first half 2017 constant underlying EPS.
Net debt
Net debt is defined as the excess of total financial liabilities, excluding trade payables and other current liabilities, over
cash, cash equivalents and other current financial assets, excluding trade and other current receivables. It is a measure
that provides valuable additional information on the summary presentation of the Group’s net financial liabilities and is a
measure in common use elsewhere.
The reconciliation of total financial liabilities to net debt is as follows:
€ million As at
30 June
2018
As at
31 December
2017
As at
30 June
2017
(unaudited)
Total financial liabilities (29,621) (24,430) (19,633)
Current financial liabilities (10,670) (7,968) (5,081)
Non-current financial liabilities (18,951) (16,462) (14,552)
Cash and cash equivalents as per balance sheet 3,991 3,317 5,016
Cash and cash equivalents as per cash flow statement 3,811 3,169 4,860
Add bank overdrafts deducted therein 189 167 156
Less cash and cash equivalents classified as held for sale (9) (19) -
Other current financial assets 866 770 825
Net debt (24,764) (20,343) (13,792)
10
PRINCIPAL RISK FACTORS
On pages 27 to 31 of our 2017 Report and Accounts we set out our assessment of the principal risk issues that would
face the business through 2018 under the headings: brand preference; portfolio management; sustainability; climate
change; customer relationships; talent; supply chain; safe and high quality products; systems and information;
business transformation; economic and political instability; treasury and pensions; ethical; and legal and regulatory.
In our view, the nature and potential impact of such risks remain essentially unchanged as regards our performance
over the second half of 2018.
OTHER INFORMATION
This document represents Unilever’s half-yearly report for the purposes of the Disclosure and Transparency Rules
(DTR) issued by the UK Financial Conduct Authority (DTR 4.2) and the Dutch Act on Financial Supervision, section
5:25d (8)/(9) (Half-yearly financial reports). In this context: (i) the condensed set of financial statements can be found
on pages 11 to 22; (ii) pages 2 to 10 comprise the interim management report; and (iii) the Directors’ responsibility
statement can be found on page 23. No material related parties transactions have taken place in the first six months
of the year.
CAUTIONARY STATEMENT
This announcement may contain forward-looking statements, including ‘forward-looking statements’ within the
meaning of the United States Private Securities Litigation Reform Act of 1995. Words such as ‘will’, ‘aim’, ‘expects’,
‘anticipates’, ‘intends’, ‘looks’, ‘believes’, ‘vision’, or the negative of these terms and other similar expressions of
future performance or results, and their negatives, are intended to identify such forward-looking statements. These
forward-looking statements are based upon current expectations and assumptions regarding anticipated
developments and other factors affecting the Unilever Group (the ‘Group’). They are not historical facts, nor are they
guarantees of future performance.
Because these forward-looking statements involve risks and uncertainties, there are important factors that could
cause actual results to differ materially from those expressed or implied by these forward-looking statements.
Among other risks and uncertainties, the material or principal factors which could cause actual results to differ
materially are: Unilever’s global brands not meeting consumer preferences; Unilever’s ability to innovate and remain
competitive; Unilever’s investment choices in its portfolio management; inability to find sustainable solutions to
support long-term growth; the effect of climate change on Unilever’s business; customer relationships; the
recruitment and retention of talented employees; disruptions in our supply chain; the cost of raw materials and
commodities; the production of safe and high quality products; secure and reliable IT infrastructure; successful
execution of acquisitions, divestitures and business transformation projects; economic and political risks and natural
disasters; financial risks; failure to meet high and ethical standards; and managing regulatory, tax and legal matters.
These forward-looking statements speak only as of the date of this announcement. Except as required by any
applicable law or regulation, the Group expressly disclaims any obligation or undertaking to release publicly any
updates or revisions to any forward-looking statements contained herein to reflect any change in the Group’s
expectations with regard thereto or any change in events, conditions or circumstances on which any such statement is
based. Further details of potential risks and uncertainties affecting the Group are described in the Group’s filings with
the London Stock Exchange, Euronext Amsterdam and the US Securities and Exchange Commission, including in the
Annual Report on Form 20-F 2017 and the Unilever Annual Report and Accounts 2017.
ENQUIRIES
Media: Media Relations Team Investors: Investor Relations Team
UK
or
NL
or
+44 78 2527 3767
+44 78 2504 9151
+31 10 217 4844
+32 494 60 4906
[email protected] [email protected]
+44 20 7822 6830
There will be a web cast of the results presentation available at:
www.unilever.com/investor-relations/results-and-presentations/latest-results/

11
INCOME STATEMENT
(unaudited)
€ million First Half
2018 2017
Increase/
(Decrease)
Current
rates
Constant
rates
Turnover 26,352 27,725 (5.0)% 5.7%
Operating profit 4,474 4,847 (7.7)% 2.8%
After (charging)/crediting non-underlying items (438) (79)
Net finance costs (223) (290)
Finance income 64 90
Finance costs (272) (331)
Pensions and similar obligations (15) (49)
Share of net profit/(loss) of joint ventures and
associates 83 75
Other income/(loss) from non-current investments and
associates 5 -
Profit before taxation 4,339 4,632 (6.3)% 4.0%
Taxation (1,102) (1,315)
After (charging)/crediting tax impact of non-underlying
items 141 (21)
Net profit 3,237 3,317 (2.4)% 8.1%
Attributable to:
Non-controlling interests 198 207
Shareholders’ equity 3,039 3,110 (2.3)% 8.1%
Combined earnings per share
Basic earnings per share (euros) 1.11 1.10 1.6% 12.4%
Diluted earnings per share (euros) 1.11 1.09 1.6% 12.4%
STATEMENT OF COMPREHENSIVE INCOME
(unaudited)
€ million First Half
2018 2017
Net profit 3,237 3,317
Other comprehensive income
Items that will not be reclassified to profit or loss, net of tax:
Gains/(losses) on equity instruments measured at fair value through other
comprehensive income(a) (4) -
Remeasurements of defined benefit pension plans 142 641
Items that may be reclassified subsequently to profit or loss, net of tax:
Gains/(losses) on cash flow hedges 36 63
Currency retranslation gains/(losses) (767) (694)
Fair value gains/(losses) on financial instruments(a) - (12)
Total comprehensive income 2,644 3,315
Attributable to:
Non-controlling interests 185 170
Shareholders’ equity 2,459 3,145
(a) Classification has changed following adoption of IFRS 9. See note 1 for further details.
12
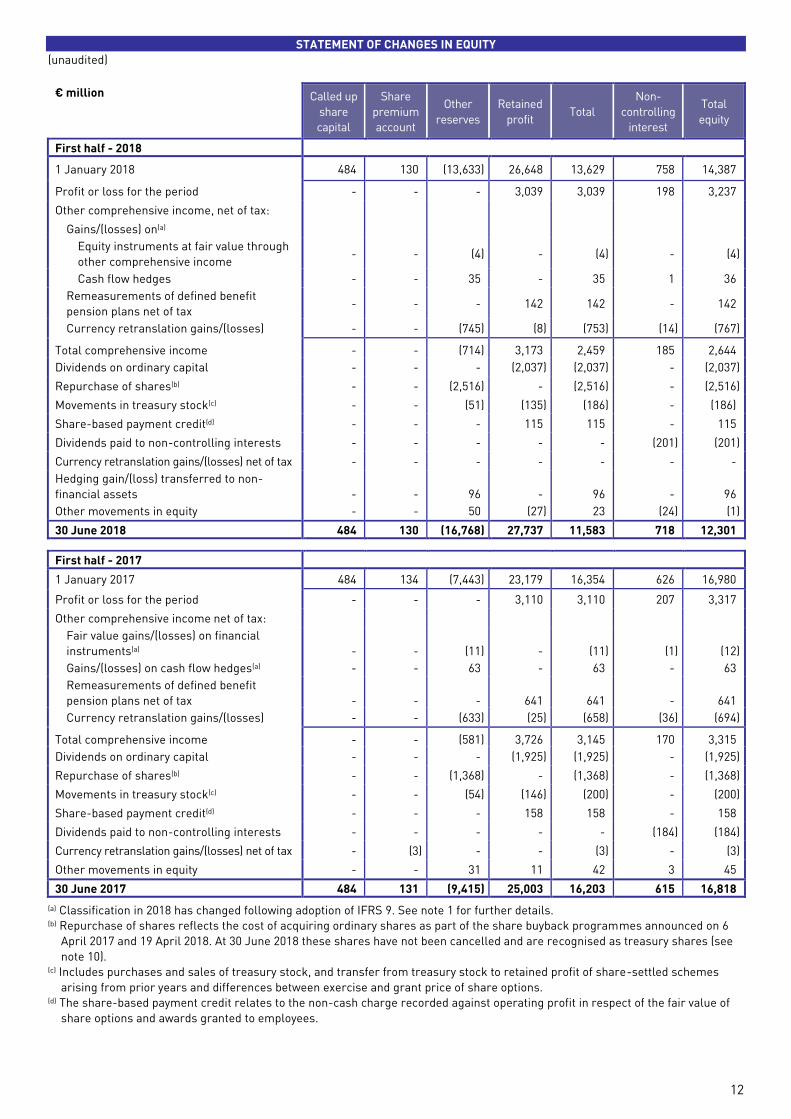
STATEMENT OF CHANGES IN EQUITY
(unaudited)
€ million Called up
share
capital
Share
premium
account
Other
reserves
Retained
profit Total
Non-
controlling
interest
Total
equity
First half - 2018
1 January 2018 484 130 (13,633) 26,648 13,629 758 14,387
Profit or loss for the period - - - 3,039 3,039 198 3,237
Other comprehensive income, net of tax:
Gains/(losses) on(a)
Equity instruments at fair value through
other comprehensive income - - (4) - (4) - (4)
Cash flow hedges - - 35 - 35 1 36
Remeasurements of defined benefit
pension plans net of tax - - - 142 142 - 142
Currency retranslation gains/(losses) - - (745) (8) (753) (14) (767)
Total comprehensive income - - (714) 3,173 2,459 185 2,644
Dividends on ordinary capital - - - (2,037) (2,037) - (2,037)
Repurchase of shares(b) - - (2,516) - (2,516) - (2,516)
Movements in treasury stock(c) - - (51) (135) (186) - (186)
Share-based payment credit(d) - - - 115 115 - 115
Dividends paid to non-controlling interests - - - - - (201) (201)
Currency retranslation gains/(losses) net of tax - - - - - - -
Hedging gain/(loss) transferred to non-
financial assets - - 96 - 96 - 96
Other movements in equity - - 50 (27) 23 (24) (1)
30 June 2018 484 130 (16,768) 27,737 11,583 718 12,301
First half - 2017
1 January 2017 484 134 (7,443) 23,179 16,354 626 16,980
Profit or loss for the period - - - 3,110 3,110 207 3,317
Other comprehensive income net of tax:
Fair value gains/(losses) on financial
instruments(a)
-
-
(11)
-
(11)
(1)
(12)
Gains/(losses) on cash flow hedges(a) - - 63 - 63 - 63
Remeasurements of defined benefit
pension plans net of tax
-
-
-
641
641
-
641
Currency retranslation gains/(losses) - - (633) (25) (658) (36) (694)
Total comprehensive income - - (581) 3,726 3,145 170 3,315
Dividends on ordinary capital - - - (1,925) (1,925) - (1,925)
Repurchase of shares(b) - - (1,368) - (1,368) - (1,368)
Movements in treasury stock(c) - - (54) (146) (200) - (200)
Share-based payment credit(d) - - - 158 158 - 158
Dividends paid to non-controlling interests - - - - - (184) (184)
Currency retranslation gains/(losses) net of tax - (3) - - (3) - (3)
Other movements in equity - - 31 11 42 3 45
30 June 2017 484 131 (9,415) 25,003 16,203 615 16,818
(a) Classification in 2018 has changed following adoption of IFRS 9. See note 1 for further details. (b) Repurchase of shares reflects the cost of acquiring ordinary shares as part of the share buyback programmes announced on 6
April 2017 and 19 April 2018. At 30 June 2018 these shares have not been cancelled and are recognised as treasury shares (see
note 10). (c) Includes purchases and sales of treasury stock, and transfer from treasury stock to retained profit of share-settled schemes
arising from prior years and differences between exercise and grant price of share options. (d) The share-based payment credit relates to the non-cash charge recorded against operating profit in respect of the fair value of
share options and awards granted to employees.
13
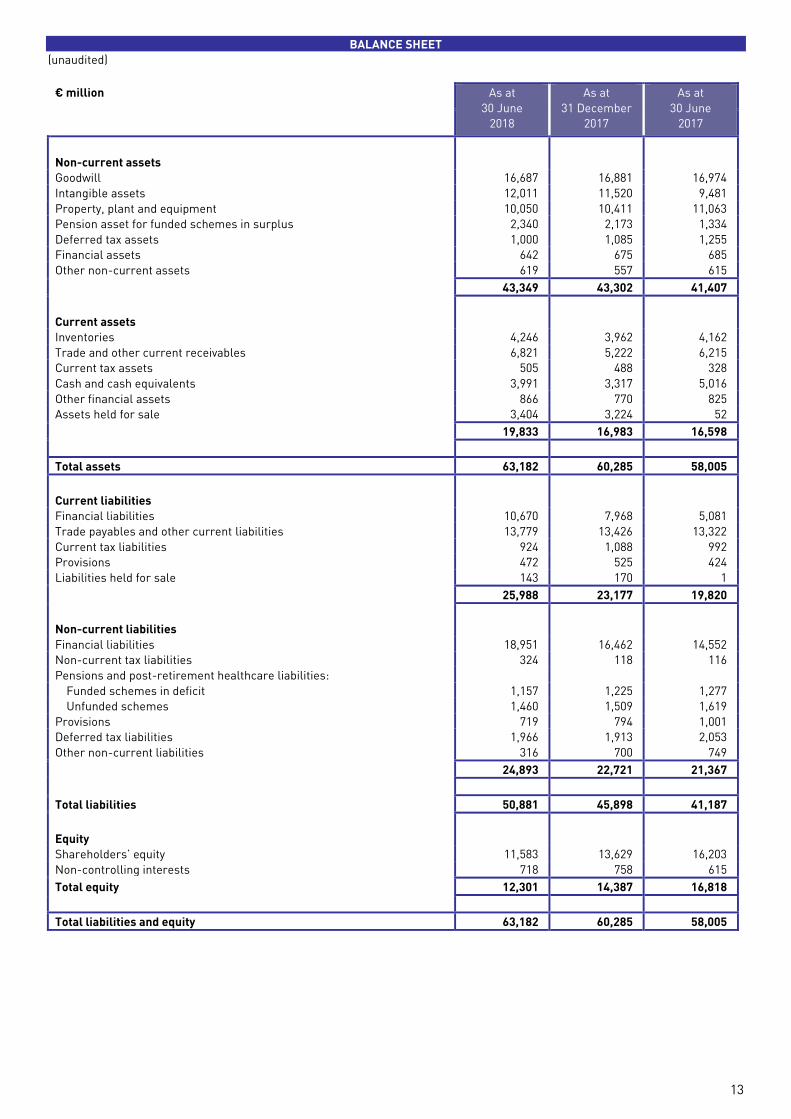
BALANCE SHEET
(unaudited)
€ million As at
30 June
2018
As at
31 December
2017
As at
30 June
2017
Non-current assets
Goodwill 16,687 16,881 16,974
Intangible assets 12,011 11,520 9,481
Property, plant and equipment 10,050 10,411 11,063
Pension asset for funded schemes in surplus 2,340 2,173 1,334
Deferred tax assets 1,000 1,085 1,255
Financial assets 642 675 685
Other non-current assets 619 557 615
43,349 43,302 41,407
Current assets
Inventories 4,246 3,962 4,162
Trade and other current receivables 6,821 5,222 6,215
Current tax assets 505 488 328
Cash and cash equivalents 3,991 3,317 5,016
Other financial assets 866 770 825
Assets held for sale 3,404 3,224 52
19,833 16,983 16,598
Total assets 63,182 60,285 58,005
Current liabilities
Financial liabilities 10,670 7,968 5,081
Trade payables and other current liabilities 13,779 13,426 13,322
Current tax liabilities 924 1,088 992
Provisions 472 525 424
Liabilities held for sale 143 170 1
25,988 23,177 19,820
Non-current liabilities
Financial liabilities 18,951 16,462 14,552
Non-current tax liabilities 324 118 116
Pensions and post-retirement healthcare liabilities:
Funded schemes in deficit 1,157 1,225 1,277
Unfunded schemes 1,460 1,509 1,619
Provisions 719 794 1,001
Deferred tax liabilities 1,966 1,913 2,053
Other non-current liabilities 316 700 749
24,893 22,721 21,367
Total liabilities 50,881 45,898 41,187
Equity
Shareholders’ equity 11,583 13,629 16,203
Non-controlling interests 718 758 615
Total equity 12,301 14,387 16,818
Total liabilities and equity 63,182 60,285 58,005

14
CASH FLOW STATEMENT
(unaudited)
€ million First Half
2018 2017
Net profit 3,237
3,317
Taxation 1,102 1,315
Share of net profit of joint ventures/associates and other income
from non-current investments and associates (88) (75)
Net finance costs 223 290
Operating profit 4,474 4,847
Depreciation, amortisation and impairment 983 763
Changes in working capital (1,697) (1,436)
Pensions and similar obligations less payments (76) (794)
Provisions less payments (61) 68
Elimination of (profits)/losses on disposals 32 (299)
Non-cash charge for share-based compensation 115 158
Other adjustments(a) (283) -
Cash flow from operating activities 3,487 3,307
Income tax paid (1,081) (1,122)
Net cash flow from operating activities 2,406 2,185
Interest received 45 104
Net capital expenditure (495) (672)
Other acquisitions and disposals (1,035) 154
Other investing activities 44 (46)
Net cash flow (used in)/from investing activities (1,441) (460)
Dividends paid on ordinary share capital (2,033) (1,911)
Interest and preference dividends paid (191) (252)
Change in financial liabilities 4,486 3,613
Repurchase of shares (2,248) (1,071)
Other movements on treasury stock (264) (199)
Other financing activities (145) (42)
Net cash flow (used in)/from financing activities (395) 138
Net increase/(decrease) in cash and cash equivalents 570 1,863
Cash and cash equivalents at the beginning of the period 3,169 3,198
Effect of foreign exchange rate changes 72 (201)
Cash and cash equivalents at the end of the period 3,811 4,860
(a) Includes a non-cash credit of €277 million from early settlement of contingent consideration relating to Blueair.
15
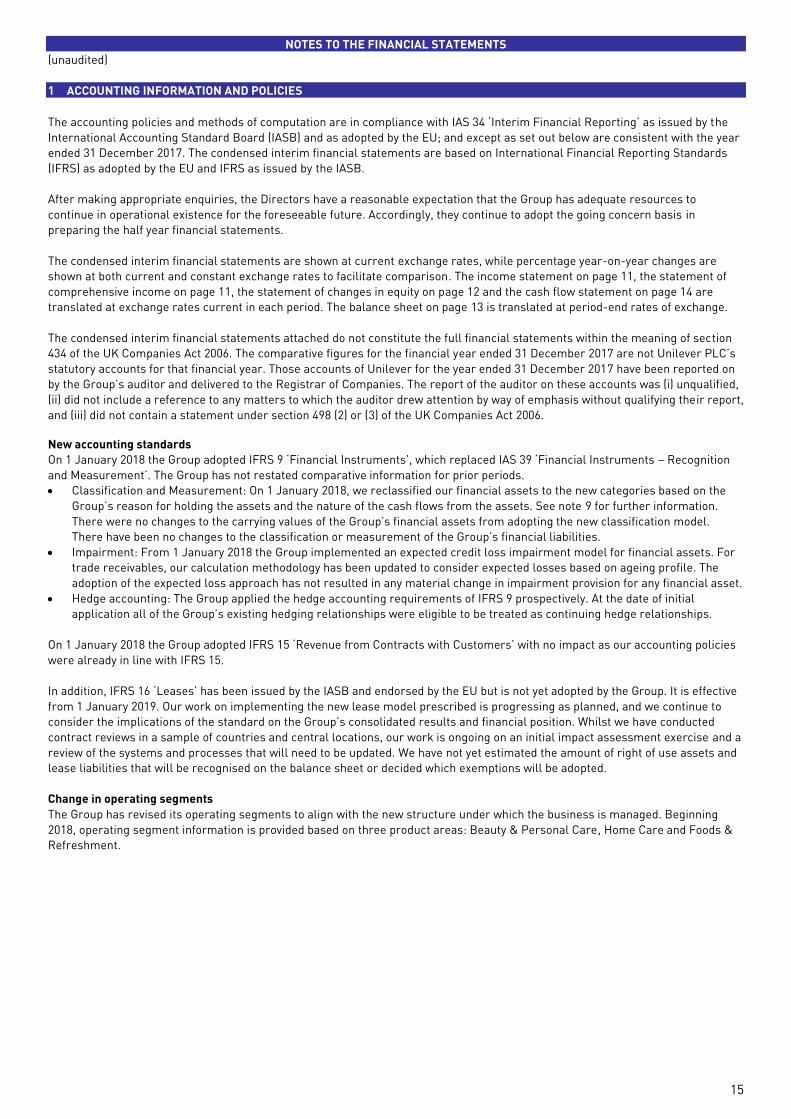
NOTES TO THE FINANCIAL STATEMENTS
(unaudited)
1 ACCOUNTING INFORMATION AND POLICIES
The accounting policies and methods of computation are in compliance with IAS 34 ‘Interim Financial Reporting’ as issued by the
International Accounting Standard Board (IASB) and as adopted by the EU; and except as set out below are consistent with the year
ended 31 December 2017. The condensed interim financial statements are based on International Financial Reporting Standards
(IFRS) as adopted by the EU and IFRS as issued by the IASB.
After making appropriate enquiries, the Directors have a reasonable expectation that the Group has adequate resources to
continue in operational existence for the foreseeable future. Accordingly, they continue to adopt the going concern basis in
preparing the half year financial statements.
The condensed interim financial statements are shown at current exchange rates, while percentage year-on-year changes are
shown at both current and constant exchange rates to facilitate comparison. The income statement on page 11, the statement of
comprehensive income on page 11, the statement of changes in equity on page 12 and the cash flow statement on page 14 are
translated at exchange rates current in each period. The balance sheet on page 13 is translated at period-end rates of exchange.
The condensed interim financial statements attached do not constitute the full financial statements within the meaning of section
434 of the UK Companies Act 2006. The comparative figures for the financial year ended 31 December 2017 are not Unilever PLC’s
statutory accounts for that financial year. Those accounts of Unilever for the year ended 31 December 2017 have been reported on
by the Group’s auditor and delivered to the Registrar of Companies. The report of the auditor on these accounts was (i) unqualified,
(ii) did not include a reference to any matters to which the auditor drew attention by way of emphasis without qualifying their report,
and (iii) did not contain a statement under section 498 (2) or (3) of the UK Companies Act 2006.
New accounting standards
On 1 January 2018 the Group adopted IFRS 9 ‘Financial Instruments’, which replaced IAS 39 ‘Financial Instruments – Recognition
and Measurement’. The Group has not restated comparative information for prior periods.
• Classification and Measurement: On 1 January 2018, we reclassified our financial assets to the new categories based on the
Group’s reason for holding the assets and the nature of the cash flows from the assets. See note 9 for further information.
There were no changes to the carrying values of the Group’s financial assets from adopting the new classification model.
There have been no changes to the classification or measurement of the Group’s financial liabilities.
• Impairment: From 1 January 2018 the Group implemented an expected credit loss impairment model for financial assets. For
trade receivables, our calculation methodology has been updated to consider expected losses based on ageing profile. The
adoption of the expected loss approach has not resulted in any material change in impairment provision for any financial asset.
• Hedge accounting: The Group applied the hedge accounting requirements of IFRS 9 prospectively. At the date of initial
application all of the Group’s existing hedging relationships were eligible to be treated as continuing hedge relationships.
On 1 January 2018 the Group adopted IFRS 15 ‘Revenue from Contracts with Customers’ with no impact as our accounting policies
were already in line with IFRS 15.
In addition, IFRS 16 ‘Leases’ has been issued by the IASB and endorsed by the EU but is not yet adopted by the Group. It is effective
from 1 January 2019. Our work on implementing the new lease model prescribed is progressing as planned, and we continue to
consider the implications of the standard on the Group’s consolidated results and financial position. Whilst we have conducted
contract reviews in a sample of countries and central locations, our work is ongoing on an initial impact assessment exercise and a
review of the systems and processes that will need to be updated. We have not yet estimated the amount of right of use assets and
lease liabilities that will be recognised on the balance sheet or decided which exemptions will be adopted.
Change in operating segments
The Group has revised its operating segments to align with the new structure under which the business is managed. Beginning
2018, operating segment information is provided based on three product areas: Beauty & Personal Care, Home Care and Foods &
Refreshment.
16
NOTES TO THE FINANCIAL STATEMENTS
(unaudited)
2 SIGNIFICANT ITEMS WITHIN THE INCOME STATEMENT
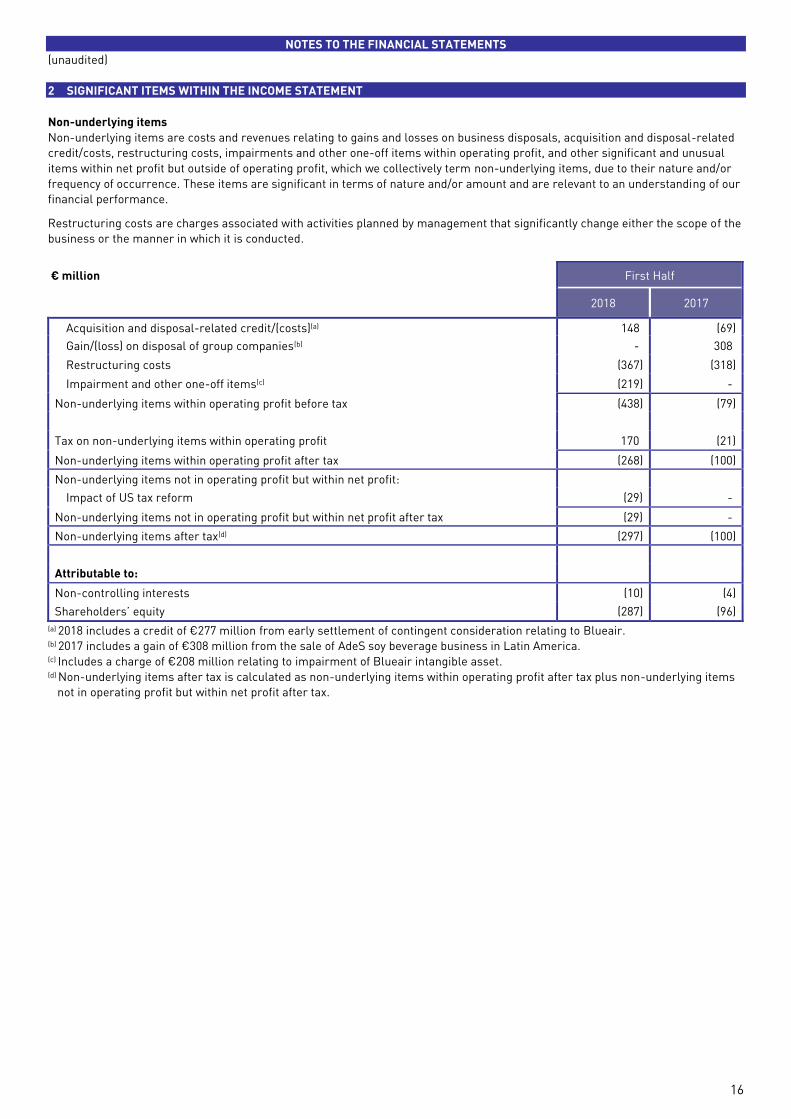
Non-underlying items
Non-underlying items are costs and revenues relating to gains and losses on business disposals, acquisition and disposal-related
credit/costs, restructuring costs, impairments and other one-off items within operating profit, and other significant and unusual
items within net profit but outside of operating profit, which we collectively term non-underlying items, due to their nature and/or
frequency of occurrence. These items are significant in terms of nature and/or amount and are relevant to an understanding of our
financial performance.
Restructuring costs are charges associated with activities planned by management that significantly change either the scope of the
business or the manner in which it is conducted.
€ million First Half
2018 2017
Acquisition and disposal-related credit/(costs)(a) 148 (69)
Gain/(loss) on disposal of group companies(b) - 308
Restructuring costs (367) (318)
Impairment and other one-off items(c) (219) -
Non-underlying items within operating profit before tax (438) (79)
Tax on non-underlying items within operating profit 170 (21)
Non-underlying items within operating profit after tax (268) (100)
Non-underlying items not in operating profit but within net profit:
Impact of US tax reform (29) -
Non-underlying items not in operating profit but within net profit after tax (29) -
Non-underlying items after tax(d) (297) (100)
Attributable to:
Non-controlling interests (10) (4)
Shareholders’ equity (287) (96)
(a) 2018 includes a credit of €277 million from early settlement of contingent consideration relating to Blueair. (b) 2017 includes a gain of €308 million from the sale of AdeS soy beverage business in Latin America. (c) Includes a charge of €208 million relating to impairment of Blueair intangible asset. (d) Non-underlying items after tax is calculated as non-underlying items within operating profit after tax plus non-underlying items
not in operating profit but within net profit after tax.
17
NOTES TO THE FINANCIAL STATEMENTS
(unaudited)
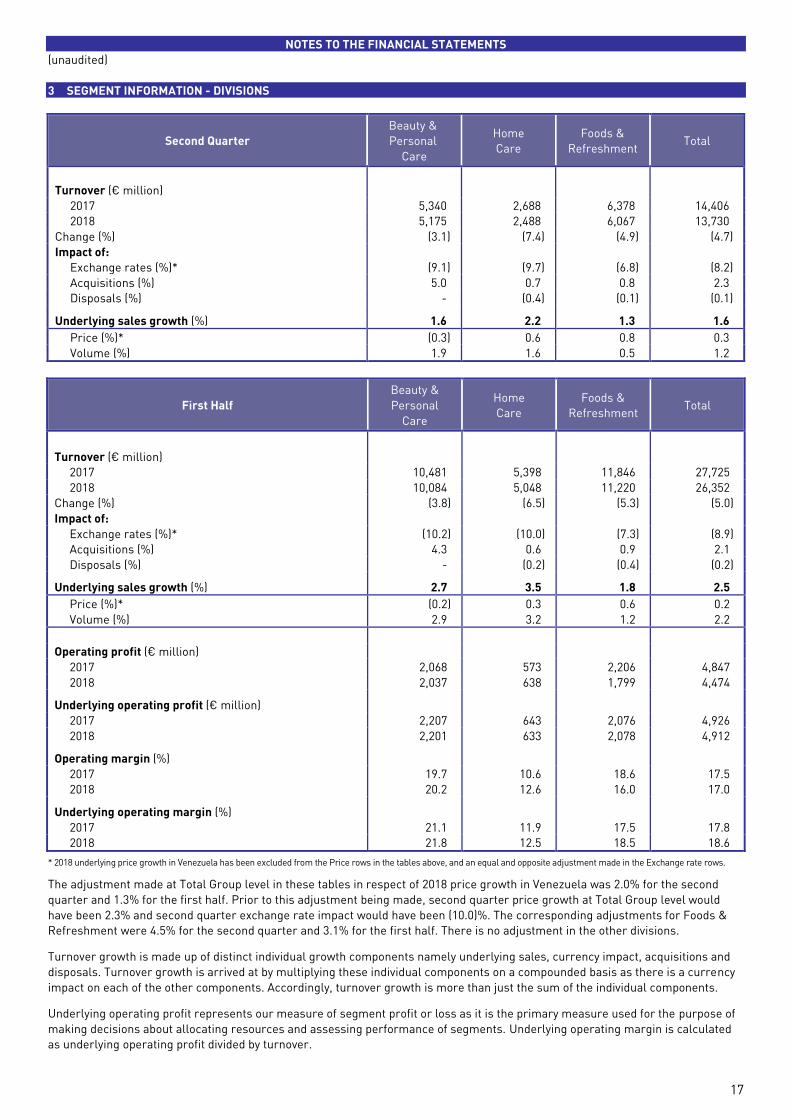
3 SEGMENT INFORMATION - DIVISIONS
Second Quarter
Beauty &
Personal
Care
Home
Care
Foods &
Refreshment Total
Turnover (€ million)
2017 5,340 2,688 6,378 14,406
2018 5,175 2,488 6,067 13,730
Change (%) (3.1) (7.4) (4.9) (4.7)
Impact of:
Exchange rates (%)* (9.1) (9.7) (6.8) (8.2)
Acquisitions (%) 5.0 0.7 0.8 2.3
Disposals (%) - (0.4) (0.1) (0.1)
Underlying sales growth (%) 1.6 2.2 1.3 1.6
Price (%)* (0.3) 0.6 0.8 0.3
Volume (%) 1.9 1.6 0.5 1.2
First Half
Beauty &
Personal
Care
Home
Care
Foods &
Refreshment Total
Turnover (€ million)
2017 10,481 5,398 11,846 27,725
2018 10,084 5,048 11,220 26,352
Change (%) (3.8) (6.5) (5.3) (5.0)
Impact of:
Exchange rates (%)* (10.2) (10.0) (7.3) (8.9)
Acquisitions (%) 4.3 0.6 0.9 2.1
Disposals (%) - (0.2) (0.4) (0.2)
Underlying sales growth (%) 2.7 3.5 1.8 2.5
Price (%)* (0.2) 0.3 0.6 0.2
Volume (%) 2.9 3.2 1.2 2.2
Operating profit (€ million)
2017 2,068 573 2,206 4,847
2018 2,037 638 1,799 4,474
Underlying operating profit (€ million)
2017 2,207 643 2,076 4,926
2018 2,201 633 2,078 4,912
Operating margin (%)
2017 19.7 10.6 18.6 17.5
2018 20.2 12.6 16.0 17.0
Underlying operating margin (%)
2017 21.1 11.9 17.5 17.8
2018 21.8 12.5 18.5 18.6
* 2018 underlying price growth in Venezuela has been excluded from the Price rows in the tables above, and an equal and opposite adjustment made in the Exchange rate rows.
The adjustment made at Total Group level in these tables in respect of 2018 price growth in Venezuela was 2.0% for the second
quarter and 1.3% for the first half. Prior to this adjustment being made, second quarter price growth at Total Group level would
have been 2.3% and second quarter exchange rate impact would have been (10.0)%. The corresponding adjustments for Foods &
Refreshment were 4.5% for the second quarter and 3.1% for the first half. There is no adjustment in the other divisions.
Turnover growth is made up of distinct individual growth components namely underlying sales, currency impact, acquisitions and
disposals. Turnover growth is arrived at by multiplying these individual components on a compounded basis as there is a currency
impact on each of the other components. Accordingly, turnover growth is more than just the sum of the individual components.
Underlying operating profit represents our measure of segment profit or loss as it is the primary measure used for the purpose of
making decisions about allocating resources and assessing performance of segments. Underlying operating margin is calculated
as underlying operating profit divided by turnover.
18
NOTES TO THE FINANCIAL STATEMENTS
(unaudited)
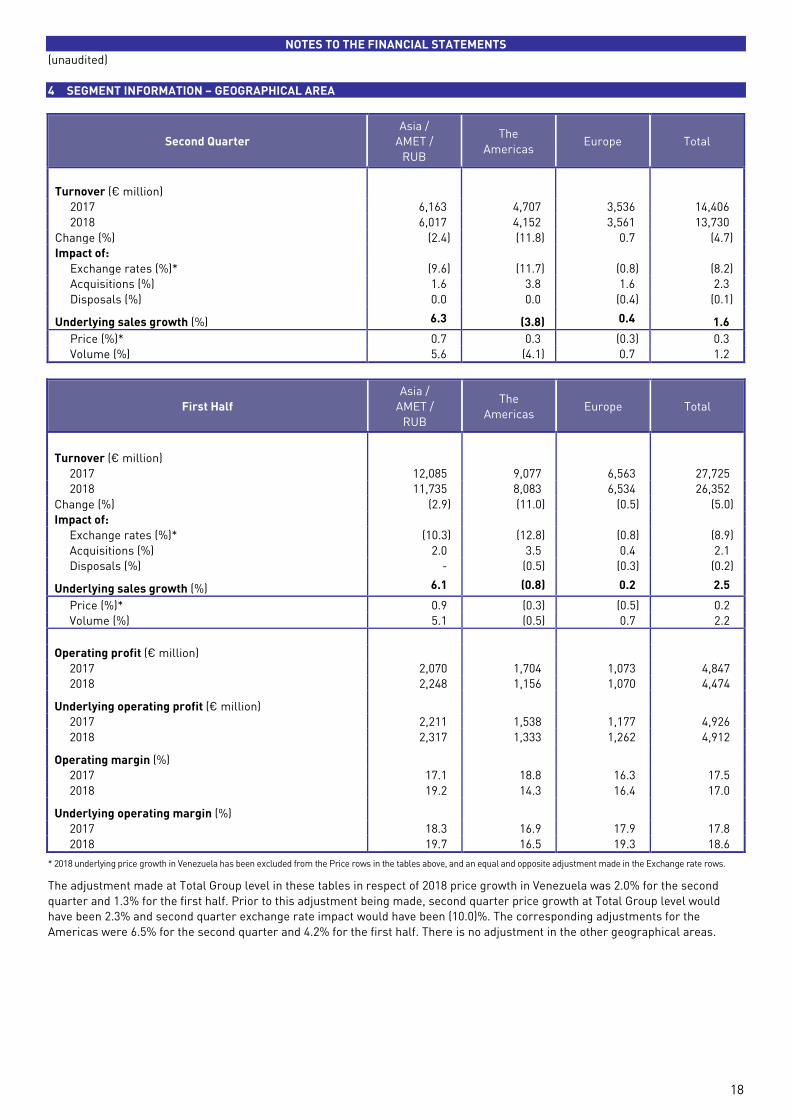
4 SEGMENT INFORMATION – GEOGRAPHICAL AREA
Second Quarter
Asia /
AMET /
RUB
The
Americas Europe Total
Turnover (€ million)
2017 6,163 4,707 3,536 14,406
2018 6,017 4,152 3,561 13,730
Change (%) (2.4) (11.8) 0.7 (4.7)
Impact of:
Exchange rates (%)* (9.6) (11.7) (0.8) (8.2)
Acquisitions (%) 1.6 3.8 1.6 2.3
Disposals (%) 0.0 0.0 (0.4) (0.1)
Underlying sales growth (%) 6.3 (3.8) 0.4 1.6
Price (%)* 0.7 0.3 (0.3) 0.3
Volume (%) 5.6 (4.1) 0.7 1.2
First Half
Asia /
AMET /
RUB
The
Americas Europe Total
Turnover (€ million)
2017 12,085 9,077 6,563 27,725
2018 11,735 8,083 6,534 26,352
Change (%) (2.9) (11.0) (0.5) (5.0)
Impact of:
Exchange rates (%)* (10.3) (12.8) (0.8) (8.9)
Acquisitions (%) 2.0 3.5 0.4 2.1
Disposals (%) - (0.5) (0.3) (0.2)
Underlying sales growth (%) 6.1 (0.8) 0.2 2.5
Price (%)* 0.9 (0.3) (0.5) 0.2
Volume (%) 5.1 (0.5) 0.7 2.2
Operating profit (€ million)
2017 2,070 1,704 1,073 4,847
2018 2,248 1,156 1,070 4,474
Underlying operating profit (€ million)
2017 2,211 1,538 1,177 4,926
2018 2,317 1,333 1,262 4,912
Operating margin (%)
2017 17.1 18.8 16.3 17.5
2018 19.2 14.3 16.4 17.0
Underlying operating margin (%)
2017 18.3 16.9 17.9 17.8
2018 19.7 16.5 19.3 18.6
* 2018 underlying price growth in Venezuela has been excluded from the Price rows in the tables above, and an equal and opposite adjustment made in the Exchange rate rows.
The adjustment made at Total Group level in these tables in respect of 2018 price growth in Venezuela was 2.0% for the second
quarter and 1.3% for the first half. Prior to this adjustment being made, second quarter price growth at Total Group level would
have been 2.3% and second quarter exchange rate impact would have been (10.0)%. The corresponding adjustments for the
Americas were 6.5% for the second quarter and 4.2% for the first half. There is no adjustment in the other geographical areas.
19
NOTES TO THE FINANCIAL STATEMENTS
(unaudited)
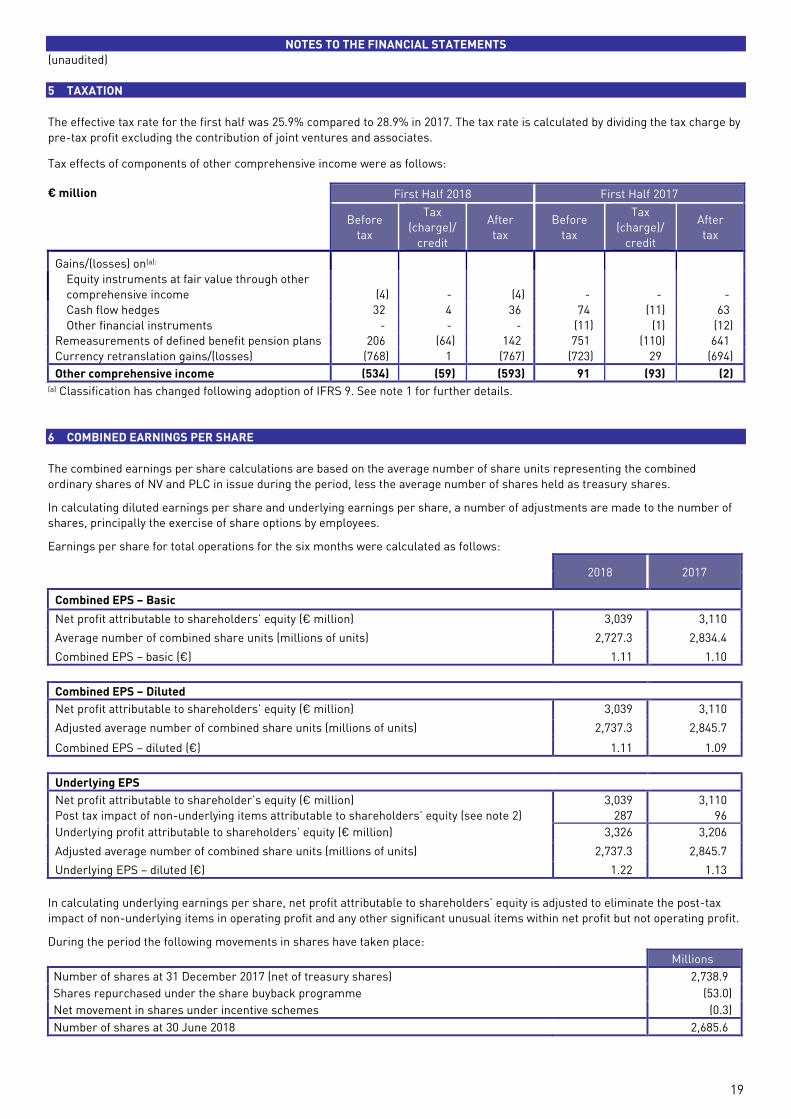
5 TAXATION
The effective tax rate for the first half was 25.9% compared to 28.9% in 2017. The tax rate is calculated by dividing the tax charge by
pre-tax profit excluding the contribution of joint ventures and associates.
Tax effects of components of other comprehensive income were as follows:
€ million First Half 2018 First Half 2017
Before
tax
Tax
(charge)/
credit
After
tax
Before
tax
Tax
(charge)/
credit
After
tax
Gains/(losses) on(a):
Equity instruments at fair value through other
comprehensive income (4) - (4) - - - Cash flow hedges 32 4 36 74 (11) 63
Other financial instruments - - - (11) (1) (12)
Remeasurements of defined benefit pension plans 206 (64) 142 751 (110) 641
Currency retranslation gains/(losses) (768) 1 (767) (723) 29 (694)
Other comprehensive income (534) (59) (593) 91 (93) (2) (a) Classification has changed following adoption of IFRS 9. See note 1 for further details.
6 COMBINED EARNINGS PER SHARE
The combined earnings per share calculations are based on the average number of share units representing the combined
ordinary shares of NV and PLC in issue during the period, less the average number of shares held as treasury shares.
In calculating diluted earnings per share and underlying earnings per share, a number of adjustments are made to the number of
shares, principally the exercise of share options by employees.
Earnings per share for total operations for the six months were calculated as follows:
2018 2017
Combined EPS – Basic
Net profit attributable to shareholders’ equity (€ million) 3,039 3,110
Average number of combined share units (millions of units) 2,727.3 2,834.4
Combined EPS – basic (€) 1.11 1.10
Combined EPS – Diluted
Net profit attributable to shareholders’ equity (€ million) 3,039 3,110
Adjusted average number of combined share units (millions of units) 2,737.3 2,845.7
Combined EPS – diluted (€) 1.11 1.09
Underlying EPS
Net profit attributable to shareholder’s equity (€ million) 3,039 3,110
Post tax impact of non-underlying items attributable to shareholders’ equity (see note 2) 287 96
Underlying profit attributable to shareholders’ equity (€ million) 3,326 3,206
Adjusted average number of combined share units (millions of units) 2,737.3 2,845.7
Underlying EPS – diluted (€) 1.22 1.13
In calculating underlying earnings per share, net profit attributable to shareholders’ equity is adjusted to eliminate the post-tax
impact of non-underlying items in operating profit and any other significant unusual items within net profit but not operating profit.
During the period the following movements in shares have taken place:
Millions
Number of shares at 31 December 2017 (net of treasury shares) 2,738.9
Shares repurchased under the share buyback programme (53.0)
Net movement in shares under incentive schemes (0.3)
Number of shares at 30 June 2018 2,685.6
20
NOTES TO THE FINANCIAL STATEMENTS
(unaudited)
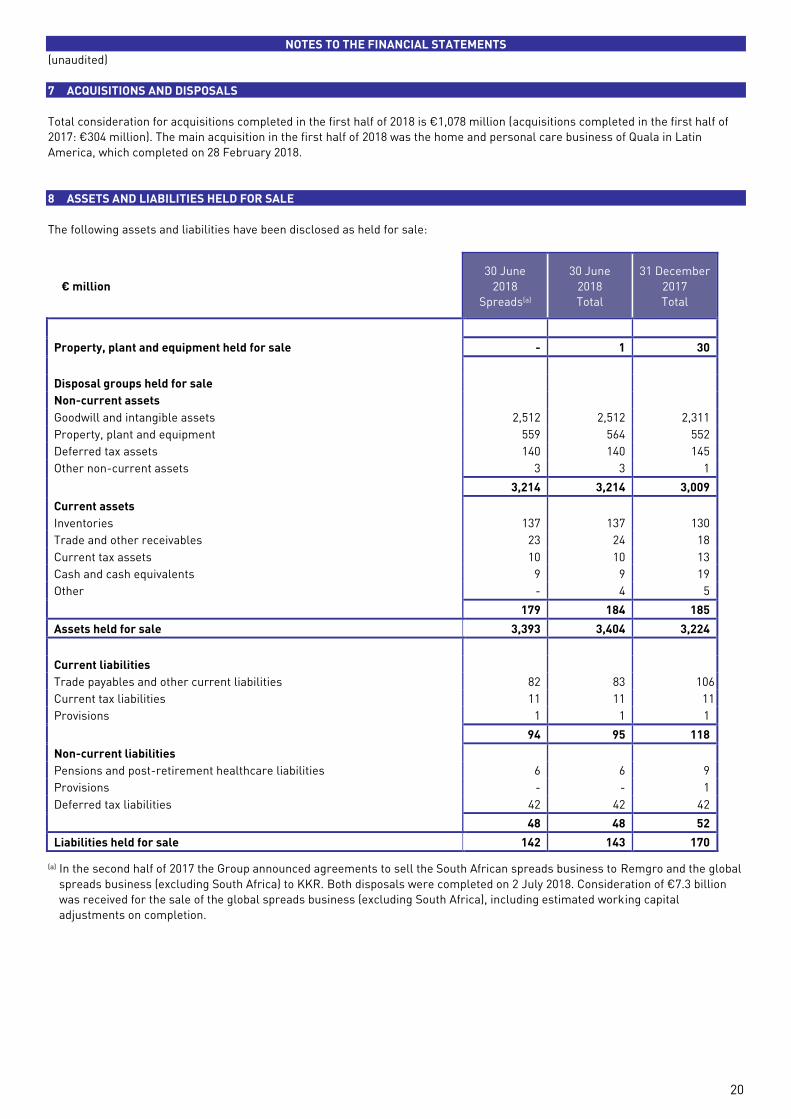
7 ACQUISITIONS AND DISPOSALS
Total consideration for acquisitions completed in the first half of 2018 is €1,078 million (acquisitions completed in the first half of
2017: €304 million). The main acquisition in the first half of 2018 was the home and personal care business of Quala in Latin
America, which completed on 28 February 2018.
8 ASSETS AND LIABILITIES HELD FOR SALE
The following assets and liabilities have been disclosed as held for sale:
€ million
30 June
2018
Spreads(a)
30 June
2018
Total
31 December
2017
Total
Property, plant and equipment held for sale - 1 30
Disposal groups held for sale
Non-current assets
Goodwill and intangible assets 2,512 2,512 2,311
Property, plant and equipment 559 564 552
Deferred tax assets 140 140 145
Other non-current assets 3 3 1
3,214 3,214 3,009
Current assets
Inventories 137 137 130
Trade and other receivables 23 24 18
Current tax assets 10 10 13
Cash and cash equivalents 9 9 19
Other - 4 5
179 184 185
Assets held for sale 3,393 3,404 3,224
Current liabilities
Trade payables and other current liabilities 82 83 106
Current tax liabilities 11 11 11
Provisions 1 1 1
94 95 118
Non-current liabilities
Pensions and post-retirement healthcare liabilities 6 6 9
Provisions - - 1
Deferred tax liabilities 42 42 42
48 48 52
Liabilities held for sale 142 143 170
(a) In the second half of 2017 the Group announced agreements to sell the South African spreads business to Remgro and the global
spreads business (excluding South Africa) to KKR. Both disposals were completed on 2 July 2018. Consideration of €7.3 billion
was received for the sale of the global spreads business (excluding South Africa), including estimated working capital
adjustments on completion.
21
NOTES TO THE FINANCIAL STATEMENTS
(unaudited)
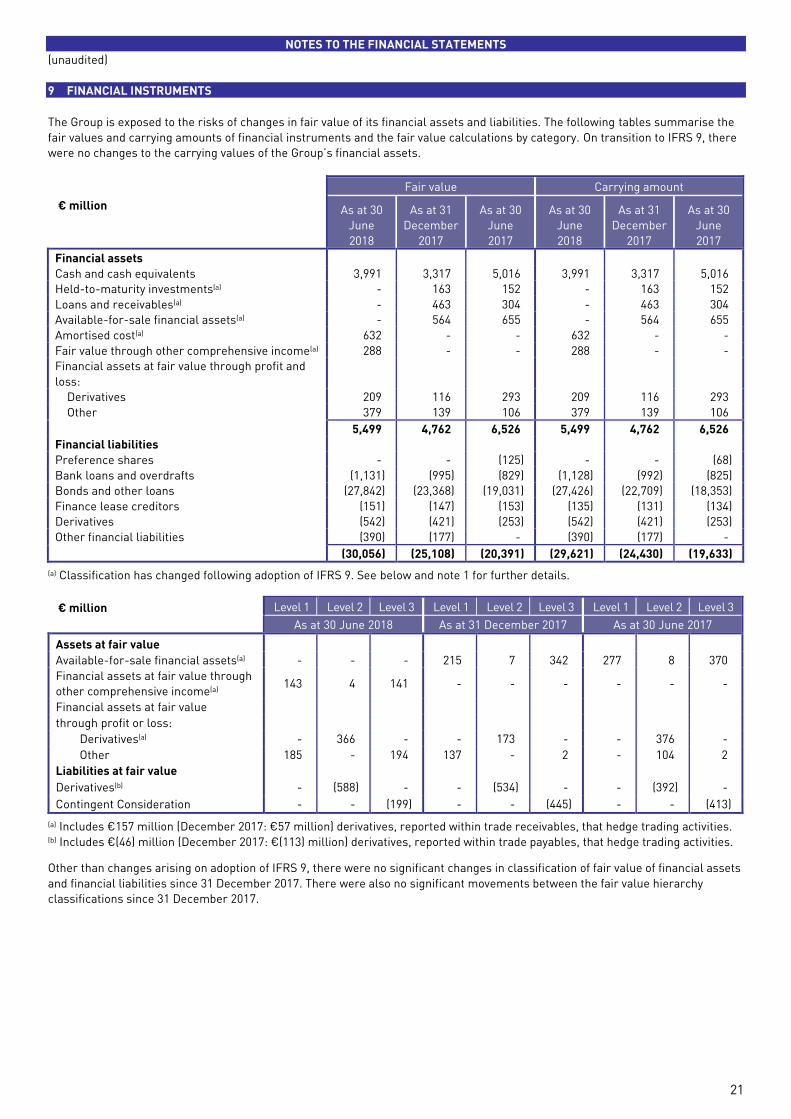
9 FINANCIAL INSTRUMENTS
The Group is exposed to the risks of changes in fair value of its financial assets and liabilities. The following tables summarise the
fair values and carrying amounts of financial instruments and the fair value calculations by category. On transition to IFRS 9, there
were no changes to the carrying values of the Group’s financial assets.
€ million
Fair value Carrying amount
As at 30
June
2018
As at 31
December
2017
As at 30
June
2017
As at 30
June
2018
As at 31
December
2017
As at 30
June
2017
Financial assets Cash and cash equivalents 3,991 3,317 5,016 3,991 3,317 5,016
Held-to-maturity investments(a) - 163 152 - 163 152
Loans and receivables(a) - 463 304 - 463 304
Available-for-sale financial assets(a) - 564 655 - 564 655
Amortised cost(a) 632 - - 632 - -
Fair value through other comprehensive income(a) 288 - - 288 - -
Financial assets at fair value through profit and
loss:
Derivatives 209 116 293 209 116 293
Other 379 139 106 379 139 106
5,499 4,762 6,526 5,499 4,762 6,526
Financial liabilities
Preference shares - - (125) - - (68)
Bank loans and overdrafts (1,131) (995) (829) (1,128) (992) (825)
Bonds and other loans (27,842) (23,368) (19,031) (27,426) (22,709) (18,353)
Finance lease creditors (151) (147) (153) (135) (131) (134)
Derivatives (542) (421) (253) (542) (421) (253)
Other financial liabilities (390) (177) - (390) (177) -
(30,056) (25,108) (20,391) (29,621) (24,430) (19,633)
(a) Classification has changed following adoption of IFRS 9. See below and note 1 for further details.
€ million Level 1 Level 2 Level 3 Level 1 Level 2 Level 3 Level 1 Level 2 Level 3
As at 30 June 2018 As at 31 December 2017 As at 30 June 2017
Assets at fair value
Available-for-sale financial assets(a) - - - 215 7 342 277 8 370
Financial assets at fair value through
other comprehensive income(a) 143 4 141 - - - - - -
Financial assets at fair value
through profit or loss:
Derivatives(a) - 366 - - 173 - - 376 -
Other 185 - 194 137 - 2 - 104 2
Liabilities at fair value
Derivatives(b) - (588) - - (534) - - (392) -
Contingent Consideration - - (199) - - (445) - - (413)
(a) Includes €157 million (December 2017: €57 million) derivatives, reported within trade receivables, that hedge trading activities. (b) Includes €(46) million (December 2017: €(113) million) derivatives, reported within trade payables, that hedge trading activities.
Other than changes arising on adoption of IFRS 9, there were no significant changes in classification of fair value of financial assets
and financial liabilities since 31 December 2017. There were also no significant movements between the fair value hierarchy
classifications since 31 December 2017.
22
NOTES TO THE FINANCIAL STATEMENTS
(unaudited)
9 FINANCIAL INSTRUMENTS (continued)
The fair value of trade receivables and payables is considered to be equal to the carrying amount of these items due to their short-
term nature.
Calculation of fair values
The fair values of the financial assets and liabilities are defined as the price that would be received to sell an asset or paid to
transfer a liability in an orderly transaction between market participants at the measurement date. Methods and assumptions used
to estimate the fair values are consistent with those used in the year ended 31 December 2017.
Adoption of IFRS 9 – Impact on measurement of financial assets
On the date of initial application of IFRS 9, 1 January 2018, financial assets of €207 million previously measured at fair value
through equity were reclassified as fair value through profit or loss. Fair value gains or losses on these financial assets were
immaterial in 2017 and 2018. Financial assets of €6 million previously measured at fair value through profit or loss were
reclassified to amortised cost under IFRS 9.
Cash and cash equivalents and trade receivables, which were classified as loans and other receivables under IAS 39, will be
classified as amortised cost under IFRS 9.
10 SHARE BUYBACK PROGRAMME
On 19 April 2018 Unilever announced a share buyback programme of up to €6 billion to return the expected after-tax proceeds
from the spreads disposal. At 30 June 2018 the Group has repurchased 53,040,783 ordinary shares as part of the programme for
€2,514 million. Cash paid for the repurchase of shares was €2,246 million and €268 million is shown within current financial
liabilities. These shares have not been cancelled and are recognised as treasury shares with the cost reported within other
reserves.
11 DIVIDENDS
The Boards have determined to pay a quarterly interim dividend for Q2 2018 at the following rates which are equivalent in value
between the two companies at the rate of exchange applied under the terms of the Equalisation Agreement:
The quarterly interim dividends have been determined in euros and converted into equivalent sterling and US dollar amounts using
exchange rates issued by WM/Reuters on 17 July 2018.
US dollar cheques for the quarterly interim dividend will be mailed on 5 September 2018 to holders of record at the close of
business on 3 August 2018. In the case of the NV New York shares, Netherlands withholding tax will be deducted.
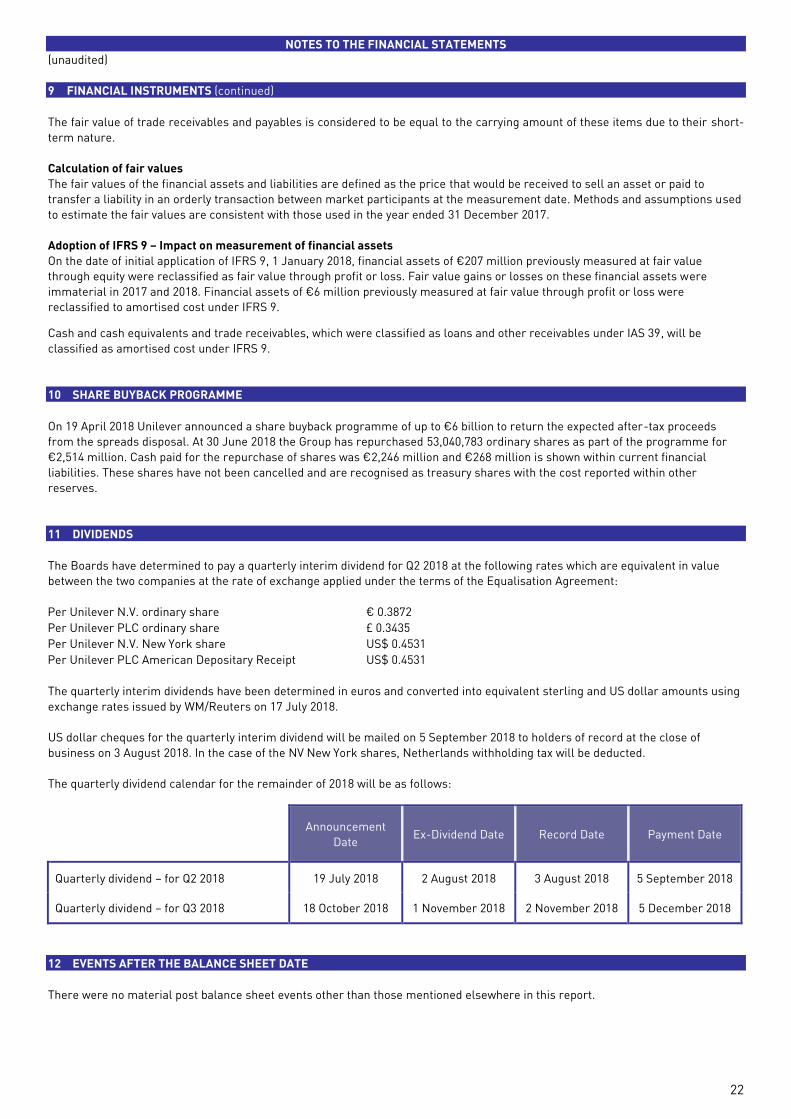
The quarterly dividend calendar for the remainder of 2018 will be as follows:
Announcement
Date Ex-Dividend Date Record Date Payment Date
Quarterly dividend – for Q2 2018 19 July 2018 2 August 2018 3 August 2018 5 September 2018
Quarterly dividend – for Q3 2018 18 October 2018 1 November 2018 2 November 2018 5 December 2018
12 EVENTS AFTER THE BALANCE SHEET DATE
There were no material post balance sheet events other than those mentioned elsewhere in this report.
Per Unilever N.V. ordinary share € 0.3872
Per Unilever PLC ordinary share £ 0.3435
Per Unilever N.V. New York share US$ 0.4531
Per Unilever PLC American Depositary Receipt US$ 0.4531
23
DIRECTORS’ RESPONSIBILITY STATEMENT
The Directors declare that, to the best of their knowledge:
• this condensed set of interim financial statements, which have been prepared in accordance with IAS 34 ‘Interim Financial
Reporting’, as issued by the International Accounting Standard Board and endorsed and adopted by the EU gives a true
and fair view of the assets, liabilities, financial position and profit or loss of Unilever; and
• the interim management report gives a fair review of the information required pursuant to regulations 4.2.7 and 4.2.8 of
the Disclosure and Transparency Rules (DTR) issued by the UK Financial Conduct Authority and section 5:25d (8)/(9) of the
Dutch Act on Financial Supervision (Wet op het financieel toezicht).
Unilever’s Directors are listed in the Annual Report and Accounts for 2017, with the exception of certain changes following the
Unilever N.V. and Unilever PLC 2018 AGMs:
• Ann Fudge retired as a Non-Executive Director
• Andrea Jung was appointed a Non-Executive Director
Details of all current Directors are available on our website at www.unilever.com
By order of the Board
Paul Polman Graeme Pitkethly
Chief Executive Officer Chief Financial Officer
19 July 2018