Embed Size (px)
Citation preview

28 February 2019
2018 FULL YEAR RESULTS
PRESENTATION
Photo: Ørjan Richardsen / Woldcam / Statoil
2
FORWARD-LOOKING STATEMENTS
Forward-looking statements contained in this presentation regrading future events and future results are based on current expectations, estimates, forecasts and projections about the industries in which Saipem S.p.A. (the “Company”) operates, as well as the beliefs and assumptions of the Company’s management. These forward-looking statements are only predictions and are subject to known and unknown risks, uncertainties, assumptions and other factors beyond the Company’ control that are difficult to predict because they relate to events and depend on circumstances that will occur in the future. These include, but are not limited to: forex and interest rate fluctuations, commodity price volatility, credit and liquidity risks, HSE risks, the levels of capital expenditure in the oil and gas industry and other sectors, political instability in areas where the Group operates, actions by competitors, success of commercial transactions, risks associated with the execution of projects (including ongoing investment projects), in addition to changes in stakeholders’ expectations and other changes affecting business conditions. Therefore, the Company’s actual results may differ materially and adversely from those expressed or implied in any forward-looking statements. They are neither statements of historical fact nor guarantees of future performance. The Company therefore caution against relying on any of these forward-looking statements. Factors that might cause or contribute to such differences include, but are not limited to, economic conditions globally, the impact of competition, political and economic developments in the countries in which the Company operates, and regulatory developments in Italy and internationally. Any forward-looking statements made by or on behalf of the Company speak only as of the date they are made. The Company undertakes no obligation to update any forward-looking statements to reflect any changes in the Company’s expectations with regard thereto or any changes in events, conditions or circumstances on which any such statement is based. Accordingly, readers should not place undue reliance on forward-looking statements due to the inherent uncertainty therein. The Financial Reports contain analyses of some of the aforementioned risks. Forward-looking statements neither represent nor can be considered as estimates for legal, accounting, fiscal or investment purposes. Forward-looking statements are not intended to provide assurances and/or solicit investment.

3
TODAY’S PRESENTATION
2 FY2018 RESULTS
3 MARKET AND PORTFOLIO UPDATE
1 OPENING REMARKS
4 BUSINESS UPDATE
5 CLOSING REMARKS AND 2019 GUIDANCE

4
OPENING REMARKS
2018 results ahead of target
Strong E&C Offshore execution throughout the year
Progress in E&C Onshore turnaround
Resilience in Drilling margins supported by efficiency measures
Net result influenced by special items
“Promising” negotiations for amicable settlement of South Stream arbitration
2019 Guidance reflects good progress on contract awards to date and visibility on new orders
Healthy cash flow generation driving Net Debt below €1.2bn
Portfolio strategy update
E&C Offshore: continue to strengthen leading competitive position
E&C Onshore: turnaround progressing, focus on energy transition
Drilling Divisions: strategic options under assessment
c.€4.5bn contract awards in 4Q driving BtB ahead of expectations
Backlog of €12.6bn as of Dec. 31, 2018, excludes €1.8bn for non-consolidated projects
Good visibility on project pipeline

28 February 2019
FY2018 RESULTS

6
FY 2018 RESULTS
YoY COMPARISON (€ mn)
Adjusted EBITDA Revenues Adjusted Net Result
25
46
FY18 FY17 FY18 FY17 FY18* FY17
964 1,002
10.7% 11.7% margin
(*) Loss from a project-related equity affiliate is included in Adjusted Net Result
8,526 8,999

7
FY 2018 ADJUSTED RESULTS – E&C
YoY COMPARISON (€ mn)
(*) E&C Onshore including Floaters business and Xsight
(**) E&C Onshore FY 2018 Reported Revenues: €3,708mn
FY18 FY17 FY18 FY17
4,204
3,769
FY18 FY17 FY18** FY17
E&C OFFSHORE E&C ONSHORE*
3,852 3,692
15.0% 13.6% margin
523 555
(0.5)% 3.1% margin
(21)
118
EBITDA Revenues EBITDA Revenues
• Higher volumes in Middle East and North Sea more
than offset Caspian and Latin America lower volumes
• Good execution underpinning solid margin
• Negotiations for amicable settlement of South Stream
arbitration
• Lower volumes in Far and Middle East and West
Africa partly offset by Latin America and Caspian
• EBITDA: 2018 not reflecting loss from equity
affiliates; 2017 includes negative ruling on Algerian
arbitration

8
FY 2018 ADJUSTED RESULTS – Drilling
YoY COMPARISON (€ mn)
EBITDA Revenues EBITDA Revenues
DRILLING OFFSHORE DRILLING ONSHORE
465
613
226
321
490 501
109
135
52.4% 48.6% margin 22.2% 26.9% margin
FY18 FY17 FY18 FY17 FY18 FY17 FY18 FY17
• Lower volumes mainly due to idleness of Semi-subs
Scarabeo 5 and Scarabeo 8
• Resilient margin year-on-year
• Volumes steady year-on-year
• Efficiency actions supporting performance

9
FY 2018 NET RESULT
RECONCILIATION
FY18
Adjusted
Provisions for
Redundancies
Legacy
Legal Cases and
Litigations FY18
Reported
25
(45)
(109)
(472)
SPECIAL ITEMS
Impairments
and Write Downs
(196)
(60)
(343)
E&C
Onshore
Goodwill
Offshore
Drilling
Assets
Net Result (€ mn)
9M18 SPECIAL ITEMS 4Q18 SPECIAL ITEMS
Drilling and
Floaters
Assets (87)

10
FY 2018 RESULTS - FROM EBITDA Adjusted TO NET RESULT
D&A
TAX RATE
FINANCE
CHARGES
Witholding taxes and unused deferred tax assets affected 2018 adj. tax rate
104
56
5
Financing costs Project hedgingcosts
One-off forexgain/losses
Total FinanceCharges
2018 € mn
165
Normalised long-term tax rate confirmed at c.30% or lower
122 133 73
196
524
106 117 40
205
468
OffshoreDrilling
OnshoreDrilling
E&COnshore*
E&COffshore
TotalD&A
FY2017
FY2018
D&A € mn
(*) Floaters business
included in E&C Onshore
11
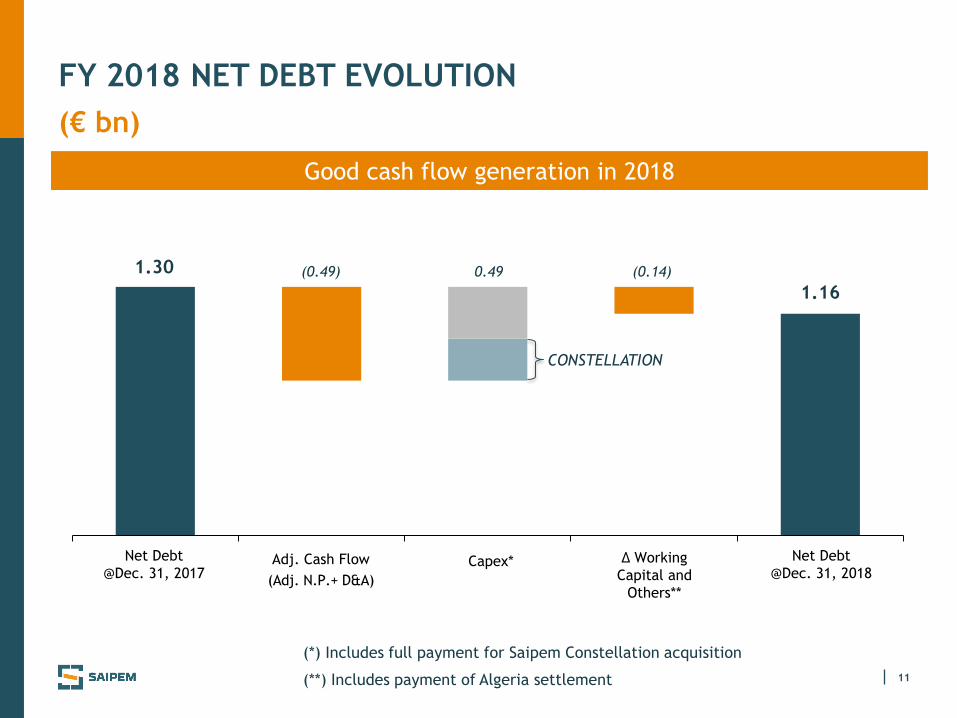
FY 2018 NET DEBT EVOLUTION
(€ bn)
Adj. Cash Flow
(Adj. N.P.+ D&A)
Capex* Net Debt
@Dec. 31, 2017
Net Debt
@Dec. 31, 2018 Δ Working
Capital and
Others**
1 2 3 4 5
1.16
(0.49) 0.49 1.30 (0.14)
Good cash flow generation in 2018
(*) Includes full payment for Saipem Constellation acquisition
(**) Includes payment of Algeria settlement
CONSTELLATION
12
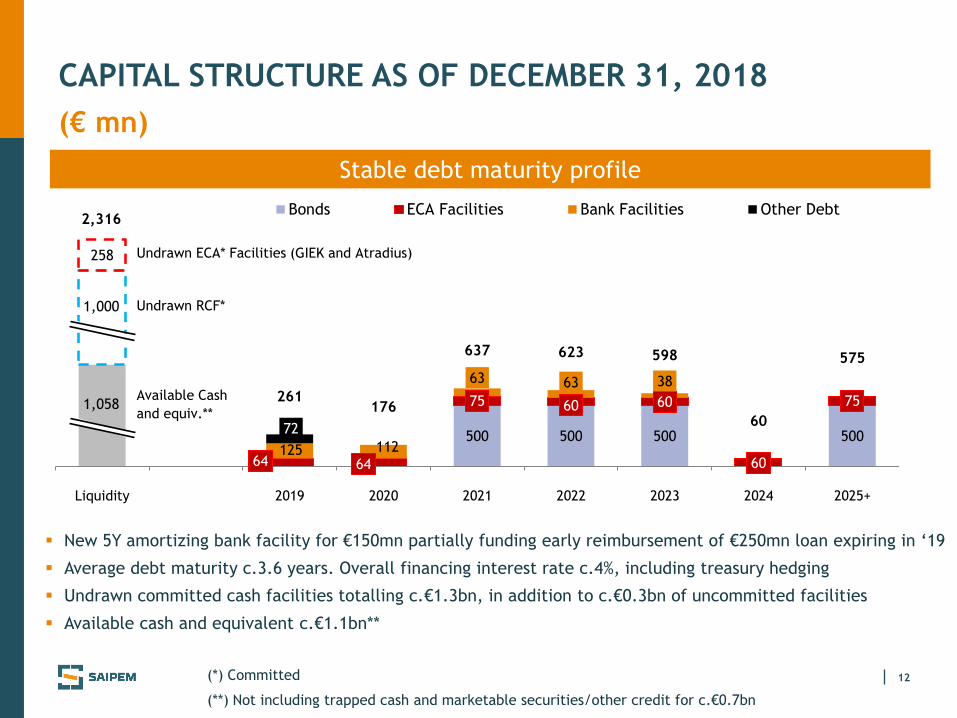
CAPITAL STRUCTURE AS OF DECEMBER 31, 2018
(€ mn)
500 500 500 500
64 64
75 60 60
60
75
125 112
63 63 38
72
261 176
637 623 598
60
575
258
Liquidity 2019 2020 2021 2022 2023 2024 2025+
Bonds ECA Facilities Bank Facilities Other Debt
Stable debt maturity profile
New 5Y amortizing bank facility for €150mn partially funding early reimbursement of €250mn loan expiring in ‘19
Average debt maturity c.3.6 years. Overall financing interest rate c.4%, including treasury hedging
Undrawn committed cash facilities totalling c.€1.3bn, in addition to c.€0.3bn of uncommitted facilities
Available cash and equivalent c.€1.1bn**
(*) Committed
(**) Not including trapped cash and marketable securities/other credit for c.€0.7bn
2,316
1,058
Undrawn RCF*
Undrawn ECA* Facilities (GIEK and Atradius)
1,000
Available Cash
and equiv.**

13
IFRS IMPACTS
• Asset “Right-of-Use” in capital employed and depreciated
• Lease obligations increasing net debt
• Financial charges applied over lease debt
RESTATEMENT AT 1st January 2019
Modified retrospective approach applied
Financial debt increased by circa €550mn
Adjusted EBITDA improved by circa €140mn
FE
AT
UR
ES
IN
IT
IA
L
IM
PA
CT
S
IFRS16 ADOPTION FROM JANUARY 1, 2019
Recently-awarded sizable projects to be managed through Equity Affiliates
NON CONSOLIDATED PROJECTS

28 February 2019
MARKET AND PORTFOLIO
UPDATE

15
E&C index
Drilling index
Brent price
MARKET OUTLOOK
Volatility still significant in 2018
Geopolitical dynamics
Oil Co.s focused on capital
discipline and dividend policy
OFS focus on consolidation,
innovation and efficiency
Improved FIDs trend in 2018 to continue
Engineering demand intensifying
Smaller-scale brownfields, tie-backs
Sizeable projects in LNG, refining and
petrochemicals
Offshore Drilling day-rates to recover in
medium term
Gradually recovering International
market for Onshore Drilling
MARKET VOLATILITY SOFT E&P SPENDING
RECOVERY
OPPORTUNITIES IN
ENERGY TRANSITION
Oil & Gas to remain main energy
source for next decades
Gas is the transition energy source
Renewables and LNG advance with
technology and economies of scale
Complementary segments: MMO,
decommissioning and infrastructure
Coal
Oil&Gas
Renewables
Long Term
Scenarios
Low CO2
control
High CO2
control
Today
Energy Mix
Source: Saipem elaboration on Bloomberg Source: Saipem elaboration on IHS Markit

16
PORTFOLIO STRATEGY UPDATE 1/2
E&C OFFSHORE
Competitive context
Recovery signals in a challenging market
Race for innovative and cost effective solutions
Vertical and horizontal consolidation ongoing
Actions
Maintain focus on core business
Selective approach to investments
Partnerships to boost integrated services
E&C OFFSHORE AND ONSHORE
Actions
Portfolio repositioning: geographies and segments
Performance recovery ongoing
Minimal capex, technology driven
E&C ONSHORE
Competitive context
Promising market, especially LNG and downstream
Leaders focusing on higher value segments
Significant competition but slow consolidation
STRENGTHEN
LEADING
COMPETITIVE POSITION
COMPLETE
TURNAROUND

17
STRATEGIC OPTIONS UNDER ASSESSMENT
OUR PERFORMANCE
Tough market context, especially offshore
High industry leverage
Many players reviewing consolidation options
Share deals preferred
Continued focus on cost base optimization
Resilient economic performance
Maintenance & mandatory capex only
Asset-light growth opportunities
DRILLING OFFSHORE AND ONSHORE
PORTFOLIO STRATEGY UPDATE 2/2
COMPETITIVE CONTEXT

18
Evolution Disruption
two pillars of Saipem’s technological innovation
Digital Transformation
enabling Technological Innovation
OUR INNOVATION MODEL
A COMMON THREAD FOR ALL DIVISIONS
CONVENTIONAL
DECARBONISATION
&
ENVIRONMENT Oil Spill
Intervention
CO2 Management
Solutions
xDIMTM
HYDRONE Subsea Platform
SPRINGSTM Plasma Welding
Subsea Flowline Heating
Subsea-to-Shore
LiqueflexTM LNG
Floating Wind Farm
New Materials for UREA plants
Digital Twin
Hybrid Process Solutions

19
OUR SUSTAINABLE BUSINESS MODEL
CEO and Board level responsibility
Senior management incentives linked to material sustainability topics
Enhanced ESG reporting and proactive stakeholder engagement
Improved scoring by most reputable ESG rating agencies
Included in leading sustainability indices DJSI and FTSE4Good
Constant focus on anticorruption: DNV Certification ISO 37001:2016
FOCUS ON CLIMATE CHANGE
Publication of “Tackling Climate Change”, in line with the
recommendations of the Task Force on Climate-Related
Financial Disclosure (TCFD)

28 February 2019
BUSINESS UPDATE

21
E&C OFFSHORE
MAIN RECENT AWARDS
BERRI AND MARJAN FIELD DEVELOPMENT
ZOHR RAMP UP TO PLATEAU PHASE
Client: Petrobel
Location: offshore Egypt
Scope of work: EPCI for subsea field development and installation/ precommissioning of new 30” Gas
export pipeline
Main vessels employed: CastorOne, S7000, FDS, CastoroSei, Normand Maximus, S3000
PROJECT HIGHLIGHTS:
— Extreme Fast Track schedule, massive deployment of assets and tight management of simultaneous
operations and interfaces
Client: Saudi Aramco
Location: Kingdom of Saudi Arabia – Arabian Gulf
Scope of work: EPCI of Platforms, with associated subsea pipelines, cables and infrastructures.
Main vessels employed: DeHe, Castoro II
PROJECT HIGHLIGHTS:
— More than 25 E&C Offshore projects carried out for Saudi Aramco
GOOD VISIBILITY ON NEAR TERM OPPORTUNITIES c.€20bn OVERALL
BP TORTUE MARINE CIVIL WORKS
Client: BP
Location: Maritime border of Mauritania and Senegal
Scope of work: EPCI of berthing and loading facilities, in consortium with Eiffage
Main vessels employed: Saipem 3000
PROJECT HIGHLIGHTS:
— Up to 22,000 tons of marine structures fabricated in Saipem Karimun yard

22
E&C OFFSHORE
DIVISIONAL STRATEGY
OFFSHORE WINDFARMS: Leverage on Footprint and Assets
DECOMMISSIONING: Service Oriented Approach
MMO: Diversify portfolio of opportunities through Strategic Partnerships
DIVERSIFICATION
Selective approach to CAPEX initiatives
EFFICIENT, ASSET LIGHT Organisation ASSETS
DIGITISATION, ROBOTICS, SUBSEA FACTORY TECHNOLOGY
SUBSEA: Expand in Reeling, Integrated SURF, Life of Field, Subsea Processing
PIPELINES and CONVENTIONAL: Consolidate Leadership
STRATEGIC
MARKETS

23
E&C ONSHORE
MAIN RECENT AWARDS
Client: Thai Oil Public Limited Company (PTT)
Location: Thailand
Scope of work: EPC and start-up activities for new production units and revamping of
the existing ones to increase production capacity of Sriracha refinery
PROJECT HIGHLIGHTS:
— High technological content: core refining, all process unit are licensed
— Extensive modularization approach: more than 300 modules up to 2,000 t
ARCTIC LNG 2 GBS
CLEAN FUEL PROJECT
Client: LLC ARCTIC LNG-2
Location: Gydan peninsula, Russia
Scope of work: construction of 3 Concrete Gravity Based Structures (GBS) with LNG
storage facilities totaling 687,000 m3
PROJECT HIGHLIGHTS:
— Highly Strategic project in terms of Client, Country and segment
— Biggest GBS ever: 330 m length, 152 m width, 30 m depth, total weight of 470,000 t
GOOD VISIBILITY ON NEAR TERM OPPORTUNITIES c.€40bn OVERALL

24
E&C ONSHORE
DIVISIONAL STRATEGY
BECOME THE
PARTNER OF
CHOICE
FOR CLIENTS
COMMITTED TO
THE ENERGY
TRANSITION
Providing carbon-neutral
operations along the
entire EPC value chain
Providing solutions to
shorten time-to-market
TOWARDS A LOW-CARBON FUTURE
5 KEY GROWTH TARGETS
LNG
MARKET SHARE
MIDDLE EAST
MARKET SHARE
OPERATING
GROSS MARGIN
TOTAL
TURNOVER
Consolidation in
Core markets & products
GREEN TECH.
MARKET SHARE

25
Client accreditation: 75 initiatives awarded in 2018
Significant awards completing start-up phase:
Exxon Mobil – Ca Voi Xanh FEED
Qatargas – North Field Production Sustainability FEED
Mitsubishi Heavy Industries – Ghorasal Polash Urea Fertilizer FEED
Engage clients in early phase definition
Disrupt traditional processes and solutions
Innovate throughout asset life span
1. Foster client relationships through engineering and consultancy services
2. Unlock opportunities for E&C Divisions
3. Commercialise full potential of proprietary licences
2020 IMO regulation implementations
Medium and Small Scale LNG (inc. floaters)
Decarbonisation
High grade petrochemical products
READY FOR
DIVISIONAL STRATEGY
SCOPE
PRIORITIES
ACHIEVEMENTS

26
OFFSHORE DRILLING
MITZON PROJECT IN MEXICO
MAIN AWARDS - 4Q 2018
Continued focus on costs optimization
Digitisation program progressing
FOCUS ON EFFICIENCY AND DIGITISATION
Client: Eni
Location: Mexico
Terms: 15 firm wells for c. 3 year operations (plus options)
RIG: Pioneer
HIGHLIGHTS:
Expansion to a new very promising area
Acquisition of one of the few long term business opportunity currently
available on the market
Rig in bare boat charter, operated and managed by Saipem Jack Up Pioneer
NEW 1Q 2019 AWARD PERRO NEGRO 8 CONTRACT EXTENSION IN UAE WITH ADNOC

27
OFFSHORE DRILLING FLEET
* ON STACKING MODE - TOTALLY WRITTEN OFF
** LEASED VESSEL
CLIENT AREA
EniCyprus-Morocco
Pakistan-Mozamb.
Eni Egypt
Eni Egypt
Shell - Total -
AkerBP - EniNorway
Eni Indonesia
- -
ADNOC UAE
Saudi Aramco Saudi Arabia
Eni Mexico
Saudi Aramco Saudi Arabia
Petrobel Egypt
- -
TENDER ASSISTED Eni - Total Congo
SHALLO
W-W
ATER
HI
SPEC
STA
ND
AR
D
ULTRA
DEEP-W
ATER a
nd
HARSH
EN
V.
DEEP-
WATER
Saipem 12000
Saipem 10000
Scarabeo 9
Scarabeo 8
Scarabeo 7
Scarabeo 5*
Perro Negro 8
Perro Negro 7
Pioneer**
Perro Negro 5
Perro Negro 4
Perro Negro 2*
TAD
2018 2019 2020
TO 2024>
2022>
Committed Optional period New awards in 4Q18 and 1Q19 to date
TO 2022>
TO

28
ONSHORE DRILLING
NEW DRILLING ACTIVITIES IN ARGENTINA
MAIN AWARDS - 4Q 2018
FOCUS ON EFFICIENCY AND DIGITISATION
Rig operating in the Vaca Muerta area
Operational Excellence
Geographical Expansion
Digital Drilling
Integrated Drilling with qualified Partners
TWO LONG TERM CONTRACTS
Client: YPF
Location: Vaca Muerta area
Terms: 5 year each contract
Project Highlights: Activities in the unconventional field with fast
moving highly efficient rigs
TWO CONTRACT EXTENSIONS FOR EXXON
Overall awards in Argentina worth c.US$140mn
NEW 1Q 2019 AWARD 5 YEAR CONTRACT IN SAUDI ARABIA

29
ONSHORE DRILLING FLEET
ONSHORE FLEET @ DECEMBER 31, 2018: 84 RIGS
LATIN AMERICA 48 RIGS
UTILISATION RATE 27%
MIDDLE EAST
31 RIGS
UTILISATION RATE 100%
REST OF THE WORLD 5 RIGS
UTILISATION RATE 78%
UTILISATION RATE IN 2018: 65%

30
2018 BACKLOG
IFRS VIEW (€ mn)
Backlog
@Dec. 31, 2018
Backlog
@Dec. 31, 2017
FY18
Revenues
FY18 Contracts
Acquisition
4,644
3,852 4,189
4,981
5,946
3,708 4,085
6,323
947 716 855 599
8,526 12,619 8,753 12,392
E&C Onshore* Drilling Offshore E&C Offshore Drilling Onshore
(*) E&C Onshore including Floaters business and XSight
(€ mn) 1,844
NON-CONSOLIDATED BACKLOG @ Dec. 31, 2018

31
BACKLOG BY YEAR OF EXECUTION
IFRS VIEW (€ mn)
E&C Onshore* Drilling Offshore E&C Offshore Drilling Onshore
(*) E&C Onshore including Floaters business and XSight
2019 2020 2021+
NON-CONSOLIDATED BACKLOG BY YEAR OF EXECUTION
2019 2020 2021+
€ mn 127 331 1,386
2,997
1,111 873
2,808
1,742 1,773
347
229 140
354
3,197
6,506
2,916

28 February 2019
GUIDANCE AND
CLOSING REMARKS

33
2019 GUIDANCE
Metrics FY 2019*
Revenues
CAPEX
Net financial position
Adjusted EBITDA % margin
c. €9bn
>10%
c. €500mn
c. €1.0bn
(*) Not inclusive of the impact of IFRS 16

34
CLOSING REMARKS
2018 AHEAD OF GUIDANCE DUE TO STRONG OPERATIONAL PERFORMANCE AND CASH GENERATION
PROMISING NEGOTIATIONS FOR AMICABLE SETTLEMENT OF SOUTH STREAM ARBITRATION
CONTINUING EVOLUTION TOWARD A GLOBAL SOLUTION PROVIDER IN E&C
ASSESSING STRATEGIC OPTIONS IN DRILLING
IMPROVING MARKET OUTLOOK ON E&P SPENDING AND OPPORTUNITIES IN THE ENERGY TRANSITION
DIVISIONAL REORGANISATION AND POSITIVE ORDERS MOMENTUM UNDERPINNING SOLID GUIDANCE
FOR 2019

28 February 2019
APPENDIX

36
FY 2018 RESULTS
QoQ TREND (€ mn)
Adjusted EBITDA Revenues Adjusted Net Result
11
4Q18 3Q18 4Q18* 3Q18 4Q18 3Q18**
2,469
2,259 277
242
12.3% 9.7% margin
8
(*) Adjusted Revenues: €2,489mn
(**) Loss from a project-related equity affiliate is included in Adjusted Net Result

37
FY 2018 RESULTS
QoQ TREND (€ mn)
(*) E&C Onshore including Floaters business and XSight
4Q18 3Q18 4Q18 3Q18
EBITDA Revenues
E&C OFFSHORE
4Q18 3Q18** 4Q18 3Q18
E&C ONSHORE*
4Q18 3Q18 4Q18 3Q18
EBITDA Revenues
DRILLING OFFSHORE
4Q18 3Q18 4Q18 3Q18
DRILLING ONSHORE
958
1,189
30
37
129 115
68
51
124 131
33 36
1,040 1,062
163
101
EBITDA Revenues
EBITDA Revenues
15.3% 9.7% margin 3.1% 3.1% margin
44.3% 52.7% margin 26.6% 27.5% margin
(**) EBITDA does not reflect loss from project-
related equity affiliate
38
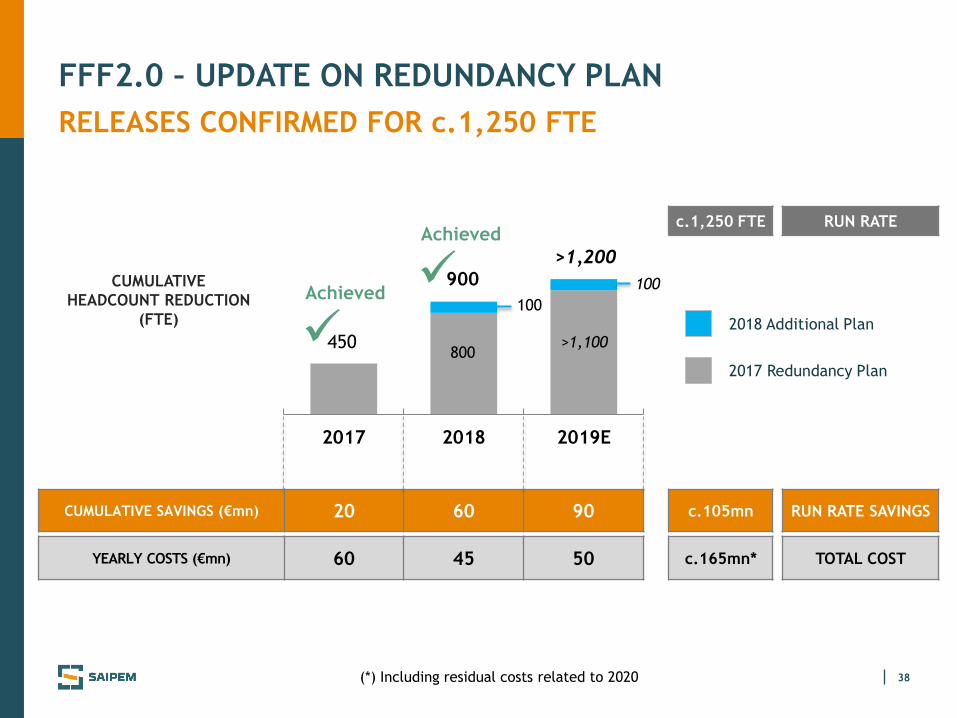
FFF2.0 – UPDATE ON REDUNDANCY PLAN
RELEASES CONFIRMED FOR c.1,250 FTE
2018 Additional Plan
CUMULATIVE
HEADCOUNT REDUCTION
(FTE)
RUN RATE c.1,250 FTE
2017 Redundancy Plan
YEARLY COSTS (€mn) 60 45 50 c.165mn* TOTAL COST
(*) Including residual costs related to 2020
>900
2017 2018 2019E
450
900
>1,200
800 >1,100
100
100
CUMULATIVE SAVINGS (€mn) 20 60 90 c.105mn RUN RATE SAVINGS
Achieved
Achieved