Embed Size (px)
Citation preview

2018 Global M&A OutlookNavigating consolidation and disruption
JANUARY 2018
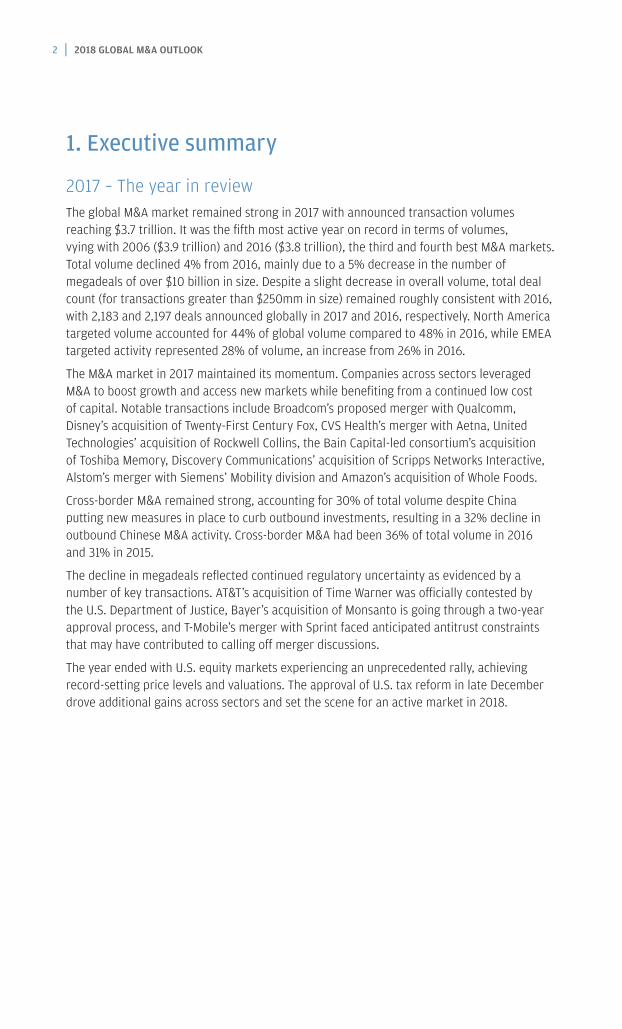
Published by J.P. Morgan’s M&A team in January 2018
Global
Hernan Cristerna Global Co-Head of M&A E: [email protected] T: +44 20 7134 4631
Kurt Simon Global Chairman of M&A E: [email protected] T: +1 212 622 9882
Chris Ventresca Global Co-Head of M&A E: [email protected] T: +1 212 622 2228
North America
Anu Aiyengar Regional Head of M&A E: [email protected] T: +1 212 622 2260
Europe, Middle East and Africa
Dirk Albersmeier Regional Co-Head of M&A E: [email protected] T: +44 20 7742 4461
David Lomer Regional Co-Head of M&A E: [email protected] T: +44 20 7134 9798
Asia Pacific
Rohit Chatterji Regional Co-Head of M&A E: [email protected] T: +65 6882 2638
Kerwin Clayton Regional Co-Head of M&A E: [email protected] T: +852 2800 6555
Latin America
Ignacio Benito Regional Head of M&A E: [email protected] T: +1 212 622 2459
2018 GLOBAL M&A OUTLOOK | 1
Contents1. Executive summary 2
2017 – The year in review 2
2018 – The year ahead 4
2. Investor confidence will continue fueling M&A activity 5
Major U.S. stock indices achieved record valuations during 2017 5
Consolidation themes / sectors 6
3. Disruption continues to drive M&A 8
Cross-sector activity increases 9
4. Regulatory challenges 11
U.S. tax reform – A new reality 11
Withdrawn deals 12
Brexit: Myth vs. reality – What actually happened? 14
Emergence of new pan-European champions 15
5. M&A without borders: Cross-border activity broadens 17
APAC activity update 17
Update on China outbound M&A activity and regulations 18
Key themes in Japanese M&A market 20
Strong increase in APAC private equity activity 23
6. Activism update 25
Activists posted a solid 2017 following a challenging 2016 25
The return of large-cap activism 25
The convergence of activism and M&A 26
Institutional investors focusing on new concerns 26
Globalization continues, more aggressively than ever 27
7. About J.P. Morgan M&A Advisory 28
8. Select J.P. Morgan-advised transactions in 2017 29
Please note: Use of this material is subject to the important disclaimers set out on the inside back cover.
2 | 2018 GLOBAL M&A OUTLOOK
1. Executive summary
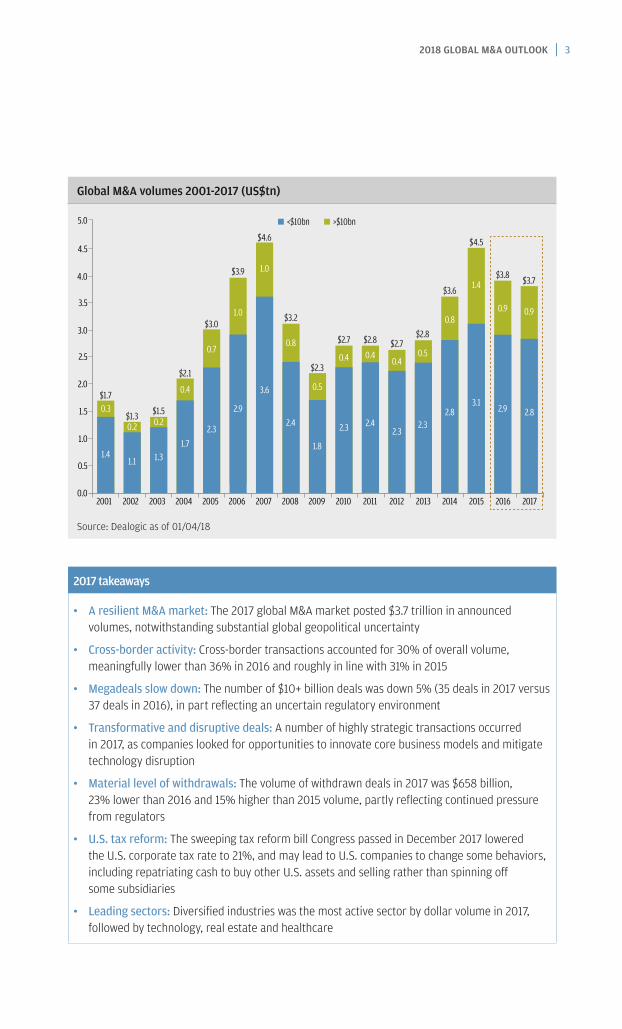
2017 – The year in reviewThe global M&A market remained strong in 2017 with announced transaction volumes reaching $3.7 trillion. It was the fifth most active year on record in terms of volumes, vying with 2006 ($3.9 trillion) and 2016 ($3.8 trillion), the third and fourth best M&A markets. Total volume declined 4% from 2016, mainly due to a 5% decrease in the number of megadeals of over $10 billion in size. Despite a slight decrease in overall volume, total deal count (for transactions greater than $250mm in size) remained roughly consistent with 2016, with 2,183 and 2,197 deals announced globally in 2017 and 2016, respectively. North America targeted volume accounted for 44% of global volume compared to 48% in 2016, while EMEA targeted activity represented 28% of volume, an increase from 26% in 2016.
The M&A market in 2017 maintained its momentum. Companies across sectors leveraged M&A to boost growth and access new markets while benefiting from a continued low cost of capital. Notable transactions include Broadcom’s proposed merger with Qualcomm, Disney’s acquisition of Twenty-First Century Fox, CVS Health’s merger with Aetna, United Technologies’ acquisition of Rockwell Collins, the Bain Capital-led consortium’s acquisition of Toshiba Memory, Discovery Communications’ acquisition of Scripps Networks Interactive, Alstom’s merger with Siemens’ Mobility division and Amazon’s acquisition of Whole Foods.
Cross-border M&A remained strong, accounting for 30% of total volume despite China putting new measures in place to curb outbound investments, resulting in a 32% decline in outbound Chinese M&A activity. Cross-border M&A had been 36% of total volume in 2016 and 31% in 2015.
The decline in megadeals reflected continued regulatory uncertainty as evidenced by a number of key transactions. AT&T’s acquisition of Time Warner was officially contested by the U.S. Department of Justice, Bayer’s acquisition of Monsanto is going through a two-year approval process, and T-Mobile’s merger with Sprint faced anticipated antitrust constraints that may have contributed to calling off merger discussions.
The year ended with U.S. equity markets experiencing an unprecedented rally, achieving record-setting price levels and valuations. The approval of U.S. tax reform in late December drove additional gains across sectors and set the scene for an active market in 2018.
2018 GLOBAL M&A OUTLOOK | 3
Global M&A volumes 2001-2017 (US$tn)
5.0
$1.70.3
1.4
$1.30.2
1.1
$1.50.2
1.3
$2.1
0.4
1.7
$3.0
0.7
2.3
$4.6
1.0
3.6
$3.9
1.0
2.9
$3.2
0.8
2.4
$2.3
0.5
1.8
$2.8
0.4
2.4
$2.7
0.4
2.3
$2.7
0.4
2.3
$2.8
0.5
2.3
$3.6
0.8
2.8
$4.5
1.4
3.1
$3.8
0.9
2.9
$3.7
0.9
4.0
3.5
2001 2002 2003 2004 2005 2006 2007 2008 2009 2010 2017201620152014201320122011
2.5
2.0
0.5
0.0
4.5
3.0
1.0
1.5
<$10bn >$10bn
2.8
Source: Dealogic as of 01/04/18
2017 takeaways
• A resilient M&A market: The 2017 global M&A market posted $3.7 trillion in announced volumes, notwithstanding substantial global geopolitical uncertainty
• Cross-border activity: Cross-border transactions accounted for 30% of overall volume, meaningfully lower than 36% in 2016 and roughly in line with 31% in 2015
• Megadeals slow down: The number of $10+ billion deals was down 5% (35 deals in 2017 versus 37 deals in 2016), in part reflecting an uncertain regulatory environment
• Transformative and disruptive deals: A number of highly strategic transactions occurred in 2017, as companies looked for opportunities to innovate core business models and mitigate technology disruption
• Material level of withdrawals: The volume of withdrawn deals in 2017 was $658 billion, 23% lower than 2016 and 15% higher than 2015 volume, partly reflecting continued pressure from regulators
• U.S. tax reform: The sweeping tax reform bill Congress passed in December 2017 lowered the U.S. corporate tax rate to 21%, and may lead to U.S. companies to change some behaviors, including repatriating cash to buy other U.S. assets and selling rather than spinning off some subsidiaries
• Leading sectors: Diversified industries was the most active sector by dollar volume in 2017, followed by technology, real estate and healthcare
4 | 2018 GLOBAL M&A OUTLOOK
2018 – The year aheadWe expect solid GDP growth in all major economies and healthy equity and debt markets to continue to provide companies with confidence to pursue innovative and transformative M&A transactions. Shareholders have demonstrated receptivity to smart and synergistic strategic deals, motivating boards to look for initiatives to bolster a modest organic growth outlook and drive shareholder value.
The rate of technology-driven changes will continue to accelerate and disrupt industries. M&A will be instrumental as companies look to acquire technologies, capabilities and scale needed to differentiate and compete.
At the same time, U.S. companies are expecting more clarity on potentially pro-business policy changes and are focusing more on long-term fundamentals. While several aspects of U.S. regulatory reform remain open, opportunities from the passing of U.S. tax reform are expected to positively impact M&A activity.
Alongside regulatory uncertainty, the greatest threat to M&A activity is equity market valuations, which ended 2017 at all-time highs. Investors continue to be very focused on the risk of overpaying for assets. The likely result is a larger stock component in deal offerings to bring some balance to valuations.
In addition, we expect increased activity from private equity funds, which, notwithstanding a record $1.0 trillion in “dry powder” capital available for investment purposes, did not feature prominently in the 2017 M&A market. These funds are likely to come under pressure to deploy their substantial available capital in the months ahead. This pressure will likely be partially offset by the impact of tax reform, given the limitations on interest tax deductibility.
2018 key themes
• Active M&A environment continues: We expect strong deal volume in 2018 as companies continue to look for opportunities to bolster modest organic growth
• Sector consolidation: Continued sector consolidation fueled by strong equity currency
• Disruption driving M&A: Rate of technological change accelerates disruption across sectors and drives cross-sector M&A
• Regulatory and geopolitical challenges will remain: Efforts by the U.S. Department of Justice to block AT&T’s acquisition of Time Warner, coupled with increasing scrutiny around Chinese investments in the U.S., demonstrates that the regulatory environment may remain challenging
• U.S. tax reform: U.S. companies will benefit from a lower tax rate and the ability to repatriate cash to the U.S.
• Private equity activity: Private equity funds will actively be seeking to deploy capital
• Return of activism: The resurgence of shareholder activism, particularly from campaigns targeting large-cap companies and those outside of North America
2018 GLOBAL M&A OUTLOOK | 5
2. Investor confidence will continue fueling M&A activity
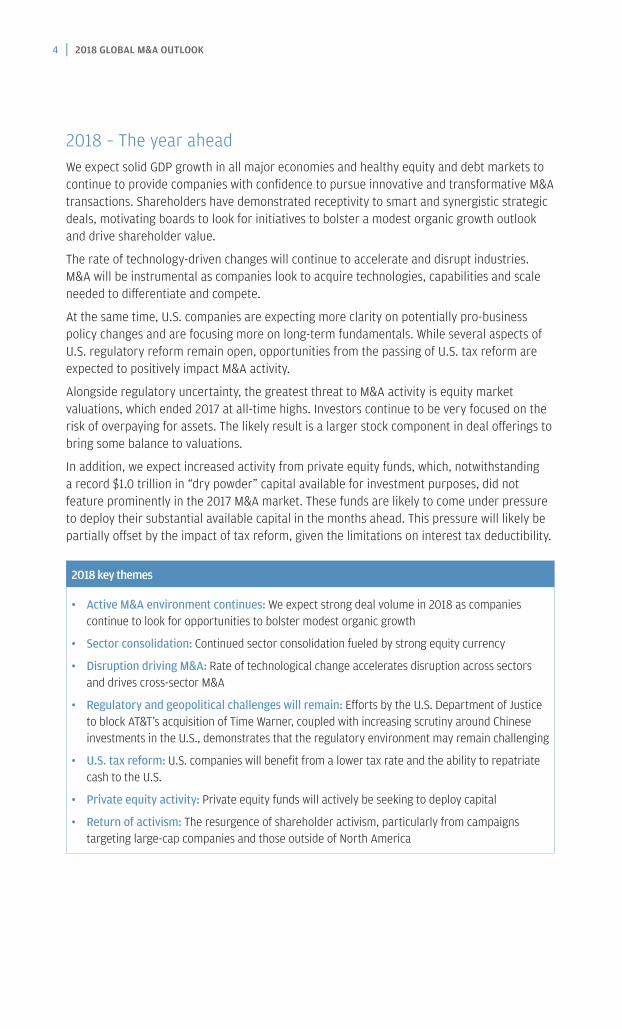
Over the course of 2017, the second longest bull market in U.S. history steadily continued its march upward, with major indices repeatedly reaching all-time highs. Since March 9, 2009, major equity indices have risen substantially, with strong performances throughout 2017 including: Dow Jones +25%, S&P 500 +19% and Nasdaq +28%. Concurrently, market volatility decreased to historic lows during 2017, with the VIX reaching an all-time low of 9.19 on October 5. The confluence of these factors, strong and rising valuations and depressed volatility, has served as a constructive backdrop to strategic M&A around the globe.
Major U.S. stock indices achieved record valuations during 2017Throughout 2017, equities across industries in the U.S. performed exceedingly well, with nine out of ten sectors achieving positive returns. Strong stock price performance was principally driven by several factors:
• Strong corporate earnings growth across sectors, with every sector apart from energy generating positive returns
• Historically low interest rates, despite increases by the Federal Reserve Board in March, June and December
• Strengthening economy driven by an unemployment rate of 4.1% in December (the lowest rate in 17 years) and an improving GDP growth backdrop (Q1: 1.2%, Q2: 3.1%, Q3: 3.0% and estimated 2.8% for Q4 to be reported in January 2018)
• Increasing consumer and business confidence: University of Michigan Index of Consumer Sentiment hit its highest level in December 2017 since January of 2004
Performance of U.S. equity indices (price re-based to 100)
Dec 2016 Mar 2017 Jun 2017 Sep 2017
135
28.2%25.1%
19.4%
12.0%
130
125
120
115
95
100
105
110
90Dec 2017
Dow JonesS&P 500 NASDAQ Russell 2000
Source: FactSet as of 12/31/17
6 | 2018 GLOBAL M&A OUTLOOK
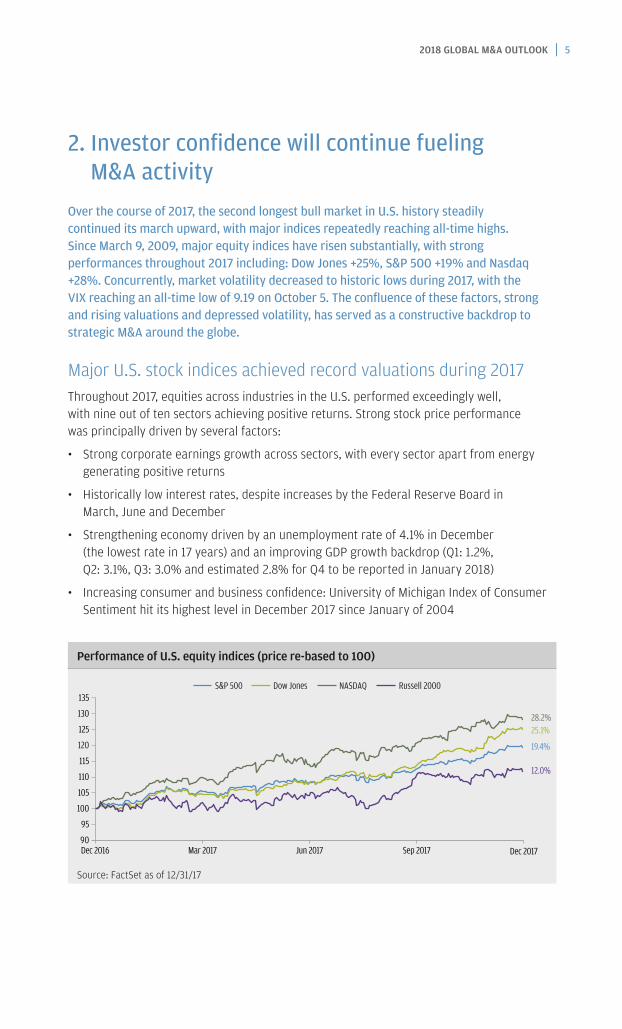
Key index metrics
S&P 500 Dow Jones NASDAQ Russell 2000
# of all-time highs in 2017 62 71 72 31
Current NTM P/E 18.2x 18.2x 22.5x 24.2x
% growth over NTM P/E as of 12/31/16 8.5% 10.6% 12.6% 2.7%
Source: FactSet as of 12/31/17
Summary of S&P 500 sector performance
Consumer Disc.
Consumer Staples
Energy Financials Healthcare Industrials Info Tech Materials Real Estate
Utilities
Index return since 12/31/16 13% 2% (10%) 14% 18% 13% 35% 18% 5% 13%
Current NTM P/E 21.8x 20.0x 25.7x 14.6x 16.6x 19.6x 18.7x 18.3x 17.9x 17.4x
% growth over NTM P/E as of 12/31/16 17% 5% (22%) 6% 14% 9% 16% 10% 3% 2%
Source: FactSet as of 12/31/17
Consolidation themes / sectorsIn 2017, strategic acquirors drove 78% of M&A deals, in line with 79% in 2016. Strategics focused on sector consolidating, highly synergistic (revenue and cost) transactions. Key consolidation transactions are detailed in the table below:
Key consolidation transactions announced in 2017
Sector Ann. date Acquiror Target Consideration Deal size (US$bn)
Consumer/Retail 01/16/17 Essilor International Luxottica Group Stock 25.6
02/02/17 Mead Johnson Nutrition Reckitt Benckiser Cash 17.9
04/05/17 JAB Holdings* Panera Bread Cash 7.5
04/25/17 LVMH Moet Hennessy Louis Vuitton
Christian Dior Couture Cash 7.1
05/08/17 Coach Kate Spade Cash 2.4
07/25/17 Michael Kors* Jimmy Choo Cash 1.4
Financial Institutions 03/06/17 Standard Life Aberdeen Asset Management* Stock 5.0
02/14/17 SoftBank Group* Fortress Investment Group Cash 3.3
Healthcare 01/27/17 Johnson & Johnson Actelion Cash 31.4
04/23/17 Becton Dickinson CR Bard Mixed 25.5
08/28/17 Gilead Sciences Kite Pharmaceuticals Cash 11.9
04/18/17 Cardinal Health Medtronic (Medical supplies business)*
Cash 6.1
01/09/17 Takeda Pharmaceuticals Ariad Pharmaceuticals* Cash 5.7
10/17/17 Impax Laboratories Amneal Pharmaceuticals* Stock 5.5
Industrials 10/18/17 Hochtief* Abertis Infrastructure Mixed 41.7
09/04/17 United Technologies Rockwell Collins* Mixed 30.1
09/18/17 Northrop Grumman Orbital ATK Cash 9.5
09/26/17 Siemens Alstom* Stock 8.7
2018 GLOBAL M&A OUTLOOK | 7
Key consolidation transactions announced in 2017 (cont.)Sector Ann. date Acquiror Target Consideration Deal size (US$bn)
Media & Communications
12/14/17 Disney* 21st Century Fox Stock 69.0
07/31/17 Discovery Scripps* Mixed 14.8
07/18/17 Crown Castle International Light Tower Fiber* Cash 7.1
05/08/17 Sinclair Broadcast Group* Tribune Media Mixed 6.6
05/15/17 Moody’s Bureau van Dijk Electronic Publishing*
Cash 3.3
04/08/17 Liberty Interactive* General Communication Stock 2.7
Oil and Gas 03/29/17 Cenovus Energy* ConocoPhillips (FCCL Partnership)
Mixed 12.5
06/19/17 EQT Rice Energy Mixed 8.7
Power/Utilities 08/21/17 Sempra Energy Future Holdings Cash 18.8
10/30/17 Vistra Energy Dynergy Stock 10.7
07/10/17 Great Plains Westar Energy Stock 9.71
01/25/17 AltaGas* WGL Holdings Cash 6.6
07/19/17 Hydro One Avista Cash 5.3
10/16/17 South Jersey Industries Elizabethtown Gas and Elkton Gas
Cash 1.7
Real Estate 10/30/17 Lennar CalAtlantic Group* Mixed 9.5
08/10/17 Invitation Homes* Starwood Waypoint Homes Stock 8.4
Technology 11/06/17 Broadcom* Qualcomm Mixed 130.3
07/04/17 Vantiv Worldpay Group Mixed 13.7
11/20/17 Marvell Technology Cavium* Mixed 6.7
11/30/17 Altran Technologies Aricent* Cash 2.0
07/13/17 Yandex.Taxi* Uber (Russian operations) Cash 1.4
Source: Dealogic as of 01/04/18 * J.P. Morgan served as financial advisor 1 Renegotiated, all stock MOE transaction after the original deal, which was announced on 05/29/16
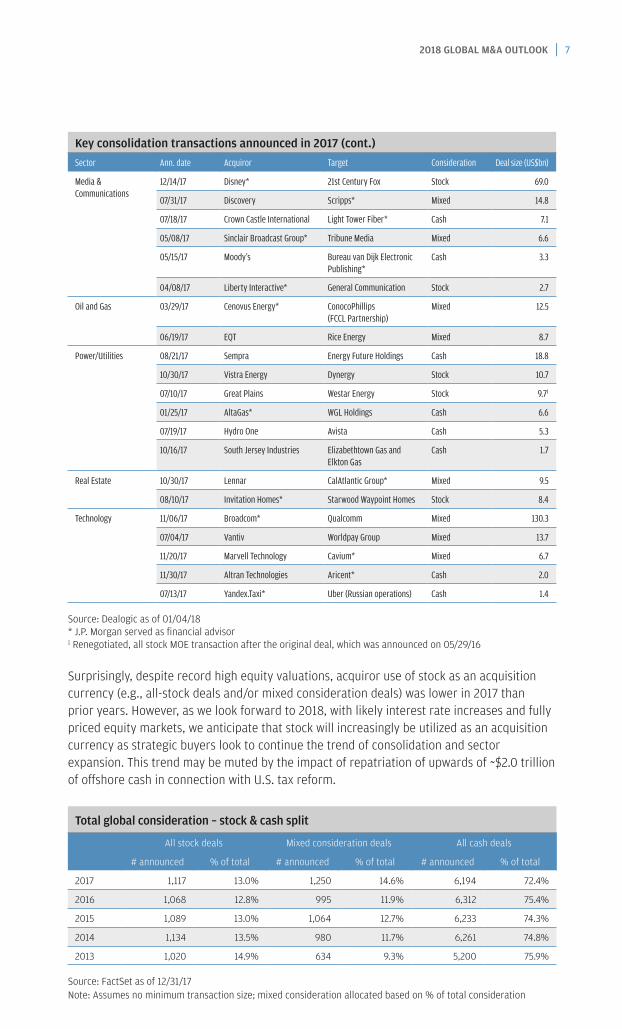
Surprisingly, despite record high equity valuations, acquiror use of stock as an acquisition currency (e.g., all-stock deals and/or mixed consideration deals) was lower in 2017 than prior years. However, as we look forward to 2018, with likely interest rate increases and fully priced equity markets, we anticipate that stock will increasingly be utilized as an acquisition currency as strategic buyers look to continue the trend of consolidation and sector expansion. This trend may be muted by the impact of repatriation of upwards of ~$2.0 trillion of offshore cash in connection with U.S. tax reform.
Total global consideration – stock & cash split
All stock deals Mixed consideration deals All cash deals
# announced % of total # announced % of total # announced % of total
2017 1,117 13.0% 1,250 14.6% 6,194 72.4%
2016 1,068 12.8% 995 11.9% 6,312 75.4%
2015 1,089 13.0% 1,064 12.7% 6,233 74.3%
2014 1,134 13.5% 980 11.7% 6,261 74.8%
2013 1,020 14.9% 634 9.3% 5,200 75.9%
Source: FactSet as of 12/31/17 Note: Assumes no minimum transaction size; mixed consideration allocated based on % of total consideration
8 | 2018 GLOBAL M&A OUTLOOK
3. Disruption continues to drive M&A
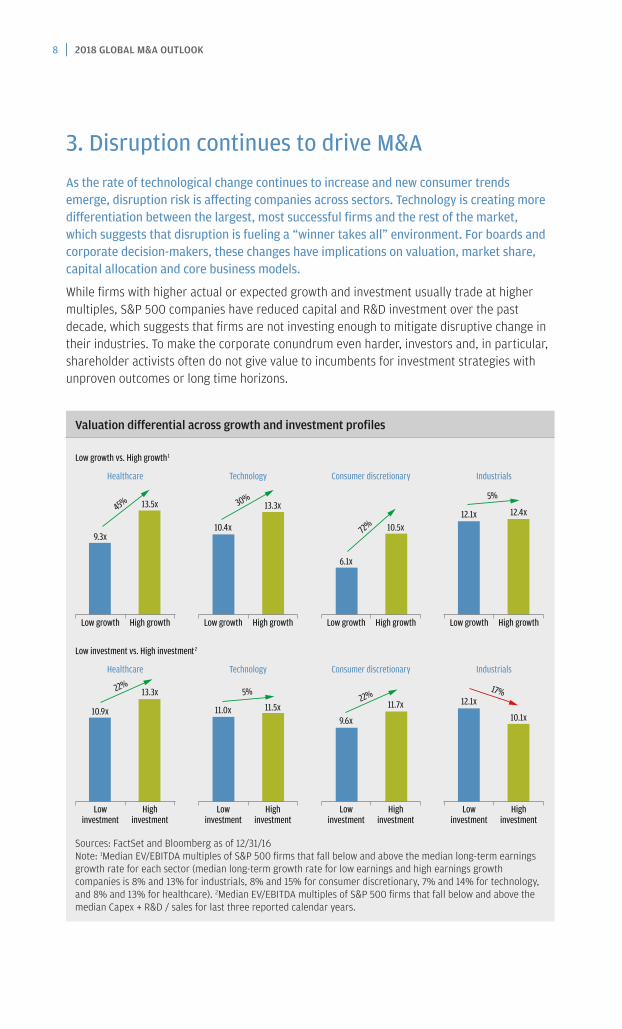
As the rate of technological change continues to increase and new consumer trends emerge, disruption risk is affecting companies across sectors. Technology is creating more differentiation between the largest, most successful firms and the rest of the market, which suggests that disruption is fueling a “winner takes all” environment. For boards and corporate decision-makers, these changes have implications on valuation, market share, capital allocation and core business models.
While firms with higher actual or expected growth and investment usually trade at higher multiples, S&P 500 companies have reduced capital and R&D investment over the past decade, which suggests that firms are not investing enough to mitigate disruptive change in their industries. To make the corporate conundrum even harder, investors and, in particular, shareholder activists often do not give value to incumbents for investment strategies with unproven outcomes or long time horizons.
Valuation differential across growth and investment profiles
High growthLow growth
Healthcare
9.3x
13.5x
High growthLow growth
Technology
10.4x
13.3x
High growthLow growth
Consumer discretionary
6.1x
10.5x
High growth
Low growth vs. High growth1
Low growth
Industrials
Healthcare Technology Consumer discretionary
Low investment vs. High investment2
Industrials
12.1x 12.4x
Highinvestment
Lowinvestment
10.9x
13.3x
Highinvestment
Lowinvestment
11.0x 11.5x
Highinvestment
Lowinvestment
9.6x
11.7x
Highinvestment
Lowinvestment
12.1x
10.1x
45% 30%
72%
5%
5%22%22%
17%
Sources: FactSet and Bloomberg as of 12/31/16 Note: 1Median EV/EBITDA multiples of S&P 500 firms that fall below and above the median long-term earnings growth rate for each sector (median long-term growth rate for low earnings and high earnings growth companies is 8% and 13% for industrials, 8% and 15% for consumer discretionary, 7% and 14% for technology, and 8% and 13% for healthcare). 2Median EV/EBITDA multiples of S&P 500 firms that fall below and above the median Capex + R&D / sales for last three reported calendar years.
2018 GLOBAL M&A OUTLOOK | 9
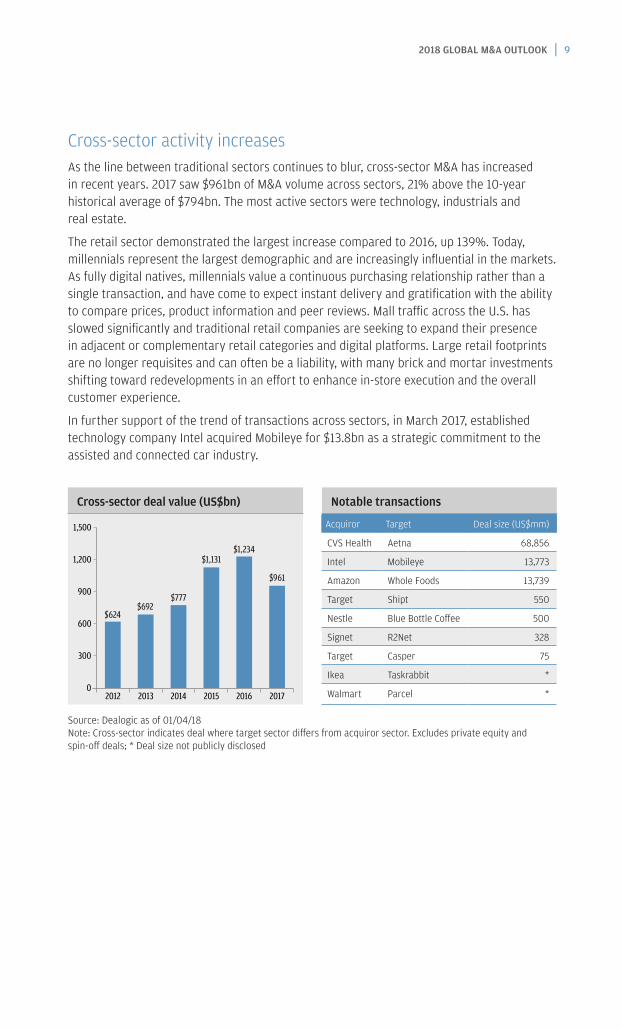
Cross-sector activity increasesAs the line between traditional sectors continues to blur, cross-sector M&A has increased in recent years. 2017 saw $961bn of M&A volume across sectors, 21% above the 10-year historical average of $794bn. The most active sectors were technology, industrials and real estate.
The retail sector demonstrated the largest increase compared to 2016, up 139%. Today, millennials represent the largest demographic and are increasingly influential in the markets. As fully digital natives, millennials value a continuous purchasing relationship rather than a single transaction, and have come to expect instant delivery and gratification with the ability to compare prices, product information and peer reviews. Mall traffic across the U.S. has slowed significantly and traditional retail companies are seeking to expand their presence in adjacent or complementary retail categories and digital platforms. Large retail footprints are no longer requisites and can often be a liability, with many brick and mortar investments shifting toward redevelopments in an effort to enhance in-store execution and the overall customer experience.
In further support of the trend of transactions across sectors, in March 2017, established technology company Intel acquired Mobileye for $13.8bn as a strategic commitment to the assisted and connected car industry.
Cross-sector deal value (US$bn) Notable transactions
201420132012 2015 2016 2017
$624$692
$777
$1,131$1,234
$961
300
0
600
900
1,200
1,500 Acquiror Target Deal size (US$mm)
CVS Health Aetna 68,856
Intel Mobileye 13,773
Amazon Whole Foods 13,739
Target Shipt 550
Nestle Blue Bottle Coffee 500
Signet R2Net 328
Target Casper 75
Ikea Taskrabbit *
Walmart Parcel *
Source: Dealogic as of 01/04/18 Note: Cross-sector indicates deal where target sector differs from acquiror sector. Excludes private equity and spin-off deals; * Deal size not publicly disclosed
10 | 2018 GLOBAL M&A OUTLOOK
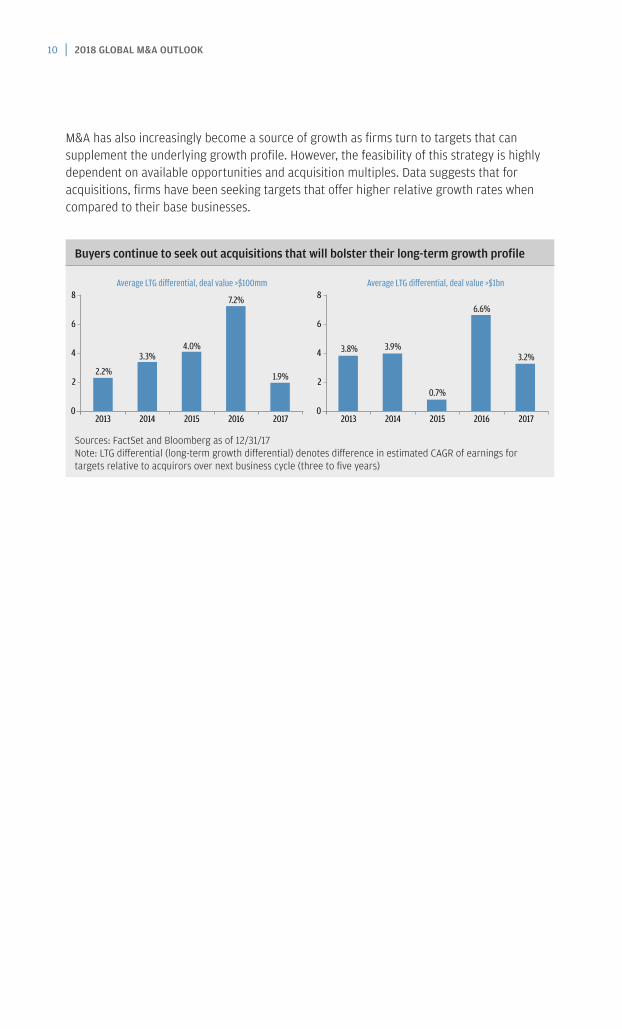
M&A has also increasingly become a source of growth as firms turn to targets that can supplement the underlying growth profile. However, the feasibility of this strategy is highly dependent on available opportunities and acquisition multiples. Data suggests that for acquisitions, firms have been seeking targets that offer higher relative growth rates when compared to their base businesses.
Buyers continue to seek out acquisitions that will bolster their long-term growth profile
2013 2014 2015 2016 2017
Average LTG di�erential, deal value >$100mm
2.2%
7.2%
4.0%3.3%
1.9%
Average LTG di�erential, deal value >$1bn
0
8
6
4
2
2013 2014 2015 2016 2017
3.8%
6.6%
0.7%
3.9%3.2%
0
8
6
4
2
Sources: FactSet and Bloomberg as of 12/31/17 Note: LTG differential (long-term growth differential) denotes difference in estimated CAGR of earnings for targets relative to acquirors over next business cycle (three to five years)
10 | 2018 GLOBAL M&A OUTLOOK 2018 GLOBAL M&A OUTLOOK | 11
4. Regulatory challenges
U.S. tax reform – A new reality At the end of 2017, the Tax Cuts and Jobs Act (i.e., tax reform bill) was passed into legislation, with sweeping implications for U.S. corporations. The tax bill was designed in large part to make U.S. corporations more competitive and, accordingly, contains a number of significant changes including (but not limited to) a lower corporate tax rate, a shift toward a form of a territorial tax system (i.e., tax-free dividends from foreign subsidiaries) accompanied by a one-time transition tax on repatriated foreign earnings and the implementation of certain revenue-raising provisions (such as limitations on interest deductibility and anti-base erosion measures). All of these changes raise several important questions as companies consider M&A opportunities:
1. How does tax reform affect corporate valuations?
Broadly speaking, most U.S. companies should benefit from tax reform legislation. The lower corporate tax rate is intended to outweigh any increase in taxes resulting from elimination of certain tax deductions. Increased earnings and cash flow are expected to result, benefitting high tax-paying, U.S.-weighted businesses the most. However, certain firms could be adversely impacted, particularly in industries where payments to foreign affiliates (e.g., IP royalties) would be subject to additional U.S. anti-base erosion taxes.
2. How does tax reform affect firepower for M&A?
Access to current offshore cash following the mandatory transition tax on un-repatriated earnings, as well as ongoing access to foreign profits without incremental U.S. tax, should immediately increase cash balances on the whole and acquisition firepower for most U.S. incorporated multinationals.
3. How will limitations on interest deductibility affect the M&A landscape?
New tax rules limit interest deductibility to 30% of U.S. EBITDA from years 2018-21, and to 30% of U.S. EBIT for years thereafter, with carryforwards for unused interest. Firms that will be most heavily impacted are those with significant non-U.S. operations (and therefore a lower proportion of U.S. EBITDA/EBIT) and highly leveraged companies, such as sponsor-backed portfolio companies. In a competitive bidding process, this would result (at times) in a disadvantage for financial sponsors relative to strategic bidders due to the reliance on highly leveraged capital structures. Coupled with the lower tax shield resulting from a 21% corporate tax rate, the interest deductibility limitations could impact cash/stock consideration mixes or result in greater benefits for utilizing alternate sources of capital (e.g., preferred equity).
12 | 2018 GLOBAL M&A OUTLOOK
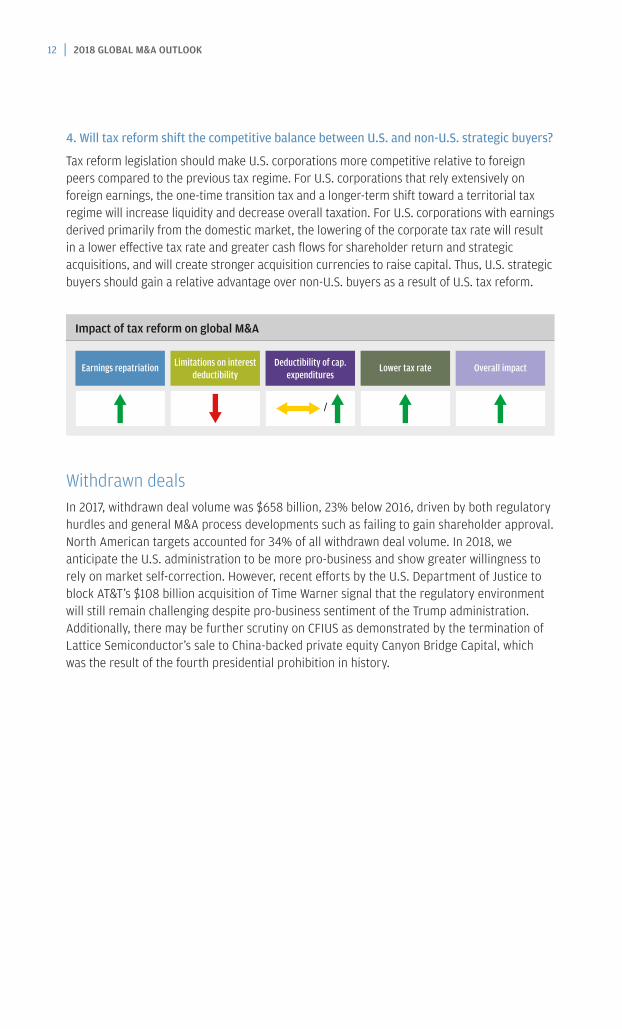
4. Will tax reform shift the competitive balance between U.S. and non-U.S. strategic buyers?
Tax reform legislation should make U.S. corporations more competitive relative to foreign peers compared to the previous tax regime. For U.S. corporations that rely extensively on foreign earnings, the one-time transition tax and a longer-term shift toward a territorial tax regime will increase liquidity and decrease overall taxation. For U.S. corporations with earnings derived primarily from the domestic market, the lowering of the corporate tax rate will result in a lower effective tax rate and greater cash flows for shareholder return and strategic acquisitions, and will create stronger acquisition currencies to raise capital. Thus, U.S. strategic buyers should gain a relative advantage over non-U.S. buyers as a result of U.S. tax reform.
Impact of tax reform on global M&A
Earnings repatriation Limitations on interest deductibility
Deductibility of cap. expenditures
/
Lower tax rate Overall impact
Withdrawn dealsIn 2017, withdrawn deal volume was $658 billion, 23% below 2016, driven by both regulatory hurdles and general M&A process developments such as failing to gain shareholder approval. North American targets accounted for 34% of all withdrawn deal volume. In 2018, we anticipate the U.S. administration to be more pro-business and show greater willingness to rely on market self-correction. However, recent efforts by the U.S. Department of Justice to block AT&T’s $108 billion acquisition of Time Warner signal that the regulatory environment will still remain challenging despite pro-business sentiment of the Trump administration. Additionally, there may be further scrutiny on CFIUS as demonstrated by the termination of Lattice Semiconductor’s sale to China-backed private equity Canyon Bridge Capital, which was the result of the fourth presidential prohibition in history.
12 | 2018 GLOBAL M&A OUTLOOK 2018 GLOBAL M&A OUTLOOK | 13
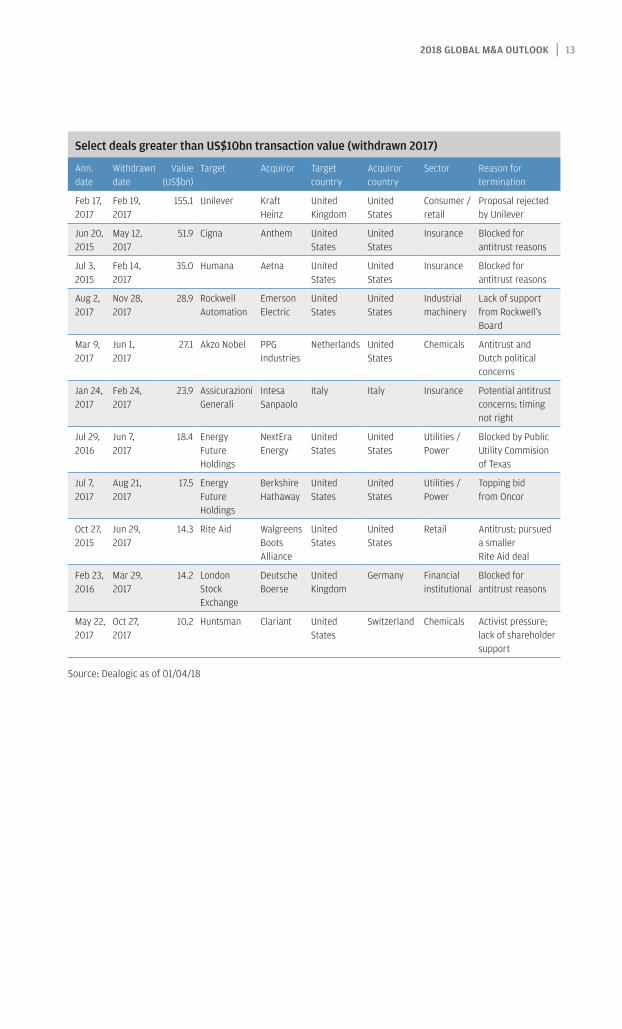
Select deals greater than US$10bn transaction value (withdrawn 2017)
Ann. date
Withdrawn date
Value (US$bn)
Target Acquiror Target country
Acquiror country
Sector Reason for termination
Feb 17, 2017
Feb 19, 2017
155.1 Unilever Kraft Heinz
United Kingdom
United States
Consumer / retail
Proposal rejected by Unilever
Jun 20, 2015
May 12, 2017
51.9 Cigna Anthem United States
United States
Insurance Blocked for antitrust reasons
Jul 3, 2015
Feb 14, 2017
35.0 Humana Aetna United States
United States
Insurance Blocked for antitrust reasons
Aug 2, 2017
Nov 28, 2017
28.9 Rockwell Automation
Emerson Electric
United States
United States
Industrial machinery
Lack of support from Rockwell’s Board
Mar 9, 2017
Jun 1, 2017
27.1 Akzo Nobel PPG Industries
Netherlands United States
Chemicals Antitrust and Dutch political concerns
Jan 24, 2017
Feb 24, 2017
23.9 Assicurazioni Generali
Intesa Sanpaolo
Italy Italy Insurance Potential antitrust concerns; timing not right
Jul 29, 2016
Jun 7, 2017
18.4 Energy Future Holdings
NextEra Energy
United States
United States
Utilities / Power
Blocked by Public Utility Commision of Texas
Jul 7, 2017
Aug 21, 2017
17.5 Energy Future Holdings
Berkshire Hathaway
United States
United States
Utilities / Power
Topping bid from Oncor
Oct 27, 2015
Jun 29, 2017
14.3 Rite Aid Walgreens Boots Alliance
United States
United States
Retail Antitrust; pursued a smaller Rite Aid deal
Feb 23, 2016
Mar 29, 2017
14.2 London Stock Exchange
Deutsche Boerse
United Kingdom
Germany Financial institutional
Blocked for antitrust reasons
May 22, 2017
Oct 27, 2017
10.2 Huntsman Clariant United States
Switzerland Chemicals Activist pressure; lack of shareholder support
Source: Dealogic as of 01/04/18
14 | 2018 GLOBAL M&A OUTLOOK
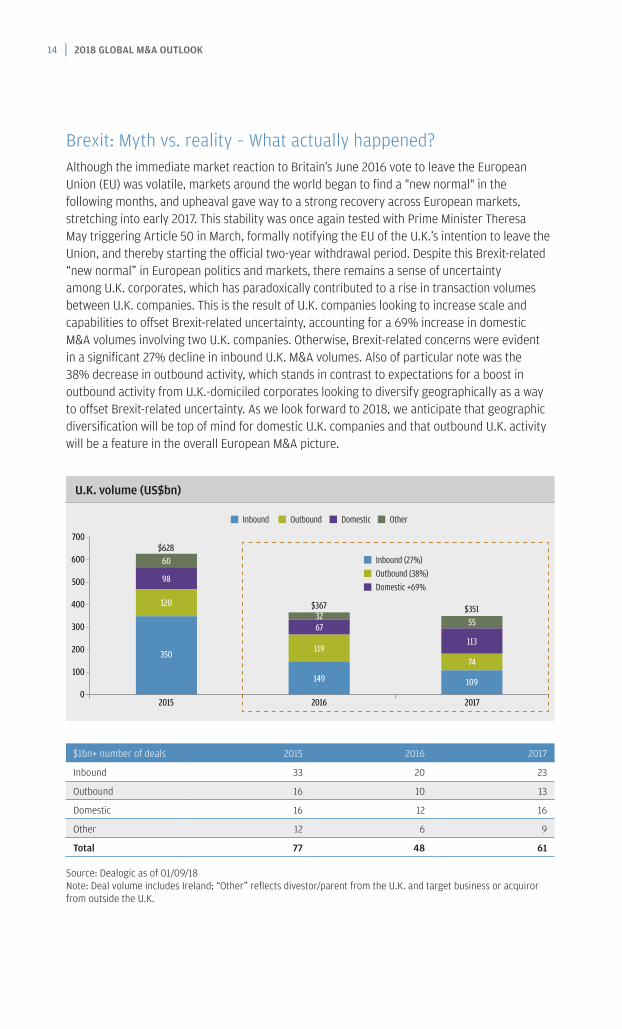
Brexit: Myth vs. reality – What actually happened? Although the immediate market reaction to Britain’s June 2016 vote to leave the European Union (EU) was volatile, markets around the world began to find a "new normal" in the following months, and upheaval gave way to a strong recovery across European markets, stretching into early 2017. This stability was once again tested with Prime Minister Theresa May triggering Article 50 in March, formally notifying the EU of the U.K.’s intention to leave the Union, and thereby starting the official two-year withdrawal period. Despite this Brexit-related “new normal” in European politics and markets, there remains a sense of uncertainty among U.K. corporates, which has paradoxically contributed to a rise in transaction volumes between U.K. companies. This is the result of U.K. companies looking to increase scale and capabilities to offset Brexit-related uncertainty, accounting for a 69% increase in domestic M&A volumes involving two U.K. companies. Otherwise, Brexit-related concerns were evident in a significant 27% decline in inbound U.K. M&A volumes. Also of particular note was the 38% decrease in outbound activity, which stands in contrast to expectations for a boost in outbound activity from U.K.-domiciled corporates looking to diversify geographically as a way to offset Brexit-related uncertainty. As we look forward to 2018, we anticipate that geographic diversification will be top of mind for domestic U.K. companies and that outbound U.K. activity will be a feature in the overall European M&A picture.
U.K. volume (US$bn)
2015 2016 2017
OutboundInbound Domestic Other
Outbound (38%)Inbound (27%)
Domestic +69%
$62860
98
120
350
$3673267
119
149
$35155
113
74
109
200
0
400
300
100
500
600
700
$1bn+ number of deals 2015 2016 2017
Inbound 33 20 23
Outbound 16 10 13
Domestic 16 12 16
Other 12 6 9
Total 77 48 61
Source: Dealogic as of 01/09/18 Note: Deal volume includes Ireland; “Other” reflects divestor/parent from the U.K. and target business or acquiror from outside the U.K.
14 | 2018 GLOBAL M&A OUTLOOK 2018 GLOBAL M&A OUTLOOK | 15
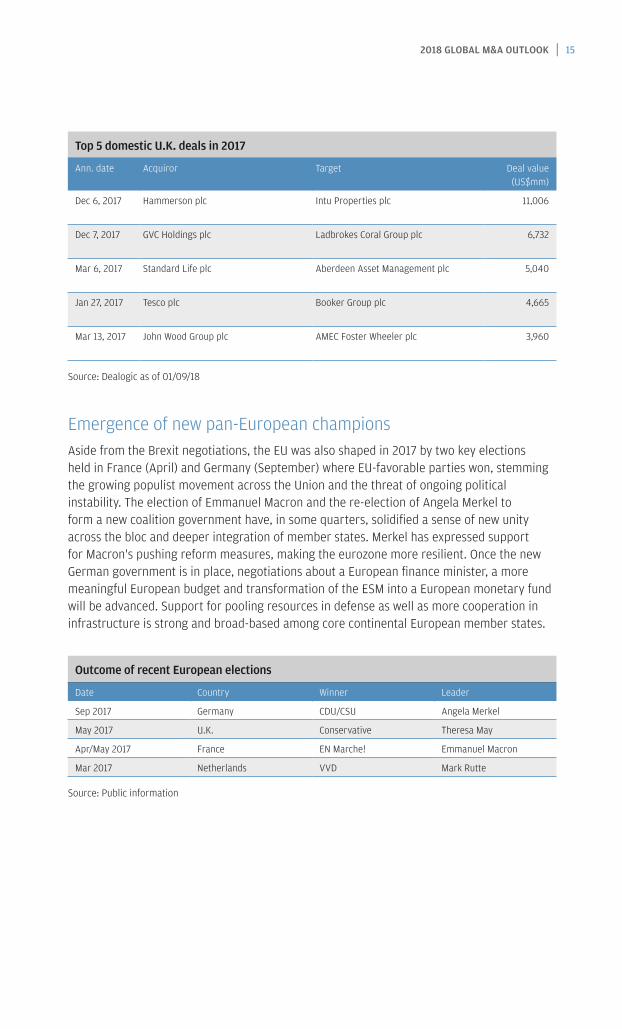
Top 5 domestic U.K. deals in 2017
Ann. date Acquiror Target Deal value (US$mm)
Dec 6, 2017 Hammerson plc Intu Properties plc 11,006
Dec 7, 2017 GVC Holdings plc Ladbrokes Coral Group plc 6,732
Mar 6, 2017 Standard Life plc Aberdeen Asset Management plc 5,040
Jan 27, 2017 Tesco plc Booker Group plc 4,665
Mar 13, 2017 John Wood Group plc AMEC Foster Wheeler plc 3,960
Source: Dealogic as of 01/09/18
Emergence of new pan-European champions Aside from the Brexit negotiations, the EU was also shaped in 2017 by two key elections held in France (April) and Germany (September) where EU-favorable parties won, stemming the growing populist movement across the Union and the threat of ongoing political instability. The election of Emmanuel Macron and the re-election of Angela Merkel to form a new coalition government have, in some quarters, solidified a sense of new unity across the bloc and deeper integration of member states. Merkel has expressed support for Macron's pushing reform measures, making the eurozone more resilient. Once the new German government is in place, negotiations about a European finance minister, a more meaningful European budget and transformation of the ESM into a European monetary fund will be advanced. Support for pooling resources in defense as well as more cooperation in infrastructure is strong and broad-based among core continental European member states.
Outcome of recent European elections
Date Country Winner Leader
Sep 2017 Germany CDU/CSU Angela Merkel
May 2017 U.K. Conservative Theresa May
Apr/May 2017 France EN Marche! Emmanuel Macron
Mar 2017 Netherlands VVD Mark Rutte
Source: Public information
16 | 2018 GLOBAL M&A OUTLOOK
France has adopted a pro-business policy, favoring the emergence of European regional champions and privileging the end result from an industrial standpoint rather than optics of control over sovereign assets and protectionism. The Alstom and Siemens Mobility transaction is a good example of this mindset. While the combined group will remain listed in France, its CEO will be French and the group made a number of undertakings to France, German Siemens will own a majority of the share capital. Such a transaction would have been blocked by state officials a few years ago. This is a notable change which may be replicated in other sectors where European consolidation is critical to fend off the growing competition from non-European players.
One example of this is Airbus, which is often shown as an example of visionary industrial cooperation between countries and creation of a world class and European-based champion of legacy European competitors. Such a concept resonates very well with public opinion and politicians, and it is no surprise that each and every sector is reviewing strategic alternatives with that proven concept in mind.
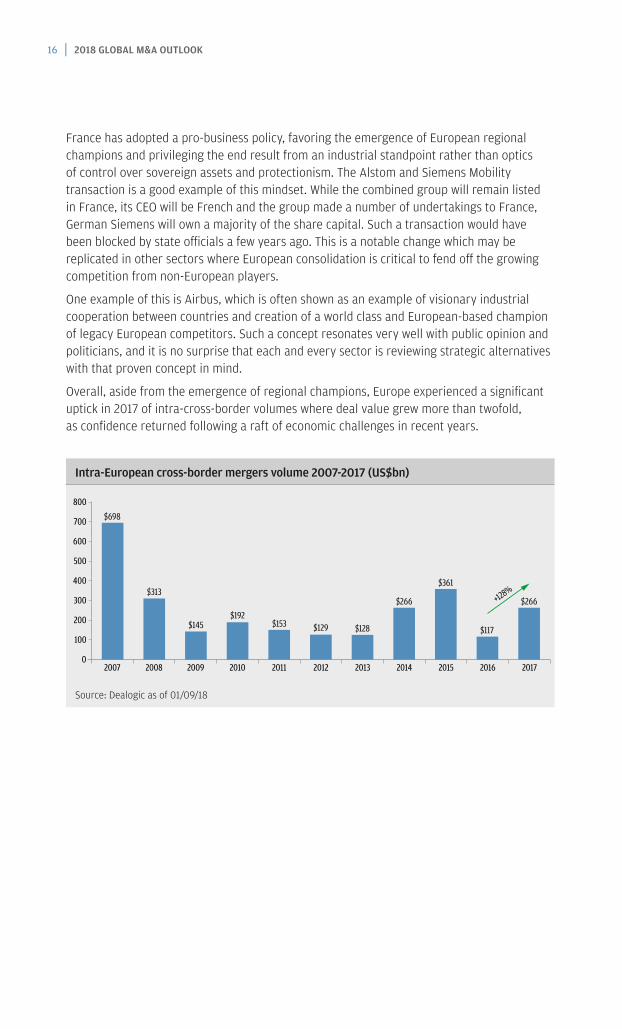
Overall, aside from the emergence of regional champions, Europe experienced a significant uptick in 2017 of intra-cross-border volumes where deal value grew more than twofold, as confidence returned following a raft of economic challenges in recent years.
Intra-European cross-border mergers volume 2007-2017 (US$bn)
2010 2015 20162014201320122011 2017200920082007
$698
$313
$145$192
$153 $129 $128
$266
$361
$117
$266
0
100
200
300
400
600
500
800
700
+128%
Source: Dealogic as of 01/09/18
16 | 2018 GLOBAL M&A OUTLOOK 2018 GLOBAL M&A OUTLOOK | 17
5. M&A without borders: Cross-border activity broadens
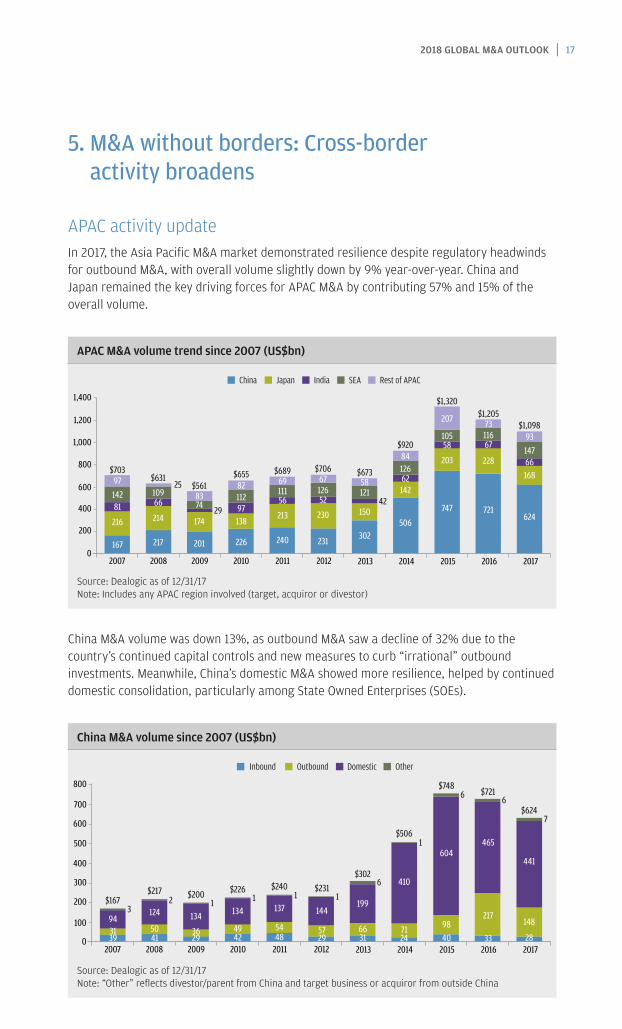
APAC activity updateIn 2017, the Asia Pacific M&A market demonstrated resilience despite regulatory headwinds for outbound M&A, with overall volume slightly down by 9% year-over-year. China and Japan remained the key driving forces for APAC M&A by contributing 57% and 15% of the overall volume.
APAC M&A volume trend since 2007 (US$bn)
20142013201220112010200920082007 2015 2016 2017
JapanChina India SEA Rest of APAC
$703$631
$561$655 $689 $706 $673
$920
$1,320$1,205
$1,09893147
16866
624
7311667
228
721
207
10558
203
747
8412662142
506
58121
150
302
42
6712652
230
231
6911156
213
240
8211297138
226
97 258374
174
201
29
10966
214
217
14281
216
167
600
400
200
0
800
1,000
1,200
1,400
Source: Dealogic as of 12/31/17 Note: Includes any APAC region involved (target, acquiror or divestor)
China M&A volume was down 13%, as outbound M&A saw a decline of 32% due to the country’s continued capital controls and new measures to curb “irrational” outbound investments. Meanwhile, China’s domestic M&A showed more resilience, helped by continued domestic consolidation, particularly among State Owned Enterprises (SOEs).
China M&A volume since 2007 (US$bn)
20142013201220112010200920082007 2015 2016 2017
Outbound DomesticInbound Other
$1673
6
6 6
7
2 1 1 1 1
1
$200 $226 $240 $231$302
$506
$748$721
$624
441
148
28
465
217
33
604
9840
410
7124
199
6631
144
5729
137
5448
134
4942
134
3629
124
$217
504139
3194100
0
200
300
400
500
600
700
800
Source: Dealogic as of 12/31/17 Note: “Other” reflects divestor/parent from China and target business or acquiror from outside China
18 | 2018 GLOBAL M&A OUTLOOK
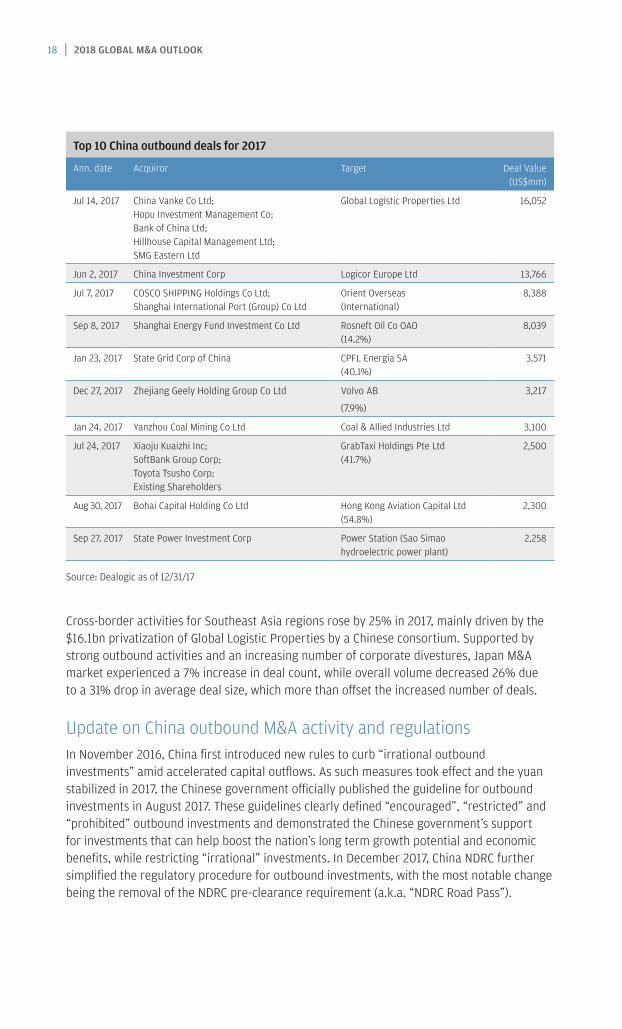
Top 10 China outbound deals for 2017
Ann. date Acquiror Target Deal Value (US$mm)
Jul 14, 2017 China Vanke Co Ltd;Hopu Investment Management Co;Bank of China Ltd;Hillhouse Capital Management Ltd;SMG Eastern Ltd
Global Logistic Properties Ltd 16,052
Jun 2, 2017 China Investment Corp Logicor Europe Ltd 13,766
Jul 7, 2017 COSCO SHIPPING Holdings Co Ltd;Shanghai International Port (Group) Co Ltd
Orient Overseas (International)
8,388
Sep 8, 2017 Shanghai Energy Fund Investment Co Ltd Rosneft Oil Co OAO (14.2%)
8,039
Jan 23, 2017 State Grid Corp of China CPFL Energia SA (40.1%)
3,571
Dec 27, 2017 Zhejiang Geely Holding Group Co Ltd Volvo AB
(7.9%)
3,217
Jan 24, 2017 Yanzhou Coal Mining Co Ltd Coal & Allied Industries Ltd 3,100
Jul 24, 2017 Xiaoju Kuaizhi Inc;SoftBank Group Corp;Toyota Tsusho Corp;Existing Shareholders
GrabTaxi Holdings Pte Ltd (41.7%)
2,500
Aug 30, 2017 Bohai Capital Holding Co Ltd Hong Kong Aviation Capital Ltd (54.8%)
2,300
Sep 27, 2017 State Power Investment Corp Power Station (Sao Simao hydroelectric power plant)
2,258
Source: Dealogic as of 12/31/17
Cross-border activities for Southeast Asia regions rose by 25% in 2017, mainly driven by the $16.1bn privatization of Global Logistic Properties by a Chinese consortium. Supported by strong outbound activities and an increasing number of corporate divestures, Japan M&A market experienced a 7% increase in deal count, while overall volume decreased 26% due to a 31% drop in average deal size, which more than offset the increased number of deals.
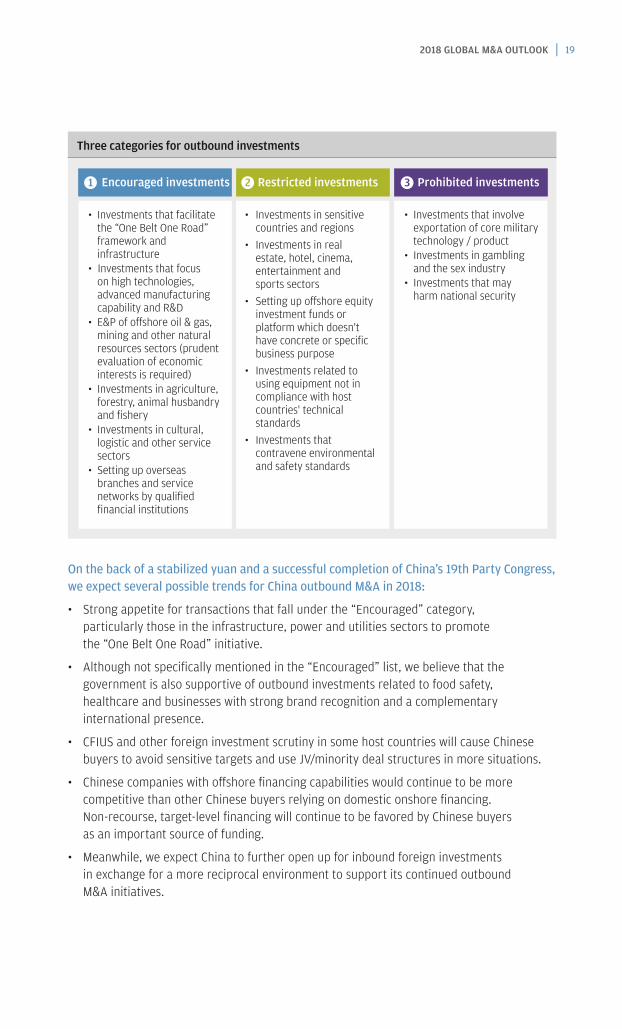
Update on China outbound M&A activity and regulationsIn November 2016, China first introduced new rules to curb “irrational outbound investments” amid accelerated capital outflows. As such measures took effect and the yuan stabilized in 2017, the Chinese government officially published the guideline for outbound investments in August 2017. These guidelines clearly defined “encouraged”, “restricted” and “prohibited” outbound investments and demonstrated the Chinese government’s support for investments that can help boost the nation’s long term growth potential and economic benefits, while restricting “irrational” investments. In December 2017, China NDRC further simplified the regulatory procedure for outbound investments, with the most notable change being the removal of the NDRC pre-clearance requirement (a.k.a. “NDRC Road Pass”).
18 | 2018 GLOBAL M&A OUTLOOK 2018 GLOBAL M&A OUTLOOK | 19
Three categories for outbound investments
• Investments that facilitate the “One Belt One Road” framework and infrastructure
• Investments that focus on high technologies, advanced manufacturing capability and R&D
• E&P of o�shore oil & gas, mining and other natural resources sectors (prudent evaluation of economic interests is required)
• Investments in agriculture, forestry, animal husbandry and fishery
• Investments in cultural, logistic and other service sectors
• Setting up overseas branches and service networks by qualified financial institutions
• Investments in sensitive countries and regions
• Investments in real estate, hotel, cinema, entertainment and sports sectors
• Setting up o�shore equity investment funds or platform which doesn't have concrete or specific business purpose
• Investments related to using equipment not in compliance with host countries' technical standards
• Investments that contravene environmental and safety standards
• Investments that involve exportation of core military technology / product
• Investments in gambling and the sex industry
• Investments that may harm national security
Encouraged investments Restricted investments Prohibited investments1 2 3
On the back of a stabilized yuan and a successful completion of China’s 19th Party Congress, we expect several possible trends for China outbound M&A in 2018:
• Strong appetite for transactions that fall under the “Encouraged” category, particularly those in the infrastructure, power and utilities sectors to promote the “One Belt One Road” initiative.
• Although not specifically mentioned in the “Encouraged” list, we believe that the government is also supportive of outbound investments related to food safety, healthcare and businesses with strong brand recognition and a complementary international presence.
• CFIUS and other foreign investment scrutiny in some host countries will cause Chinese buyers to avoid sensitive targets and use JV/minority deal structures in more situations.
• Chinese companies with offshore financing capabilities would continue to be more competitive than other Chinese buyers relying on domestic onshore financing. Non-recourse, target-level financing will continue to be favored by Chinese buyers as an important source of funding.
• Meanwhile, we expect China to further open up for inbound foreign investments in exchange for a more reciprocal environment to support its continued outbound M&A initiatives.
20 | 2018 GLOBAL M&A OUTLOOK
Key themes in Japanese M&A marketJapanese M&A market overview
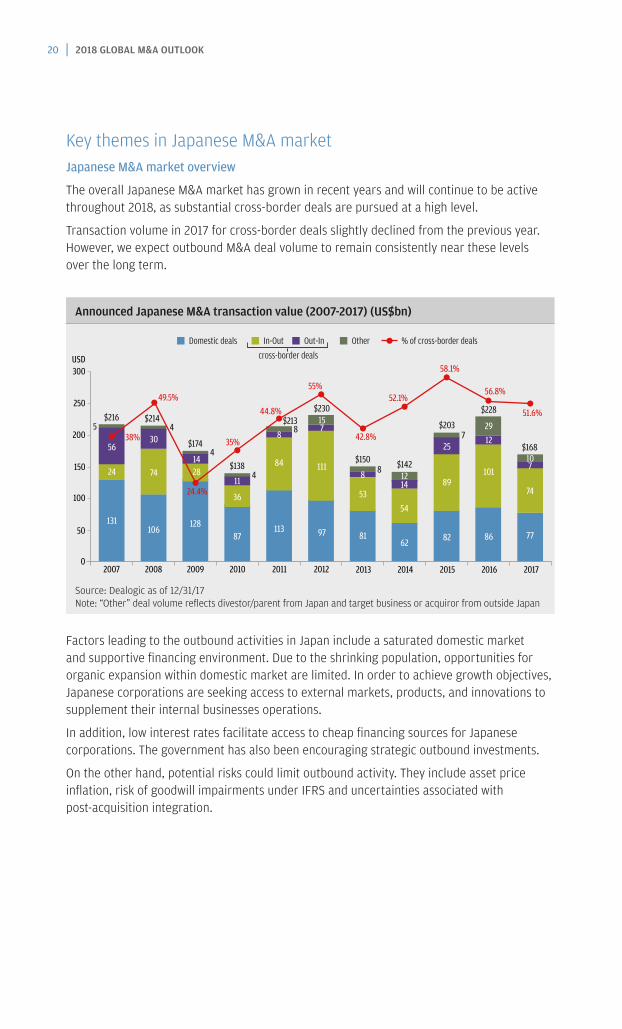
The overall Japanese M&A market has grown in recent years and will continue to be active throughout 2018, as substantial cross-border deals are pursued at a high level.
Transaction volume in 2017 for cross-border deals slightly declined from the previous year. However, we expect outbound M&A deal volume to remain consistently near these levels over the long term.
Announced Japanese M&A transaction value (2007-2017) (US$bn)
38%
49.5%
24.4%
35%
44.8%
55%
42.8%
52.1%
58.1%
56.8%
51.6%
20142013201220112010200920082007 2015 2016 2017
In-OutDomestic deals Out-In Other % of cross-border deals
$216
$174
$138
$213$230
$150 $142
$203
$228
$168
710
74
77
1229
101
86
25
89
82
1412
54
62
53
81
715
111
97
8 8
4
4
45
8 8
7
84
113
11
36
87
1428
128
30
$214
74
106131
24
56
50
0
100
150
200
250
USD300
cross-border deals
Source: Dealogic as of 12/31/17 Note: “Other” deal volume reflects divestor/parent from Japan and target business or acquiror from outside Japan
Factors leading to the outbound activities in Japan include a saturated domestic market and supportive financing environment. Due to the shrinking population, opportunities for organic expansion within domestic market are limited. In order to achieve growth objectives, Japanese corporations are seeking access to external markets, products, and innovations to supplement their internal businesses operations.
In addition, low interest rates facilitate access to cheap financing sources for Japanese corporations. The government has also been encouraging strategic outbound investments.
On the other hand, potential risks could limit outbound activity. They include asset price inflation, risk of goodwill impairments under IFRS and uncertainties associated with post-acquisition integration.
20 | 2018 GLOBAL M&A OUTLOOK 2018 GLOBAL M&A OUTLOOK | 21
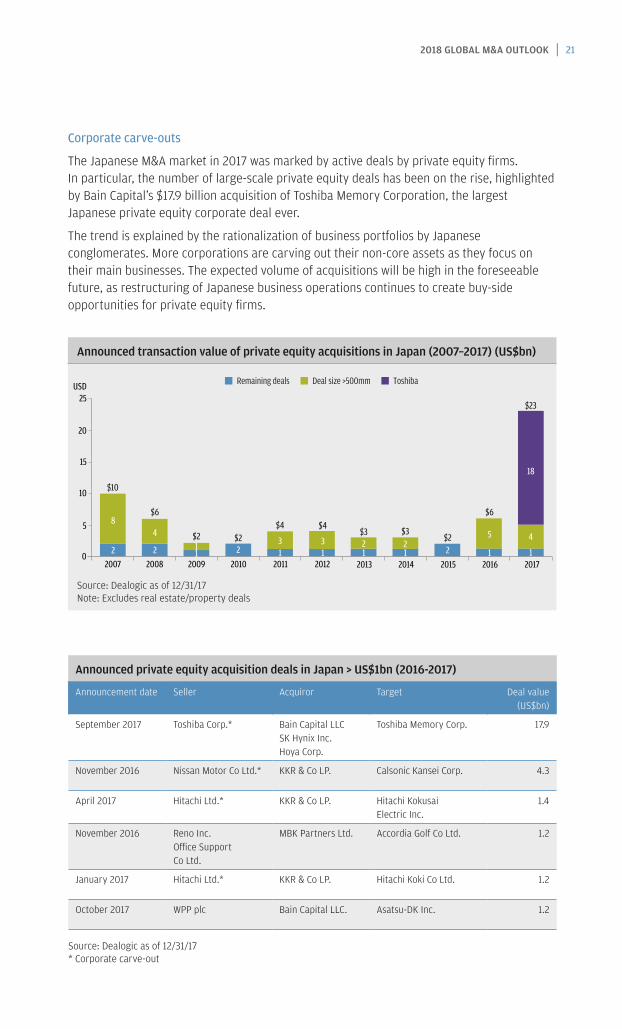
Corporate carve-outs
The Japanese M&A market in 2017 was marked by active deals by private equity firms. In particular, the number of large-scale private equity deals has been on the rise, highlighted by Bain Capital’s $17.9 billion acquisition of Toshiba Memory Corporation, the largest Japanese private equity corporate deal ever.
The trend is explained by the rationalization of business portfolios by Japanese conglomerates. More corporations are carving out their non-core assets as they focus on their main businesses. The expected volume of acquisitions will be high in the foreseeable future, as restructuring of Japanese business operations continues to create buy-side opportunities for private equity firms.
Announced transaction value of private equity acquisitions in Japan (2007–2017) (US$bn)
20142013201220112010200920082007 2015 2016 2017
Deal size >500mmRemaining deals Toshiba
$10
$2 $2$4 $4
$3 $3$2
$6
$23
18
4
1
5
1221
21
31
3121
1
$6
4
22
85
0
10
15
20
25USD
Source: Dealogic as of 12/31/17 Note: Excludes real estate/property deals
Announced private equity acquisition deals in Japan > US$1bn (2016-2017)
Announcement date Seller Acquiror Target Deal value (US$bn)
September 2017 Toshiba Corp.* Bain Capital LLC SK Hynix Inc. Hoya Corp.
Toshiba Memory Corp. 17.9
November 2016 Nissan Motor Co Ltd.* KKR & Co LP. Calsonic Kansei Corp. 4.3
April 2017 Hitachi Ltd.* KKR & Co LP. Hitachi Kokusai Electric Inc.
1.4
November 2016 Reno Inc. Office Support Co Ltd.
MBK Partners Ltd. Accordia Golf Co Ltd. 1.2
January 2017 Hitachi Ltd.* KKR & Co LP. Hitachi Koki Co Ltd. 1.2
October 2017 WPP plc Bain Capital LLC. Asatsu-DK Inc. 1.2
Source: Dealogic as of 12/31/17 * Corporate carve-out
22 | 2018 GLOBAL M&A OUTLOOK
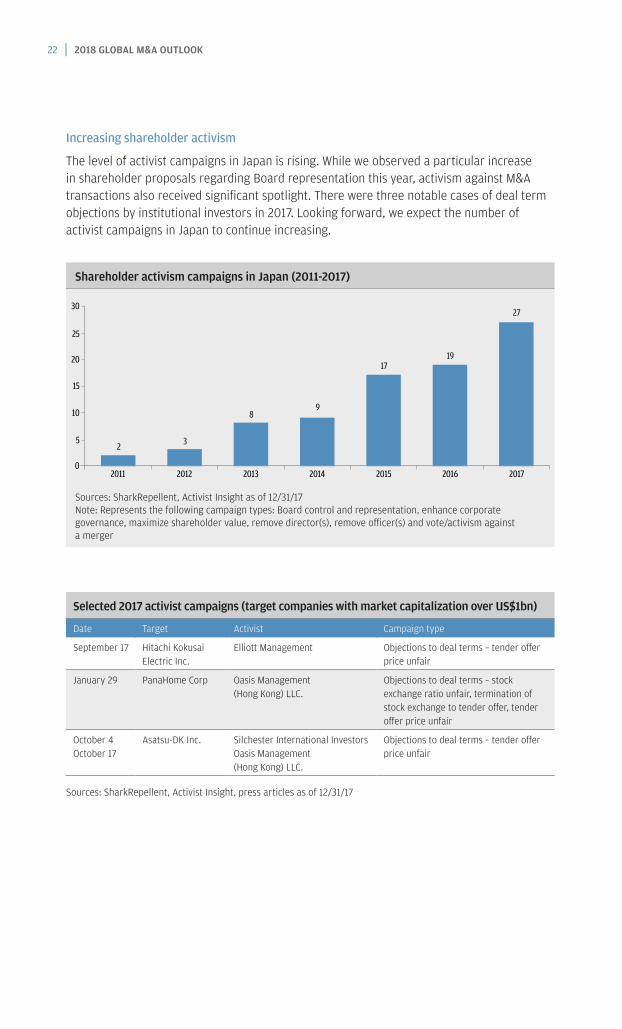
Increasing shareholder activism
The level of activist campaigns in Japan is rising. While we observed a particular increase in shareholder proposals regarding Board representation this year, activism against M&A transactions also received significant spotlight. There were three notable cases of deal term objections by institutional investors in 2017. Looking forward, we expect the number of activist campaigns in Japan to continue increasing.
Shareholder activism campaigns in Japan (2011-2017)
2011 2015 2016201420132012 2017
2 3
89
1719
27
0
5
10
20
15
25
30
Sources: SharkRepellent, Activist Insight as of 12/31/17 Note: Represents the following campaign types: Board control and representation, enhance corporate governance, maximize shareholder value, remove director(s), remove officer(s) and vote/activism against a merger
Selected 2017 activist campaigns (target companies with market capitalization over US$1bn)
Date Target Activist Campaign type
September 17 Hitachi Kokusai Electric Inc.
Elliott Management Objections to deal terms – tender offer price unfair
January 29 PanaHome Corp Oasis Management (Hong Kong) LLC.
Objections to deal terms – stock exchange ratio unfair, termination of stock exchange to tender offer, tender offer price unfair
October 4 October 17
Asatsu-DK Inc. Silchester International Investors Oasis Management (Hong Kong) LLC.
Objections to deal terms – tender offer price unfair
Sources: SharkRepellent, Activist Insight, press articles as of 12/31/17
22 | 2018 GLOBAL M&A OUTLOOK 2018 GLOBAL M&A OUTLOOK | 23
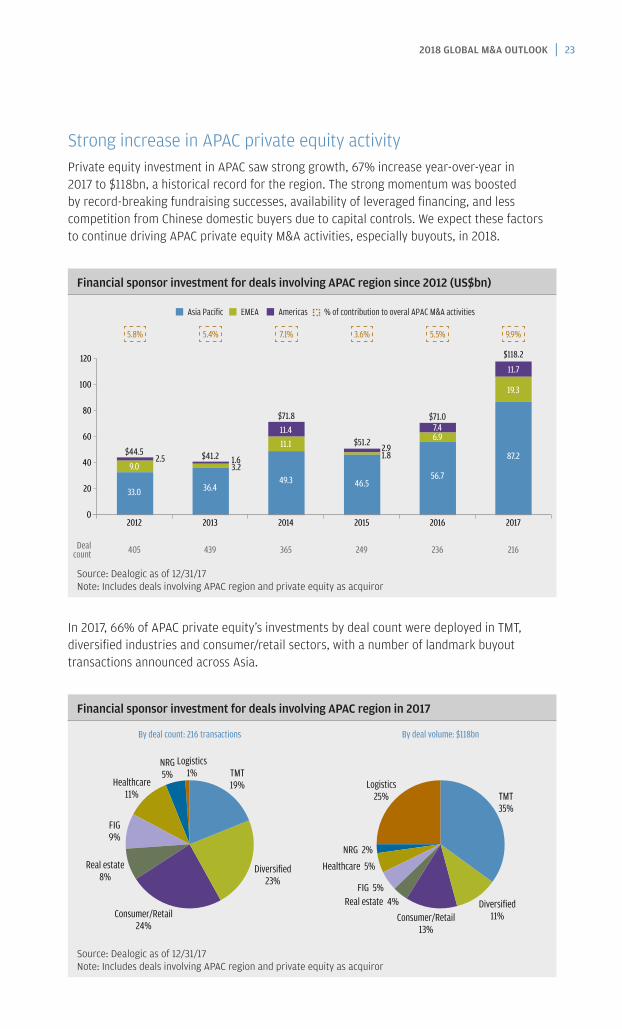
Strong increase in APAC private equity activityPrivate equity investment in APAC saw strong growth, 67% increase year-over-year in 2017 to $118bn, a historical record for the region. The strong momentum was boosted by record-breaking fundraising successes, availability of leveraged financing, and less competition from Chinese domestic buyers due to capital controls. We expect these factors to continue driving APAC private equity M&A activities, especially buyouts, in 2018.
Financial sponsor investment for deals involving APAC region since 2012 (US$bn)
2015 2016201420132012 2017
405 439 236249365 216
33.0
9.0
$44.5 $41.2
$71.8
$51.2
$71.0
$118.2
2.5
36.4
3.21.6
49.3
11.111.4
46.5
2.91.8
56.7
6.97.4
87.2
19.3
11.7
0
Dealcount
20
40
60
80
100
120
EMEAAsia Pacific Americas % of contribution to overal APAC M&A activities
5.8% 5.4% 7.1% 3.6% 5.5% 9.9%
Source: Dealogic as of 12/31/17 Note: Includes deals involving APAC region and private equity as acquiror
In 2017, 66% of APAC private equity’s investments by deal count were deployed in TMT, diversified industries and consumer/retail sectors, with a number of landmark buyout transactions announced across Asia.
Financial sponsor investment for deals involving APAC region in 2017
Real estate8%
FIG9%
Healthcare11%
NRG5%
Logistics1% TMT
19%
Diversified23%
Consumer/Retail24%
Real estate 4%FIG 5%
Healthcare 5%
NRG 2%
Logistics25% TMT
35%
Diversified11%Consumer/Retail
13%
By deal count: 216 transactions By deal volume: $118bn
Source: Dealogic as of 12/31/17 Note: Includes deals involving APAC region and private equity as acquiror
24 | 2018 GLOBAL M&A OUTLOOK
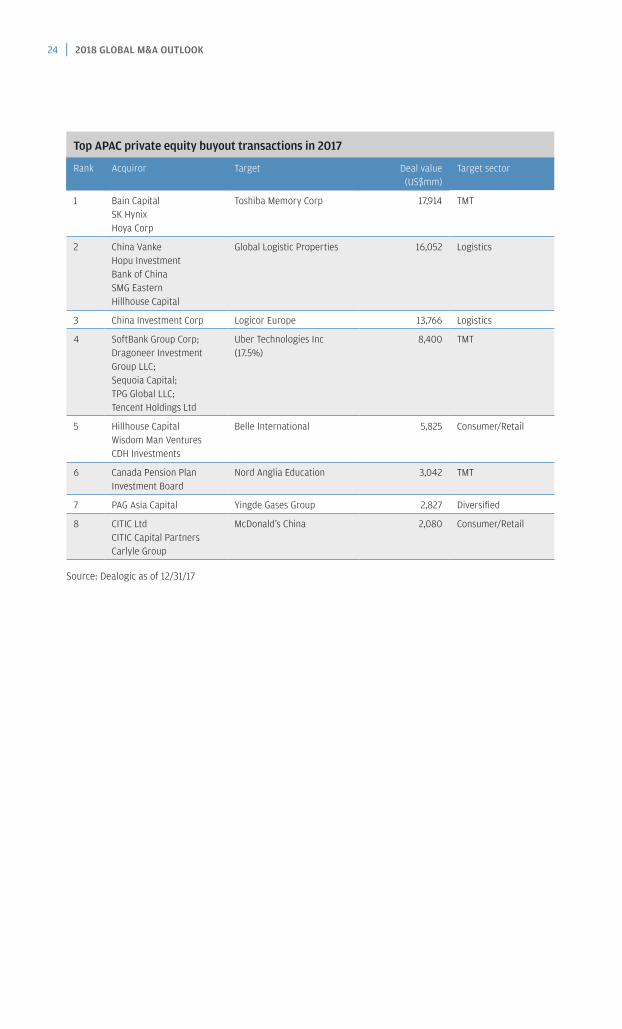
Top APAC private equity buyout transactions in 2017
Rank Acquiror Target Deal value (US$mm)
Target sector
1 Bain CapitalSK HynixHoya Corp
Toshiba Memory Corp 17,914 TMT
2 China Vanke Hopu InvestmentBank of ChinaSMG EasternHillhouse Capital
Global Logistic Properties 16,052 Logistics
3 China Investment Corp Logicor Europe 13,766 Logistics
4 SoftBank Group Corp;Dragoneer Investment Group LLC;Sequoia Capital;TPG Global LLC;Tencent Holdings Ltd
Uber Technologies Inc (17.5%)
8,400 TMT
5 Hillhouse CapitalWisdom Man VenturesCDH Investments
Belle International 5,825 Consumer/Retail
6 Canada Pension Plan Investment Board
Nord Anglia Education 3,042 TMT
7 PAG Asia Capital Yingde Gases Group 2,827 Diversified
8 CITIC LtdCITIC Capital PartnersCarlyle Group
McDonald’s China 2,080 Consumer/Retail
Source: Dealogic as of 12/31/17
24 | 2018 GLOBAL M&A OUTLOOK 2018 GLOBAL M&A OUTLOOK | 25
6. Activism update
Activists posted a solid 2017 following a challenging 2016Activist hedge funds recovered from their first decline in assets under management at the end of 2016, with AUM of $125.4bn as of September 2017, up 3.5% from the end of 2016 and up 2.0% from the end of 2015. Activists largely shook off the troubles that plagued many in 2015 and 2016, particularly those with meaningful commodity exposure, to reassert their place as a permanent investment strategy that issuers must contend with. We expect 2018 to be another year of growth for shareholder activism as activists build off a number of high-profile mega-cap campaigns, both in the U.S. and globally, during 2017.
The resurgence of shareholder activism, which at one point was at least somewhat uncertain, should focus issuers on preparedness and proactive measures that can be taken to avoid the attention of an activist. Regular and robust shareholder communication have never been more important as shareholders are often an issuer’s first line of defense when an activist is contemplating the launch of a public campaign.
We previously identified the rise in direct engagement by long-only institutional investors as a key area for issuers to watch. That trend will continue and expand in 2018. Institutional investors have taken an ever-expanding role in not only supporting shareholder activism, but in facilitating shareholder activism via indirect (and increasingly, direct) requests to activists to investigate value-creating options at their portfolio companies.
The return of large-cap activism2017 witnessed the return of activism targeting large- and mega-cap issuers. After taking stock and refocusing following substantial losses by a number of high-profile activist hedge funds and a resulting wave of redemptions by LPs in 2016, activists returned to high-profile mega-cap activism in 2017. Targets spanned multiple sectors and geographies; however, results for activists were mixed with some close and not-so-close outcomes on both sides of the table.
This renewal of large-cap activism signifies a renewed confidence by activist investors that large bets will not just be tolerated by their LPs, but that failure on individual campaigns will not necessarily lead to dire consequences for the fund in the eyes of LPs. One change from large-cap activism from years past, however, is that a number of these campaigns were initiated using special purpose investment vehicles. These are typically special situation funds raised by the activist with a specific target in mind. This structure provides some, albeit limited, comfort to LPs as typically an activist will need to confidentially disclose the target to at least a limited number of anchor investors in order to raise the capital required to initiate the campaign. In some situations this has helped alleviate LPs' skepticism toward supporting a very large investment out of a blind-pool fund.
We expect the trend toward large- and mega-cap activism to continue, particularly outside the U.S., where there may be a greater number of potential targets given the past activity that has already occurred in the size range in the U.S.
26 | 2018 GLOBAL M&A OUTLOOK
The convergence of activism and M&AM&A and shareholder activism have become ever more intertwined and we see no impetus changing that fact in the immediate future. Activists continue to advance the well-established strategy of pushing companies to seek out potential buyers for the company, in whole or in parts, willing to pay a premium to the value ascribed to those assets by the market. This is not a new trend and is not a trend that is likely to change anytime soon.
Similarly, activists will continue to appear after transactions have been announced, criticizing either the acquiror for paying too much or the seller for not demanding enough. 2017 has seen a number of campaigns abandoned, in the U.S. and Europe, following pressure from a shareholder activist. Issuers should be vigilant in the face of activist opposition to an announced M&A transaction, as the termination of the transaction does not necessarily result in the activist's exiting. In fact, an activist likely has a thesis supporting shareholder value creation that begins only once the transaction is abandoned.
Lastly, at the end of 2017, we have seen an even closer marriage of shareholder activism and traditional M&A when an activist who had been agitating for change with an issuer for some time ultimately decided to take the company private entirely in order to effectuate the changes they were advocating. While this is unlikely to become a widespread activist strategy, the largest and most experienced activists are likely to continue exploring this as an avenue to create value.
Institutional investors focusing on new concernsLong a concern of institutional investors, particularly index funds and public pension funds, corporate governance at publicly listed companies is under continuous pressure as investors and activists advocate for “best in class” corporate governance structures. In years past, this meant eliminating traditional protective provisions such as staggered boards or poison pills. More recently it was the push for adoption on proxy access policies to allow shareholders to utilize the company’s proxy materials to make director nominations.
The focus for 2018 will continue to include those themes, but will expand to include the makeup of company boards themselves. While institutional investors have spoken in the past about the importance of diversity in the boardroom, those statements have strengthened recently, indicating seriousness about using the strength of their ownership to diversify public company boardrooms away from the “pale, male and stale” of years past. 2018 is likely to see action, in the form of shareholder proposals, withhold vote campaigns or director nominations by institutional holders aimed at bringing that change to boards.
26 | 2018 GLOBAL M&A OUTLOOK 2018 GLOBAL M&A OUTLOOK | 27
Globalization continues, more aggressively than everThe globalization of shareholder activism is not a new development. In fact, activists have been active in non-U.S. markets for many years. What have changed recently are the number of global shareholder activist campaigns, the rate at which that pace is accelerating and the size and caliber of companies being targeted outside the U.S.
While new campaign activity in the U.S. has reached a relatively steady state in terms of number of campaign announcements, campaign activity outside the U.S. continues to grow meaningfully year-over-year. Furthermore, companies targeted outside the U.S. now include some of the most prominent and sizable global brands, including European and Asian companies. Nowhere was this more clear than at campaigns targeting Nestle and BHP Billiton in 2017. At Nestle, Dan Loeb's Third Point demanded the company return capital to shareholders, improve productivity and reshape its portfolio, resulting in the board's evaluating alternatives for certain divisions and replacing key managers. At BHP Billiton, Elliott Management continued its global crusade against companies, pressuring the dual listed (Australia and the U.K.) company to unify its corporate structure in Australia, separate its U.S. petroleum business, and implement a more robust capital return policy.
Historically, activist campaign tactics outside the U.S. have been more moderate, eschewing the visceral and personal attacks on management and directors that have become familiar in U.S. shareholder activist campaigns. As activist activity follows a similar growth trajectory globally to that of the U.S. in years past, the development of campaign tactics, and their acceptance by investors in global companies, follows a similar pattern of development as was seen in the U.S. as activism developed.
This charge against global companies is not being led just by U.S.-based hedge fund activists. In Europe, investors such as TCI and Cevian have increased their focus on domestic targets, with TCI attempting a major shake-up of the board and management at London Stock Exchange Group. Cevian Capital also launched a campaign against ThyssenKrupp after having received board seats at both LM Ericsson and ABB earlier in the year. Prior to these Cevian campaigns, their last public activist activity had been nearly 10 years ago.
Every publicly traded company, anywhere in the world, must now take seriously the prospect that they may be targeted by a shareholder activist and must act with a sense of urgency to understand their potential vulnerability and prepare to respond and defend themselves in the event an activist emerges.
28 | 2018 GLOBAL M&A OUTLOOK
7. About J.P. Morgan M&A Advisory
We advise corporations and institutions of all sizes on their most complex strategic needs, in their home markets and around the world. Whatever your strategic challenge or opportunity, J.P. Morgan provides a full M&A offering to address your needs. Drawing upon our in-depth industry-specific expertise and regional market acumen, we can evaluate your business with a long-term view to provide a tailored, comprehensive and integrated solution.
We have a track record of strategic defense. Our scale and breadth of experience with shareholder activism mean we provide a differentiated approach toward defense for clients. We have successfully engaged with all the major activists in some of the most sophisticated campaigns around the world, and our deep understanding of activist tactics and firsthand knowledge brings unparalleled experience to your defense. As we advise only corporate clients and do not counsel any shareholder activist campaigns, our interests are fully aligned with your company’s priorities.
Clients benefit from J.P. Morgan’s global experience leveraging our specialized advice, swift strategic execution, and strong resources to help you seize opportunities and solve problems.
Our bespoke solutions combine:
• In-depth knowledge of sector and market dynamics with M&A bankers based locally in most major markets globally.
• Innovative advice on valuation, transaction structures and deal tactics and negotiations.
• Rigorous execution delivered with responsive and agile service.
• Ability to partner with product experts across our full range of competencies, including comprehensive financing through our debt and equity issuance platforms, as well as derivatives and treasury services, such as escrow services.
J.P. Morgan provides M&A advisory solutions across the full strategic life cycle of our clients:
Strategic expansion
• Acquisitions, including cross-border opportunities
• Mergers and joint ventures
Enhancing business value
• Corporate combinations
• Divestures
• Capital restructuring projects
• Spinoffs and other repositionings
Shareholder strategy
• Defense preparations for publicly announced and non-public approaches
• Dedicated shareholder activism advice

28 | 2018 GLOBAL M&A OUTLOOK 2018 GLOBAL M&A OUTLOOK | 29
8. Select J.P. Morgan-advised transactions in 2017
Pending $130.3bn
Advisor to Broadcom on its offer to acquire Qualcomm
Pending $69.0bn
Advisor to Disney on its acquisition of 21st Century Fox’s entertainment businesses
Pending $41.7bn
Advisor to Hochtief on its offer to acquire Abertis Infraestructuras
Pending $22.5bn
Advisor to Unibail-Rodamco on its acquisiton of Westfield
2017 $16.6bn
Advisor to ONEOK on its acquisition of 58.8% stake in ONEOK Partners
Pending $16.1bn
Advisor to Global Logistic Properties on its sale to China Vanke consortium
Pending $11.0bn
Advisor to Hammerson on its acquisition of Intu Properties
2017 $7.5bn
Advisor to JAB Holdings on its acquisition of Panera Bread
2017 $12.0bn
Advisor to METRO Group’s demerger and listing of METRO Wholesale & Food Specialist
2017 $8.4bn
Advisor to Invitation Homes on its merger of equals with Starwood Waypoint Homes
Pending $6.6bn
Advisor to Sinclair Broadcast on its acquisition of Tribune Media
Cross-border deals
Pending $6.6bn
Advisor to AltaGas on its acquisition of WGL Holdings
2018 $10.2bn
Advisor to Telecom Argentina on its merger with Cablevision
Pending $6.7bn
Advisor to Cavium on its sale to Marvell Technology
Pending $9.5bn
Advisor to CalAtlantic on its combination with Lennar
2017 $7.1bn
Advisor to LTS Group on its sale to Crown Castle
2017 $8.2bn
Advisor to Royal Dutch Shell on the sale of its stake in Athabasca Oil Sands Project and other oil sands assets
2017 $12.5bn
Advisor to Cenovus on its acquisition of oil sands and Deep Basin assets from ConocoPhillips
Pending $30.1bn
Advisor to Rockwell Collins on its sale to United Technologies
Pending $14.8bn
Advisor to Scripps Networks Interactive on its sale to Discovery Communications
Pending $8.7bn
Advisor to Alstom on its merger with Siemens’ Mobility division
Pending $8.4bn
Advisor to Orient Overseas on its sale to COSCO Shipping and Shanghai International Port
2017 $7.4bn
Advisor to United Internet on its merger of 1&1 telco business with Drillisch
2017 $6.8bn
Advisor to Gecina on its acquisition of Eurosic
Pending $6.5bn
Advisor to Gemalto on its sale to Thales
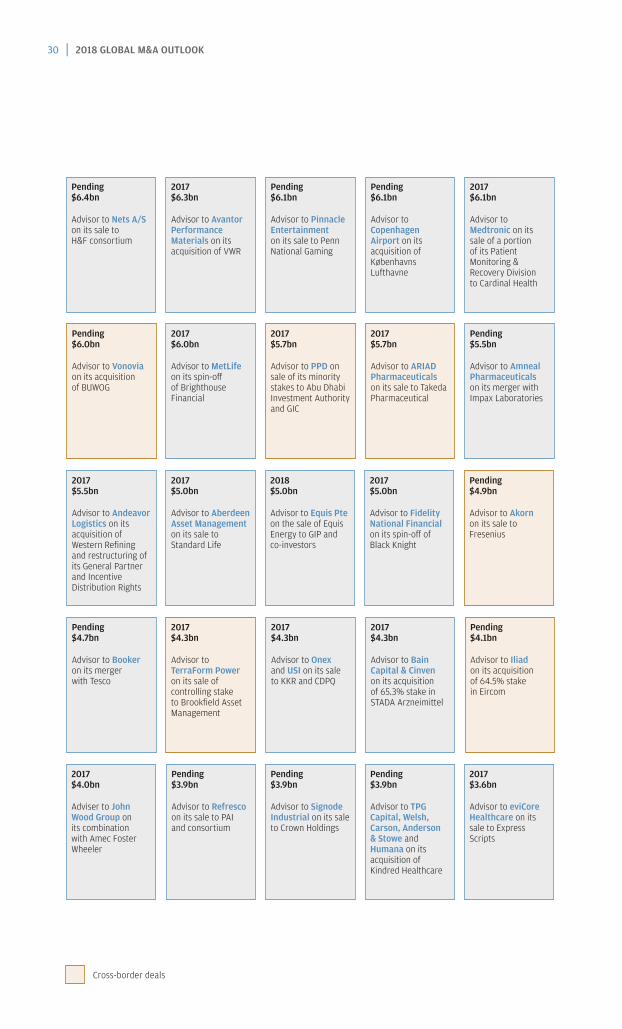
30 | 2018 GLOBAL M&A OUTLOOK
Pending $6.4bn
Advisor to Nets A/S on its sale to H&F consortium
2017 $6.3bn
Advisor to Avantor Performance Materials on its acquisition of VWR
Pending $6.1bn
Advisor to Copenhagen Airport on its acquisition of Københavns Lufthavne
2017 $6.1bn
Advisor to Medtronic on its sale of a portion of its Patient Monitoring & Recovery Division to Cardinal Health
Pending $6.0bn
Advisor to Vonovia on its acquisition of BUWOG
2017 $5.7bn
Advisor to PPD on sale of its minority stakes to Abu Dhabi Investment Authority and GIC
2017 $5.0bn
Advisor to Aberdeen Asset Management on its sale to Standard Life
2017 $4.3bn
Advisor to TerraForm Power on its sale of controlling stake to Brookfield Asset Management
Pending $5.5bn
Advisor to Amneal Pharmaceuticals on its merger with Impax Laboratories
2017 $3.6bn
Advisor to eviCore Healthcare on its sale to Express Scripts
Pending $3.9bn
Advisor to Signode Industrial on its sale to Crown Holdings
Cross-border deals
Pending $3.9bn
Advisor to TPG Capital, Welsh, Carson, Anderson & Stowe and Humana on its acquisition of Kindred Healthcare
2018 $5.0bn
Advisor to Equis Pte on the sale of Equis Energy to GIP and co-investors
2017 $4.0bn
Adviser to John Wood Group on its combination with Amec Foster Wheeler
2017 $5.0bn
Advisor to Fidelity National Financial on its spin-off of Black Knight
2017 $4.3bn
Advisor to Bain Capital & Cinven on its acquisition of 65.3% stake in STADA Arzneimittel
Pending $4.7bn
Advisor to Booker on its merger with Tesco
2017 $5.7bn
Advisor to ARIAD Pharmaceuticals on its sale to Takeda Pharmaceutical
Pending $6.1bn
Advisor to Pinnacle Entertainment on its sale to Penn National Gaming
2017 $6.0bn
Advisor to MetLife on its spin-off of Brighthouse Financial
Pending $3.9bn
Advisor to Refresco on its sale to PAI and consortium
Pending $4.9bn
Advisor to Akorn on its sale to Fresenius
2017 $4.3bn
Advisor to Onex and USI on its sale to KKR and CDPQ
Pending $4.1bn
Advisor to Iliad on its acquisition of 64.5% stake in Eircom
2017 $5.5bn
Advisor to Andeavor Logistics on its acquisition of Western Refining and restructuring of its General Partner and Incentive Distribution Rights

30 | 2018 GLOBAL M&A OUTLOOK 2018 GLOBAL M&A OUTLOOK | 31
Notes

Notes
This material (including market commentary, market data, observations or the like) has been prepared by personnel in the Mergers & Acquisitions Group of JPMorgan Chase & Co. It has not been reviewed, endorsed or otherwise approved by, and is not a work product of, any research department of JPMorgan Chase & Co. and/or its affiliates (“J.P. Morgan”). Any views or opinions expressed herein are solely those of the individual authors and may differ from the views and opinions expressed by other departments or divisions of J.P. Morgan. This material is for the general information of our clients only and is a “solicitation” only as that term is used within CFTC Rule 1.71 and 23.605 promulgated under the U.S. Commodity Exchange Act.
RESTRICTED DISTRIBUTION: This material is distributed by the relevant J.P. Morgan entities that possess the necessary licenses to distribute the material in the respective countries. This material is proprietary and confidential to J.P. Morgan and is for your personal use only. Any distribution, copy, reprints and/or forward to others is strictly prohibited.
This material is intended merely to highlight market developments and is not intended to be comprehensive and does not constitute investment, legal or tax advice, nor does it constitute an offer or solicitation for the purchase or sale of any financial instrument or a recommendation for any investment product or strategy.
Information contained in this material has been obtained from sources believed to be reliable but no representation or warranty is made by J.P. Morgan as to the quality, completeness, accuracy, fitness for a particular purpose or non infringement of such information. In no event shall J.P. Morgan be liable (whether in contract, tort, equity or otherwise) for any use by any party of, for any decision made or action taken by any party in reliance upon, or for any inaccuracies or errors in, or omissions from, the information contained herein and such information may not be relied upon by you in evaluating the merits of participating in any transaction. All information contained herein is as of the date referenced and is subject to change without notice. All market statistics are based on announced transactions. Numbers in various tables may not sum due to rounding.
J.P. Morgan may have positions (long or short), effect transactions, or make markets in securities or financial instruments mentioned herein (or options with respect thereto), or provide advice or loans to, or participate in the underwriting or restructuring of the obligations of, issuers mentioned herein. All transactions presented herein are for illustration purposes only. J.P. Morgan does not make representations or warranties as to the legal, tax, credit, or accounting treatment of any such transactions, or any other effects similar transactions may have on you or your affiliates. You should consult with your own advisors as to such matters.
The use of any third-party trademarks or brand names is for informational purposes only and does not imply an endorsement by JPMorgan Chase & Co. or that such trademark owner has authorized JPMorgan Chase & Co. to promote its products or services.
J.P. Morgan is the marketing name for the investment banking activities of JPMorgan Chase Bank, N.A., J.P. Morgan Limited, J.P. Morgan Securities LLC (member, NYSE), J.P. Morgan Securities plc (authorized by the Prudential Regulation Authority and regulated by the Financial Conduct Authority and the Prudential Regulation Authority), J.P. Morgan Australia Limited (ABN 52 002 888 011/AFS Licence No: 238188 and regulated by Australian Securities and Investments Commission) and their investment banking affiliates. J.P. Morgan Securities plc is exempt from the licensing provisions of the Financial and Intermediary Services Act, 2002 (South Africa).
For Brazil: Ombudsman J.P. Morgan: 0800-7700847 / [email protected]
For Australia: This material is issued and distributed by JP Morgan Australia Limited (ABN 52 002 888 011/AFS Licence No: 238188) (regulated by ASIC) for the benefit of “wholesale clients” only. This material does not take into account the specific investment objectives, financial situation or particular needs of the recipient. The recipient of this material must not distribute it to any third party or outside Australia without the prior written consent of JP Morgan Australia Limited.
© 2018 JPMorgan Chase & Co. All rights reserved.