Embed Size (px)
Citation preview

2018 Global Status Report
Towards a zero-emission, efficient and resilient buildings and construction sector
2018 Global Status Report
Towards a zero-emission, efficient and resilient buildings and construction sector
The 2018 Global Status Report was prepared by the International Energy Agency (IEA) for the Global Alliance for Buildings and Construction (GlobalABC). The report was coordinated by the United Nations Environment Programme and was made possible by the generous support of the governments of France, Germany and Switzerland.
ISBN No: 978‐92‐807‐3729‐5
Job No: DTI/2213/PA
Cover Images: © Shutterstock, John Dulac
Copyright © United Nations Environment Programme, 2018.
The United Nations Environment Programme and GlobalABC members acknowledge the IEA’s role in generating the analysis in this report based on IEA data and the data of GlobalABC members. The IEA shall retain ownership of its underlying data and analysis included in this report.
This publication may be reproduced in whole or in part and in any form for educational or non‐profit purposes without special permission from the copyright holders, provided acknowledgement of the source is made. The IEA and the United Nations Environment Programme would appreciate receiving a copy of any publication that uses this publication as a source.
No use of this publication may be made for resale or for any other commercial purpose whatsoever without prior permission in writing from the IEA and the United Nations Environment Programme.
The electronic copy of this report can be downloaded at www.iea.org or www.globalabc.org.
Citation: International Energy Agency and the United Nations Environment Programme (2018): 2018 Global Status Report: towards a zero‐emission, efficient and resilient buildings and construction sector.
Disclaimer
The views expressed in this 2018 Global Status Report are not necessarily those of GlobalABC partners. Moreover, the views expressed do not necessarily represent the decision of the stated policy of the IEA or its individual member countries or the United Nations Environment Programme, nor does citing of trade names or commercial process constitute endorsement. The IEA and the United Nations Environment Programme do not make any representation or warranty, express or implied, in respect of the report’s contents (including its completeness or accuracy) and shall not be responsible for any use of, or reliance on, the report.
Geographical disclaimer
The designations employed and the presentation of the material in this report do not imply the expression of any opinion whatsoever on the part of the authors, the IEA or the United Nations Environment Programme concerning the name or legal status of any country, territory, city or area, nor of its authorities, nor concerning the delimitation of its frontiers or boundaries.
UN Environment promotes environmentally sound practices globally
and in its own activities. Our distribution policyaims to reduce UN Environment’s carbon footprint.
2018 Global Status Report Towards a zero‐emission, efficient and resilient buildings and construction sector
Page | 3
ForewordThe Global Alliance for Buildings and Construction (GlobalABC) is proud to present this third edition of the Global Status Report on the state of the transition towards a zero‐emission, efficient and resilient buildings and construction sector.
We would like to thank the GlobalABC secretariat hosted by UN Environment, and the International Energy Agency (IEA) for the coordination of this important work, as well as all the contributors, which we hope continues to grow each year, in order to realise an accurate and global vision of the desired buildings transition.
We equally would like thank the governments of France, Germany and Switzerland for their generous support to make this 2018 edition possible.
This year’s report has strived to be closer to the eight axis of the shared roadmap that we collectively developed to put the buildings and construction sector on a pathway consistent with the Paris Agreement.
While energy efficiency remains a top priority for buildings, this year’s edition is enriched by a chapter looking at minimising the carbon footprint of building materials, as well as reducing the vulnerability and increasing the resilience of buildings to climate change.
The coming year will be marked by the pairing of the Global Status Report with the forthcoming IEA‐GlobalABC database, a digitalisation of the status report that will give a more detailed and complete view of the transitions towards zero‐emission, efficient and resilient buildings.
We invite other stakeholders from the buildings, construction and real estate sectors to take part in this new effort.
Signed, the steering committee of the GlobalABC
www.globalabc.org
2018 Global Status Report
Towards a zero‐emission, efficient and resilient buildings and construction sector
Page | 4
Acknowledgements Thibaut Abergel, Brian Dean, John Dulac and Ian Hamilton prepared this report with the support of Tim Wheeler on behalf of the International Energy Agency for the Global Alliance for Buildings and Construction (GlobalABC). The authors would like to thank the following partners who supported this report with their important contributions, input, comments and review:
Miriam Badino, ICLEI – Local Governments for Sustainability, Germany
Ibtissem Bouattay, Ministry of Housing and Land Use Planning, Tunisia
Oriane Cebile, Sustainable Real Estate Observatory, France
Arturo Cervera, Ministry of Agricultural, Territorial and Urban Development, Mexico
Kurt Emil Eriksen, VELUX, Denmark
Jérôme Gatier, Directorate General for Planning, Housing and Nature, France
Luca De Giovanetti and Roland Hunziker, World Business Council for Sustainable Development, Switzerland
Cécile Gracy, Energy and Environment Agency, France
Peter Graham, Global Buildings Performance Network, Australia
Lukas Gutzwiller, Swiss Federal Office of Energy, Switzerland
Ursula Hartenberger, Royal Institution of Chartered Surveyors, Belgium
Naoto Hashimoto, Ministry of Land, Infrastructure, Transport and Tourism, Japan
Luu Linh Huong, Ministry of Construction, Viet Nam
Pekka Huovila, 10YFP Sustainable Buildings and Construction, Finland
Innovation Directorate for Sustainable Development, Ministry of Environment and Sustainable Development, Argentina
Usha Iyer‐Raniga, Royal Melbourne Institute of Technology, Australia
Idriss Kathrada, Novasirhe/International Federation of Consulting Engineers, France
Guillaume de Laboulaye, ENERGIES 2050, France
Mirjam Macchi, Swiss Agency for Development and Cooperation, Switzerland
Eric Mackres, World Resources Institute, United States
Cédric de Meeûs and Michael Scharpf, LafargeHolcim, Switzerland
Regis Meyer, Ministry of Ecological and Inclusive Transition, France
Emmanuel Normant, Saint Gobain, France
York Ostermeyer, Chalmers University, Sweden
Martina Otto and Nora Steurer, UN Environment/GlobalABC Secretariat, France
Véronique Pappe, Construction21, France
Oliver Rapf, Buildings Performance Institute Europe, Belgium
Ane Rostrup Gabrielsen, Ministry of Climate and Environment, Norway
Saurabh Saraf, CUES Foundation, India
Camille Sifferlen, Passive House Institute, United States
Kauhiro Teranishi, Sekisui House, Ltd., Japan
Marie Lyne Tremblay, Natural Resources Canada
Giorgia Tzar, International Passive House Association, Germany
Terri Wills, World Green Building Council, United Kingdom
2018 Global Status Report Towards a zero‐emission, efficient and resilient buildings and construction sector
Page | 5
Table of contents Executive summary ................................................................................................................... 9
Global status ........................................................................................................................... 11
Energy and emissions in the buildings and construction sector ................................................. 11
Energy trends .......................................................................................................................... 11
Emissions trends ...................................................................................................................... 14
Sustainable buildings and construction policies ......................................................................... 15
NDCs ........................................................................................................................................ 15
Building energy codes ............................................................................................................. 20
Building energy certification ................................................................................................... 23
Other commitments and actions ............................................................................................ 25
Investment and finance for sustainable buildings ...................................................................... 26
Bridging the investment gap ................................................................................................... 28
Government spending ............................................................................................................. 30
Pathways to sustainable buildings and construction ................................................................ 31
Human factors ............................................................................................................................. 33
Human skills, behaviour and decisions ................................................................................... 33
User control ............................................................................................................................. 33
Health and well‐being ............................................................................................................. 34
Technology solutions ................................................................................................................... 35
Building envelopes .................................................................................................................. 36
Heating and cooling systems ................................................................................................... 37
Appliances and lighting ........................................................................................................... 40
Architecture solutions ................................................................................................................. 42
Material solutions ....................................................................................................................... 43
Material demand trends ......................................................................................................... 44
Material policy trends ............................................................................................................. 48
Resilient buildings ....................................................................................................................... 49
Floods ...................................................................................................................................... 49
Urban heat islands ................................................................................................................... 50
Adaptation ............................................................................................................................... 50
Urban solutions ........................................................................................................................... 51
Clean energy transition ............................................................................................................... 53
Source of clean energy for buildings ....................................................................................... 54
Access to and use of modern energy services ........................................................................ 54
Circular economy ........................................................................................................................ 56
2018 Global Status Report Towards a zero‐emission, efficient and resilient buildings and construction sector
Page | 6
Global Roadmap recommendations ........................................................................................ 59
GlobalABC work areas ............................................................................................................. 60
Work Area 1: Awareness and education ................................................................................. 60
Work Area 2: Public policies .................................................................................................... 60
Work Area 3: Market transformation ..................................................................................... 60
Work Area 4: Finance .............................................................................................................. 60
Work Area 5: Building measurement, data and information .................................................. 60
GlobalABC members and activities .......................................................................................... 61
Programme for Energy Efficiency in Buildings ........................................................................ 61
National Alliances for Buildings and Construction .................................................................. 61
References .............................................................................................................................. 62
Acronyms, abbreviations and units of measure ....................................................................... 70
Units of measure ......................................................................................................................... 71
Photo credits ............................................................................................................................... 71
List of figures
Figure 1 • Global share of buildings and construction final energy and emissions, 2017 ........ 11 Figure 2 • Global buildings sector final energy use by fuel type and change in indicators,
2010‐17 .................................................................................................................... 12 Figure 3 • Global buildings final energy use and change in intensity by end use, 2010‐17 ..... 13 Figure 4 • Influence of factors on global buildings energy use, 2010‐17 ................................. 13 Figure 5 • Influence of factors buildings energy use by building type, 2010‐17 ...................... 14 Figure 6 • Global buildings energy‐related emissions by building type and change in
indicators, 2010‐17 .................................................................................................. 15 Figure 7 • NDC and buildings policy coverage, 2017‐18 ........................................................... 18 Figure 8 • Share of buildings emissions covered by NDCs, policies or both, 2017‐18 ............. 19 Figure 9 • Global energy efficiency investments and total spending on buildings, 2017 ........ 26 Figure 10 • Global investment in energy efficiency in buildings, 2017 ...................................... 27 Figure 11 • Global green bond issuance by use of proceeds, 2014‐17 ...................................... 29 Figure 12 • PACE by sector, 2014‐17 (left) and commercial PACE by state, 2013‐17 (right) ..... 29 Figure 13 • Government and policy‐related spending on energy efficiency in buildings, 2017 30 Figure 14 • Global building final energy use per unit of floor area, 2000‐30 ............................. 31 Figure 15 • Share of equipment stock for key energy efficiency technologies, 2000‐17 ........... 36 Figure 16 • Global sales shares of space and water heating technologies, 2010‐17 ................. 38 Figure 17 • Factors influencing global appliance energy use, 2010‐17 ...................................... 40 Figure 18 • Cement and steel demand for buildings by key region, 2000‐17 ............................ 44 Figure 19 • Global residential building structure material and material intensity, 2017 ........... 45 Figure 20 • Global non‐residential building structure material and material intensity, 2017 ... 45 Figure 21 • NDCs mentioning the construction sector, 2018 ..................................................... 49 Figure 22 • Residential fuel use and access to electricity, 2000‐15 ........................................... 55
2018 Global Status Report Towards a zero‐emission, efficient and resilient buildings and construction sector
Page | 7
List of maps
Map 1 • Buildings sector emissions coverage in NDCs, 2017‐18 .................................................. 16 Map 2 • Building energy codes by jurisdiction, 2017‐18 .............................................................. 20 Map 3 • Building energy certification programmes by jurisdiction, 2017‐18 .............................. 23 Map 4 • Average cooling degree days (CDDs) and SEERs of residential ACs, 2017 ...................... 39 Map 5 • GlobalABC membership and participation ..................................................................... 61
List of boxes
Box 1 • NDC updates related to buildings and construction in 2017‐18 ..................................... 17 Box 2 • Examples of policies from NDCs supporting climate commitments ............................... 19 Box 3 • Examples of building energy codes by jurisdiction ......................................................... 21 Box 4 • Examples of building energy certification, rating and labels .......................................... 23 Box 5 • Examples of other sustainability commitments and actions .......................................... 25 Box 6 • Examples of investment for sustainable buildings and construction ............................. 28 Box 7 • Examples of sustainable buildings pathway efforts ........................................................ 32 Box 8 • Examples of capacity building to enable improved decision making .............................. 33 Box 9 • Examples of digital occupant and user controls .............................................................. 34 Box 10 • Examples of factors for achieving health and well‐being ............................................... 35 Box 11 • Examples of sustainable envelope technology ............................................................... 37 Box 12 • Examples of heating and cooling system technology ..................................................... 40 Box 13 • Examples of energy‐efficient appliances and lighting ..................................................... 41 Box 14 • Examples of architectural solutions for sustainable buildings ........................................ 43 Box 15 • Examples of material solutions for sustainable buildings ............................................... 47 Box 16 • Examples of steps made towards achieving resilient buildings ...................................... 51 Box 17 • Examples of urban initiatives supporting sustainable buildings ..................................... 53 Box 18 • Examples of efforts delivering a clean energy transition ................................................ 56 Box 19 • Examples of circular economy in the built environment ................................................ 57

2018 Global Status Report Towards a zero‐emission, efficient and resilient buildings and construction sector
Page | 9
Executive summary This Global Status Report documents the status and trends of key indicators for energy use, emissions, technologies, policies, and investments to track the buildings and construction sector, globally and in key regions. Central findings of this report include:
Buildings play a dominant role in the clean energy transition. Buildings construction and operations accounted for 36% of global final energy use and nearly 40% of energy‐related carbon dioxide (CO2) emissions in 2017.1
Global buildings sector energy use continues to grow, but not as quickly as population or floor area. Heating, lighting and household cooking are the most improved building end uses. Continued increases in population and floor area are and will be the principal factors of rising energy demand in buildings.
Buildings and construction sector emissions appear to have levelled off since 2015, although they still represent the largest share of total global energy‐related CO2 emissions. A clean energy transition will enable a steady decrease in future emissions.
Global dialogue is supporting progress in developing policies for sustainable buildings. Most countries have submitted nationally determined contributions (NDCs) that relate to buildings and some have improved them; however, many NDCs still lack specific actions.
Countries are continuing to implement and update building energy codes and certification policies. However, most expected future buildings growth is in countries that do not have mandatory energy codes and policies in place today.
Investment in energy efficiency in buildings has slowed. Incremental energy efficiency investment increased by 4.7% in 2017 (3% adjusted for inflation), which is the lowest rate of increase in recent years.
International agreements and initiatives are providing direction
A process of international dialogue on climate change began in 2018, facilitated through the Talanoa Dialogue. Discussions are in the first five‐year cycle (2015‐20), after which all Parties to the United Nations Framework Convention on Climate Change (UNFCCC) take stock of their progress towards achieving their long‐term objectives under the 2015 Paris Agreement.
Five countries updated their NDCs in 2017‐18 with specific mentions of buildings and construction. For instance, Canada revised its previously submitted NDC with new targets for the buildings sector, including “net‐zero energy ready” building codes to be adopted by provinces and territories.
A total of 136 NDCs now reference the buildings sector, compared to 132 in 2017. Most NDCs still do not have specific targets or policy actions on buildings, although analysis of NDCs and existing building policies show that around 63% of buildings‐related CO2 emissions are now covered – a slight improvement from 60% coverage previously.
The Global Alliance for Buildings and Construction (GlobalABC) is supporting countries in their NDC updates, and it contributed to the Talanoa Dialogue in March 2018 when it set out how the global buildings and construction sector can facilitate emissions reductions. Furthermore, the GlobalABC is developing a guidance tool on incorporating buildings sector climate actions in NDCs, aiding parties wishing to develop or update meaningful NDCs regarding buildings and construction.
1 These data cover buildings and construction, including the manufacture of materials and products for buildings construction, such as steel, cement and glass. Further information is available in the section “Global status”.
2018 Global Status Report
Towards a zero‐emission, efficient and resilient buildings and construction sector
Page | 10
Buildings sector policies and investments are not improving quickly enough
The number of building codes implemented has grown over the past 10 years, with 69 countries now having either voluntary or mandatory buildings energy codes in place or under development. This is an increase from 54 countries in 2010. However, despite this progress, two‐thirds of countries still do not have building energy codes, and most changes in 2017‐18 were updates to previously existing energy codes.
Similarly, only 85 countries have adopted building certification programmes. Updates in 2017‐18 appear to be concentrated in countries that already had building energy codes or certification programmes. While use of certification programmes is growing, voluntary certification still remains common in most countries.
Many jurisdictions and organisations are supporting sustainable buildings and construction beyond NDCs, building energy codes and certificates. For example, Mexico plans to eliminate electricity subsidies that discourage energy efficiency investments. Mayors from 19 cities, representing 130 million people globally, committed in 2018 to achieving net‐zero carbon in new buildings by 2030. Cities also made 443 additional commitments pledging to move towards 100% electricity generated from renewable sources of energy (renewable electricity) by 2035.
Global efforts do not provide the necessary momentum to drive major change towards sustainable buildings and construction. Energy efficiency spending for buildings appears to be slowing down, with incremental energy efficiency investment increasing by only 4.7% (3% adjusted for inflation) in 2017, compared to the 6‐11% annual growth rates from 2014 to 2016.
Social and economic benefits are at hand and ready for the taking
The multiple benefits of energy‐efficient, resilient and sustainable buildings are significant. They include local benefits such as job creation, increased productivity, reductions in local air pollution, and poverty alleviation. All of these enable greater social and economic development. For example, the WELL Building Standard includes optimising indoor daylight levels, where studies in Europe have shown that people living and working in well‐lit and properly conditioned spaces report poor health half as often.
Some countries and cities have seen substantial job creation as part of energy efficiency actions and related to the incremental investment of more than 140 billion United States dollars (USD) in buildings’ energy efficiency in 2017. Further benefits include increasing access to cleaner fuels and technologies in buildings, which will reduce exposure to indoor‐generated air pollution and increase access to energy services. For the first time ever, the number of people without access to electricity fell to less than 1 billion in 2017, down from 1.7 billion in 2000.
Achieving sustainable buildings and construction starts today
The global average building energy intensity per unit of floor area needs to be at least 30% lower than current levels. Actions ranging from sustainable material choices and building design to urban planning measures, adaptation and resilience plans, clean energy transitions, and building operations and renovation approaches all provide an opportunity to realise this ambitious target, as identified by the GlobalABC in its Global Roadmap.
The good news is that examples in this report illustrate how countries, cities, organisations and other stakeholders are already working towards sustainable buildings and construction. Realising the potential of the buildings and construction sector to meet the Sustainable Development Goals and avoid the lock‐in of inefficient buildings requires global efforts, ranging from policy, technology, and financing tools to increased international co‐operation, greater education and awareness, and better training and capacity building across the buildings value chain.
2018 Global Status Report Towards a zero‐emission, efficient and resilient buildings and construction sector
Page | 11
Global status Tracking the buildings and construction sector shows that there is progress on policies, a stalling of investment growth in energy efficiency, a levelling off in emissions and a growth in energy.
Energy and emissions in the buildings and construction sector
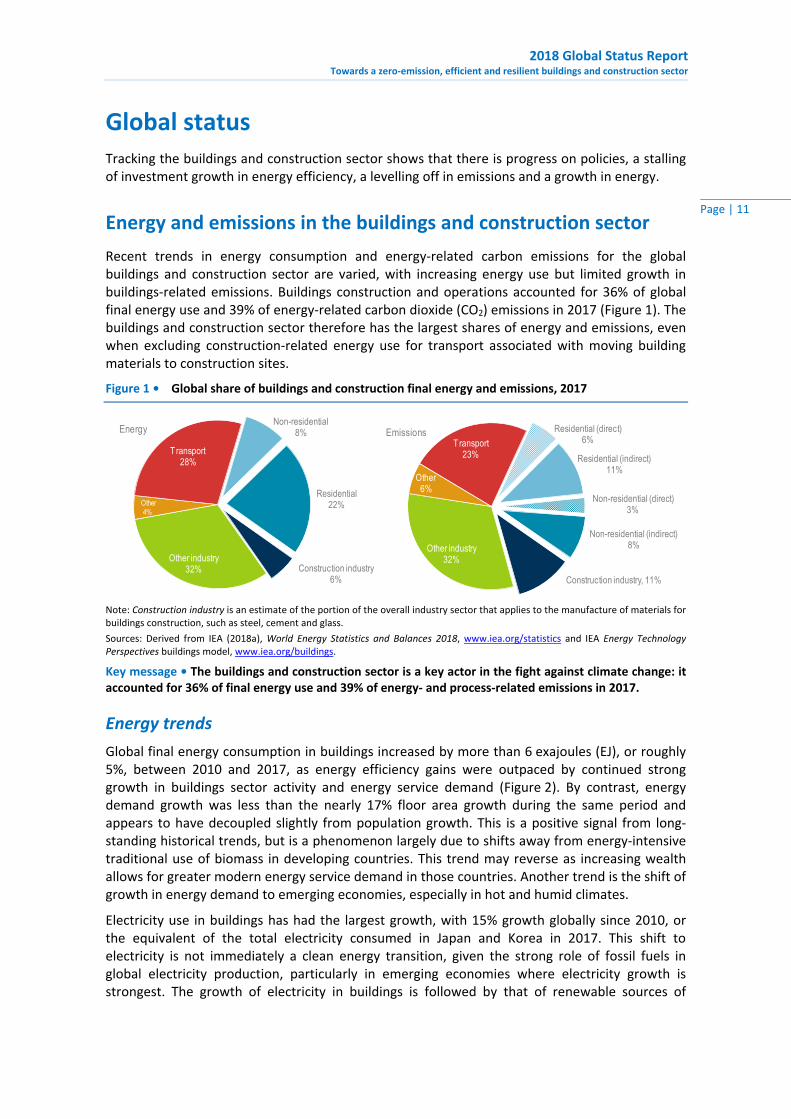
Recent trends in energy consumption and energy‐related carbon emissions for the global buildings and construction sector are varied, with increasing energy use but limited growth in buildings‐related emissions. Buildings construction and operations accounted for 36% of global final energy use and 39% of energy‐related carbon dioxide (CO2) emissions in 2017 (Figure 1). The buildings and construction sector therefore has the largest shares of energy and emissions, even when excluding construction‐related energy use for transport associated with moving building materials to construction sites.
Figure 1 • Global share of buildings and construction final energy and emissions, 2017
Note: Construction industry is an estimate of the portion of the overall industry sector that applies to the manufacture of materials for buildings construction, such as steel, cement and glass.
Sources: Derived from IEA (2018a), World Energy Statistics and Balances 2018, www.iea.org/statistics and IEA Energy Technology Perspectives buildings model, www.iea.org/buildings.
Key message • The buildings and construction sector is a key actor in the fight against climate change: it accounted for 36% of final energy use and 39% of energy‐ and process‐related emissions in 2017.
Energy trends
Global final energy consumption in buildings increased by more than 6 exajoules (EJ), or roughly 5%, between 2010 and 2017, as energy efficiency gains were outpaced by continued strong growth in buildings sector activity and energy service demand (Figure 2). By contrast, energy demand growth was less than the nearly 17% floor area growth during the same period and appears to have decoupled slightly from population growth. This is a positive signal from long‐standing historical trends, but is a phenomenon largely due to shifts away from energy‐intensive traditional use of biomass in developing countries. This trend may reverse as increasing wealth allows for greater modern energy service demand in those countries. Another trend is the shift of growth in energy demand to emerging economies, especially in hot and humid climates.
Electricity use in buildings has had the largest growth, with 15% growth globally since 2010, or the equivalent of the total electricity consumed in Japan and Korea in 2017. This shift to electricity is not immediately a clean energy transition, given the strong role of fossil fuels in global electricity production, particularly in emerging economies where electricity growth is strongest. The growth of electricity in buildings is followed by that of renewable sources of
Construction industry6%
Other industry32%
Other4%
Transport28%
Non-residential8%
Residential22%
Energy
Construction industry, 11%
Other industry32%
Other6%
Transport23%
Residential (direct)6%
Residential (indirect)11%
Non-residential (direct)3%
Non-residential (indirect)8%
Emissions
2018 Global Status Report
Towards a zero‐emission, efficient and resilient buildings and construction sector
Page | 12
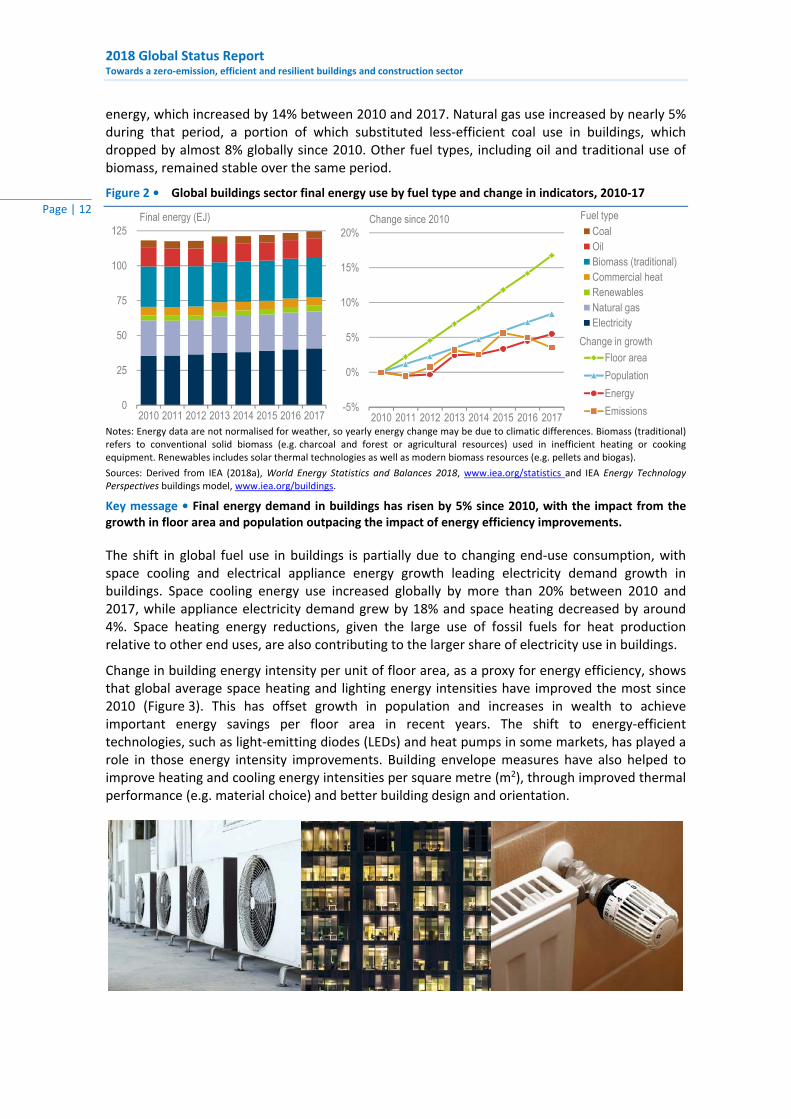
energy, which increased by 14% between 2010 and 2017. Natural gas use increased by nearly 5% during that period, a portion of which substituted less‐efficient coal use in buildings, which dropped by almost 8% globally since 2010. Other fuel types, including oil and traditional use of biomass, remained stable over the same period.
Figure 2 • Global buildings sector final energy use by fuel type and change in indicators, 2010‐17
Notes: Energy data are not normalised for weather, so yearly energy change may be due to climatic differences. Biomass (traditional) refers to conventional solid biomass (e.g. charcoal and forest or agricultural resources) used in inefficient heating or cooking equipment. Renewables includes solar thermal technologies as well as modern biomass resources (e.g. pellets and biogas).
Sources: Derived from IEA (2018a), World Energy Statistics and Balances 2018, www.iea.org/statistics and IEA Energy Technology Perspectives buildings model, www.iea.org/buildings.
Key message • Final energy demand in buildings has risen by 5% since 2010, with the impact from the growth in floor area and population outpacing the impact of energy efficiency improvements.
The shift in global fuel use in buildings is partially due to changing end‐use consumption, with space cooling and electrical appliance energy growth leading electricity demand growth in buildings. Space cooling energy use increased globally by more than 20% between 2010 and 2017, while appliance electricity demand grew by 18% and space heating decreased by around 4%. Space heating energy reductions, given the large use of fossil fuels for heat production relative to other end uses, are also contributing to the larger share of electricity use in buildings.
Change in building energy intensity per unit of floor area, as a proxy for energy efficiency, shows that global average space heating and lighting energy intensities have improved the most since 2010 (Figure 3). This has offset growth in population and increases in wealth to achieve important energy savings per floor area in recent years. The shift to energy‐efficient technologies, such as light‐emitting diodes (LEDs) and heat pumps in some markets, has played a role in those energy intensity improvements. Building envelope measures have also helped to improve heating and cooling energy intensities per square metre (m2), through improved thermal performance (e.g. material choice) and better building design and orientation.
0
25
50
75
100
125
2010 2011 2012 2013 2014 2015 2016 2017
Final energy (EJ) Fuel typeCoalOilBiomass (traditional)Commercial heatRenewablesNatural gasElectricity
-5%
0%
5%
10%
15%
20%
2010 2011 2012 2013 2014 2015 2016 2017
Change in growth
Change since 2010
Floor area
Population
Energy
Emissions

2018 Global Status Report Towards a zero‐emission, efficient and resilient buildings and construction sector
Page | 13
Figure 3 • Global buildings final energy use and change in intensity by end use, 2010‐17
Notes: Energy intensity is final energy per unit floor area. Appliances and other includes household appliances (e.g. refrigerators, washers and televisions), smaller plug loads (e.g. laptops, phones and electronics) and other services equipment.
Sources: Derived from IEA (2018a), World Energy Statistics and Balances 2018, www.iea.org/statistics and IEA Energy Technology Perspectives buildings model, www.iea.org/buildings.
Key message • Space cooling and appliances and other plug loads are the fastest‐growing building end uses; however, only space cooling has grown in energy intensity per unit floor area.
Separating the impacts of influential factors of global building energy use illustrates the influence on buildings sector energy use from population, floor area and other energy service demand activity (e.g. growing ownership of household appliances and rising use of cooling equipment). Globally, building envelope measures (e.g. improved windows and insulation) and improvements in performance of building energy systems (e.g. heating, cooling and ventilation) and components (e.g. cooking equipment) have all helped to offset the effects of population, floor area and energy service activity in buildings (Figure 4). Climate effects from warmer winters have also limited overall energy growth. However, the hot summers of 2017 and 2018 prompted air‐conditioning (AC) growth (not visible given the smaller share of cooling energy use globally).
Figure 4 • Influence of factors on global buildings energy use, 2010‐17
Notes: Access indicates increased access to modern energy services in buildings, notably electricity in developing countries. Building use reflects changes in energy service (e.g. change in temperature setting). Climate indicates changes in cooling or heating degree days. Envelope reflects energy performance (i.e. thermal resistance) of the building shell. Systems include energy technologies and equipment, such as heating, cooling, ventilation, lighting, appliances, cooking equipment and miscellaneous plug loads. Total energy change is the overall change in final energy since 2010 when the other factors are taken into account.
Source: Derived from IEA (2018a), World Energy Statistics and Balances 2018, www.iea.org/statistics and IEA Energy Technology Perspectives buildings model, www.iea.org/buildings.
Key message • Buildings sector energy use continues to grow, despite improvements in building envelopes and systems, which are not fast enough to offset strong population and floor area growth.
-18%
-12%
-6%
0%
6%
12%
0
25
50
75
100
125
2010 2011 2012 2013 2014 2015 2016 2017
Final energy (EJ) Change in energy intensity since 2010
Appliances and other
Cooking
Lighting
Water heating
Space cooling
Space heating
- 15
- 10
- 5
0
5
10
15
2010 2011 2012 2013 2014 2015 2016 2017
Access
Building use
Floor area
Population
Climate
Envelope
Systems
Total energychange
Change in final energy since 2010 (EJ)
2018 Global Status Report
Towards a zero‐emission, efficient and resilient buildings and construction sector
Page | 14
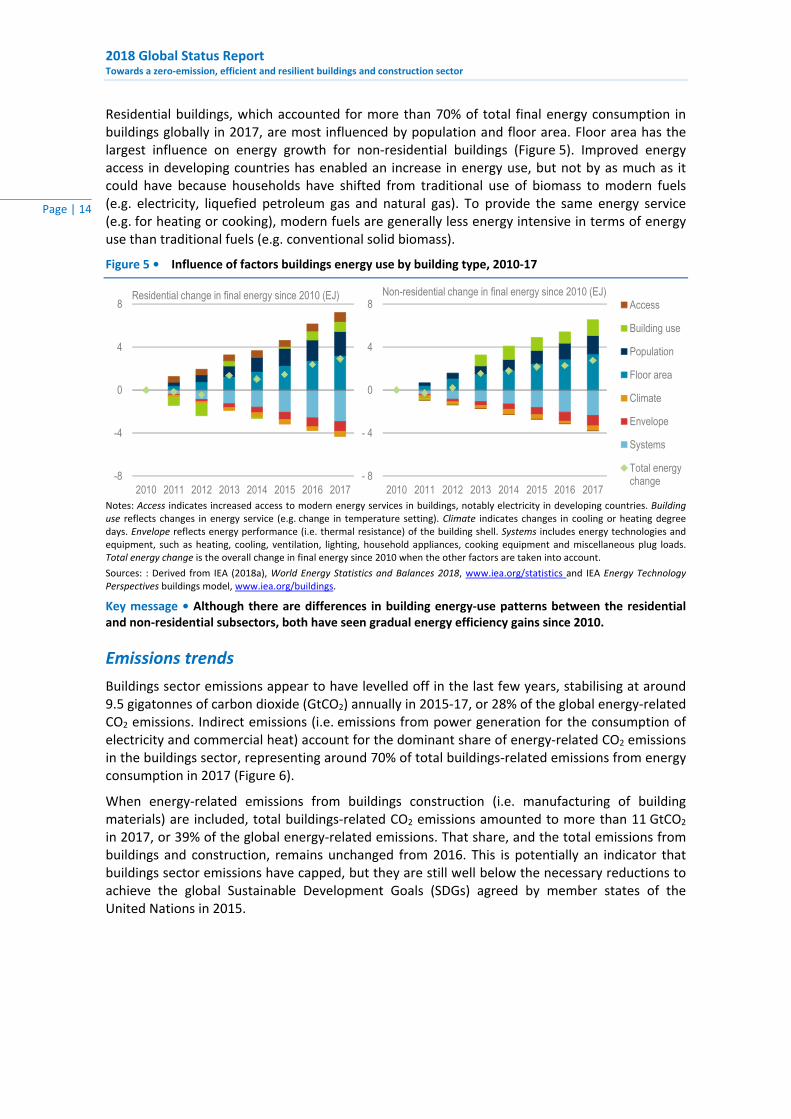
Residential buildings, which accounted for more than 70% of total final energy consumption in buildings globally in 2017, are most influenced by population and floor area. Floor area has the largest influence on energy growth for non‐residential buildings (Figure 5). Improved energy access in developing countries has enabled an increase in energy use, but not by as much as it could have because households have shifted from traditional use of biomass to modern fuels (e.g. electricity, liquefied petroleum gas and natural gas). To provide the same energy service (e.g. for heating or cooking), modern fuels are generally less energy intensive in terms of energy use than traditional fuels (e.g. conventional solid biomass).
Figure 5 • Influence of factors buildings energy use by building type, 2010‐17
Notes: Access indicates increased access to modern energy services in buildings, notably electricity in developing countries. Building use reflects changes in energy service (e.g. change in temperature setting). Climate indicates changes in cooling or heating degree days. Envelope reflects energy performance (i.e. thermal resistance) of the building shell. Systems includes energy technologies and equipment, such as heating, cooling, ventilation, lighting, household appliances, cooking equipment and miscellaneous plug loads. Total energy change is the overall change in final energy since 2010 when the other factors are taken into account.
Sources: : Derived from IEA (2018a), World Energy Statistics and Balances 2018, www.iea.org/statistics and IEA Energy Technology Perspectives buildings model, www.iea.org/buildings.
Key message • Although there are differences in building energy‐use patterns between the residential and non‐residential subsectors, both have seen gradual energy efficiency gains since 2010.
Emissions trends
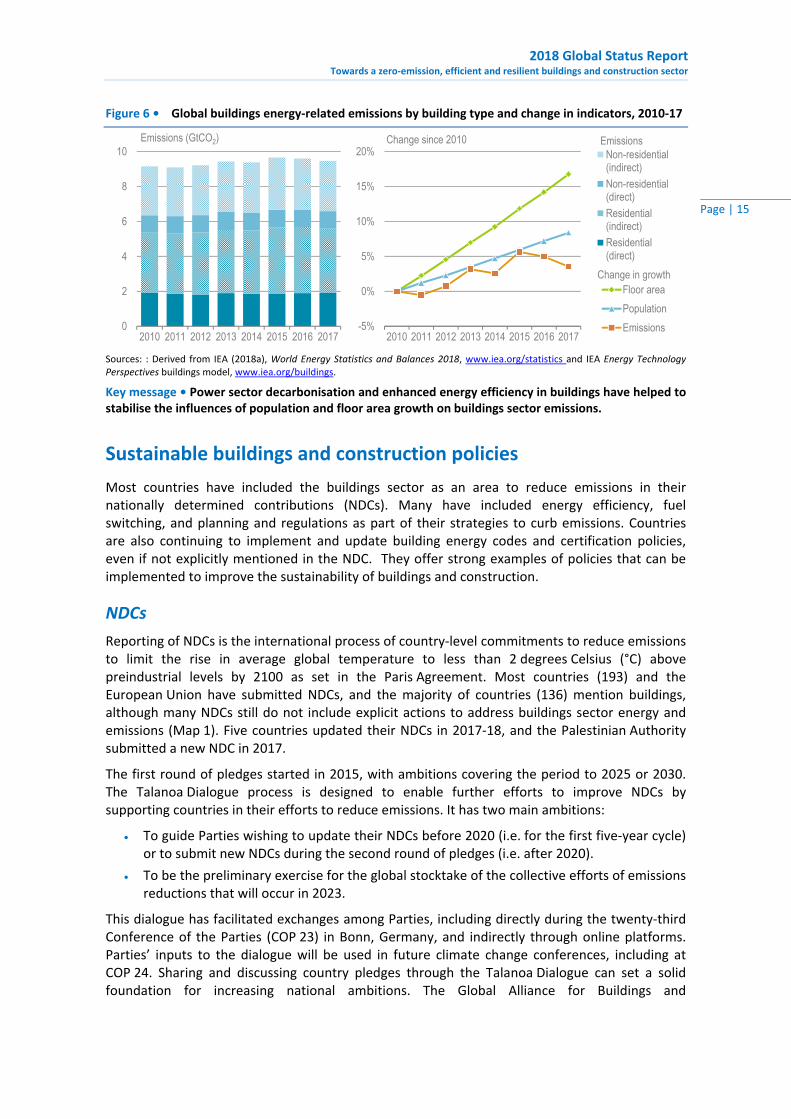
Buildings sector emissions appear to have levelled off in the last few years, stabilising at around 9.5 gigatonnes of carbon dioxide (GtCO2) annually in 2015‐17, or 28% of the global energy‐related CO2 emissions. Indirect emissions (i.e. emissions from power generation for the consumption of electricity and commercial heat) account for the dominant share of energy‐related CO2 emissions in the buildings sector, representing around 70% of total buildings‐related emissions from energy consumption in 2017 (Figure 6).
When energy‐related emissions from buildings construction (i.e. manufacturing of building materials) are included, total buildings‐related CO2 emissions amounted to more than 11 GtCO2 in 2017, or 39% of the global energy‐related emissions. That share, and the total emissions from buildings and construction, remains unchanged from 2016. This is potentially an indicator that buildings sector emissions have capped, but they are still well below the necessary reductions to achieve the global Sustainable Development Goals (SDGs) agreed by member states of the United Nations in 2015.
-8
-4
0
4
8
2010 2011 2012 2013 2014 2015 2016 2017
Access
Building use
Population
Floor area
Climate
Envelope
Systems
Total energychange
Residential change in final energy since 2010 (EJ) Non-residential change in final energy since 2010 (EJ)
- 8
- 4
0
4
8
2010 2011 2012 2013 2014 2015 2016 2017
2018 Global Status Report Towards a zero‐emission, efficient and resilient buildings and construction sector
Page | 15
Figure 6 • Global buildings energy‐related emissions by building type and change in indicators, 2010‐17
Sources: : Derived from IEA (2018a), World Energy Statistics and Balances 2018, www.iea.org/statistics and IEA Energy Technology Perspectives buildings model, www.iea.org/buildings.
Key message • Power sector decarbonisation and enhanced energy efficiency in buildings have helped to stabilise the influences of population and floor area growth on buildings sector emissions.
Sustainable buildings and construction policies
Most countries have included the buildings sector as an area to reduce emissions in their nationally determined contributions (NDCs). Many have included energy efficiency, fuel switching, and planning and regulations as part of their strategies to curb emissions. Countries are also continuing to implement and update building energy codes and certification policies, even if not explicitly mentioned in the NDC. They offer strong examples of policies that can be implemented to improve the sustainability of buildings and construction.
NDCs
Reporting of NDCs is the international process of country‐level commitments to reduce emissions to limit the rise in average global temperature to less than 2 degrees Celsius (°C) above preindustrial levels by 2100 as set in the Paris Agreement. Most countries (193) and the European Union have submitted NDCs, and the majority of countries (136) mention buildings, although many NDCs still do not include explicit actions to address buildings sector energy and emissions (Map 1). Five countries updated their NDCs in 2017‐18, and the Palestinian Authority submitted a new NDC in 2017.
The first round of pledges started in 2015, with ambitions covering the period to 2025 or 2030. The Talanoa Dialogue process is designed to enable further efforts to improve NDCs by supporting countries in their efforts to reduce emissions. It has two main ambitions:
To guide Parties wishing to update their NDCs before 2020 (i.e. for the first five‐year cycle) or to submit new NDCs during the second round of pledges (i.e. after 2020).
To be the preliminary exercise for the global stocktake of the collective efforts of emissions reductions that will occur in 2023.
This dialogue has facilitated exchanges among Parties, including directly during the twenty‐third Conference of the Parties (COP 23) in Bonn, Germany, and indirectly through online platforms. Parties’ inputs to the dialogue will be used in future climate change conferences, including at COP 24. Sharing and discussing country pledges through the Talanoa Dialogue can set a solid foundation for increasing national ambitions. The Global Alliance for Buildings and
-5%
0%
5%
10%
15%
20%
2010 2011 2012 2013 2014 2015 2016 2017
Change since 2010
Change in growthFloor area
Population
Emissions0
2
4
6
8
10
2010 2011 2012 2013 2014 2015 2016 2017
Emissions (GtCO2) EmissionsNon-residential(indirect)
Non-residential(direct)
Residential(indirect)
Residential(direct)
2018 Global Status Report
Towards a zero‐emission, efficient and resilient buildings and construction sector
Page | 16
Construction (GlobalABC) is also supporting countries in their NDC updates, and it contributed to the Talanoa Dialogue in March 2018 when it set out how the global buildings and construction sector can facilitate emissions reductions (GlobalABC, 2018).
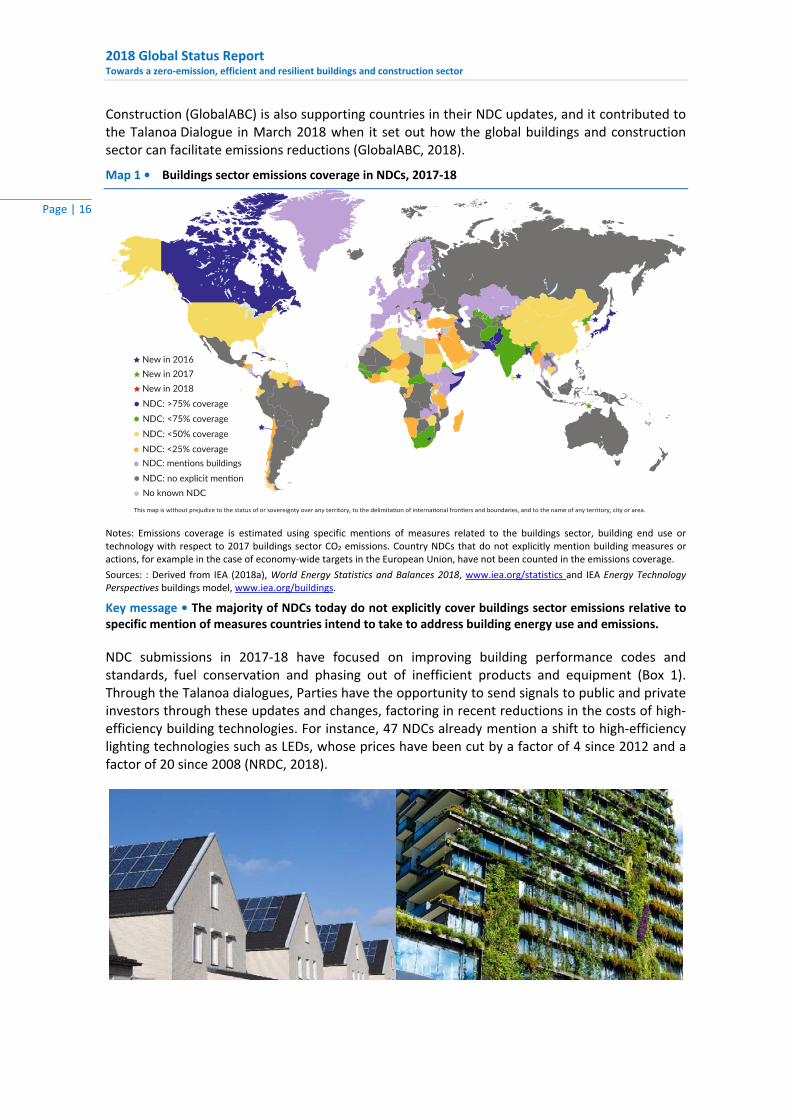
Map 1 • Buildings sector emissions coverage in NDCs, 2017‐18
Notes: Emissions coverage is estimated using specific mentions of measures related to the buildings sector, building end use or technology with respect to 2017 buildings sector CO2 emissions. Country NDCs that do not explicitly mention building measures or actions, for example in the case of economy‐wide targets in the European Union, have not been counted in the emissions coverage.
Sources: : Derived from IEA (2018a), World Energy Statistics and Balances 2018, www.iea.org/statistics and IEA Energy Technology Perspectives buildings model, www.iea.org/buildings.
Key message • The majority of NDCs today do not explicitly cover buildings sector emissions relative to specific mention of measures countries intend to take to address building energy use and emissions.
NDC submissions in 2017‐18 have focused on improving building performance codes and standards, fuel conservation and phasing out of inefficient products and equipment (Box 1). Through the Talanoa dialogues, Parties have the opportunity to send signals to public and private investors through these updates and changes, factoring in recent reductions in the costs of high‐efficiency building technologies. For instance, 47 NDCs already mention a shift to high‐efficiency lighting technologies such as LEDs, whose prices have been cut by a factor of 4 since 2012 and a factor of 20 since 2008 (NRDC, 2018).
2018 Global Status Report Towards a zero‐emission, efficient and resilient buildings and construction sector
Page | 17
Box 1 • NDC updates related to buildings and construction in 2017‐18
Canada
In May 2017, Canada revised its previously submitted NDC, following the release of the Pan‐Canadian Framework on Clean Growth and Climate Change. The revised NDC set targets for the buildings sector, including: developing “net‐zero energy ready” building codes to be adopted by provinces and territories by 2030 for new buildings; retrofitting existing buildings based on new retrofit codes; and providing businesses and consumers with information on energy performance. Enhancing the energy performance of appliances and equipment is also part of Canada’s ambitions.
France
Metropolitan France reaffirmed its commitment at the end of 2016 to meet pledges submitted at the European Union (EU) level in 2015, while setting separate targets for its overseas territories and departments. In addition, French Polynesia released a complementary NDC that plans to promote sustainable construction practices, with regulations on fuel consumption for the commercial sector. Saint Barthélemy intends to tap into the energy‐saving potential of improved building envelopes and energy‐efficient ACs. Saint Pierre and Miquelon committed to building heating networks to increase energy efficiency and reduce total emissions by 5%.
El Salvador
El Salvador set quantified greenhouse gas (GHG) emissions reduction targets for the energy sector in October 2017: 46% by 2025 compared to a business‐as‐usual scenario. An additional 15% could be achieved with financial support from the international community for development of geothermal energy. El Salvador confirmed its ambition to promote enhanced building envelopes for energy efficiency and thermal comfort, especially for residential and office buildings. It also wants to reap the benefits of innovative construction practices to meet climate mitigation and adaptation objectives.
Lesotho
Lesotho released an updated NDC in December 2017, which committed to decarbonising the buildings sector. It intends to phase out incandescent lighting, introduce energy‐efficient stoves in households, implement incentives for retrofits and regulations for construction, and reduce the share of traditional solid biomass to 10% by 2030. Lesotho also plans to implement climate‐related building codes and standards, launch energy efficiency programmes, shift to environment‐friendly refrigerants, and develop national standards for alternative building materials and technologies.
Palestinian Authority
In March 2016, the Palestinian Authority formally entered the United Nations Framework Convention on Climate Change (UNFCCC) and a month later it ratified the Paris Agreement. Its NDC gives priority to climate change adaptation, but also considers actions to reduce buildings‐related emissions by upgrading energy efficiency standards in buildings and improving upon existing regulations. It aims to increase the uptake of high‐efficiency lighting technologies by 1% every year through new performance standards. It is also integrating solar photovoltaic (PV) panels on public buildings. The mitigation actions are dependent on financial and capacity‐building support from the international community.
Papua New Guinea
In May 2017, Papua New Guinea confirmed the climate pledges submitted in its first NDC and added explanatory notes. The country is committed to reducing GHG emissions by 10% by 2030 compared to a business‐as‐usual scenario, or 20% by 2030, conditional on international support.
A total of 136 NDCs now reference the buildings sector, but most do not have specific targets or policy actions on buildings (Figure 7). Analysis of NDCs and existing building policies shows that more than 50% of buildings‐related CO2 emissions were covered by existing policies in 2017 – a slight improvement from 47% coverage in 2016.2 If NDCs are realised as future policy, that coverage would increase to more than 60%. However, the strength of the policies and the specificity of NDCs need further attention, where coverage does not indicate performance.
2 International Energy Agency (IEA) policy coverage analysis estimates the portion of energy use and emissions associated with building end uses having requirements within policies or that are mentioned in NDCs. It does not reflect reductions in energy or emissions and is an indicator of the portion of current energy and emissions that fall under existing or expected policies.
2018 Global Status Report
Towards a zero‐emission, efficient and resilient buildings and construction sector
Page | 18
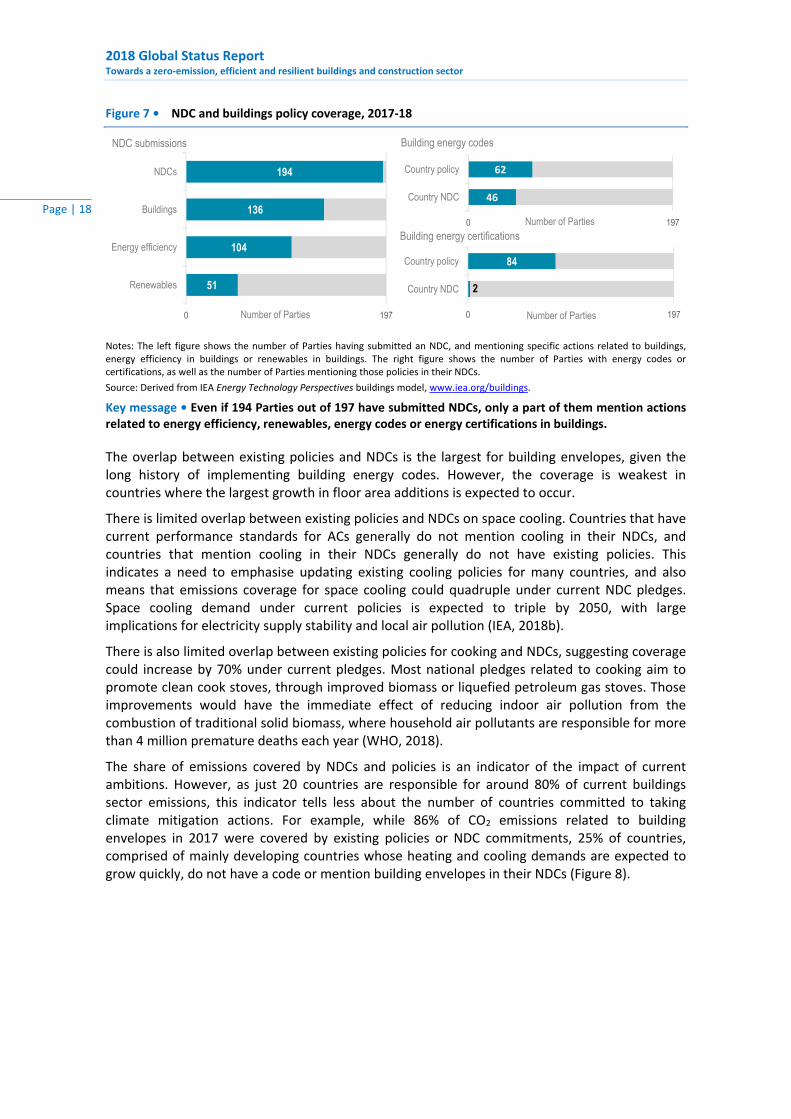
Figure 7 • NDC and buildings policy coverage, 2017‐18
Notes: The left figure shows the number of Parties having submitted an NDC, and mentioning specific actions related to buildings, energy efficiency in buildings or renewables in buildings. The right figure shows the number of Parties with energy codes or certifications, as well as the number of Parties mentioning those policies in their NDCs.
Source: Derived from IEA Energy Technology Perspectives buildings model, www.iea.org/buildings.
Key message • Even if 194 Parties out of 197 have submitted NDCs, only a part of them mention actions related to energy efficiency, renewables, energy codes or energy certifications in buildings.
The overlap between existing policies and NDCs is the largest for building envelopes, given the long history of implementing building energy codes. However, the coverage is weakest in countries where the largest growth in floor area additions is expected to occur.
There is limited overlap between existing policies and NDCs on space cooling. Countries that have current performance standards for ACs generally do not mention cooling in their NDCs, and countries that mention cooling in their NDCs generally do not have existing policies. This indicates a need to emphasise updating existing cooling policies for many countries, and also means that emissions coverage for space cooling could quadruple under current NDC pledges. Space cooling demand under current policies is expected to triple by 2050, with large implications for electricity supply stability and local air pollution (IEA, 2018b).
There is also limited overlap between existing policies for cooking and NDCs, suggesting coverage could increase by 70% under current pledges. Most national pledges related to cooking aim to promote clean cook stoves, through improved biomass or liquefied petroleum gas stoves. Those improvements would have the immediate effect of reducing indoor air pollution from the combustion of traditional solid biomass, where household air pollutants are responsible for more than 4 million premature deaths each year (WHO, 2018).
The share of emissions covered by NDCs and policies is an indicator of the impact of current ambitions. However, as just 20 countries are responsible for around 80% of current buildings sector emissions, this indicator tells less about the number of countries committed to taking climate mitigation actions. For example, while 86% of CO2 emissions related to building envelopes in 2017 were covered by existing policies or NDC commitments, 25% of countries, comprised of mainly developing countries whose heating and cooling demands are expected to grow quickly, do not have a code or mention building envelopes in their NDCs (Figure 8).
51
104
136
194
0 197
Renewables
Energy efficiency
Buildings
NDCs
Number of Parties
NDC submissions
2
84
0 197
Country NDC
Country policy
Number of Parties
Building energy certifications
46
62
0 197
Country NDC
Country policy
Number of Parties
Building energy codes
2018 Global Status Report Towards a zero‐emission, efficient and resilient buildings and construction sector
Page | 19
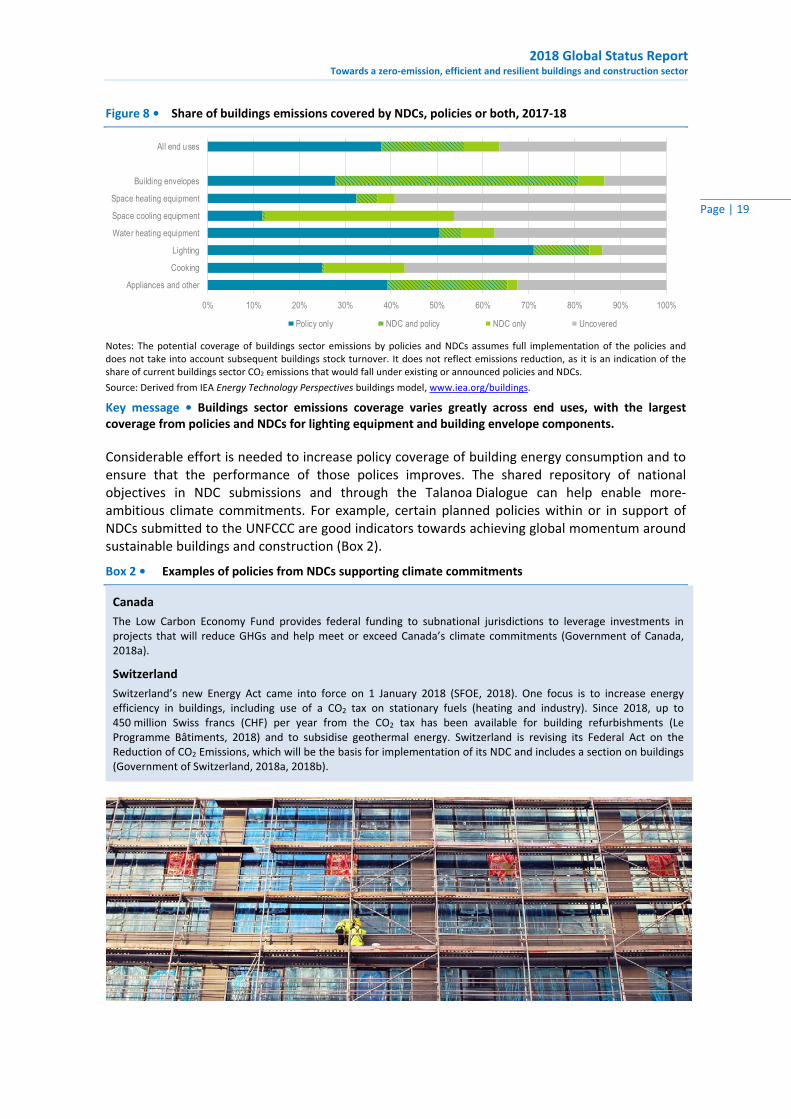
Figure 8 • Share of buildings emissions covered by NDCs, policies or both, 2017‐18
Notes: The potential coverage of buildings sector emissions by policies and NDCs assumes full implementation of the policies and does not take into account subsequent buildings stock turnover. It does not reflect emissions reduction, as it is an indication of the share of current buildings sector CO2 emissions that would fall under existing or announced policies and NDCs.
Source: Derived from IEA Energy Technology Perspectives buildings model, www.iea.org/buildings.
Key message • Buildings sector emissions coverage varies greatly across end uses, with the largest coverage from policies and NDCs for lighting equipment and building envelope components.
Considerable effort is needed to increase policy coverage of building energy consumption and to ensure that the performance of those polices improves. The shared repository of national objectives in NDC submissions and through the Talanoa Dialogue can help enable more‐ambitious climate commitments. For example, certain planned policies within or in support of NDCs submitted to the UNFCCC are good indicators towards achieving global momentum around sustainable buildings and construction (Box 2).
Box 2 • Examples of policies from NDCs supporting climate commitments
Canada
The Low Carbon Economy Fund provides federal funding to subnational jurisdictions to leverage investments in projects that will reduce GHGs and help meet or exceed Canada’s climate commitments (Government of Canada, 2018a).
Switzerland
Switzerland’s new Energy Act came into force on 1 January 2018 (SFOE, 2018). One focus is to increase energy efficiency in buildings, including use of a CO2 tax on stationary fuels (heating and industry). Since 2018, up to 450 million Swiss francs (CHF) per year from the CO2 tax has been available for building refurbishments (Le Programme Bâtiments, 2018) and to subsidise geothermal energy. Switzerland is revising its Federal Act on the Reduction of CO2 Emissions, which will be the basis for implementation of its NDC and includes a section on buildings (Government of Switzerland, 2018a, 2018b).
0% 10% 20% 30% 40% 50% 60% 70% 80% 90% 100%
Appliances and other
Cooking
Lighting
Water heating equipment
Space cooling equipment
Space heating equipment
Building envelopes
All end uses
Policy only NDC and policy NDC only Uncovered
2018 Global Status Report
Towards a zero‐emission, efficient and resilient buildings and construction sector
Page | 20
Building energy codes
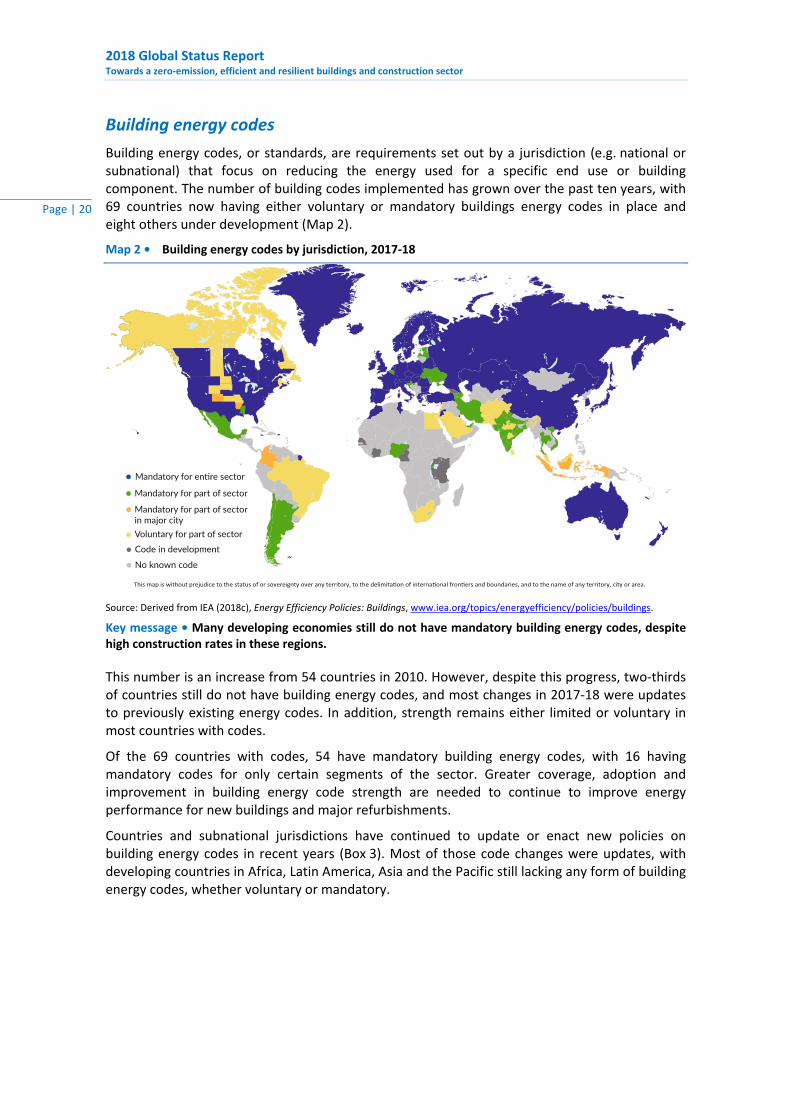
Building energy codes, or standards, are requirements set out by a jurisdiction (e.g. national or subnational) that focus on reducing the energy used for a specific end use or building component. The number of building codes implemented has grown over the past ten years, with 69 countries now having either voluntary or mandatory buildings energy codes in place and eight others under development (Map 2).
Map 2 • Building energy codes by jurisdiction, 2017‐18
Source: Derived from IEA (2018c), Energy Efficiency Policies: Buildings, www.iea.org/topics/energyefficiency/policies/buildings.
Key message • Many developing economies still do not have mandatory building energy codes, despite high construction rates in these regions.
This number is an increase from 54 countries in 2010. However, despite this progress, two‐thirds of countries still do not have building energy codes, and most changes in 2017‐18 were updates to previously existing energy codes. In addition, strength remains either limited or voluntary in most countries with codes.
Of the 69 countries with codes, 54 have mandatory building energy codes, with 16 having mandatory codes for only certain segments of the sector. Greater coverage, adoption and improvement in building energy code strength are needed to continue to improve energy performance for new buildings and major refurbishments.
Countries and subnational jurisdictions have continued to update or enact new policies on building energy codes in recent years (Box 3). Most of those code changes were updates, with developing countries in Africa, Latin America, Asia and the Pacific still lacking any form of building energy codes, whether voluntary or mandatory.
2018 Global Status Report Towards a zero‐emission, efficient and resilient buildings and construction sector
Page | 21
Box 3 • Examples of building energy codes by jurisdiction
Argentina
Argentina’s national government has developed a national standard for thermal envelope performance that applies to social housing. This social housing policy is the first national standard for building energy performance, and building codes in Argentina are generally local policies.3
Canada
Canada has a continuous improvement process and is guided by the target of achieving net‐zero energy ready buildings by 2030. The National Energy Code of Canada for Buildings 2017 pushes towards that target with a 10% energy savings compared to the 2011 version (NRCC, 2018).
Canada (British Columbia)
British Columbia has committed to taking steps to increase energy efficiency requirements to make buildings net‐zero energy ready by 2032. The province developed the Energy Step Code in April 2017 as a voluntary standard for higher efficiency in buildings through a performance‐based approach (British Columbia, 2018). The city of Vancouver has also developed a Zero Emissions Building Plan and is working to advance the education and support for zero‐emissions buildings construction. Through this process, the city is planning to change and develop new policies and guidelines to increase the penetration of zero‐emissions buildings (City of Vancouver, 2018).
Colombia
Bogotá has become the first subnational jurisdiction in Colombia to implement national Resolution 549/15. Through the Building Efficiency Accelerator, Bogotá committed publicly to implementing a building energy code, with official support from multiple city departments. It was then determined that the Colombian national green building policy could not be implemented without collecting additional information on the baseline of building efficiency in the city to develop clear pathways for compliance. A consortium of the Consejo Colombiano de Construcción Sostenible partnership, Bogotá city officials, Building Efficiency Accelerator and the Pacific Northwest National Laboratory then assessed how to adapt, adopt and implement the national green building guidelines into a usable construction code. Bogotá also enlisted Colombian university researchers, utility executives and construction leaders to collect data to develop a local baseline and define multiple pathways for compliance with the energy‐ and water‐saving code. As Bogotá is finalising legal adoption and implementation of the code, it will work with the national government to improve the existing national policy and provide assistance to other cities to ease the process of adoption in other parts of the country.4
Denmark
Danish building regulations have introduced two renovation classes, where owners can choose from two different levels to renovate buildings. The advantage is that the methodology follows the approach for new buildings, where renewable energy is included, and owners get benchmarks to new and existing buildings. The best class also sets requirements for indoor comfort levels to the new building code level.5
European Union
An amendment (2018/844/EU) to the Energy Performance of Buildings Directive (EPBD) was published on 19 June 2018. This amendment introduces revisions to the EPBD to accelerate renovation of existing buildings. The aim is for a buildings stock that is highly energy efficient and decarbonised by 2050 in a cost‐effective transformation to nearly zero energy buildings. Member states have until March 2020 to transpose provisions into national law (European Commission, 2018a).
France
Decree No. 2017‐919 of 9 May 2017 sets a requirement to undertake energy performance improvements when a major renovation occurs. This requires increased insulation when renovating 50% of an exterior surface (e.g. façade renovation, roof replacement or transformation of a non‐heated space into housing) with the aim for a “no‐regret” approach through optimised cost during an existing renovation process (République Française, 2018a). The French Energy Transition Law also sets a requirement on users and owners of tertiary buildings to reduce their final energy consumption, as compared to 2010, by 40% in 2030, 50% in 2040 and 60% in 2050, either through improved building operations or physical building and system improvements.6
3 Written communication from Ministry of Environment and Sustainable Development, Argentina. 4 Written communication from World Resources Institute. 5 Written communication from VELUX. 6 Written communication from Directorate General for Planning, Housing and Nature, France.
2018 Global Status Report
Towards a zero‐emission, efficient and resilient buildings and construction sector
Page | 22
Germany
The Energy Conservation Ordinance has been in effect since 2016 and requires new buildings to achieve a reduction of primary energy consumption by 25% and an improvement in building insulation by 20% (BMWi, 2018). The insulation improvement is a continuation of significant improvements in Germany through a series of policies that have achieved more than 75% heating energy savings since 1975 (IEA, 2016).
India
India took a step forward in 2018 with the development process for its first national model building energy code for residential buildings. The draft Energy Conservation Building Code for Residential Buildings has been developed to enable simple enforcement while also improving occupant thermal comfort and enabling the use of passive systems (BEE, 2018; BEEP India, 2018).
Japan
The Act on the Improvement of Energy Consumption Performance of Buildings (Building Energy Efficiency Act) came into effect in 2017. The Act includes regulatory measures for mandatory compliance with energy efficiency standards for non‐residential buildings with floor areas over 2 000 m2. It also requires mandatory notification to administrative agencies of plans for new construction, extensions and renovations for buildings with floor areas of 300 m2 or more (MLIT, 2018a).
Mexico
The Mexican federal government, in collaboration with stakeholders, developed a national model code when it published the Energy Conservation Code (CASEDI, 2016; CONAVI, 2017). This links legal code language and existing building standards, including for non‐residential and residential thermal envelopes (e.g. standards NOM‐ENER‐008‐2001 and NOM‐ENER‐020‐2011). This national model code is not mandatory until local governments adopt it in their local building regulations, which are not common. The Mexican National Housing Commission (CONAVI), which previously developed a building code for social housing that includes a chapter on sustainable development, is supporting the process to have locally adopted codes. CONAVI is also promoting sustainable solutions through a simulation tool developed with the support of Germany and the Passiv Haus Institute that has been used for 230 000 homes built over the last three years in Mexico.7
Switzerland
While each canton can individually adopt codes, the building energy codes in Switzerland are harmonised. The codes for the canton of Bern were revised in 2017‐18 and will be submitted to a public vote (referendum). For building refurbishment, Switzerland applies a target value for deep refurbishment of 75 kilowatt hours (kWh) per m2, which is about double the value of the mandatory standard for new buildings. For non‐residential buildings, the code limits electricity use in buildings with floor areas over 500 m2 and requires improvements every five years (EnDK, 2018a, 2018b). From 2020 onwards, new buildings shall produce their own thermal energy and a substantial proportion of electricity through integration of renewables. Electric resistance heaters and water heaters will be forbidden. A building refurbishment programme will subsidise building insulation and the integration of renewables by up to CHF 450 million per.8
United States
As of May 2018, the California 2019 Building Energy Efficiency Standards is the first code in the United States to require solar PV systems on new homes. In addition, the code also targeted energy efficiency, including 30% reduction in energy use for non‐residential buildings (CEC, 2018).
The New York State Energy Research and Development Authority has developed a stretch code (NYStretch Code – Energy) supplement with amendments to the latest national model codes (the 2018 International Energy Conservation Code and ASHRAE 90.1‐2016) to increase the overall efficiency and sustainability of buildings (NYSERDA, 2018). New York City also developed an energy code revision handbook, which includes the goals of the 2019 code to incorporate the latest version of the NYStretch Code – Energy based on Local Law 32 of 2018 (NYC, 2018).
Viet Nam
The national technical regulation QCVN 09:2017/BXD on energy efficiency buildings was revised and issued in December 2017 with the support of the Danish government and the participation of experts from the Viet Nam Association for the Built Environment, the International Finance Corporation (IFC) and the Pacific Northwest National Laboratory (Viet Nam, 2018).
7 Written communication from Ministry of Agricultural, Territorial and Urban Development, Mexico. 8 Written communication from Swiss Agency for Development and Cooperation.
2018 Global Status Report Towards a zero‐emission, efficient and resilient buildings and construction sector
Page | 23
Building energy certification
Building energy certification includes programmes and policies that evaluate the performance of a building and its energy service systems. Certification may focus on rating operational energy use or the expected (or notional) energy use of the building. It can be voluntary or mandatory for all or part of a buildings sector.
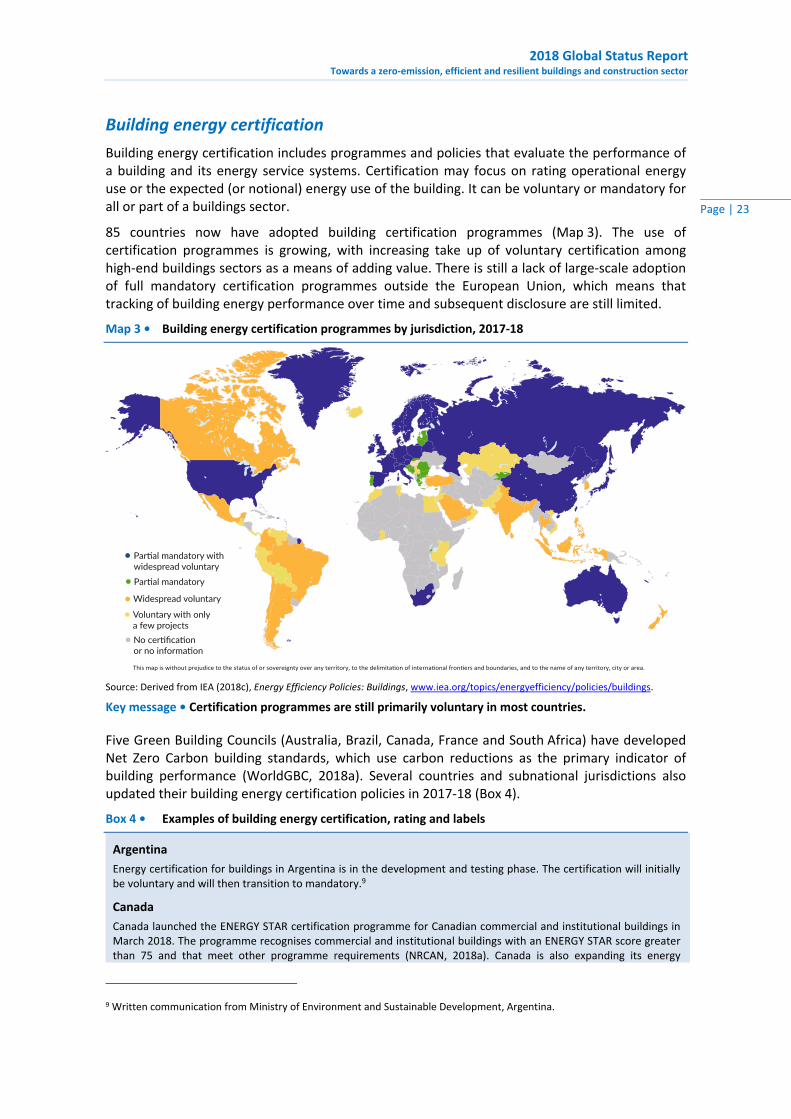
85 countries now have adopted building certification programmes (Map 3). The use of certification programmes is growing, with increasing take up of voluntary certification among high‐end buildings sectors as a means of adding value. There is still a lack of large‐scale adoption of full mandatory certification programmes outside the European Union, which means that tracking of building energy performance over time and subsequent disclosure are still limited.
Map 3 • Building energy certification programmes by jurisdiction, 2017‐18
Source: Derived from IEA (2018c), Energy Efficiency Policies: Buildings, www.iea.org/topics/energyefficiency/policies/buildings.
Key message • Certification programmes are still primarily voluntary in most countries.
Five Green Building Councils (Australia, Brazil, Canada, France and South Africa) have developed Net Zero Carbon building standards, which use carbon reductions as the primary indicator of building performance (WorldGBC, 2018a). Several countries and subnational jurisdictions also updated their building energy certification policies in 2017‐18 (Box 4).
Box 4 • Examples of building energy certification, rating and labels
Argentina
Energy certification for buildings in Argentina is in the development and testing phase. The certification will initially be voluntary and will then transition to mandatory.9
Canada
Canada launched the ENERGY STAR certification programme for Canadian commercial and institutional buildings in March 2018. The programme recognises commercial and institutional buildings with an ENERGY STAR score greater than 75 and that meet other programme requirements (NRCAN, 2018a). Canada is also expanding its energy
9 Written communication from Ministry of Environment and Sustainable Development, Argentina.
2018 Global Status Report
Towards a zero‐emission, efficient and resilient buildings and construction sector
Page | 24
management programme (International Organization for Standardization [ISO] standard 50001) for industry to include commercial and institutional building energy management (NRCAN, 2018b). For residential buildings, Natural Resources Canada updated the ENERGY STAR for New Homes Standard in Ontario in 2017 to reflect changes made to the Ontario Building Code and to be about 20% more energy efficient than a typical home (NRCAN, 2018c).
European Union
Under the EPBD, energy performance certificates (EPCs) must be issued when a building is sold or rented, and they must also be included in all advertisements for the sale or rental of buildings (European Commission, 2018a). The EPBD encourages member states to link their financing measures for energy efficiency improvements to the energy savings, notably using EPCs to compare energy performance before and after renovation.
France
Some 500 000 housing units and 2 000 non‐residential buildings, totalling 85 million m2 are “Haute Qualité Environnementale” (HQE) certified. More than 800 000 housing units and 120 million m2 of non‐residential buildings are also “EFFINERGY” certified. Additionally, 50 000 house units each year are new “NF habitat HQE” certified, representing around 15% of the new residential buildings market.10
Japan
Japan has innovative building certifications that ensure energy saving and earthquake‐resistant, resilient buildings. There are two types of energy saving certifications. One is for remodelling and achieving 10% energy savings compared to the building energy code. The other is for buildings that meet the building energy code (MLIT, 2018a, 2018b).
Malta
Energy Performance of Buildings Regulations were published in February 2018 to strengthen the enforcement of EPCs in Malta as of March 2018 (Government of Malta, 2018).
Mexico
Mexico was the first country to develop a nationally appropriate mitigation action (NAMA) focused exclusively on social housing. To enable such homes, which are designed to maximise energy efficiency and comfort, the government prioritises public resources to finance social housing with NAMA certification. The certificate is under analysis to ensure all new social houses are labelled according to their performance (NAMA Facility, 2018).
Sweden
EPCs in Sweden cover energy consumption for heating, cooling, water heating, property electricity and energy performance. The certificates contain information on suggested measures (if provided by the building auditor) to reduce energy consumption. Most EPCs use consumption data rather than modelled data (Boverket, 2018). International sustainability labels (Leadership in Energy and Environmental Design [LEED], Building Research Establishment Environmental Assessment Method [BREEAM] and Passive House) are common for advanced projects, but are still the exception on an overall scale rather than the norm (GBIG, 2018a).
Switzerland
There is a building passport/certification harmonised among cantons in Switzerland. The certification applies mainly to public buildings (e.g. schools and hospitals) but not office buildings (EnDK, 2018c). In some municipalities, it is mandatory for public buildings or new buildings to use the “Minergie” certification, but it is widely used as a voluntary code. Minergie includes multiple certification levels: Minergie A (plus‐energy buildings), Minergie P (lowest‐energy buildings) and Minergie Eco (sustainable materials) (Minergie, 2018; EnDK, 2018b).
Ukraine
In July 2017, Ukraine established a certification programme for the energy performance of buildings, enacted as the Energy Performance of Buildings Bill Number 4941‐d (Government of Ukraine, 2018).
Viet Nam
More than 60 green buildings have been certified in Viet Nam,11 including through the Viet Nam Green Building Council and the IFC Excellence in Design for Greater Efficiencies (GBIG, 2018b). This certification system has also been used to certify nearly 8 700 homes in Viet Nam and over 200 000 m2 of floor space to provide over 7 200 tonnes of carbon dioxide (tCO2) per year of emissions savings (IFC, 2018).
10 Written communication from Ministry of Ecological and Inclusive Transition, France. 11 Written communication from Ministry of Construction, Viet Nam.
2018 Global Status Report Towards a zero‐emission, efficient and resilient buildings and construction sector
Page | 25
Other commitments and actions
Beyond NDCs, building energy codes and certificates, some jurisdictions and organisations have begun to address building energy performance through other policies and activities (Box 5). This includes actions such as informing building owners of operation and maintenance activities in their buildings (e.g. building passports) and the use of subsidies to enable sustainable buildings and construction.
Box 5 • Examples of other sustainability commitments and actions
Clean Energy Ministerial
Ministers and heads of administration of five countries (Argentina, France, Germany, Morocco and Switzerland) launched a call for engagement in building and climate strategies and co‐operation. They were later joined by Mexico.
European Union
Building renovation passports are being used in some European countries as a means of triggering energy‐efficient building renovations through a long‐term step‐by‐step renovation roadmap to achieve deep renovation. Existing initiatives include the “individueller Sanierungsfahrplan” (individual renovation roadmap) in Germany, the Flemish “Woningpas” (dwelling passport) in Belgium and the “Passeport Efficacité Énergétique” (energy efficiency passport) in France (BPIE, 2018). The revised EPBD also provides the framework for member states to introduce optional programmes for building renovation passports to stimulate cost‐effective deep energy renovation.
France
The first National Low‐Carbon Strategy in France has been assessed and the second version will be released by the end of 2018. It includes more ambitious targets and measures related to the construction sector, including new building energy codes in 2020, with carbon performance as a life‐cycle methodology. National stakeholders in France developed an action plan to enable energy performance improvement in existing buildings (Fédération CINOV, 2018).
Mexico
Mexico plans to eliminate the electricity subsidy that discourages the investment required for efficient technologies. It is promoting distributed generation (e.g. PV cells on roofs in urban areas) and is strengthening incentives to buy energy‐efficient appliances through an electricity bill.12
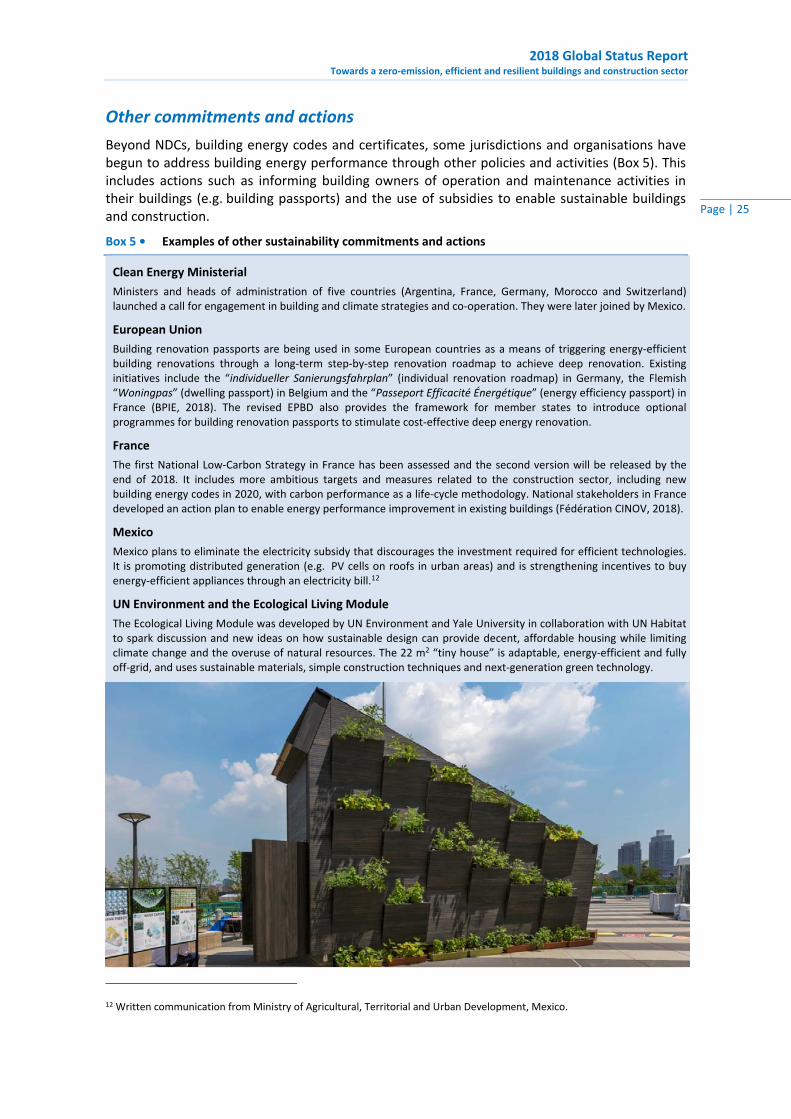
UN Environment and the Ecological Living Module
The Ecological Living Module was developed by UN Environment and Yale University in collaboration with UN Habitat to spark discussion and new ideas on how sustainable design can provide decent, affordable housing while limiting climate change and the overuse of natural resources. The 22 m2 “tiny house” is adaptable, energy‐efficient and fully off‐grid, and uses sustainable materials, simple construction techniques and next‐generation green technology.
12 Written communication from Ministry of Agricultural, Territorial and Urban Development, Mexico.
2018 Global Status Report
Towards a zero‐emission, efficient and resilient buildings and construction sector
Page | 26
Investment and finance for sustainable buildings
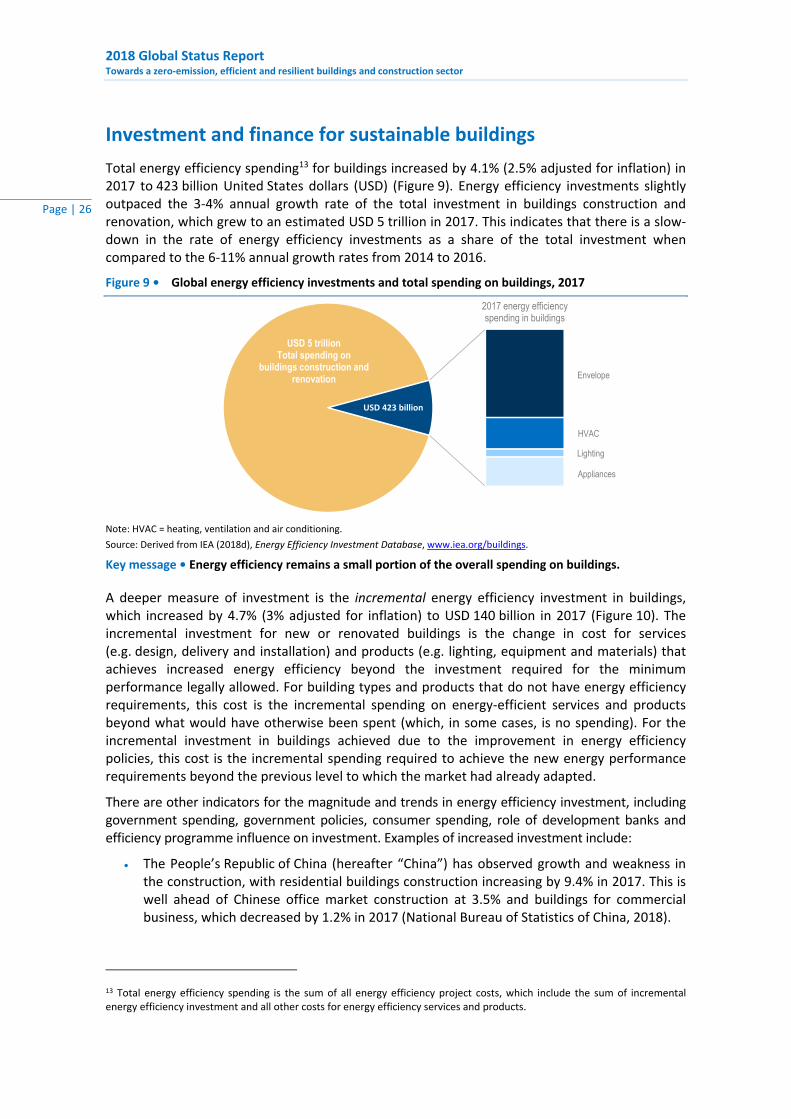
Total energy efficiency spending13 for buildings increased by 4.1% (2.5% adjusted for inflation) in 2017 to 423 billion United States dollars (USD) (Figure 9). Energy efficiency investments slightly outpaced the 3‐4% annual growth rate of the total investment in buildings construction and renovation, which grew to an estimated USD 5 trillion in 2017. This indicates that there is a slow‐down in the rate of energy efficiency investments as a share of the total investment when compared to the 6‐11% annual growth rates from 2014 to 2016.
Figure 9 • Global energy efficiency investments and total spending on buildings, 2017
Note: HVAC = heating, ventilation and air conditioning.
Source: Derived from IEA (2018d), Energy Efficiency Investment Database, www.iea.org/buildings.
Key message • Energy efficiency remains a small portion of the overall spending on buildings.
A deeper measure of investment is the incremental energy efficiency investment in buildings, which increased by 4.7% (3% adjusted for inflation) to USD 140 billion in 2017 (Figure 10). The incremental investment for new or renovated buildings is the change in cost for services (e.g. design, delivery and installation) and products (e.g. lighting, equipment and materials) that achieves increased energy efficiency beyond the investment required for the minimum performance legally allowed. For building types and products that do not have energy efficiency requirements, this cost is the incremental spending on energy‐efficient services and products beyond what would have otherwise been spent (which, in some cases, is no spending). For the incremental investment in buildings achieved due to the improvement in energy efficiency policies, this cost is the incremental spending required to achieve the new energy performance requirements beyond the previous level to which the market had already adapted.
There are other indicators for the magnitude and trends in energy efficiency investment, including government spending, government policies, consumer spending, role of development banks and efficiency programme influence on investment. Examples of increased investment include:
The People’s Republic of China (hereafter “China”) has observed growth and weakness in the construction, with residential buildings construction increasing by 9.4% in 2017. This is well ahead of Chinese office market construction at 3.5% and buildings for commercial business, which decreased by 1.2% in 2017 (National Bureau of Statistics of China, 2018).
13 Total energy efficiency spending is the sum of all energy efficiency project costs, which include the sum of incremental energy efficiency investment and all other costs for energy efficiency services and products.
USD 5 trillion Total spending on
buildings construction and renovation Envelope
HVAC
Lighting
Appliances
2017 energy efficiency spending in buildings
USD 423 billion
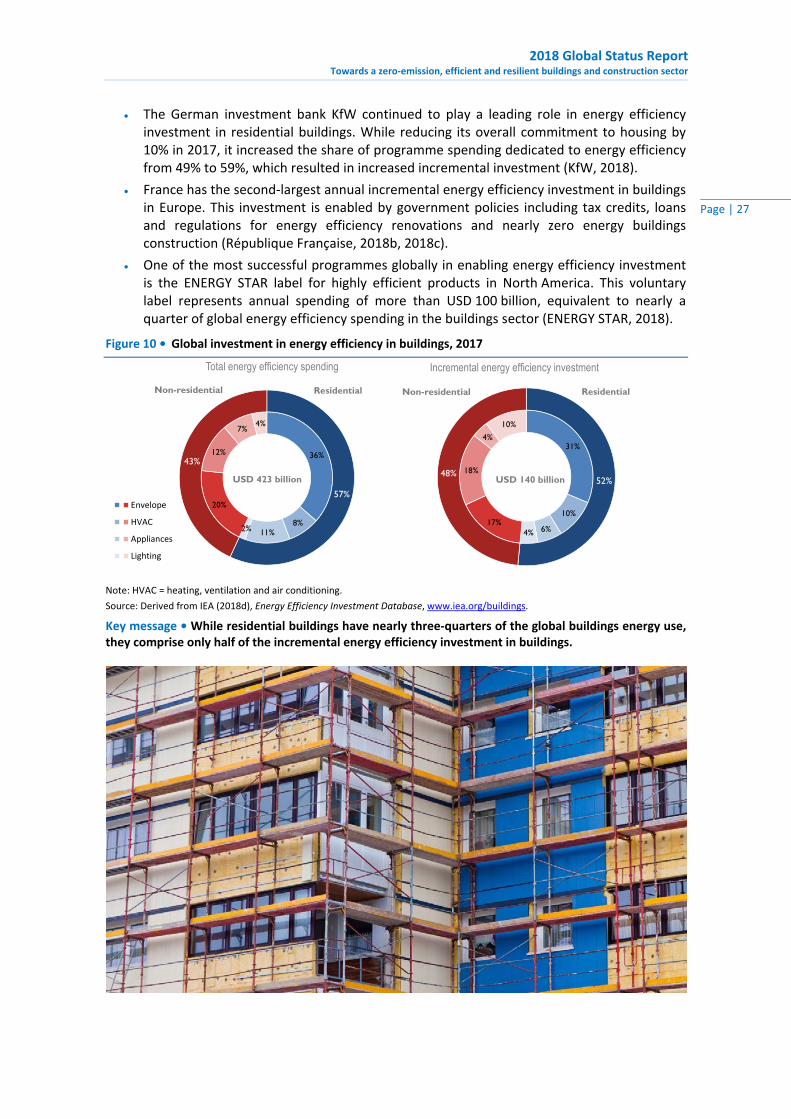
2018 Global Status Report Towards a zero‐emission, efficient and resilient buildings and construction sector
Page | 27
The German investment bank KfW continued to play a leading role in energy efficiency investment in residential buildings. While reducing its overall commitment to housing by 10% in 2017, it increased the share of programme spending dedicated to energy efficiency from 49% to 59%, which resulted in increased incremental investment (KfW, 2018).
France has the second‐largest annual incremental energy efficiency investment in buildings in Europe. This investment is enabled by government policies including tax credits, loans and regulations for energy efficiency renovations and nearly zero energy buildings construction (République Française, 2018b, 2018c).
One of the most successful programmes globally in enabling energy efficiency investment is the ENERGY STAR label for highly efficient products in North America. This voluntary label represents annual spending of more than USD 100 billion, equivalent to nearly a quarter of global energy efficiency spending in the buildings sector (ENERGY STAR, 2018).
Figure 10 • Global investment in energy efficiency in buildings, 2017
Note: HVAC = heating, ventilation and air conditioning.
Source: Derived from IEA (2018d), Energy Efficiency Investment Database, www.iea.org/buildings.
Key message • While residential buildings have nearly three‐quarters of the global buildings energy use, they comprise only half of the incremental energy efficiency investment in buildings.
31%
10%
6%4%17%
18%
4%
10%
52%48%
Incremental energy efficiency investment
Envelope
HVAC
Appliances
Lighting
USD 140 billion
ResidentialNon-residential
36%
8%11%2%
20%
12%
7%4%
57%
43%
Total energy efficiency spending
Envelope
HVAC
Appliances
Lighting
USD 423 billion
ResidentialNon-residential
2018 Global Status Report
Towards a zero‐emission, efficient and resilient buildings and construction sector
Page | 28
Bridging the investment gap
The process of bridging the investment gap is improving knowledge of the benefits of energy efficiency, for example by understanding the total life‐cycle costs and savings or by understanding the impact on a range of government budget items. Some global examples show support for the effort to enable more energy efficiency investment (Box 6).
Box 6 • Examples of investment for sustainable buildings and construction
European Union
The Energy Efficient Mortgage Initiative aims to create a standardised “energy‐efficient mortgage”. Building owners are incentivised to improve the energy efficiency of their buildings or acquire a property that is already energy efficient by preferential financing conditions linked to the mortgage. Based on a lower capital charge, banks providing energy‐efficient mortgages will offer the possibility of a preferential interest rate or additional funds at the time of origination of the mortgage or re‐mortgaging in return for measurable energy‐efficient improvement (EeMAP, 2018).
France
A 2017 study found that refurbished office buildings in France have energy consumption 12% less than the average energy use of office buildings that do not have energy efficiency as a determinant of refurbishment work. However, it is difficult to understand the true cost for energy efficiency as it typically becomes an objective embedded in the overall refurbishment plans. Commercial real estate owners are starting to provide energy savings within their building improvement efforts.14
French law has also made it possible to create a new category of stakeholders that provide third‐party financing (i.e. those that can provide a combined offer of technical and financial services aimed at renovating private housing). Regional councils have created more than six semi‐public corporations, which are now operational. To boost the financing of green investments, the French law on energy transition sets a requirement for institutional investors to report on their management of climate‐related risks in their investment portfolio.15
India
Energy Efficiency Services Limited, an Indian state‐owned “super” energy services company, has been successful in using bulk procurement to increase uptake of energy efficiency in India. For example, it has pushed down the price of LEDs and helped to create local manufacturing jobs to meet the need for energy‐efficient lighting. LEDs now cost less than USD 1 (around 60 Indian rupees [INR]), down 80% through the bulk purchase of over 308 million lamps with LEDs in the last four years without the need for subsidies. Through its first procurement round of ACs in 2017, the lowest‐price bidder offered high‐efficiency, five‐star ACs that can save 30‐40% on the cooling electricity bill for INR 35 000, a cost slightly higher than that of the cheapest AC units on the market.
Ireland
The Irish government’s National Mitigation Plan commits to support the Deep Retrofit pilot programme with an additional 21.2 million euros (EUR) between 2017 and 2019. This funding is beyond existing incentive programs for traditional building renovation and includes up to 50% of the total capital and project management costs for a deep energy retrofit and up to 95% for voluntary housing association homes and the homes of those that are in energy poverty (SEAI, 2018).
Mexico
Mexico created a Special Fund for Climate Change to finance programmes, activities and technology transfer measures that are complementary to those already financed by the Global Environment Facility and all bilateral and multilateral financing. CONAVI is also providing a social housing subsidy for families considering housing, where the energy and water performance of the home represents up to 15% (or approximately USD 550) of the total subsidy. Current investment in sustainable solutions in social housing roughly doubles this investment directly in the housing solution to achieve performance benchmarks. This incentive has proven important for the creation of a market of sustainable technologies and enabling local green jobs.16
United States
Green bonds issued primarily for energy efficiency tripled from USD 16 billion in 2016 to USD 47 billion in 2017, outpacing green bonds dedicated to renewable and other energy sources for the first time (Figure 11). Green bonds
14 Written communication from Observatoire de l’immobilier durable. 15 Written communication from Directorate General for Planning, Housing and Nature, France. 16 Written communication from Ministry of Agricultural, Territorial and Urban Development, Mexico.

2018 Global Status Report Towards a zero‐emission, efficient and resilient buildings and construction sector
Page | 29
can provide investors with greater certainty and transparency that their investment will contribute towards specific green projects or activities. Fannie Mae’s green mortgage‐backed securities now account for nearly 60% of green bonds issued primarily for energy efficiency (Fannie Mae, 2018).
Figure 11 • Global green bond issuance by use of proceeds, 2014‐17
Notes: Green bonds included are those labelled under the Climate Bonds Standard and Certification Scheme. Allocation by energy end use follows Climate Bonds Initiative conventions. Non‐energy includes uses such as forestry and climate adaptation projects. Other energy share of total includes non‐energy and renewable energy bonds.
Source: Derived from Climate Bonds Initiative (2018), Labelled Green Bonds Data, www.climatebonds.net/cbi/pub/data/bonds.
Key message • Energy efficiency is increasing as a share of a growing market for green bonds.
The Property Assessed Clean Energy (PACE) programme is another financing tool through which property owners in the United States can obtain funds to finance energy efficiency measures. PACE allows for the repayment of funds through charges attached to property tax bills, and it supports the deployment of a range of renewable energy, energy efficiency and water conservation projects. There are two types of PACE programmes: residential and commercial. Most investment has been in the residential sector (Figure 12). However, the annual funding of commercial PACE programmes nearly doubled in 2017, with most projects being in California, the first state in the United States to enact enabling legislation.
Figure 12 • PACE by sector, 2014‐17 (left) and commercial PACE by state, 2013‐17 (right)
Source: PACENation (2018), PACE Market Data, http://pacenation.us/.
Key message • Commercial PACE loans are increasing rapidly, but are much smaller than those for residential PACE.
Following its success in the United States, the funding model used by the PACE programme is now expanding to other regions. The Australian funding programme modelled on PACE, called Environmental Upgrade Agreements, has financed projects worth more than USD 60 million. The Canadian province of Alberta is developing the PACEAlberta programme. In Europe, Spain is developing a EuroPACE programme pilot (PACENation, 2018).
0%
10%
20%
30%
40%
50%
0
40
80
120
160
200
2014 2015 2016 2017
USD
billi
ons
Non-energy
Renewables andother energy
Other bonds with atleast one energyefficiency componentPrimarily energyefficiency
Energy efficiencyshare of total
Other energy shareof total
0.0
0.4
0.8
1.2
1.6
2.0
2014 2015 2016 2017
USD billions
Commercial Residential 0
50
100
150
200
250
300
2013 2014 2015 2016 2017
USD millions
Other
Montana
Texas
Washington DC
Minnesota
Connecticut
California
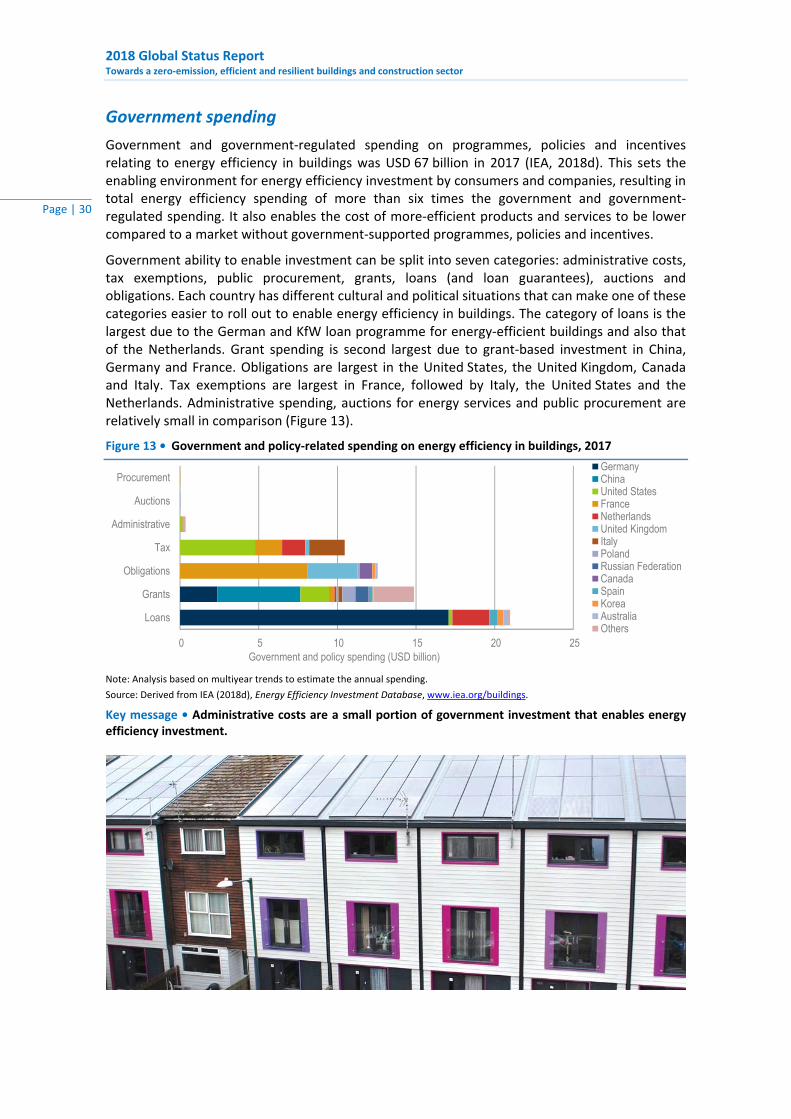
2018 Global Status Report
Towards a zero‐emission, efficient and resilient buildings and construction sector
Page | 30
Government spending
Government and government‐regulated spending on programmes, policies and incentives relating to energy efficiency in buildings was USD 67 billion in 2017 (IEA, 2018d). This sets the enabling environment for energy efficiency investment by consumers and companies, resulting in total energy efficiency spending of more than six times the government and government‐regulated spending. It also enables the cost of more‐efficient products and services to be lower compared to a market without government‐supported programmes, policies and incentives.
Government ability to enable investment can be split into seven categories: administrative costs, tax exemptions, public procurement, grants, loans (and loan guarantees), auctions and obligations. Each country has different cultural and political situations that can make one of these categories easier to roll out to enable energy efficiency in buildings. The category of loans is the largest due to the German and KfW loan programme for energy‐efficient buildings and also that of the Netherlands. Grant spending is second largest due to grant‐based investment in China, Germany and France. Obligations are largest in the United States, the United Kingdom, Canada and Italy. Tax exemptions are largest in France, followed by Italy, the United States and the Netherlands. Administrative spending, auctions for energy services and public procurement are relatively small in comparison (Figure 13).
Figure 13 • Government and policy‐related spending on energy efficiency in buildings, 2017
Note: Analysis based on multiyear trends to estimate the annual spending.
Source: Derived from IEA (2018d), Energy Efficiency Investment Database, www.iea.org/buildings.
Key message • Administrative costs are a small portion of government investment that enables energy efficiency investment.
0 5 10 15 20 25
Loans
Grants
Obligations
Tax
Administrative
Auctions
Procurement
Government and policy spending (USD billion)
GermanyChinaUnited StatesFranceNetherlandsUnited KingdomItalyPolandRussian FederationCanadaSpainKoreaAustraliaOthers
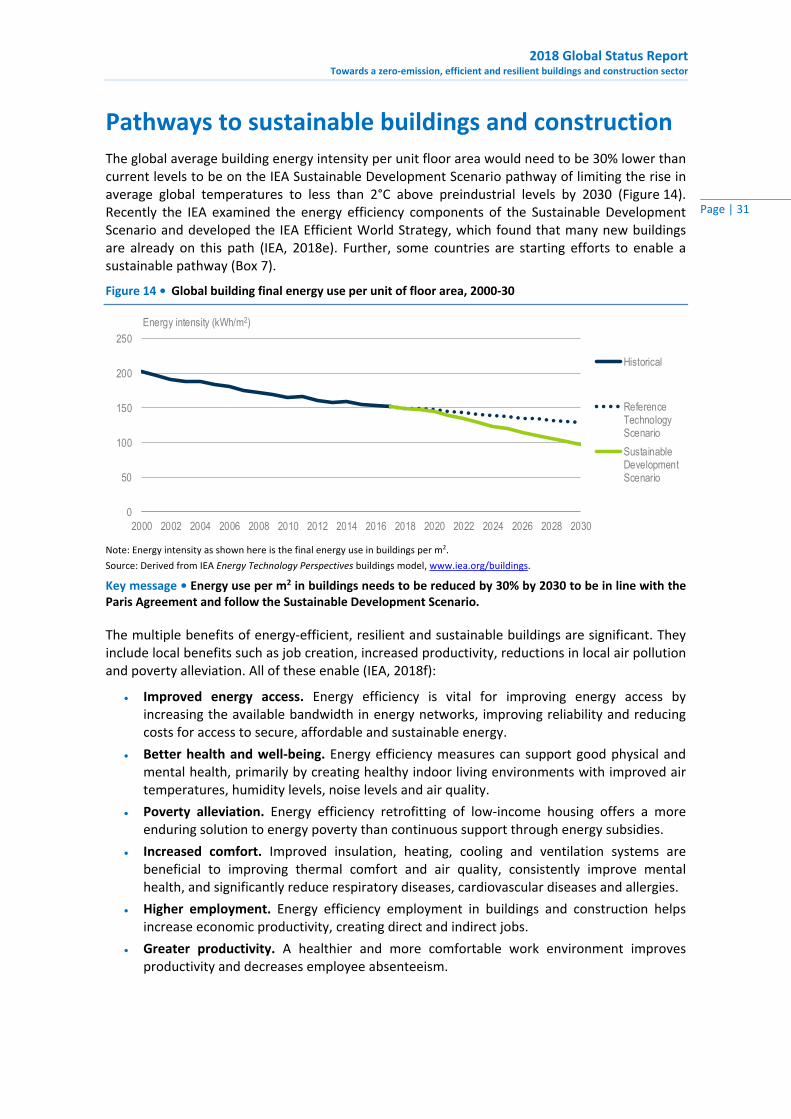
2018 Global Status Report Towards a zero‐emission, efficient and resilient buildings and construction sector
Page | 31
Pathways to sustainable buildings and construction The global average building energy intensity per unit floor area would need to be 30% lower than current levels to be on the IEA Sustainable Development Scenario pathway of limiting the rise in average global temperatures to less than 2°C above preindustrial levels by 2030 (Figure 14). Recently the IEA examined the energy efficiency components of the Sustainable Development Scenario and developed the IEA Efficient World Strategy, which found that many new buildings are already on this path (IEA, 2018e). Further, some countries are starting efforts to enable a sustainable pathway (Box 7).
Figure 14 • Global building final energy use per unit of floor area, 2000‐30
Note: Energy intensity as shown here is the final energy use in buildings per m2.
Source: Derived from IEA Energy Technology Perspectives buildings model, www.iea.org/buildings.
Key message • Energy use per m2 in buildings needs to be reduced by 30% by 2030 to be in line with the Paris Agreement and follow the Sustainable Development Scenario.
The multiple benefits of energy‐efficient, resilient and sustainable buildings are significant. They include local benefits such as job creation, increased productivity, reductions in local air pollution and poverty alleviation. All of these enable (IEA, 2018f):
Improved energy access. Energy efficiency is vital for improving energy access by increasing the available bandwidth in energy networks, improving reliability and reducing costs for access to secure, affordable and sustainable energy.
Better health and well‐being. Energy efficiency measures can support good physical and mental health, primarily by creating healthy indoor living environments with improved air temperatures, humidity levels, noise levels and air quality.
Poverty alleviation. Energy efficiency retrofitting of low‐income housing offers a more enduring solution to energy poverty than continuous support through energy subsidies.
Increased comfort. Improved insulation, heating, cooling and ventilation systems are beneficial to improving thermal comfort and air quality, consistently improve mental health, and significantly reduce respiratory diseases, cardiovascular diseases and allergies.
Higher employment. Energy efficiency employment in buildings and construction helps increase economic productivity, creating direct and indirect jobs.
Greater productivity. A healthier and more comfortable work environment improves productivity and decreases employee absenteeism.
0
50
100
150
200
250
2000 2002 2004 2006 2008 2010 2012 2014 2016 2018 2020 2022 2024 2026 2028 2030
Energy intensity (kWh/m2)
Historical
ReferenceTechnologyScenario
SustainableDevelopmentScenario
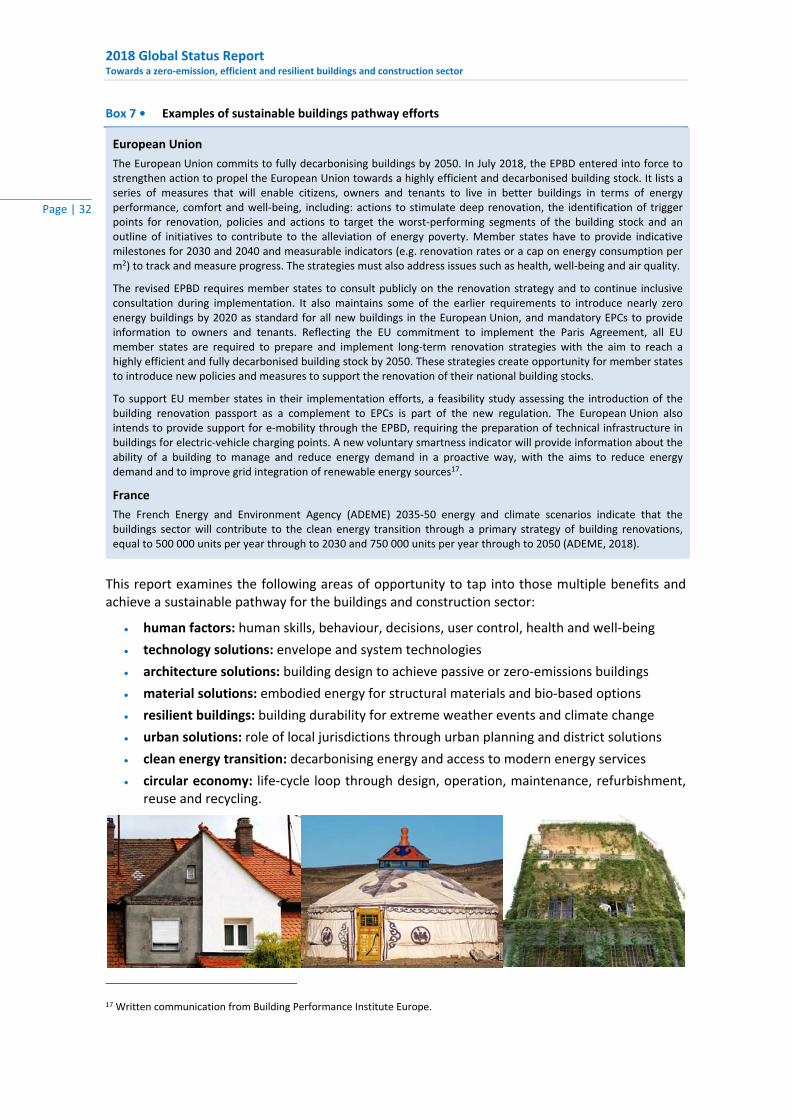
2018 Global Status Report
Towards a zero‐emission, efficient and resilient buildings and construction sector
Page | 32
Box 7 • Examples of sustainable buildings pathway efforts
European Union
The European Union commits to fully decarbonising buildings by 2050. In July 2018, the EPBD entered into force to strengthen action to propel the European Union towards a highly efficient and decarbonised building stock. It lists a series of measures that will enable citizens, owners and tenants to live in better buildings in terms of energy performance, comfort and well‐being, including: actions to stimulate deep renovation, the identification of trigger points for renovation, policies and actions to target the worst‐performing segments of the building stock and an outline of initiatives to contribute to the alleviation of energy poverty. Member states have to provide indicative milestones for 2030 and 2040 and measurable indicators (e.g. renovation rates or a cap on energy consumption per m2) to track and measure progress. The strategies must also address issues such as health, well‐being and air quality.
The revised EPBD requires member states to consult publicly on the renovation strategy and to continue inclusive consultation during implementation. It also maintains some of the earlier requirements to introduce nearly zero energy buildings by 2020 as standard for all new buildings in the European Union, and mandatory EPCs to provide information to owners and tenants. Reflecting the EU commitment to implement the Paris Agreement, all EU member states are required to prepare and implement long‐term renovation strategies with the aim to reach a highly efficient and fully decarbonised building stock by 2050. These strategies create opportunity for member states to introduce new policies and measures to support the renovation of their national building stocks.
To support EU member states in their implementation efforts, a feasibility study assessing the introduction of the building renovation passport as a complement to EPCs is part of the new regulation. The European Union also intends to provide support for e‐mobility through the EPBD, requiring the preparation of technical infrastructure in buildings for electric‐vehicle charging points. A new voluntary smartness indicator will provide information about the ability of a building to manage and reduce energy demand in a proactive way, with the aims to reduce energy demand and to improve grid integration of renewable energy sources17.
France
The French Energy and Environment Agency (ADEME) 2035‐50 energy and climate scenarios indicate that the buildings sector will contribute to the clean energy transition through a primary strategy of building renovations, equal to 500 000 units per year through to 2030 and 750 000 units per year through to 2050 (ADEME, 2018).
This report examines the following areas of opportunity to tap into those multiple benefits and achieve a sustainable pathway for the buildings and construction sector:
human factors: human skills, behaviour, decisions, user control, health and well‐being
technology solutions: envelope and system technologies
architecture solutions: building design to achieve passive or zero‐emissions buildings
material solutions: embodied energy for structural materials and bio‐based options
resilient buildings: building durability for extreme weather events and climate change
urban solutions: role of local jurisdictions through urban planning and district solutions
clean energy transition: decarbonising energy and access to modern energy services
circular economy: life‐cycle loop through design, operation, maintenance, refurbishment, reuse and recycling.
17 Written communication from Building Performance Institute Europe.
2018 Global Status Report Towards a zero‐emission, efficient and resilient buildings and construction sector
Page | 33
Human factors
People (as designers, builders, owners, operators and users of buildings) play a critical role in influencing the energy and environmental performance of buildings. These influences relate to how a building is designed (e.g. architectural and material choices), the way owners prioritise investment in energy performance, the management practices of building operators, and the comfort norms and demand use of available service levels (e.g. lighting, heating and cooling).
The influences of buildings and how people use buildings in relation to productivity, health and well‐being, learning, environmental quality and exposure to pollution are many. Bringing user experience into the design and operation of buildings will help ensure that energy use and services can meet user needs. Three areas of response to human factors in buildings are highlighted below.
Human skills, behaviour and decisions
People spend most time indoors. Therefore, the indoor building environment and building physical systems are important influencers of daily human experience. Having the skills and knowledge to enable decision making on sustainability by building occupants is a challenge. Even with the necessary knowledge, other priorities (e.g. comfort or convenience) reduce the occurrence of efficient behaviour. Various activities are helping to build global capacity through information and education efforts (Box 8).
Box 8 • Examples of capacity building to enable improved decision making
France
France has started a media campaign to promote home retrofits by private owners through the Sustainable Building Plan in recognition of the need for increased comfort, air quality and health. Free and independent advice by non‐profit organisations arranged by the government helps home owners prepare their retrofit projects. A charter to encourage voluntary improvements of energy performance in tertiary building is also being rolled out for non‐residential buildings. This is in addition to green deals to include energy performance as a decision‐making criterion in real estate transactions and multi‐owner housing property management. Retrofitting of education buildings is recognised as being important because it involves all levels such as school executives, teachers, children and parents.18
Mexico
Mexico’s switch towards a sustainable housing sector has created a growing market of specialised suppliers and professionals. To ensure technologies are included in CONAVI sustainability programmes, great efforts and investments have been made towards capacity building and product certification evidencing performance and durability. CONAVI has trained roughly 1 500 architects and engineers in the use of a sustainable housing simulator, and is expecting to increase this number through academic programmes.19
User control
Providing the ability for building users to have control over their space is a means of introducing closer alignment of building systems and user needs. Smart sensing and intelligent systems can better enable users to modify indoor services (heating, cooling, lighting, etc.) to provide a more‐comfortable indoor environment. For instance, area‐based lighting with occupant sensors and desk‐based light level controls can provide a balance between ensuring lights are turned off when unoccupied but are available for users when at their desks.
18 Written communication from Directorate General for Planning, Housing and Nature, France. 19 Written communication from Ministry of Agricultural, Territorial and Urban Development, Mexico.
2018 Global Status Report
Towards a zero‐emission, efficient and resilient buildings and construction sector
Page | 34
The integration of digital smart systems and controls among existing analogue or passive building components and systems is evolving (IEA, 2017a). This will be influenced by the interest of building occupants to better manage their space conditions and operation of services. Making use of controls to support building users to achieve energy savings while matching individual needs will continue to develop as building owners and operators continue to invest in these systems. Policies to support future adoption of information and communication technology (ICT) for energy management will ensure these opportunities are not lost in the future (Box 9).
Box 9 • Examples of digital occupant and user controls
European Union
The EPBD provides direction for all new buildings to be “smart ready” by including a “smart readiness indicator”. This would measure the capacity of a building to use ICT to adapt the operation of buildings to better meet occupant needs, provide resilience to the grid and contribute to energy savings through automation of building systems (European Parliament, 2018a).
France
The Luminem project in Bobigny illustrates the power of using building management systems and sensors embedded throughout the building to actively manage energy performances and optimise energy use and comfort. These systems offer computer and hand‐held applications for users to control their environment (Construction21, 2018).
United Kingdom
Households in the United Kingdom are transitioning to smart and connected home devices that can help manage energy. A 2017 survey found a growth in the number of households with control devices including smart meters (in 21% of households), smart home plugs (7%), smart thermostats (7%) and smart lighting (6%), along with a growing number of other devices (e.g. smart white goods, boiler monitors, smart blinds and shutters) (techUK, 2017).
Health and well‐being
Health and safety is a primary focus area for professionals in the construction and operation of buildings industry. Regulations and building codes in most countries ensure that buildings are built to a high standard to protect the user and that safety is part of standard construction practices. Understanding and recognition of the relationship between health and well‐being and building design, construction and operations is growing. However, improved guidance and regulations are needed in this area.
The process of adopting methods for healthy environments is growing. This is through voluntary standards like the WELL Building Standard (IWBI, 2018) and the health components of the LEED and BREEAM certifications. The key components contributing to a healthy building include: ventilation, air quality, thermal environment, moisture, dust and pest control, safety, security, water quality, acoustic environment, lighting and views (For Health, 2017).
Multiple examples exist of integrating human factors into building design and operation (Box 10). Identifying the benefits of low‐carbon and high‐energy‐performance buildings, in particular the role that these types of buildings can have in improving health, is an important motivation for their implementation. For instance, work at Harvard T.H. Chan School of Public Health (United States) has shown that using green building certification standards has considerable energy, economic and health benefits, with USD 5.8 billion in health benefits from reductions in air pollution emissions and USD 7.5 billion in energy savings across six countries using LEED (Brazil, China, Germany, India, Turkey and the United States) (MacNaughton et al., 2018).
A study from Canada found that office buildings designed with green certification demonstrated higher scores on employee survey outcomes related to job satisfaction, value and engagement compared to similar buildings without a green‐certification design (Newsham, Veitch and Hu, 2018). A 2017 study of tenants of French office buildings showed that user expectations for well‐being focus on: light, calm, view of green areas and access to public transportation
2018 Global Status Report Towards a zero‐emission, efficient and resilient buildings and construction sector
Page | 35
(OID, 2017), and in Europe, the Healthy Home Barometers for 2016, 2017 and 2018 have shown a link between buildings with poor energy performance and human health. People living in cold and dark buildings report poor health up to twice as much as people living in buildings that are well heated and lit by daylight.20
Box 10 • Examples of factors for achieving health and well‐being
Construction 21 Green Solution Awards 2018
There is a trend to put users at the centre of energy efficiency and to address health comfort and well‐being among builders competing in the Construction 21 Green Solutions Awards 2018. Many of the competitors address issues of thermal comfort, in winter and in summer, and visual comfort through more sources of daylight or the layout of interiors. Some examples of buildings taking human factors into account are found in the Construction21 Green Solutions Awards 2018.21
European Union
The new EPBD requires taking multiple benefits into account, such that renovation strategies are now supposed to include “an evidence‐based estimate of expected energy savings and wider benefits, such as those related to health, safety and air quality” (European Parliament, 2018b).
France
The Delta Green development in Saint‐Herblain focused on providing a high level of natural light (100%) across the working surface through high ceilings (3.3 metres) and optimising the orientation of the façade (Construction21, 2018). Similarly, the Beehive development in Bègles focused on façade openings and treatments to optimise daylight (Construction21, 2018).
Spain
The School of Industrial Engineering of the University of Valladolid is using the WELL Building Standard and also focusing on optimising indoor daylight levels. The approach includes the use of natural light through fibre optics to extend natural light to the interior of the building (Construction21, 2018).
Technology solutions
Technology development has the potential to reshape energy use in buildings. The evolution in technologies is being influenced by changes in policy ambitions, industry priorities and consumer demand for products, including their expectations for energy services. The transition towards the adoption of more‐efficient building technologies has begun to shift building energy performance. For example, manufacturers globally have started to produce high‐efficiency LEDs, and their share in global lighting sales has increased substantially in recent years (Figure 15). Energy efficiency standards and labelling have also steered the diffusion of best‐available household appliances in developed and developing markets.
Despite some positive progress for certain clean energy technologies, the transition towards high‐efficiency and low‐carbon solutions is not happening at the same pace for all building end uses. For instance, space heating and water heating (accounting for 53% of the global building energy use in 2017) have had limited progress to date. Neither building envelopes nor heating solutions are improving fast enough to keep up with the increasing demand for thermal comfort, and the small market shares of low‐emissivity windows (enabling improved occupant comfort by allowing heat gains during winter and reducing them during the summer) and heat pumps are two examples demonstrating that market transformation is still slow.
20 Written communication from VELUX. 21 Written communication from Construcion21.
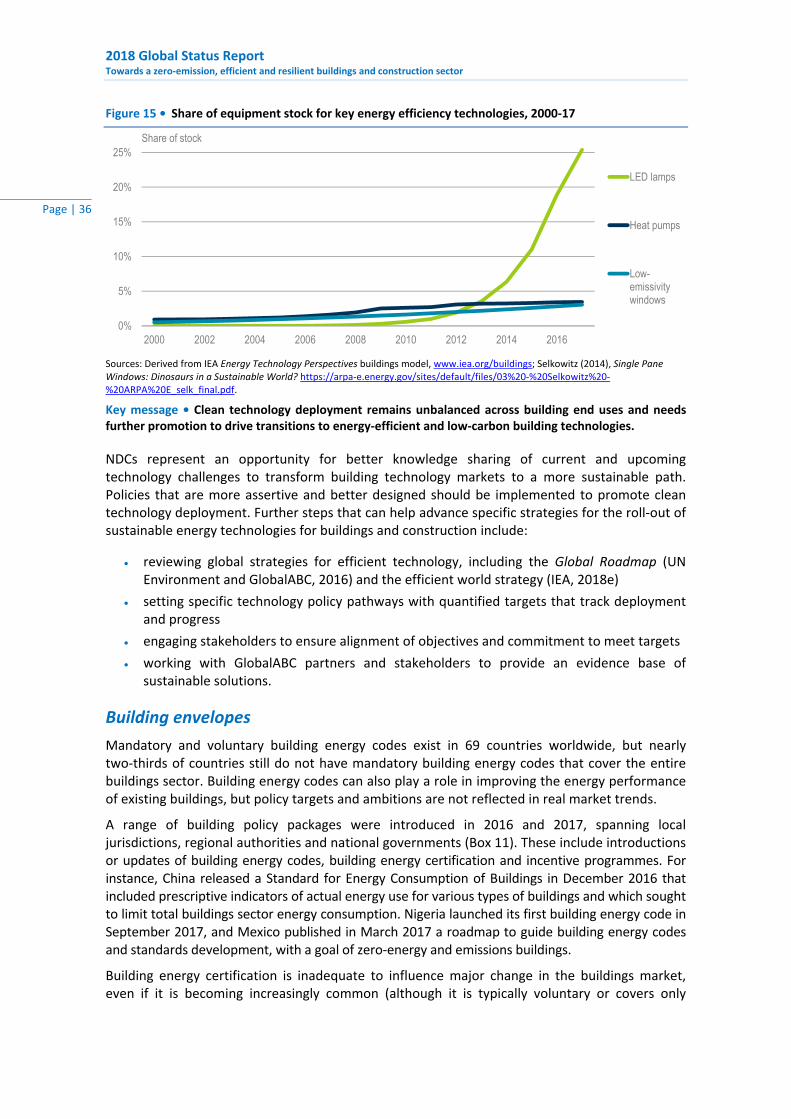
2018 Global Status Report
Towards a zero‐emission, efficient and resilient buildings and construction sector
Page | 36
Figure 15 • Share of equipment stock for key energy efficiency technologies, 2000‐17
Sources: Derived from IEA Energy Technology Perspectives buildings model, www.iea.org/buildings; Selkowitz (2014), Single Pane Windows: Dinosaurs in a Sustainable World? https://arpa‐e.energy.gov/sites/default/files/03%20‐%20Selkowitz%20‐%20ARPA%20E_selk_final.pdf.
Key message • Clean technology deployment remains unbalanced across building end uses and needs further promotion to drive transitions to energy‐efficient and low‐carbon building technologies.
NDCs represent an opportunity for better knowledge sharing of current and upcoming technology challenges to transform building technology markets to a more sustainable path. Policies that are more assertive and better designed should be implemented to promote clean technology deployment. Further steps that can help advance specific strategies for the roll‐out of sustainable energy technologies for buildings and construction include:
reviewing global strategies for efficient technology, including the Global Roadmap (UN Environment and GlobalABC, 2016) and the efficient world strategy (IEA, 2018e)
setting specific technology policy pathways with quantified targets that track deployment and progress
engaging stakeholders to ensure alignment of objectives and commitment to meet targets
working with GlobalABC partners and stakeholders to provide an evidence base of sustainable solutions.
Building envelopes
Mandatory and voluntary building energy codes exist in 69 countries worldwide, but nearly two‐thirds of countries still do not have mandatory building energy codes that cover the entire buildings sector. Building energy codes can also play a role in improving the energy performance of existing buildings, but policy targets and ambitions are not reflected in real market trends.
A range of building policy packages were introduced in 2016 and 2017, spanning local jurisdictions, regional authorities and national governments (Box 11). These include introductions or updates of building energy codes, building energy certification and incentive programmes. For instance, China released a Standard for Energy Consumption of Buildings in December 2016 that included prescriptive indicators of actual energy use for various types of buildings and which sought to limit total buildings sector energy consumption. Nigeria launched its first building energy code in September 2017, and Mexico published in March 2017 a roadmap to guide building energy codes and standards development, with a goal of zero‐energy and emissions buildings.
Building energy certification is inadequate to influence major change in the buildings market, even if it is becoming increasingly common (although it is typically voluntary or covers only
0%
5%
10%
15%
20%
25%
2000 2002 2004 2006 2008 2010 2012 2014 2016
Share of stock
LED lamps
Heat pumps
Low-emissivitywindows
2018 Global Status Report Towards a zero‐emission, efficient and resilient buildings and construction sector
Page | 37
a certain number of buildings). In 2017, the ISO published the energy performance of buildings standard ISO 52000‐1, which established a systematic and comprehensive structure for assessing building energy performance (ISO, 2017). But harmonisation is just one step towards moving markets to compulsory energy certification.
Building envelope measures fall short of sustainability targets, despite some progress. Near‐zero‐energy construction shares are typically less than 5% in most markets, and typical renovation rates are around 1‐2% of the building stock per year with 10‐15% energy intensity improvements. Achieving sustainability targets would require high‐performance envelopes to become the global construction standard and for refurbishment rates to double and to avoid the lock‐in of inefficient buildings and their subsequent emissions.
Box 11 • Examples of sustainable envelope technology
India
The Indo‐Swiss Building Energy Efficiency Project (BEEP) supported the introduction of external movable shades in India to limit cooling needs through reduced solar heat gains. Shading systems for windows can reflect more than 80% of solar radiation, while letting natural daylight through, in comparison to single‐pane windows that only block around 20% of solar radiation. BEEP also supports the adoption of best practice natural ventilation, which is critical in India as most buildings are not cooled. Smart Ghar is one example of an affordable housing project in Rajkot where 1 176 social dwelling units benefit from natural ventilation. BEEP is also conducting research on large‐scale application of earth‐air tunnels for cooling in collaboration with the University of Geneva in Switzerland (BEEP India, 2018).
Mexico
Mexico has placed emphasis on sustainable housing development and has approved an integrated approach towards sustainable housing design, considering housing as a system to enable continuous performance improvement through the addition of new technologies and materials.22
Spain
Research at the Institute of Advanced Architecture of Catalonia is developing a series of passive cooling options that include technologies to control temperature by imitating the human body to regulate temperature through transpiration as well as technologies that enable shading based on devices that tilt closed when liquid is evaporated by solar heat (Architecture Daily, 2017).
Switzerland
Research is being conducted at the Swiss Federal Institute of Technology in Zurich on a technology that can be used in hot and dry climates. It is a three‐layer membrane that can be used as a “passive cooling curtain”. This technology functions by allowing evaporation of water from the middle water‐attracting layer through holes in the outer water‐repellent layers, resulting in heat extraction from the air and passive cooling of the space without the use of energy (ETH Zurich, 2017).
United States
Researchers at the University of Colorado in Boulder are working on a plastic film technology that can cool without consuming energy or water. It is a thin film that can reflect solar heat gain while also allowing heat rejection in the form of infrared thermal radiation (CU Boulder Today, 2017).
Heating and cooling systems
Space and water heating
Global energy demand for space heating has remained stable in recent years at around 42 EJ. This is due to energy intensity improvements in major heating markets such as Canada, the United States, Europe, the Russian Federation and China. Water heating represents 24 EJ in
22 Written communication from Ministry of Agricultural, Territorial and Urban Development, Mexico.
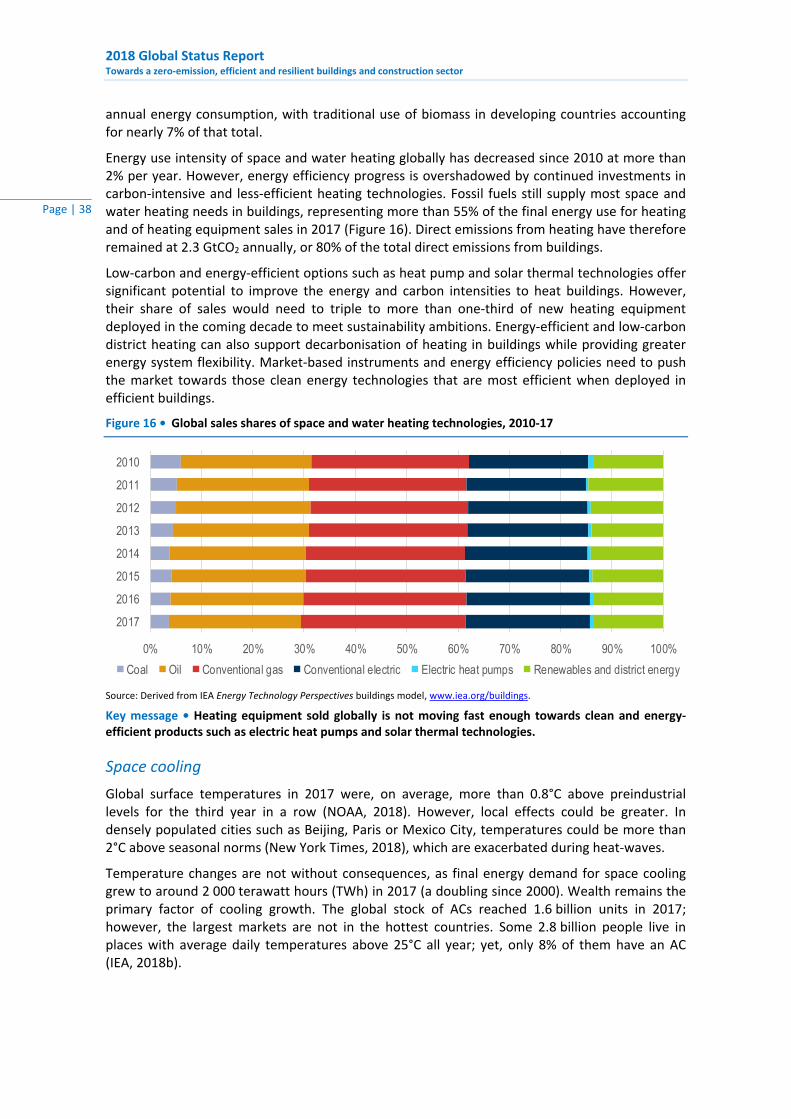
2018 Global Status Report
Towards a zero‐emission, efficient and resilient buildings and construction sector
Page | 38
annual energy consumption, with traditional use of biomass in developing countries accounting for nearly 7% of that total.
Energy use intensity of space and water heating globally has decreased since 2010 at more than 2% per year. However, energy efficiency progress is overshadowed by continued investments in carbon‐intensive and less‐efficient heating technologies. Fossil fuels still supply most space and water heating needs in buildings, representing more than 55% of the final energy use for heating and of heating equipment sales in 2017 (Figure 16). Direct emissions from heating have therefore remained at 2.3 GtCO2 annually, or 80% of the total direct emissions from buildings.
Low‐carbon and energy‐efficient options such as heat pump and solar thermal technologies offer significant potential to improve the energy and carbon intensities to heat buildings. However, their share of sales would need to triple to more than one‐third of new heating equipment deployed in the coming decade to meet sustainability ambitions. Energy‐efficient and low‐carbon district heating can also support decarbonisation of heating in buildings while providing greater energy system flexibility. Market‐based instruments and energy efficiency policies need to push the market towards those clean energy technologies that are most efficient when deployed in efficient buildings.
Figure 16 • Global sales shares of space and water heating technologies, 2010‐17
Source: Derived from IEA Energy Technology Perspectives buildings model, www.iea.org/buildings.
Key message • Heating equipment sold globally is not moving fast enough towards clean and energy‐efficient products such as electric heat pumps and solar thermal technologies.
Space cooling
Global surface temperatures in 2017 were, on average, more than 0.8°C above preindustrial levels for the third year in a row (NOAA, 2018). However, local effects could be greater. In densely populated cities such as Beijing, Paris or Mexico City, temperatures could be more than 2°C above seasonal norms (New York Times, 2018), which are exacerbated during heat‐waves.
Temperature changes are not without consequences, as final energy demand for space cooling grew to around 2 000 terawatt hours (TWh) in 2017 (a doubling since 2000). Wealth remains the primary factor of cooling growth. The global stock of ACs reached 1.6 billion units in 2017; however, the largest markets are not in the hottest countries. Some 2.8 billion people live in places with average daily temperatures above 25°C all year; yet, only 8% of them have an AC (IEA, 2018b).
0% 10% 20% 30% 40% 50% 60% 70% 80% 90% 100%
2010
2011
2012
2013
2014
2015
2016
2017
Coal Oil Conventional gas Conventional electric Electric heat pumps Renewables and district energy
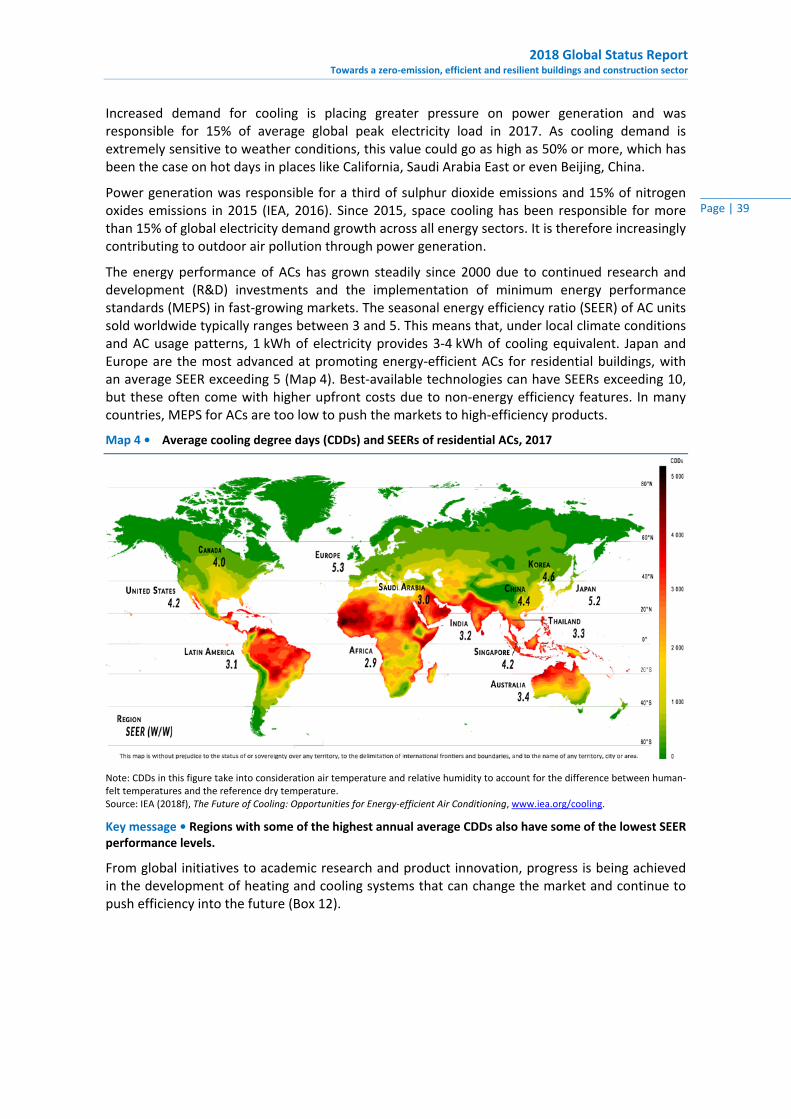
2018 Global Status Report Towards a zero-emission, efficient and resilient buildings and construction sector
Page | 39
Increased demand for cooling is placing greater pressure on power generation and was responsible for 15% of average global peak electricity load in 2017. As cooling demand is extremely sensitive to weather conditions, this value could go as high as 50% or more, which has been the case on hot days in places like California, Saudi Arabia East or even Beijing, China.
Power generation was responsible for a third of sulphur dioxide emissions and 15% of nitrogen oxides emissions in 2015 (IEA, 2016). Since 2015, space cooling has been responsible for more than 15% of global electricity demand growth across all energy sectors. It is therefore increasingly contributing to outdoor air pollution through power generation.
The energy performance of ACs has grown steadily since 2000 due to continued research and development (R&D) investments and the implementation of minimum energy performance standards (MEPS) in fast-growing markets. The seasonal energy efficiency ratio (SEER) of AC units sold worldwide typically ranges between 3 and 5. This means that, under local climate conditions and AC usage patterns, 1 kWh of electricity provides 3-4 kWh of cooling equivalent. Japan and Europe are the most advanced at promoting energy-efficient ACs for residential buildings, with an average SEER exceeding 5 (Map 4). Best-available technologies can have SEERs exceeding 10, but these often come with higher upfront costs due to non-energy efficiency features. In many countries, MEPS for ACs are too low to push the markets to high-efficiency products.
Map 4 • Average cooling degree days (CDDs) and SEERs of residential ACs, 2017
Note: CDDs in this figure take into consideration air temperature and relative humidity to account for the difference between human-felt temperatures and the reference dry temperature. Source: IEA (2018f), The Future of Cooling: Opportunities for Energy-efficient Air Conditioning, www.iea.org/cooling.
Key message • Regions with some of the highest annual average CDDs also have some of the lowest SEER performance levels.
From global initiatives to academic research and product innovation, progress is being achieved in the development of heating and cooling systems that can change the market and continue to push efficiency into the future (Box 12).
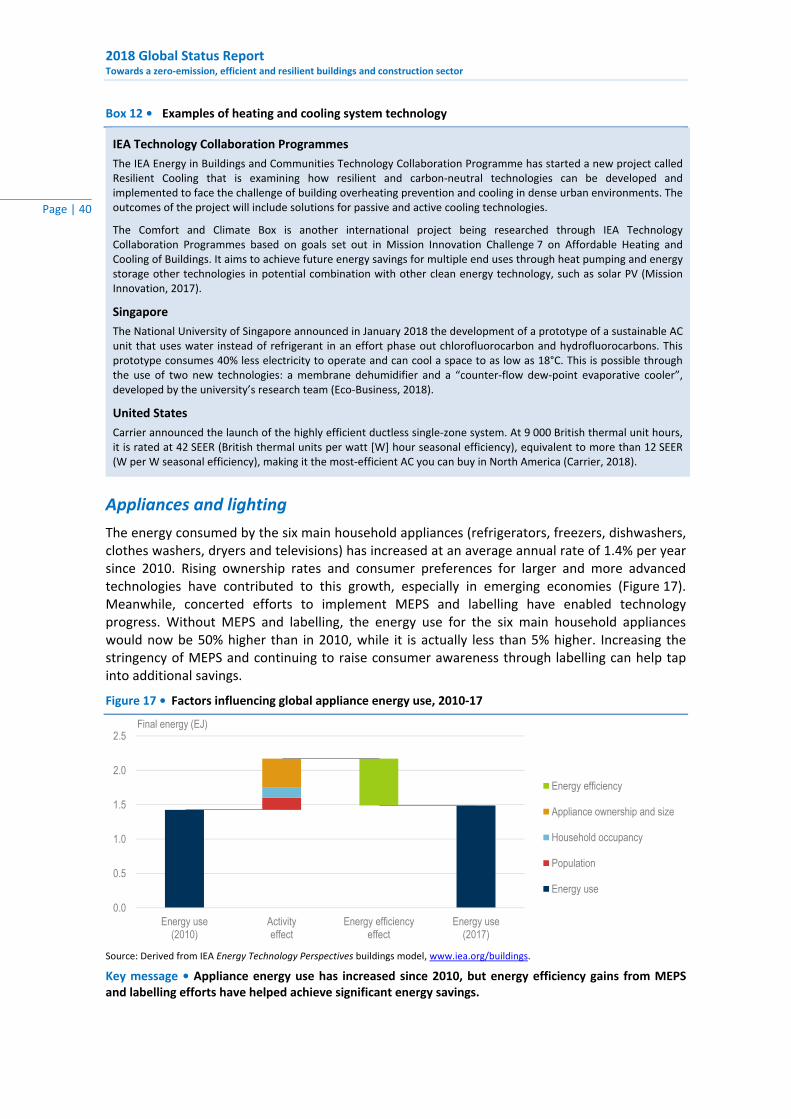
2018 Global Status Report
Towards a zero‐emission, efficient and resilient buildings and construction sector
Page | 40
Box 12 • Examples of heating and cooling system technology
IEA Technology Collaboration Programmes
The IEA Energy in Buildings and Communities Technology Collaboration Programme has started a new project called Resilient Cooling that is examining how resilient and carbon‐neutral technologies can be developed and implemented to face the challenge of building overheating prevention and cooling in dense urban environments. The outcomes of the project will include solutions for passive and active cooling technologies.
The Comfort and Climate Box is another international project being researched through IEA Technology Collaboration Programmes based on goals set out in Mission Innovation Challenge 7 on Affordable Heating and Cooling of Buildings. It aims to achieve future energy savings for multiple end uses through heat pumping and energy storage other technologies in potential combination with other clean energy technology, such as solar PV (Mission Innovation, 2017).
Singapore
The National University of Singapore announced in January 2018 the development of a prototype of a sustainable AC unit that uses water instead of refrigerant in an effort phase out chlorofluorocarbon and hydrofluorocarbons. This prototype consumes 40% less electricity to operate and can cool a space to as low as 18°C. This is possible through the use of two new technologies: a membrane dehumidifier and a “counter‐flow dew‐point evaporative cooler”, developed by the university’s research team (Eco‐Business, 2018).
United States
Carrier announced the launch of the highly efficient ductless single‐zone system. At 9 000 British thermal unit hours, it is rated at 42 SEER (British thermal units per watt [W] hour seasonal efficiency), equivalent to more than 12 SEER (W per W seasonal efficiency), making it the most‐efficient AC you can buy in North America (Carrier, 2018).
Appliances and lighting
The energy consumed by the six main household appliances (refrigerators, freezers, dishwashers, clothes washers, dryers and televisions) has increased at an average annual rate of 1.4% per year since 2010. Rising ownership rates and consumer preferences for larger and more advanced technologies have contributed to this growth, especially in emerging economies (Figure 17). Meanwhile, concerted efforts to implement MEPS and labelling have enabled technology progress. Without MEPS and labelling, the energy use for the six main household appliances would now be 50% higher than in 2010, while it is actually less than 5% higher. Increasing the stringency of MEPS and continuing to raise consumer awareness through labelling can help tap into additional savings.
Figure 17 • Factors influencing global appliance energy use, 2010‐17
Source: Derived from IEA Energy Technology Perspectives buildings model, www.iea.org/buildings.
Key message • Appliance energy use has increased since 2010, but energy efficiency gains from MEPS and labelling efforts have helped achieve significant energy savings.
0.0
0.5
1.0
1.5
2.0
2.5
Energy use(2010)
Activityeffect
Energy efficiencyeffect
Energy use(2017)
Final energy (EJ)
Energy efficiency
Appliance ownership and size
Household occupancy
Population
Energy use
2018 Global Status Report Towards a zero‐emission, efficient and resilient buildings and construction sector
Page | 41
Although MEPS have played a role in achieving more efficient products, appliances and plug loads are not on track to meet climate ambitions. Less than 35% of the energy consumed by the major household appliances was covered by national or local policies in 2016. The refrigerator and freezer market is the most regulated, and policy coverage is expanding to other products. Continuing this effort and updating existing policies will be critical to bringing best‐available technologies to scale and achieving expected savings. The stand‐by power of smaller plug loads and connected devices, which could represent more than 60% of the energy used by appliances globally by 2030 (IEA, 2017a), has also decreased in major markets such as the European Union, India, Korea and Mexico, thanks to mandatory energy performance standards.
Global final energy consumption for lighting in buildings appears to have reached a plateau at around 1 800 TWh in 2015. High‐efficiency lighting technologies, including LEDs, are helping to hold energy demand constant, despite growth in global buildings floor area and lighting services.
The surge in use of LEDs promises to provide greater energy savings in coming years, with the LED market share exceeding 33% of residential lighting sales in 2017. LED performance (measured in luminous efficacy by lumens [lm] per W) also continues to improve – with market averages (around 96 lm/W) 70% higher in 2017 than in 2010. In many markets, LED efficacies (residential) already exceed 110 lm/W. Conversely, incandescent lamps have typical efficacies around 13 lm/W and have decreased to less than 5% of market sales. The share of halogens and compact fluorescent lamps also peaked in 2015 and has since declined to about 55% of the residential market.
Current market trends indicate LEDs are on track to meet climate targets, although they are not the dominant lighting technology globally. Countries should update policies to extend the phase‐out of incandescent lamps to also include the phase‐out of halogen lighting (with halogen lamps being, on average, 80% less efficient than LEDs). Progress on efficient appliances and lighting continues through policy and technology efforts (Box 13).
Box 13 • Examples of energy‐efficient appliances and lighting
Colombia
Colombia has announced its Return and Save programme to replace 1 million refrigerators within 5 years, targeting low and medium income households. The subsidy is via a reduction in value‐added tax (VAT) levels on the most‐efficient refrigerators, reduced from 19% to 5%. Old appliances are removed and delivered to authorised agents for recycling and refrigerant disposal (under Montreal Protocol commitments). The national budget balance is expected to be positive, as the reduction in VAT revenue is offset by the reduction in energy use and therefore energy subsidies. Other benefits include growth in the labour market by 2 000 directly created jobs and 10 000 indirect ones, promotion of the recycling industry and better use of materials in the economy.
European Union
The 2017 revision of the EPBD introduced the smart readiness indicator. This will measure building capacity to use new technologies and electronic systems to adapt to the needs of the consumer, optimise operation and interact with the grid. The intention is to future‐proof the ability of a building to be ready to adopt smart demand‐side technologies and appliances to better manage energy use and allow for greater user control (European Commission, 2017).
Japan
Tokyo Institute of Technology and Kyoto University are developing a red‐light‐emitting semiconductor that uses “earth‐abundant elements”, such as nitrogen and zinc components, as an alternative to rare materials, which can reduce the production costs of red LEDs and solar cells (Eletimes, 2018).
Korea
LG announced the first commercially available LED to achieve 220 lm/W. Previously, 200 lm/W was achieved by Philips in 2016 for lamps developed for Dubai (Lux Review, 2018).
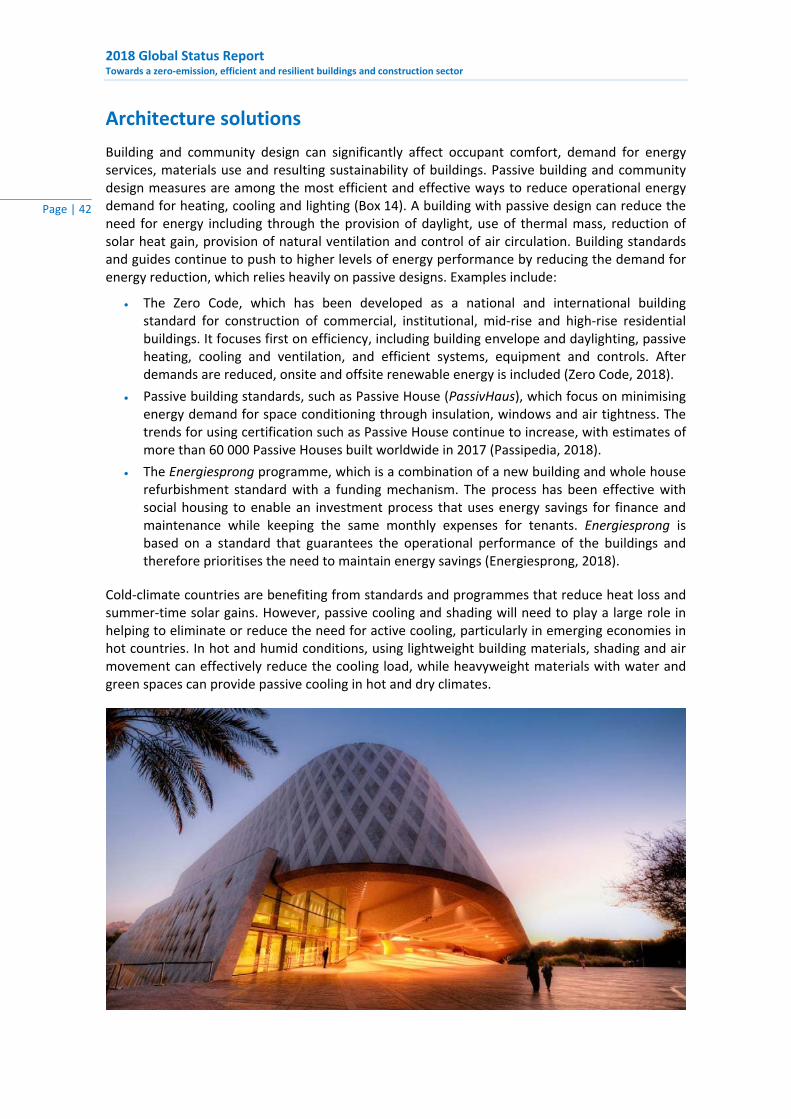
2018 Global Status Report
Towards a zero‐emission, efficient and resilient buildings and construction sector
Page | 42
Architecture solutions
Building and community design can significantly affect occupant comfort, demand for energy services, materials use and resulting sustainability of buildings. Passive building and community design measures are among the most efficient and effective ways to reduce operational energy demand for heating, cooling and lighting (Box 14). A building with passive design can reduce the need for energy including through the provision of daylight, use of thermal mass, reduction of solar heat gain, provision of natural ventilation and control of air circulation. Building standards and guides continue to push to higher levels of energy performance by reducing the demand for energy reduction, which relies heavily on passive designs. Examples include:
The Zero Code, which has been developed as a national and international building standard for construction of commercial, institutional, mid‐rise and high‐rise residential buildings. It focuses first on efficiency, including building envelope and daylighting, passive heating, cooling and ventilation, and efficient systems, equipment and controls. After demands are reduced, onsite and offsite renewable energy is included (Zero Code, 2018).
Passive building standards, such as Passive House (PassivHaus), which focus on minimising energy demand for space conditioning through insulation, windows and air tightness. The trends for using certification such as Passive House continue to increase, with estimates of more than 60 000 Passive Houses built worldwide in 2017 (Passipedia, 2018).
The Energiesprong programme, which is a combination of a new building and whole house refurbishment standard with a funding mechanism. The process has been effective with social housing to enable an investment process that uses energy savings for finance and maintenance while keeping the same monthly expenses for tenants. Energiesprong is based on a standard that guarantees the operational performance of the buildings and therefore prioritises the need to maintain energy savings (Energiesprong, 2018).
Cold‐climate countries are benefiting from standards and programmes that reduce heat loss and summer‐time solar gains. However, passive cooling and shading will need to play a large role in helping to eliminate or reduce the need for active cooling, particularly in emerging economies in hot countries. In hot and humid conditions, using lightweight building materials, shading and air movement can effectively reduce the cooling load, while heavyweight materials with water and green spaces can provide passive cooling in hot and dry climates.
2018 Global Status Report Towards a zero‐emission, efficient and resilient buildings and construction sector
Page | 43
Box 14 • Examples of architectural solutions for sustainable buildings
France
Passive Houses are being built across France in efforts to meet its near‐zero‐energy building efforts for 2020. Examples include: the Avenidor development, which is the first certified Passive House and 100% independent building through a 19.2 kilowatt‐peak and 15 kilowatt‐storage system, and Thémis, an 11 000 m2 commercial office development in Paris, which includes vegetation on the façades, the roof and inside the building to create a cooler climate during the summer, thus reducing the estimated cooling demand to 1.7 kWh/m2 per year (Construction21, 2018). In Saint Etienne, 53 Fauriel is the first protected historic monument to be renovated to the Passive House standard. This office uses the concept of “a box in the box” to limit thermal bridges by putting a new thermal envelope within the existing building to protect the historic façade (Passive House Database, 2018).
India
The energy performance index of the Forest Department Head Office Building in Jaipur was reduced to an actual consumption of 43 kWh/m2, which is less than half the 90 kWh/m2 limit for five‐star buildings in India. This was achieved through conventional measures such as a lower window‐to‐wall ratio, improved insulation, a high‐reflectivity roof, double pane low‐emissivity windows, high‐efficiency water‐cooled chillers using treated wastewater, and a grid‐connected rooftop PV system.23
Mexico
The construction of passive housing in Mexico is gaining support including through the EcoCasa programme, managed by the Sociedad Hipotecaria Federal that provides grants to builders to add energy efficiency into buildings. This was supported by the Latin American Investment Fund to build up to 600 Passive Houses in Mexico. Adjusting to the local conditions, a Passive House development in Morelia in Michoacán state focused on thermal envelopes and shading to reduce space cooling demand (International Passive House Association, 2018).
Singapore
A new development at Singapore Management University is being designed to be an onsite net‐zero‐energy building using the Building and Construction Authority green mark rating system. It will make use of natural ventilation and advanced displacement cooling to reduce energy demand and provide a comfortable environment (SMU, 2018).
Spain
The Towers of Bolueta in Bilbao have been certified as the tallest Passive House building at 88 metres tall, including 361 residences and 45 840 m2 of net floor area. The heating energy demand is calculated as 6 kWh/m2 per year, compared to a standard building at 56 kWh/m2 per year (Construction21, 2018).
United Kingdom
Wilmcote House in Portsmouth is a refurbishment of three 11‐storey tower residential buildings using passive design (EnerPHit) standards. The refurbishment focused on using external wall insulation and double‐glazing to reduce heating energy demand (ECD Architects, 2018).
Material solutions
CO2 emissions resulting from material use in buildings account for 28% of the annual buildings‐related CO2 emissions. Most of these emissions are a result of cement and steel manufacturing, which have high process emissions and are used in large quantities. Aluminium, glass and insulation materials are secondary contributors. While countries are taking action to address direct emissions24 (e.g. from fossil fuel combustion in buildings) and indirect emissions25 (e.g. from electricity consumption), ambitions to reduce embodied carbon in buildings are in the background. The relative importance of embodied carbon26 in the global buildings and construction carbon footprint is therefore increasing.
23 Written communication from Swiss Agency for Development and Cooperation. 24 Building‐related emissions can be partitioned into three scopes. Direct emissions from fossil fuel combustion in buildings are buildings scope‐1 emissions. 25 Indirect emissions from power and heat generation make up buildings scope‐2 emissions. 26 Embodied carbon, or CO2 emissions from the use of materials for buildings, are part of buildings scope‐3 emissions.
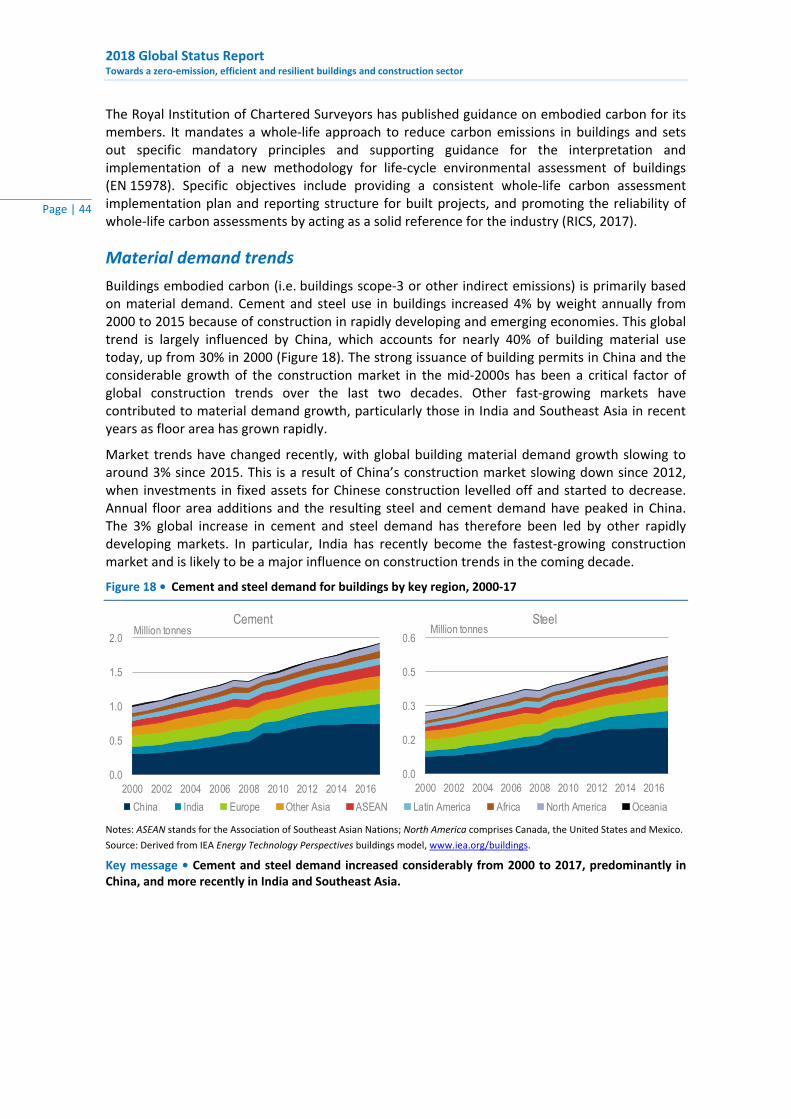
2018 Global Status Report
Towards a zero‐emission, efficient and resilient buildings and construction sector
Page | 44
The Royal Institution of Chartered Surveyors has published guidance on embodied carbon for its members. It mandates a whole‐life approach to reduce carbon emissions in buildings and sets out specific mandatory principles and supporting guidance for the interpretation and implementation of a new methodology for life‐cycle environmental assessment of buildings (EN 15978). Specific objectives include providing a consistent whole‐life carbon assessment implementation plan and reporting structure for built projects, and promoting the reliability of whole‐life carbon assessments by acting as a solid reference for the industry (RICS, 2017).
Material demand trends
Buildings embodied carbon (i.e. buildings scope‐3 or other indirect emissions) is primarily based on material demand. Cement and steel use in buildings increased 4% by weight annually from 2000 to 2015 because of construction in rapidly developing and emerging economies. This global trend is largely influenced by China, which accounts for nearly 40% of building material use today, up from 30% in 2000 (Figure 18). The strong issuance of building permits in China and the considerable growth of the construction market in the mid‐2000s has been a critical factor of global construction trends over the last two decades. Other fast‐growing markets have contributed to material demand growth, particularly those in India and Southeast Asia in recent years as floor area has grown rapidly.
Market trends have changed recently, with global building material demand growth slowing to around 3% since 2015. This is a result of China’s construction market slowing down since 2012, when investments in fixed assets for Chinese construction levelled off and started to decrease. Annual floor area additions and the resulting steel and cement demand have peaked in China. The 3% global increase in cement and steel demand has therefore been led by other rapidly developing markets. In particular, India has recently become the fastest‐growing construction market and is likely to be a major influence on construction trends in the coming decade.
Figure 18 • Cement and steel demand for buildings by key region, 2000‐17
Notes: ASEAN stands for the Association of Southeast Asian Nations; North America comprises Canada, the United States and Mexico.
Source: Derived from IEA Energy Technology Perspectives buildings model, www.iea.org/buildings.
Key message • Cement and steel demand increased considerably from 2000 to 2017, predominantly in China, and more recently in India and Southeast Asia.
0.0
0.5
1.0
1.5
2.0
2000 2002 2004 2006 2008 2010 2012 2014 2016
Million tonnesCement
China India Europe Other Asia ASEAN Latin America Africa North America Oceania
0.0
0.2
0.3
0.5
0.6
2000 2002 2004 2006 2008 2010 2012 2014 2016
Million tonnesSteel
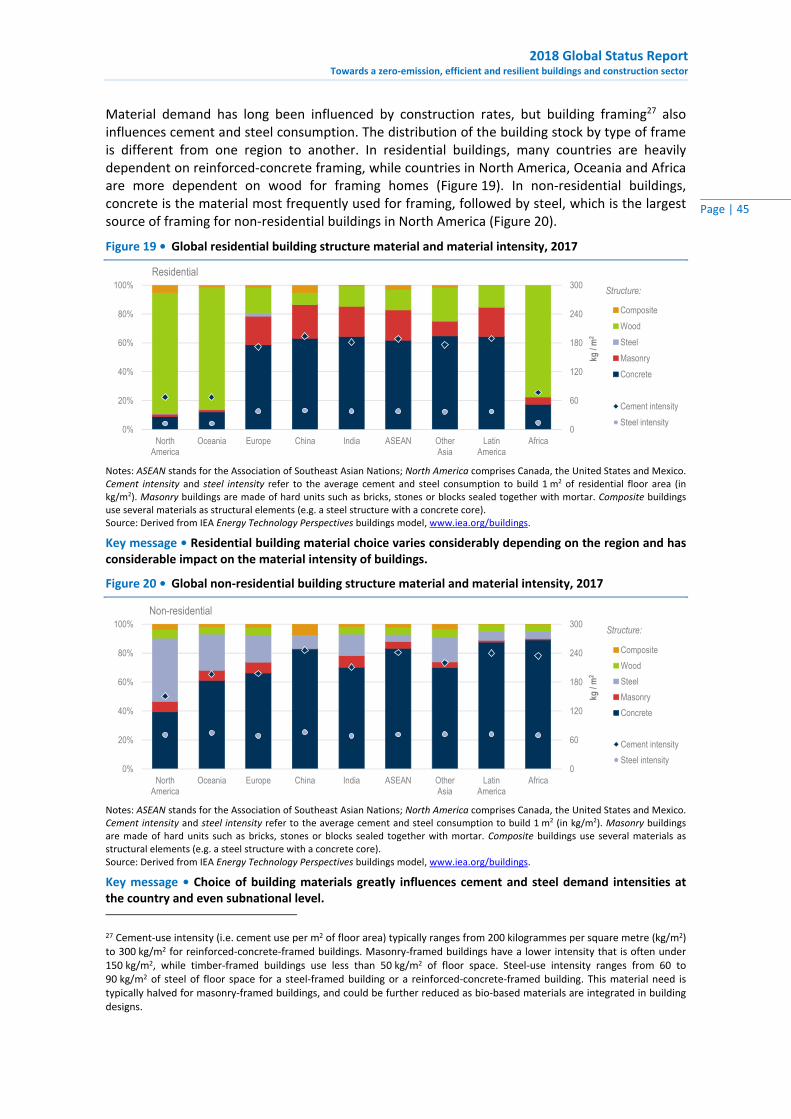
2018 Global Status Report Towards a zero‐emission, efficient and resilient buildings and construction sector
Page | 45
Material demand has long been influenced by construction rates, but building framing27 also influences cement and steel consumption. The distribution of the building stock by type of frame is different from one region to another. In residential buildings, many countries are heavily dependent on reinforced‐concrete framing, while countries in North America, Oceania and Africa are more dependent on wood for framing homes (Figure 19). In non‐residential buildings, concrete is the material most frequently used for framing, followed by steel, which is the largest source of framing for non‐residential buildings in North America (Figure 20).
Figure 19 • Global residential building structure material and material intensity, 2017
Notes: ASEAN stands for the Association of Southeast Asian Nations; North America comprises Canada, the United States and Mexico. Cement intensity and steel intensity refer to the average cement and steel consumption to build 1 m2 of residential floor area (in kg/m2). Masonry buildings are made of hard units such as bricks, stones or blocks sealed together with mortar. Composite buildings use several materials as structural elements (e.g. a steel structure with a concrete core). Source: Derived from IEA Energy Technology Perspectives buildings model, www.iea.org/buildings.
Key message • Residential building material choice varies considerably depending on the region and has considerable impact on the material intensity of buildings.
Figure 20 • Global non‐residential building structure material and material intensity, 2017
Notes: ASEAN stands for the Association of Southeast Asian Nations; North America comprises Canada, the United States and Mexico. Cement intensity and steel intensity refer to the average cement and steel consumption to build 1 m2 (in kg/m2). Masonry buildings are made of hard units such as bricks, stones or blocks sealed together with mortar. Composite buildings use several materials as structural elements (e.g. a steel structure with a concrete core). Source: Derived from IEA Energy Technology Perspectives buildings model, www.iea.org/buildings.
Key message • Choice of building materials greatly influences cement and steel demand intensities at the country and even subnational level.
27 Cement‐use intensity (i.e. cement use per m2 of floor area) typically ranges from 200 kilogrammes per square metre (kg/m2) to 300 kg/m2 for reinforced‐concrete‐framed buildings. Masonry‐framed buildings have a lower intensity that is often under 150 kg/m2, while timber‐framed buildings use less than 50 kg/m2 of floor space. Steel‐use intensity ranges from 60 to 90 kg/m2 of steel of floor space for a steel‐framed building or a reinforced‐concrete‐framed building. This material need is typically halved for masonry‐framed buildings, and could be further reduced as bio‐based materials are integrated in building designs.
0
60
120
180
240
300
0%
20%
40%
60%
80%
100%
NorthAmerica
Oceania Europe China India ASEAN OtherAsia
LatinAmerica
Africa
kg /
m2
Residential
Composite
Wood
Steel
Masonry
Concrete
Cement intensity
Steel intensity
Structure:
0
60
120
180
240
300
0%
20%
40%
60%
80%
100%
NorthAmerica
Oceania Europe China India ASEAN OtherAsia
LatinAmerica
Africa
kg /
m2
Non-residential
Composite
Wood
Steel
Masonry
Concrete
Cement intensity
Steel intensity
Structure:
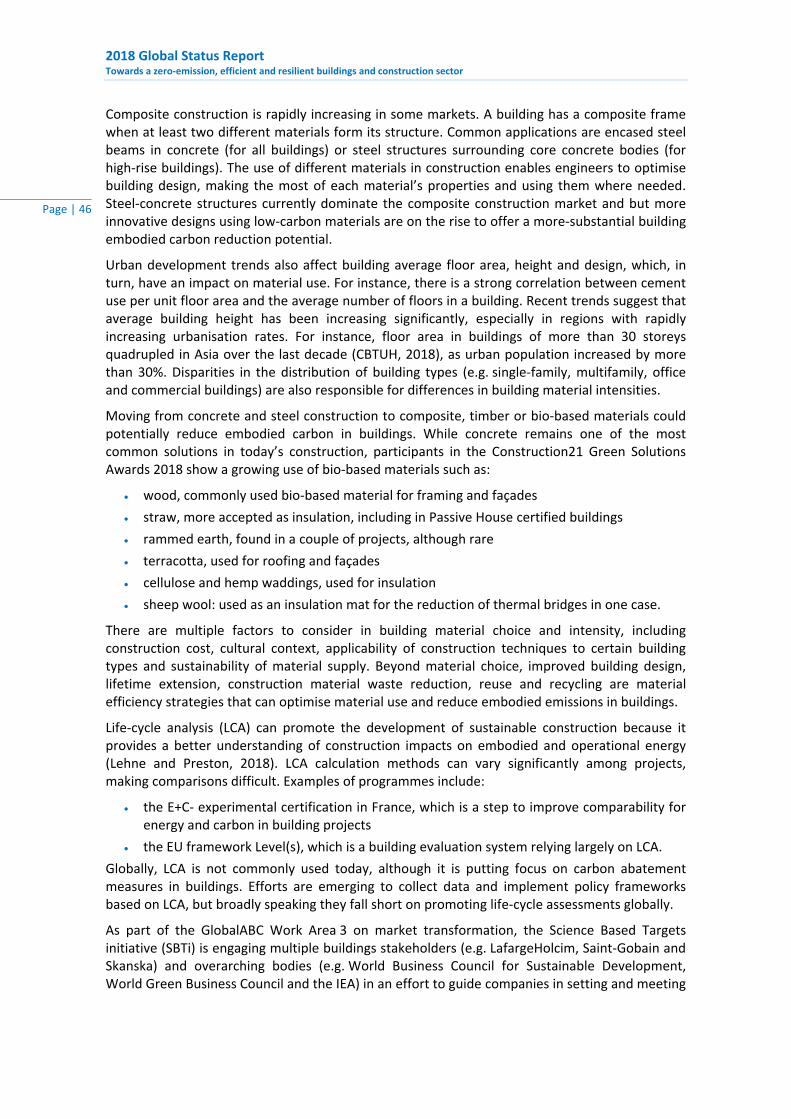
2018 Global Status Report
Towards a zero‐emission, efficient and resilient buildings and construction sector
Page | 46
Composite construction is rapidly increasing in some markets. A building has a composite frame when at least two different materials form its structure. Common applications are encased steel beams in concrete (for all buildings) or steel structures surrounding core concrete bodies (for high‐rise buildings). The use of different materials in construction enables engineers to optimise building design, making the most of each material’s properties and using them where needed. Steel‐concrete structures currently dominate the composite construction market and but more innovative designs using low‐carbon materials are on the rise to offer a more‐substantial building embodied carbon reduction potential.
Urban development trends also affect building average floor area, height and design, which, in turn, have an impact on material use. For instance, there is a strong correlation between cement use per unit floor area and the average number of floors in a building. Recent trends suggest that average building height has been increasing significantly, especially in regions with rapidly increasing urbanisation rates. For instance, floor area in buildings of more than 30 storeys quadrupled in Asia over the last decade (CBTUH, 2018), as urban population increased by more than 30%. Disparities in the distribution of building types (e.g. single‐family, multifamily, office and commercial buildings) are also responsible for differences in building material intensities.
Moving from concrete and steel construction to composite, timber or bio‐based materials could potentially reduce embodied carbon in buildings. While concrete remains one of the most common solutions in today’s construction, participants in the Construction21 Green Solutions Awards 2018 show a growing use of bio‐based materials such as:
wood, commonly used bio‐based material for framing and façades
straw, more accepted as insulation, including in Passive House certified buildings
rammed earth, found in a couple of projects, although rare
terracotta, used for roofing and façades
cellulose and hemp waddings, used for insulation
sheep wool: used as an insulation mat for the reduction of thermal bridges in one case.
There are multiple factors to consider in building material choice and intensity, including construction cost, cultural context, applicability of construction techniques to certain building types and sustainability of material supply. Beyond material choice, improved building design, lifetime extension, construction material waste reduction, reuse and recycling are material efficiency strategies that can optimise material use and reduce embodied emissions in buildings.
Life‐cycle analysis (LCA) can promote the development of sustainable construction because it provides a better understanding of construction impacts on embodied and operational energy (Lehne and Preston, 2018). LCA calculation methods can vary significantly among projects, making comparisons difficult. Examples of programmes include:
the E+C‐ experimental certification in France, which is a step to improve comparability for energy and carbon in building projects
the EU framework Level(s), which is a building evaluation system relying largely on LCA.
Globally, LCA is not commonly used today, although it is putting focus on carbon abatement measures in buildings. Efforts are emerging to collect data and implement policy frameworks based on LCA, but broadly speaking they fall short on promoting life‐cycle assessments globally.
As part of the GlobalABC Work Area 3 on market transformation, the Science Based Targets initiative (SBTi) is engaging multiple buildings stakeholders (e.g. LafargeHolcim, Saint‐Gobain and Skanska) and overarching bodies (e.g. World Business Council for Sustainable Development, World Green Business Council and the IEA) in an effort to guide companies in setting and meeting

2018 Global Status Report Towards a zero‐emission, efficient and resilient buildings and construction sector
Page | 47
GHG reduction targets. The SBTi4buildings project focuses on enabling the buildings and construction sector to a suitable pathway with objectives to:
map the carbon footprint of the buildings and construction value chain
elaborate on a common language allowing study of carbon emissions interdependencies and assignment of company responsibilities
move away from a vertical approach that breaks down a building carbon budget into smaller pieces for each subsector
adopt a horizontal approach, setting performance‐based targets to promote demand along the entire value chain
define a framework that characterises building life‐cycle stages and subsectors
improve understanding of embodied carbon in buildings
enable representation of the value chain by inviting building occupiers, property managers and investors to take part in discussions.
Examples for increasing the sustainability of buildings through the use of materials show a range of products that are starting to provide creative options (Box 15).
Box 15 • Examples of material solutions for sustainable buildings
Australia
In 2016, the Australian government made changes to building codes recognising massive timber as a viable, code‐compliant construction material for mid‐rise buildings. Timber buildings construction could be allowed for up to eight storeys, while it was previously limited to around three (ABCB, 2016).
Austria
Concrete is being used to enable more‐efficient heating and cooling and also as a means of storing excess wind and solar energy through structural thermal masses (Architektur, 2015). Insulated concrete, lightweight concrete and concrete as a thermal mass are key to the 100% Haus, such as Haus M in Graz (100% Haus, 2017).
France
The Beehive is one example of a residential building project that increased the share of bio‐based materials by using earth and straw. Triballat is an office building that used prefabricated wood‐concrete hemp panels to provide insulation and structure in an integrated wall, while CFA BTP Blois is an academic building that is based on the use of wood for structure and façades to help provide a bioclimatic and low‐carbon building. LowCal is another office building project and was developed to be energy positive. It is the first tertiary building to be labelled E4 C2 in the E+C‐ experimental certification, and included straw‐wood construction, soil‐based adobe brick and cellulose insulation (Construction21, 2018).
INIES is a national reference database putting together nearly 1 100 declarations on more than 70 000 product environmental profiles on building equipment and services, all of them being certified by a third party. Operated by the HQE association in France, INIES uses life‐cycle inventories to promote high‐quality ecodesign of buildings through assessment of its environmental and health impact.
Mexico
Programmes are being designed to promote low‐footprint materials in the housing sector across the country, where current construction techniques are not the most efficient. Initiatives of companies like CEMEX that are lowering the production cost of cement through energy and resource efficiency are receiving recognition. Additionally, CONAVI is planning to promote industrialised materials that will diversify construction methods, accelerate construction times and improve the LCA of materials.28
United Kingdom
Brighton Waste House, the “first permanent ‘carbon negative’ public building in Europe”, is an extreme example of an energy‐efficient building that was built out of 90% waste material. London Aquatic Centre received BREEAM Innovation Credit for the use of concrete mixes with over 80% of secondary aggregate from recycled sources. The project also reduced material embodied energy by 50% with the use of recycled roof and wall materials (Construction21, 2018).
28 Written communication from Ministry of Agricultural, Territorial and Urban Development, Mexico.
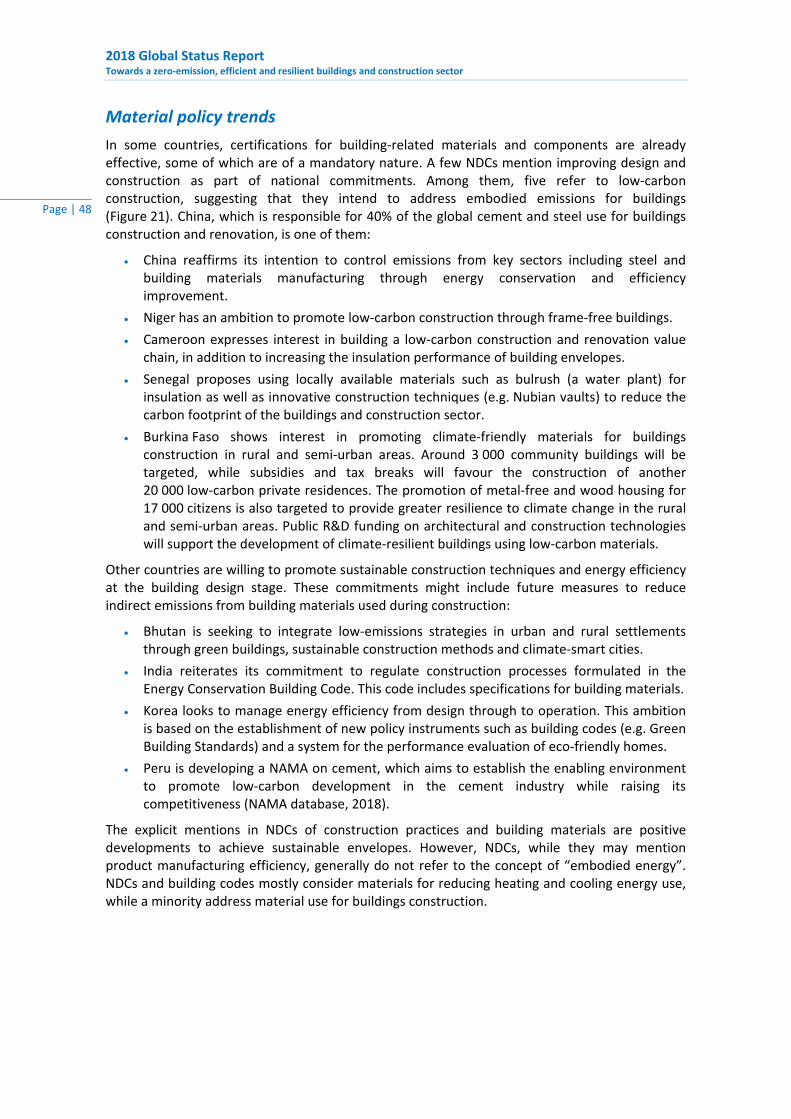
2018 Global Status Report
Towards a zero‐emission, efficient and resilient buildings and construction sector
Page | 48
Material policy trends
In some countries, certifications for building‐related materials and components are already effective, some of which are of a mandatory nature. A few NDCs mention improving design and construction as part of national commitments. Among them, five refer to low‐carbon construction, suggesting that they intend to address embodied emissions for buildings (Figure 21). China, which is responsible for 40% of the global cement and steel use for buildings construction and renovation, is one of them:
China reaffirms its intention to control emissions from key sectors including steel and building materials manufacturing through energy conservation and efficiency improvement.
Niger has an ambition to promote low‐carbon construction through frame‐free buildings.
Cameroon expresses interest in building a low‐carbon construction and renovation value chain, in addition to increasing the insulation performance of building envelopes.
Senegal proposes using locally available materials such as bulrush (a water plant) for insulation as well as innovative construction techniques (e.g. Nubian vaults) to reduce the carbon footprint of the buildings and construction sector.
Burkina Faso shows interest in promoting climate‐friendly materials for buildings construction in rural and semi‐urban areas. Around 3 000 community buildings will be targeted, while subsidies and tax breaks will favour the construction of another 20 000 low‐carbon private residences. The promotion of metal‐free and wood housing for 17 000 citizens is also targeted to provide greater resilience to climate change in the rural and semi‐urban areas. Public R&D funding on architectural and construction technologies will support the development of climate‐resilient buildings using low‐carbon materials.
Other countries are willing to promote sustainable construction techniques and energy efficiency at the building design stage. These commitments might include future measures to reduce indirect emissions from building materials used during construction:
Bhutan is seeking to integrate low‐emissions strategies in urban and rural settlements through green buildings, sustainable construction methods and climate‐smart cities.
India reiterates its commitment to regulate construction processes formulated in the Energy Conservation Building Code. This code includes specifications for building materials.
Korea looks to manage energy efficiency from design through to operation. This ambition is based on the establishment of new policy instruments such as building codes (e.g. Green Building Standards) and a system for the performance evaluation of eco‐friendly homes.
Peru is developing a NAMA on cement, which aims to establish the enabling environment to promote low‐carbon development in the cement industry while raising its competitiveness (NAMA database, 2018).
The explicit mentions in NDCs of construction practices and building materials are positive developments to achieve sustainable envelopes. However, NDCs, while they may mention product manufacturing efficiency, generally do not refer to the concept of “embodied energy”. NDCs and building codes mostly consider materials for reducing heating and cooling energy use, while a minority address material use for buildings construction.
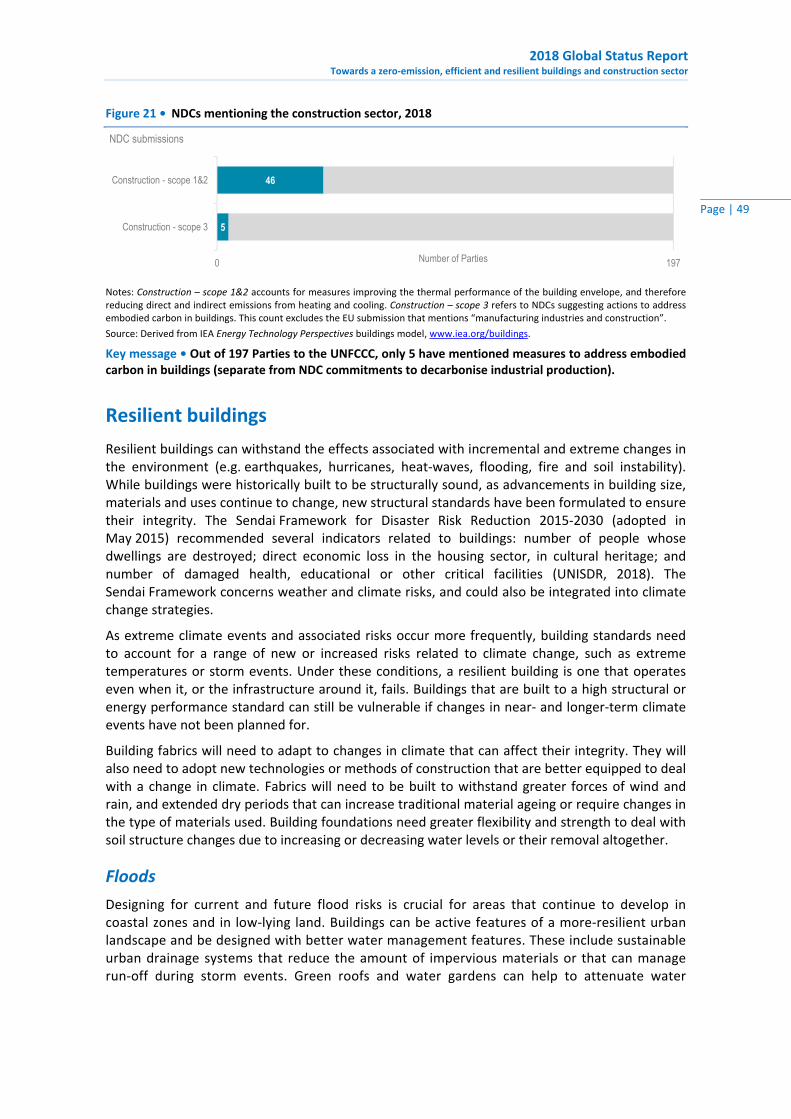
2018 Global Status Report Towards a zero‐emission, efficient and resilient buildings and construction sector
Page | 49
Figure 21 • NDCs mentioning the construction sector, 2018
Notes: Construction – scope 1&2 accounts for measures improving the thermal performance of the building envelope, and therefore reducing direct and indirect emissions from heating and cooling. Construction – scope 3 refers to NDCs suggesting actions to address embodied carbon in buildings. This count excludes the EU submission that mentions “manufacturing industries and construction”.
Source: Derived from IEA Energy Technology Perspectives buildings model, www.iea.org/buildings.
Key message • Out of 197 Parties to the UNFCCC, only 5 have mentioned measures to address embodied carbon in buildings (separate from NDC commitments to decarbonise industrial production).
Resilient buildings
Resilient buildings can withstand the effects associated with incremental and extreme changes in the environment (e.g. earthquakes, hurricanes, heat‐waves, flooding, fire and soil instability). While buildings were historically built to be structurally sound, as advancements in building size, materials and uses continue to change, new structural standards have been formulated to ensure their integrity. The Sendai Framework for Disaster Risk Reduction 2015‐2030 (adopted in May 2015) recommended several indicators related to buildings: number of people whose dwellings are destroyed; direct economic loss in the housing sector, in cultural heritage; and number of damaged health, educational or other critical facilities (UNISDR, 2018). The Sendai Framework concerns weather and climate risks, and could also be integrated into climate change strategies.
As extreme climate events and associated risks occur more frequently, building standards need to account for a range of new or increased risks related to climate change, such as extreme temperatures or storm events. Under these conditions, a resilient building is one that operates even when it, or the infrastructure around it, fails. Buildings that are built to a high structural or energy performance standard can still be vulnerable if changes in near‐ and longer‐term climate events have not been planned for.
Building fabrics will need to adapt to changes in climate that can affect their integrity. They will also need to adopt new technologies or methods of construction that are better equipped to deal with a change in climate. Fabrics will need to be built to withstand greater forces of wind and rain, and extended dry periods that can increase traditional material ageing or require changes in the type of materials used. Building foundations need greater flexibility and strength to deal with soil structure changes due to increasing or decreasing water levels or their removal altogether.
Floods
Designing for current and future flood risks is crucial for areas that continue to develop in coastal zones and in low‐lying land. Buildings can be active features of a more‐resilient urban landscape and be designed with better water management features. These include sustainable urban drainage systems that reduce the amount of impervious materials or that can manage run‐off during storm events. Green roofs and water gardens can help to attenuate water
5
46
0 197
Construction - scope 3
Construction - scope 1&2
Number of Parties
NDC submissions

2018 Global Status Report
Towards a zero‐emission, efficient and resilient buildings and construction sector
Page | 50
run‐off during storm events. Governments are now creating policies to address buildings and flood risk from storm and rising sea levels, for example:
Monroe County, Florida, which contains the Florida Keys and is a coastal flood zone, has required buildings to be built a minimum of 30 centimetres above the base flood elevation since 2016. Parts of the county have a base flood elevation of 3.3 metres, which is increasing over time (Monroe County, 2018).
A recent agreement between Da Nang and Quang Nam Provinces in Viet Nam has begun the creation of a joint water management plan that aims to reduce flooding risks and better plan the rapid urbanisation along the Vu Gia‐Thu Bon river basin (Medium, 2018).
Urban heat islands
The urban heat island effect can be reduced when taken into account in urban planning and or during the building design phase, through the orientation of buildings, air circulation, materials and vegetation. Buildings designs may also need to develop, for example, by using highly insulated construction in areas becoming more prone to heat‐waves and elevated temperatures. Landscape features can also provide evaporative cooling to reduce localised heat islands. Urban heat islands have a real local impact, and cities are responding with efforts to minimise their effects:
Since 2003, Tokyo has had a Heat Island Control Measures policy requiring new construction or expanded buildings to account for their impact on the local heat island by adopting measures based on their location within Tokyo and the size of the development. These include increasing the surface reflectance, greening façades and roofs, and increasing site vegetation (Tokyo Metropolitan Government, 2005).
The draft New London Plan included development proposals to minimise the impact of the urban heat island and reduce the need for space cooling through heat‐sensitive designs and materials (Greater London Authority, 2018a). It also includes a statement that London’s green belt should be protected from inappropriate development and that its quality should be improved while enhancing access to green infrastructure (Greater London Authority, 2018b).
Adaptation
Buildings can also be better designed to adapt to changes in climate through the use of adequate passive and active technologies, including advanced sensors and adaptive technologies. Economic losses related to extreme events are also likely to increase under a changing climate. The extent and severity of those losses related to the built environment will be influenced by adaptability and resiliency. Overall economic losses related to weather disasters in 2017 (including building damage) were estimated at more than USD 200 billion globally, and there were more than 8 000 victims (Swiss Re Institute, 2018). Institutional investors, who are major investors in global building stock, will need tools to evaluate their investment risk and its resilience to climate change events.
The 2018 Resilience Reference Guide (GRESB, 2018), which assesses the sustainability and resilience of real estate and infrastructure portfolios, includes questions on resilience and climate risks of organisations’ assets and promotes resilience at the company level. The cost of damage or the cost of transition (stranded assets or economical loses linked to mitigation or adaptation measures) is a real concern for investors in building assets. Buildings represent an important economic asset and are capital intensive. There is therefore a growing recognition for the need for assessment of climate change risks of building investment portfolios (TCFD, 2017).
2018 Global Status Report Towards a zero‐emission, efficient and resilient buildings and construction sector
Page | 51
Article 7 of the Paris Agreement establishes a global goal on adaptation to climate change of enhancing adaptive capacity, strengthening resilience and reducing vulnerability. Within the national adaptation plans communicated to the UNFCCC, some countries such as Brazil, Burkina Faso, Kenya and Sri Lanka included measures related to buildings (e.g. reviews of building regulations and standards and urban planning rules).
The national climate adaptation plan in France established two key measures related to buildings: the promotion of more‐efficient cooling equipment and the reinforcement of summer comfort requirements in the building code. Summer comfort is particularly important given the context of the 2018 summer heatwave that averaged 2°C above seasonal norms and is ranked as the second hottest on record after the 2003 heatwave. As the climate continues to change and the normal conditions that buildings experience shift, buildings need to withstand these conditions, which requires more attention to building risk assessment and construction methods. Global efforts are bringing resiliency to policies, building design and construction (Box 16).
Box 16 • Examples of steps made towards achieving resilient buildings
100 Resilient Cities
The 100 Resilient Cities project is supporting cities to become more resilient and has identified four key steps: creation of the position of a Chief Resilience Officer in each city; development of a resilience strategy; provision of access to resilience service providers; and sharing and learning in a global network of member cities (100 Resilient Cities, 2018).
Australia
The Insurance Council of Australia has developed a building resilience web tool to raise awareness of property owners by enabling the rating of resilience performance of private buildings (Insurance Council of Australia, 2018).
France
The E.Leclerc centre in Quimper is a supermarket that used white paint on its roof to withstand summer heat and reduce the urban heat island effect (Construction21, 2018). A study conducted by the Observatoire de l’immobilier durable and PwC on climate reporting also shows that an increasing number of real estate asset managers map the climate risks of their portfolios to identify the assets at risk and the measures to implement (OID and PwC, 2017). Additionally, the label “HQE” (high quality of environment) for housing has included criteria for resilience since February 2018 (HQE GBC, 2018).
United Kingdom
Thames Amphibious House is designed to rise on its dock‐like foundations on the River Thames to avoid flood waters and increase its resilience to extreme weather events (Construction21, 2018).
United States
The recent LEED‐platinum‐rated Lucille Packard Children’s Hospital at Stanford University integrates a horizontal solar shading system with outdoor planters to reduce heat gains through active and passive means (Facility Executive, 2018). In November 2017, Green Business Certification Inc. adopted RELi as a resilient rating system for certification of buildings, neighbourhoods, homes and infrastructure developed in 2014 (GBCI, 2017).
Urban solutions
Urban environments have and will continue to have a strong influence on the construction of buildings and their energy use. Urban environments influence the size, shape and type of buildings that are built and how they respond to their surrounding environment through municipal governance, land use and planning controls. Local government planning often has the power to directly control aspects related to building energy performance, including height and overshadowing, orientation, building controls and inspection, and requirements around access to energy and transport infrastructure.
2018 Global Status Report
Towards a zero‐emission, efficient and resilient buildings and construction sector
Page | 52
City29 planning typically also influences the adoption of district energy services and integration of decentralised energy generation. Local governments typically have control over many buildings, often in the form of municipal offices, schools, public housing, warehouses, and sanitary and waste services. This makes them a large single‐source buyer who can influence supplier practices and the adoption of more‐efficient technologies across their building stocks.
Cities that own their own utilities have an incentive to address energy performance of their building stock and of those buildings to which they provide services. The cost of building new power generation systems can be far greater than that of maintaining and upgrading existing systems. Adopting energy efficiency among energy customers of a local utility provides a solution for reducing the rate of energy demand growth.
Municipal governments also play an important role in setting the tone and conditions around buildings construction through incentives and reporting activities, and, in some cases, through conditions on issuing building permits. During the 2018 Global Climate Action Summit, 19 mayors, representing 130 million people, committed to all new buildings operating as net‐zero carbon by 2030. The Net Zero Carbon Buildings Declaration that the mayors signed is a commitment to enacting “regulations and/or planning policy to ensure new buildings operate as net‐zero carbon by 2030 and all buildings by 2050” (C40 Cities, 2018). Beyond the declaration, 12 businesses, 22 cities, and 4 states and regions also signed the Net Zero Buildings Commitment (WorldGBC, 2018b). In addition, 443 commitments have been made in renewable energy, including through the ICLEI 100% RE Energy Cities and Regions Network, pledging to move towards 100% renewable electricity (citywide) by 2035, and 100% renewable energy (including electricity, heating, cooling and transport) by 2050.30
Energy benchmarking and disclosure programmes provide another means for municipal governments to direct improvement in buildings construction quality and energy performance of new and existing buildings. These programmes can be applied to their own building stock or more widely under compulsory or voluntary systems. In many cases, these data can help set benchmarks and track progress on improvements in performance and energy use (e.g. the Tokyo carbon reduction reporting programme mandating the reporting of CO2 emissions for small and medium facilities [Tokyo Metropolitan Government, 2018]). City governments can also take an active role in making energy and building data more accessible as part of their public services, for example, by digitalising information on properties and buildings that can be accessed by owners and residents and used to direct energy programmes.
Local governments can support other levels of government to raise their ambitions, sharing best practices and climate‐related data, on top of their needs to overcome barriers. Global platforms such as the carbonn Climate Registry, managed by ICLEI, recognised in the Global Covenant of Mayors for Climate & Energy, support multilevel governance by recognition of the key role that communities play in reaching national objectives.31 Urban initiatives are enabling sustainability through policies, planning and construction (Box 17).
29 The terms “city” and “local government” are used throughout this document, understanding that the geopolitical institutions of local governments may vary from country to country and terminology used may differ. In this document, a city refers to a geographical subnational jurisdiction (“territory”) such as a community, a town or a city that is governed by a local government as the legal entity of public administration. 30 Written communication from ICLEI and www.iclei.org. 31 Written communication from ICLEI and www.carbonn.org.
2018 Global Status Report Towards a zero‐emission, efficient and resilient buildings and construction sector
Page | 53
Box 17 • Examples of urban initiatives supporting sustainable buildings
Austria
The GreenHouse student dormitory in Vienna supports energy efficiency through connection to an urban heating network, bike storage and charging stations for electric cars (Construction21, 2018).
France
The recently constructed Paris Court in Porte de Clichy includes a total net floor area of 110 000 m2 and is designed with a district heating system for space and water heating. The development also includes transport mobility integration (Construction21, 2018).
Mexico
Mexico has created policies to curb urban sprawl, including a policy implemented at the federal level to set the perimeters of urban containment. This policy provides guidance on the ability to receive incentives based on location and housing quality in relation to the local environment.32
Switzerland
The 2000‐Watt Society is a model for Swiss energy policy that limits per‐capita energy consumption to 2 000 W, a significant reduction from the current 5 500 W per capita. An example for a 2 000 W certified development is the settlement of Stöckacker Süd in Bümpliz, a neighbourhood to the west of the capital Bern. The development is 146 urban apartments that comply with the Minergie P‐Eco standard (low energy and highest possible renewable energy) and is connected to public transport (Swissinfo, 2018).
United States (Los Angeles)
The Energy Atlas of the County of Los Angeles provides online interactive information through which residents and citizens can view, analyse and compare energy use across the county. The Atlas comprises information on every property within the county including energy use, fuel type, GHG emissions, building type and age. The Atlas provides local government with a mechanism to plan climate actions, identify areas of high energy intensity and investment in energy efficiency, and evaluate the impact of energy efficiency programmes on energy savings (UCLA, 2018).
Clean energy transition
Enabling the transition to a sustainable buildings and construction sector will require swift and ambitious policy action to innovate and move markets quickly to low‐carbon and high‐efficiency technologies and best building practices. This will capture energy savings in the next decade and reduce the increasing impact that growing electricity demand has on the power sector, whose global average efficiency is less than 45% (IEA, 2018g).
Shifting to electricity in buildings can offer considerable gains in energy performance through more‐efficient technologies, while tapping into opportunities offered by the growing digital economy and enabling greater flexibility of demand within the energy sector. However, that increased electricity demand will also place greater strains on the power sector and should be planned carefully, to ensure those investments lead to a net reduction in emissions.
The clean energy transition towards sustainable buildings and construction will also require a strategic shift away from use of fossil fuels in buildings. Fossil fuels still account for 36% of the final energy consumption in buildings and represent 2.9 GtCO2 in annual emissions, or slightly less than all the emissions produced by the European Union in 2016.
Progress is already noticeable in some areas. For example, sales of heat pumps and renewable heating equipment have increased by about 5% per year since 2010, representing approximately 10% of the overall heating equipment sales in 2017 (IEA, 2018g). Solar thermal energy use in buildings, notably for water heating, has almost doubled since 2010. Sales of LEDs now represent
32 Written communication from Ministry of Agricultural, Territorial and Urban Development, Mexico.
2018 Global Status Report
Towards a zero‐emission, efficient and resilient buildings and construction sector
Page | 54
around one‐third of market sales, owing to reductions in costs, improved quality and greater options for lighting applications (see “Technology solutions” section above).
Source of clean energy for buildings
Clean energy for buildings can be divided between onsite and offsite generation. Offsite generation includes renewable energy delivered in the electricity grid. Onsite generation is enabled by the available energy resources within the boundary of a building site and whose generation relies on the capture and conversion of solar, wind or thermal energy within that boundary. Examples of onsite generation include use of solar PVs and solar thermal panels on buildings and use of geothermal heating and cooling technologies (e.g. with ground source heat pumps). In some markets, such as the European Union, air source heat pumps are also considered renewable, producing greater heating and cooling service provision (in calorific output) than the energy consumed to produce that output.
Onsite generation can be achieved by importing or converting clean fuels and generating thermal or electric power on the building site. This can be done through the use of biomass, biogas or hydrogen, for instance. Clean energy generation technologies can be integrated into building services, for example co‐generation,33 or biogas from wastewater systems. Building fabrics provide another opportunity to integrate renewable energy generation through integrated PVs on roofs and walls, shading and small‐scale wind generation.
Improved energy management and demand response can reduce overall consumption of fossil fuel in buildings (or indirect use of fossil fuels for power generation) to enable a larger share of clean energy. For instance, shifting when buildings need heating and cooling can reduce peak energy demand (typically produced using fossil fuels) and potentially shift to renewable energy. The use of smart controls and smart grids can improve the operational efficiency to lower the total global buildings energy demand by as much as 10% over the next 20 years (IEA, 2017a).
Access to and use of modern energy services
In 2015 as part of the Transforming our World: 2030 Agenda for Sustainable Development, member states of the United Nations agreed a specific SDG to ensure access to affordable, reliable and modern energy for all, and universal access to electricity and clean cooking by 2030 (SDG 7). Access to affordable and reliable energy services is fundamental for reducing poverty and improving health, increasing productivity, enhancing competitiveness and promoting economic growth. This is because modern energy services enhance the life of the poor in countless ways. For instance, electricity provides the highest quality and most‐efficient form of lighting, extending the day and providing extra hours to study or work. Household appliances also require it, opening up new possibilities for communication, entertainment, heating, etc.
The IEA provides annual country‐by‐country data on access to electricity and clean cooking (SDG 7.1) and is the main source for tracking progress towards renewables (SDG 7.2) and energy efficiency (SDG 7.3) targets. 2017 saw the number of people without access to electricity fall below 1 billion for the first time, down from 1.7 billion in 2000 (IEA, 2018h). India completed the electrification of all villages in early 2018 and plans to reach universal access to electricity in the early 2020s. However, despite significant steps forward in Kenya, Ethiopia, Tanzania and Nigeria, more than 600 million people are still without access to electricity in sub‐Saharan Africa. Some 2.7 billion people also lacked access to clean cooking, which has remained about the same since 2000.
33 Co‐generation refers to the combined production of heat and power.
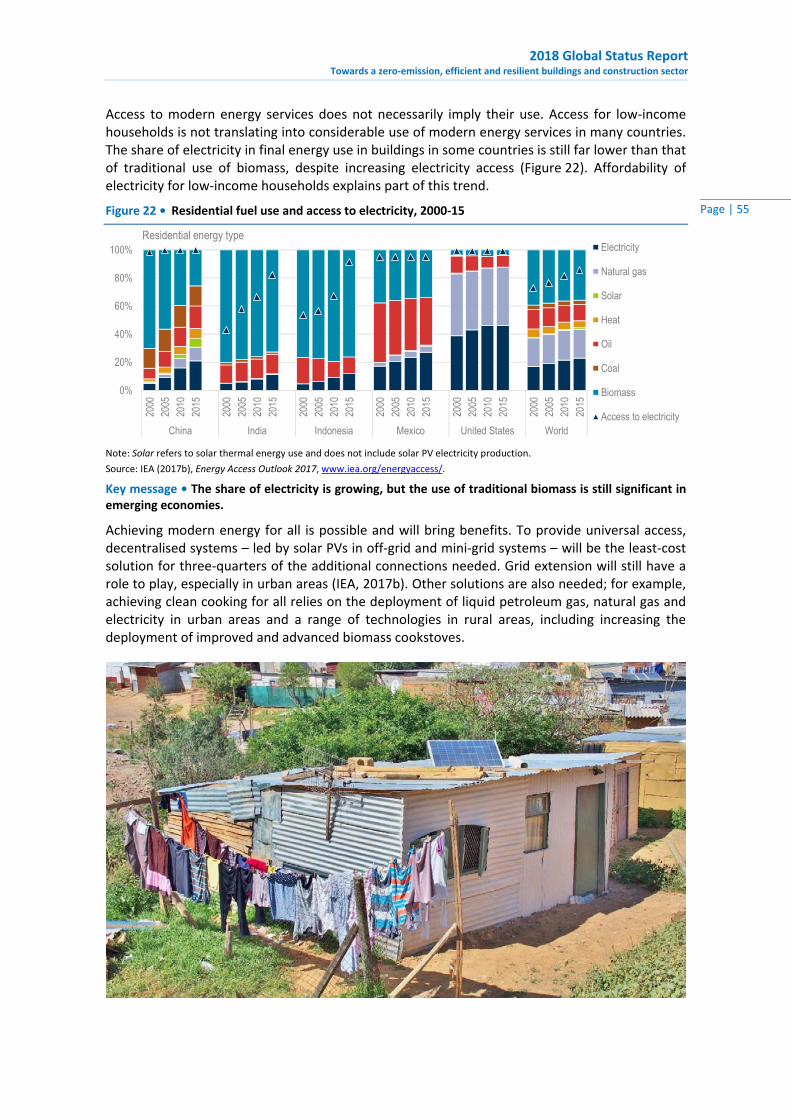
2018 Global Status Report Towards a zero‐emission, efficient and resilient buildings and construction sector
Page | 55
Access to modern energy services does not necessarily imply their use. Access for low‐income households is not translating into considerable use of modern energy services in many countries. The share of electricity in final energy use in buildings in some countries is still far lower than that of traditional use of biomass, despite increasing electricity access (Figure 22). Affordability of electricity for low‐income households explains part of this trend.
Figure 22 • Residential fuel use and access to electricity, 2000‐15
Note: Solar refers to solar thermal energy use and does not include solar PV electricity production.
Source: IEA (2017b), Energy Access Outlook 2017, www.iea.org/energyaccess/.
Key message • The share of electricity is growing, but the use of traditional biomass is still significant in emerging economies.
Achieving modern energy for all is possible and will bring benefits. To provide universal access, decentralised systems – led by solar PVs in off‐grid and mini‐grid systems – will be the least‐cost solution for three‐quarters of the additional connections needed. Grid extension will still have a role to play, especially in urban areas (IEA, 2017b). Other solutions are also needed; for example, achieving clean cooking for all relies on the deployment of liquid petroleum gas, natural gas and electricity in urban areas and a range of technologies in rural areas, including increasing the deployment of improved and advanced biomass cookstoves.
0%
20%
40%
60%
80%
100%
2000
2005
2010
2015
2000
2005
2010
2015
2000
2005
2010
2015
2000
2005
2010
2015
2000
2005
2010
2015
2000
2005
2010
2015
China India Indonesia Mexico United States World
Residential energy type Electricity
Natural gas
Solar
Heat
Oil
Coal
Biomass
Access to electricity
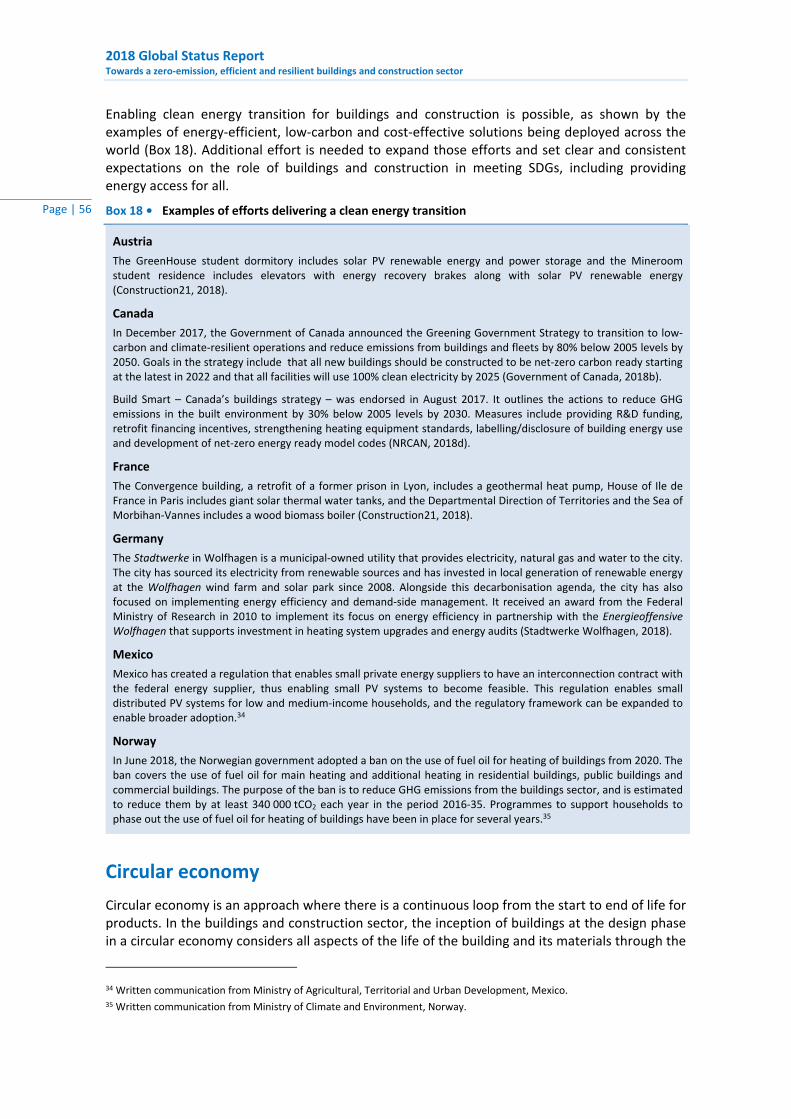
2018 Global Status Report
Towards a zero‐emission, efficient and resilient buildings and construction sector
Page | 56
Enabling clean energy transition for buildings and construction is possible, as shown by the examples of energy‐efficient, low‐carbon and cost‐effective solutions being deployed across the world (Box 18). Additional effort is needed to expand those efforts and set clear and consistent expectations on the role of buildings and construction in meeting SDGs, including providing energy access for all.
Box 18 • Examples of efforts delivering a clean energy transition
Austria
The GreenHouse student dormitory includes solar PV renewable energy and power storage and the Mineroom student residence includes elevators with energy recovery brakes along with solar PV renewable energy (Construction21, 2018).
Canada
In December 2017, the Government of Canada announced the Greening Government Strategy to transition to low‐carbon and climate‐resilient operations and reduce emissions from buildings and fleets by 80% below 2005 levels by 2050. Goals in the strategy include that all new buildings should be constructed to be net‐zero carbon ready starting at the latest in 2022 and that all facilities will use 100% clean electricity by 2025 (Government of Canada, 2018b).
Build Smart – Canada’s buildings strategy – was endorsed in August 2017. It outlines the actions to reduce GHG emissions in the built environment by 30% below 2005 levels by 2030. Measures include providing R&D funding, retrofit financing incentives, strengthening heating equipment standards, labelling/disclosure of building energy use and development of net‐zero energy ready model codes (NRCAN, 2018d).
France
The Convergence building, a retrofit of a former prison in Lyon, includes a geothermal heat pump, House of Ile de France in Paris includes giant solar thermal water tanks, and the Departmental Direction of Territories and the Sea of Morbihan‐Vannes includes a wood biomass boiler (Construction21, 2018).
Germany
The Stadtwerke in Wolfhagen is a municipal‐owned utility that provides electricity, natural gas and water to the city. The city has sourced its electricity from renewable sources and has invested in local generation of renewable energy at the Wolfhagen wind farm and solar park since 2008. Alongside this decarbonisation agenda, the city has also focused on implementing energy efficiency and demand‐side management. It received an award from the Federal Ministry of Research in 2010 to implement its focus on energy efficiency in partnership with the Energieoffensive Wolfhagen that supports investment in heating system upgrades and energy audits (Stadtwerke Wolfhagen, 2018).
Mexico
Mexico has created a regulation that enables small private energy suppliers to have an interconnection contract with the federal energy supplier, thus enabling small PV systems to become feasible. This regulation enables small distributed PV systems for low and medium‐income households, and the regulatory framework can be expanded to enable broader adoption.34
Norway
In June 2018, the Norwegian government adopted a ban on the use of fuel oil for heating of buildings from 2020. The ban covers the use of fuel oil for main heating and additional heating in residential buildings, public buildings and commercial buildings. The purpose of the ban is to reduce GHG emissions from the buildings sector, and is estimated to reduce them by at least 340 000 tCO2 each year in the period 2016‐35. Programmes to support households to phase out the use of fuel oil for heating of buildings have been in place for several years.35
Circular economy
Circular economy is an approach where there is a continuous loop from the start to end of life for products. In the buildings and construction sector, the inception of buildings at the design phase in a circular economy considers all aspects of the life of the building and its materials through the
34 Written communication from Ministry of Agricultural, Territorial and Urban Development, Mexico. 35 Written communication from Ministry of Climate and Environment, Norway.
2018 Global Status Report Towards a zero‐emission, efficient and resilient buildings and construction sector
Page | 57
construction, operation and end of useful life. To achieve the circular nature, the end of life would be extended through improved operations, maintenance, refurbishment, reuse and recycling of the building and building components (Box 19).
Box 19 • Examples of circular economy in the built environment
European Union
The built environment is a target in the European Commission’s policy for circular economy: a regenerative economic system in which resource and energy consumption are minimised. The EU is targeting to move away from the linear economic model of “take, make and waste” and towards resource efficiency. Level(s) is the EU voluntary reporting framework and a tool for designing and constructing sustainable buildings (European Commission, 2018b).
France
The national roadmap for a circular economy provides an ambitious objective of recycling and reusing construction materials to reduce the environmental impact throughout the whole life‐cycle of buildings.36
India
The city of Ahmedabad in Gujarat state has successfully recycled and reused construction and demolition waste at the city scale. The Ahmedabad Municipal Corporation has introduced aggregation and collection systems with promotional policy, which has resulted in segregation and collection of waste in predesignated areas. The waste is recycled by a commercial enterprise to produce non‐structural building materials and is reused in public construction projects of Ahmedabad Municipal Corporation. Procurement incentives and policies have provided a boost to replicate this example in other cities in Gujarat (Iyer‐Raniga et al., n.d.).
Netherlands
Alliander headquarters in the Netherlands could be perceived as a new build. However, it is a reworking and extension of an existing building, where 92% of the materials are labelled as “circular”. Originally built 30 years ago to accommodate 600 people, the expansion in 2015 allowed for a further 900 occupants. Some 90% of the building materials from the existing building were reused or remain on site (Arup & Ellen MacArthur Foundation, 2018).
The concept of circularity has been extolled as value‐added strategies for: recirculating (without reduction in value) of materials, reducing waste upstream and downstream, using “appropriate” materials, extending the lifetime of products, and deploying new business models to encourage circularity in materials use and also through socio‐economic underpinnings of everyday life. Circular economy may be defined as a regenerative system in which resource input and waste, emissions and energy leakage are minimised by closing material and energy loops. This can be achieved through long‐lasting design, maintenance, repair, re‐use, remanufacturing, refurbishing and recycling (Geissdoerfer et al., 2017).
The EU vision for a circular economy is to move away from linear processes, to a scenario where production and consumption processes are closely linked. Waste and waste management would then become resources for manufacturing and production, leading to non‐linear, closed‐loop production and consumption systems (European Commission, 2015). Examples include:
The Ellen MacArthur Foundation has identified four common components to enable a circular economy: 1) circular economy design to enable product reuse, recycling and cascading; 2) new business models to replace existing business models or seize new opportunities to enable circularity; 3) reverse cycles to return materials to the Earth or back into industry; and 4) enablers and favourable system conditions for widespread reuse of materials and higher resource productivity to become commonplace (Ellen MacArthur Foundation, 2018).
All six of the One Planet Network programmes work on the topic of circular economy, and the Sustainable Buildings and Construction Programme has chosen circular economy as its priority theme (One Planet Network, 2018).
36 Written communication from Directorate General for Planning, Housing and Nature, France.
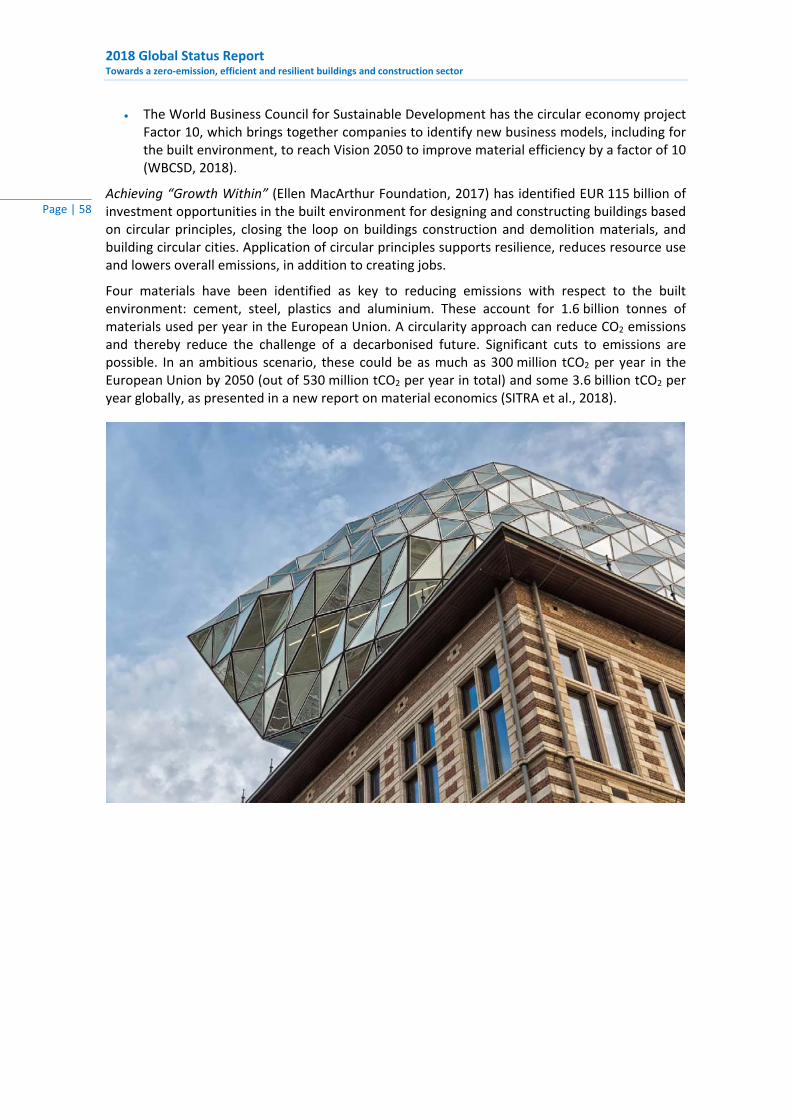
2018 Global Status Report
Towards a zero‐emission, efficient and resilient buildings and construction sector
Page | 58
The World Business Council for Sustainable Development has the circular economy project Factor 10, which brings together companies to identify new business models, including for the built environment, to reach Vision 2050 to improve material efficiency by a factor of 10 (WBCSD, 2018).
Achieving “Growth Within” (Ellen MacArthur Foundation, 2017) has identified EUR 115 billion of investment opportunities in the built environment for designing and constructing buildings based on circular principles, closing the loop on buildings construction and demolition materials, and building circular cities. Application of circular principles supports resilience, reduces resource use and lowers overall emissions, in addition to creating jobs.
Four materials have been identified as key to reducing emissions with respect to the built environment: cement, steel, plastics and aluminium. These account for 1.6 billion tonnes of materials used per year in the European Union. A circularity approach can reduce CO2 emissions and thereby reduce the challenge of a decarbonised future. Significant cuts to emissions are possible. In an ambitious scenario, these could be as much as 300 million tCO2 per year in the European Union by 2050 (out of 530 million tCO2 per year in total) and some 3.6 billion tCO2 per year globally, as presented in a new report on material economics (SITRA et al., 2018).
2018 Global Status Report Towards a zero‐emission, efficient and resilient buildings and construction sector
Page | 59
Global Roadmap recommendations A global transformation to a highly energy‐efficient and low‐carbon buildings and construction sector is key to ensuring global ambitions to limit the rise in average global temperature to less than 2°C above preindustrial levels by 2030. There is a critical window of opportunity to address buildings and construction in the coming decade to avoid locking in inefficient buildings for decades to come. There is an equally critical need to address energy performance improvements and emissions reduction in the world’s existing buildings stock.
There are many strategies for reducing the energy and climate impact of buildings and construction. Key priorities identified by the GlobalABC Global Roadmap (UN Environment and GlobalABC, 2016) include supporting market transformation, training and capacity building for:
1. Urban planning
Use urban planning policies to enable reduced energy demand, increased renewable energy capacity and improved infrastructure resilience.
2. New buildings
Increase uptake of net‐zero operating emissions for buildings.
3. Existing building retrofitting
Increase the rate of building energy renovation and increase the level of energy efficiency in existing buildings.
4. Existing building operations
Reduce the operating energy and emissions through improved energy management tools and operational capacity building.
5. Systems
Reduce the energy demand from systems, appliances, lighting and cooking.
6. Materials
Reduce the environmental impact of materials and equipment in the buildings and construction value chain by taking a life‐cycle approach.
7. Resiliency
Reduce building risks related to climate change by adapting building design and improving resilience.
8. Clean energy
Increase secure, affordable and sustainable energy and reduce the carbon footprint of energy demand in buildings.
Future work will include developing regional roadmaps to provide more‐specific targets by country and region. For further information on best practice and examples of existing policies and technologies for the buildings sector, see www.iea.org/buildings.
2018 Global Status Report
Towards a zero‐emission, efficient and resilient buildings and construction sector
Page | 60
GlobalABC work areas The GlobalABC aims to bring together the buildings and construction industry, countries and stakeholders to raise awareness and facilitate the global transition towards low‐emission, energy‐efficient buildings. The GlobalABC works on a voluntary collaboration basis through a series of five working areas.
Work Area 1: Awareness and education
The focus is to develop common narratives and key messages as well as to support capacity building. Topics include: the importance of targets; the need to increase the level of ambition; how to make the case for finance/policies; bringing out multiple benefits; how to increase demand for energy‐efficient buildings; and training building professionals.
Work Area 2: Public policies
The focus is to be a platform for countries to showcase their policies and enable peer‐to‐peer learning; to mobilise GlobalABC members to facilitate national strategies for low‐carbon buildings; to support the development of national alliances; to promote the integration of sustainable buildings in NDCs; and to enable city and subnational engagement. A local government public policies group has been created to identify opportunities, facilitate community‐level climate and energy strategies, and promote co‐operation among national and subnational governments.
Work Area 3: Market transformation
The focus is to enable multiple partnerships and a shared culture between private and public sectors as well as to facilitate market transformation. This includes the development of voluntary arrangements to prepare regulation and enable innovation in the market. It also includes developing guidance on science‐based targets that can be used to help transform the buildings and construction sector.
Work Area 4: Finance
The focus is to influence the enabling environment and deployment of innovative financing mechanisms that increase investment for a low‐carbon and resilient buildings sector, including: improving government and institutional capacity to set and execute policies that support investment in building‐scale energy efficiency and clean energy; expanding knowledge of private and blended finance mechanisms for reducing sector emissions; and improving access to climate finance.
Work Area 5: Building measurement, data and information
The focus is to reduce CO2 emissions from the buildings and construction sector by addressing data and information gaps and by supporting buildings and construction‐related policy and investment decisions with measurable, reportable and verifiable data. Key barriers include availability, collection, quality, reporting, storage and accessibility. To overcome these barriers, the working area team is co‐ordinating an industry‐wide global effort to develop a digital building data and information collection tool – the so‐called “building passport”. This will help to promote greater cross‐sectoral data transparency, consistency and information exchange.
All work areas welcome new participation. Please contact [email protected] for information.
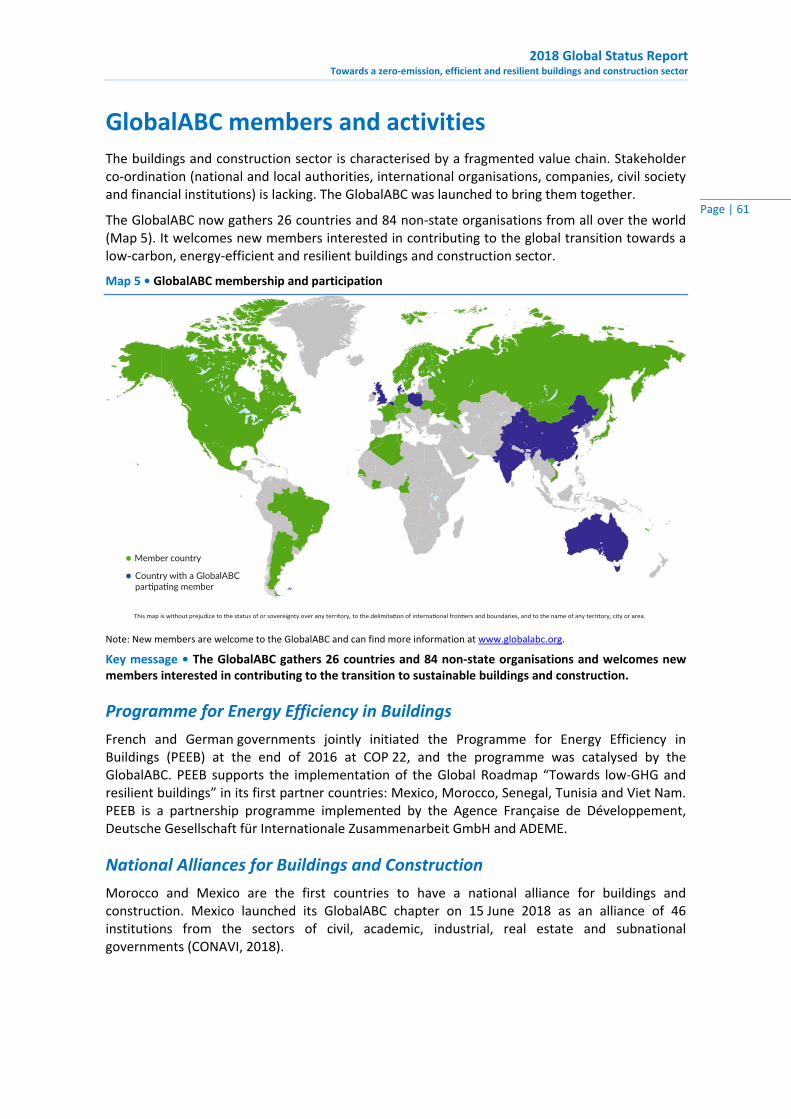
2018 Global Status Report Towards a zero‐emission, efficient and resilient buildings and construction sector
Page | 61
GlobalABC members and activities The buildings and construction sector is characterised by a fragmented value chain. Stakeholder co‐ordination (national and local authorities, international organisations, companies, civil society and financial institutions) is lacking. The GlobalABC was launched to bring them together.
The GlobalABC now gathers 26 countries and 84 non‐state organisations from all over the world (Map 5). It welcomes new members interested in contributing to the global transition towards a low‐carbon, energy‐efficient and resilient buildings and construction sector.
Map 5 • GlobalABC membership and participation
Note: New members are welcome to the GlobalABC and can find more information at www.globalabc.org.
Key message • The GlobalABC gathers 26 countries and 84 non‐state organisations and welcomes new members interested in contributing to the transition to sustainable buildings and construction.
Programme for Energy Efficiency in Buildings
French and German governments jointly initiated the Programme for Energy Efficiency in Buildings (PEEB) at the end of 2016 at COP 22, and the programme was catalysed by the GlobalABC. PEEB supports the implementation of the Global Roadmap “Towards low‐GHG and resilient buildings” in its first partner countries: Mexico, Morocco, Senegal, Tunisia and Viet Nam. PEEB is a partnership programme implemented by the Agence Française de Développement, Deutsche Gesellschaft für Internationale Zusammenarbeit GmbH and ADEME.
National Alliances for Buildings and Construction
Morocco and Mexico are the first countries to have a national alliance for buildings and construction. Mexico launched its GlobalABC chapter on 15 June 2018 as an alliance of 46 institutions from the sectors of civil, academic, industrial, real estate and subnational governments (CONAVI, 2018).
2018 Global Status Report
Towards a zero‐emission, efficient and resilient buildings and construction sector
Page | 62
References 100% Haus (2017), Haus M, www.100prozenthaus.at/referenzen/haus‐m‐wohnhaus‐aus‐
isolationsbeton.
100 Resilient Cities (2018), “100 Resilient Cities”, website, www.100resilientcities.org/about‐us/ (accessed August 2018).
ABCB (Australian Building Codes Board) (2016), Australian Building Regulation Bulletin, Issue 17, www.abcb.gov.au/‐/media/Files/Resources/Education‐Training/ABR‐Online‐Issue‐17.pdf.
ADEME (Agence de l’Environnement et de la Maitrise de l’Energie) [French Environment and Energy Management Agency] (2018), Energy‐climate Scenario 2035‐2050, www.ademe.fr/updated‐energy‐climate‐scenario‐ademe‐2035‐2050.
Architecture Daily (2017), 5 Passive Cooling Alternatives Using Robotics and Smart Materials, www.archdaily.com/877693/iaac‐develops‐five‐passive‐cooling‐alternatives‐using‐robotics‐and‐smart‐materials.
Architektur (2015), Energy Storage Concrete, www.architektur‐online.com/kolumnen/energiespeicher‐beton.
Arup & Ellen MacArthur Foundation (2018), From Principles to Practices: First Steps towards a Circular Built Environment, www.arup.com/perspectives/publications/research/section/first‐steps‐towards‐a‐circular‐built‐environment.
BEE (Bureau of Energy Efficiency, India) (2018), Design Guidelines for Energy‐efficient Multi‐storey Residential Buildings, https://beeindia.gov.in/sites/default/files/Design%20Guideline_Book_0.pdf.
BEEP India (2018), Indo‐Swiss Building Energy Efficiency Project, www.beepindia.org.
BMWi (Bundesministerium für Wirtschaft und Energie) (Federal Ministry of Economy and Energy) (2018), Energy Conservation Legislation, www.bmwi.de/Redaktion/EN/Artikel/Energy/energy‐conservation‐legislation.html.
Boverket (2018), Energy Performance Certificate, www.boverket.se/en/start/building‐in‐sweden/developer/inspection‐and‐delivery/energy‐performance‐certificate/.
BPIE (Building Performance Institute Europe) (2018), Building Renovation Passports, http://bpie.eu/publication/renovation‐passports/.
British Columbia (2018), BC Energy Step Code, www2.gov.bc.ca/gov/content/industry/construction‐industry/building‐codes‐standards/energy‐efficiency/energy‐step‐code.
C40 Cities (2018), 19 Global Cities Commit to Make New Buildings “Net‐Zero Carbon” by 2030, www.c40.org/press_releases/global‐cities‐commit‐to‐make‐new‐buildings‐net‐zero‐carbon‐by‐2030.
Carrier (2018), Carrier Launches the Most Efficient Air Conditioner You Can Buy in America, www.carrier.com/carrier/en/us/news/news‐article/carrier_launches_the_most_efficient_air_conditioner_you_can_buy_in_america.aspx.
CASEDI (2016), Energy Conservation Code for Buildings of Mexico (IECC – MEXICO), www.casedi.org.mx/iecc‐mexico.
CBTUH (Council on Tall Buildings and Urban Habitat) (2018), The Skyscraper Center: The Global Tall Building Database of the CBTUH, www.skyscrapercenter.com/buildings.
2018 Global Status Report Towards a zero‐emission, efficient and resilient buildings and construction sector
Page | 63
CEC (California Energy Commission) (2018), 2019 Building Energy Efficiency Standards, www.energy.ca.gov/title24/2019standards/.
City of Vancouver (2018), Zero Emissions Buildings, https://vancouver.ca/green‐vancouver/zero‐emissions‐buildings.aspx.
Climate Bonds Initiative (2018), Labelled Green Bonds Data, www.climatebonds.net/cbi/pub/data/bonds.
CONAVI (2018), Launch of the GlobalABC Mexico Against Climate Change, www.gob.mx/conavi/articulos/acciones‐del‐sector‐de‐la‐construccion‐contra‐el‐cambio‐climatico?idiom=es.
CONAVI (Mexican National Housing Commission) (2017), Housing Building Code, 3rd edition, www.gob.mx/conavi/documentos/codigo‐de‐edificacion‐de‐vivienda‐3ra‐edicion‐2017.
Construction21 (2018), Green Solutions Awards, www.construction21.org/case‐studies/.
CU Boulder Today (University of Colorado Boulder) (2017), Newly Engineered Material Can Cool Roofs, Structures With Zero Energy Consumption, www.colorado.edu/today/2017/02/09/newly‐engineered‐material‐can‐cool‐roofs‐structures‐zero‐energy‐consumption.
ECD Architects (2018), Wilmcote House, https://ecda.co.uk/portfolio/wilmcote‐house‐2/.
Eco‐Business (2018), Here’s a New Air Conditioner That Cools Without Warming The Planet, www.eco‐business.com/videos/heres‐a‐new‐air‐conditioner‐that‐cools‐without‐warming‐the‐planet/.
EeMAP (2018), Energy Efficient Mortgages Action Plan, http://eemap.energyefficientmortgages.eu/services/.
Eletimes (2018), LED Technology Innovations Happening Around the World, www.eletimes.com/led‐technology‐innovations‐happening‐around‐world.
Ellen MacArthur Foundation (2018), Building Blocks: Circular Economy Design, Business Models, Reverse Cycles and Enabling Conditions are Essential, www.ellenmacarthurfoundation.org/circular‐economy/concept/building‐blocks.
Ellen MacArthur Foundation (2017), Achieving ‘Growth Within’, www.ellenmacarthurfoundation.org/publications/achieving‐growth‐within.
EnDK (Swiss Conference of Cantonal Energy Directors) (2018a), Model Regulations for Energy in the Cantons, www.endk.ch/de/energiepolitik‐der‐kantone/muken.
EnDK (2018b), Model Energy Requirements of the Cantons, www.endk.ch/fr/ablage_fr/politique‐energetique/mopec2014‐f20150109‐2.pdf/view.
EnDK (2018c), The Building Energy Certificate of the Cantons, www.endk.ch/de/energiepolitik‐der‐kantone/geak‐r.
Energiesprong (2018), Energiesprong website, http://energiesprong.eu/about/ (accessed August 2018).
ENERGY STAR (2018), ENERGY STAR by the Numbers, www.energystar.gov/about/origins_mission/energy_star_numbers.
ETH Zurich (2017), Not Air Con, but a Cooling Curtain, www.ethz.ch/en/news‐and‐events/eth‐news/news/2017/07/no‐air‐con‐but‐a‐cooling‐curtain.html.
2018 Global Status Report
Towards a zero‐emission, efficient and resilient buildings and construction sector
Page | 64
European Commission (2018a), Buildings, https://ec.europa.eu/energy/en/topics/energy‐efficiency/buildings.
European Commission (2018b), Level(s), http://ec.europa.eu/environment/eussd/buildings.htm.
European Commission (2017), EPBD Revision: Smartness Indicator for Buildings, http://bpie.eu/wp‐content/uploads/2017/11/Presentation_SmartBuilding_DG_ENER.pdf.
European Commission (2015), Closing the Loop – An EU Action Plan for the Circular Economy, https://eur‐lex.europa.eu/resource.html?uri=cellar:8a8ef5e8‐99a0‐11e5‐b3b7‐01aa75ed71a1.0012.02/DOC_1&format=PDF.
European Parliament (2018a), Directive of the European Parliament and of the Council Amending Directive 2010/31/EU on the Energy Performance of Buildings and Directive 2012/27/EU on Energy Efficiency, http://data.consilium.europa.eu/doc/document/PE‐4‐2018‐INIT/en/pdf.
European Parliament (2018b), Directive (EU) 2018/844 of the European Parliament and of the Council Amending Directive 2010/31/EU on the Energy Performance of Buildings and Directive 2012/27/EU on Energy Efficiency, https://eur‐lex.europa.eu/legal‐content/EN/TXT/PDF/?uri=CELEX:32018L0844&from=EN.
Facility Executive (2018), LEED Platinum Children’s Hospital is First on West Coast, https://facilityexecutive.com/2018/04/leed‐platinum‐childrens‐hospital‐first‐west‐coast/.
Fannie Mae (2018), Fannie Mae Wins Recognition as Largest Issuer of Green Bond by the Climate Bonds Initiative, www.fanniemae.com/portal/media/corporate‐news/2018/green‐bond‐award‐6680.html.
Fédération CINOV (2018), Building Energy Renovation Plan, www.cinov.fr/federation/cache/journal/2018/07/20/plan‐de‐r%C3%A9novation‐%C3%A9nerg%C3%A9tique‐des‐b%C3%A2timents.
For Health (2017), Building Evidence for Health, https://buildingevidence.forhealth.org.
GBCI (Green Business Certification Inc.) (2017), GBCI and the RELi Resilience Standard Work Together, www.gbci.org/reli.
GBIG (Green Building Information Gateway) (2018a), Sweden, www.gbig.org/places/853.
GBIG (2018b), Viet Nam, www.gbig.org/places/6978.
Geissdoerfer, M. et al. (2017), “The circular economy – a new sustainability paradigm”, Journal of Cleaner Production, Vol. 143, pp. 757‐767.
GlobalABC (Global Alliance for Buildings and Construction) (2018), Inputs to the Talanoa Dialogue Provided by the Global Alliance for Buildings and Construction, https://unfccc.int/sites/default/files/resource/66_Talanoa%20Dialogue%20‐%20input%20GABC‐30%20March%202018.pdf.
Government of Canada (2018a), The Low Carbon Economy Fund, www.canada.ca/en/environment‐climate‐change/services/climate‐change/low‐carbon‐economy‐fund.html.
Government of Canada (2018b), Greening Government Strategy, www.canada.ca/en/treasury‐board‐secretariat/services/innovation/greening‐government/strategy.html.
Government of Malta (2018), Energy Performance of Buildings Regulations, http://epc.gov.mt/legislation.

2018 Global Status Report Towards a zero‐emission, efficient and resilient buildings and construction sector
Page | 65
Government of Switzerland (2018a), Federal Act on the Reduction of CO2 Emissions, www.admin.ch/opc/en/classified‐compilation/20091310/201801010000/641.71.pdf.
Government of Switzerland (2018b), Switzerland Targets 50% Reduction in Greenhouse Gas Emissions by 2030, www.admin.ch/gov/en/start/dokumentation/medienmitteilungen.msg‐id‐56394.html.
Government of Ukraine (2018), Bill “On Energy Efficiency Fund” Supported in First Reading, Says Hennadii Zubko, http://old.kmu.gov.ua/kmu/control/en/publish/article?art_id=249834605&cat_id=244314975.
Greater London Authority (2018a), Policy SI4 Managing Heat Risk, www.london.gov.uk/what‐we‐do/planning/london‐plan/new‐london‐plan/draft‐new‐london‐plan/chapter‐9‐sustainable‐infrastructure/policy‐si4‐managing‐heat.
Greater London Authority (2018b), Policy G2 London’s Green Belt, www.london.gov.uk/what‐we‐do/planning/london‐plan/new‐london‐plan/draft‐new‐london‐plan/chapter‐8‐green‐infrastructure‐and‐natural‐environment/policy‐g2.
GRESB (2018), 2018 Resilience Reference Guide, http://gresb‐public.s3.amazonaws.com/2018/Assessments‐and‐Reference‐Guides/2018‐GRESB‐Resilience‐Reference‐Guide.pdf.
HQE GBC (2018), Resilience and Adaptation to Climate Change, www.hqegbc.org/quality‐of‐life/resilience‐and‐adaptation‐to‐climate‐change/.
IEA (2018a), World Energy Statistics and Balances 2018, OECD/IEA, Paris, https://webstore.iea.org/world‐energy‐statistics‐and‐balances‐2018
IEA (2018b), The Future of Cooling: Opportunities for Energy‐efficient Air Conditioning, OECD/IEA, Paris, https://webstore.iea.org/the‐future‐of‐cooling.
IEA (2018c), Energy Efficiency Policies: Buildings, OECD/IEA, Paris, www.iea.org/topics/energyefficiency/policies/buildings.
IEA (2018d), Energy Efficiency Investment Database, OECD/IEA, Paris, www.iea.org/buildings.
IEA (2018e), Energy Efficiency 2018, OECD/IEA, Paris, www.iea.org/efficiency2018.
IEA (2018f), Multiple Benefits of Energy Efficiency, http://beta.iea.org/multiple‐benefits.
IEA (2018g), Buildings: Tracking Clean Energy Progress, OECD/IEA, Paris, www.iea.org/tcep/buildings.
IEA (2018h), World Energy Outlook 2018, OECD/IEA, Paris, https://webstore.iea.org/world‐energy‐outlook‐2018.
IEA (2017a), Digitalization and Energy 2017, OECD/IEA, Paris, www.iea.org/digital.
IEA (2017b), Energy Access Outlook 2017, www.iea.org/energyaccess/.
IEA (International Energy Agency) (2016), Energy Efficiency Market Report 2016, OECD/IEA, Paris, www.iea.org/eemr16/files/medium‐term‐energy‐efficiency‐2016_WEB.PDF.
IFC (International Finance Corporation) (2018), EDGE in Vietnam, www.edgebuildings.com/certify/vietnam/.
Insurance Council of Australia (2018), Building Resilience, www.resilient.property.
International Passive House Association (2018), On the Road to Passive House Buildings in Mexico, https://blog.passivehouse‐international.org/passive‐house‐buildings‐mexico/.
2018 Global Status Report
Towards a zero‐emission, efficient and resilient buildings and construction sector
Page | 66
ISO (International Organization for Standardization) (2017), ISO 52000‐1:2017 Energy Performance of Buildings, www.iso.org/standard/65601.html.
IWBI (International Well Building Institute) (2018), WELL Building Standard, www.wellcertified.com.
Iyer‐Raniga, U. et al. (n.d.), Circularity in the Built Environment, International Business, Trade and Environmental Sustainability: International Business as a Positive Driver of Environmental Sustainability, Filho W.L. and P.R.B. de Brito (eds.), Springer World Sustainability Series.
KfW (2018), Promotional Year 2017: KfW Scales Back Financing Volume Slightly as Planned, www.kfw.de/KfW‐Group/Newsroom/Latest‐News/Press‐Releases/Pressemitteilungen‐Details_455488.html.
Le Programme Bâtiments (2018), The Buildings Programme, www.leprogrammebatiments.ch/fr/.
Lehne, J. and F. Preston (2018), Making Concrete Change, Innovation in Low‐carbon Cement and Concrete, The Royal Institute of International Affairs, Chatham House Report Series, www.chathamhouse.org/sites/default/files/publications/research/2018‐06‐13‐making‐concrete‐change‐cement‐lehne‐preston.pdf.
Lux Review (2018), LED Breakthrough Promises Ultra Efficient Luminaires, http://luxreview.com/article/2018/01/led‐breakthrough‐promises‐ultra‐efficient‐luminaires.
MacNaughton, P. et al. (2018), “Energy savings, emission reductions, and health co‐benefits of the green building movement”, Journal of Exposure Science & Environmental Epidemiology, Vol. 28, pp. 307‐318, https://doi.org/10.1038/s41370‐017‐0014‐9.
Medium (2018), The Global Resilience Prospectus, Da Nang, Vietnam, https://medium.com/the‐global‐resilience‐prospectus/da‐nang‐vietnam‐b4b959a3a03d.
Minergie (2018), MINERGIE Standard, www.minergie.ch.
Mission Innovation (2017), Coordinating Creativity: How International Collaboration is Turning up the Dial on Heating & Cooling Innovation, http://mission‐innovation.net/2017/12/15/coordinating‐creativity‐how‐international‐collaboration‐is‐turning‐up‐the‐dial‐on‐heating‐cooling‐innovation/.
MLIT (Ministry of Land, Infrastructure, Transport and Tourism, Japan) (2018a), Overview of the Act on the Improvement of Energy Consumption Performance of Buildings, www.mlit.go.jp/jutakukentiku/jutakukentiku_house_tk4_000103.html [English version: www.mlit.go.jp/common/001134876.pdf].
MLIT (2018b), Act on Promotion of Quality Assurance of Housing, www.mlit.go.jp/jutakukentiku/house/jutakukentiku_house_tk4_000016.html.
Monroe County (2018), Flood Management Building Requirements, www.monroecounty‐fl.gov/692/Building‐Requirements.
NAMA database (Nationally Appropriate Mitigation Actions) (2018), “Cement NAMA in Peru”, website, www.nama‐database.org/index.php/Cement_NAMA_in_Peru.
NAMA Facility (2018), Implementation of the New Housing NAMA Mexico, http://nama‐facility.org/projects/implementation‐of‐the‐new‐housing‐nama‐mexico/.
National Bureau of Statistics of China (2018), National Real Estate Development and Sales in 2017, www.stats.gov.cn/english/pressrelease/201801/t20180126_1577671.html.
New York Times (2018), How Much Warmer Was Your City in 2017, www.nytimes.com/interactive/2018/01/21/world/year‐in‐weather.html#pkb.
2018 Global Status Report Towards a zero‐emission, efficient and resilient buildings and construction sector
Page | 67
Newsham, G. J.A. Veitch and Y. (V.) Hu (2018), “Effect of green building certification on organizational productivity metrics”, Building Research & Information, Vol. 46(7), pp. 755‐766, https://10.1080/09613218.2017.1358032.
NOAA (National Oceanic and Atmospheric Administration (2018), Global Climate Report – August 2018, www.ncdc.noaa.gov/sotc/global/.
NRCAN (Natural Resources Canada) (2018a), ENERGY STAR Certification for Commercial and Institutional Buildings in Canada, www.nrcan.gc.ca/energy/efficiency/buildings/energy‐benchmarking/building/20258.
NRCAN (2018b), ISO 50001 Energy Management Systems Standard, www.nrcan.gc.ca/energy/efficiency/industry/energy‐management/20405.
NRCAN (2018c), ENERGY STAR® Certified Homes, www.nrcan.gc.ca/energy/efficiency/housing/new‐homes/5057.
NRCAN (2018d), Build Smart Canada’s Buildings Strategy, www.nrcan.gc.ca/sites/www.nrcan.gc.ca/files/emmc/pdf/Building_Smart_en.pdf.
NRCC (National Research Council Canada) (2018), National Energy Code of Canada for Buildings 2017, www.nrc‐cnrc.gc.ca/eng/publications/codes_centre/2017_national_energy_code_buildings.html.
NRDC (Natural Resources Defense Council) (2018), Revolution Now, the Future is Here for Clean Energy Technology, www.nrdc.org/sites/default/files/revolution‐now‐clean‐energy‐technology‐fs.pdf.
NYC (City of New York) (2018), 2018 Energy Code Revision Handbook, www1.nyc.gov/assets/buildings/pdf/energy_code_revision_handbook_2018.pdf.
NYSERDA (New York State Energy Research and Development Authority) (2018), New York Stretch Code, www.nyserda.ny.gov/‐/media/Files/Programs/energy‐code‐training/Draft‐NYStretch‐Code‐Energy‐2018.pdf.
OID (Observatoire de l’immobilier durable) (2017), Confort et bien‐être dans les immeubles de bureaux, www.o‐immobilierdurable.fr/hc_ressources/publication‐confort‐bien‐etre‐immeubles‐de‐bureaux/.
OID and PwC (2017), Démarches ESG‐Climat des gérants immobiliers, www.o‐immobilierdurable.fr/hc_ressources/publication‐guide‐dapplication‐de‐larticle‐173‐vi/.
One Planet Network (2018), One Planet Network website, www.oneplanetnetwork.org (accessed August 2018).
PACENation (2018), PACE Market Data, http://pacenation.us/pace‐market‐data/.
Passipedia (The Passive House Resource) (2018), Examples, https://passipedia.org/examples.
Passive House Database (2018), Renovated Office in Saint Etienne, https://passivhausprojekte.de/index.php#d_2720.
République Française (2018a), Insulation Obligation, www.rt‐batiment.fr/batiments‐existants/obligation‐disolation/obligation‐disolation‐en‐cas‐de‐travaux‐importants.html.
République Française (2018b), Financial Aid for Energy Renovation, www.ecologique‐solidaire.gouv.fr/aides‐financieres‐renovation‐energetique.
République Française (2018c), Réglementation Thermique 2012, www.rt‐batiment.fr/batiments‐neufs/reglementation‐thermique‐2012/presentation.html.
2018 Global Status Report
Towards a zero‐emission, efficient and resilient buildings and construction sector
Page | 68
RICS (Royal Institution of Chartered Surveyors) (2017), Whole Life Carbon Assessment for the Built Environment, www.rics.org/fr/news‐insight/latest‐news/press‐releases/new‐rics‐standard‐on‐whole‐life‐carbon‐supports‐global‐climate‐aims/.
SEAI (Sustainable Energy Authority of Ireland) (2018), Deep Energy Retrofit Programme, www.seai.ie/grants/home‐grants/deep‐retrofit‐programme/.
Selkowitz, S. (2014), Single Pane Windows: Dinosaurs in a Sustainable World?, Lawrence Berkeley National Laboratory, Berkeley, https://arpa‐e.energy.gov/sites/default/files/03%20‐%20Selkowitz%20‐%20ARPA%20E_selk_final.pdf.
SFOE (Swiss Federal Office of Energy) (2018), What is the Energy Strategy 2050?, www.bfe.admin.ch/energiestrategie2050/06445/index.html?lang=en.
SITRA, European Climate Foundation, Climate‐KIC, Energy Transitions Commission, Ellen MacArthur Foundation, MAVA and ClimateWorks Foundation (2018), Material Economics: The Circular Economy: A Powerful Force for Climate Mitigation, Transformative Innovation for Prosperous and Low‐carbon Industry, www.materialeconomics.com/latest‐updates/the‐circular‐economy.
SMU (Singapore Management University) (2018), SMU Expands City Campus Footprint with new Sustainable Development Named Tahir Foundation Connexion, www.smu.edu.sg/sites/default/files/smu/news_room/Press%20release_SMU%20expands%20city%20campus%20footprint%20with%20Tahir%20Foundation%20Connexion.pdf.
Stadtwerke Wolfhagen (2018), Energy Transition, www.stadtwerke‐wolfhagen.de/index.php/energiewende.
Swiss RE Institute (2018), Natural Catastrophes and Man‐made Disasters in 2017, http://institute.swissre.com/research/library/natural_catastrophes_2017.html.
Swissinfo (2018), 2000 Watt Society: When the Future Becomes a Reality, www.swissinfo.ch/eng/politics/energy‐efficiency_2000‐watt‐society‐when‐the‐future‐becomes‐a‐reality/41958718.
TCFD (Task Force on Climate‐related Financial Disclosures) (2017), Final Report: Recommendations of the Task Force on Climate‐related Financial Disclosures (June 2017), www.fsb‐tcfd.org/publications/final‐recommendations‐report.
techUK (2017), State of the Connected Home Report – Device Ownership, www.techuk.org/connected‐home/device_ownership.
Tokyo Metropolitan Government (2018), Tokyo Carbon Reporting Program for SMFs, www.kankyo.metro.tokyo.jp/en/climate/tokyo_carbon.html.
Tokyo Metropolitan Government (2005), Guidelines for Heat Island Control Measures, www.kankyo.metro.tokyo.jp/en/about_us/videos_documents/documents_1.files/heat_island.pdf.
UCLA (University of California, Los Angeles) (2018), About the LA Energy Atlas, www.energyatlas.ucla.edu/about/overview.
UN Environment and GlobalABC (Global Alliance for Buildings and Construction) (2016), Global Roadmap: Towards Low‐GHG and Resilient Buildings, https://globalabc.org/uploads/media/default/0001/01/0d6a71a346ea7e6841b1b29c77eba6d6ae986103.pdf.
2018 Global Status Report Towards a zero‐emission, efficient and resilient buildings and construction sector
Page | 69
UNISDR (United Nations Office for Disaster Risk Reduction) (2018), Technical Guidance for Monitoring and Reporting on Progress in Achieving the Global Targets of the Sendai Framework for Disaster Risk Reduction, www.preventionweb.net/publications/view/54970.
Viet Nam (2018), Full Text of National Technical Regulation QCVN 09: 2017 / BXD on Energy Efficient Buildings, https://vanbanphapluat.co/qcvn‐09‐2017‐bxd‐cong‐trinh‐xay‐dung‐su‐dung‐nang‐luong‐hieu‐qua.
WBCSD (World Business Council for Sustainable Development) (2018), Factor 10, www.wbcsd.org/Programs/Energy‐Circular‐Economy/Factor‐10.
WHO (World Health Organization) (2018), Household Air Pollution and Health, www.who.int/news‐room/fact‐sheets/detail/household‐air‐pollution‐and‐health.
WorldGBC (World Green Building Council) (2018a), WorldGBC Snapshots Detail Net Aero Carbon Standards Developed by Green Building Councils, www.worldgbc.org/news‐media/new‐worldgbc‐snapshots‐detail‐net‐zero‐carbon‐standards‐developed‐green‐building‐councils.
WorldGBC (2018b), Net Zero Carbon Buildings Commitment Launched at the Global Climate Action Summit, www.worldgbc.org/news‐media/WorldGBC‐Launches‐Net‐Zero‐Carbon‐Buildings‐Commitment.
Zero Code (2018), ZERO Code website, www.zero‐code.org (accessed August 2018).
2018 Global Status Report Towards a zero‐emission, efficient and resilient buildings and construction sector
Page | 70
Acronyms, abbreviations and units of measure
Acronyms and abbreviations
AC air conditioning
ADEME Agence de l’Environnement et de la Maitrise de l’Energie (French Environment & Energy Management Agency)
BEEP Building Energy Efficiency Project
BREEAM Building Research Establishment Environmental Assessment Method
CHF Swiss franc
CO2 carbon dioxide
COP Conference of the Parties
EPBD Energy Performance of Buildings Directive
EPC energy performance certificate
EU European Union
EUR euro
GHG greenhouse gas
GlobalABC Global Alliance for Buildings and Construction
HQE Haute Qualité Environnementale
ICT information and communication technology
IEA International Energy Agency
IFC International Finance Corporation
INR Indian rupee
ISO International Organization for Standardization
LCA life‐cycle analysis
LED light‐emitting diode
LEED Leadership in Energy and Environmental Design
MEPS minimum energy performance standards
NAMA nationally appropriate mitigation action
NDC nationally determined contribution
PACE Property Assessed Clean Energy
PEEB Programme for Energy Efficiency in Buildings
PV photovoltaic
R&D research and development
SBTi Science Based Targets initiative
SDG Sustainable Development Goal
2018 Global Status ReportTowards a zero‐emission, efficient and resilient buildings and construction sector
Page | 71
SEER seasonal energy efficiency ratio
UNFCCC United Nations Framework Convention on Climate Change
USD United States dollar
VAT value‐added tax
Units of measure
°C degree Celsius
EJ exajoule
GtCO2 gigatonne of carbon dioxide
kg/m2 kilogramme per square metre
kWh kilowatt hour
kWh/m2 kilowatt hour per square metre
lm/W lumen per watt
m2 square metre
tCO2 tonne of carbon dioxide
TWh terawatt hour
W watt
Photo credits
Pages 12, 16, 19, 27, 32, 42, 55, 58 Shutterstock
Page 25 UN Environment
Pages 30, 32 (right) John Dulac