Embed Size (px)
Citation preview

2018Green Bond ReportREPSOL Group
Contents
Page 2 1. Introduction
Page 3 2. Repsol Green Bond Framework Sumary
Page 4 3. Allocation of the proceeds
Page 5 4. Avoided GHG emissions
Page 6 5. Case studies
Page 7 6. Total amount invested and GHG emissions avoided 2014-2018
Page 8 7. ESG Performance indicators
Page 9 8. Methodology notes
Green Bond Report 2018
2
1. Introduction Repsol, as signatory of the Paris Pledge for Action, supports the Paris Agreement and is working to ensure that is an active part of the solution to climate change.
With the issuance of this Green Bond in May 2017, Repsol reinforces its commitment with Sustainability demonstrating its investment in sustainable purposes. On May 9th, Repsol announced its inaugural Green Bond offering having previously made available to the investors a NetRoadshow presentation and links to the Company’s Green Bond Framework and Second Party Opinion, provided by Vigeo1. In addition, during the day one-on-ones and group calls were held with investors. The deal was announced to the market with Initial Price Talks of MS+55bp area. At the time of Guidance announcement, the spread was revised to MS+40bp as the orderbook reached €2.7 billion, which represents an oversubscription of five times the amount offered. Given the strong demand and continued growth of the orderbook, the deal was revised further to MS+35bp. Repsol finally issued €500 million in a 5-year deal and the coupon was set at 0.500%. Circa 45% of the bonds were allocated to investors with Environmental, Social and Governance (ESG) mandates.
1. ESG Analyst
Repsol works to provide accessible, efficient and safe energy to meet growing energy demand without compromising future generations. In Repsol’s strategy there are clear energy efficiency and climate change objectives that supports the global goals that have to be pursued; the mitigation of climate change and the access to affordable energy in order to support economic growth and development.
Moreover, Repsol supports the 2030 Agenda for Sustainable Development of the United Nations and uses the 17 Sustainable Development Goals (SDGs) as a reference when defining its Sustainability priorities. The Company has prioritized seven SDGs to which Repsol can contribute most, highlighting in this document the actions related to two of them that are key for an energy company: SDG 7, Affordable and clean energy and SDG 13, Climate action.
Society increasingly requires more energy as the population grows and economies develop. This energy must be supplied in a safe, efficient and sustainable manner, along with a reduction in Greenhouse Gas (GHG) emissions. At Repsol, we share society’s concerns over the effects that human activity is having on climate. We recognize that the current trend of GHG emissions is greater than the required to limit the increase of the average global temperature to no more than 2°C above preindustrial levels.
Introduction | Green Bond Report 2018
Repsol is committed to accessible, affordable and low-carbon energy.
3
2. Repsol Green Bond Framework Sumary
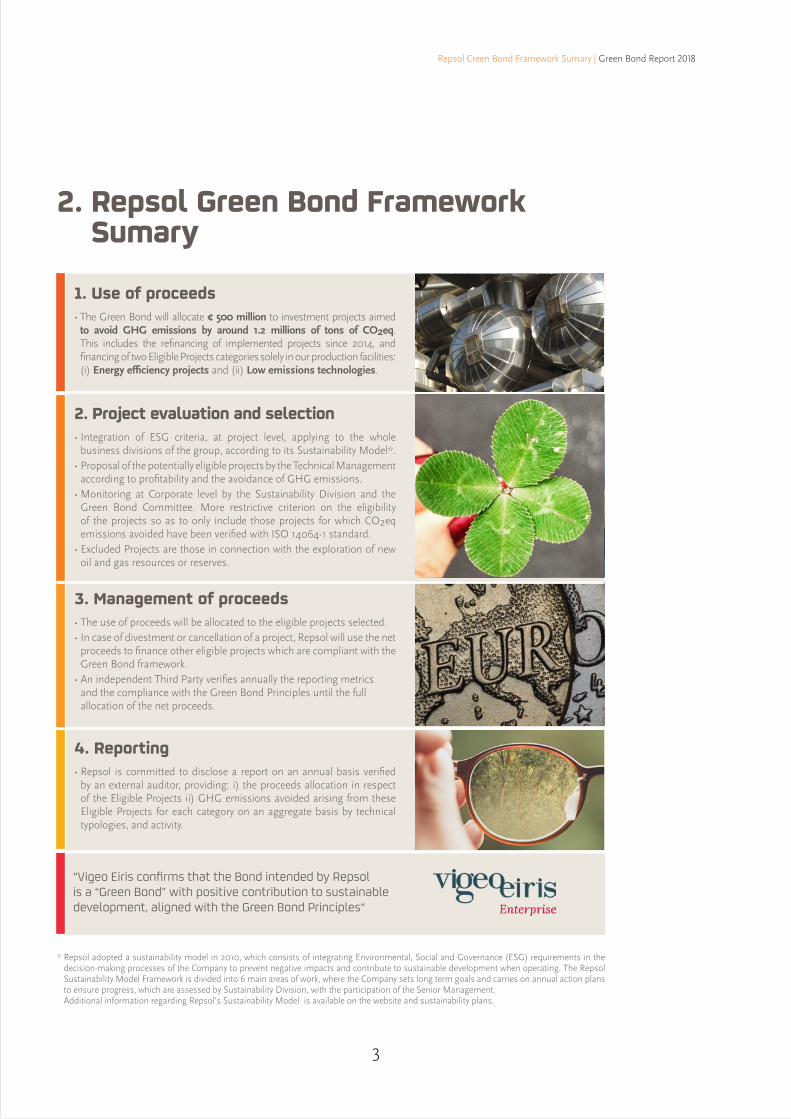
• The Green Bond will allocate € 500 million to investment projects aimed to avoid GHG emissions by around 1.2 millions of tons of CO2eq. This includes the refinancing of implemented projects since 2014, and financing of two Eligible Projects categories solely in our production facilities: (i) Energy efficiency projects and (ii) Low emissions technologies.
1. Use of proceeds
• The use of proceeds will be allocated to the eligible projects selected.• In case of divestment or cancellation of a project, Repsol will use the net
proceeds to finance other eligible projects which are compliant with the Green Bond framework.
• An independent Third Party verifies annually the reporting metrics and the compliance with the Green Bond Principles until the full allocation of the net proceeds.
3. Management of proceeds
• Repsol is committed to disclose a report on an annual basis verified by an external auditor, providing: i) the proceeds allocation in respect of the Eligible Projects ii) GHG emissions avoided arising from these Eligible Projects for each category on an aggregate basis by technical typologies, and activity.
4. Reporting
• Integration of ESG criteria, at project level, applying to the whole business divisions of the group, according to its Sustainability Model*.
• Proposal of the potentially eligible projects by the Technical Management according to profitability and the avoidance of GHG emissions.
• Monitoring at Corporate level by the Sustainability Division and the Green Bond Committee. More restrictive criterion on the eligibility of the projects so as to only include those projects for which CO2eq emissions avoided have been verified with ISO 14064-1 standard.
• Excluded Projects are those in connection with the exploration of new oil and gas resources or reserves.
2. Project evaluation and selection
“Vigeo Eiris confirms that the Bond intended by Repsol is a “Green Bond” with positive contribution to sustainable development, aligned with the Green Bond Principles“
* Repsol adopted a sustainability model in 2010, which consists of integrating Environmental, Social and Governance (ESG) requirements in the decision-making processes of the Company to prevent negative impacts and contribute to sustainable development when operating. The Repsol Sustainability Model Framework is divided into 6 main areas of work, where the Company sets long term goals and carries on annual action plans to ensure progress, which are assessed by Sustainability Division, with the participation of the Senior Management.
Additional information regarding Repsol’s Sustainability Model is available on the website and sustainability plans.
Repsol Creen Bond Framework Sumary | Green Bond Report 2018
4
Allocations of the proceeds | Green Bond Report 2018
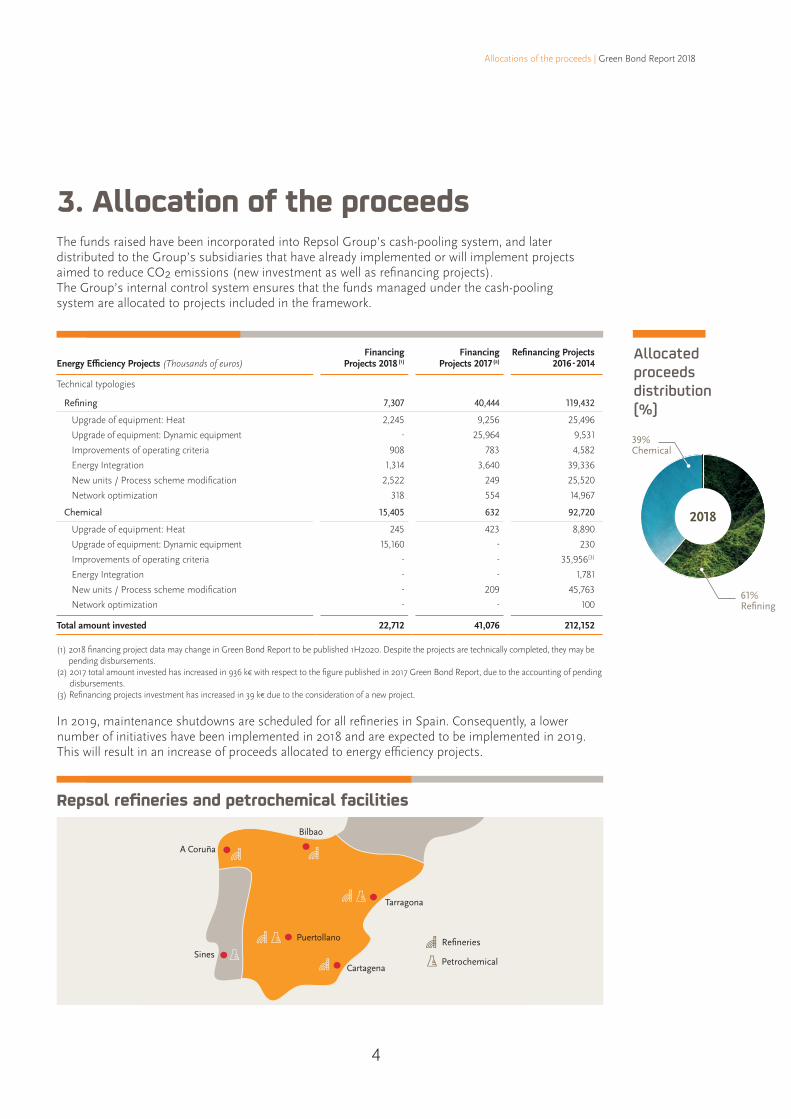
3. Allocation of the proceedsThe funds raised have been incorporated into Repsol Group’s cash-pooling system, and later distributed to the Group’s subsidiaries that have already implemented or will implement projects aimed to reduce CO2 emissions (new investment as well as refinancing projects). The Group’s internal control system ensures that the funds managed under the cash-pooling system are allocated to projects included in the framework.
Energy Efficiency Projects (Thousands of euros)Financing
Projects 2018 (1)Financing
Projects 2017 (2)Refinancing Projects
2016 - 2014
Technical typologies
Refining 7,307 40,444 119,432
Upgrade of equipment: Heat 2,245 9,256 25,496
Upgrade of equipment: Dynamic equipment - 25,964 9,531
Improvements of operating criteria 908 783 4,582
Energy Integration 1,314 3,640 39,336
New units / Process scheme modification 2,522 249 25,520
Network optimization 318 554 14,967
Chemical 15,405 632 92,720
Upgrade of equipment: Heat 245 423 8,890
Upgrade of equipment: Dynamic equipment 15,160 - 230
Improvements of operating criteria - - 35,956(3)
Energy Integration - - 1,781
New units / Process scheme modification - 209 45,763
Network optimization - - 100
Total amount invested 22,712 41,076 212,152
(1) 2018 financing project data may change in Green Bond Report to be published 1H2020. Despite the projects are technically completed, they may be pending disbursements.
(2) 2017 total amount invested has increased in 936 k€ with respect to the figure published in 2017 Green Bond Report, due to the accounting of pending disbursements.
(3) Refinancing projects investment has increased in 39 k€ due to the consideration of a new project.
Allocated proceeds distribution (%)
2018
39%Chemical
39%Chemical
61%Refining
61%Refining
Punto 3.
Punto 4.
2018
Punto 4.
2018
2018
26%Chemical
74%Refining
26%Chemical
74%Refining
Refineries
Petrochemical
Tarragona
Puertollano
Cartagena
Bilbao
A Coruña
Sines
Repsol refineries and petrochemical facilities
In 2019, maintenance shutdowns are scheduled for all refineries in Spain. Consequently, a lower number of initiatives have been implemented in 2018 and are expected to be implemented in 2019. This will result in an increase of proceeds allocated to energy efficiency projects.
5
Avoided GHG emissions | Green Bond Report 2018
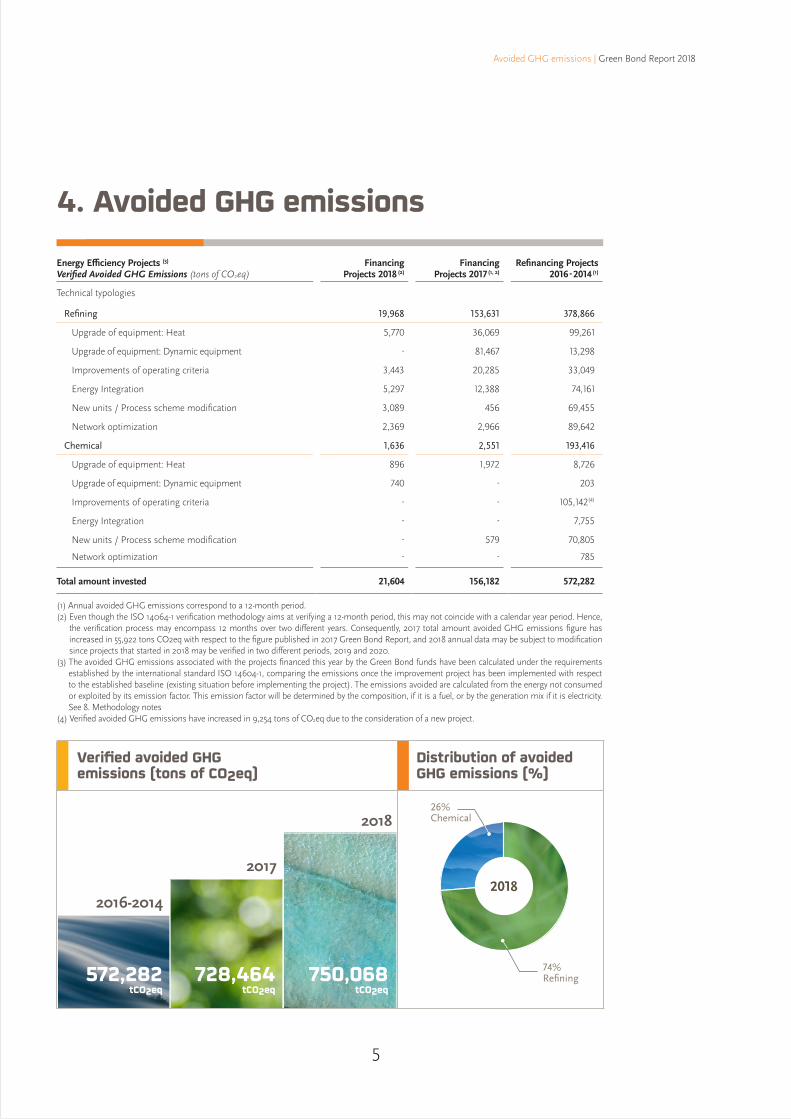
4. Avoided GHG emissions
Energy Efficiency Projects (3) Verified Avoided GHG Emissions (tons of CO2eq)
Financing Projects 2018 (2)
Financing Projects 2017 (1, 2)
Refinancing Projects 2016 - 2014 (1)
Technical typologies
Refining 19,968 153,631 378,866
Upgrade of equipment: Heat 5,770 36,069 99,261
Upgrade of equipment: Dynamic equipment - 81,467 13,298
Improvements of operating criteria 3,443 20,285 33,049
Energy Integration 5,297 12,388 74,161
New units / Process scheme modification 3,089 456 69,455
Network optimization 2,369 2,966 89,642
Chemical 1,636 2,551 193,416
Upgrade of equipment: Heat 896 1,972 8,726
Upgrade of equipment: Dynamic equipment 740 - 203
Improvements of operating criteria - - 105,142(4)
Energy Integration - - 7,755
New units / Process scheme modification - 579 70,805
Network optimization - - 785
Total amount invested 21,604 156,182 572,282
(1) Annual avoided GHG emissions correspond to a 12-month period. (2) Even though the ISO 14064-1 verification methodology aims at verifying a 12-month period, this may not coincide with a calendar year period. Hence,
the verification process may encompass 12 months over two different years. Consequently, 2017 total amount avoided GHG emissions figure has increased in 55,922 tons CO2eq with respect to the figure published in 2017 Green Bond Report, and 2018 annual data may be subject to modification since projects that started in 2018 may be verified in two different periods, 2019 and 2020.
(3) The avoided GHG emissions associated with the projects financed this year by the Green Bond funds have been calculated under the requirements established by the international standard ISO 14604-1, comparing the emissions once the improvement project has been implemented with respect to the established baseline (existing situation before implementing the project). The emissions avoided are calculated from the energy not consumed or exploited by its emission factor. This emission factor will be determined by the composition, if it is a fuel, or by the generation mix if it is electricity. See 8. Methodology notes
(4) Verified avoided GHG emissions have increased in 9,254 tons of CO2eq due to the consideration of a new project.
Verified avoided GHG emissions (tons of CO2eq)
2016-2014
2017
2018
750,068 tCO2eq
728,464 tCO2eq
572,282 tCO2eq
2018
39%Chemical
39%Chemical
61%Refining
61%Refining
Punto 3.
Punto 4.
2018
Punto 4.
2018
2018
26%Chemical
74%Refining
26%Chemical
74%Refining
Distribution of avoided GHG emissions (%)
6
Case studies | Green Bond Report 2018
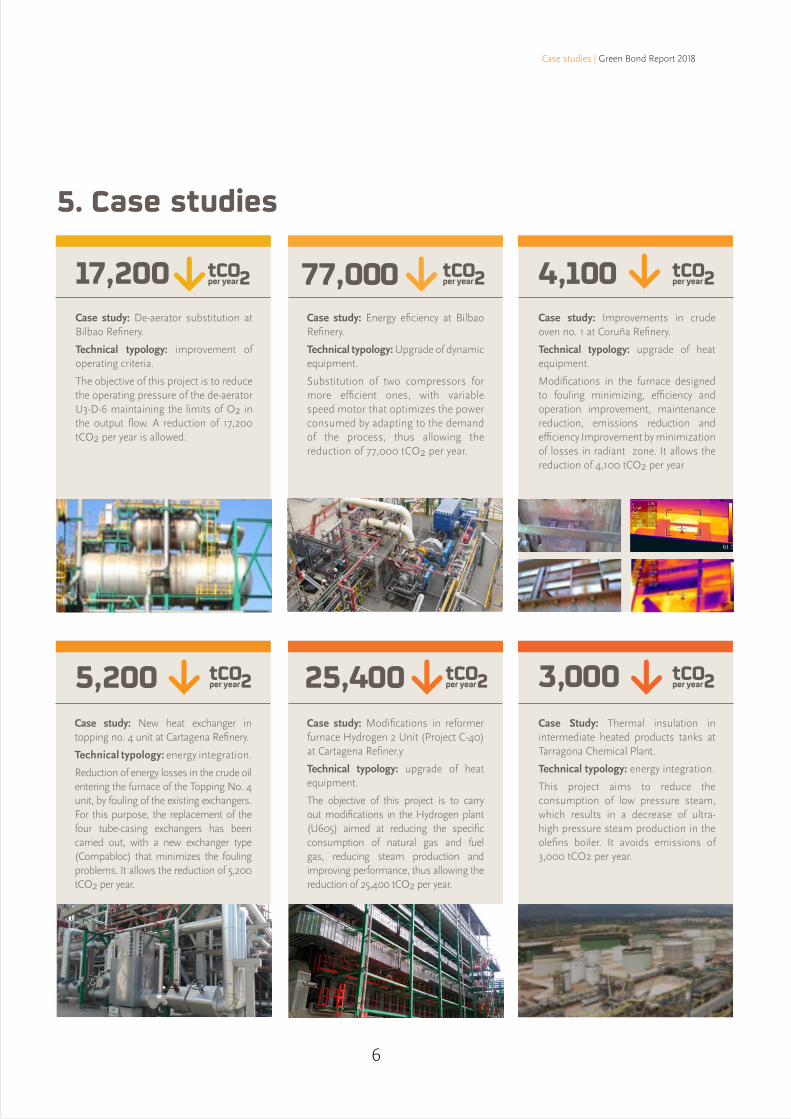
5. Case studies
Case study: De-aerator substitution at Bilbao Refinery.
Technical typology: improvement of operating criteria.
The objective of this project is to reduce the operating pressure of the de-aerator U3-D-6 maintaining the limits of O2 in the output flow. A reduction of 17,200 tCO2 per year is allowed.
Case study: Improvements in crude oven no. 1 at Coruña Refinery.
Technical typology: upgrade of heat equipment.
Modifications in the furnace designed to fouling minimizing, efficiency and operation improvement, maintenance reduction, emissions reduction and efficiency Improvement by minimization of losses in radiant zone. It allows the reduction of 4,100 tCO2 per year
Case study: Modifications in reformer furnace Hydrogen 2 Unit (Project C-40) at Cartagena Refiner.y
Technical typology: upgrade of heat equipment.
The objective of this project is to carry out modifications in the Hydrogen plant (U605) aimed at reducing the specific consumption of natural gas and fuel gas, reducing steam production and improving performance, thus allowing the reduction of 25,400 tCO2 per year.
Case study: New heat exchanger in topping no. 4 unit at Cartagena Refinery.
Technical typology: energy integration.
Reduction of energy losses in the crude oil entering the furnace of the Topping No. 4 unit, by fouling of the existing exchangers. For this purpose, the replacement of the four tube-casing exchangers has been carried out, with a new exchanger type (Compabloc) that minimizes the fouling problems. It allows the reduction of 5,200 tCO2 per year.
Case Study: Thermal insulation in intermediate heated products tanks at Tarragona Chemical Plant.
Technical typology: energy integration.
This project aims to reduce the consumption of low pressure steam, which results in a decrease of ultra-high pressure steam production in the olefins boiler. It avoids emissions of 3,000 tCO2 per year.
Case study: Energy eficiency at Bilbao Refinery.
Technical typology: Upgrade of dynamic equipment.
Substitution of two compressors for more efficient ones, with variable speed motor that optimizes the power consumed by adapting to the demand of the process, thus allowing the reduction of 77,000 tCO2 per year.
5,200 25,400 3,000tCO2per yeartCO2per year
tCO2per year
17,200 77,000 4,100tCO2per yeartCO2per year
tCO2per year
7
Total amount invested and GHG emissiones avoid 2014-2017 | Green Bond Report 2018
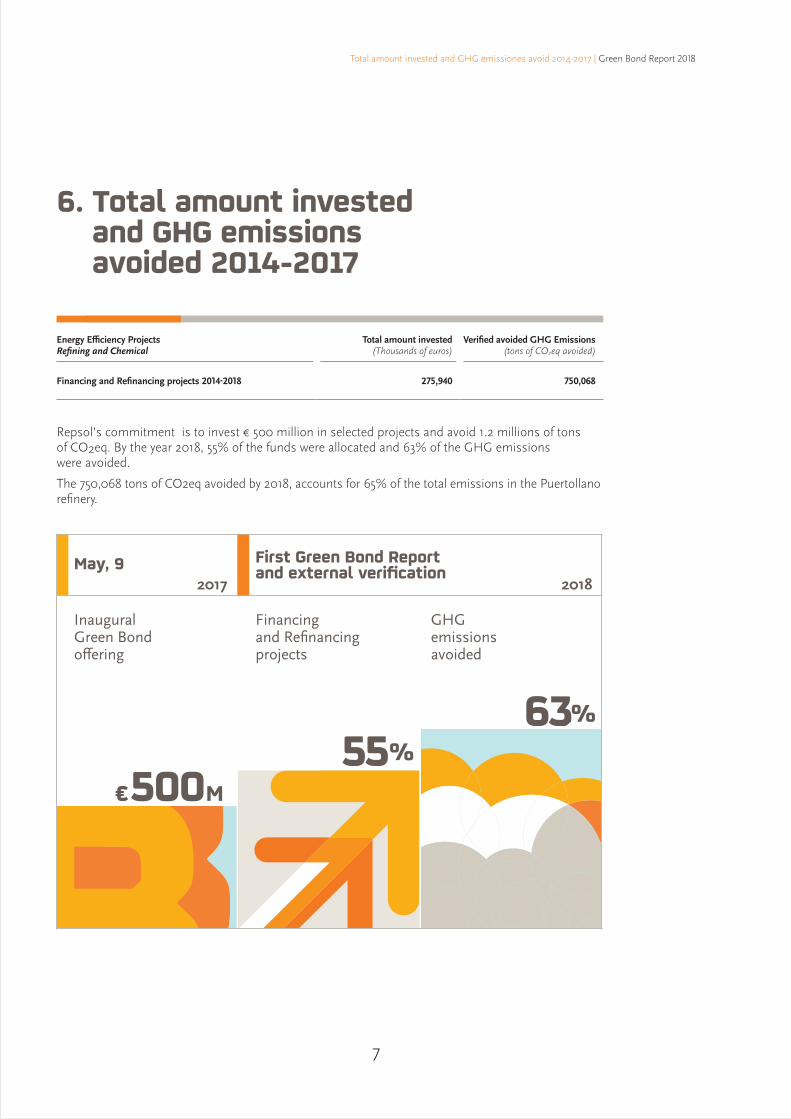
6. Total amount invested and GHG emissions avoided 2014-2017
Energy Efficiency Projects Refining and Chemical
Total amount invested (Thousands of euros)
Verified avoided GHG Emissions (tons of CO2eq avoided)
Financing and Refinancing projects 2014-2018 275,940 750,068
Repsol’s commitment is to invest € 500 million in selected projects and avoid 1.2 millions of tons of CO2eq. By the year 2018, 55% of the funds were allocated and 63% of the GHG emissions were avoided.
The 750,068 tons of CO2eq avoided by 2018, accounts for 65% of the total emissions in the Puertollano refinery.
Financing and Refinancing projects
Inaugural Green Bond offering
May, 9
GHG emissions avoided
First Green Bond Report and external verification
55% 55%€ 500M
%63
20182017

No controversies arose 2018 in Spain and Portugal facilities
ESG performance indicators | Green Bond Report 2018
7. ESG performance indicatorsAll ESG information is reported annually in the Management Report of Repsol, in accordance with the Global Reporting Initiative (GRI) Standard Guidelines, using the “comprehensive” option. This information is approved by the Board of Directors of Repsol and verified by an external auditor. The following table summarizes the key ESG Indicators for Refining and Chemical facilities in Spain and Portugal.
Energy Efficiency Projects (Refining and Chemical segment-Spain and Portugal) 2018 2017
Social Indicators
Labor managementTotal employees (% women(1)) 6,664 (19.9%) 6,751 (18.7%)New employees (% women) 298 (29.5%) 250 (27.2%)% women in leadership positions 24% 22%Employee turnover rate (%)(2) 10% 3.1%No. of employees with disabilities 124 136
Occupational healthOccupational disease rate 0% 0%
Training and developmentHours of training per employee(3) 81 51% of employees receiving training(4) 75% 77%
Community dialogue and managementVoluntary Social Investments (€ thousand) 2,021 2,133
Personal and process safetyLost Time Injury Frequency (LTIF)(5) 1.17 0.99Total Recordable Incident Rate (TRIR)(6) 1.94 1.86No. of Fatalities 2 0PSIR (TIER1+TIER2)(7) 0.42 0.50
Environmental Indicators
Spill prevention and managementNo. of spills (>1bbl) (t) 31.45 5.28
Energy and carbon managementEnergy intensity in Refining (GJ/t processed crude oil) 2.66 2.90Intensity of GHG emissions in Refining (tCO2e/t processed crude oil) 0.194 0.197Direct emission of CO2 (million tons) 11.80 11.47Direct emission of CH4 (million tons) 0.002 0.003Direct emission of N2O (thousand tons) 0.092 0.623Direct emission of CO2e (million tons) 11.87 11.73
Water managementFresh water withdrawn (kilotons) 45,215 46,933Recycled water (kilotons) 16,649 14,445Water discharged (kilotons) 25,946 24,047Hydrocarbons discharged in water (tons) 49 60
Waste managementHazardous waste (metric tons) 26,807 19,843Non-hazardous waste (metric tons) 66,643 56,239
Air quality – Pollution controlTons SO2 / thousands of tons of oil processed tons (Refining) 0.547 0.499NOX (tons) 9,512 14,151COVNM (tons) 12,286 16,350
(1) Gender indicators are calculated including employees managed with effective time of employment of 20%.(2) Corresponds to the total turnover rate of permanent and temporary employees out of the total number of employees at year-end. Change over
the criterion of year 2017, in which only permanent employees were considered.(3) Calculated as total number of hours of the year divided by total managed workforce.(4) Extension rate calculated over the cumulative average of the managed workforce, taken to one.(5) LTIF: Number of fatalities plus lost time injuries accumulated within the period for every 1,000,000 hours worked.(6) TRIR: Total number of injuries (fatalities, lost time injuries, medical treatment and restricted work) accumulated within the period per million
hours worked.(7) PSIR (Process Safety Incident Rate): A process safety accident is one in which the first line of control has been breached, with the following happening
simultaneously: i) A chemical product or process is involved ii) It occurs at a specific location: the incident takes place at a production, distribution, or storage facility, at an auxiliary services facility (utilities) or pilot plant related to the chemical process or product involved and iii) It gives rise to an unplanned or uncontrolled release of material, including non-toxic and non-flammable matter (e.g. vapor, hot water, nitrogen, compressed air or CO2), with certain levels of consequence The process safety accident will be classified as Tier 1 or Tier 2 according to the defined thresholds.
8
Methodology notes | Green Bond Report 2018
8. Methodology notesRepsol publishes this report on an annual basis reporting on:a) Total amount of Green Bond proceeds allocated to Eligible Projectsb) The proceeds allocation in respect of the Eligible Projects for each category on an aggregate basis by
technical typologies, year of implementation; project stage; share of refinancing and financing proceedsc) The ex-ante estimates / real of GHG emissions avoided arising from these Eligible Projects for each
category on an aggregate basis by technical typologies, and activity (refining and chemicals facilities).
Both GHG inventories and targeted actions to reduce GHG emissions are verified by a third party according to ISO 14064-1 methodology. Accordingly, the avoided GHG emissions associated with the projects financed this year by the Green Bond funds, have been calculated under the requirements established by the above mentioned standard, thus following the same methodology which implies estimating energy consumption and associated emissions reduction using emission factors, heating values, etc., comparing the emissions once the improvement project has been implemented with respect to the established baseline (existing situation before implementing the project). The whole organization finds reduction opportunities in order to reduce the energy consumption in the different industrial processes. For example, by reducing the fuel consumption in furnaces or boilers, by adjusting optimum O2 concentration in the combustion mix, by implementing high efficiency pumps, by replacing condensation steam turbines, by power motors, by reducing routine flaring by sending the fuel gases to a power generator, by reducing methane venting or leaks, etc. All of those opportunities are described in the framework as different categories. When the organization finds out an opportunity, process engineers quantify the energy savings compared with the reference. For example, if it comes to a reduction opportunity in a furnace or a boiler fuel consumption reduction is quantified (t of fuel oil, Nm3 of Natural Gas, etc.). The energy from this volume or mass is calculated using its Low Calorific Value (GJ per t, GJ per Nm3, etc.) that is something well know if it is a commercial fuel or it is determined if it is not a commercial one (for example, a refinery fuel gas). When the amount of energy saved is quantified, the emissions avoided are calculated using its emission factor; this emission factor is determined by the composition if it is a fuel or by the generation mix if it is electricity. Once again, this emission factor is well known from commercial fuels or power mix or is determined if it is not a commercial one.Calculations have been done for the time period of 1st January to 31st December 2018. To the extent available, the reporting is based on real data reported by the projects.
9

Division of Investor Relations: Speak to us by calling +34 91 753 55 48, or alternatively, you can send us an email to [email protected]
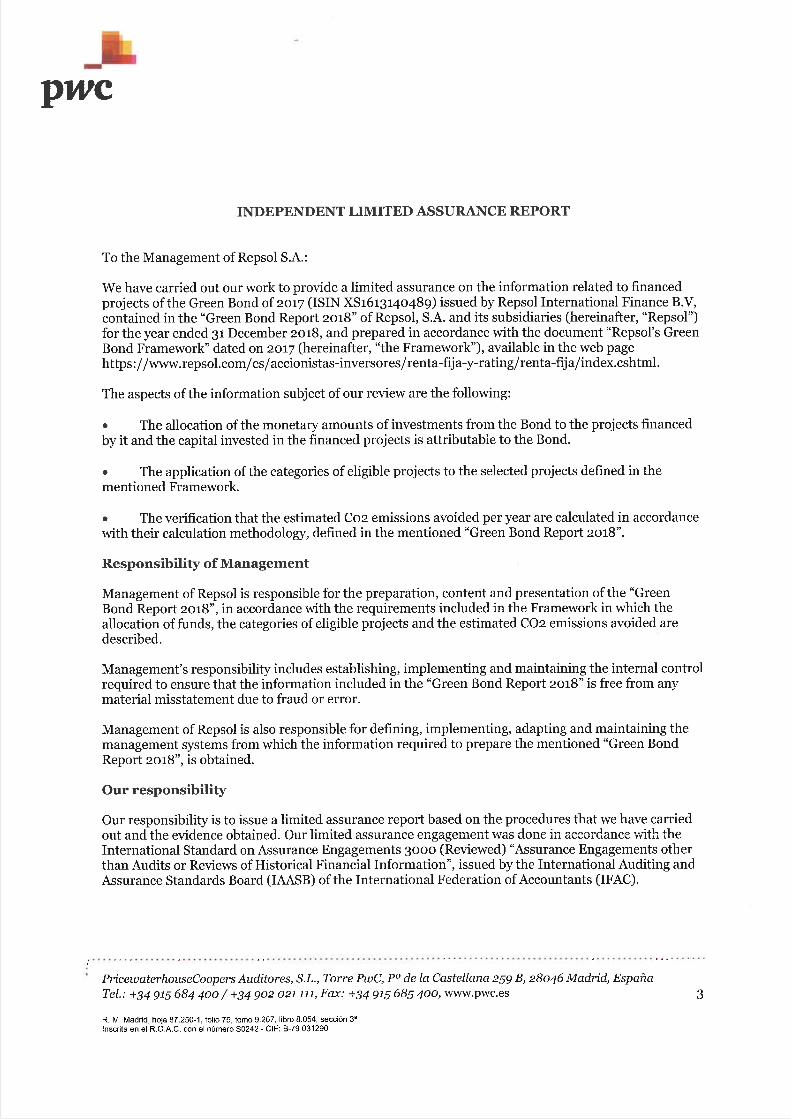
Independent Assurance Report on the “Green Bond Report 2018”
13