Embed Size (px)
Citation preview
Savings and RetirementEQUITABLE LIFE SEGREGATED FUNDS
Annual ReportDecember 31, 2019
TABLE OF CONTENTS
Independent Auditors' Report 1
Accumulative Income Fund 4
Active Canadian Bond Fund 7
American Growth Fund 11
Asset Allocation Fund 14
Canadian Stock Fund 17
Common Stock Fund 20
Equitable Life Active Balanced Growth Portfolio 23
Equitable Life Active Balanced Income Portfolio 26
Equitable Life Active Balanced Portfolio 29
Equitable Life Bissett Canadian Equity Fund (Initial series and B series) 32
Equitable Life Bissett Canadian Equity Fund (Select series) 35
Equitable Life Bissett Dividend Income Fund 38
Equitable Life Bissett Monthly Income and Growth Fund 41
Equitable Life Dynamic American Fund 44
Equitable Life Dynamic Asia Pacific Equity Fund 47
Equitable Life Dynamic Equity Income Fund 50
Equitable Life Dynamic Global Discovery Fund 53
Equitable Life Dynamic Power Global Growth Fund 56
Equitable Life Dynamic U.S. Monthly Income Fund 59
Equitable Life Dynamic Value Balanced Fund 62
Equitable Life Invesco Canadian Premier Growth Fund 65
Equitable Life Invesco Diversified Yield Fund 68
Equitable Life Invesco Europlus Fund 71
Equitable Life Invesco Global Balanced Fund 74
Equitable Life Invesco Global Bond Fund 77
Equitable Life Invesco Global Companies Fund 80
Equitable Life Invesco Intactive Balanced Growth Portfolio 83
Equitable Life Invesco Intactive Balanced Income Portfolio 86
Equitable Life Invesco International Companies Fund 89
Equitable Life Low Volatility Canadian Equity Fund 92
Equitable Life Mackenzie Canadian Growth Balanced Fund 95
Equitable Life Mackenzie Global Small Cap Growth Fund 98
Equitable Life Mackenzie Income Fund 101
Equitable Life Mackenzie Ivy Canadian Balanced Fund 104
Equitable Life Mackenzie Ivy Global Balanced Fund 107
Equitable Life Mackenzie Unconstrained Fixed Income Fund 110
Equitable Life Quotential Balanced Growth Portfolio 113
Equitable Life Quotential Balanced Income Portfolio 116
Equitable Life Quotential Diversified Equity Portfolio 119
Equitable Life Quotential Diversified Income Portfolio 122
Equitable Life Quotential Growth Portfolio 125
Equitable Life Templeton Growth Fund 128
Money Market Fund 131
Notes to Financial Statements 134
INDEPENDENT AUDITORS’ REPORT
To the Directors of The Equitable Life Insurance Company of Canada and to the Unitholders of The Equitable Life Insurance Company of Canada Segregated Funds (the “Funds”) listed below:
Accumulative Income Fund Equitable Life Invesco Diversified Yield Fund Active Canadian Bond Fund Equitable Life Invesco Europlus Fund American Growth Fund Equitable Life Invesco Global Balanced Fund Asset Allocation Fund Equitable Life Invesco Global Bond Fund Canadian Stock Fund Equitable Life Invesco Global Companies Fund Common Stock Fund Equitable Life Invesco Intactive Balanced Growth Portfolio Equitable Life Active Balanced Growth Portfolio Equitable Life Invesco Intactive Balanced Income Portfolio Equitable Life Active Balanced Income Portfolio Equitable Life Invesco International Companies Fund Equitable Life Active Balanced Portfolio Equitable Life Low Volatility Canadian Equity Fund Equitable Life Bissett Canadian Equity Fund (Initial series Equitable Life Mackenzie Canadian Growth Balanced Fund and B series) Equitable Life Mackenzie Global Small Cap Growth Fund Equitable Life Bissett Canadian Equity Fund (Select series) Equitable Life Mackenzie Income Fund Equitable Life Bissett Dividend Income Fund Equitable Life Mackenzie Ivy Canadian Balanced Fund Equitable Life Bissett Monthly Income and Growth Fund Equitable Life Mackenzie Ivy Global Balanced Fund Equitable Life Dynamic American Fund Equitable Life Mackenzie Unconstrained Fixed Income Fund Equitable Life Dynamic Asia Pacific Equity Fund Equitable Life Quotential Balanced Growth Portfolio Equitable Life Dynamic Equity Income Fund Equitable Life Quotential Balanced Income Portfolio Equitable Life Dynamic Global Discovery Fund Equitable Life Quotential Diversified Equity Portfolio Equitable Life Dynamic Power Global Growth Fund Equitable Life Quotential Diversified Income Portfolio Equitable Life Dynamic U.S. Monthly Income Fund Equitable Life Quotential Growth Portfolio Equitable Life Dynamic Value Balanced Fund Equitable Life Templeton Growth Fund Equitable Life Invesco Canadian Premier Growth Fund Money Market Fund
Opinion
We have audited the financial statements of each of the Funds, which comprise:
the statements of financial position as at December 31, 2019 and December 31, 2018;
the statements of comprehensive income for the years then ended;
the statements of changes in net assets attributable to contractholders for the years then ended;
the statements of cash flows for the years then ended;
and notes to the consolidated financial statements, including a summary of significant accounting policies
(Hereinafter referred to as the “financial statements”).
Basis for Opinion
We are independent of the Funds in accordance with the ethical requirements that are relevant to our audit of the financial
statements in Canada and we have fulfilled our other responsibilities in accordance with these requirements.
We believe that the audit evidence we have obtained is sufficient and appropriate to provide a basis for our opinion.
1
In our opinion, the accompanying financial statements present fairly, in all material respects, the financial position of the Funds
as at December 31, 2019 and December 31, 2018, and its financial performance and its cash flows for the years then ended in
accordance with International Financial Reporting Standards (IFRS).
We conducted our audit in accordance with Canadian generally accepted auditing standards. Our responsibilities under those
standards are further described in the Auditors' Responsibilities for the Audit of the Financial Statements section of our
auditors' report.
Other Information
Management is responsible for the other information. Other information comprises:
the schedule of investment portfolio;
annual compound net returns; and,
financial highlights.
Our opinion on the financial statements does not cover the other information and we do not and will not express any form of
assurance conclusion thereon.
In connection with our audit of the financial statements, our responsibility is to read the other information identified above and,
in doing so, consider whether the other information is materially inconsistent with the financial statements or our knowledge
obtained in the audit and remain alert for indications that the other information appears to be materially misstated.
If, based on the work we have performed on this other information, we conclude that there is a material misstatement of this
other information, we are required to report that fact in the auditors’ report.
for such internal control as management determines is necessary to enable the preparation of financial statements that are free
from material misstatement, whether due to fraud or error.
In preparing the financial statements, management is responsible for assessing the Funds’ ability to continue as a going
concern, disclosing as applicable, matters related to going concern and using the going concern basis of accounting unless
management either intends to liquidate the Funds or to cease operations, or has no realistic alternative but to do so.
Those charged with governance are responsible for overseeing the Funds’ financial reporting process.
Auditors' Responsibilities for the Audit of the Financial Statements
Our objectives are to obtain reasonable assurance about whether the financial statements as a whole are free from material
misstatement, whether due to fraud or error, and to issue an auditors' report that includes our opinion.
Reasonable assurance is a high level of assurance, but is not a guarantee that an audit conducted in accordance with
Canadian generally accepted auditing standards will always detect a material misstatement when it exists.
Misstatements can arise from fraud or error and are considered material if, individually or in the aggregate, they could
reasonably be expected to influence the economic decisions of users taken on the basis of the financial statements.
As part of an audit in accordance with Canadian generally accepted auditing standards, we exercise professional judgment and
maintain professional skepticism throughout the audit.
We also:
Identify and assess the risks of material misstatement of the financial statements, whether due to fraud or error, design
and perform audit procedures responsive to those risks, and obtain audit evidence that is sufficient and appropriate to
provide a basis for our opinion.
The risk of not detecting a material misstatement resulting from fraud is higher than for one resulting from error, as fraud
may involve collusion, forgery, intentional omissions, misrepresentations, or the override of internal control.
Obtain an understanding of internal control relevant to the audit in order to design audit procedures that are appropriate in
the circumstances, but not for the purpose of expressing an opinion on the effectiveness of the Funds’ internal control.
Evaluate the appropriateness of accounting policies used and the reasonableness of accounting estimates and related
disclosures made by management.
2
We have nothing to report in this regard.
Responsibilities of Management and Those Charged with Governance for the Financial Statements
Management is responsible for the preparation and fair presentation of the financial statements in accordance with IFRS, and
Conclude on the appropriateness of management's use of the going concern basis of accounting and, based on the audit
evidence obtained, whether a material uncertainty exists related to events or conditions that may cast significant doubt on
the Funds’ ability to continue as a going concern. If we conclude that a material uncertainty exists, we are required to draw
attention in our auditors' report to the related disclosures in the financial statements or, if such disclosures are inadequate,
to modify our opinion. Our conclusions are based on the audit evidence obtained up to the date of our auditors' report.
However, future events or conditions may cause the Funds to cease to continue as a going concern.
Evaluate the overall presentation, structure and content of the financial statements, including the disclosures, and whether
the financial statements represent the underlying transactions and events in a manner that achieves fair presentation.
Communicate with those charged with governance regarding, among other matters, the planned scope and timing of the
audit and significant audit findings, including any significant deficiencies in internal control that we identify during our audit.
3
Chartered Professional Accountants, Licensed Public Accountants Waterloo, Canada, February 11, 2020
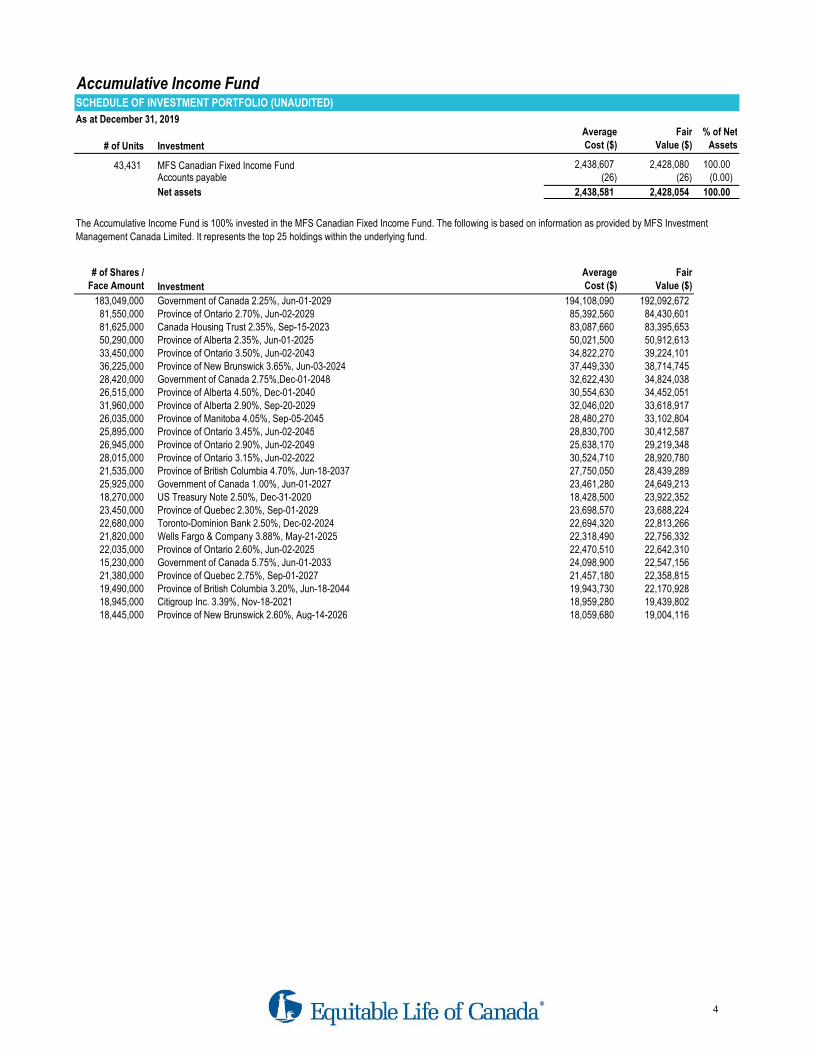
Accumulative Income FundSCHEDULE OF INVESTMENT PORTFOLIO (UNAUDITED)
As at December 31, 2019
# of Units Investment
Average
Cost ($)
Fair
Value ($)
% of Net
Assets
43,431 MFS Canadian Fixed Income Fund 2,438,607 2,428,080 100.00 Accounts payable (26) (26) (0.00)
Net assets 2,438,581 2,428,054 100.00
# of Shares /
Face Amount Investment
Average
Cost ($)
Fair
Value ($)
183,049,000 Government of Canada 2.25%, Jun-01-2029 194,108,090 192,092,672 81,550,000 Province of Ontario 2.70%, Jun-02-2029 85,392,560 84,430,601 81,625,000 Canada Housing Trust 2.35%, Sep-15-2023 83,087,660 83,395,653 50,290,000 Province of Alberta 2.35%, Jun-01-2025 50,021,500 50,912,613 33,450,000 Province of Ontario 3.50%, Jun-02-2043 34,822,270 39,224,101 36,225,000 Province of New Brunswick 3.65%, Jun-03-2024 37,449,330 38,714,745 28,420,000 Government of Canada 2.75%,Dec-01-2048 32,622,430 34,824,038 26,515,000 Province of Alberta 4.50%, Dec-01-2040 30,554,630 34,452,051 31,960,000 Province of Alberta 2.90%, Sep-20-2029 32,046,020 33,618,917 26,035,000 Province of Manitoba 4.05%, Sep-05-2045 28,480,270 33,102,804 25,895,000 Province of Ontario 3.45%, Jun-02-2045 28,830,700 30,412,587 26,945,000 Province of Ontario 2.90%, Jun-02-2049 25,638,170 29,219,348 28,015,000 Province of Ontario 3.15%, Jun-02-2022 30,524,710 28,920,780 21,535,000 Province of British Columbia 4.70%, Jun-18-2037 27,750,050 28,439,289 25,925,000 Government of Canada 1.00%, Jun-01-2027 23,461,280 24,649,213 18,270,000 US Treasury Note 2.50%, Dec-31-2020 18,428,500 23,922,352 23,450,000 Province of Quebec 2.30%, Sep-01-2029 23,698,570 23,688,224 22,680,000 Toronto-Dominion Bank 2.50%, Dec-02-2024 22,694,320 22,813,266 21,820,000 Wells Fargo & Company 3.88%, May-21-2025 22,318,490 22,756,332 22,035,000 Province of Ontario 2.60%, Jun-02-2025 22,470,510 22,642,310 15,230,000 Government of Canada 5.75%, Jun-01-2033 24,098,900 22,547,156 21,380,000 Province of Quebec 2.75%, Sep-01-2027 21,457,180 22,358,815 19,490,000 Province of British Columbia 3.20%, Jun-18-2044 19,943,730 22,170,928 18,945,000 Citigroup Inc. 3.39%, Nov-18-2021 18,959,280 19,439,802 18,445,000 Province of New Brunswick 2.60%, Aug-14-2026 18,059,680 19,004,116
The Accumulative Income Fund is 100% invested in the MFS Canadian Fixed Income Fund. The following is based on information as provided by MFS Investment
Management Canada Limited. It represents the top 25 holdings within the underlying fund.
4

Accumulative Income FundSTATEMENTS OF FINANCIAL POSITIONAs at December 31
Assets 2019 2018
Investments at fair value 2,428,080$ 2,584,614$
Cash and cash equivalents - -
2,428,080 2,584,614 Liabilities
Accounts payable 26 84
26 84
Net assets attributable to contractholders 2,428,054$ 2,584,530$
Net assets attributable to contractholders, per unit
Initial series 47.08$ 44.09$
STATEMENTS OF COMPREHENSIVE INCOMEFor the twelve months ended December 31
Investment income (loss) 2019 2018
Interest, dividends and fee income 73,910$ 79,341$
Net realized and unrealized gain (loss) 104,454 (41,498)
178,364 37,843 Expenses
Management fees (note 5) 9,127 9,585
Insurance fees, HST and other expenses 716 816
9,843 10,401
Net increase (decrease) in net assets from operations attributable to contractholders 168,521$ 27,442$
Net increase (decrease) in net assets from operations attributable to contractholders, per unit (note 7)
Initial series 3.09$ 0.45$
STATEMENTS OF CHANGES IN NET ASSETS ATTRIBUTABLE TO CONTRACTHOLDERSFor the twelve months ended December 31
2019 2018
Net assets attributable to contractholders - beginning of period 2,584,530$ 2,776,654$
Contractholders' contributions 99,550 102,377
Contractholders' withdrawals (424,547) (321,943)
Net increase (decrease) from contractholders' transactions (324,997) (219,566)
Net increase (decrease) in net assets from operations attributable to contractholders 168,521 27,442
Net assets attributable to contractholders - end of period 2,428,054$ 2,584,530$
STATEMENTS OF CASH FLOWS
For the twelve months ended December 31
Operating cash inflows (outflows) 2019 2018
Interest, dividend and other investment income received 73,910$ 79,341$
Operating expenses paid (9,901) (10,347)
Proceeds from sale of investments 343,262 241,831
Purchase of investments (82,274) (90,532)
Contractholders' contributions 99,550 102,377
Contractholders' withdrawals (424,547) (321,943)
Cash provided by (used in) operating activities - 727
Increase (decrease) in cash and cash equivalents during the period - 727
Cash and cash equivalents - beginning of period - (727)
Cash and cash equivalents - end of period -$ -$
5
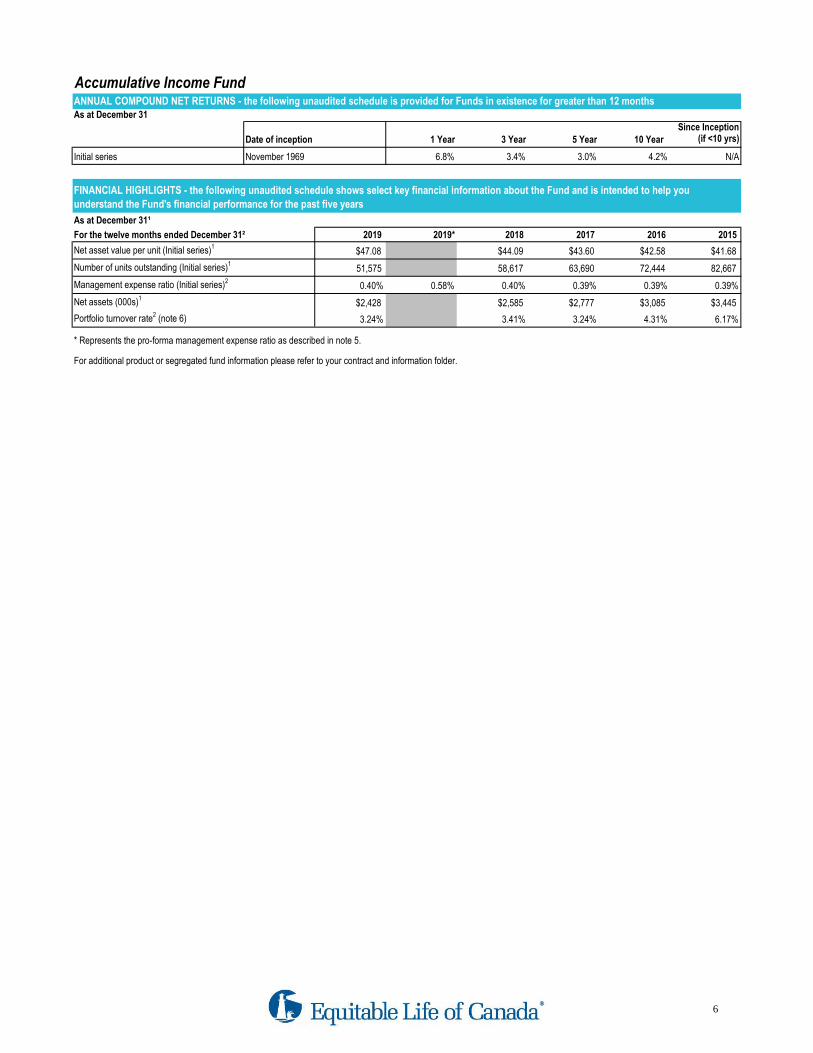
Accumulative Income FundANNUAL COMPOUND NET RETURNS - the following unaudited schedule is provided for Funds in existence for greater than 12 monthsAs at December 31
Since Inception
Date of inception 1 Year 3 Year 5 Year 10 Year (if <10 yrs)
Initial series November 1969 6.8% 3.4% 3.0% 4.2% N/A
As at December 31¹
For the twelve months ended December 31² 2019 2019* 2018 2017 2016 2015
Net asset value per unit (Initial series)1$47.08 $44.09 $43.60 $42.58 $41.68
Number of units outstanding (Initial series)151,575 58,617 63,690 72,444 82,667
Management expense ratio (Initial series)20.40% 0.58% 0.40% 0.39% 0.39% 0.39%
Net assets (000s)1$2,428 $2,585 $2,777 $3,085 $3,445
Portfolio turnover rate2 (note 6) 3.24% 3.41% 3.24% 4.31% 6.17%
* Represents the pro-forma management expense ratio as described in note 5.
For additional product or segregated fund information please refer to your contract and information folder.
FINANCIAL HIGHLIGHTS - the following unaudited schedule shows select key financial information about the Fund and is intended to help you
understand the Fund's financial performance for the past five years
6
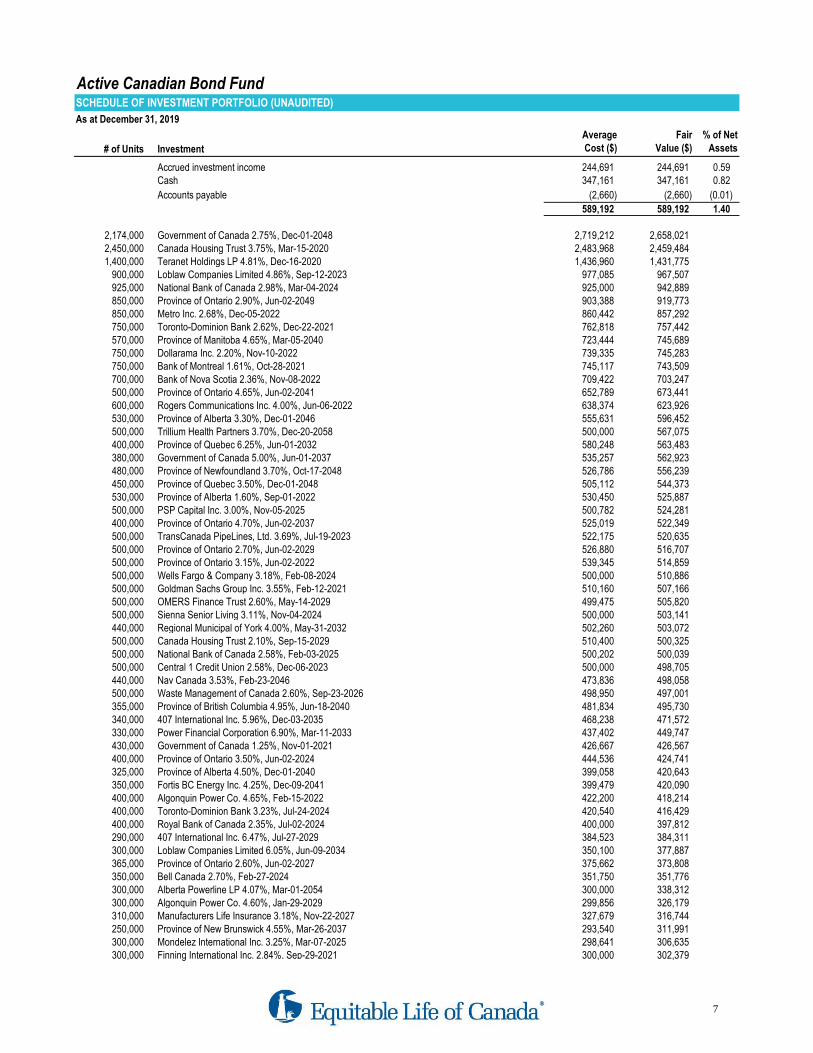
Active Canadian Bond FundSCHEDULE OF INVESTMENT PORTFOLIO (UNAUDITED)
As at December 31, 2019
# of Units Investment
Average
Cost ($)
Fair
Value ($)
% of Net
Assets
Accrued investment income 244,691 244,691 0.59 Cash 347,161 347,161 0.82
Accounts payable (2,660) (2,660) (0.01)
589,192 589,192 1.40
2,174,000 Government of Canada 2.75%, Dec-01-2048 2,719,212 2,658,021 2,450,000 Canada Housing Trust 3.75%, Mar-15-2020 2,483,968 2,459,484 1,400,000 Teranet Holdings LP 4.81%, Dec-16-2020 1,436,960 1,431,775
900,000 Loblaw Companies Limited 4.86%, Sep-12-2023 977,085 967,507 925,000 National Bank of Canada 2.98%, Mar-04-2024 925,000 942,889 850,000 Province of Ontario 2.90%, Jun-02-2049 903,388 919,773 850,000 Metro Inc. 2.68%, Dec-05-2022 860,442 857,292 750,000 Toronto-Dominion Bank 2.62%, Dec-22-2021 762,818 757,442 570,000 Province of Manitoba 4.65%, Mar-05-2040 723,444 745,689 750,000 Dollarama Inc. 2.20%, Nov-10-2022 739,335 745,283 750,000 Bank of Montreal 1.61%, Oct-28-2021 745,117 743,509 700,000 Bank of Nova Scotia 2.36%, Nov-08-2022 709,422 703,247 500,000 Province of Ontario 4.65%, Jun-02-2041 652,789 673,441 600,000 Rogers Communications Inc. 4.00%, Jun-06-2022 638,374 623,926 530,000 Province of Alberta 3.30%, Dec-01-2046 555,631 596,452 500,000 Trillium Health Partners 3.70%, Dec-20-2058 500,000 567,075 400,000 Province of Quebec 6.25%, Jun-01-2032 580,248 563,483 380,000 Government of Canada 5.00%, Jun-01-2037 535,257 562,923 480,000 Province of Newfoundland 3.70%, Oct-17-2048 526,786 556,239 450,000 Province of Quebec 3.50%, Dec-01-2048 505,112 544,373 530,000 Province of Alberta 1.60%, Sep-01-2022 530,450 525,887 500,000 PSP Capital Inc. 3.00%, Nov-05-2025 500,782 524,281 400,000 Province of Ontario 4.70%, Jun-02-2037 525,019 522,349 500,000 TransCanada PipeLines, Ltd. 3.69%, Jul-19-2023 522,175 520,635 500,000 Province of Ontario 2.70%, Jun-02-2029 526,880 516,707 500,000 Province of Ontario 3.15%, Jun-02-2022 539,345 514,859 500,000 Wells Fargo & Company 3.18%, Feb-08-2024 500,000 510,886 500,000 Goldman Sachs Group Inc. 3.55%, Feb-12-2021 510,160 507,166 500,000 OMERS Finance Trust 2.60%, May-14-2029 499,475 505,820 500,000 Sienna Senior Living 3.11%, Nov-04-2024 500,000 503,141 440,000 Regional Municipal of York 4.00%, May-31-2032 502,260 503,072 500,000 Canada Housing Trust 2.10%, Sep-15-2029 510,400 500,325 500,000 National Bank of Canada 2.58%, Feb-03-2025 500,202 500,039 500,000 Central 1 Credit Union 2.58%, Dec-06-2023 500,000 498,705 440,000 Nav Canada 3.53%, Feb-23-2046 473,836 498,058 500,000 Waste Management of Canada 2.60%, Sep-23-2026 498,950 497,001 355,000 Province of British Columbia 4.95%, Jun-18-2040 481,834 495,730 340,000 407 International Inc. 5.96%, Dec-03-2035 468,238 471,572 330,000 Power Financial Corporation 6.90%, Mar-11-2033 437,402 449,747 430,000 Government of Canada 1.25%, Nov-01-2021 426,667 426,567 400,000 Province of Ontario 3.50%, Jun-02-2024 444,536 424,741 325,000 Province of Alberta 4.50%, Dec-01-2040 399,058 420,643 350,000 Fortis BC Energy Inc. 4.25%, Dec-09-2041 399,479 420,090 400,000 Algonquin Power Co. 4.65%, Feb-15-2022 422,200 418,214 400,000 Toronto-Dominion Bank 3.23%, Jul-24-2024 420,540 416,429 400,000 Royal Bank of Canada 2.35%, Jul-02-2024 400,000 397,812 290,000 407 International Inc. 6.47%, Jul-27-2029 384,523 384,311 300,000 Loblaw Companies Limited 6.05%, Jun-09-2034 350,100 377,887 365,000 Province of Ontario 2.60%, Jun-02-2027 375,662 373,808 350,000 Bell Canada 2.70%, Feb-27-2024 351,750 351,776 300,000 Alberta Powerline LP 4.07%, Mar-01-2054 300,000 338,312 300,000 Algonquin Power Co. 4.60%, Jan-29-2029 299,856 326,179 310,000 Manufacturers Life Insurance 3.18%, Nov-22-2027 327,679 316,744 250,000 Province of New Brunswick 4.55%, Mar-26-2037 293,540 311,991 300,000 Mondelez International Inc. 3.25%, Mar-07-2025 298,641 306,635 300,000 Finning International Inc. 2.84%, Sep-29-2021 300,000 302,379
7
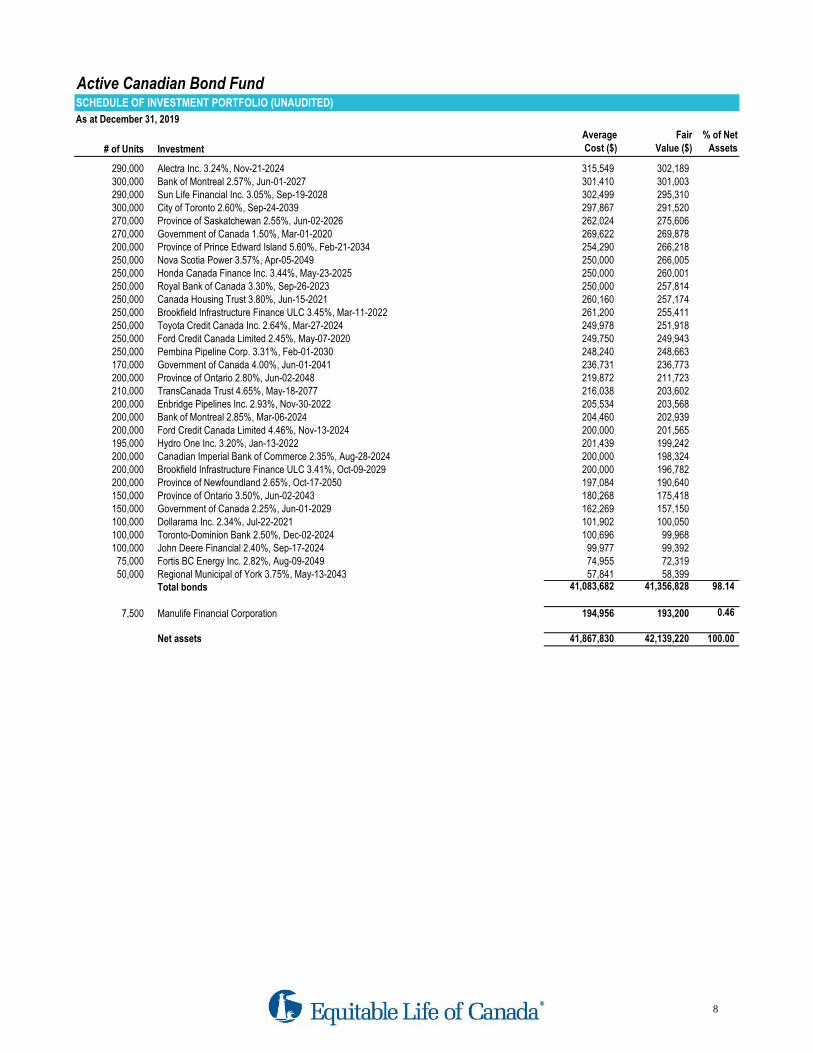
Active Canadian Bond FundSCHEDULE OF INVESTMENT PORTFOLIO (UNAUDITED)
As at December 31, 2019
# of Units Investment
Average
Cost ($)
Fair
Value ($)
% of Net
Assets
290,000 Alectra Inc. 3.24%, Nov-21-2024 315,549 302,189 300,000 Bank of Montreal 2.57%, Jun-01-2027 301,410 301,003 290,000 Sun Life Financial Inc. 3.05%, Sep-19-2028 302,499 295,310 300,000 City of Toronto 2.60%, Sep-24-2039 297,867 291,520 270,000 Province of Saskatchewan 2.55%, Jun-02-2026 262,024 275,606 270,000 Government of Canada 1.50%, Mar-01-2020 269,622 269,878 200,000 Province of Prince Edward Island 5.60%, Feb-21-2034 254,290 266,218 250,000 Nova Scotia Power 3.57%, Apr-05-2049 250,000 266,005 250,000 Honda Canada Finance Inc. 3.44%, May-23-2025 250,000 260,001 250,000 Royal Bank of Canada 3.30%, Sep-26-2023 250,000 257,814 250,000 Canada Housing Trust 3.80%, Jun-15-2021 260,160 257,174 250,000 Brookfield Infrastructure Finance ULC 3.45%, Mar-11-2022 261,200 255,411 250,000 Toyota Credit Canada Inc. 2.64%, Mar-27-2024 249,978 251,918 250,000 Ford Credit Canada Limited 2.45%, May-07-2020 249,750 249,943 250,000 Pembina Pipeline Corp. 3.31%, Feb-01-2030 248,240 248,663 170,000 Government of Canada 4.00%, Jun-01-2041 236,731 236,773 200,000 Province of Ontario 2.80%, Jun-02-2048 219,872 211,723 210,000 TransCanada Trust 4.65%, May-18-2077 216,038 203,602 200,000 Enbridge Pipelines Inc. 2.93%, Nov-30-2022 205,534 203,568 200,000 Bank of Montreal 2.85%, Mar-06-2024 204,460 202,939 200,000 Ford Credit Canada Limited 4.46%, Nov-13-2024 200,000 201,565 195,000 Hydro One Inc. 3.20%, Jan-13-2022 201,439 199,242 200,000 Canadian Imperial Bank of Commerce 2.35%, Aug-28-2024 200,000 198,324 200,000 Brookfield Infrastructure Finance ULC 3.41%, Oct-09-2029 200,000 196,782 200,000 Province of Newfoundland 2.65%, Oct-17-2050 197,084 190,640 150,000 Province of Ontario 3.50%, Jun-02-2043 180,268 175,418 150,000 Government of Canada 2.25%, Jun-01-2029 162,269 157,150 100,000 Dollarama Inc. 2.34%, Jul-22-2021 101,902 100,050 100,000 Toronto-Dominion Bank 2.50%, Dec-02-2024 100,696 99,968 100,000 John Deere Financial 2.40%, Sep-17-2024 99,977 99,392
75,000 Fortis BC Energy Inc. 2.82%, Aug-09-2049 74,955 72,319 50,000 Regional Municipal of York 3.75%, May-13-2043 57,841 58,399
Total bonds 41,083,682 41,356,828 98.14
7,500 Manulife Financial Corporation 194,956 193,200 0.46
Net assets 41,867,830 42,139,220 100.00
8
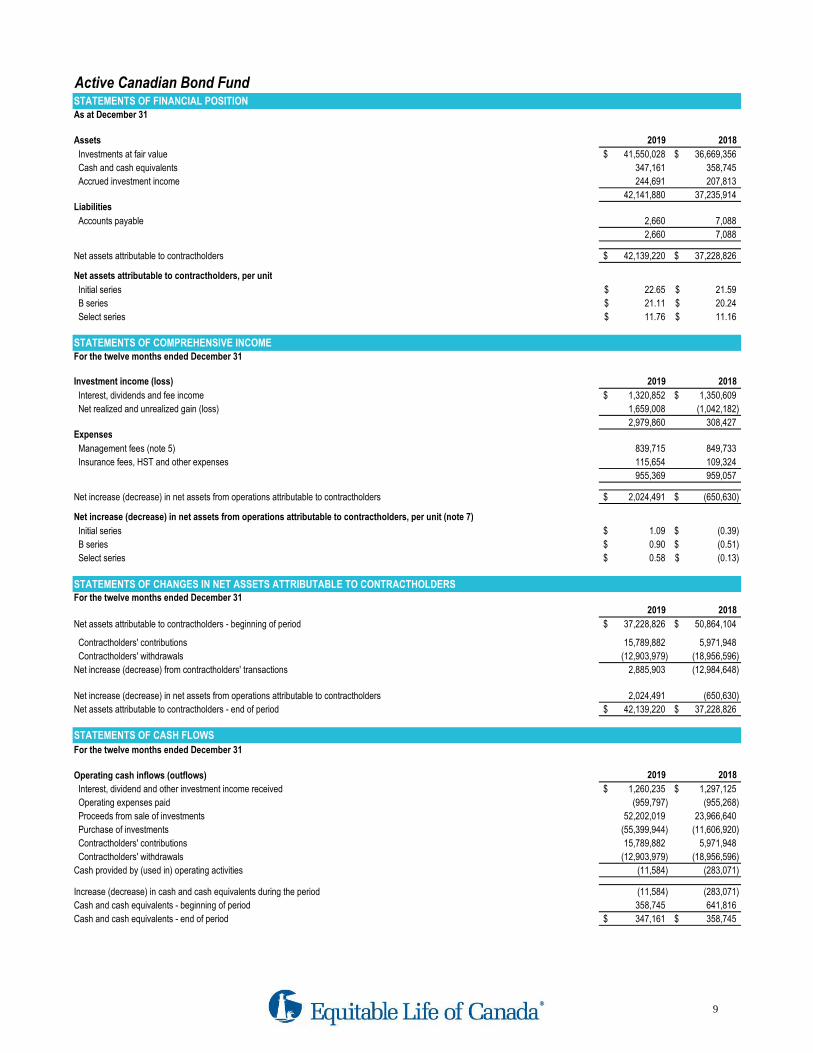
Active Canadian Bond FundSTATEMENTS OF FINANCIAL POSITIONAs at December 31
Assets 2019 2018
Investments at fair value 41,550,028$ 36,669,356$
Cash and cash equivalents 347,161 358,745
Accrued investment income 244,691 207,813
42,141,880 37,235,914 Liabilities
Accounts payable 2,660 7,088
2,660 7,088
Net assets attributable to contractholders 42,139,220$ 37,228,826$
Net assets attributable to contractholders, per unit
Initial series 22.65$ 21.59$
B series 21.11$ 20.24$
Select series 11.76$ 11.16$
STATEMENTS OF COMPREHENSIVE INCOMEFor the twelve months ended December 31
Investment income (loss) 2019 2018
Interest, dividends and fee income 1,320,852$ 1,350,609$
Net realized and unrealized gain (loss) 1,659,008 (1,042,182)
2,979,860 308,427 Expenses
Management fees (note 5) 839,715 849,733
Insurance fees, HST and other expenses 115,654 109,324
955,369 959,057
Net increase (decrease) in net assets from operations attributable to contractholders 2,024,491$ (650,630)$
Net increase (decrease) in net assets from operations attributable to contractholders, per unit (note 7)
Initial series 1.09$ (0.39)$
B series 0.90$ (0.51)$
Select series 0.58$ (0.13)$
STATEMENTS OF CHANGES IN NET ASSETS ATTRIBUTABLE TO CONTRACTHOLDERSFor the twelve months ended December 31
2019 2018
Net assets attributable to contractholders - beginning of period 37,228,826$ 50,864,104$
Contractholders' contributions 15,789,882 5,971,948
Contractholders' withdrawals (12,903,979) (18,956,596)
Net increase (decrease) from contractholders' transactions 2,885,903 (12,984,648)
Net increase (decrease) in net assets from operations attributable to contractholders 2,024,491 (650,630)
Net assets attributable to contractholders - end of period 42,139,220$ 37,228,826$
STATEMENTS OF CASH FLOWS
For the twelve months ended December 31
Operating cash inflows (outflows) 2019 2018
Interest, dividend and other investment income received 1,260,235$ 1,297,125$
Operating expenses paid (959,797) (955,268)
Proceeds from sale of investments 52,202,019 23,966,640
Purchase of investments (55,399,944) (11,606,920)
Contractholders' contributions 15,789,882 5,971,948
Contractholders' withdrawals (12,903,979) (18,956,596)
Cash provided by (used in) operating activities (11,584) (283,071)
Increase (decrease) in cash and cash equivalents during the period (11,584) (283,071)
Cash and cash equivalents - beginning of period 358,745 641,816
Cash and cash equivalents - end of period 347,161$ 358,745$
9
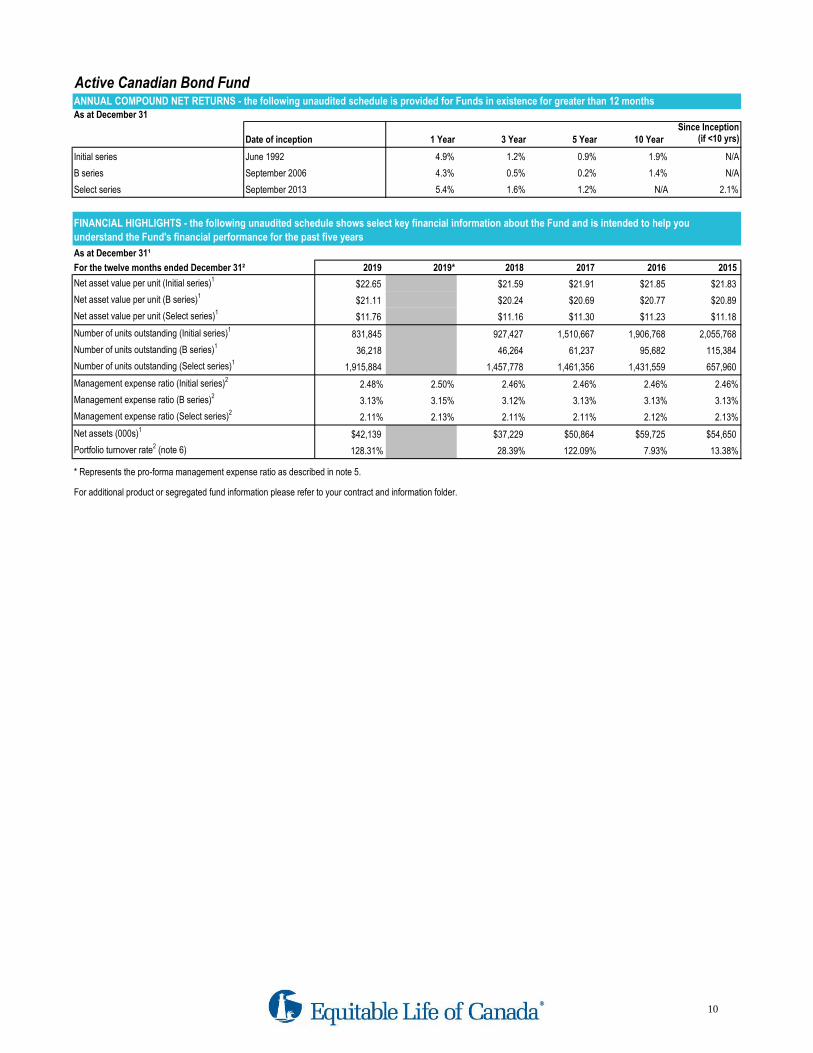
Active Canadian Bond FundANNUAL COMPOUND NET RETURNS - the following unaudited schedule is provided for Funds in existence for greater than 12 monthsAs at December 31
Since Inception
Date of inception 1 Year 3 Year 5 Year 10 Year (if <10 yrs)
Initial series June 1992 4.9% 1.2% 0.9% 1.9% N/A
B series September 2006 4.3% 0.5% 0.2% 1.4% N/A
Select series September 2013 5.4% 1.6% 1.2% N/A 2.1%
As at December 31¹
For the twelve months ended December 31² 2019 2019* 2018 2017 2016 2015
Net asset value per unit (Initial series)1$22.65 $21.59 $21.91 $21.85 $21.83
Net asset value per unit (B series)1$21.11 $20.24 $20.69 $20.77 $20.89
Net asset value per unit (Select series)1$11.76 $11.16 $11.30 $11.23 $11.18
Number of units outstanding (Initial series)1831,845 927,427 1,510,667 1,906,768 2,055,768
Number of units outstanding (B series)136,218 46,264 61,237 95,682 115,384
Number of units outstanding (Select series)11,915,884 1,457,778 1,461,356 1,431,559 657,960
Management expense ratio (Initial series)22.48% 2.50% 2.46% 2.46% 2.46% 2.46%
Management expense ratio (B series)23.13% 3.15% 3.12% 3.13% 3.13% 3.13%
Management expense ratio (Select series)22.11% 2.13% 2.11% 2.11% 2.12% 2.13%
Net assets (000s)1$42,139 $37,229 $50,864 $59,725 $54,650
Portfolio turnover rate2 (note 6) 128.31% 28.39% 122.09% 7.93% 13.38%
* Represents the pro-forma management expense ratio as described in note 5.
For additional product or segregated fund information please refer to your contract and information folder.
FINANCIAL HIGHLIGHTS - the following unaudited schedule shows select key financial information about the Fund and is intended to help you
understand the Fund's financial performance for the past five years
10
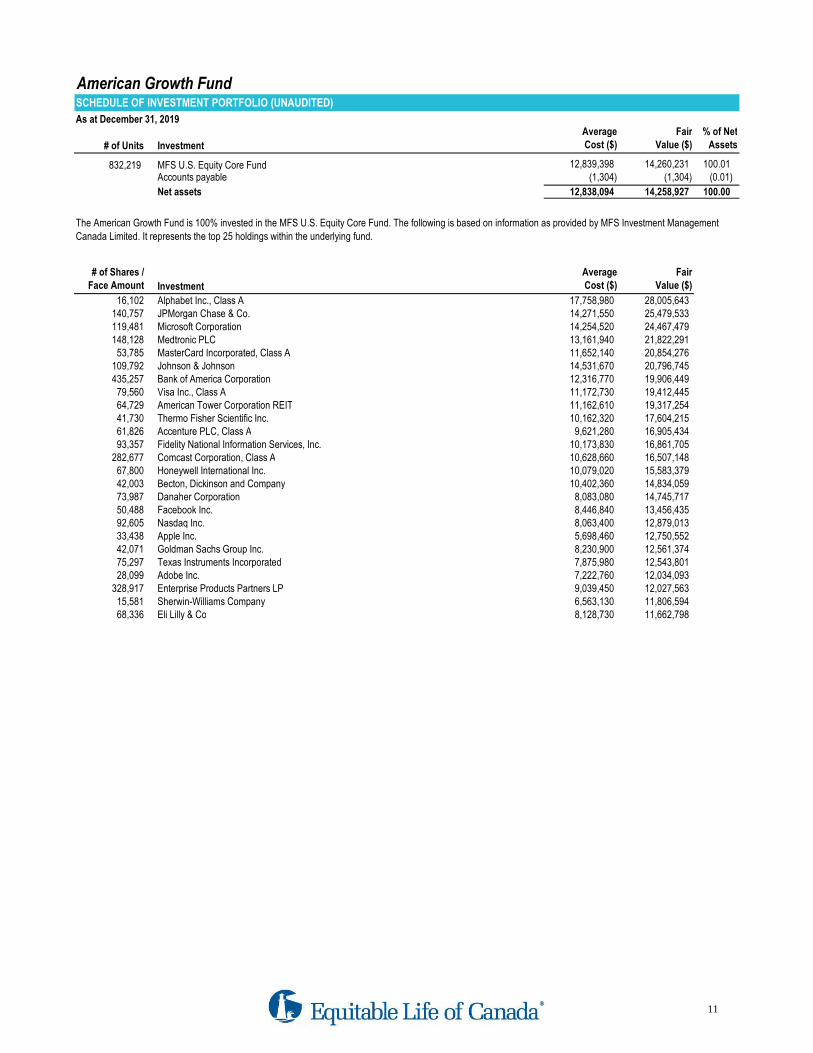
American Growth FundSCHEDULE OF INVESTMENT PORTFOLIO (UNAUDITED)
As at December 31, 2019
# of Units Investment
Average
Cost ($)
Fair
Value ($)
% of Net
Assets
832,219 MFS U.S. Equity Core Fund 12,839,398 14,260,231 100.01 Accounts payable (1,304) (1,304) (0.01)
Net assets 12,838,094 14,258,927 100.00
# of Shares /
Face Amount Investment
Average
Cost ($)
Fair
Value ($)
16,102 Alphabet Inc., Class A 17,758,980 28,005,643 140,757 JPMorgan Chase & Co. 14,271,550 25,479,533 119,481 Microsoft Corporation 14,254,520 24,467,479 148,128 Medtronic PLC 13,161,940 21,822,291
53,785 MasterCard Incorporated, Class A 11,652,140 20,854,276 109,792 Johnson & Johnson 14,531,670 20,796,745 435,257 Bank of America Corporation 12,316,770 19,906,449
79,560 Visa Inc., Class A 11,172,730 19,412,445 64,729 American Tower Corporation REIT 11,162,610 19,317,254 41,730 Thermo Fisher Scientific Inc. 10,162,320 17,604,215 61,826 Accenture PLC, Class A 9,621,280 16,905,434 93,357 Fidelity National Information Services, Inc. 10,173,830 16,861,705
282,677 Comcast Corporation, Class A 10,628,660 16,507,148 67,800 Honeywell International Inc. 10,079,020 15,583,379 42,003 Becton, Dickinson and Company 10,402,360 14,834,059 73,987 Danaher Corporation 8,083,080 14,745,717 50,488 Facebook Inc. 8,446,840 13,456,435 92,605 Nasdaq Inc. 8,063,400 12,879,013 33,438 Apple Inc. 5,698,460 12,750,552 42,071 Goldman Sachs Group Inc. 8,230,900 12,561,374 75,297 Texas Instruments Incorporated 7,875,980 12,543,801 28,099 Adobe Inc. 7,222,760 12,034,093
328,917 Enterprise Products Partners LP 9,039,450 12,027,563 15,581 Sherwin-Williams Company 6,563,130 11,806,594 68,336 Eli Lilly & Co 8,128,730 11,662,798
The American Growth Fund is 100% invested in the MFS U.S. Equity Core Fund. The following is based on information as provided by MFS Investment Management
Canada Limited. It represents the top 25 holdings within the underlying fund.
11
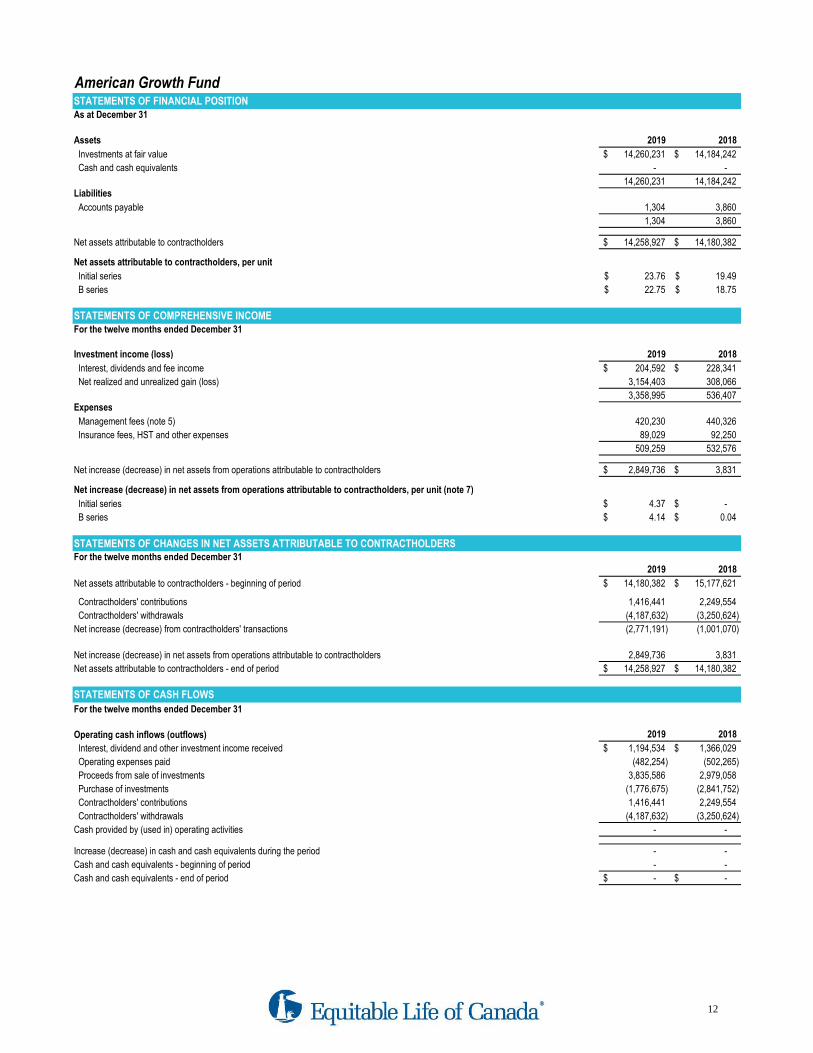
American Growth FundSTATEMENTS OF FINANCIAL POSITIONAs at December 31
Assets 2019 2018
Investments at fair value 14,260,231$ 14,184,242$
Cash and cash equivalents - -
14,260,231 14,184,242 Liabilities
Accounts payable 1,304 3,860
1,304 3,860
Net assets attributable to contractholders 14,258,927$ 14,180,382$
Net assets attributable to contractholders, per unit
Initial series 23.76$ 19.49$
B series 22.75$ 18.75$
STATEMENTS OF COMPREHENSIVE INCOMEFor the twelve months ended December 31
Investment income (loss) 2019 2018
Interest, dividends and fee income 204,592$ 228,341$
Net realized and unrealized gain (loss) 3,154,403 308,066
3,358,995 536,407 Expenses
Management fees (note 5) 420,230 440,326
Insurance fees, HST and other expenses 89,029 92,250
509,259 532,576
Net increase (decrease) in net assets from operations attributable to contractholders 2,849,736$ 3,831$
Net increase (decrease) in net assets from operations attributable to contractholders, per unit (note 7)
Initial series 4.37$ -$
B series 4.14$ 0.04$
STATEMENTS OF CHANGES IN NET ASSETS ATTRIBUTABLE TO CONTRACTHOLDERSFor the twelve months ended December 31
2019 2018
Net assets attributable to contractholders - beginning of period 14,180,382$ 15,177,621$
Contractholders' contributions 1,416,441 2,249,554
Contractholders' withdrawals (4,187,632) (3,250,624)
Net increase (decrease) from contractholders' transactions (2,771,191) (1,001,070)
Net increase (decrease) in net assets from operations attributable to contractholders 2,849,736 3,831
Net assets attributable to contractholders - end of period 14,258,927$ 14,180,382$
STATEMENTS OF CASH FLOWS
For the twelve months ended December 31
Operating cash inflows (outflows) 2019 2018
Interest, dividend and other investment income received 1,194,534$ 1,366,029$
Operating expenses paid (482,254) (502,265)
Proceeds from sale of investments 3,835,586 2,979,058
Purchase of investments (1,776,675) (2,841,752)
Contractholders' contributions 1,416,441 2,249,554
Contractholders' withdrawals (4,187,632) (3,250,624)
Cash provided by (used in) operating activities - -
Increase (decrease) in cash and cash equivalents during the period - -
Cash and cash equivalents - beginning of period - -
Cash and cash equivalents - end of period -$ -$
12
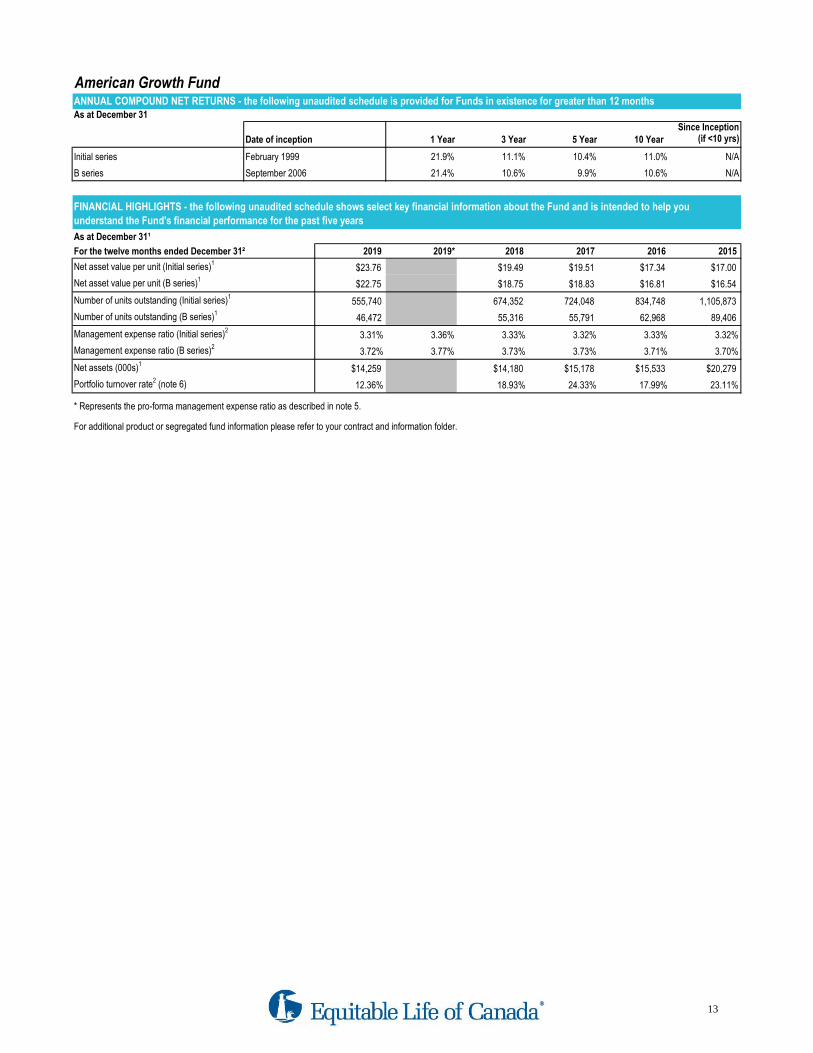
American Growth FundANNUAL COMPOUND NET RETURNS - the following unaudited schedule is provided for Funds in existence for greater than 12 monthsAs at December 31
Since Inception
Date of inception 1 Year 3 Year 5 Year 10 Year (if <10 yrs)
Initial series February 1999 21.9% 11.1% 10.4% 11.0% N/A
B series September 2006 21.4% 10.6% 9.9% 10.6% N/A
As at December 31¹
For the twelve months ended December 31² 2019 2019* 2018 2017 2016 2015
Net asset value per unit (Initial series)1$23.76 $19.49 $19.51 $17.34 $17.00
Net asset value per unit (B series)1$22.75 $18.75 $18.83 $16.81 $16.54
Number of units outstanding (Initial series)1555,740 674,352 724,048 834,748 1,105,873
Number of units outstanding (B series)146,472 55,316 55,791 62,968 89,406
Management expense ratio (Initial series)23.31% 3.36% 3.33% 3.32% 3.33% 3.32%
Management expense ratio (B series)23.72% 3.77% 3.73% 3.73% 3.71% 3.70%
Net assets (000s)1$14,259 $14,180 $15,178 $15,533 $20,279
Portfolio turnover rate2 (note 6) 12.36% 18.93% 24.33% 17.99% 23.11%
* Represents the pro-forma management expense ratio as described in note 5.
For additional product or segregated fund information please refer to your contract and information folder.
FINANCIAL HIGHLIGHTS - the following unaudited schedule shows select key financial information about the Fund and is intended to help you
understand the Fund's financial performance for the past five years
13
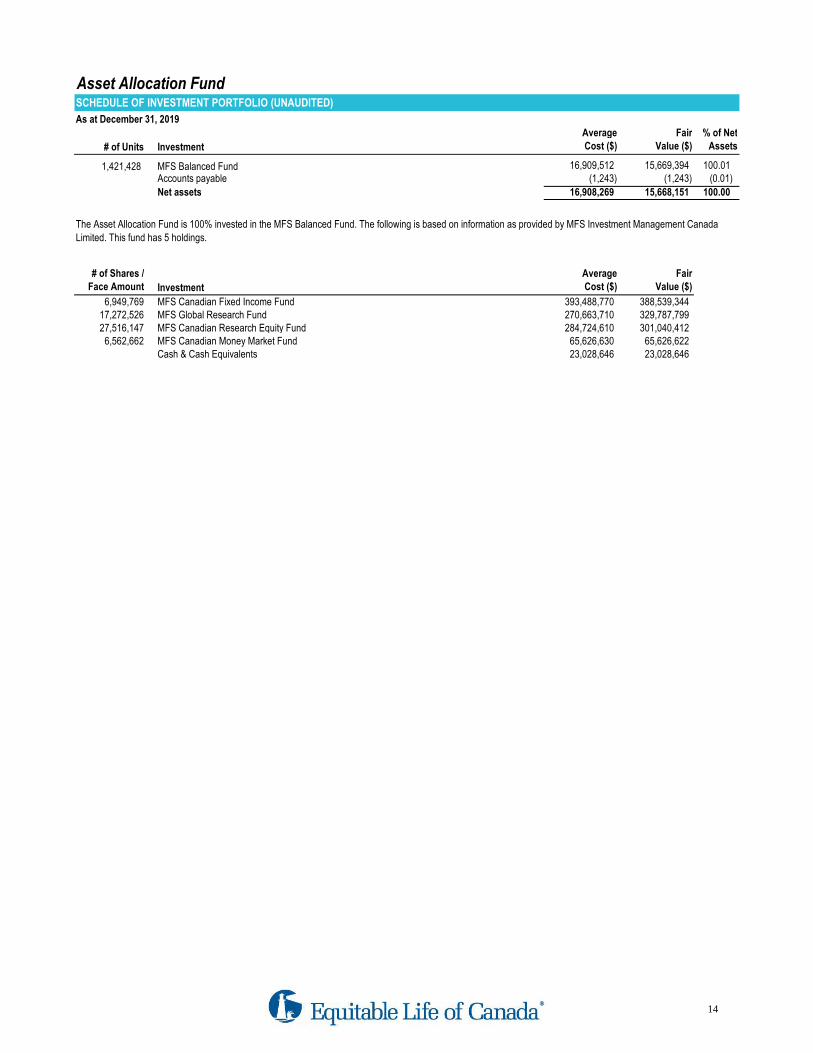
Asset Allocation FundSCHEDULE OF INVESTMENT PORTFOLIO (UNAUDITED)
As at December 31, 2019
# of Units Investment
Average
Cost ($)
Fair
Value ($)
% of Net
Assets
1,421,428 MFS Balanced Fund 16,909,512 15,669,394 100.01 Accounts payable (1,243) (1,243) (0.01)
Net assets 16,908,269 15,668,151 100.00
# of Shares /
Face Amount Investment
Average
Cost ($)
Fair
Value ($)
6,949,769 MFS Canadian Fixed Income Fund 393,488,770 388,539,344 17,272,526 MFS Global Research Fund 270,663,710 329,787,799 27,516,147 MFS Canadian Research Equity Fund 284,724,610 301,040,412
6,562,662 MFS Canadian Money Market Fund 65,626,630 65,626,622 Cash & Cash Equivalents 23,028,646 23,028,646
The Asset Allocation Fund is 100% invested in the MFS Balanced Fund. The following is based on information as provided by MFS Investment Management Canada
Limited. This fund has 5 holdings.
14

Asset Allocation FundSTATEMENTS OF FINANCIAL POSITIONAs at December 31
Assets 2019 2018
Investments at fair value 15,669,394$ 15,299,875$
Cash and cash equivalents - -
15,669,394 15,299,875 Liabilities
Accounts payable 1,243 3,611
1,243 3,611
Net assets attributable to contractholders 15,668,151$ 15,296,264$
Net assets attributable to contractholders, per unit
Initial series 30.98$ 27.24$
STATEMENTS OF COMPREHENSIVE INCOMEFor the twelve months ended December 31
Investment income (loss) 2019 2018
Interest, dividends and fee income 413,719$ 414,373$
Net realized and unrealized gain (loss) 2,109,717 (543,291)
2,523,436 (128,918) Expenses
Management fees (note 5) 412,332 429,455
Insurance fees, HST and other expenses 61,487 62,483
473,819 491,938
Net increase (decrease) in net assets from operations attributable to contractholders 2,049,617$ (620,856)$
Net increase (decrease) in net assets from operations attributable to contractholders, per unit (note 7)
Initial series 3.81$ (1.06)$
STATEMENTS OF CHANGES IN NET ASSETS ATTRIBUTABLE TO CONTRACTHOLDERSFor the twelve months ended December 31
2019 2018
Net assets attributable to contractholders - beginning of period 15,296,264$ 17,493,198$
Contractholders' contributions 892,090 2,452,979
Contractholders' withdrawals (2,569,820) (4,029,057)
Net increase (decrease) from contractholders' transactions (1,677,730) (1,576,078)
Net increase (decrease) in net assets from operations attributable to contractholders 2,049,617 (620,856)
Net assets attributable to contractholders - end of period 15,668,151$ 15,296,264$
STATEMENTS OF CASH FLOWS
For the twelve months ended December 31
Operating cash inflows (outflows) 2019 2018
Interest, dividend and other investment income received 1,209,662$ 1,010,152$
Operating expenses paid (465,458) (479,536)
Proceeds from sale of investments 2,437,918 3,519,469
Purchase of investments (1,504,392) (2,474,007)
Contractholders' contributions 892,090 2,452,979
Contractholders' withdrawals (2,569,820) (4,029,057)
Cash provided by (used in) operating activities - -
Increase (decrease) in cash and cash equivalents during the period - -
Cash and cash equivalents - beginning of period - -
Cash and cash equivalents - end of period -$ -$
15
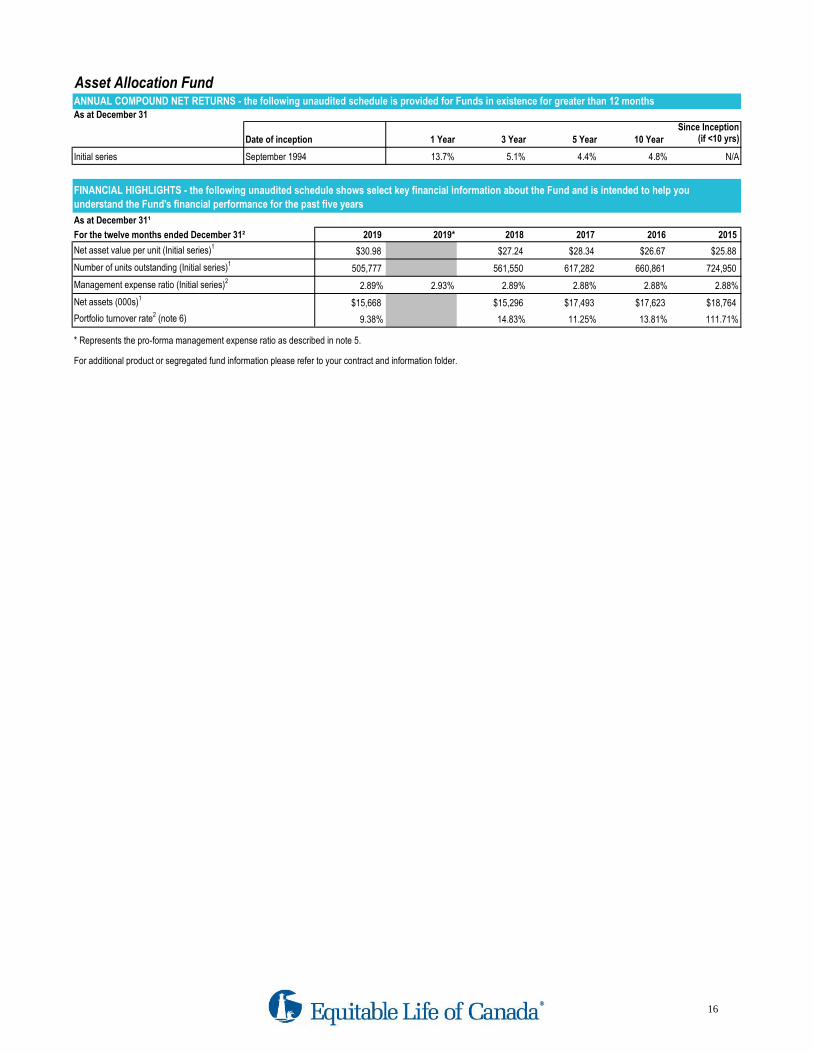
Asset Allocation FundANNUAL COMPOUND NET RETURNS - the following unaudited schedule is provided for Funds in existence for greater than 12 monthsAs at December 31
Since Inception
Date of inception 1 Year 3 Year 5 Year 10 Year (if <10 yrs)
Initial series September 1994 13.7% 5.1% 4.4% 4.8% N/A
As at December 31¹
For the twelve months ended December 31² 2019 2019* 2018 2017 2016 2015
Net asset value per unit (Initial series)1$30.98 $27.24 $28.34 $26.67 $25.88
Number of units outstanding (Initial series)1505,777 561,550 617,282 660,861 724,950
Management expense ratio (Initial series)22.89% 2.93% 2.89% 2.88% 2.88% 2.88%
Net assets (000s)1$15,668 $15,296 $17,493 $17,623 $18,764
Portfolio turnover rate2 (note 6) 9.38% 14.83% 11.25% 13.81% 111.71%
* Represents the pro-forma management expense ratio as described in note 5.
For additional product or segregated fund information please refer to your contract and information folder.
FINANCIAL HIGHLIGHTS - the following unaudited schedule shows select key financial information about the Fund and is intended to help you
understand the Fund's financial performance for the past five years
16
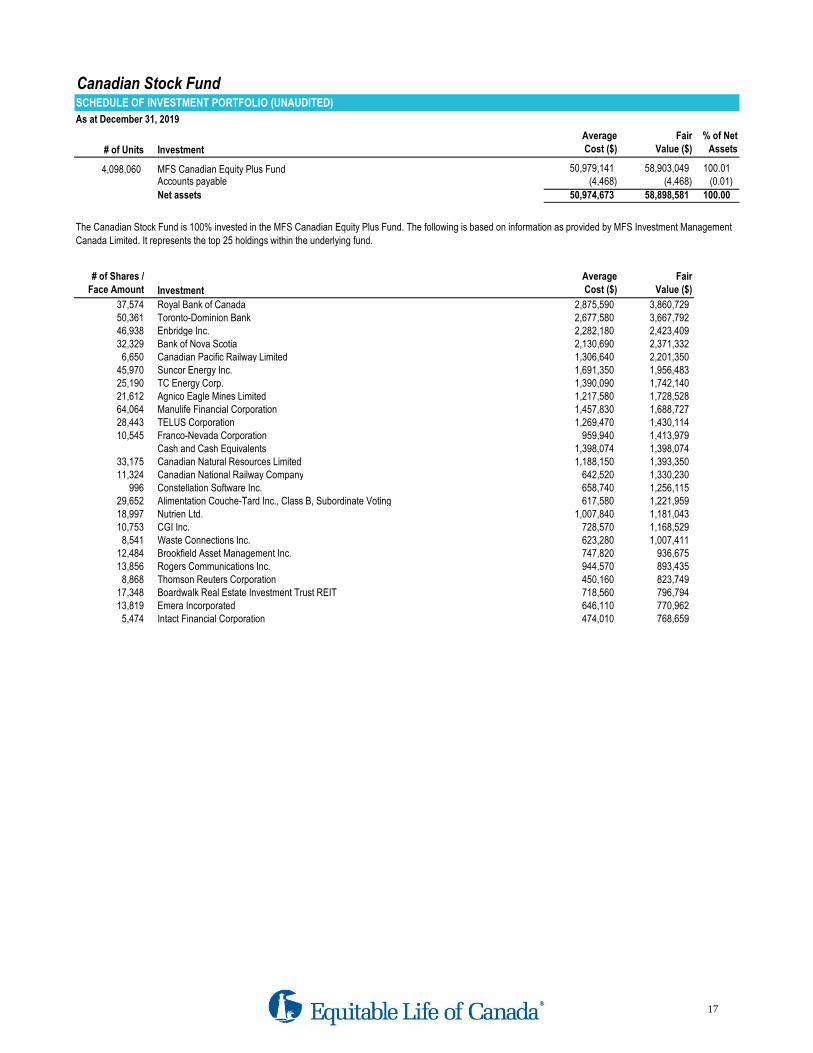
Canadian Stock FundSCHEDULE OF INVESTMENT PORTFOLIO (UNAUDITED)
As at December 31, 2019
# of Units Investment
Average
Cost ($)
Fair
Value ($)
% of Net
Assets
4,098,060 MFS Canadian Equity Plus Fund 50,979,141 58,903,049 100.01 Accounts payable (4,468) (4,468) (0.01)
Net assets 50,974,673 58,898,581 100.00
# of Shares /
Face Amount Investment
Average
Cost ($)
Fair
Value ($)
37,574 Royal Bank of Canada 2,875,590 3,860,729 50,361 Toronto-Dominion Bank 2,677,580 3,667,792 46,938 Enbridge Inc. 2,282,180 2,423,409 32,329 Bank of Nova Scotia 2,130,690 2,371,332
6,650 Canadian Pacific Railway Limited 1,306,640 2,201,350 45,970 Suncor Energy Inc. 1,691,350 1,956,483 25,190 TC Energy Corp. 1,390,090 1,742,140 21,612 Agnico Eagle Mines Limited 1,217,580 1,728,528 64,064 Manulife Financial Corporation 1,457,830 1,688,727 28,443 TELUS Corporation 1,269,470 1,430,114 10,545 Franco-Nevada Corporation 959,940 1,413,979
Cash and Cash Equivalents 1,398,074 1,398,074 33,175 Canadian Natural Resources Limited 1,188,150 1,393,350 11,324 Canadian National Railway Company 642,520 1,330,230
996 Constellation Software Inc. 658,740 1,256,115 29,652 Alimentation Couche-Tard Inc., Class B, Subordinate Voting 617,580 1,221,959 18,997 Nutrien Ltd. 1,007,840 1,181,043 10,753 CGI Inc. 728,570 1,168,529
8,541 Waste Connections Inc. 623,280 1,007,411 12,484 Brookfield Asset Management Inc. 747,820 936,675 13,856 Rogers Communications Inc. 944,570 893,435
8,868 Thomson Reuters Corporation 450,160 823,749 17,348 Boardwalk Real Estate Investment Trust REIT 718,560 796,794 13,819 Emera Incorporated 646,110 770,962
5,474 Intact Financial Corporation 474,010 768,659
The Canadian Stock Fund is 100% invested in the MFS Canadian Equity Plus Fund. The following is based on information as provided by MFS Investment Management
Canada Limited. It represents the top 25 holdings within the underlying fund.
17
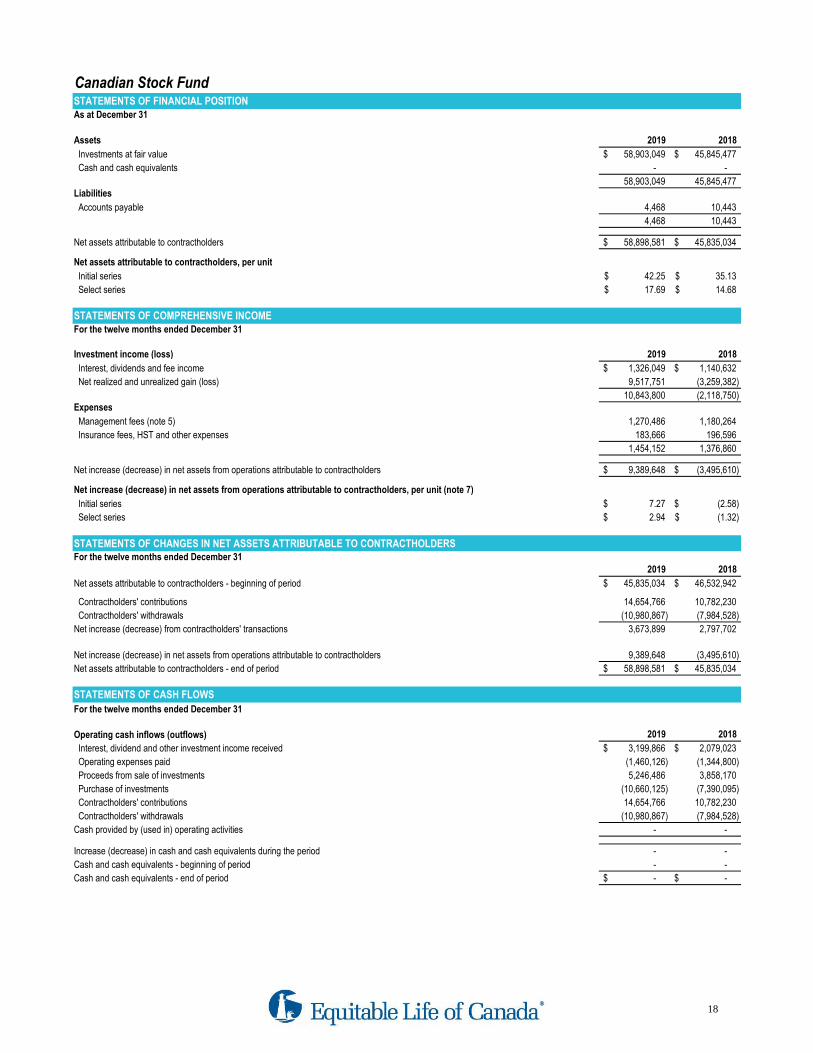
Canadian Stock FundSTATEMENTS OF FINANCIAL POSITIONAs at December 31
Assets 2019 2018
Investments at fair value 58,903,049$ 45,845,477$
Cash and cash equivalents - -
58,903,049 45,845,477 Liabilities
Accounts payable 4,468 10,443
4,468 10,443
Net assets attributable to contractholders 58,898,581$ 45,835,034$
Net assets attributable to contractholders, per unit
Initial series 42.25$ 35.13$
Select series 17.69$ 14.68$
STATEMENTS OF COMPREHENSIVE INCOMEFor the twelve months ended December 31
Investment income (loss) 2019 2018
Interest, dividends and fee income 1,326,049$ 1,140,632$
Net realized and unrealized gain (loss) 9,517,751 (3,259,382)
10,843,800 (2,118,750) Expenses
Management fees (note 5) 1,270,486 1,180,264
Insurance fees, HST and other expenses 183,666 196,596
1,454,152 1,376,860
Net increase (decrease) in net assets from operations attributable to contractholders 9,389,648$ (3,495,610)$
Net increase (decrease) in net assets from operations attributable to contractholders, per unit (note 7)
Initial series 7.27$ (2.58)$
Select series 2.94$ (1.32)$
STATEMENTS OF CHANGES IN NET ASSETS ATTRIBUTABLE TO CONTRACTHOLDERSFor the twelve months ended December 31
2019 2018
Net assets attributable to contractholders - beginning of period 45,835,034$ 46,532,942$
Contractholders' contributions 14,654,766 10,782,230
Contractholders' withdrawals (10,980,867) (7,984,528)
Net increase (decrease) from contractholders' transactions 3,673,899 2,797,702
Net increase (decrease) in net assets from operations attributable to contractholders 9,389,648 (3,495,610)
Net assets attributable to contractholders - end of period 58,898,581$ 45,835,034$
STATEMENTS OF CASH FLOWS
For the twelve months ended December 31
Operating cash inflows (outflows) 2019 2018
Interest, dividend and other investment income received 3,199,866$ 2,079,023$
Operating expenses paid (1,460,126) (1,344,800)
Proceeds from sale of investments 5,246,486 3,858,170
Purchase of investments (10,660,125) (7,390,095)
Contractholders' contributions 14,654,766 10,782,230
Contractholders' withdrawals (10,980,867) (7,984,528)
Cash provided by (used in) operating activities - -
Increase (decrease) in cash and cash equivalents during the period - -
Cash and cash equivalents - beginning of period - -
Cash and cash equivalents - end of period -$ -$
18
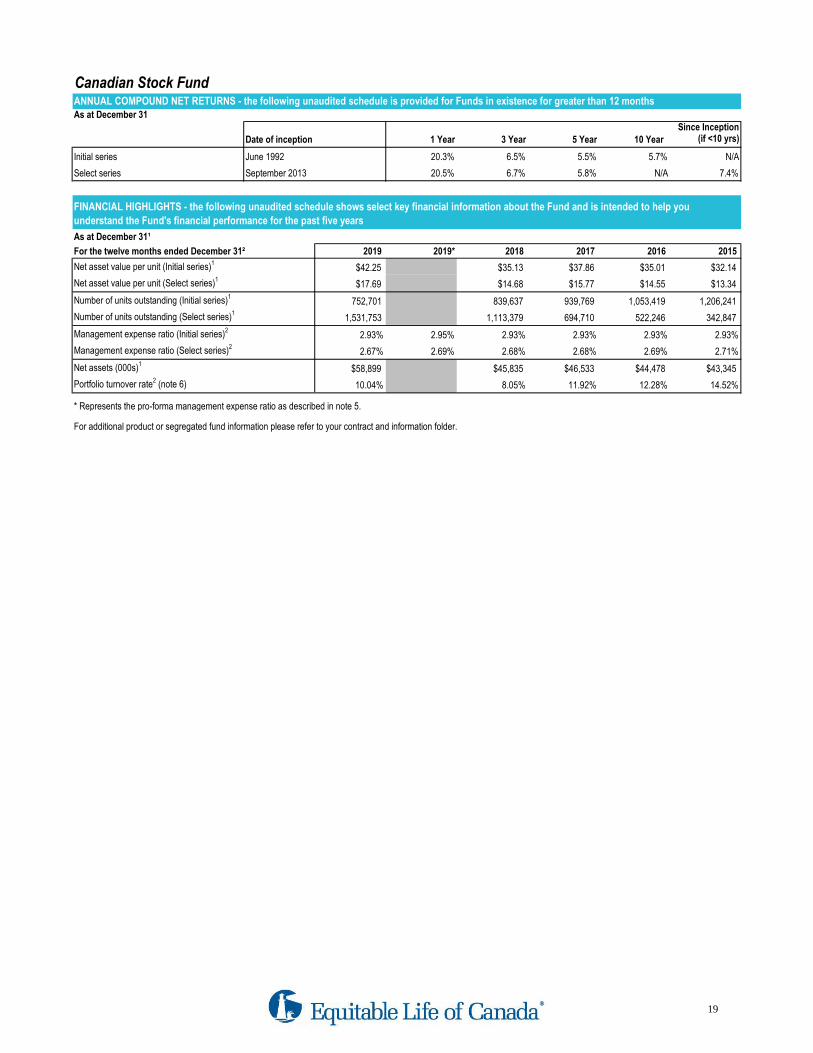
Canadian Stock FundANNUAL COMPOUND NET RETURNS - the following unaudited schedule is provided for Funds in existence for greater than 12 monthsAs at December 31
Since Inception
Date of inception 1 Year 3 Year 5 Year 10 Year (if <10 yrs)
Initial series June 1992 20.3% 6.5% 5.5% 5.7% N/A
Select series September 2013 20.5% 6.7% 5.8% N/A 7.4%
As at December 31¹
For the twelve months ended December 31² 2019 2019* 2018 2017 2016 2015
Net asset value per unit (Initial series)1$42.25 $35.13 $37.86 $35.01 $32.14
Net asset value per unit (Select series)1$17.69 $14.68 $15.77 $14.55 $13.34
Number of units outstanding (Initial series)1752,701 839,637 939,769 1,053,419 1,206,241
Number of units outstanding (Select series)11,531,753 1,113,379 694,710 522,246 342,847
Management expense ratio (Initial series)22.93% 2.95% 2.93% 2.93% 2.93% 2.93%
Management expense ratio (Select series)22.67% 2.69% 2.68% 2.68% 2.69% 2.71%
Net assets (000s)1$58,899 $45,835 $46,533 $44,478 $43,345
Portfolio turnover rate2 (note 6) 10.04% 8.05% 11.92% 12.28% 14.52%
* Represents the pro-forma management expense ratio as described in note 5.
For additional product or segregated fund information please refer to your contract and information folder.
FINANCIAL HIGHLIGHTS - the following unaudited schedule shows select key financial information about the Fund and is intended to help you
understand the Fund's financial performance for the past five years
19

Common Stock FundSCHEDULE OF INVESTMENT PORTFOLIO (UNAUDITED)
As at December 31, 2019
# of Units Investment
Average
Cost ($)
Fair
Value ($)
% of Net
Assets
396,272 MFS Canadian Equity Plus Fund 4,637,016 5,695,782 100.00 Accounts payable (180) (180) (0.00) Net assets 4,636,836 5,695,602 100.00
# of Shares /
Face Amount Investment
Average
Cost ($)
Fair
Value ($)
37,574 Royal Bank of Canada 2,875,590 3,860,729 50,361 Toronto-Dominion Bank 2,677,580 3,667,792 46,938 Enbridge Inc. 2,282,180 2,423,409 32,329 Bank of Nova Scotia 2,130,690 2,371,332
6,650 Canadian Pacific Railway Limited 1,306,640 2,201,350 45,970 Suncor Energy Inc. 1,691,350 1,956,483 25,190 TC Energy Corp. 1,390,090 1,742,140 21,612 Agnico Eagle Mines Limited 1,217,580 1,728,528 64,064 Manulife Financial Corporation 1,457,830 1,688,727 28,443 TELUS Corporation 1,269,470 1,430,114 10,545 Franco-Nevada Corporation 959,940 1,413,979
Cash and Cash Equivalents 1,398,074 1,398,074 33,175 Canadian Natural Resources Limited 1,188,150 1,393,350 11,324 Canadian National Railway Company 642,520 1,330,230
996 Constellation Software Inc. 658,740 1,256,115 29,652 Alimentation Couche-Tard Inc., Class B, Subordinate Voting 617,580 1,221,959 18,997 Nutrien Ltd. 1,007,840 1,181,043 10,753 CGI Inc. 728,570 1,168,529
8,541 Waste Connections Inc. 623,280 1,007,411 12,484 Brookfield Asset Management Inc. 747,820 936,675 13,856 Rogers Communications Inc. 944,570 893,435
8,868 Thomson Reuters Corporation 450,160 823,749 17,348 Boardwalk Real Estate Investment Trust REIT 718,560 796,794 13,819 Emera Incorporated 646,110 770,962
5,474 Intact Financial Corporation 474,010 768,659
The Common Stock Fund is 100% invested in the MFS Canadian Equity Plus Fund. The following is based on information as provided by MFS Investment Management
Canada Limited. It represents the top 25 holdings within the underlying fund.
20
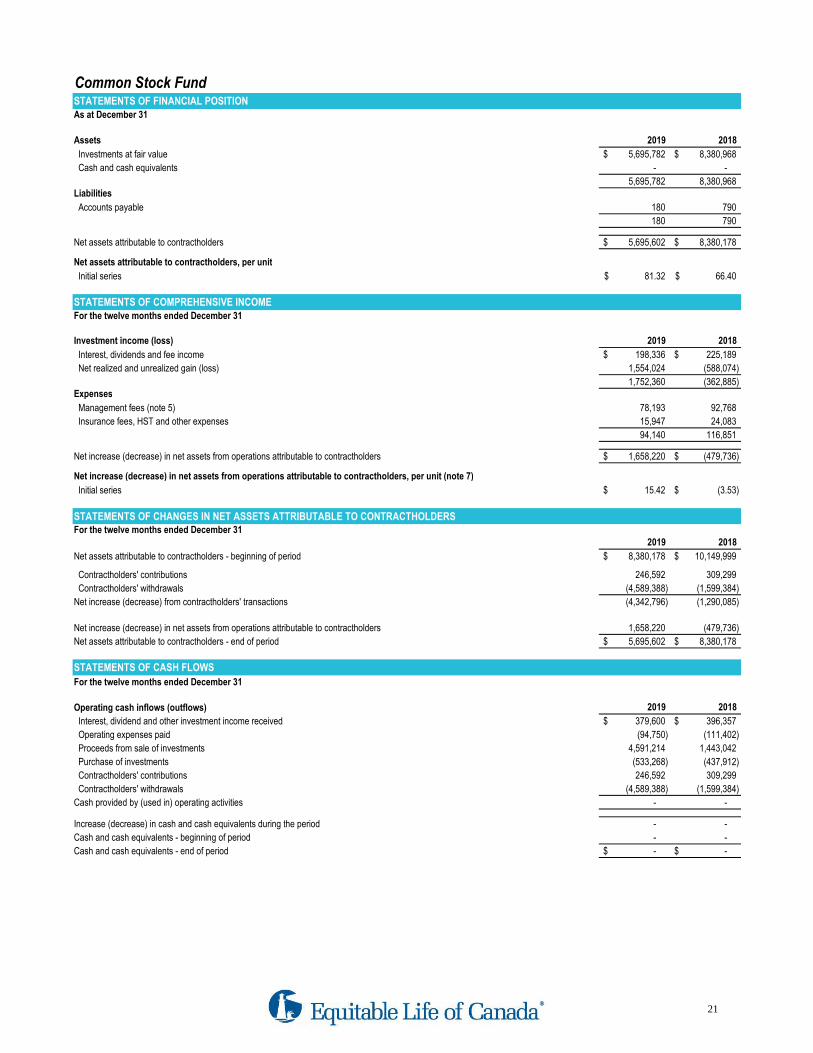
Common Stock FundSTATEMENTS OF FINANCIAL POSITIONAs at December 31
Assets 2019 2018
Investments at fair value 5,695,782$ 8,380,968$
Cash and cash equivalents - -
5,695,782 8,380,968 Liabilities
Accounts payable 180 790
180 790
Net assets attributable to contractholders 5,695,602$ 8,380,178$
Net assets attributable to contractholders, per unit
Initial series 81.32$ 66.40$
STATEMENTS OF COMPREHENSIVE INCOMEFor the twelve months ended December 31
Investment income (loss) 2019 2018
Interest, dividends and fee income 198,336$ 225,189$
Net realized and unrealized gain (loss) 1,554,024 (588,074)
1,752,360 (362,885) Expenses
Management fees (note 5) 78,193 92,768
Insurance fees, HST and other expenses 15,947 24,083
94,140 116,851
Net increase (decrease) in net assets from operations attributable to contractholders 1,658,220$ (479,736)$
Net increase (decrease) in net assets from operations attributable to contractholders, per unit (note 7)
Initial series 15.42$ (3.53)$
STATEMENTS OF CHANGES IN NET ASSETS ATTRIBUTABLE TO CONTRACTHOLDERSFor the twelve months ended December 31
2019 2018
Net assets attributable to contractholders - beginning of period 8,380,178$ 10,149,999$
Contractholders' contributions 246,592 309,299
Contractholders' withdrawals (4,589,388) (1,599,384)
Net increase (decrease) from contractholders' transactions (4,342,796) (1,290,085)
Net increase (decrease) in net assets from operations attributable to contractholders 1,658,220 (479,736)
Net assets attributable to contractholders - end of period 5,695,602$ 8,380,178$
STATEMENTS OF CASH FLOWS
For the twelve months ended December 31
Operating cash inflows (outflows) 2019 2018
Interest, dividend and other investment income received 379,600$ 396,357$
Operating expenses paid (94,750) (111,402)
Proceeds from sale of investments 4,591,214 1,443,042
Purchase of investments (533,268) (437,912)
Contractholders' contributions 246,592 309,299
Contractholders' withdrawals (4,589,388) (1,599,384)
Cash provided by (used in) operating activities - -
Increase (decrease) in cash and cash equivalents during the period - -
Cash and cash equivalents - beginning of period - -
Cash and cash equivalents - end of period -$ -$
21
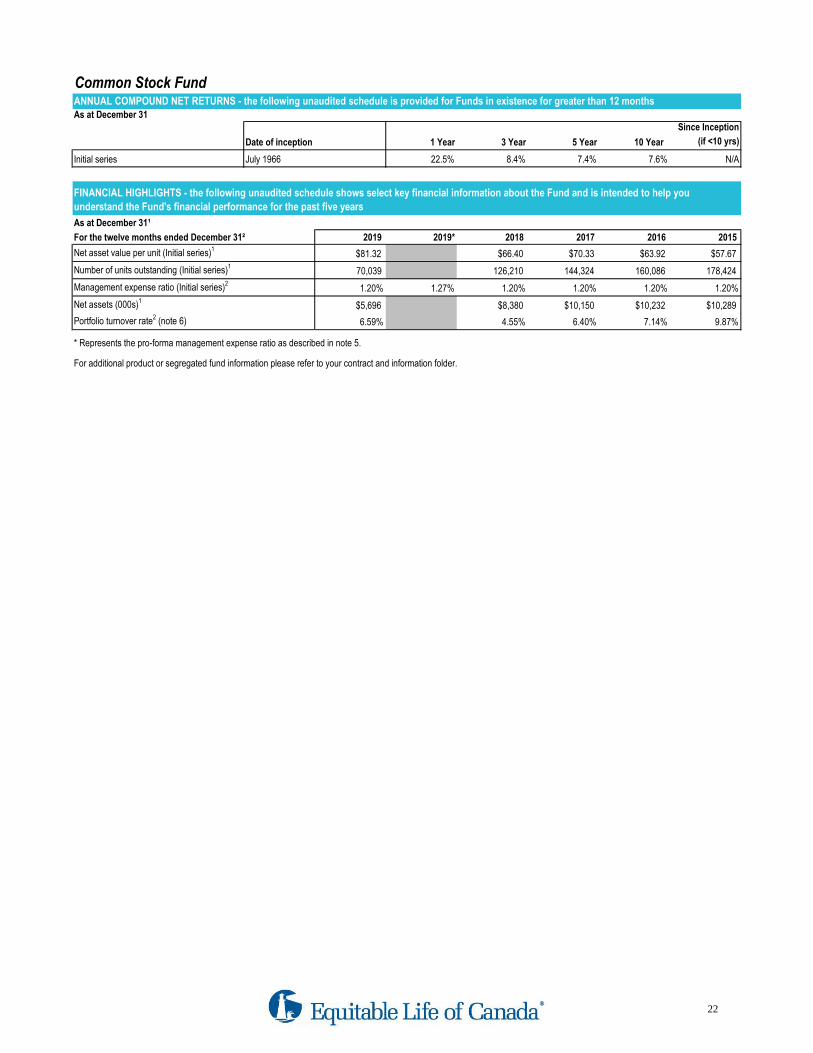
Common Stock FundANNUAL COMPOUND NET RETURNS - the following unaudited schedule is provided for Funds in existence for greater than 12 monthsAs at December 31
Since Inception
Date of inception 1 Year 3 Year 5 Year 10 Year (if <10 yrs)
Initial series July 1966 22.5% 8.4% 7.4% 7.6% N/A
As at December 31¹
For the twelve months ended December 31² 2019 2019* 2018 2017 2016 2015
Net asset value per unit (Initial series)1$81.32 $66.40 $70.33 $63.92 $57.67
Number of units outstanding (Initial series)170,039 126,210 144,324 160,086 178,424
Management expense ratio (Initial series)21.20% 1.27% 1.20% 1.20% 1.20% 1.20%
Net assets (000s)1$5,696 $8,380 $10,150 $10,232 $10,289
Portfolio turnover rate2 (note 6) 6.59% 4.55% 6.40% 7.14% 9.87%
* Represents the pro-forma management expense ratio as described in note 5.
For additional product or segregated fund information please refer to your contract and information folder.
FINANCIAL HIGHLIGHTS - the following unaudited schedule shows select key financial information about the Fund and is intended to help you
understand the Fund's financial performance for the past five years
22
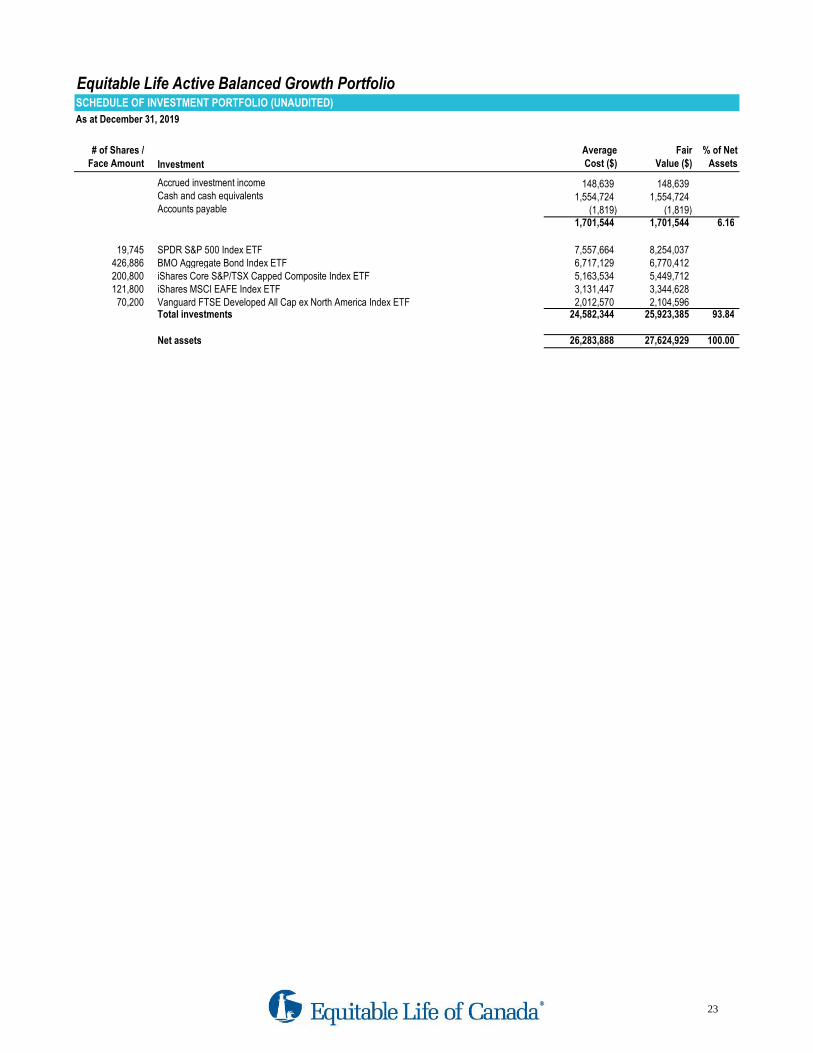
Equitable Life Active Balanced Growth PortfolioSCHEDULE OF INVESTMENT PORTFOLIO (UNAUDITED)
As at December 31, 2019
# of Shares /
Face Amount Investment
Average
Cost ($)
Fair
Value ($)
% of Net
Assets
Accrued investment income 148,639 148,639 Cash and cash equivalents 1,554,724 1,554,724 Accounts payable (1,819) (1,819)
1,701,544 1,701,544 6.16
19,745 SPDR S&P 500 Index ETF 7,557,664 8,254,037 426,886 BMO Aggregate Bond Index ETF 6,717,129 6,770,412 200,800 iShares Core S&P/TSX Capped Composite Index ETF 5,163,534 5,449,712 121,800 iShares MSCI EAFE Index ETF 3,131,447 3,344,628
70,200 Vanguard FTSE Developed All Cap ex North America Index ETF 2,012,570 2,104,596 Total investments 24,582,344 25,923,385 93.84
Net assets 26,283,888 27,624,929 100.00
23
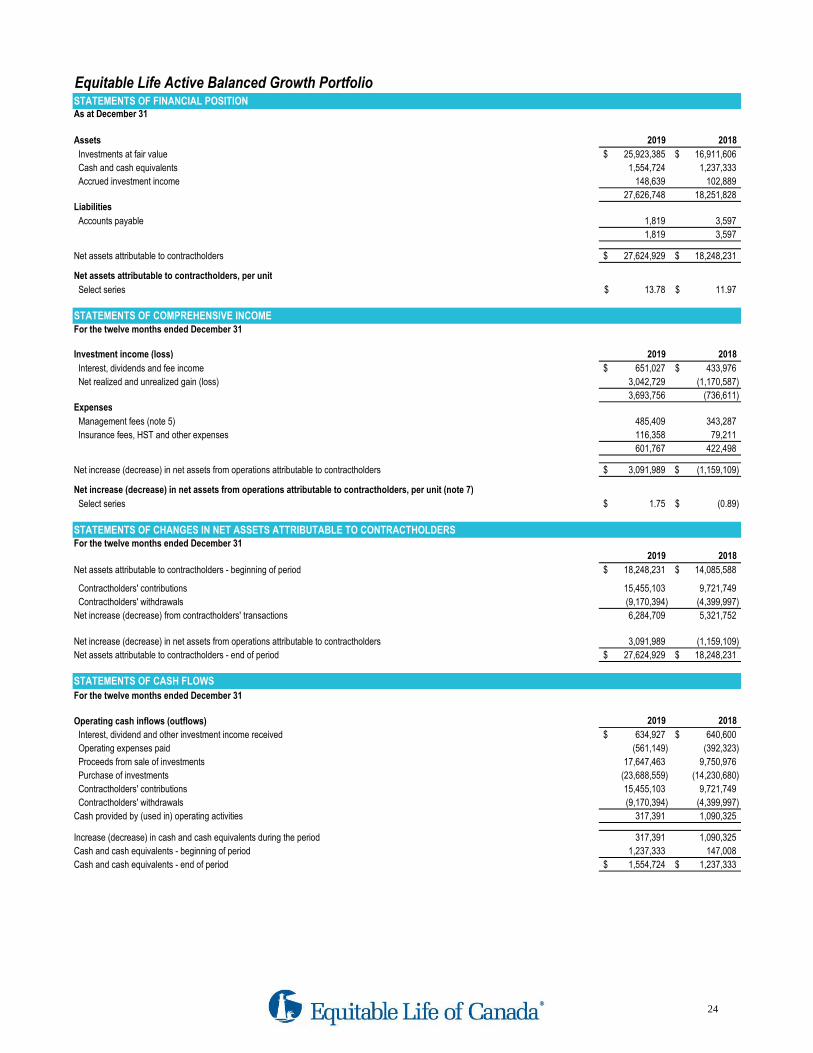
Equitable Life Active Balanced Growth PortfolioSTATEMENTS OF FINANCIAL POSITIONAs at December 31
Assets 2019 2018
Investments at fair value 25,923,385$ 16,911,606$
Cash and cash equivalents 1,554,724 1,237,333
Accrued investment income 148,639 102,889
27,626,748 18,251,828 Liabilities
Accounts payable 1,819 3,597
1,819 3,597
Net assets attributable to contractholders 27,624,929$ 18,248,231$
Net assets attributable to contractholders, per unit
Select series 13.78$ 11.97$
STATEMENTS OF COMPREHENSIVE INCOMEFor the twelve months ended December 31
Investment income (loss) 2019 2018
Interest, dividends and fee income 651,027$ 433,976$
Net realized and unrealized gain (loss) 3,042,729 (1,170,587)
3,693,756 (736,611) Expenses
Management fees (note 5) 485,409 343,287
Insurance fees, HST and other expenses 116,358 79,211
601,767 422,498
Net increase (decrease) in net assets from operations attributable to contractholders 3,091,989$ (1,159,109)$
Net increase (decrease) in net assets from operations attributable to contractholders, per unit (note 7)
Select series 1.75$ (0.89)$
STATEMENTS OF CHANGES IN NET ASSETS ATTRIBUTABLE TO CONTRACTHOLDERSFor the twelve months ended December 31
2019 2018
Net assets attributable to contractholders - beginning of period 18,248,231$ 14,085,588$
Contractholders' contributions 15,455,103 9,721,749
Contractholders' withdrawals (9,170,394) (4,399,997)
Net increase (decrease) from contractholders' transactions 6,284,709 5,321,752
Net increase (decrease) in net assets from operations attributable to contractholders 3,091,989 (1,159,109)
Net assets attributable to contractholders - end of period 27,624,929$ 18,248,231$
STATEMENTS OF CASH FLOWS
For the twelve months ended December 31
Operating cash inflows (outflows) 2019 2018
Interest, dividend and other investment income received 634,927$ 640,600$
Operating expenses paid (561,149) (392,323)
Proceeds from sale of investments 17,647,463 9,750,976
Purchase of investments (23,688,559) (14,230,680)
Contractholders' contributions 15,455,103 9,721,749
Contractholders' withdrawals (9,170,394) (4,399,997)
Cash provided by (used in) operating activities 317,391 1,090,325
Increase (decrease) in cash and cash equivalents during the period 317,391 1,090,325
Cash and cash equivalents - beginning of period 1,237,333 147,008
Cash and cash equivalents - end of period 1,554,724$ 1,237,333$
24

Equitable Life Active Balanced Growth PortfolioANNUAL COMPOUND NET RETURNS - the following unaudited schedule is provided for Funds in existence for greater than 12 monthsAs at December 31
Since Inception
Date of inception 1 Year 3 Year 5 Year 10 Year (if <10 yrs)
Select series September 2013 15.1% 5.2% 3.9% N/A 5.2%
As at December 31¹
For the twelve months ended December 31² 2019 2019* 2018 2017 2016 2015
Net asset value per unit (Select series)1$13.78 $11.97 $12.78 $11.84 $11.32
Number of units outstanding (Select series)12,005,497 1,524,911 1,102,595 659,868 478,865
Management expense ratio (Select series)22.53% 2.56% 2.57% 2.60% 2.65% 2.72%
Net assets (000s)1$27,625 $18,248 $14,086 $7,810 $5,420
Portfolio turnover rate2 (note 6) 81.43% 62.66% 77.85% 116.82% 231.59%
* Represents the pro-forma management expense ratio as described in note 5.
For additional product or segregated fund information please refer to your contract and information folder.
FINANCIAL HIGHLIGHTS - the following unaudited schedule shows select key financial information about the Fund and is intended to help you
understand the Fund's financial performance for the past five years
25
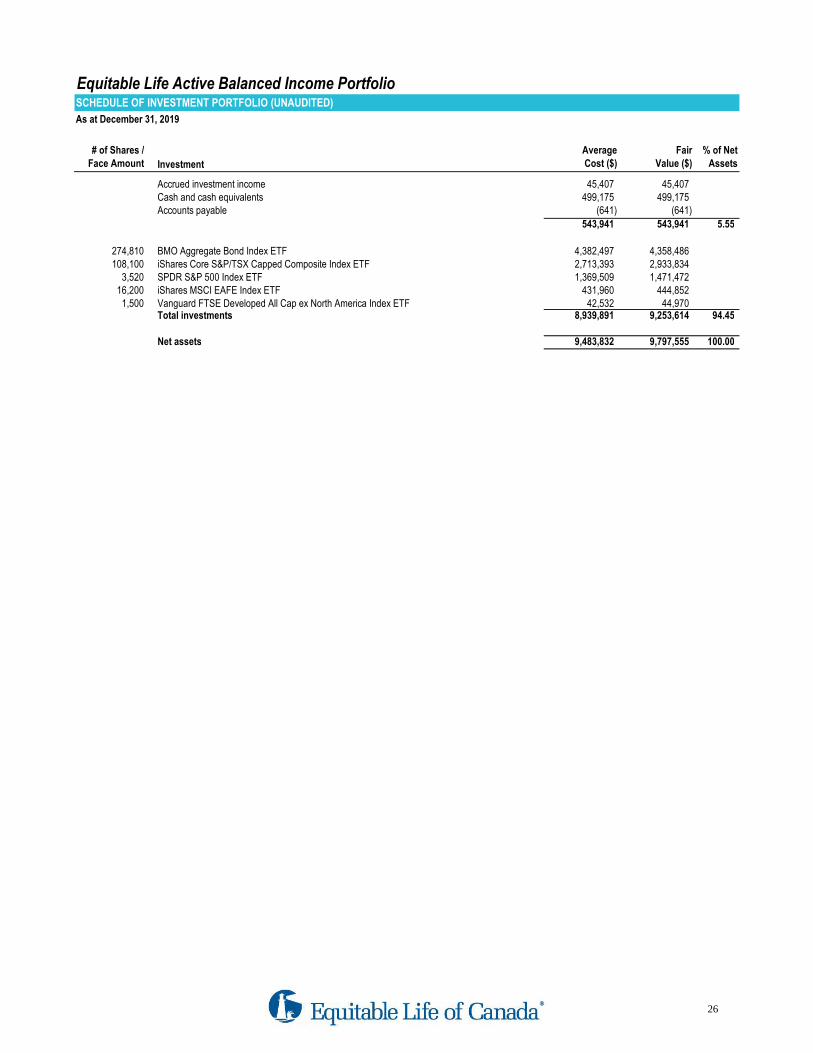
Equitable Life Active Balanced Income PortfolioSCHEDULE OF INVESTMENT PORTFOLIO (UNAUDITED)
As at December 31, 2019
# of Shares /
Face Amount Investment
Average
Cost ($)
Fair
Value ($)
% of Net
Assets
Accrued investment income 45,407 45,407 Cash and cash equivalents 499,175 499,175 Accounts payable (641) (641)
543,941 543,941 5.55
274,810 BMO Aggregate Bond Index ETF 4,382,497 4,358,486 108,100 iShares Core S&P/TSX Capped Composite Index ETF 2,713,393 2,933,834
3,520 SPDR S&P 500 Index ETF 1,369,509 1,471,472 16,200 iShares MSCI EAFE Index ETF 431,960 444,852
1,500 Vanguard FTSE Developed All Cap ex North America Index ETF 42,532 44,970 Total investments 8,939,891 9,253,614 94.45
Net assets 9,483,832 9,797,555 100.00
26
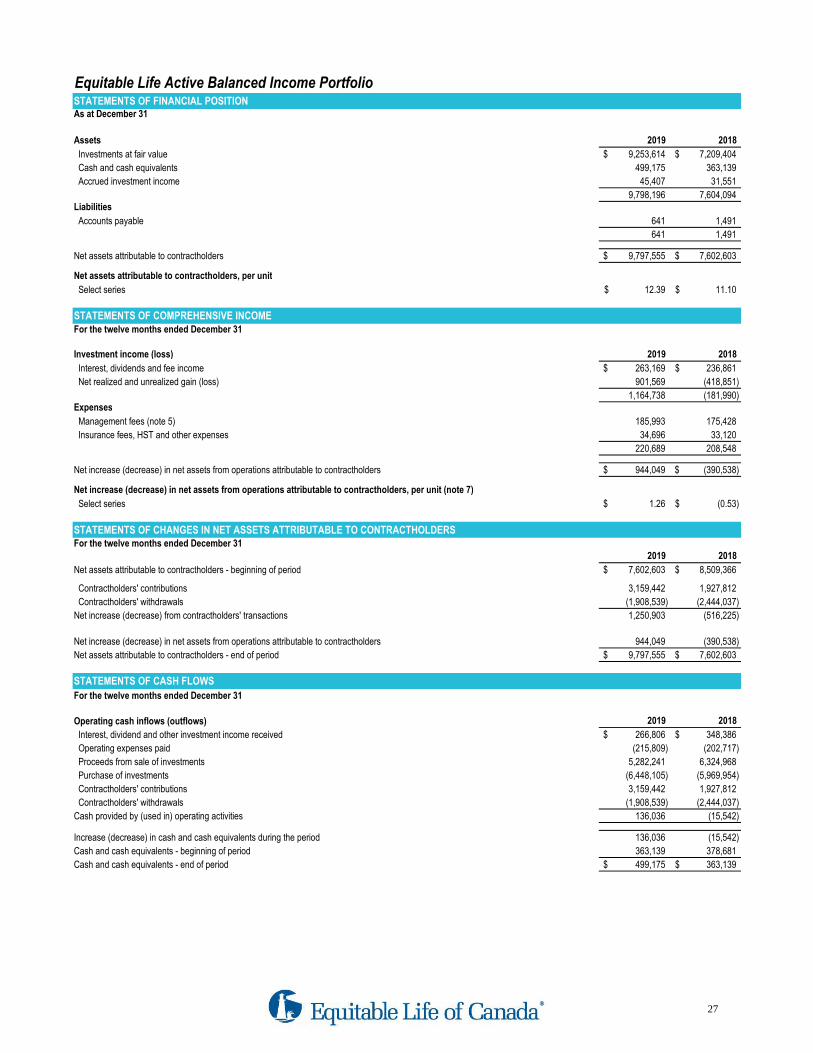
Equitable Life Active Balanced Income PortfolioSTATEMENTS OF FINANCIAL POSITIONAs at December 31
Assets 2019 2018
Investments at fair value 9,253,614$ 7,209,404$
Cash and cash equivalents 499,175 363,139
Accrued investment income 45,407 31,551
9,798,196 7,604,094 Liabilities
Accounts payable 641 1,491
641 1,491
Net assets attributable to contractholders 9,797,555$ 7,602,603$
Net assets attributable to contractholders, per unit
Select series 12.39$ 11.10$
STATEMENTS OF COMPREHENSIVE INCOMEFor the twelve months ended December 31
Investment income (loss) 2019 2018
Interest, dividends and fee income 263,169$ 236,861$
Net realized and unrealized gain (loss) 901,569 (418,851)
1,164,738 (181,990) Expenses
Management fees (note 5) 185,993 175,428
Insurance fees, HST and other expenses 34,696 33,120
220,689 208,548
Net increase (decrease) in net assets from operations attributable to contractholders 944,049$ (390,538)$
Net increase (decrease) in net assets from operations attributable to contractholders, per unit (note 7)
Select series 1.26$ (0.53)$
STATEMENTS OF CHANGES IN NET ASSETS ATTRIBUTABLE TO CONTRACTHOLDERSFor the twelve months ended December 31
2019 2018
Net assets attributable to contractholders - beginning of period 7,602,603$ 8,509,366$
Contractholders' contributions 3,159,442 1,927,812
Contractholders' withdrawals (1,908,539) (2,444,037)
Net increase (decrease) from contractholders' transactions 1,250,903 (516,225)
Net increase (decrease) in net assets from operations attributable to contractholders 944,049 (390,538)
Net assets attributable to contractholders - end of period 9,797,555$ 7,602,603$
STATEMENTS OF CASH FLOWS
For the twelve months ended December 31
Operating cash inflows (outflows) 2019 2018
Interest, dividend and other investment income received 266,806$ 348,386$
Operating expenses paid (215,809) (202,717)
Proceeds from sale of investments 5,282,241 6,324,968
Purchase of investments (6,448,105) (5,969,954)
Contractholders' contributions 3,159,442 1,927,812
Contractholders' withdrawals (1,908,539) (2,444,037)
Cash provided by (used in) operating activities 136,036 (15,542)
Increase (decrease) in cash and cash equivalents during the period 136,036 (15,542)
Cash and cash equivalents - beginning of period 363,139 378,681
Cash and cash equivalents - end of period 499,175$ 363,139$
27

Equitable Life Active Balanced Income PortfolioANNUAL COMPOUND NET RETURNS - the following unaudited schedule is provided for Funds in existence for greater than 12 monthsAs at December 31
Since Inception
Date of inception 1 Year 3 Year 5 Year 10 Year (if <10 yrs)
Select series September 2013 11.7% 3.4% 2.4% N/A 3.5%
As at December 31¹
For the twelve months ended December 31² 2019 2019* 2018 2017 2016 2015
Net asset value per unit (Select series)1$12.39 $11.10 $11.65 $11.22 $10.97
Number of units outstanding (Select series)1790,614 685,062 730,471 742,745 290,158
Management expense ratio (Select series)22.47% 2.53% 2.50% 2.54% 2.60% 2.69%
Net assets (000s)1$9,798 $7,603 $8,509 $8,334 $3,182
Portfolio turnover rate2 (note 6) 62.66% 73.95% 66.34% 111.20% 284.97%
* Represents the pro-forma management expense ratio as described in note 5.
For additional product or segregated fund information please refer to your contract and information folder.
FINANCIAL HIGHLIGHTS - the following unaudited schedule shows select key financial information about the Fund and is intended to help you
understand the Fund's financial performance for the past five years
28
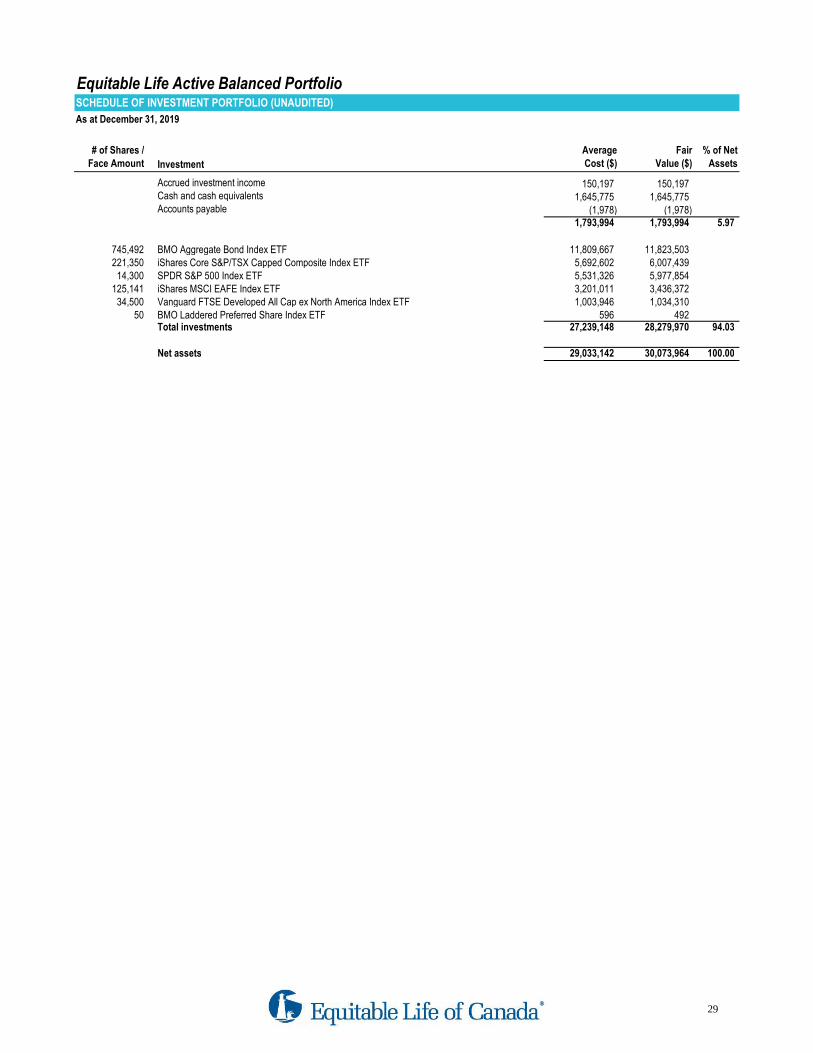
Equitable Life Active Balanced PortfolioSCHEDULE OF INVESTMENT PORTFOLIO (UNAUDITED)
As at December 31, 2019
# of Shares /
Face Amount Investment
Average
Cost ($)
Fair
Value ($)
% of Net
Assets
Accrued investment income 150,197 150,197 Cash and cash equivalents 1,645,775 1,645,775 Accounts payable (1,978) (1,978)
1,793,994 1,793,994 5.97
745,492 BMO Aggregate Bond Index ETF 11,809,667 11,823,503 221,350 iShares Core S&P/TSX Capped Composite Index ETF 5,692,602 6,007,439
14,300 SPDR S&P 500 Index ETF 5,531,326 5,977,854 125,141 iShares MSCI EAFE Index ETF 3,201,011 3,436,372
34,500 Vanguard FTSE Developed All Cap ex North America Index ETF 1,003,946 1,034,310 50 BMO Laddered Preferred Share Index ETF 596 492
Total investments 27,239,148 28,279,970 94.03
Net assets 29,033,142 30,073,964 100.00
29
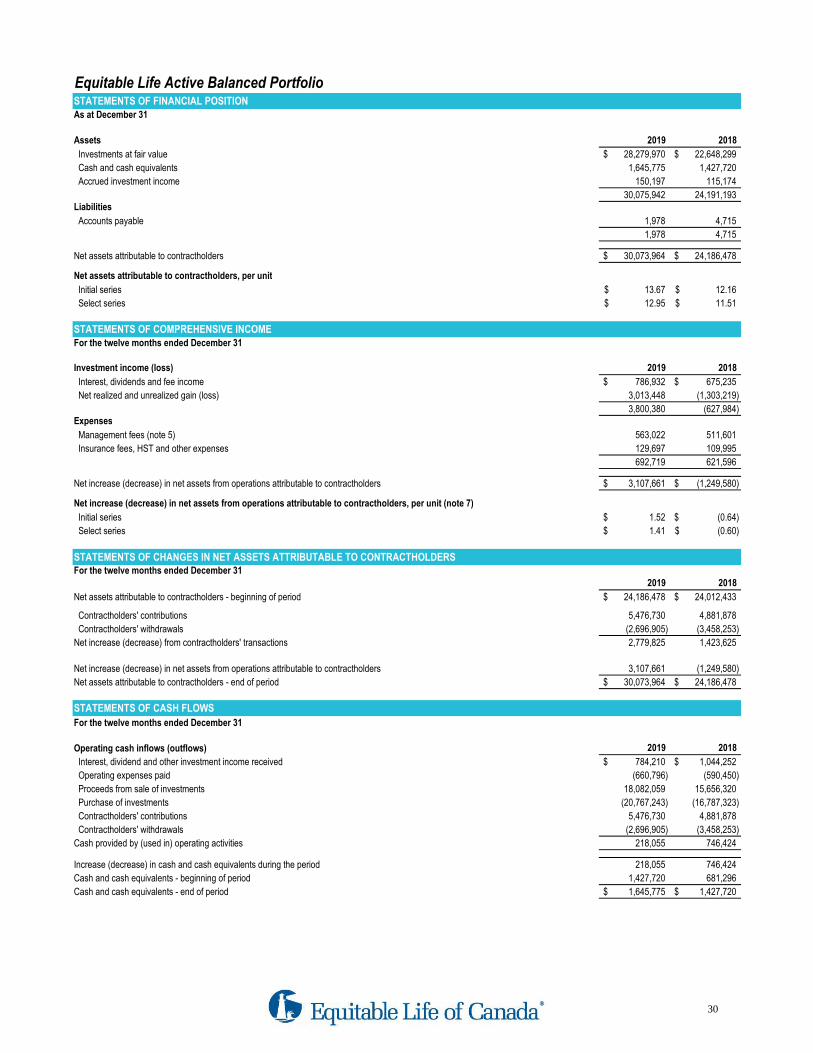
Equitable Life Active Balanced PortfolioSTATEMENTS OF FINANCIAL POSITIONAs at December 31
Assets 2019 2018
Investments at fair value 28,279,970$ 22,648,299$
Cash and cash equivalents 1,645,775 1,427,720
Accrued investment income 150,197 115,174
30,075,942 24,191,193 Liabilities
Accounts payable 1,978 4,715
1,978 4,715
Net assets attributable to contractholders 30,073,964$ 24,186,478$
Net assets attributable to contractholders, per unit
Initial series 13.67$ 12.16$
Select series 12.95$ 11.51$
STATEMENTS OF COMPREHENSIVE INCOMEFor the twelve months ended December 31
Investment income (loss) 2019 2018
Interest, dividends and fee income 786,932$ 675,235$
Net realized and unrealized gain (loss) 3,013,448 (1,303,219)
3,800,380 (627,984) Expenses
Management fees (note 5) 563,022 511,601
Insurance fees, HST and other expenses 129,697 109,995
692,719 621,596
Net increase (decrease) in net assets from operations attributable to contractholders 3,107,661$ (1,249,580)$
Net increase (decrease) in net assets from operations attributable to contractholders, per unit (note 7)
Initial series 1.52$ (0.64)$
Select series 1.41$ (0.60)$
STATEMENTS OF CHANGES IN NET ASSETS ATTRIBUTABLE TO CONTRACTHOLDERSFor the twelve months ended December 31
2019 2018
Net assets attributable to contractholders - beginning of period 24,186,478$ 24,012,433$
Contractholders' contributions 5,476,730 4,881,878
Contractholders' withdrawals (2,696,905) (3,458,253)
Net increase (decrease) from contractholders' transactions 2,779,825 1,423,625
Net increase (decrease) in net assets from operations attributable to contractholders 3,107,661 (1,249,580)
Net assets attributable to contractholders - end of period 30,073,964$ 24,186,478$
STATEMENTS OF CASH FLOWS
For the twelve months ended December 31
Operating cash inflows (outflows) 2019 2018
Interest, dividend and other investment income received 784,210$ 1,044,252$
Operating expenses paid (660,796) (590,450)
Proceeds from sale of investments 18,082,059 15,656,320
Purchase of investments (20,767,243) (16,787,323)
Contractholders' contributions 5,476,730 4,881,878
Contractholders' withdrawals (2,696,905) (3,458,253)
Cash provided by (used in) operating activities 218,055 746,424
Increase (decrease) in cash and cash equivalents during the period 218,055 746,424
Cash and cash equivalents - beginning of period 1,427,720 681,296
Cash and cash equivalents - end of period 1,645,775$ 1,427,720$
30

Equitable Life Active Balanced PortfolioANNUAL COMPOUND NET RETURNS - the following unaudited schedule is provided for Funds in existence for greater than 12 monthsAs at December 31
Since Inception
Date of inception 1 Year 3 Year 5 Year 10 Year (if <10 yrs)
Initial series January 2011 12.5% 4.1% 2.9% N/A 3.6%
Select series September 2013 12.5% 4.2% 3.0% N/A 4.2%
As at December 31¹
For the twelve months ended December 31² 2019 2019* 2018 2017 2016 2015
Net asset value per unit (Initial series)1$13.67 $12.16 $12.80 $12.12 $11.74
Net asset value per unit (Select series)1$12.95 $11.51 $12.12 $11.47 $11.09
Number of units outstanding (Initial series)1258,414 266,000 262,106 298,268 336,196
Number of units outstanding (Select series)12,049,391 1,819,867 1,704,942 1,395,228 306,025
Management expense ratio (Initial series)22.52% 2.54% 2.55% 2.55% 2.61% 2.67%
Management expense ratio (Select series)22.52% 2.54% 2.50% 2.50% 2.56% 2.61%
Net assets (000s)1$30,074 $24,186 $24,012 $19,610 $7,339
Portfolio turnover rate2 (note 6) 70.43% 66.38% 62.34% 109.06% 266.99%
* Represents the pro-forma management expense ratio as described in note 5.
For additional product or segregated fund information please refer to your contract and information folder.
FINANCIAL HIGHLIGHTS - the following unaudited schedule shows select key financial information about the Fund and is intended to help you
understand the Fund's financial performance for the past five years
31
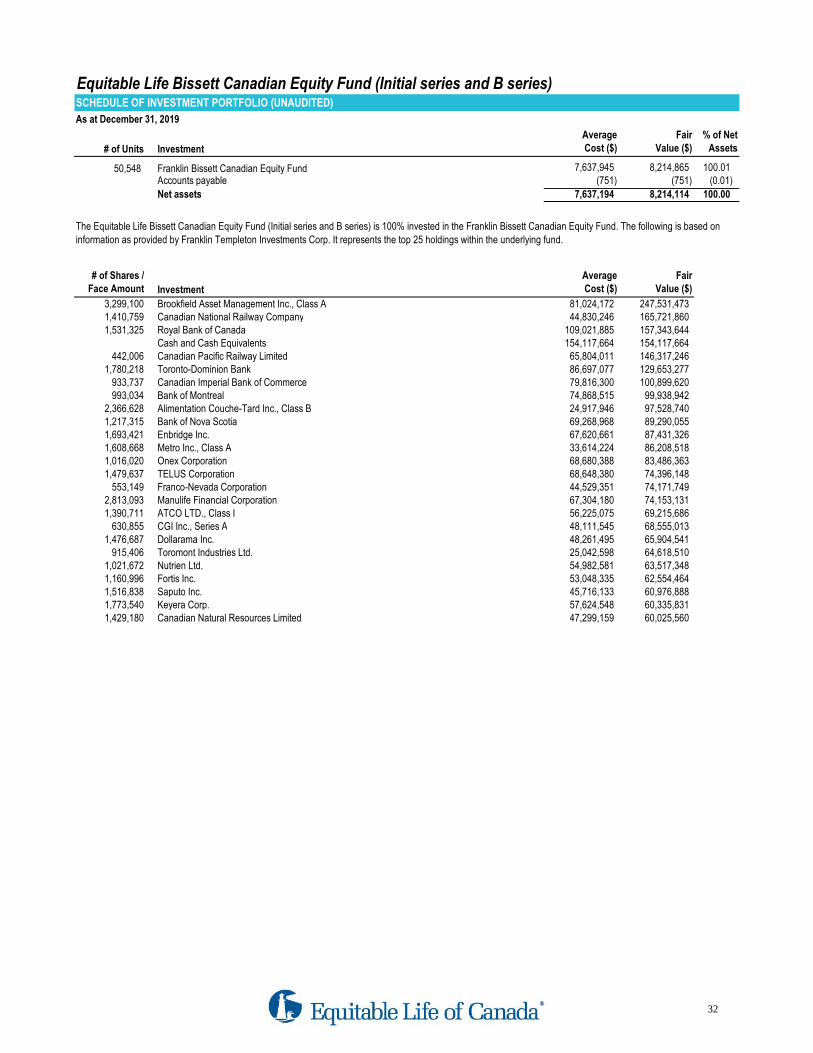
Equitable Life Bissett Canadian Equity Fund (Initial series and B series)SCHEDULE OF INVESTMENT PORTFOLIO (UNAUDITED)
As at December 31, 2019
# of Units Investment
Average
Cost ($)
Fair
Value ($)
% of Net
Assets
50,548 Franklin Bissett Canadian Equity Fund 7,637,945 8,214,865 100.01 Accounts payable (751) (751) (0.01)
Net assets 7,637,194 8,214,114 100.00
# of Shares /
Face Amount Investment
Average
Cost ($)
Fair
Value ($)
3,299,100 Brookfield Asset Management Inc., Class A 81,024,172 247,531,473 1,410,759 Canadian National Railway Company 44,830,246 165,721,860 1,531,325 Royal Bank of Canada 109,021,885 157,343,644
Cash and Cash Equivalents 154,117,664 154,117,664 442,006 Canadian Pacific Railway Limited 65,804,011 146,317,246
1,780,218 Toronto-Dominion Bank 86,697,077 129,653,277 933,737 Canadian Imperial Bank of Commerce 79,816,300 100,899,620 993,034 Bank of Montreal 74,868,515 99,938,942
2,366,628 Alimentation Couche-Tard Inc., Class B 24,917,946 97,528,740 1,217,315 Bank of Nova Scotia 69,268,968 89,290,055 1,693,421 Enbridge Inc. 67,620,661 87,431,326 1,608,668 Metro Inc., Class A 33,614,224 86,208,518 1,016,020 Onex Corporation 68,680,388 83,486,363 1,479,637 TELUS Corporation 68,648,380 74,396,148
553,149 Franco-Nevada Corporation 44,529,351 74,171,749 2,813,093 Manulife Financial Corporation 67,304,180 74,153,131 1,390,711 ATCO LTD., Class I 56,225,075 69,215,686
630,855 CGI Inc., Series A 48,111,545 68,555,013 1,476,687 Dollarama Inc. 48,261,495 65,904,541
915,406 Toromont Industries Ltd. 25,042,598 64,618,510 1,021,672 Nutrien Ltd. 54,982,581 63,517,348 1,160,996 Fortis Inc. 53,048,335 62,554,464 1,516,838 Saputo Inc. 45,716,133 60,976,888 1,773,540 Keyera Corp. 57,624,548 60,335,831 1,429,180 Canadian Natural Resources Limited 47,299,159 60,025,560
The Equitable Life Bissett Canadian Equity Fund (Initial series and B series) is 100% invested in the Franklin Bissett Canadian Equity Fund. The following is based on
information as provided by Franklin Templeton Investments Corp. It represents the top 25 holdings within the underlying fund.
32
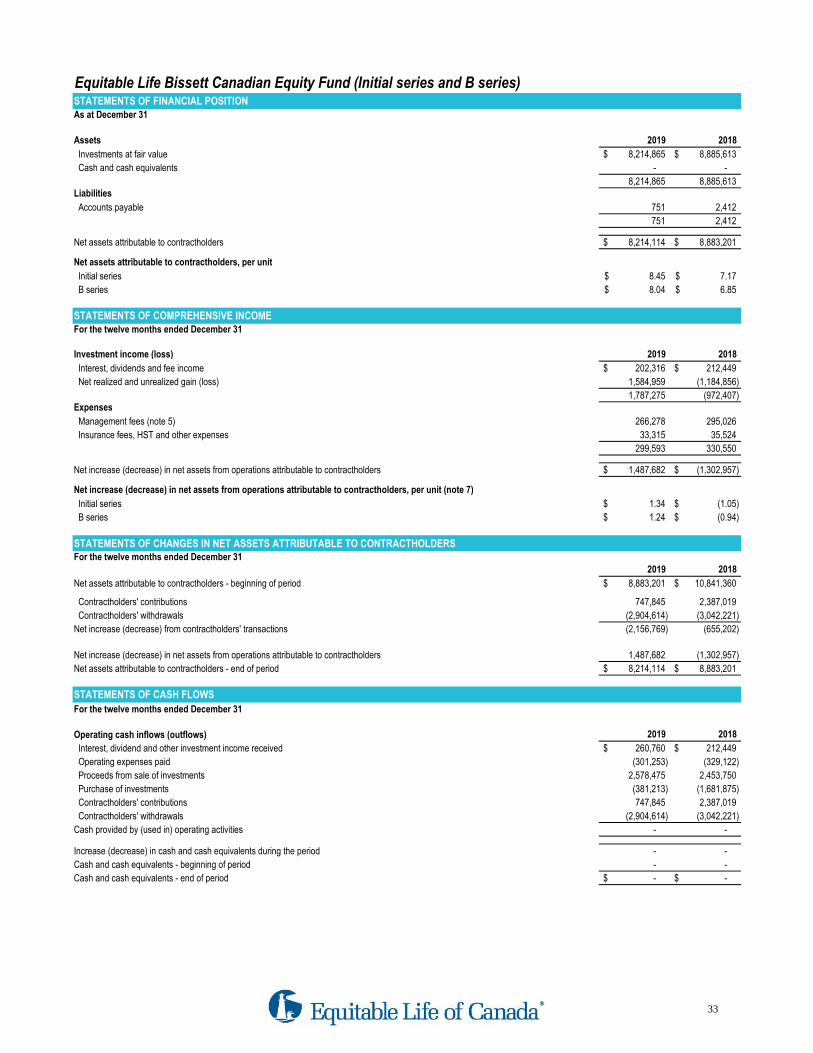
Equitable Life Bissett Canadian Equity Fund (Initial series and B series)STATEMENTS OF FINANCIAL POSITIONAs at December 31
Assets 2019 2018
Investments at fair value 8,214,865$ 8,885,613$
Cash and cash equivalents - -
8,214,865 8,885,613 Liabilities
Accounts payable 751 2,412
751 2,412
Net assets attributable to contractholders 8,214,114$ 8,883,201$
Net assets attributable to contractholders, per unit
Initial series 8.45$ 7.17$
B series 8.04$ 6.85$
STATEMENTS OF COMPREHENSIVE INCOMEFor the twelve months ended December 31
Investment income (loss) 2019 2018
Interest, dividends and fee income 202,316$ 212,449$
Net realized and unrealized gain (loss) 1,584,959 (1,184,856)
1,787,275 (972,407) Expenses
Management fees (note 5) 266,278 295,026
Insurance fees, HST and other expenses 33,315 35,524
299,593 330,550
Net increase (decrease) in net assets from operations attributable to contractholders 1,487,682$ (1,302,957)$
Net increase (decrease) in net assets from operations attributable to contractholders, per unit (note 7)
Initial series 1.34$ (1.05)$
B series 1.24$ (0.94)$
STATEMENTS OF CHANGES IN NET ASSETS ATTRIBUTABLE TO CONTRACTHOLDERSFor the twelve months ended December 31
2019 2018
Net assets attributable to contractholders - beginning of period 8,883,201$ 10,841,360$
Contractholders' contributions 747,845 2,387,019
Contractholders' withdrawals (2,904,614) (3,042,221)
Net increase (decrease) from contractholders' transactions (2,156,769) (655,202)
Net increase (decrease) in net assets from operations attributable to contractholders 1,487,682 (1,302,957)
Net assets attributable to contractholders - end of period 8,214,114$ 8,883,201$
STATEMENTS OF CASH FLOWS
For the twelve months ended December 31
Operating cash inflows (outflows) 2019 2018
Interest, dividend and other investment income received 260,760$ 212,449$
Operating expenses paid (301,253) (329,122)
Proceeds from sale of investments 2,578,475 2,453,750
Purchase of investments (381,213) (1,681,875)
Contractholders' contributions 747,845 2,387,019
Contractholders' withdrawals (2,904,614) (3,042,221)
Cash provided by (used in) operating activities - -
Increase (decrease) in cash and cash equivalents during the period - -
Cash and cash equivalents - beginning of period - -
Cash and cash equivalents - end of period -$ -$
33
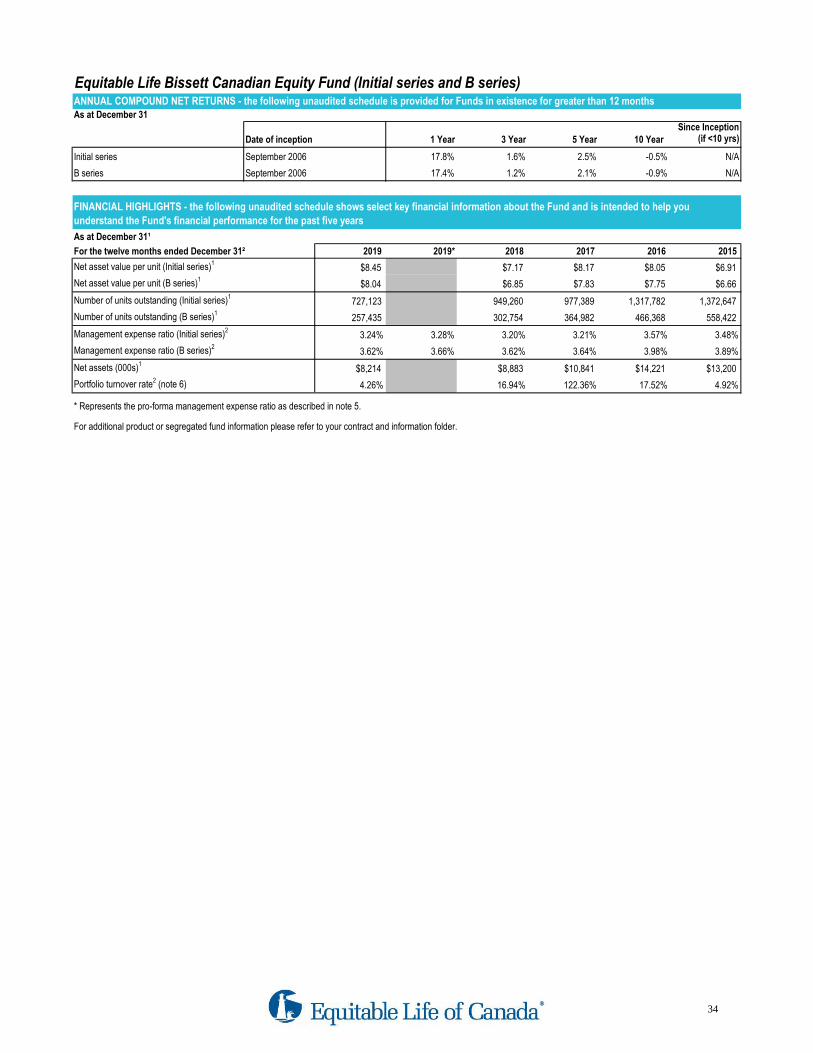
Equitable Life Bissett Canadian Equity Fund (Initial series and B series)ANNUAL COMPOUND NET RETURNS - the following unaudited schedule is provided for Funds in existence for greater than 12 monthsAs at December 31
Since Inception
Date of inception 1 Year 3 Year 5 Year 10 Year (if <10 yrs)
Initial series September 2006 17.8% 1.6% 2.5% -0.5% N/A
B series September 2006 17.4% 1.2% 2.1% -0.9% N/A
As at December 31¹
For the twelve months ended December 31² 2019 2019* 2018 2017 2016 2015
Net asset value per unit (Initial series)1$8.45 $7.17 $8.17 $8.05 $6.91
Net asset value per unit (B series)1$8.04 $6.85 $7.83 $7.75 $6.66
Number of units outstanding (Initial series)1727,123 949,260 977,389 1,317,782 1,372,647
Number of units outstanding (B series)1257,435 302,754 364,982 466,368 558,422
Management expense ratio (Initial series)23.24% 3.28% 3.20% 3.21% 3.57% 3.48%
Management expense ratio (B series)23.62% 3.66% 3.62% 3.64% 3.98% 3.89%
Net assets (000s)1$8,214 $8,883 $10,841 $14,221 $13,200
Portfolio turnover rate2 (note 6) 4.26% 16.94% 122.36% 17.52% 4.92%
* Represents the pro-forma management expense ratio as described in note 5.
For additional product or segregated fund information please refer to your contract and information folder.
FINANCIAL HIGHLIGHTS - the following unaudited schedule shows select key financial information about the Fund and is intended to help you
understand the Fund's financial performance for the past five years
34
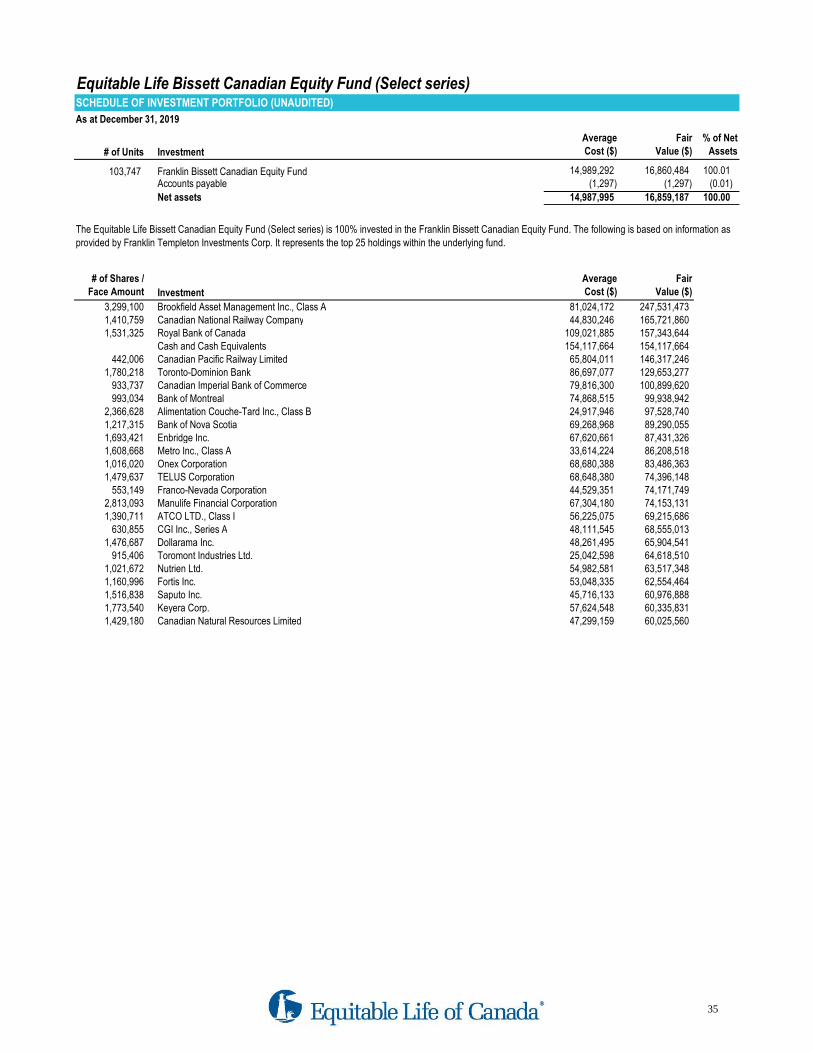
Equitable Life Bissett Canadian Equity Fund (Select series)SCHEDULE OF INVESTMENT PORTFOLIO (UNAUDITED)
As at December 31, 2019
# of Units Investment
Average
Cost ($)
Fair
Value ($)
% of Net
Assets
103,747 Franklin Bissett Canadian Equity Fund 14,989,292 16,860,484 100.01 Accounts payable (1,297) (1,297) (0.01)
Net assets 14,987,995 16,859,187 100.00
# of Shares /
Face Amount Investment
Average
Cost ($)
Fair
Value ($)
3,299,100 Brookfield Asset Management Inc., Class A 81,024,172 247,531,473 1,410,759 Canadian National Railway Company 44,830,246 165,721,860 1,531,325 Royal Bank of Canada 109,021,885 157,343,644
Cash and Cash Equivalents 154,117,664 154,117,664 442,006 Canadian Pacific Railway Limited 65,804,011 146,317,246
1,780,218 Toronto-Dominion Bank 86,697,077 129,653,277 933,737 Canadian Imperial Bank of Commerce 79,816,300 100,899,620 993,034 Bank of Montreal 74,868,515 99,938,942
2,366,628 Alimentation Couche-Tard Inc., Class B 24,917,946 97,528,740 1,217,315 Bank of Nova Scotia 69,268,968 89,290,055 1,693,421 Enbridge Inc. 67,620,661 87,431,326 1,608,668 Metro Inc., Class A 33,614,224 86,208,518 1,016,020 Onex Corporation 68,680,388 83,486,363 1,479,637 TELUS Corporation 68,648,380 74,396,148
553,149 Franco-Nevada Corporation 44,529,351 74,171,749 2,813,093 Manulife Financial Corporation 67,304,180 74,153,131 1,390,711 ATCO LTD., Class I 56,225,075 69,215,686
630,855 CGI Inc., Series A 48,111,545 68,555,013 1,476,687 Dollarama Inc. 48,261,495 65,904,541
915,406 Toromont Industries Ltd. 25,042,598 64,618,510 1,021,672 Nutrien Ltd. 54,982,581 63,517,348 1,160,996 Fortis Inc. 53,048,335 62,554,464 1,516,838 Saputo Inc. 45,716,133 60,976,888 1,773,540 Keyera Corp. 57,624,548 60,335,831 1,429,180 Canadian Natural Resources Limited 47,299,159 60,025,560
The Equitable Life Bissett Canadian Equity Fund (Select series) is 100% invested in the Franklin Bissett Canadian Equity Fund. The following is based on information as
provided by Franklin Templeton Investments Corp. It represents the top 25 holdings within the underlying fund.
35

Equitable Life Bissett Canadian Equity Fund (Select series)STATEMENTS OF FINANCIAL POSITIONAs at December 31
Assets 2019 2018
Investments at fair value 16,860,484$ 15,054,269$
Cash and cash equivalents - -
16,860,484 15,054,269 Liabilities
Accounts payable 1,297 3,442
1,297 3,442
Net assets attributable to contractholders 16,859,187$ 15,050,827$
Net assets attributable to contractholders, per unit
Select series 13.87$ 11.72$
STATEMENTS OF COMPREHENSIVE INCOMEFor the twelve months ended December 31
Investment income (loss) 2019 2018
Interest, dividends and fee income 408,999$ 357,719$
Net realized and unrealized gain (loss) 2,802,918 (1,958,624)
3,211,917 (1,600,905) Expenses
Management fees (note 5) 408,374 405,782
Insurance fees, HST and other expenses 58,037 57,022
466,411 462,804
Net increase (decrease) in net assets from operations attributable to contractholders 2,745,506$ (2,063,709)$
Net increase (decrease) in net assets from operations attributable to contractholders, per unit (note 7)
Select series 2.18$ (1.61)$
STATEMENTS OF CHANGES IN NET ASSETS ATTRIBUTABLE TO CONTRACTHOLDERSFor the twelve months ended December 31
2019 2018
Net assets attributable to contractholders - beginning of period 15,050,827$ 17,853,049$
Contractholders' contributions 3,894,650 3,365,445
Contractholders' withdrawals (4,831,796) (4,103,958)
Net increase (decrease) from contractholders' transactions (937,146) (738,513)
Net increase (decrease) in net assets from operations attributable to contractholders 2,745,506 (2,063,709)
Net assets attributable to contractholders - end of period 16,859,187$ 15,050,827$
STATEMENTS OF CASH FLOWS
For the twelve months ended December 31
Operating cash inflows (outflows) 2019 2018
Interest, dividend and other investment income received 527,151$ 357,719$
Operating expenses paid (468,557) (460,718)
Proceeds from sale of investments 3,176,120 2,867,008
Purchase of investments (2,297,568) (2,025,496)
Contractholders' contributions 3,894,650 3,365,445
Contractholders' withdrawals (4,831,796) (4,103,958)
Cash provided by (used in) operating activities - -
Increase (decrease) in cash and cash equivalents during the period - -
Cash and cash equivalents - beginning of period - -
Cash and cash equivalents - end of period -$ -$
36

Equitable Life Bissett Canadian Equity Fund (Select series)ANNUAL COMPOUND NET RETURNS - the following unaudited schedule is provided for Funds in existence for greater than 12 monthsAs at December 31
Since Inception
Date of inception 1 Year 3 Year 5 Year 10 Year (if <10 yrs)
Select series September 2013 18.3% 2.7% 3.4% N/A 5.4%
As at December 31¹
For the twelve months ended December 31² 2019 2019* 2018 2017 2016 2015
Net asset value per unit (Select series)1$13.87 $11.72 $13.29 $12.80 $10.62
Number of units outstanding (Select series)11,215,624 1,283,788 1,342,951 814,135 588,486
Management expense ratio (Select series)22.80% 2.82% 2.78% 2.77% 2.77% 2.77%
Net assets (000s)1$16,859 $15,051 $17,853 $10,419 $6,249
Portfolio turnover rate2 (note 6) 13.88% 12.29% 6.30% 15.87% 22.24%
* Represents the pro-forma management expense ratio as described in note 5.
For additional product or segregated fund information please refer to your contract and information folder.
FINANCIAL HIGHLIGHTS - the following unaudited schedule shows select key financial information about the Fund and is intended to help you
understand the Fund's financial performance for the past five years
37
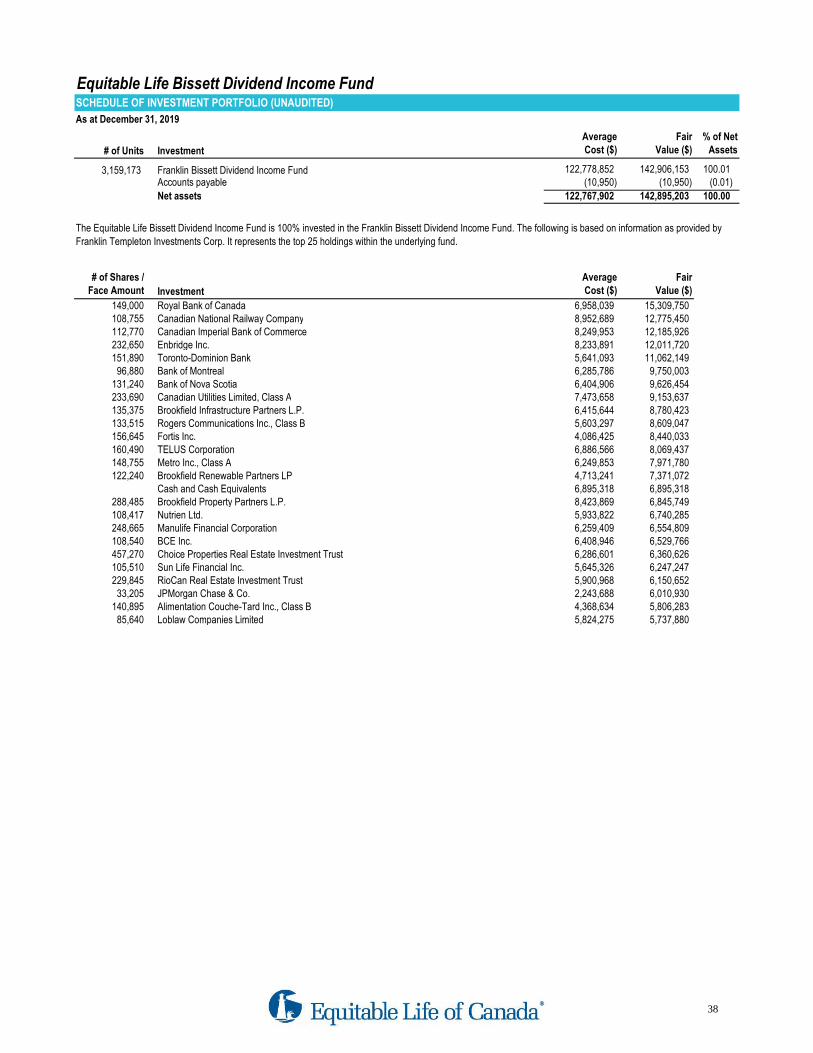
Equitable Life Bissett Dividend Income FundSCHEDULE OF INVESTMENT PORTFOLIO (UNAUDITED)
As at December 31, 2019
# of Units Investment
Average
Cost ($)
Fair
Value ($)
% of Net
Assets
3,159,173 Franklin Bissett Dividend Income Fund 122,778,852 142,906,153 100.01 Accounts payable (10,950) (10,950) (0.01)
Net assets 122,767,902 142,895,203 100.00
# of Shares /
Face Amount Investment
Average
Cost ($)
Fair
Value ($)
149,000 Royal Bank of Canada 6,958,039 15,309,750 108,755 Canadian National Railway Company 8,952,689 12,775,450 112,770 Canadian Imperial Bank of Commerce 8,249,953 12,185,926 232,650 Enbridge Inc. 8,233,891 12,011,720 151,890 Toronto-Dominion Bank 5,641,093 11,062,149
96,880 Bank of Montreal 6,285,786 9,750,003 131,240 Bank of Nova Scotia 6,404,906 9,626,454 233,690 Canadian Utilities Limited, Class A 7,473,658 9,153,637 135,375 Brookfield Infrastructure Partners L.P. 6,415,644 8,780,423 133,515 Rogers Communications Inc., Class B 5,603,297 8,609,047 156,645 Fortis Inc. 4,086,425 8,440,033 160,490 TELUS Corporation 6,886,566 8,069,437 148,755 Metro Inc., Class A 6,249,853 7,971,780 122,240 Brookfield Renewable Partners LP 4,713,241 7,371,072
Cash and Cash Equivalents 6,895,318 6,895,318 288,485 Brookfield Property Partners L.P. 8,423,869 6,845,749 108,417 Nutrien Ltd. 5,933,822 6,740,285 248,665 Manulife Financial Corporation 6,259,409 6,554,809 108,540 BCE Inc. 6,408,946 6,529,766 457,270 Choice Properties Real Estate Investment Trust 6,286,601 6,360,626 105,510 Sun Life Financial Inc. 5,645,326 6,247,247 229,845 RioCan Real Estate Investment Trust 5,900,968 6,150,652
33,205 JPMorgan Chase & Co. 2,243,688 6,010,930 140,895 Alimentation Couche-Tard Inc., Class B 4,368,634 5,806,283
85,640 Loblaw Companies Limited 5,824,275 5,737,880
The Equitable Life Bissett Dividend Income Fund is 100% invested in the Franklin Bissett Dividend Income Fund. The following is based on information as provided by
Franklin Templeton Investments Corp. It represents the top 25 holdings within the underlying fund.
38
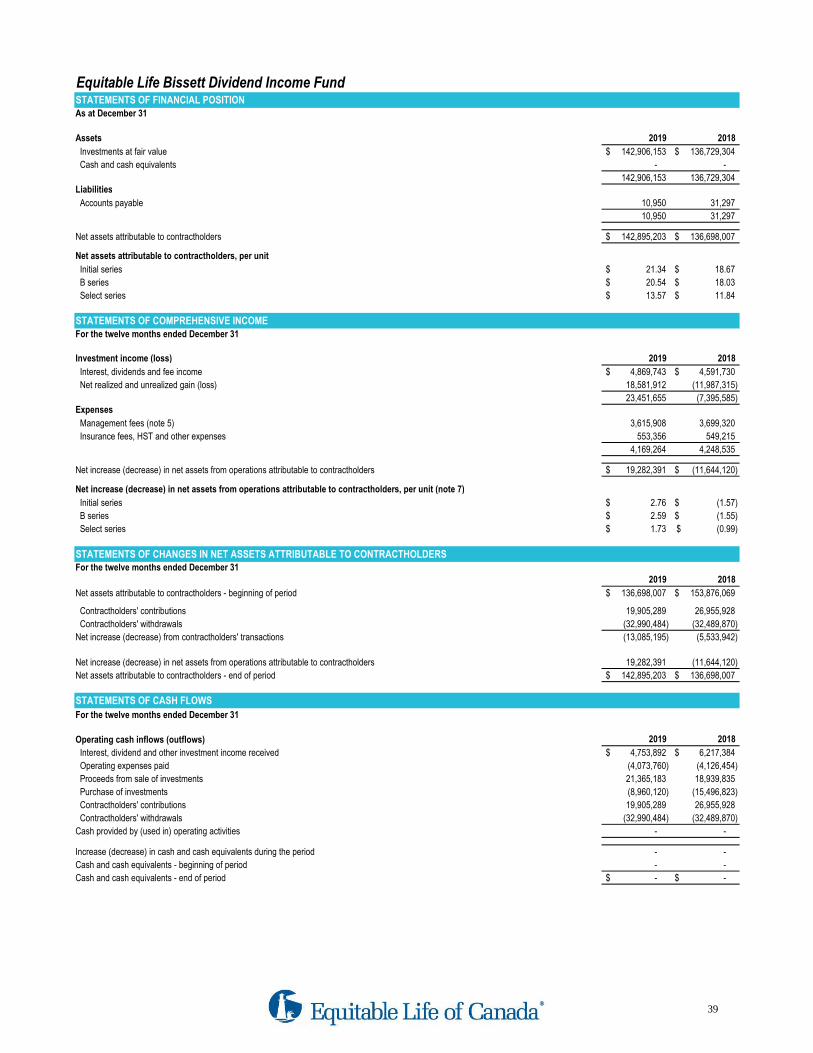
Equitable Life Bissett Dividend Income FundSTATEMENTS OF FINANCIAL POSITIONAs at December 31
Assets 2019 2018
Investments at fair value 142,906,153$ 136,729,304$
Cash and cash equivalents - -
142,906,153 136,729,304 Liabilities
Accounts payable 10,950 31,297
10,950 31,297
Net assets attributable to contractholders 142,895,203$ 136,698,007$
Net assets attributable to contractholders, per unit
Initial series 21.34$ 18.67$
B series 20.54$ 18.03$
Select series 13.57$ 11.84$
STATEMENTS OF COMPREHENSIVE INCOMEFor the twelve months ended December 31
Investment income (loss) 2019 2018
Interest, dividends and fee income 4,869,743$ 4,591,730$
Net realized and unrealized gain (loss) 18,581,912 (11,987,315)
23,451,655 (7,395,585) Expenses
Management fees (note 5) 3,615,908 3,699,320
Insurance fees, HST and other expenses 553,356 549,215
4,169,264 4,248,535
Net increase (decrease) in net assets from operations attributable to contractholders 19,282,391$ (11,644,120)$
Net increase (decrease) in net assets from operations attributable to contractholders, per unit (note 7)
Initial series 2.76$ (1.57)$
B series 2.59$ (1.55)$
Select series 1.73$ (0.99)$
STATEMENTS OF CHANGES IN NET ASSETS ATTRIBUTABLE TO CONTRACTHOLDERSFor the twelve months ended December 31
2019 2018
Net assets attributable to contractholders - beginning of period 136,698,007$ 153,876,069$
Contractholders' contributions 19,905,289 26,955,928
Contractholders' withdrawals (32,990,484) (32,489,870)
Net increase (decrease) from contractholders' transactions (13,085,195) (5,533,942)
Net increase (decrease) in net assets from operations attributable to contractholders 19,282,391 (11,644,120)
Net assets attributable to contractholders - end of period 142,895,203$ 136,698,007$
STATEMENTS OF CASH FLOWS
For the twelve months ended December 31
Operating cash inflows (outflows) 2019 2018
Interest, dividend and other investment income received 4,753,892$ 6,217,384$
Operating expenses paid (4,073,760) (4,126,454)
Proceeds from sale of investments 21,365,183 18,939,835
Purchase of investments (8,960,120) (15,496,823)
Contractholders' contributions 19,905,289 26,955,928
Contractholders' withdrawals (32,990,484) (32,489,870)
Cash provided by (used in) operating activities - -
Increase (decrease) in cash and cash equivalents during the period - -
Cash and cash equivalents - beginning of period - -
Cash and cash equivalents - end of period -$ -$
39
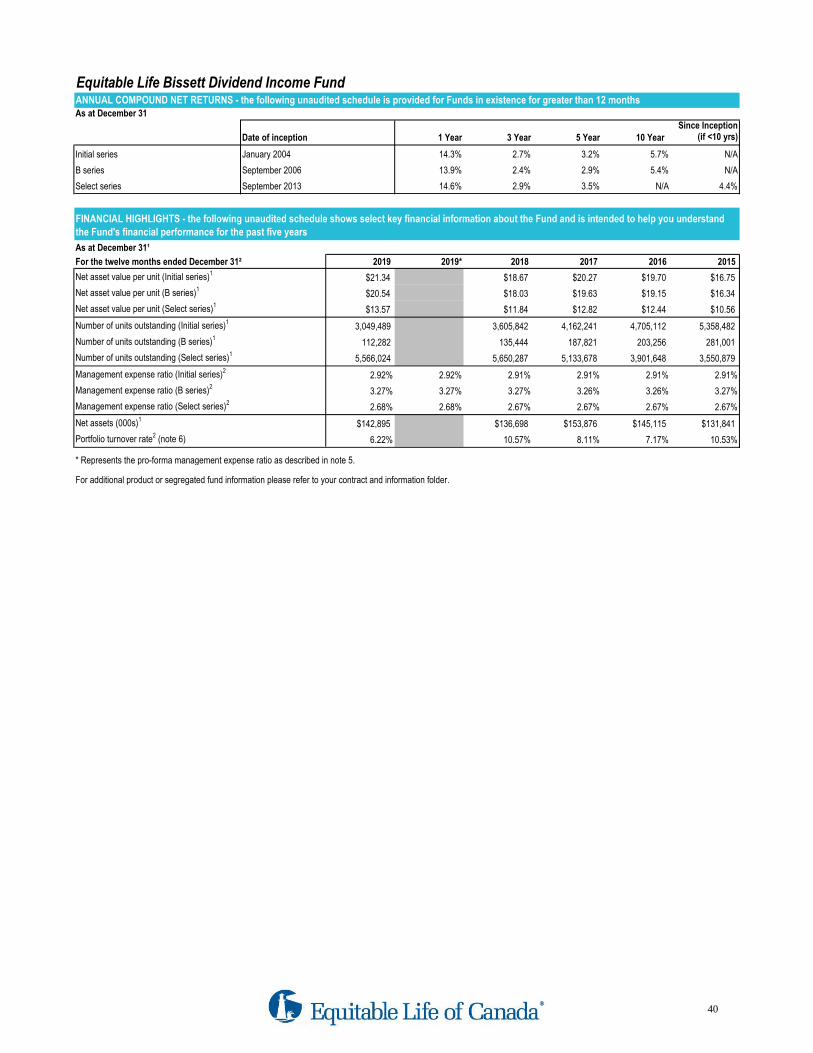
Equitable Life Bissett Dividend Income FundANNUAL COMPOUND NET RETURNS - the following unaudited schedule is provided for Funds in existence for greater than 12 monthsAs at December 31
Since Inception
Date of inception 1 Year 3 Year 5 Year 10 Year (if <10 yrs)
Initial series January 2004 14.3% 2.7% 3.2% 5.7% N/A
B series September 2006 13.9% 2.4% 2.9% 5.4% N/A
Select series September 2013 14.6% 2.9% 3.5% N/A 4.4%
As at December 31¹
For the twelve months ended December 31² 2019 2019* 2018 2017 2016 2015
Net asset value per unit (Initial series)1$21.34 $18.67 $20.27 $19.70 $16.75
Net asset value per unit (B series)1$20.54 $18.03 $19.63 $19.15 $16.34
Net asset value per unit (Select series)1$13.57 $11.84 $12.82 $12.44 $10.56
Number of units outstanding (Initial series)13,049,489 3,605,842 4,162,241 4,705,112 5,358,482
Number of units outstanding (B series)1112,282 135,444 187,821 203,256 281,001
Number of units outstanding (Select series)15,566,024 5,650,287 5,133,678 3,901,648 3,550,879
Management expense ratio (Initial series)22.92% 2.92% 2.91% 2.91% 2.91% 2.91%
Management expense ratio (B series)23.27% 3.27% 3.27% 3.26% 3.26% 3.27%
Management expense ratio (Select series)22.68% 2.68% 2.67% 2.67% 2.67% 2.67%
Net assets (000s)1$142,895 $136,698 $153,876 $145,115 $131,841
Portfolio turnover rate2 (note 6) 6.22% 10.57% 8.11% 7.17% 10.53%
* Represents the pro-forma management expense ratio as described in note 5.
For additional product or segregated fund information please refer to your contract and information folder.
FINANCIAL HIGHLIGHTS - the following unaudited schedule shows select key financial information about the Fund and is intended to help you understand
the Fund's financial performance for the past five years
40
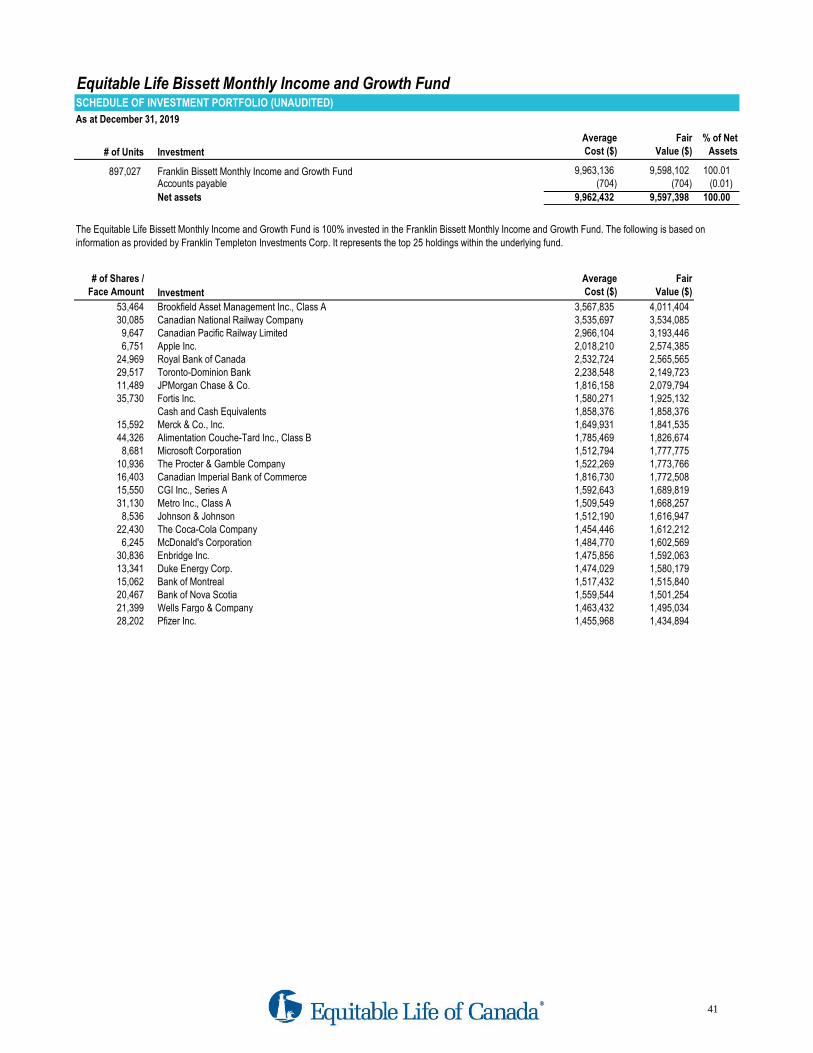
Equitable Life Bissett Monthly Income and Growth FundSCHEDULE OF INVESTMENT PORTFOLIO (UNAUDITED)
As at December 31, 2019
# of Units Investment
Average
Cost ($)
Fair
Value ($)
% of Net
Assets
897,027 Franklin Bissett Monthly Income and Growth Fund 9,963,136 9,598,102 100.01 Accounts payable (704) (704) (0.01)
Net assets 9,962,432 9,597,398 100.00
# of Shares /
Face Amount Investment
Average
Cost ($)
Fair
Value ($)
53,464 Brookfield Asset Management Inc., Class A 3,567,835 4,011,404 30,085 Canadian National Railway Company 3,535,697 3,534,085
9,647 Canadian Pacific Railway Limited 2,966,104 3,193,446 6,751 Apple Inc. 2,018,210 2,574,385
24,969 Royal Bank of Canada 2,532,724 2,565,565 29,517 Toronto-Dominion Bank 2,238,548 2,149,723 11,489 JPMorgan Chase & Co. 1,816,158 2,079,794 35,730 Fortis Inc. 1,580,271 1,925,132
Cash and Cash Equivalents 1,858,376 1,858,376 15,592 Merck & Co., Inc. 1,649,931 1,841,535 44,326 Alimentation Couche-Tard Inc., Class B 1,785,469 1,826,674
8,681 Microsoft Corporation 1,512,794 1,777,775 10,936 The Procter & Gamble Company 1,522,269 1,773,766 16,403 Canadian Imperial Bank of Commerce 1,816,730 1,772,508 15,550 CGI Inc., Series A 1,592,643 1,689,819 31,130 Metro Inc., Class A 1,509,549 1,668,257
8,536 Johnson & Johnson 1,512,190 1,616,947 22,430 The Coca-Cola Company 1,454,446 1,612,212
6,245 McDonald's Corporation 1,484,770 1,602,569 30,836 Enbridge Inc. 1,475,856 1,592,063 13,341 Duke Energy Corp. 1,474,029 1,580,179 15,062 Bank of Montreal 1,517,432 1,515,840 20,467 Bank of Nova Scotia 1,559,544 1,501,254 21,399 Wells Fargo & Company 1,463,432 1,495,034 28,202 Pfizer Inc. 1,455,968 1,434,894
The Equitable Life Bissett Monthly Income and Growth Fund is 100% invested in the Franklin Bissett Monthly Income and Growth Fund. The following is based on
information as provided by Franklin Templeton Investments Corp. It represents the top 25 holdings within the underlying fund.
41

Equitable Life Bissett Monthly Income and Growth FundSTATEMENTS OF FINANCIAL POSITIONAs at December 31
Assets 2019 2018
Investments at fair value 9,598,102$ 8,033,623$
Cash and cash equivalents - -
9,598,102 8,033,623 Liabilities
Accounts payable 704 1,753
704 1,753
Net assets attributable to contractholders 9,597,398$ 8,031,870$
Net assets attributable to contractholders, per unit
Select series 9.62$ 8.68$
STATEMENTS OF COMPREHENSIVE INCOMEFor the twelve months ended December 31
Investment income (loss) 2019 2018
Interest, dividends and fee income 378,092$ 297,140$
Net realized and unrealized gain (loss) 761,257 (333,927)
1,139,349 (36,787) Expenses
Management fees (note 5) 212,389 193,648
Insurance fees, HST and other expenses 33,302 30,469
245,691 224,117
Net increase (decrease) in net assets from operations attributable to contractholders 893,658$ (260,904)$
Net increase (decrease) in net assets from operations attributable to contractholders, per unit (note 7)
Select series 0.93$ (0.29)$
STATEMENTS OF CHANGES IN NET ASSETS ATTRIBUTABLE TO CONTRACTHOLDERSFor the twelve months ended December 31
2019 2018
Net assets attributable to contractholders - beginning of period 8,031,870$ 8,387,819$
Contractholders' contributions 2,128,201 2,249,305
Contractholders' withdrawals (1,456,331) (2,344,350)
Net increase (decrease) from contractholders' transactions 671,870 (95,045)
Net increase (decrease) in net assets from operations attributable to contractholders 893,658 (260,904)
Net assets attributable to contractholders - end of period 9,597,398$ 8,031,870$
STATEMENTS OF CASH FLOWS
For the twelve months ended December 31
Operating cash inflows (outflows) 2019 2018
Interest, dividend and other investment income received 575,714$ 433,208$
Operating expenses paid (239,073) (215,480)
Proceeds from sale of investments 997,424 1,578,232
Purchase of investments (2,005,935) (1,700,185)
Contractholders' contributions 2,128,201 2,249,305
Contractholders' withdrawals (1,456,331) (2,344,350)
Cash provided by (used in) operating activities - 730
Increase (decrease) in cash and cash equivalents during the period - 730
Cash and cash equivalents - beginning of period - (730)
Cash and cash equivalents - end of period -$ -$
42
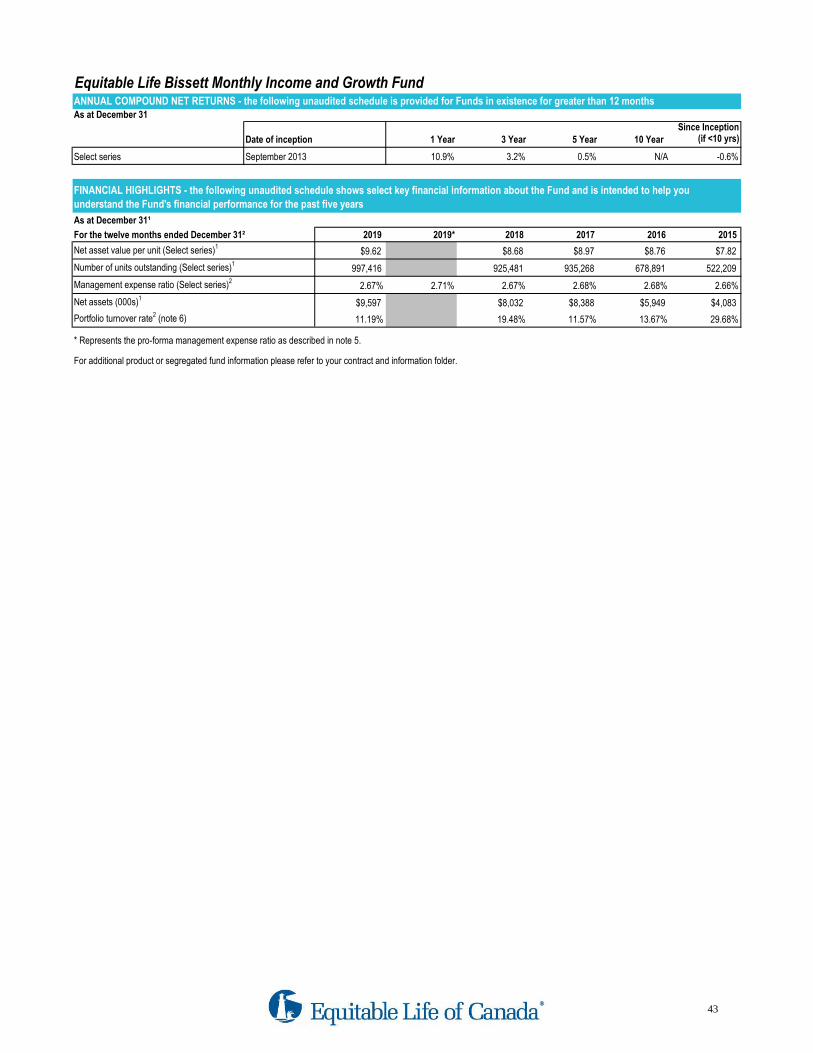
Equitable Life Bissett Monthly Income and Growth FundANNUAL COMPOUND NET RETURNS - the following unaudited schedule is provided for Funds in existence for greater than 12 monthsAs at December 31
Since Inception
Date of inception 1 Year 3 Year 5 Year 10 Year (if <10 yrs)
Select series September 2013 10.9% 3.2% 0.5% N/A -0.6%
As at December 31¹
For the twelve months ended December 31² 2019 2019* 2018 2017 2016 2015
Net asset value per unit (Select series)1$9.62 $8.68 $8.97 $8.76 $7.82
Number of units outstanding (Select series)1997,416 925,481 935,268 678,891 522,209
Management expense ratio (Select series)22.67% 2.71% 2.67% 2.68% 2.68% 2.66%
Net assets (000s)1$9,597 $8,032 $8,388 $5,949 $4,083
Portfolio turnover rate2 (note 6) 11.19% 19.48% 11.57% 13.67% 29.68%
* Represents the pro-forma management expense ratio as described in note 5.
For additional product or segregated fund information please refer to your contract and information folder.
FINANCIAL HIGHLIGHTS - the following unaudited schedule shows select key financial information about the Fund and is intended to help you
understand the Fund's financial performance for the past five years
43

Equitable Life Dynamic American FundSCHEDULE OF INVESTMENT PORTFOLIO (UNAUDITED)
As at December 31, 2019
# of Units Investment
Average
Cost ($)
Fair
Value ($)
% of Net
Assets
7,232,298 Dynamic American Fund 97,632,966 97,491,374 100.01 Accounts payable (8,285) (8,285) (0.01)
Net assets 97,624,681 97,483,089 100.00
# of Shares /
Face Amount Investment
Average
Cost ($)
Fair
Value ($)
217,300 Microsoft Corporation 34,859,135 44,428,755 219,400 JPMorgan Chase & Co. 35,368,983 39,652,642 832,100 Bank of America Corporation 36,530,617 37,995,976 187,500 Danaher Corporation 32,300,595 37,310,046
21,200 Alphabet Inc., Class A 37,182,107 36,814,223 128,700 Raytheon Company 35,896,203 36,665,735 274,400 Keysight Technologies Inc. 35,817,457 36,511,625
89,000 MasterCard Incorporated, Class A 29,804,415 34,453,869 108,600 NVIDIA Corporation 30,044,720 33,130,232 246,000 NIKE Inc., Class B 30,328,077 32,311,725 102,200 Moody's Corporation 28,883,708 31,457,386
72,500 Thermo Fisher Scientific Inc. 29,092,164 30,536,576 123,600 Visa Inc., Class A 29,871,852 30,110,501 380,200 Applied Materials, Inc. 30,099,848 30,088,419
97,600 Air Products and Chemicals, Inc. 30,597,708 29,735,273 38,900 Sherwin-Williams Company 27,492,313 29,430,183
261,100 Abbott Laboratories 29,381,591 29,403,527 146,700 Kansas City Southern 29,919,770 29,130,517 110,300 Rockwell Automation, Inc. 29,736,374 28,982,624 152,000 The Walt Disney Company 28,518,382 28,501,958
83,400 MSCI Inc. 29,140,679 27,916,526 137,100 Zoetis Inc. 21,921,876 23,525,243 197,500 Merck & Co., Inc. 23,095,966 23,288,554
Cash, Cash Equivalents, and Other Assets 1,569,091 1,569,091
The Equitable Life Dynamic American Fund is 100% invested in the Dynamic American Fund. The following is based on information as provided by 1832 Asset
Management L.P. This fund has 24 holdings.
44
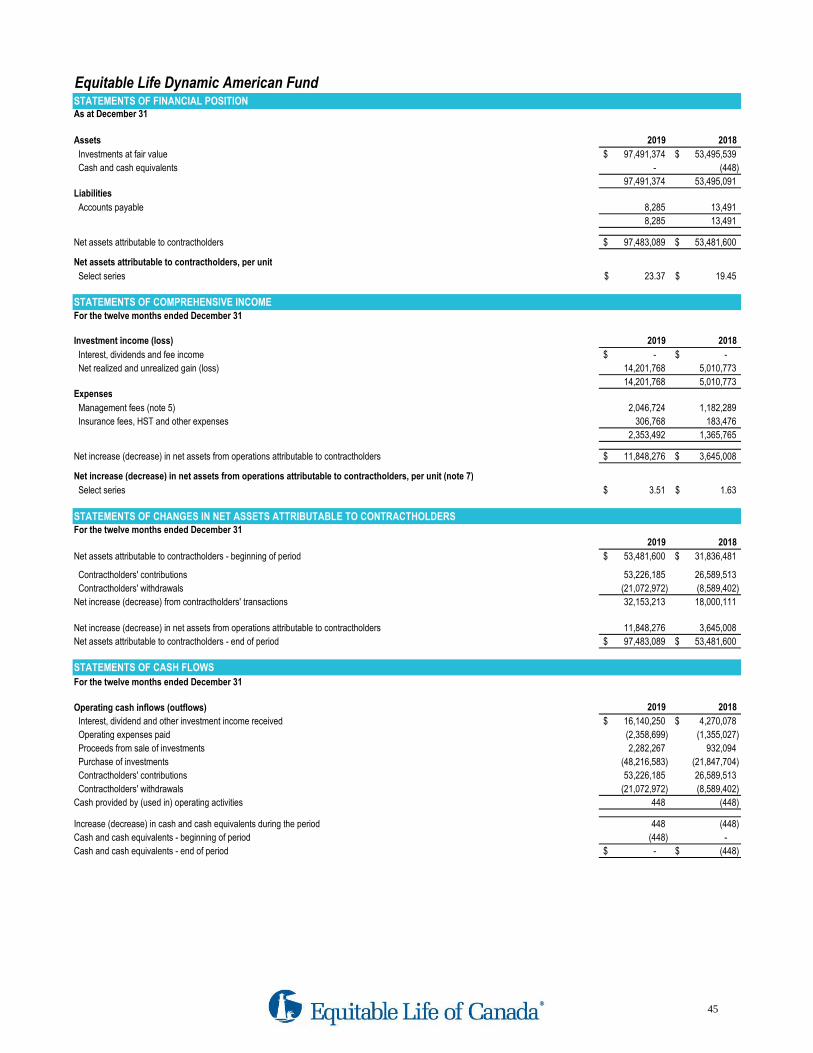
Equitable Life Dynamic American FundSTATEMENTS OF FINANCIAL POSITIONAs at December 31
Assets 2019 2018
Investments at fair value 97,491,374$ 53,495,539$
Cash and cash equivalents - (448)
97,491,374 53,495,091 Liabilities
Accounts payable 8,285 13,491
8,285 13,491
Net assets attributable to contractholders 97,483,089$ 53,481,600$
Net assets attributable to contractholders, per unit
Select series 23.37$ 19.45$
STATEMENTS OF COMPREHENSIVE INCOMEFor the twelve months ended December 31
Investment income (loss) 2019 2018
Interest, dividends and fee income -$ -$
Net realized and unrealized gain (loss) 14,201,768 5,010,773
14,201,768 5,010,773 Expenses
Management fees (note 5) 2,046,724 1,182,289
Insurance fees, HST and other expenses 306,768 183,476
2,353,492 1,365,765
Net increase (decrease) in net assets from operations attributable to contractholders 11,848,276$ 3,645,008$
Net increase (decrease) in net assets from operations attributable to contractholders, per unit (note 7)
Select series 3.51$ 1.63$
STATEMENTS OF CHANGES IN NET ASSETS ATTRIBUTABLE TO CONTRACTHOLDERSFor the twelve months ended December 31
2019 2018
Net assets attributable to contractholders - beginning of period 53,481,600$ 31,836,481$
Contractholders' contributions 53,226,185 26,589,513
Contractholders' withdrawals (21,072,972) (8,589,402)
Net increase (decrease) from contractholders' transactions 32,153,213 18,000,111
Net increase (decrease) in net assets from operations attributable to contractholders 11,848,276 3,645,008
Net assets attributable to contractholders - end of period 97,483,089$ 53,481,600$
STATEMENTS OF CASH FLOWS
For the twelve months ended December 31
Operating cash inflows (outflows) 2019 2018
Interest, dividend and other investment income received 16,140,250$ 4,270,078$
Operating expenses paid (2,358,699) (1,355,027)
Proceeds from sale of investments 2,282,267 932,094
Purchase of investments (48,216,583) (21,847,704)
Contractholders' contributions 53,226,185 26,589,513
Contractholders' withdrawals (21,072,972) (8,589,402)
Cash provided by (used in) operating activities 448 (448)
Increase (decrease) in cash and cash equivalents during the period 448 (448)
Cash and cash equivalents - beginning of period (448) -
Cash and cash equivalents - end of period -$ (448)$
45

Equitable Life Dynamic American FundANNUAL COMPOUND NET RETURNS - the following unaudited schedule is provided for Funds in existence for greater than 12 monthsAs at December 31
Since Inception
Date of inception 1 Year 3 Year 5 Year 10 Year (if <10 yrs)
Select series September 2013 20.1% 14.3% 12.6% N/A 14.5%
As at December 31¹
For the twelve months ended December 31² 2019 2019* 2018 2017 2016 2015
Net asset value per unit (Select series)1$23.37 $19.45 $17.29 $15.64 $15.05
Number of units outstanding (Select series)14,171,214 2,749,223 1,841,848 1,211,670 910,558
Management expense ratio (Select series)23.14% 3.14% 3.17% 3.18% 3.18% 3.18%
Net assets (000s)1$97,483 $53,482 $31,836 $18,955 $13,700
Portfolio turnover rate2 (note 6) 3.00% 2.13% 7.29% 18.91% 10.69%
* Represents the pro-forma management expense ratio as described in note 5.
For additional product or segregated fund information please refer to your contract and information folder.
FINANCIAL HIGHLIGHTS - the following unaudited schedule shows select key financial information about the Fund and is intended to help you
understand the Fund's financial performance for the past five years
46
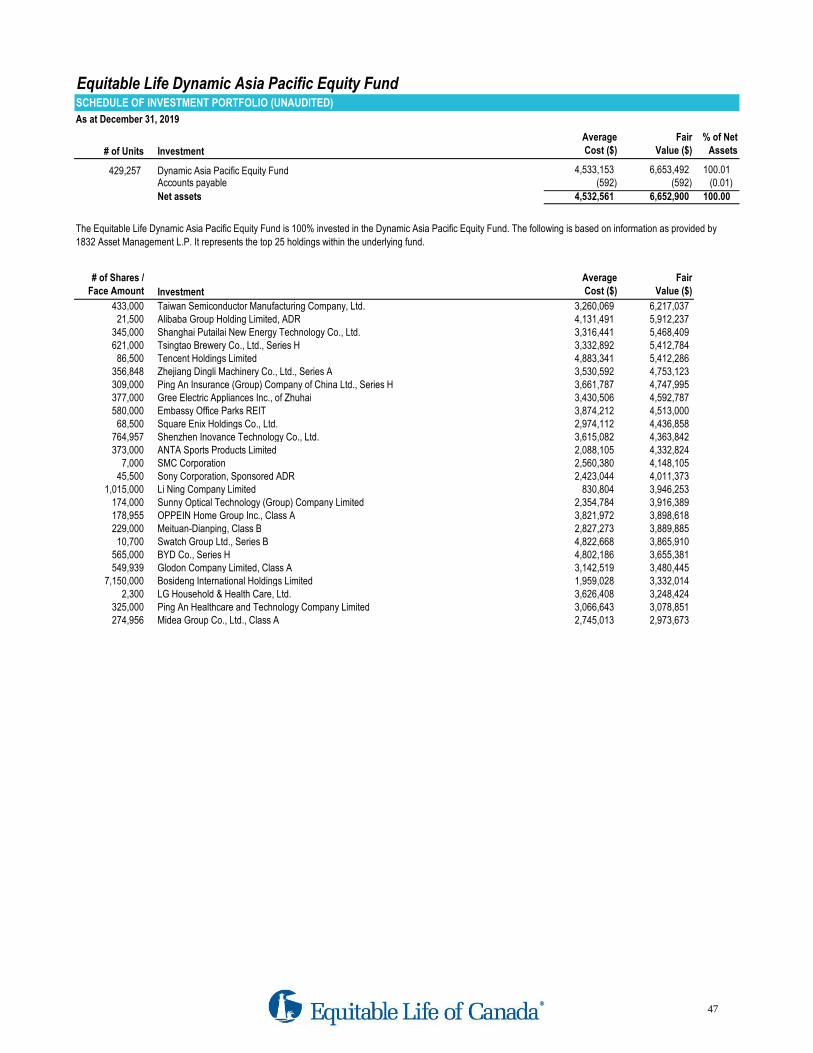
Equitable Life Dynamic Asia Pacific Equity FundSCHEDULE OF INVESTMENT PORTFOLIO (UNAUDITED)
As at December 31, 2019
# of Units Investment
Average
Cost ($)
Fair
Value ($)
% of Net
Assets
429,257 Dynamic Asia Pacific Equity Fund 4,533,153 6,653,492 100.01 Accounts payable (592) (592) (0.01)
Net assets 4,532,561 6,652,900 100.00
# of Shares /
Face Amount Investment
Average
Cost ($)
Fair
Value ($)
433,000 Taiwan Semiconductor Manufacturing Company, Ltd. 3,260,069 6,217,037 21,500 Alibaba Group Holding Limited, ADR 4,131,491 5,912,237
345,000 Shanghai Putailai New Energy Technology Co., Ltd. 3,316,441 5,468,409 621,000 Tsingtao Brewery Co., Ltd., Series H 3,332,892 5,412,784
86,500 Tencent Holdings Limited 4,883,341 5,412,286 356,848 Zhejiang Dingli Machinery Co., Ltd., Series A 3,530,592 4,753,123 309,000 Ping An Insurance (Group) Company of China Ltd., Series H 3,661,787 4,747,995 377,000 Gree Electric Appliances Inc., of Zhuhai 3,430,506 4,592,787 580,000 Embassy Office Parks REIT 3,874,212 4,513,000
68,500 Square Enix Holdings Co., Ltd. 2,974,112 4,436,858 764,957 Shenzhen Inovance Technology Co., Ltd. 3,615,082 4,363,842 373,000 ANTA Sports Products Limited 2,088,105 4,332,824
7,000 SMC Corporation 2,560,380 4,148,105 45,500 Sony Corporation, Sponsored ADR 2,423,044 4,011,373
1,015,000 Li Ning Company Limited 830,804 3,946,253 174,000 Sunny Optical Technology (Group) Company Limited 2,354,784 3,916,389 178,955 OPPEIN Home Group Inc., Class A 3,821,972 3,898,618 229,000 Meituan-Dianping, Class B 2,827,273 3,889,885
10,700 Swatch Group Ltd., Series B 4,822,668 3,865,910 565,000 BYD Co., Series H 4,802,186 3,655,381 549,939 Glodon Company Limited, Class A 3,142,519 3,480,445
7,150,000 Bosideng International Holdings Limited 1,959,028 3,332,014 2,300 LG Household & Health Care, Ltd. 3,626,408 3,248,424
325,000 Ping An Healthcare and Technology Company Limited 3,066,643 3,078,851 274,956 Midea Group Co., Ltd., Class A 2,745,013 2,973,673
The Equitable Life Dynamic Asia Pacific Equity Fund is 100% invested in the Dynamic Asia Pacific Equity Fund. The following is based on information as provided by
1832 Asset Management L.P. It represents the top 25 holdings within the underlying fund.
47
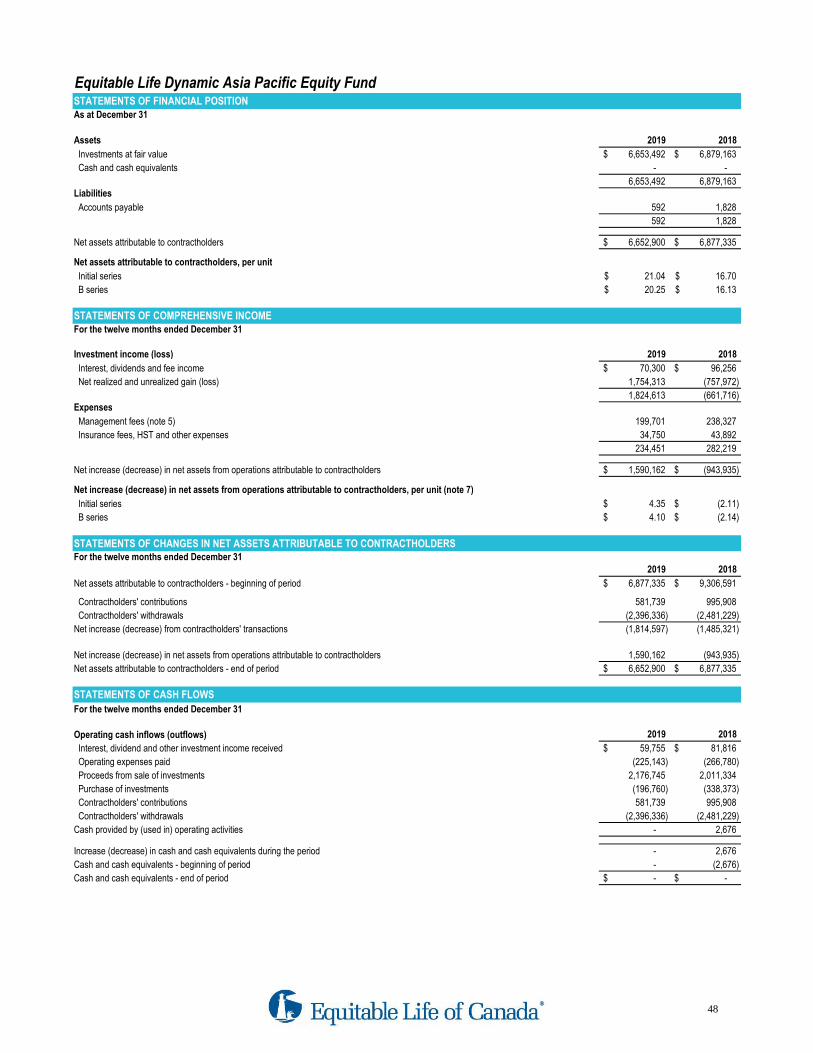
Equitable Life Dynamic Asia Pacific Equity FundSTATEMENTS OF FINANCIAL POSITIONAs at December 31
Assets 2019 2018
Investments at fair value 6,653,492$ 6,879,163$
Cash and cash equivalents - -
6,653,492 6,879,163 Liabilities
Accounts payable 592 1,828
592 1,828
Net assets attributable to contractholders 6,652,900$ 6,877,335$
Net assets attributable to contractholders, per unit
Initial series 21.04$ 16.70$
B series 20.25$ 16.13$
STATEMENTS OF COMPREHENSIVE INCOMEFor the twelve months ended December 31
Investment income (loss) 2019 2018
Interest, dividends and fee income 70,300$ 96,256$
Net realized and unrealized gain (loss) 1,754,313 (757,972)
1,824,613 (661,716) Expenses
Management fees (note 5) 199,701 238,327
Insurance fees, HST and other expenses 34,750 43,892
234,451 282,219
Net increase (decrease) in net assets from operations attributable to contractholders 1,590,162$ (943,935)$
Net increase (decrease) in net assets from operations attributable to contractholders, per unit (note 7)
Initial series 4.35$ (2.11)$
B series 4.10$ (2.14)$
STATEMENTS OF CHANGES IN NET ASSETS ATTRIBUTABLE TO CONTRACTHOLDERSFor the twelve months ended December 31
2019 2018
Net assets attributable to contractholders - beginning of period 6,877,335$ 9,306,591$
Contractholders' contributions 581,739 995,908
Contractholders' withdrawals (2,396,336) (2,481,229)
Net increase (decrease) from contractholders' transactions (1,814,597) (1,485,321)
Net increase (decrease) in net assets from operations attributable to contractholders 1,590,162 (943,935)
Net assets attributable to contractholders - end of period 6,652,900$ 6,877,335$
STATEMENTS OF CASH FLOWS
For the twelve months ended December 31
Operating cash inflows (outflows) 2019 2018
Interest, dividend and other investment income received 59,755$ 81,816$
Operating expenses paid (225,143) (266,780)
Proceeds from sale of investments 2,176,745 2,011,334
Purchase of investments (196,760) (338,373)
Contractholders' contributions 581,739 995,908
Contractholders' withdrawals (2,396,336) (2,481,229)
Cash provided by (used in) operating activities - 2,676
Increase (decrease) in cash and cash equivalents during the period - 2,676
Cash and cash equivalents - beginning of period - (2,676)
Cash and cash equivalents - end of period -$ -$
48

Equitable Life Dynamic Asia Pacific Equity FundANNUAL COMPOUND NET RETURNS - the following unaudited schedule is provided for Funds in existence for greater than 12 monthsAs at December 31
Since Inception
Date of inception 1 Year 3 Year 5 Year 10 Year (if <10 yrs)
Initial series September 2006 26.0% 11.8% 7.0% 6.7% N/A
B series September 2006 25.6% 11.4% 6.7% 6.3% N/A
As at December 31¹
For the twelve months ended December 31² 2019 2019* 2018 2017 2016 2015
Net asset value per unit (Initial series)1$21.04 $16.70 $19.01 $15.05 $16.07
Net asset value per unit (B series)1$20.25 $16.13 $18.41 $14.63 $15.69
Number of units outstanding (Initial series)1275,900 359,304 429,495 548,959 661,046
Number of units outstanding (B series)141,836 54,317 62,128 77,521 91,418
Management expense ratio (Initial series)23.27% 3.32% 3.29% 3.29% 3.29% 3.28%
Management expense ratio (B series)23.68% 3.73% 3.67% 3.67% 3.68% 3.67%
Net assets (000s)1$6,653 $6,877 $9,307 $9,398 $12,058
Portfolio turnover rate2 (note 6) 2.84% 4.11% 11.59% 10.32% 12.60%
* Represents the pro-forma management expense ratio as described in note 5.
For additional product or segregated fund information please refer to your contract and information folder.
FINANCIAL HIGHLIGHTS - the following unaudited schedule shows select key financial information about the Fund and is intended to help you
understand the Fund's financial performance for the past five years
49
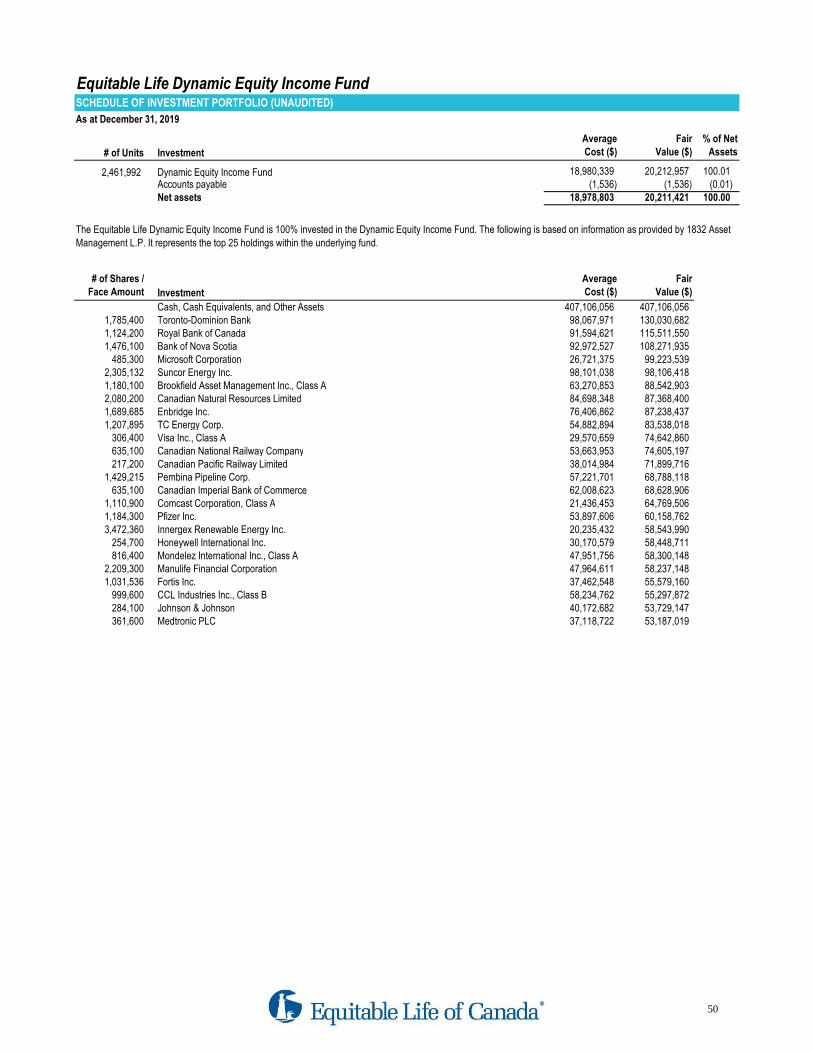
Equitable Life Dynamic Equity Income FundSCHEDULE OF INVESTMENT PORTFOLIO (UNAUDITED)
As at December 31, 2019
# of Units Investment
Average
Cost ($)
Fair
Value ($)
% of Net
Assets
2,461,992 Dynamic Equity Income Fund 18,980,339 20,212,957 100.01 Accounts payable (1,536) (1,536) (0.01) Net assets 18,978,803 20,211,421 100.00
# of Shares /
Face Amount Investment
Average
Cost ($)
Fair
Value ($)
Cash, Cash Equivalents, and Other Assets 407,106,056 407,106,056 1,785,400 Toronto-Dominion Bank 98,067,971 130,030,682 1,124,200 Royal Bank of Canada 91,594,621 115,511,550 1,476,100 Bank of Nova Scotia 92,972,527 108,271,935
485,300 Microsoft Corporation 26,721,375 99,223,539 2,305,132 Suncor Energy Inc. 98,101,038 98,106,418 1,180,100 Brookfield Asset Management Inc., Class A 63,270,853 88,542,903 2,080,200 Canadian Natural Resources Limited 84,698,348 87,368,400 1,689,685 Enbridge Inc. 76,406,862 87,238,437 1,207,895 TC Energy Corp. 54,882,894 83,538,018
306,400 Visa Inc., Class A 29,570,659 74,642,860 635,100 Canadian National Railway Company 53,663,953 74,605,197 217,200 Canadian Pacific Railway Limited 38,014,984 71,899,716
1,429,215 Pembina Pipeline Corp. 57,221,701 68,788,118 635,100 Canadian Imperial Bank of Commerce 62,008,623 68,628,906
1,110,900 Comcast Corporation, Class A 21,436,453 64,769,506 1,184,300 Pfizer Inc. 53,897,606 60,158,762 3,472,360 Innergex Renewable Energy Inc. 20,235,432 58,543,990
254,700 Honeywell International Inc. 30,170,579 58,448,711 816,400 Mondelez International Inc., Class A 47,951,756 58,300,148
2,209,300 Manulife Financial Corporation 47,964,611 58,237,148 1,031,536 Fortis Inc. 37,462,548 55,579,160
999,600 CCL Industries Inc., Class B 58,234,762 55,297,872 284,100 Johnson & Johnson 40,172,682 53,729,147 361,600 Medtronic PLC 37,118,722 53,187,019
The Equitable Life Dynamic Equity Income Fund is 100% invested in the Dynamic Equity Income Fund. The following is based on information as provided by 1832 Asset
Management L.P. It represents the top 25 holdings within the underlying fund.
50
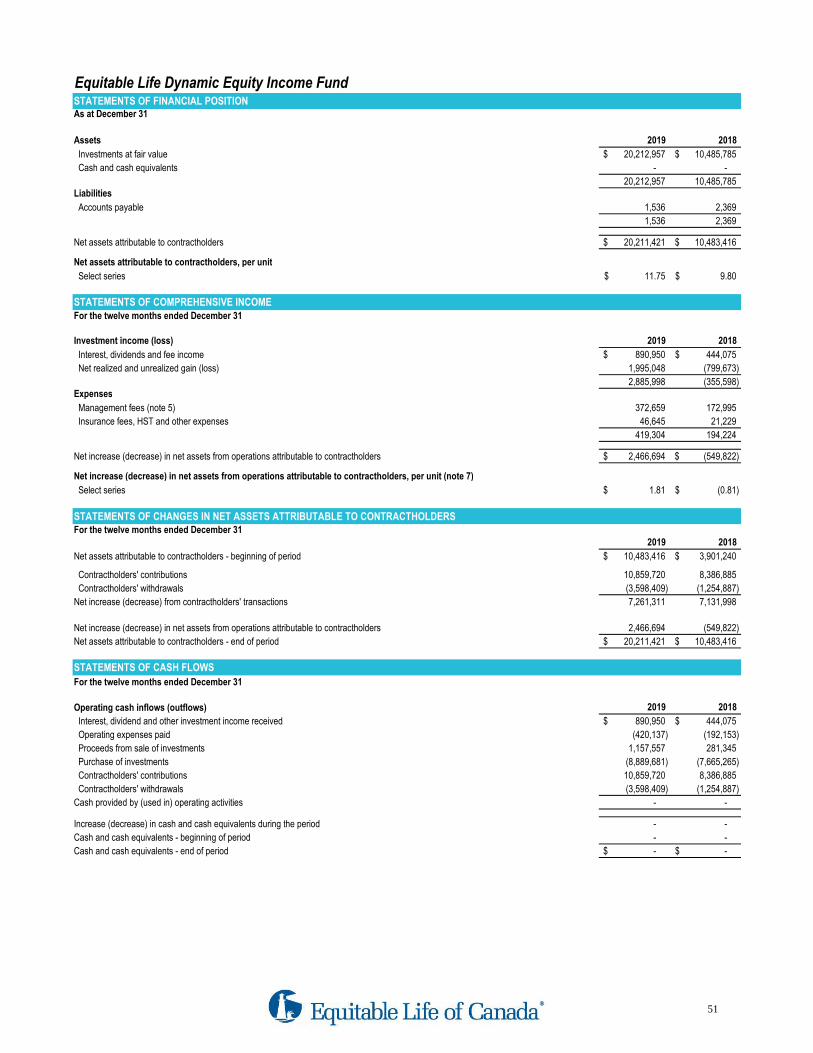
Equitable Life Dynamic Equity Income FundSTATEMENTS OF FINANCIAL POSITIONAs at December 31
Assets 2019 2018
Investments at fair value 20,212,957$ 10,485,785$
Cash and cash equivalents - -
20,212,957 10,485,785 Liabilities
Accounts payable 1,536 2,369
1,536 2,369
Net assets attributable to contractholders 20,211,421$ 10,483,416$
Net assets attributable to contractholders, per unit
Select series 11.75$ 9.80$
STATEMENTS OF COMPREHENSIVE INCOMEFor the twelve months ended December 31
Investment income (loss) 2019 2018
Interest, dividends and fee income 890,950$ 444,075$
Net realized and unrealized gain (loss) 1,995,048 (799,673)
2,885,998 (355,598) Expenses
Management fees (note 5) 372,659 172,995
Insurance fees, HST and other expenses 46,645 21,229
419,304 194,224
Net increase (decrease) in net assets from operations attributable to contractholders 2,466,694$ (549,822)$
Net increase (decrease) in net assets from operations attributable to contractholders, per unit (note 7)
Select series 1.81$ (0.81)$
STATEMENTS OF CHANGES IN NET ASSETS ATTRIBUTABLE TO CONTRACTHOLDERSFor the twelve months ended December 31
2019 2018
Net assets attributable to contractholders - beginning of period 10,483,416$ 3,901,240$
Contractholders' contributions 10,859,720 8,386,885
Contractholders' withdrawals (3,598,409) (1,254,887)
Net increase (decrease) from contractholders' transactions 7,261,311 7,131,998
Net increase (decrease) in net assets from operations attributable to contractholders 2,466,694 (549,822)
Net assets attributable to contractholders - end of period 20,211,421$ 10,483,416$
STATEMENTS OF CASH FLOWS
For the twelve months ended December 31
Operating cash inflows (outflows) 2019 2018
Interest, dividend and other investment income received 890,950$ 444,075$
Operating expenses paid (420,137) (192,153)
Proceeds from sale of investments 1,157,557 281,345
Purchase of investments (8,889,681) (7,665,265)
Contractholders' contributions 10,859,720 8,386,885
Contractholders' withdrawals (3,598,409) (1,254,887)
Cash provided by (used in) operating activities - -
Increase (decrease) in cash and cash equivalents during the period - -
Cash and cash equivalents - beginning of period - -
Cash and cash equivalents - end of period -$ -$
51

Equitable Life Dynamic Equity Income FundANNUAL COMPOUND NET RETURNS - the following unaudited schedule is provided for Funds in existence for greater than 12 monthsAs at December 31
Since Inception
Date of inception 1 Year 3 Year 5 Year 10 Year (if <10 yrs)
Select series May 2017 19.9% N/A N/A N/A 6.4%
As at December 31¹
For the twelve months ended December 31² 2019 2019* 2018 2017 2016 2015
Net asset value per unit (Select series)1$11.75 $9.80 $10.38 N/A N/A
Number of units outstanding (Select series)11,720,243 1,069,953 375,988 N/A N/A
Management expense ratio (Select series)22.80% 2.82% 2.81% 2.80% N/A N/A
Net assets (000s)1$20,211 $10,483 $3,901 N/A N/A
Portfolio turnover rate2 (note 6) 7.66% 4.00% 5.46% N/A N/A
* Represents the pro-forma management expense ratio as described in note 5.
For additional product or segregated fund information please refer to your contract and information folder.
FINANCIAL HIGHLIGHTS - the following unaudited schedule shows select key financial information about the Fund and is intended to help you
understand the Fund's financial performance for the past five years
52
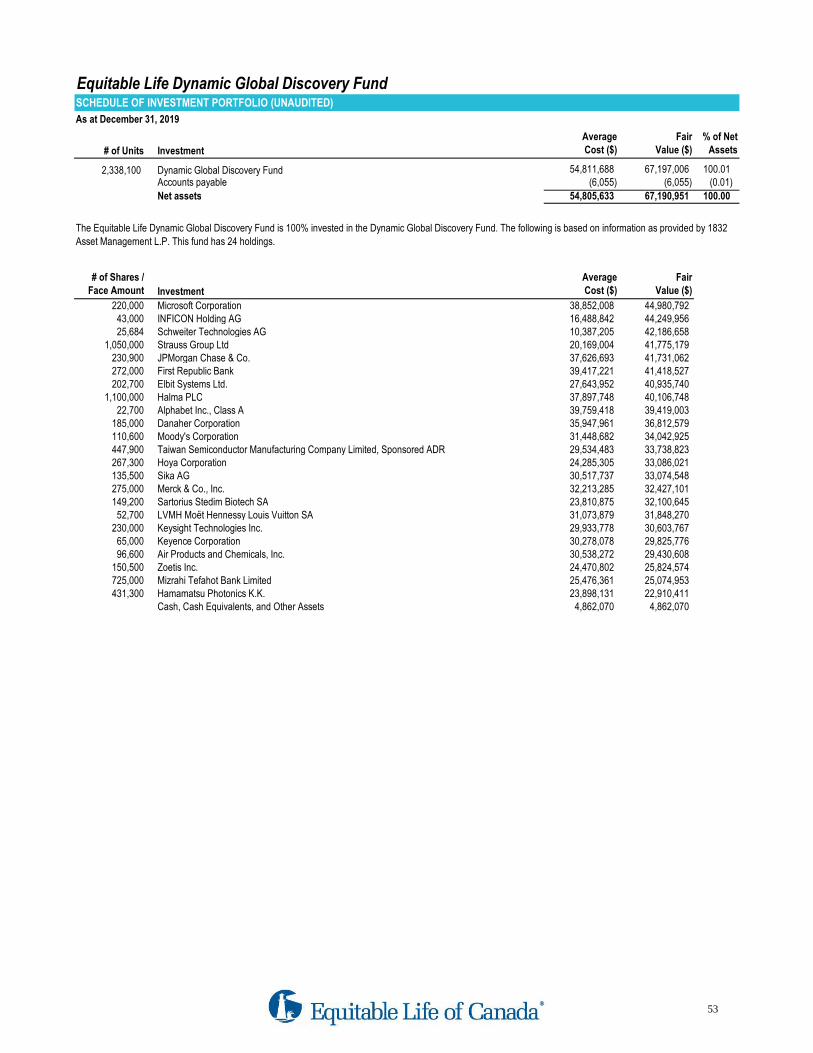
Equitable Life Dynamic Global Discovery FundSCHEDULE OF INVESTMENT PORTFOLIO (UNAUDITED)
As at December 31, 2019
# of Units Investment
Average
Cost ($)
Fair
Value ($)
% of Net
Assets
2,338,100 Dynamic Global Discovery Fund 54,811,688 67,197,006 100.01 Accounts payable (6,055) (6,055) (0.01)
Net assets 54,805,633 67,190,951 100.00
# of Shares /
Face Amount Investment
Average
Cost ($)
Fair
Value ($)
220,000 Microsoft Corporation 38,852,008 44,980,792 43,000 INFICON Holding AG 16,488,842 44,249,956 25,684 Schweiter Technologies AG 10,387,205 42,186,658
1,050,000 Strauss Group Ltd 20,169,004 41,775,179 230,900 JPMorgan Chase & Co. 37,626,693 41,731,062 272,000 First Republic Bank 39,417,221 41,418,527 202,700 Elbit Systems Ltd. 27,643,952 40,935,740
1,100,000 Halma PLC 37,897,748 40,106,748 22,700 Alphabet Inc., Class A 39,759,418 39,419,003
185,000 Danaher Corporation 35,947,961 36,812,579 110,600 Moody's Corporation 31,448,682 34,042,925 447,900 Taiwan Semiconductor Manufacturing Company Limited, Sponsored ADR 29,534,483 33,738,823 267,300 Hoya Corporation 24,285,305 33,086,021 135,500 Sika AG 30,517,737 33,074,548 275,000 Merck & Co., Inc. 32,213,285 32,427,101 149,200 Sartorius Stedim Biotech SA 23,810,875 32,100,645
52,700 LVMH Moët Hennessy Louis Vuitton SA 31,073,879 31,848,270 230,000 Keysight Technologies Inc. 29,933,778 30,603,767
65,000 Keyence Corporation 30,278,078 29,825,776 96,600 Air Products and Chemicals, Inc. 30,538,272 29,430,608
150,500 Zoetis Inc. 24,470,802 25,824,574 725,000 Mizrahi Tefahot Bank Limited 25,476,361 25,074,953 431,300 Hamamatsu Photonics K.K. 23,898,131 22,910,411
Cash, Cash Equivalents, and Other Assets 4,862,070 4,862,070
The Equitable Life Dynamic Global Discovery Fund is 100% invested in the Dynamic Global Discovery Fund. The following is based on information as provided by 1832
Asset Management L.P. This fund has 24 holdings.
53
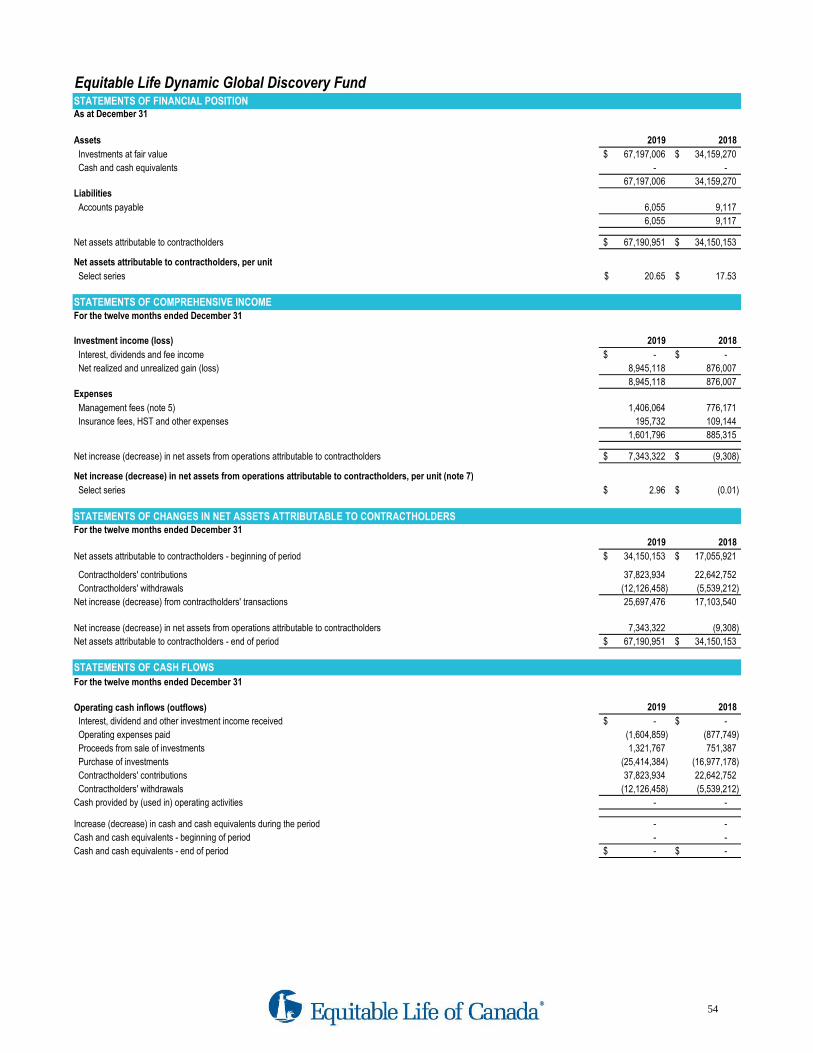
Equitable Life Dynamic Global Discovery FundSTATEMENTS OF FINANCIAL POSITIONAs at December 31
Assets 2019 2018
Investments at fair value 67,197,006$ 34,159,270$
Cash and cash equivalents - -
67,197,006 34,159,270 Liabilities
Accounts payable 6,055 9,117
6,055 9,117
Net assets attributable to contractholders 67,190,951$ 34,150,153$
Net assets attributable to contractholders, per unit
Select series 20.65$ 17.53$
STATEMENTS OF COMPREHENSIVE INCOMEFor the twelve months ended December 31
Investment income (loss) 2019 2018
Interest, dividends and fee income -$ -$
Net realized and unrealized gain (loss) 8,945,118 876,007
8,945,118 876,007 Expenses
Management fees (note 5) 1,406,064 776,171
Insurance fees, HST and other expenses 195,732 109,144
1,601,796 885,315
Net increase (decrease) in net assets from operations attributable to contractholders 7,343,322$ (9,308)$
Net increase (decrease) in net assets from operations attributable to contractholders, per unit (note 7)
Select series 2.96$ (0.01)$
STATEMENTS OF CHANGES IN NET ASSETS ATTRIBUTABLE TO CONTRACTHOLDERSFor the twelve months ended December 31
2019 2018
Net assets attributable to contractholders - beginning of period 34,150,153$ 17,055,921$
Contractholders' contributions 37,823,934 22,642,752
Contractholders' withdrawals (12,126,458) (5,539,212)
Net increase (decrease) from contractholders' transactions 25,697,476 17,103,540
Net increase (decrease) in net assets from operations attributable to contractholders 7,343,322 (9,308)
Net assets attributable to contractholders - end of period 67,190,951$ 34,150,153$
STATEMENTS OF CASH FLOWS
For the twelve months ended December 31
Operating cash inflows (outflows) 2019 2018
Interest, dividend and other investment income received -$ -$
Operating expenses paid (1,604,859) (877,749)
Proceeds from sale of investments 1,321,767 751,387
Purchase of investments (25,414,384) (16,977,178)
Contractholders' contributions 37,823,934 22,642,752
Contractholders' withdrawals (12,126,458) (5,539,212)
Cash provided by (used in) operating activities - -
Increase (decrease) in cash and cash equivalents during the period - -
Cash and cash equivalents - beginning of period - -
Cash and cash equivalents - end of period -$ -$
54

Equitable Life Dynamic Global Discovery FundANNUAL COMPOUND NET RETURNS - the following unaudited schedule is provided for Funds in existence for greater than 12 monthsAs at December 31
Since Inception
Date of inception 1 Year 3 Year 5 Year 10 Year (if <10 yrs)
Select series September 2013 17.8% 12.1% 11.8% N/A 12.3%
As at December 31¹
For the twelve months ended December 31² 2019 2019* 2018 2017 2016 2015
Net asset value per unit (Select series)1$20.65 $17.53 $16.91 $14.68 $14.92
Number of units outstanding (Select series)13,253,396 1,948,378 1,008,908 645,030 398,440
Management expense ratio (Select series)23.33% 3.34% 3.34% 3.34% 3.35% 3.34%
Net assets (000s)1$67,191 $34,150 $17,056 $9,469 $5,944
Portfolio turnover rate2 (note 6) 2.70% 2.80% 6.06% 16.91% 5.72%
* Represents the pro-forma management expense ratio as described in note 5.
For additional product or segregated fund information please refer to your contract and information folder.
FINANCIAL HIGHLIGHTS - the following unaudited schedule shows select key financial information about the Fund and is intended to help you
understand the Fund's financial performance for the past five years
55
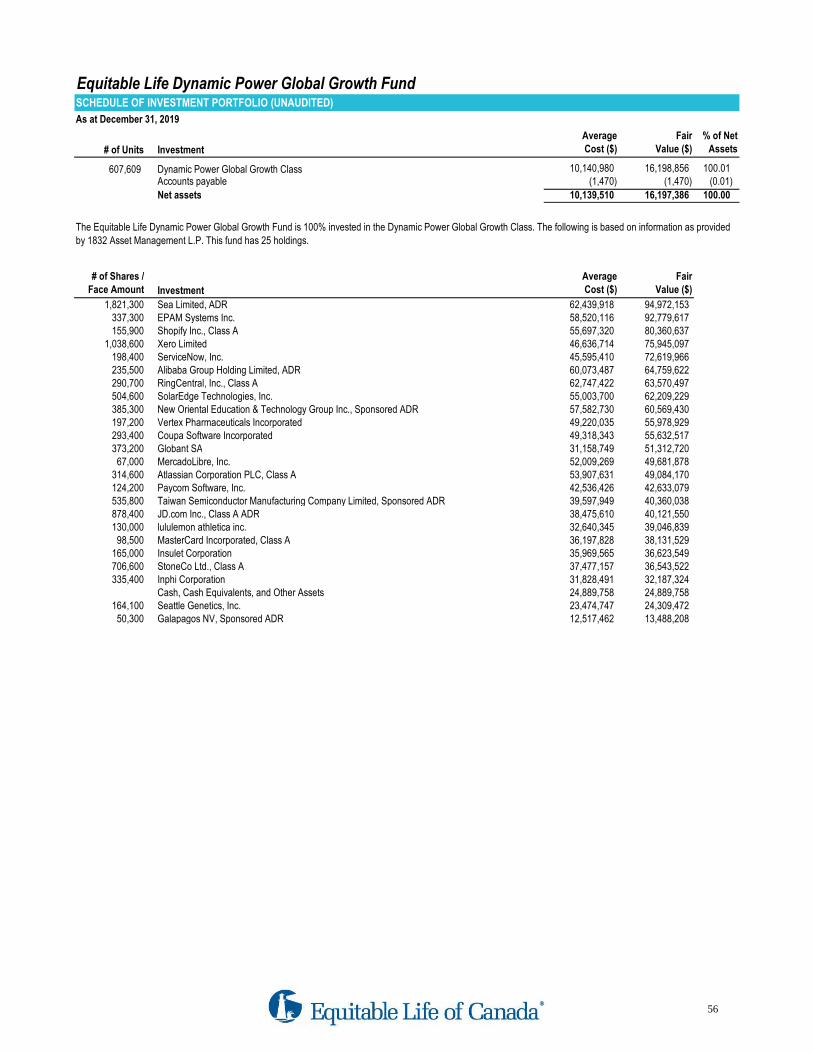
Equitable Life Dynamic Power Global Growth FundSCHEDULE OF INVESTMENT PORTFOLIO (UNAUDITED)
As at December 31, 2019
# of Units Investment
Average
Cost ($)
Fair
Value ($)
% of Net
Assets
607,609 Dynamic Power Global Growth Class 10,140,980 16,198,856 100.01 Accounts payable (1,470) (1,470) (0.01)
Net assets 10,139,510 16,197,386 100.00
# of Shares /
Face Amount Investment
Average
Cost ($)
Fair
Value ($)
1,821,300 Sea Limited, ADR 62,439,918 94,972,153 337,300 EPAM Systems Inc. 58,520,116 92,779,617 155,900 Shopify Inc., Class A 55,697,320 80,360,637
1,038,600 Xero Limited 46,636,714 75,945,097 198,400 ServiceNow, Inc. 45,595,410 72,619,966 235,500 Alibaba Group Holding Limited, ADR 60,073,487 64,759,622 290,700 RingCentral, Inc., Class A 62,747,422 63,570,497 504,600 SolarEdge Technologies, Inc. 55,003,700 62,209,229 385,300 New Oriental Education & Technology Group Inc., Sponsored ADR 57,582,730 60,569,430 197,200 Vertex Pharmaceuticals Incorporated 49,220,035 55,978,929 293,400 Coupa Software Incorporated 49,318,343 55,632,517 373,200 Globant SA 31,158,749 51,312,720
67,000 MercadoLibre, Inc. 52,009,269 49,681,878 314,600 Atlassian Corporation PLC, Class A 53,907,631 49,084,170 124,200 Paycom Software, Inc. 42,536,426 42,633,079 535,800 Taiwan Semiconductor Manufacturing Company Limited, Sponsored ADR 39,597,949 40,360,038 878,400 JD.com Inc., Class A ADR 38,475,610 40,121,550 130,000 lululemon athletica inc. 32,640,345 39,046,839
98,500 MasterCard Incorporated, Class A 36,197,828 38,131,529 165,000 Insulet Corporation 35,969,565 36,623,549 706,600 StoneCo Ltd., Class A 37,477,157 36,543,522 335,400 Inphi Corporation 31,828,491 32,187,324
Cash, Cash Equivalents, and Other Assets 24,889,758 24,889,758 164,100 Seattle Genetics, Inc. 23,474,747 24,309,472
50,300 Galapagos NV, Sponsored ADR 12,517,462 13,488,208
The Equitable Life Dynamic Power Global Growth Fund is 100% invested in the Dynamic Power Global Growth Class. The following is based on information as provided
by 1832 Asset Management L.P. This fund has 25 holdings.
56
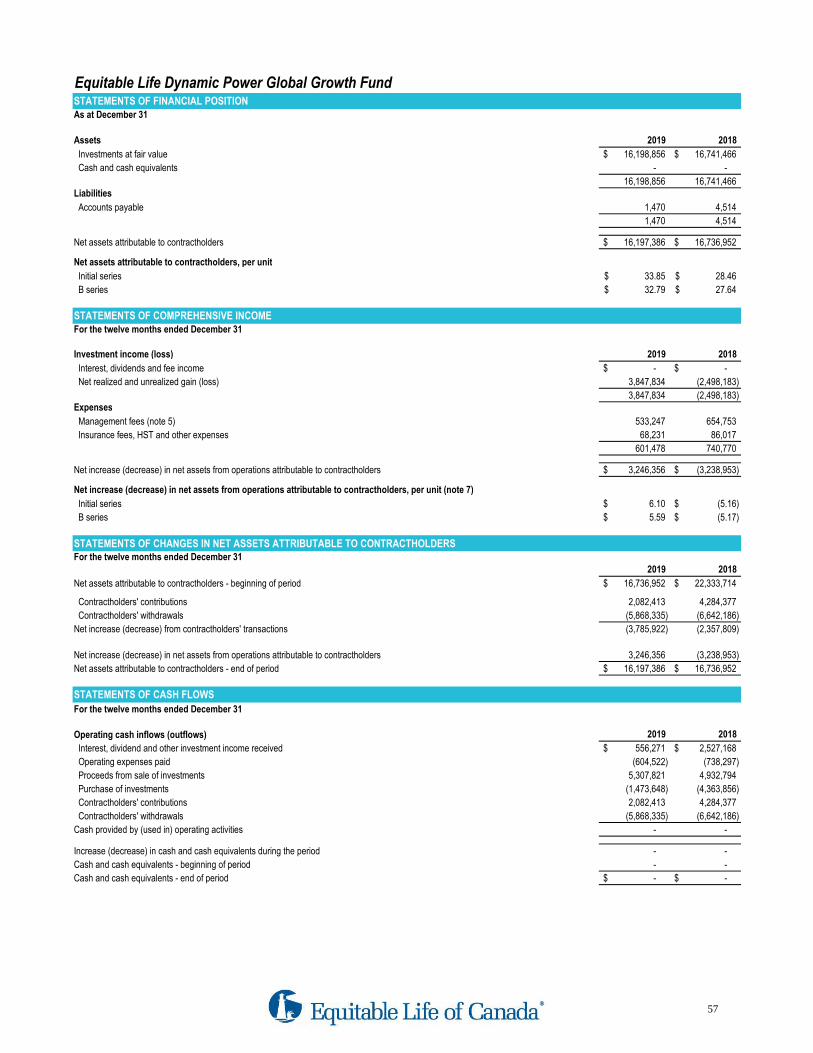
Equitable Life Dynamic Power Global Growth FundSTATEMENTS OF FINANCIAL POSITIONAs at December 31
Assets 2019 2018
Investments at fair value 16,198,856$ 16,741,466$
Cash and cash equivalents - -
16,198,856 16,741,466 Liabilities
Accounts payable 1,470 4,514
1,470 4,514
Net assets attributable to contractholders 16,197,386$ 16,736,952$
Net assets attributable to contractholders, per unit
Initial series 33.85$ 28.46$
B series 32.79$ 27.64$
STATEMENTS OF COMPREHENSIVE INCOMEFor the twelve months ended December 31
Investment income (loss) 2019 2018
Interest, dividends and fee income -$ -$
Net realized and unrealized gain (loss) 3,847,834 (2,498,183)
3,847,834 (2,498,183) Expenses
Management fees (note 5) 533,247 654,753
Insurance fees, HST and other expenses 68,231 86,017
601,478 740,770
Net increase (decrease) in net assets from operations attributable to contractholders 3,246,356$ (3,238,953)$
Net increase (decrease) in net assets from operations attributable to contractholders, per unit (note 7)
Initial series 6.10$ (5.16)$
B series 5.59$ (5.17)$
STATEMENTS OF CHANGES IN NET ASSETS ATTRIBUTABLE TO CONTRACTHOLDERSFor the twelve months ended December 31
2019 2018
Net assets attributable to contractholders - beginning of period 16,736,952$ 22,333,714$
Contractholders' contributions 2,082,413 4,284,377
Contractholders' withdrawals (5,868,335) (6,642,186)
Net increase (decrease) from contractholders' transactions (3,785,922) (2,357,809)
Net increase (decrease) in net assets from operations attributable to contractholders 3,246,356 (3,238,953)
Net assets attributable to contractholders - end of period 16,197,386$ 16,736,952$
STATEMENTS OF CASH FLOWS
For the twelve months ended December 31
Operating cash inflows (outflows) 2019 2018
Interest, dividend and other investment income received 556,271$ 2,527,168$
Operating expenses paid (604,522) (738,297)
Proceeds from sale of investments 5,307,821 4,932,794
Purchase of investments (1,473,648) (4,363,856)
Contractholders' contributions 2,082,413 4,284,377
Contractholders' withdrawals (5,868,335) (6,642,186)
Cash provided by (used in) operating activities - -
Increase (decrease) in cash and cash equivalents during the period - -
Cash and cash equivalents - beginning of period - -
Cash and cash equivalents - end of period -$ -$
57

Equitable Life Dynamic Power Global Growth FundANNUAL COMPOUND NET RETURNS - the following unaudited schedule is provided for Funds in existence for greater than 12 monthsAs at December 31
Since Inception
Date of inception 1 Year 3 Year 5 Year 10 Year (if <10 yrs)
Initial series September 2006 18.9% 14.7% 10.2% 11.4% N/A
B series September 2006 18.6% 14.3% 9.9% 11.2% N/A
As at December 31¹
For the twelve months ended December 31² 2019 2019* 2018 2017 2016 2015
Net asset value per unit (Initial series)1$33.85 $28.46 $34.20 $22.44 $25.71
Net asset value per unit (B series)1$32.79 $27.64 $33.34 $21.95 $25.24
Number of units outstanding (Initial series)1353,929 446,200 494,359 614,108 753,248
Number of units outstanding (B series)1128,581 146,018 162,785 200,219 239,608
Management expense ratio (Initial series)23.26% 3.28% 3.27% 3.27% 3.28% 3.27%
Management expense ratio (B series)23.60% 3.62% 3.60% 3.61% 3.61% 3.61%
Net assets (000s)1$16,197 $16,737 $22,334 $18,178 $25,414
Portfolio turnover rate2 (note 6) 8.13% 19.70% 7.42% 9.50% 12.62%
* Represents the pro-forma management expense ratio as described in note 5.
For additional product or segregated fund information please refer to your contract and information folder.
FINANCIAL HIGHLIGHTS - the following unaudited schedule shows select key financial information about the Fund and is intended to help you
understand the Fund's financial performance for the past five years
58
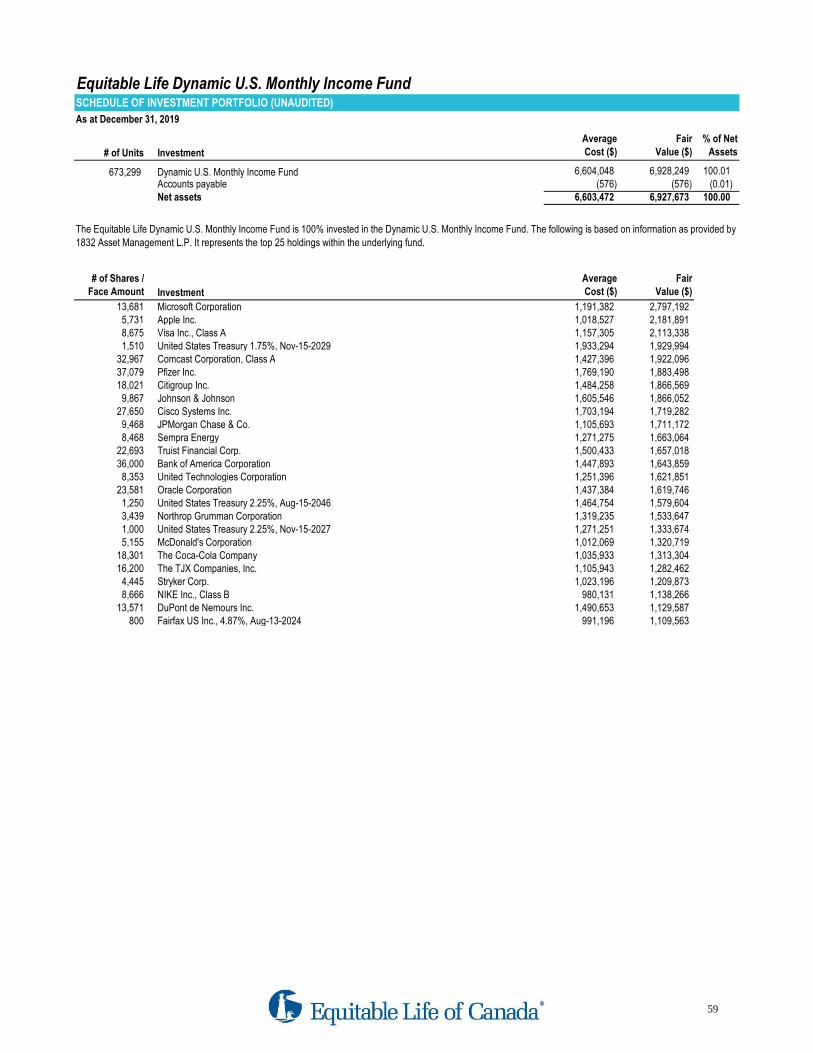
Equitable Life Dynamic U.S. Monthly Income FundSCHEDULE OF INVESTMENT PORTFOLIO (UNAUDITED)
As at December 31, 2019
# of Units Investment
Average
Cost ($)
Fair
Value ($)
% of Net
Assets
673,299 Dynamic U.S. Monthly Income Fund 6,604,048 6,928,249 100.01 Accounts payable (576) (576) (0.01) Net assets 6,603,472 6,927,673 100.00
# of Shares /
Face Amount Investment
Average
Cost ($)
Fair
Value ($)
13,681 Microsoft Corporation 1,191,382 2,797,192 5,731 Apple Inc. 1,018,527 2,181,891 8,675 Visa Inc., Class A 1,157,305 2,113,338 1,510 United States Treasury 1.75%, Nov-15-2029 1,933,294 1,929,994
32,967 Comcast Corporation, Class A 1,427,396 1,922,096 37,079 Pfizer Inc. 1,769,190 1,883,498 18,021 Citigroup Inc. 1,484,258 1,866,569
9,867 Johnson & Johnson 1,605,546 1,866,052 27,650 Cisco Systems Inc. 1,703,194 1,719,282
9,468 JPMorgan Chase & Co. 1,105,693 1,711,172 8,468 Sempra Energy 1,271,275 1,663,064
22,693 Truist Financial Corp. 1,500,433 1,657,018 36,000 Bank of America Corporation 1,447,893 1,643,859
8,353 United Technologies Corporation 1,251,396 1,621,851 23,581 Oracle Corporation 1,437,384 1,619,746
1,250 United States Treasury 2.25%, Aug-15-2046 1,464,754 1,579,604 3,439 Northrop Grumman Corporation 1,319,235 1,533,647 1,000 United States Treasury 2.25%, Nov-15-2027 1,271,251 1,333,674 5,155 McDonald's Corporation 1,012,069 1,320,719
18,301 The Coca-Cola Company 1,035,933 1,313,304 16,200 The TJX Companies, Inc. 1,105,943 1,282,462
4,445 Stryker Corp. 1,023,196 1,209,873 8,666 NIKE Inc., Class B 980,131 1,138,266
13,571 DuPont de Nemours Inc. 1,490,653 1,129,587 800 Fairfax US Inc., 4.87%, Aug-13-2024 991,196 1,109,563
The Equitable Life Dynamic U.S. Monthly Income Fund is 100% invested in the Dynamic U.S. Monthly Income Fund. The following is based on information as provided by
1832 Asset Management L.P. It represents the top 25 holdings within the underlying fund.
59
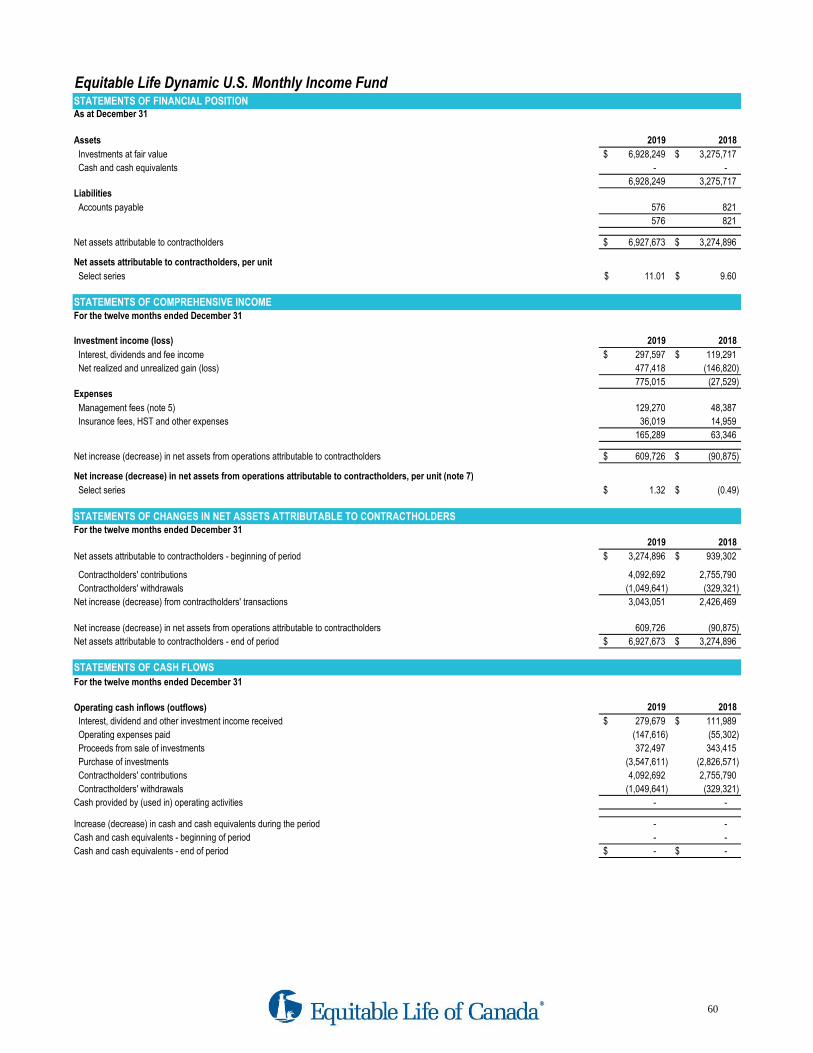
Equitable Life Dynamic U.S. Monthly Income FundSTATEMENTS OF FINANCIAL POSITIONAs at December 31
Assets 2019 2018
Investments at fair value 6,928,249$ 3,275,717$
Cash and cash equivalents - -
6,928,249 3,275,717 Liabilities
Accounts payable 576 821
576 821
Net assets attributable to contractholders 6,927,673$ 3,274,896$
Net assets attributable to contractholders, per unit
Select series 11.01$ 9.60$
STATEMENTS OF COMPREHENSIVE INCOMEFor the twelve months ended December 31
Investment income (loss) 2019 2018
Interest, dividends and fee income 297,597$ 119,291$
Net realized and unrealized gain (loss) 477,418 (146,820)
775,015 (27,529) Expenses
Management fees (note 5) 129,270 48,387
Insurance fees, HST and other expenses 36,019 14,959
165,289 63,346
Net increase (decrease) in net assets from operations attributable to contractholders 609,726$ (90,875)$
Net increase (decrease) in net assets from operations attributable to contractholders, per unit (note 7)
Select series 1.32$ (0.49)$
STATEMENTS OF CHANGES IN NET ASSETS ATTRIBUTABLE TO CONTRACTHOLDERSFor the twelve months ended December 31
2019 2018
Net assets attributable to contractholders - beginning of period 3,274,896$ 939,302$
Contractholders' contributions 4,092,692 2,755,790
Contractholders' withdrawals (1,049,641) (329,321)
Net increase (decrease) from contractholders' transactions 3,043,051 2,426,469
Net increase (decrease) in net assets from operations attributable to contractholders 609,726 (90,875)
Net assets attributable to contractholders - end of period 6,927,673$ 3,274,896$
STATEMENTS OF CASH FLOWS
For the twelve months ended December 31
Operating cash inflows (outflows) 2019 2018
Interest, dividend and other investment income received 279,679$ 111,989$
Operating expenses paid (147,616) (55,302)
Proceeds from sale of investments 372,497 343,415
Purchase of investments (3,547,611) (2,826,571)
Contractholders' contributions 4,092,692 2,755,790
Contractholders' withdrawals (1,049,641) (329,321)
Cash provided by (used in) operating activities - -
Increase (decrease) in cash and cash equivalents during the period - -
Cash and cash equivalents - beginning of period - -
Cash and cash equivalents - end of period -$ -$
60

Equitable Life Dynamic U.S. Monthly Income FundANNUAL COMPOUND NET RETURNS - the following unaudited schedule is provided for Funds in existence for greater than 12 monthsAs at December 31
Since Inception
Date of inception 1 Year 3 Year 5 Year 10 Year (if <10 yrs)
Select series May 2017 14.8% N/A N/A N/A 3.8%
As at December 31¹
For the twelve months ended December 31² 2019 2019* 2018 2017 2016 2015
Net asset value per unit (Select series)1$11.01 $9.60 $9.66 N/A N/A
Number of units outstanding (Select series)1628,979 341,282 97,256 N/A N/A
Management expense ratio (Select series)23.07% 3.14% 3.12% 3.04% N/A N/A
Net assets (000s)1$6,928 $3,275 $939 N/A N/A
Portfolio turnover rate2 (note 6) 7.65% 18.68% 3.41% N/A N/A
* Represents the pro-forma management expense ratio as described in note 5.
For additional product or segregated fund information please refer to your contract and information folder.
FINANCIAL HIGHLIGHTS - the following unaudited schedule shows select key financial information about the Fund and is intended to help you
understand the Fund's financial performance for the past five years
61

Equitable Life Dynamic Value Balanced FundSCHEDULE OF INVESTMENT PORTFOLIO (UNAUDITED)
As at December 31, 2019
# of Units Investment
Average
Cost ($)
Fair
Value ($)
% of Net
Assets
2,179,801 Dynamic Value Balanced Fund 12,015,345 11,661,934 100.01 Accounts payable (955) (955) (0.01)
Net assets 12,014,390 11,660,979 100.00
# of Shares /
Face Amount Investment
Average
Cost ($)
Fair
Value ($)
29,255 Government of Canada 2.25%, Jun-01-2029 30,079,944 30,655,298 27,941 Canada Housing Trust 2.10%, Sep-15-2029 28,221,807 27,969,010
272,100 Toronto-Dominion Bank 16,662,878 19,817,043 17,453 Province Of Quebec 2.75%, Sep-01-2028 17,757,555 18,134,003
128,335 Intact Financial Corporation 10,947,166 18,020,801 173,900 Royal Bank of Canada 14,987,314 17,868,225 115,600 Franco-Nevada Corporation 10,996,850 15,500,804 128,300 Canadian National Railway Company 11,567,835 15,071,401 563,000 Shaw Communications Inc., Class B 15,468,424 14,835,050 194,200 Bank of Nova Scotia 13,112,337 14,244,570
41,300 Canadian Pacific Railway Limited 8,711,491 13,671,539 143,700 Restaurant Brands International Inc. 11,231,702 11,895,486
48,300 Visa Inc., Class A 6,812,235 11,766,482 186,100 BCE Inc. 10,899,102 11,195,776
90,420 Waste Connections Inc. 7,501,615 10,665,039 204,100 Enbridge Inc. 10,296,267 10,537,683 256,000 Saputo Inc. 11,172,758 10,291,200 389,000 Manulife Financial Corporation 7,648,472 10,254,040 241,600 Alimentation Couche-Tard Inc., Class B, Subordinate Voting 7,196,228 9,956,336 146,900 Loblaw Companies Limited 8,044,198 9,842,300 113,900 Onex Corporation 10,161,545 9,359,163 207,400 Suncor Energy Inc. 8,510,411 8,826,944 578,900 PrairieSky Royalty Ltd. 18,026,011 8,816,647 194,404 Canadian Natural Resources Limited 7,239,027 8,164,968
6,791 Province of Ontario 2.90%, Jun-02-2049 6,808,045 7,354,210
The Equitable Life Dynamic Value Balanced Fund is 100% invested in the Dynamic Value Balanced Fund. The following is based on information as provided by 1832
Asset Management L.P. It represents the top 25 holdings within the underlying fund.
62

Equitable Life Dynamic Value Balanced FundSTATEMENTS OF FINANCIAL POSITIONAs at December 31
Assets 2019 2018
Investments at fair value 11,661,934$ 10,722,637$
Cash and cash equivalents - -
11,661,934 10,722,637 Liabilities
Accounts payable 955 2,613
955 2,613
Net assets attributable to contractholders 11,660,979$ 10,720,024$
Net assets attributable to contractholders, per unit
Initial series 11.94$ 10.83$
Select series 11.94$ 10.80$
STATEMENTS OF COMPREHENSIVE INCOMEFor the twelve months ended December 31
Investment income (loss) 2019 2018
Interest, dividends and fee income 547,534$ 575,320$
Net realized and unrealized gain (loss) 913,833 (890,585)
1,461,367 (315,265) Expenses
Management fees (note 5) 304,037 316,783
Insurance fees, HST and other expenses 40,888 41,863
344,925 358,646
Net increase (decrease) in net assets from operations attributable to contractholders 1,116,442$ (673,911)$
Net increase (decrease) in net assets from operations attributable to contractholders, per unit (note 7)
Initial series 1.14$ (0.67)$
Select series 1.13$ (0.62)$
STATEMENTS OF CHANGES IN NET ASSETS ATTRIBUTABLE TO CONTRACTHOLDERSFor the twelve months ended December 31
2019 2018
Net assets attributable to contractholders - beginning of period 10,720,024$ 13,234,754$
Contractholders' contributions 2,408,868 2,057,774
Contractholders' withdrawals (2,584,355) (3,898,593)
Net increase (decrease) from contractholders' transactions (175,487) (1,840,819)
Net increase (decrease) in net assets from operations attributable to contractholders 1,116,442 (673,911)
Net assets attributable to contractholders - end of period 11,660,979$ 10,720,024$
STATEMENTS OF CASH FLOWS
For the twelve months ended December 31
Operating cash inflows (outflows) 2019 2018
Interest, dividend and other investment income received 547,534$ 575,320$
Operating expenses paid (346,583) (357,120)
Proceeds from sale of investments 1,572,379 2,999,855
Purchase of investments (1,597,843) (1,377,236)
Contractholders' contributions 2,408,868 2,057,774
Contractholders' withdrawals (2,584,355) (3,898,593)
Cash provided by (used in) operating activities - -
Increase (decrease) in cash and cash equivalents during the period - -
Cash and cash equivalents - beginning of period - -
Cash and cash equivalents - end of period -$ -$
63

Equitable Life Dynamic Value Balanced FundANNUAL COMPOUND NET RETURNS - the following unaudited schedule is provided for Funds in existence for greater than 12 monthsAs at December 31
Since Inception
Date of inception 1 Year 3 Year 5 Year 10 Year (if <10 yrs)
Initial series January 2011 10.2% 0.9% 1.1% N/A 2.0%
Select series September 2013 10.5% 1.2% 1.4% N/A 2.8%
As at December 31¹
For the twelve months ended December 31² 2019 2019* 2018 2017 2016 2015
Net asset value per unit (Initial series)1$11.94 $10.83 $11.49 $11.61 $11.11
Net asset value per unit (Select series)1$11.94 $10.80 $11.43 $11.51 $10.98
Number of units outstanding (Initial series)1285,904 321,228 423,173 447,944 487,327
Number of units outstanding (Select series)1691,008 670,664 732,764 577,470 443,386
Management expense ratio (Initial series)23.21% 3.24% 3.21% 3.21% 3.21% 3.22%
Management expense ratio (Select series)22.92% 2.95% 2.92% 2.92% 2.92% 2.93%
Net assets (000s)1$11,661 $10,720 $13,235 $11,848 $10,279
Portfolio turnover rate2 (note 6) 13.64% 11.54% 9.49% 13.42% 13.66%
* Represents the pro-forma management expense ratio as described in note 5.
For additional product or segregated fund information please refer to your contract and information folder.
FINANCIAL HIGHLIGHTS - the following unaudited schedule shows select key financial information about the Fund and is intended to help you
understand the Fund's financial performance for the past five years
64
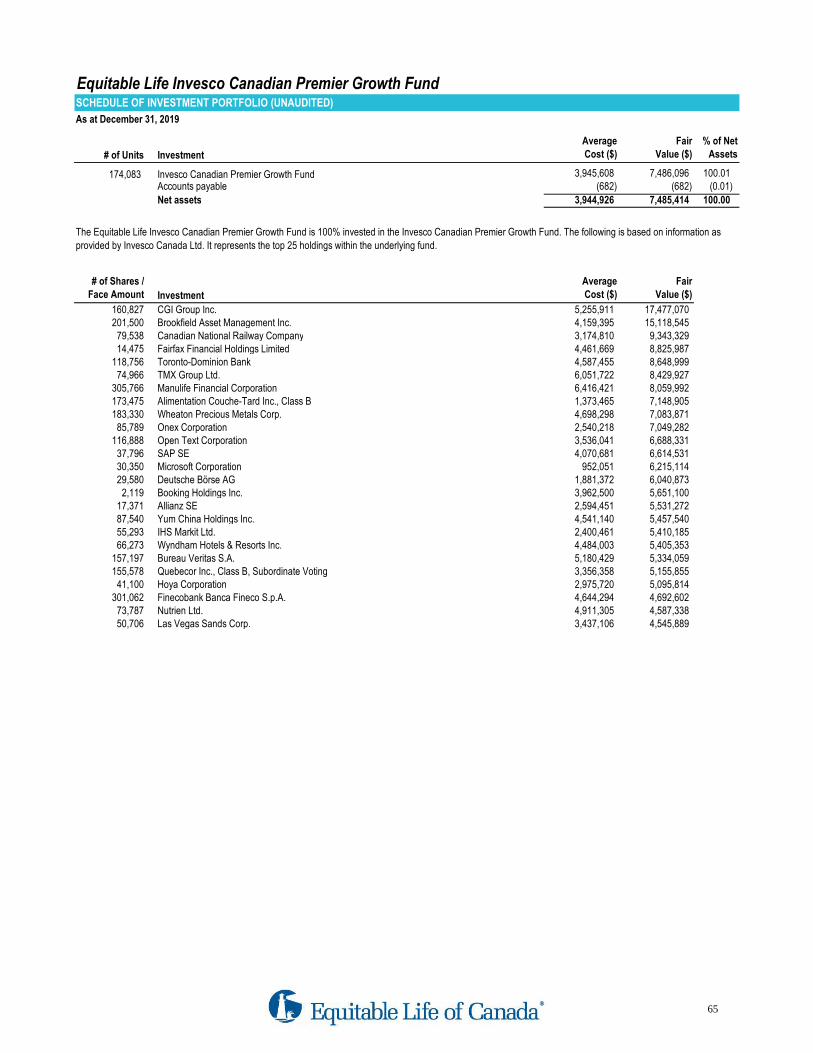
Equitable Life Invesco Canadian Premier Growth FundSCHEDULE OF INVESTMENT PORTFOLIO (UNAUDITED)
As at December 31, 2019
# of Units Investment
Average
Cost ($)
Fair
Value ($)
% of Net
Assets
174,083 Invesco Canadian Premier Growth Fund 3,945,608 7,486,096 100.01 Accounts payable (682) (682) (0.01)
Net assets 3,944,926 7,485,414 100.00
# of Shares /
Face Amount Investment
Average
Cost ($)
Fair
Value ($)
160,827 CGI Group Inc. 5,255,911 17,477,070 201,500 Brookfield Asset Management Inc. 4,159,395 15,118,545
79,538 Canadian National Railway Company 3,174,810 9,343,329 14,475 Fairfax Financial Holdings Limited 4,461,669 8,825,987
118,756 Toronto-Dominion Bank 4,587,455 8,648,999 74,966 TMX Group Ltd. 6,051,722 8,429,927
305,766 Manulife Financial Corporation 6,416,421 8,059,992 173,475 Alimentation Couche-Tard Inc., Class B 1,373,465 7,148,905 183,330 Wheaton Precious Metals Corp. 4,698,298 7,083,871
85,789 Onex Corporation 2,540,218 7,049,282 116,888 Open Text Corporation 3,536,041 6,688,331
37,796 SAP SE 4,070,681 6,614,531 30,350 Microsoft Corporation 952,051 6,215,114 29,580 Deutsche Börse AG 1,881,372 6,040,873
2,119 Booking Holdings Inc. 3,962,500 5,651,100 17,371 Allianz SE 2,594,451 5,531,272 87,540 Yum China Holdings Inc. 4,541,140 5,457,540 55,293 IHS Markit Ltd. 2,400,461 5,410,185 66,273 Wyndham Hotels & Resorts Inc. 4,484,003 5,405,353
157,197 Bureau Veritas S.A. 5,180,429 5,334,059 155,578 Quebecor Inc., Class B, Subordinate Voting 3,356,358 5,155,855
41,100 Hoya Corporation 2,975,720 5,095,814 301,062 Finecobank Banca Fineco S.p.A. 4,644,294 4,692,602
73,787 Nutrien Ltd. 4,911,305 4,587,338 50,706 Las Vegas Sands Corp. 3,437,106 4,545,889
The Equitable Life Invesco Canadian Premier Growth Fund is 100% invested in the Invesco Canadian Premier Growth Fund. The following is based on information as
provided by Invesco Canada Ltd. It represents the top 25 holdings within the underlying fund.
65
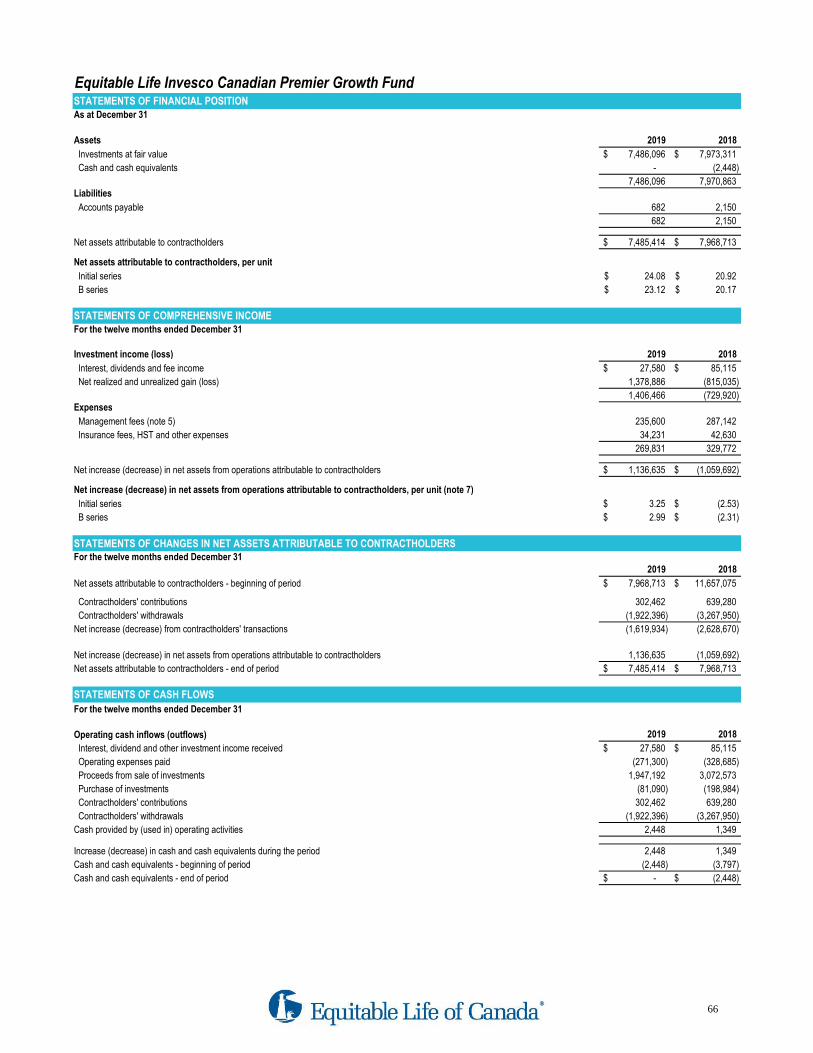
Equitable Life Invesco Canadian Premier Growth FundSTATEMENTS OF FINANCIAL POSITIONAs at December 31
Assets 2019 2018
Investments at fair value 7,486,096$ 7,973,311$
Cash and cash equivalents - (2,448)
7,486,096 7,970,863 Liabilities
Accounts payable 682 2,150
682 2,150
Net assets attributable to contractholders 7,485,414$ 7,968,713$
Net assets attributable to contractholders, per unit
Initial series 24.08$ 20.92$
B series 23.12$ 20.17$
STATEMENTS OF COMPREHENSIVE INCOMEFor the twelve months ended December 31
Investment income (loss) 2019 2018
Interest, dividends and fee income 27,580$ 85,115$
Net realized and unrealized gain (loss) 1,378,886 (815,035)
1,406,466 (729,920) Expenses
Management fees (note 5) 235,600 287,142
Insurance fees, HST and other expenses 34,231 42,630
269,831 329,772
Net increase (decrease) in net assets from operations attributable to contractholders 1,136,635$ (1,059,692)$
Net increase (decrease) in net assets from operations attributable to contractholders, per unit (note 7)
Initial series 3.25$ (2.53)$
B series 2.99$ (2.31)$
STATEMENTS OF CHANGES IN NET ASSETS ATTRIBUTABLE TO CONTRACTHOLDERSFor the twelve months ended December 31
2019 2018
Net assets attributable to contractholders - beginning of period 7,968,713$ 11,657,075$
Contractholders' contributions 302,462 639,280
Contractholders' withdrawals (1,922,396) (3,267,950)
Net increase (decrease) from contractholders' transactions (1,619,934) (2,628,670)
Net increase (decrease) in net assets from operations attributable to contractholders 1,136,635 (1,059,692)
Net assets attributable to contractholders - end of period 7,485,414$ 7,968,713$
STATEMENTS OF CASH FLOWS
For the twelve months ended December 31
Operating cash inflows (outflows) 2019 2018
Interest, dividend and other investment income received 27,580$ 85,115$
Operating expenses paid (271,300) (328,685)
Proceeds from sale of investments 1,947,192 3,072,573
Purchase of investments (81,090) (198,984)
Contractholders' contributions 302,462 639,280
Contractholders' withdrawals (1,922,396) (3,267,950)
Cash provided by (used in) operating activities 2,448 1,349
Increase (decrease) in cash and cash equivalents during the period 2,448 1,349
Cash and cash equivalents - beginning of period (2,448) (3,797)
Cash and cash equivalents - end of period -$ (2,448)$
66
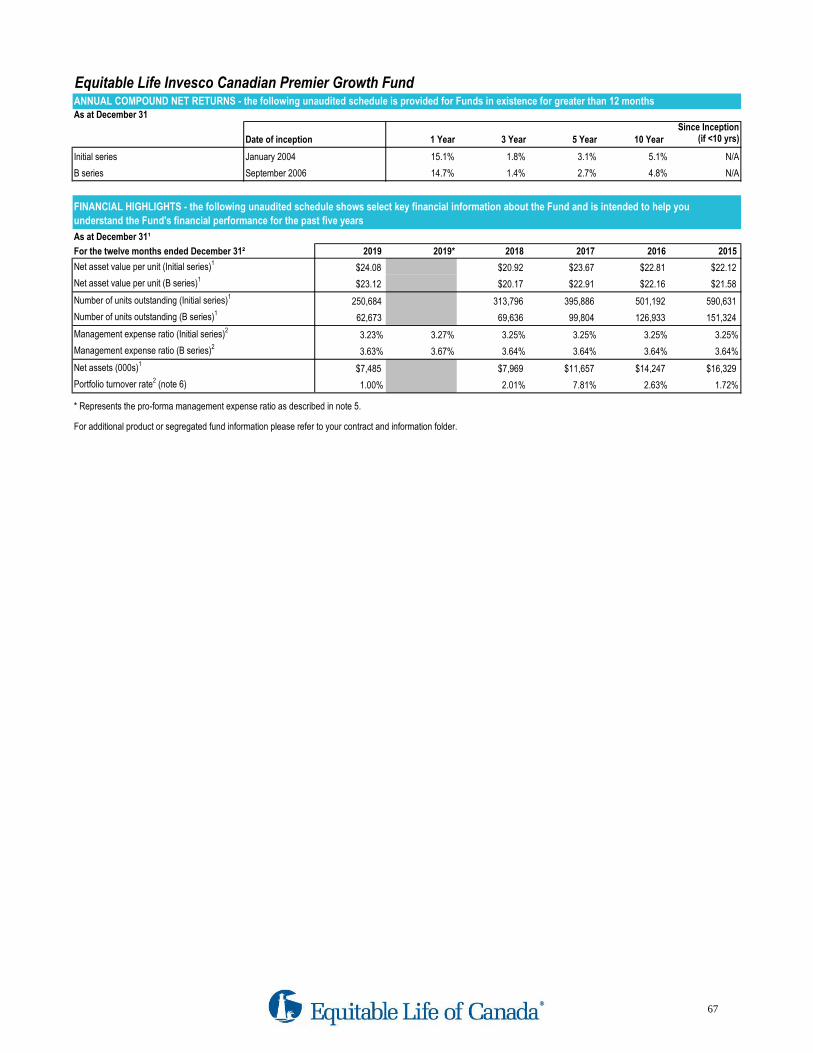
Equitable Life Invesco Canadian Premier Growth FundANNUAL COMPOUND NET RETURNS - the following unaudited schedule is provided for Funds in existence for greater than 12 monthsAs at December 31
Since Inception
Date of inception 1 Year 3 Year 5 Year 10 Year (if <10 yrs)
Initial series January 2004 15.1% 1.8% 3.1% 5.1% N/A
B series September 2006 14.7% 1.4% 2.7% 4.8% N/A
As at December 31¹
For the twelve months ended December 31² 2019 2019* 2018 2017 2016 2015
Net asset value per unit (Initial series)1$24.08 $20.92 $23.67 $22.81 $22.12
Net asset value per unit (B series)1$23.12 $20.17 $22.91 $22.16 $21.58
Number of units outstanding (Initial series)1250,684 313,796 395,886 501,192 590,631
Number of units outstanding (B series)162,673 69,636 99,804 126,933 151,324
Management expense ratio (Initial series)23.23% 3.27% 3.25% 3.25% 3.25% 3.25%
Management expense ratio (B series)23.63% 3.67% 3.64% 3.64% 3.64% 3.64%
Net assets (000s)1$7,485 $7,969 $11,657 $14,247 $16,329
Portfolio turnover rate2 (note 6) 1.00% 2.01% 7.81% 2.63% 1.72%
* Represents the pro-forma management expense ratio as described in note 5.
For additional product or segregated fund information please refer to your contract and information folder.
FINANCIAL HIGHLIGHTS - the following unaudited schedule shows select key financial information about the Fund and is intended to help you
understand the Fund's financial performance for the past five years
67

Equitable Life Invesco Diversified Yield FundSCHEDULE OF INVESTMENT PORTFOLIO (UNAUDITED)
As at December 31, 2019
# of Units Investment
Average
Cost ($)
Fair
Value ($)
% of Net
Assets
850,361 Invesco Diversified Yield Class 10,030,856 10,371,002 100.01
Accounts payable (859) (859) (0.01) Net assets 10,029,997 10,370,143 100.00
# of Shares /
Face Amount Investment
Average
Cost ($)
Fair
Value ($)
288,632 Toronto-Dominion Bank 14,688,928 21,021,069 283,821 Bank of Nova Scotia 18,238,504 20,818,270 199,093 Royal Bank of Canada 15,306,313 20,456,806 325,100 SoftBank Group Corp. 17,229,846 18,379,315
1,950,046 ARC Resources Ltd. 25,639,037 15,951,376 1,577,637 Pizza Pizza Royalty Corp. 19,597,003 15,413,513
72,517 Microsoft Corporation 4,752,968 14,850,128 1,109,578 Cenovus Energy Inc. 18,884,449 14,646,430
491,736 Infineon Technologies AG 11,235,897 14,643,075 8,415 Alphabet Inc., Class A 12,869,723 14,635,914
190,833 Brookfield Asset Management Inc. 6,952,792 14,318,200 1,236,975 Chemtrade Logistics Income Fund 20,412,511 13,643,834
111,599 Canadian National Railway Company 10,089,926 13,109,535 489,164 Shaw Communications Inc., Class B 12,735,538 12,889,471 345,828 Stantec Inc. 11,142,306 12,691,888 748,833 Delphi Technologies PLC 25,728,176 12,475,855 209,357 Sun Life Financial Inc. 9,524,153 12,396,028 169,266 IA Financial Corporation Inc. 7,564,498 12,073,744 635,811 Algonquin Power & Utilities Corp. 8,764,163 11,679,848 366,100 ABB Ltd., ADR 10,250,299 11,452,366
1,053,187 Husky Energy Inc. 17,800,076 10,974,209 313,530 Keyera Corp. 11,939,347 10,666,291
99,157 Bayer AG 12,909,815 10,524,914 149,926 Wells Fargo & Company 9,806,319 10,474,129 145,359 Toromont Industries Ltd. 4,941,539 10,260,892
The Equitable Life Invesco Diversified Yield Fund is 100% invested in the Invesco Diversified Yield Class. The following is based on information as provided by Invesco
Canada Ltd. It represents the top 25 holdings within the underlying fund.
68
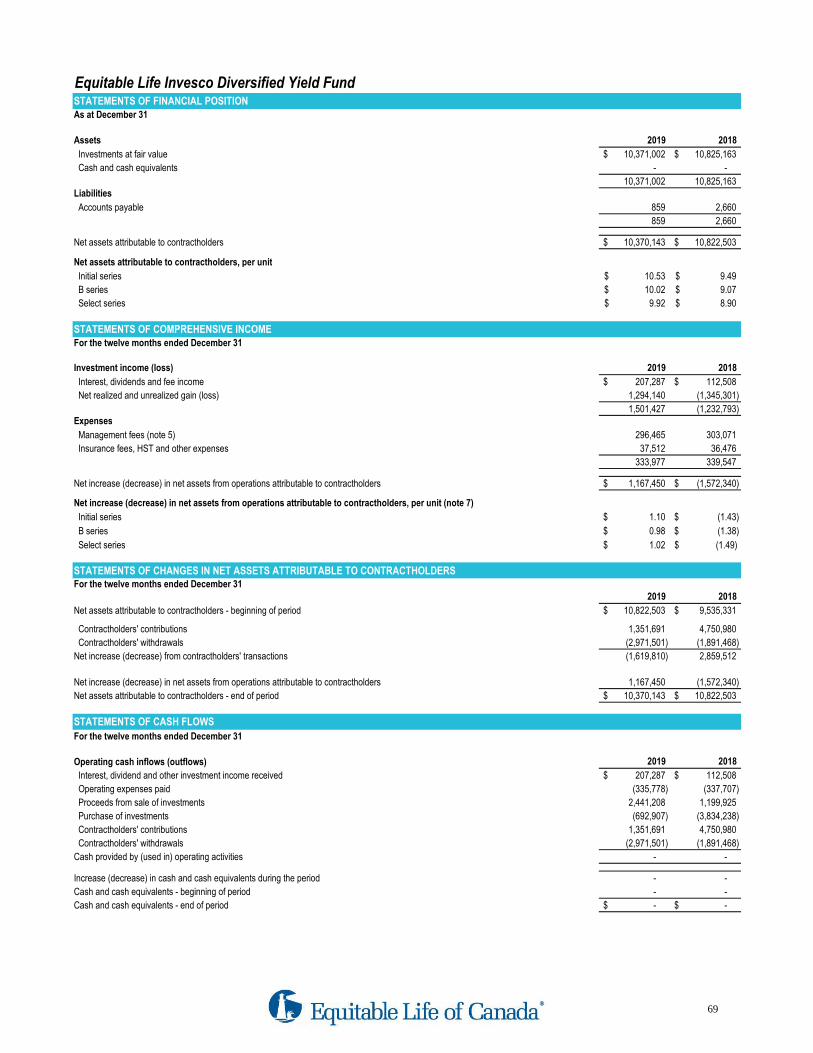
Equitable Life Invesco Diversified Yield FundSTATEMENTS OF FINANCIAL POSITIONAs at December 31
Assets 2019 2018
Investments at fair value 10,371,002$ 10,825,163$
Cash and cash equivalents - -
10,371,002 10,825,163 Liabilities
Accounts payable 859 2,660
859 2,660
Net assets attributable to contractholders 10,370,143$ 10,822,503$
Net assets attributable to contractholders, per unit
Initial series 10.53$ 9.49$
B series 10.02$ 9.07$
Select series 9.92$ 8.90$
STATEMENTS OF COMPREHENSIVE INCOMEFor the twelve months ended December 31
Investment income (loss) 2019 2018
Interest, dividends and fee income 207,287$ 112,508$
Net realized and unrealized gain (loss) 1,294,140 (1,345,301)
1,501,427 (1,232,793) Expenses
Management fees (note 5) 296,465 303,071
Insurance fees, HST and other expenses 37,512 36,476
333,977 339,547
Net increase (decrease) in net assets from operations attributable to contractholders 1,167,450$ (1,572,340)$
STATEMENTS OF CHANGES IN NET ASSETS ATTRIBUTABLE TO CONTRACTHOLDERSFor the twelve months ended December 31
2019 2018
Net assets attributable to contractholders - beginning of period 10,822,503$ 9,535,331$
Contractholders' contributions 1,351,691 4,750,980
Contractholders' withdrawals (2,971,501) (1,891,468)
Net increase (decrease) from contractholders' transactions (1,619,810) 2,859,512
Net increase (decrease) in net assets from operations attributable to contractholders 1,167,450 (1,572,340)
Net assets attributable to contractholders - end of period 10,370,143$ 10,822,503$
STATEMENTS OF CASH FLOWS
For the twelve months ended December 31
Operating cash inflows (outflows) 2019 2018
Interest, dividend and other investment income received 207,287$ 112,508$
Operating expenses paid (335,778) (337,707)
Proceeds from sale of investments 2,441,208 1,199,925
Purchase of investments (692,907) (3,834,238)
Contractholders' contributions 1,351,691 4,750,980
Contractholders' withdrawals (2,971,501) (1,891,468)
Cash provided by (used in) operating activities - -
Increase (decrease) in cash and cash equivalents during the period - -
Cash and cash equivalents - beginning of period - -
Cash and cash equivalents - end of period -$ -$
Net increase (decrease) in net assets from operations attributable to contractholders, per unit (note 7)
Initial series $ 1.10 $ (1.43)
B series $ 0.98 $ (1.38)
Select series $ 1.02 $ (1.49)
69
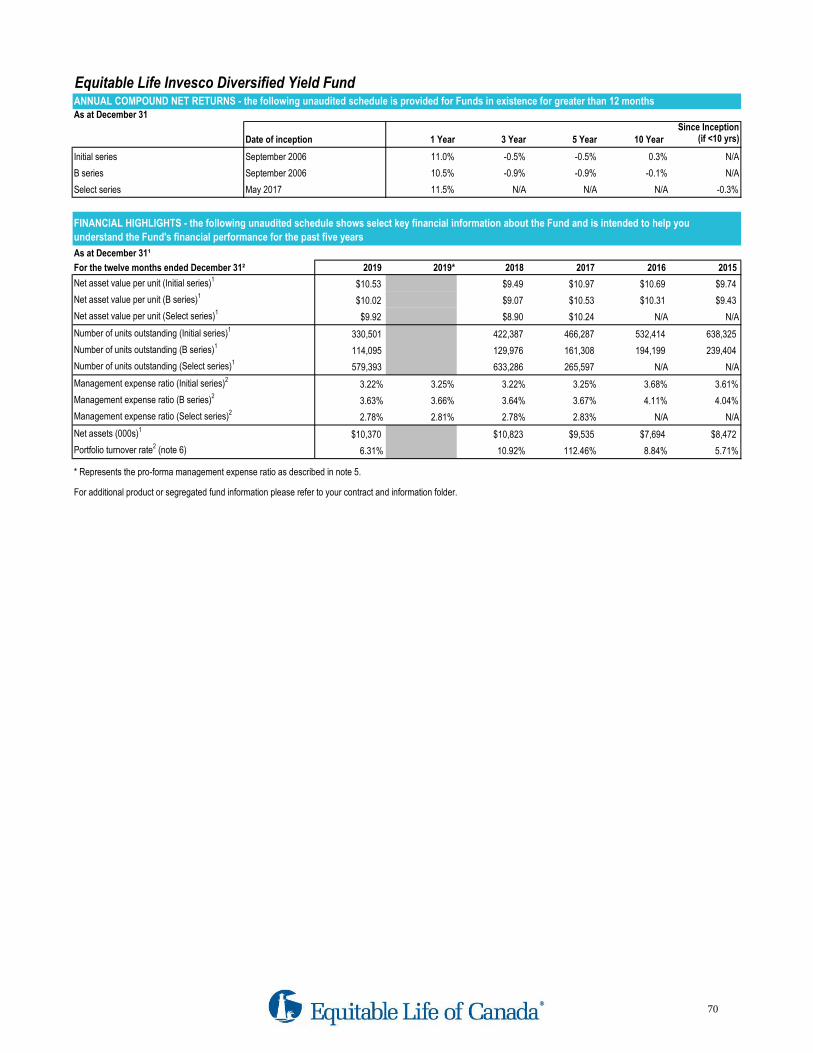
Equitable Life Invesco Diversified Yield FundANNUAL COMPOUND NET RETURNS - the following unaudited schedule is provided for Funds in existence for greater than 12 months
As at December 31
Since Inception
Date of inception 1 Year 3 Year 5 Year 10 Year (if <10 yrs)
Initial series September 2006 11.0% -0.5% -0.5% 0.3% N/A
B series September 2006 10.5% -0.9% -0.9% -0.1% N/A
Select series May 2017 11.5% N/A N/A N/A -0.3%
As at December 31¹
For the twelve months ended December 31² 2019 2019* 2018 2017 2016 2015
Net asset value per unit (Initial series)1$10.53 $9.49 $10.97 $10.69 $9.74
Net asset value per unit (B series)1$10.02 $9.07 $10.53 $10.31 $9.43
Net asset value per unit (Select series)1$9.92 $8.90 $10.24 N/A N/A
Number of units outstanding (Initial series)1330,501 422,387 466,287 532,414 638,325
Number of units outstanding (B series)1114,095 129,976 161,308 194,199 239,404
Number of units outstanding (Select series)1579,393 633,286 265,597 N/A N/A
Management expense ratio (Initial series)23.22% 3.25% 3.22% 3.25% 3.68% 3.61%
Management expense ratio (B series)23.63% 3.66% 3.64% 3.67% 4.11% 4.04%
Management expense ratio (Select series)22.78% 2.81% 2.78% 2.83% N/A N/A
Net assets (000s)1$10,370 $10,823 $9,535 $7,694 $8,472
Portfolio turnover rate2 (note 6) 6.31% 10.92% 112.46% 8.84% 5.71%
* Represents the pro-forma management expense ratio as described in note 5.
For additional product or segregated fund information please refer to your contract and information folder.
FINANCIAL HIGHLIGHTS - the following unaudited schedule shows select key financial information about the Fund and is intended to help you
understand the Fund's financial performance for the past five years
70
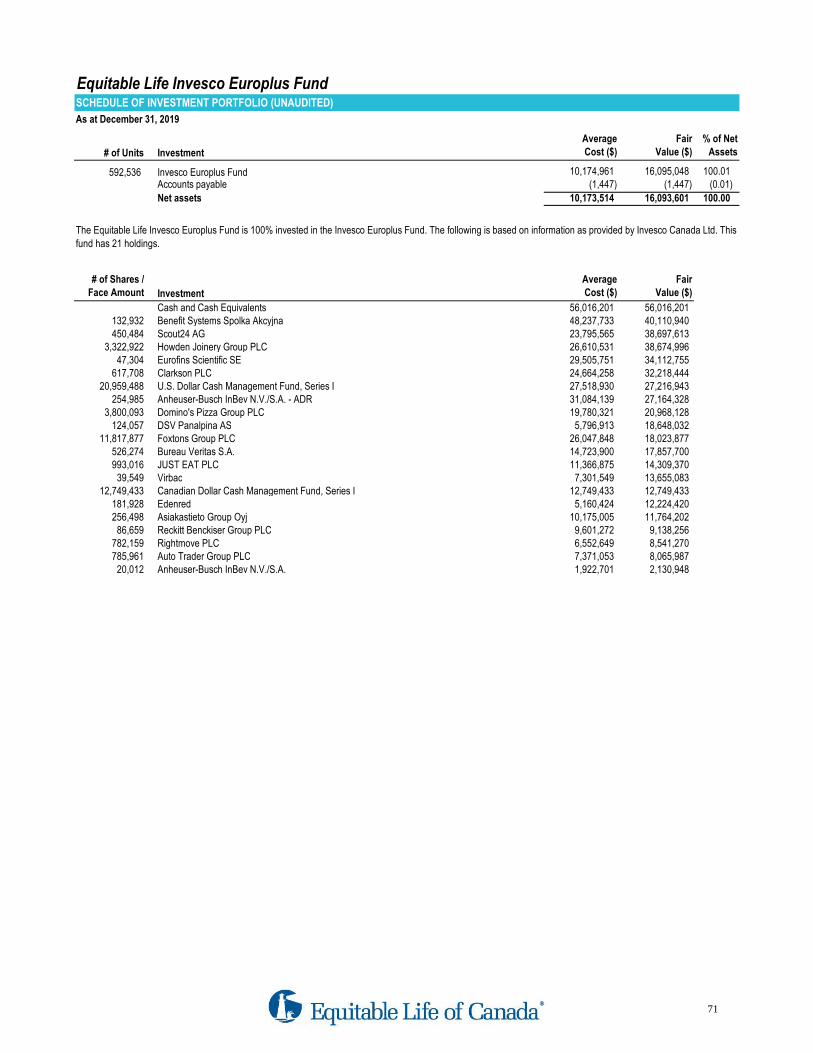
Equitable Life Invesco Europlus FundSCHEDULE OF INVESTMENT PORTFOLIO (UNAUDITED)
As at December 31, 2019
# of Units Investment
Average
Cost ($)
Fair
Value ($)
% of Net
Assets
592,536 Invesco Europlus Fund 10,174,961 16,095,048 100.01 Accounts payable (1,447) (1,447) (0.01)
Net assets 10,173,514 16,093,601 100.00
# of Shares /
Face Amount Investment
Average
Cost ($)
Fair
Value ($)
Cash and Cash Equivalents 56,016,201 56,016,201 132,932 Benefit Systems Spolka Akcyjna 48,237,733 40,110,940 450,484 Scout24 AG 23,795,565 38,697,613
3,322,922 Howden Joinery Group PLC 26,610,531 38,674,996 47,304 Eurofins Scientific SE 29,505,751 34,112,755
617,708 Clarkson PLC 24,664,258 32,218,444 20,959,488 U.S. Dollar Cash Management Fund, Series I 27,518,930 27,216,943
254,985 Anheuser-Busch InBev N.V./S.A. - ADR 31,084,139 27,164,328 3,800,093 Domino's Pizza Group PLC 19,780,321 20,968,128
124,057 DSV Panalpina AS 5,796,913 18,648,032 11,817,877 Foxtons Group PLC 26,047,848 18,023,877
526,274 Bureau Veritas S.A. 14,723,900 17,857,700 993,016 JUST EAT PLC 11,366,875 14,309,370
39,549 Virbac 7,301,549 13,655,083 12,749,433 Canadian Dollar Cash Management Fund, Series I 12,749,433 12,749,433
181,928 Edenred 5,160,424 12,224,420 256,498 Asiakastieto Group Oyj 10,175,005 11,764,202
86,659 Reckitt Benckiser Group PLC 9,601,272 9,138,256 782,159 Rightmove PLC 6,552,649 8,541,270 785,961 Auto Trader Group PLC 7,371,053 8,065,987
20,012 Anheuser-Busch InBev N.V./S.A. 1,922,701 2,130,948
The Equitable Life Invesco Europlus Fund is 100% invested in the Invesco Europlus Fund. The following is based on information as provided by Invesco Canada Ltd. This
fund has 21 holdings.
71
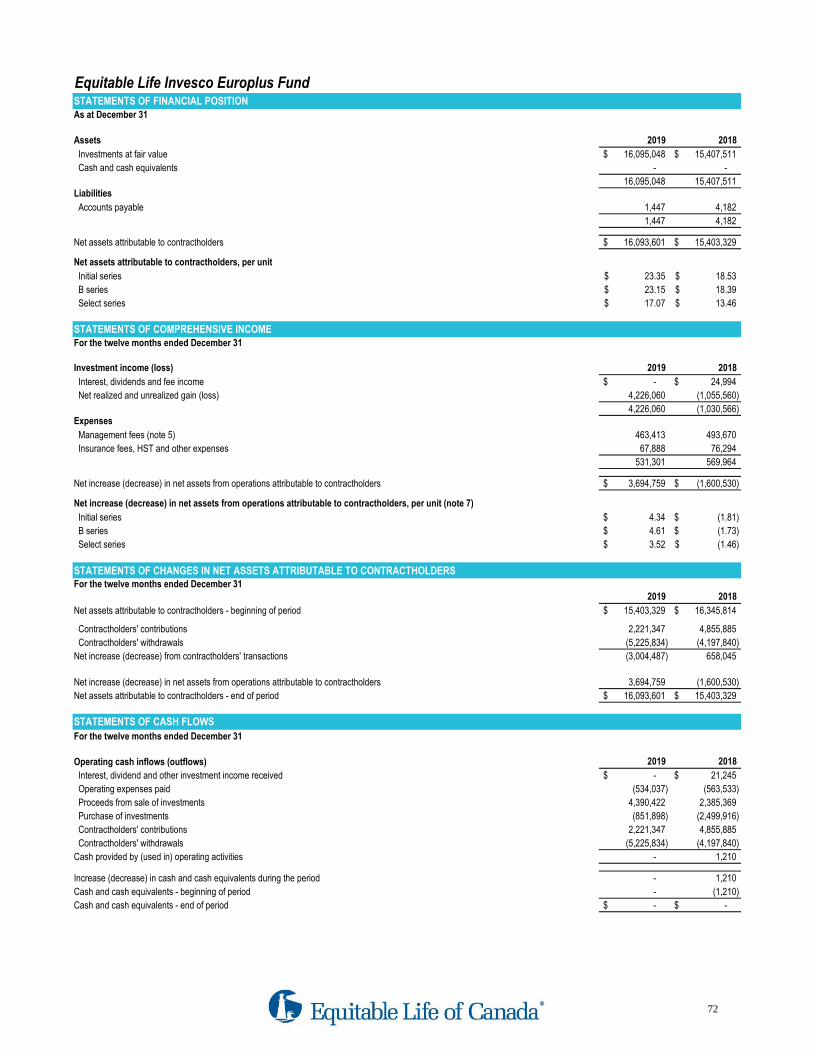
Equitable Life Invesco Europlus FundSTATEMENTS OF FINANCIAL POSITIONAs at December 31
Assets 2019 2018
Investments at fair value 16,095,048$ 15,407,511$
Cash and cash equivalents - -
16,095,048 15,407,511 Liabilities
Accounts payable 1,447 4,182
1,447 4,182
Net assets attributable to contractholders 16,093,601$ 15,403,329$
Net assets attributable to contractholders, per unit
Initial series 23.35$ 18.53$
B series 23.15$ 18.39$
Select series 17.07$ 13.46$
STATEMENTS OF COMPREHENSIVE INCOMEFor the twelve months ended December 31
Investment income (loss) 2019 2018
Interest, dividends and fee income -$ 24,994$
Net realized and unrealized gain (loss) 4,226,060 (1,055,560)
4,226,060 (1,030,566) Expenses
Management fees (note 5) 463,413 493,670
Insurance fees, HST and other expenses 67,888 76,294
531,301 569,964
Net increase (decrease) in net assets from operations attributable to contractholders 3,694,759$ (1,600,530)$
Net increase (decrease) in net assets from operations attributable to contractholders, per unit (note 7)
Initial series 4.34$ (1.81)$
B series 4.61$ (1.73)$
Select series 3.52$ (1.46)$
STATEMENTS OF CHANGES IN NET ASSETS ATTRIBUTABLE TO CONTRACTHOLDERSFor the twelve months ended December 31
2019 2018
Net assets attributable to contractholders - beginning of period 15,403,329$ 16,345,814$
Contractholders' contributions 2,221,347 4,855,885
Contractholders' withdrawals (5,225,834) (4,197,840)
Net increase (decrease) from contractholders' transactions (3,004,487) 658,045
Net increase (decrease) in net assets from operations attributable to contractholders 3,694,759 (1,600,530)
Net assets attributable to contractholders - end of period 16,093,601$ 15,403,329$
STATEMENTS OF CASH FLOWS
For the twelve months ended December 31
Operating cash inflows (outflows) 2019 2018
Interest, dividend and other investment income received -$ 21,245$
Operating expenses paid (534,037) (563,533)
Proceeds from sale of investments 4,390,422 2,385,369
Purchase of investments (851,898) (2,499,916)
Contractholders' contributions 2,221,347 4,855,885
Contractholders' withdrawals (5,225,834) (4,197,840)
Cash provided by (used in) operating activities - 1,210
Increase (decrease) in cash and cash equivalents during the period - 1,210
Cash and cash equivalents - beginning of period - (1,210)
Cash and cash equivalents - end of period -$ -$
72

Equitable Life Invesco Europlus FundANNUAL COMPOUND NET RETURNS - the following unaudited schedule is provided for Funds in existence for greater than 12 monthsAs at December 31
Since Inception
Date of inception 1 Year 3 Year 5 Year 10 Year (if <10 yrs)
Initial series January 2004 26.0% 8.7% 7.3% 9.1% N/A
B series September 2006 25.9% 8.6% 7.2% 9.1% N/A
Select series September 2013 26.8% 9.3% 7.9% N/A 8.0%
As at December 31¹
For the twelve months ended December 31² 2019 2019* 2018 2017 2016 2015
Net asset value per unit (Initial series)1$23.35 $18.53 $20.49 $18.17 $19.65
Net asset value per unit (B series)1$23.15 $18.39 $20.36 $18.07 $19.56
Net asset value per unit (Select series)1$17.07 $13.46 $14.82 $13.08 $14.06
Number of units outstanding (Initial series)1165,059 224,775 262,877 389,074 506,125
Number of units outstanding (B series)137,420 54,023 68,234 90,654 111,845
Number of units outstanding (Select series)1666,326 760,935 645,764 670,101 495,260
Management expense ratio (Initial series)23.62% 3.64% 3.65% 3.65% 3.65% 3.66%
Management expense ratio (B series)23.78% 3.80% 3.76% 3.76% 3.76% 3.76%
Management expense ratio (Select series)23.14% 3.16% 3.14% 3.15% 3.15% 3.15%
Net assets (000s)1$16,094 $15,403 $16,346 $17,471 $19,097
Portfolio turnover rate2 (note 6) 5.28% 14.17% 8.05% 20.32% 17.19%
* Represents the pro-forma management expense ratio as described in note 5.
For additional product or segregated fund information please refer to your contract and information folder.
FINANCIAL HIGHLIGHTS - the following unaudited schedule shows select key financial information about the Fund and is intended to help you
understand the Fund's financial performance for the past five years
73
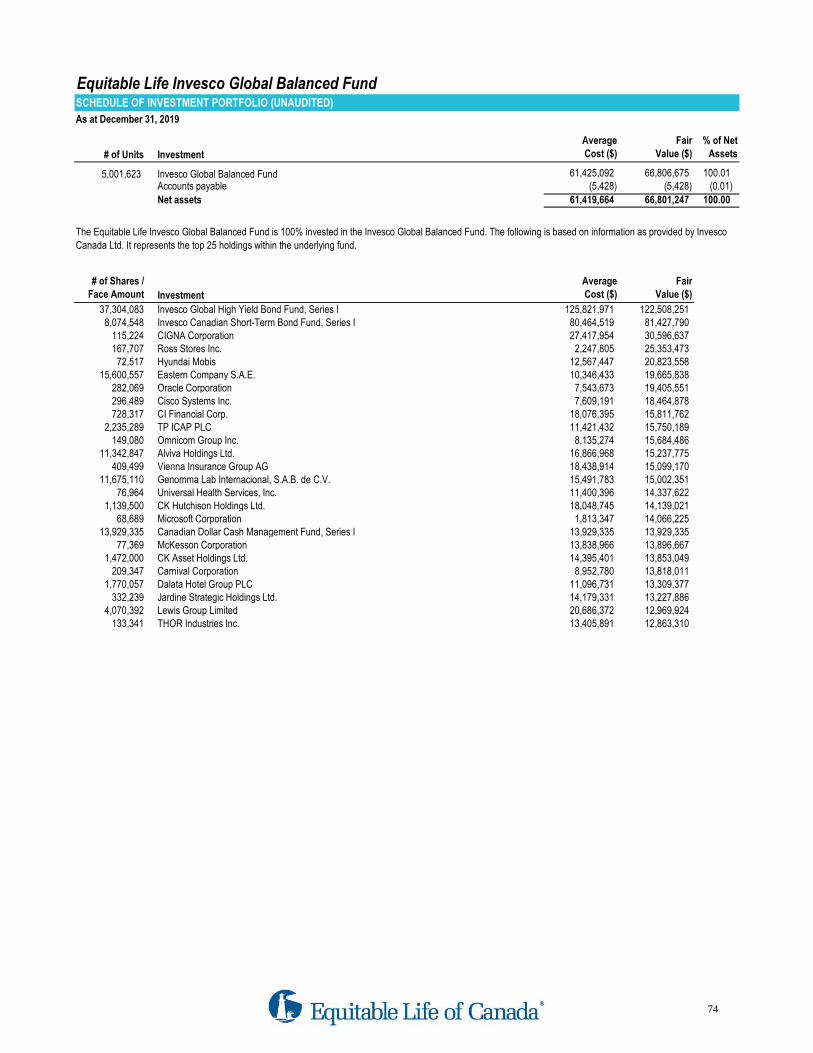
Equitable Life Invesco Global Balanced FundSCHEDULE OF INVESTMENT PORTFOLIO (UNAUDITED)
As at December 31, 2019
# of Units Investment
Average
Cost ($)
Fair
Value ($)
% of Net
Assets
5,001,623 Invesco Global Balanced Fund 61,425,092 66,806,675 100.01 Accounts payable (5,428) (5,428) (0.01)
Net assets 61,419,664 66,801,247 100.00
# of Shares /
Face Amount Investment
Average
Cost ($)
Fair
Value ($)
37,304,083 Invesco Global High Yield Bond Fund, Series I 125,821,971 122,508,251 8,074,548 Invesco Canadian Short-Term Bond Fund, Series I 80,464,519 81,427,790
115,224 CIGNA Corporation 27,417,954 30,596,637 167,707 Ross Stores Inc. 2,247,805 25,353,473
72,517 Hyundai Mobis 12,567,447 20,823,558 15,600,557 Eastern Company S.A.E. 10,346,433 19,665,838
282,069 Oracle Corporation 7,543,673 19,405,551 296,489 Cisco Systems Inc. 7,609,191 18,464,878 728,317 CI Financial Corp. 18,076,395 15,811,762
2,235,289 TP ICAP PLC 11,421,432 15,750,189 149,080 Omnicom Group Inc. 8,135,274 15,684,486
11,342,847 Alviva Holdings Ltd. 16,866,968 15,237,775 409,499 Vienna Insurance Group AG 18,438,914 15,099,170
11,675,110 Genomma Lab Internacional, S.A.B. de C.V. 15,491,783 15,002,351 76,964 Universal Health Services, Inc. 11,400,396 14,337,622
1,139,500 CK Hutchison Holdings Ltd. 18,048,745 14,139,021 68,689 Microsoft Corporation 1,813,347 14,066,225
13,929,335 Canadian Dollar Cash Management Fund, Series I 13,929,335 13,929,335 77,369 McKesson Corporation 13,838,966 13,896,667
1,472,000 CK Asset Holdings Ltd. 14,395,401 13,853,049 209,347 Carnival Corporation 8,952,780 13,818,011
1,770,057 Dalata Hotel Group PLC 11,096,731 13,309,377 332,239 Jardine Strategic Holdings Ltd. 14,179,331 13,227,886
4,070,392 Lewis Group Limited 20,686,372 12,969,924 133,341 THOR Industries Inc. 13,405,891 12,863,310
The Equitable Life Invesco Global Balanced Fund is 100% invested in the Invesco Global Balanced Fund. The following is based on information as provided by Invesco
Canada Ltd. It represents the top 25 holdings within the underlying fund.
74

Equitable Life Invesco Global Balanced FundSTATEMENTS OF FINANCIAL POSITIONAs at December 31
Assets 2019 2018
Investments at fair value 66,806,675$ 68,866,678$
Cash and cash equivalents - -
66,806,675 68,866,678 Liabilities
Accounts payable 5,428 16,689
5,428 16,689
Net assets attributable to contractholders 66,801,247$ 68,849,989$
Net assets attributable to contractholders, per unit
Initial series 16.86$ 15.87$
B series 16.18$ 15.30$
Select series 13.35$ 12.51$
STATEMENTS OF COMPREHENSIVE INCOMEFor the twelve months ended December 31
Investment income (loss) 2019 2018
Interest, dividends and fee income 2,686,170$ 2,441,026$
Net realized and unrealized gain (loss) 4,162,921 (6,164,005)
6,849,091 (3,722,979) Expenses
Management fees (note 5) 1,827,392 1,804,531
Insurance fees, HST and other expenses 577,469 562,333
2,404,861 2,366,864
Net increase (decrease) in net assets from operations attributable to contractholders 4,444,230$ (6,089,843)$
Net increase (decrease) in net assets from operations attributable to contractholders, per unit (note 7)
Initial series 0.99$ (1.46)$
B series 0.88$ (1.44)$
Select series 0.85$ (1.21)$
STATEMENTS OF CHANGES IN NET ASSETS ATTRIBUTABLE TO CONTRACTHOLDERSFor the twelve months ended December 31
2019 2018
Net assets attributable to contractholders - beginning of period 68,849,989$ 58,756,193$
Contractholders' contributions 12,301,376 31,589,126
Contractholders' withdrawals (18,794,348) (15,405,487)
Net increase (decrease) from contractholders' transactions (6,492,972) 16,183,639
Net increase (decrease) in net assets from operations attributable to contractholders 4,444,230 (6,089,843)
Net assets attributable to contractholders - end of period 66,801,247$ 68,849,989$
STATEMENTS OF CASH FLOWS
For the twelve months ended December 31
Operating cash inflows (outflows) 2019 2018
Interest, dividend and other investment income received 2,332,506$ 2,101,713$
Operating expenses paid (2,062,459) (2,015,652)
Proceeds from sale of investments 11,878,634 3,146,289
Purchase of investments (5,655,709) (19,415,989)
Contractholders' contributions 12,301,376 31,589,126
Contractholders' withdrawals (18,794,348) (15,405,487)
Cash provided by (used in) operating activities - -
Increase (decrease) in cash and cash equivalents during the period - -
Cash and cash equivalents - beginning of period - -
Cash and cash equivalents - end of period -$ -$
75

Equitable Life Invesco Global Balanced FundANNUAL COMPOUND NET RETURNS - the following unaudited schedule is provided for Funds in existence for greater than 12 monthsAs at December 31
Since Inception
Date of inception 1 Year 3 Year 5 Year 10 Year (if <10 yrs)
Initial series January 2004 6.3% 2.4% 2.7% 5.7% N/A
B series September 2006 5.8% 1.9% 2.3% 5.3% N/A
Select series September 2013 6.7% 2.8% 3.1% N/A 4.3%
As at December 31¹
For the twelve months ended December 31² 2019 2019* 2018 2017 2016 2015
Net asset value per unit (Initial series)1$16.86 $15.87 $17.32 $15.92 $15.67
Net asset value per unit (B series)1$16.18 $15.30 $16.77 $15.28 $15.30
Net asset value per unit (Select series)1$13.35 $12.51 $13.60 $12.30 $12.21
Number of units outstanding (Initial series)1451,135 536,626 535,218 572,917 588,342
Number of units outstanding (B series)138,911 48,927 51,523 59,972 59,506
Number of units outstanding (Select series)14,386,046 4,762,512 3,574,618 2,764,069 1,735,633
Management expense ratio (Initial series)23.29% 3.29% 3.30% 3.30% 3.30% 3.31%
Management expense ratio (B series)23.72% 3.72% 3.72% 3.72% 3.72% 3.73%
Management expense ratio (Select series)22.91% 2.91% 2.91% 2.91% 2.91% 2.90%
Net assets (000s)1$66,801 $68,850 $58,756 $43,905 $31,329
Portfolio turnover rate2 (note 6) 8.19% 4.65% 5.84% 5.22% 4.28%
* Represents the pro-forma management expense ratio as described in note 5.
For additional product or segregated fund information please refer to your contract and information folder.
FINANCIAL HIGHLIGHTS - the following unaudited schedule shows select key financial information about the Fund and is intended to help you
understand the Fund's financial performance for the past five years
76
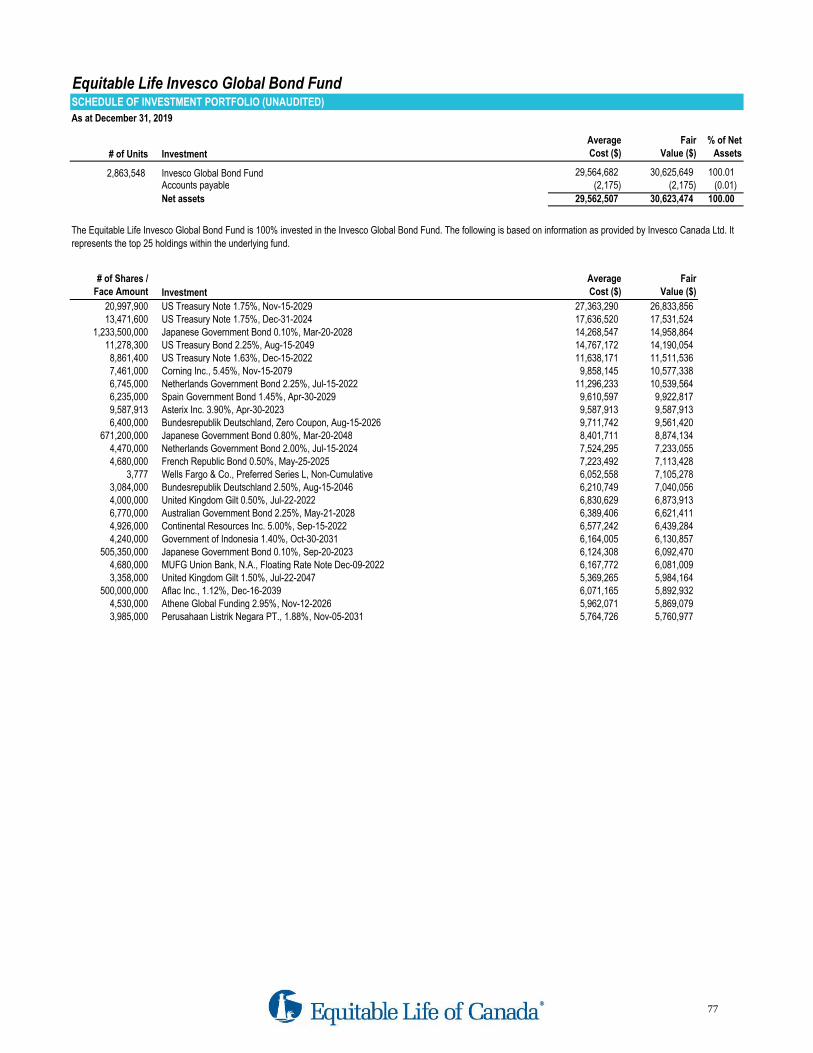
Equitable Life Invesco Global Bond FundSCHEDULE OF INVESTMENT PORTFOLIO (UNAUDITED)
As at December 31, 2019
# of Units Investment
Average
Cost ($)
Fair
Value ($)
% of Net
Assets
2,863,548 Invesco Global Bond Fund 29,564,682 30,625,649 100.01 Accounts payable (2,175) (2,175) (0.01)
Net assets 29,562,507 30,623,474 100.00
# of Shares /
Face Amount Investment
Average
Cost ($)
Fair
Value ($)
20,997,900 US Treasury Note 1.75%, Nov-15-2029 27,363,290 26,833,856 13,471,600 US Treasury Note 1.75%, Dec-31-2024 17,636,520 17,531,524
1,233,500,000 Japanese Government Bond 0.10%, Mar-20-2028 14,268,547 14,958,864 11,278,300 US Treasury Bond 2.25%, Aug-15-2049 14,767,172 14,190,054 8,861,400 US Treasury Note 1.63%, Dec-15-2022 11,638,171 11,511,536 7,461,000 Corning Inc., 5.45%, Nov-15-2079 9,858,145 10,577,338 6,745,000 Netherlands Government Bond 2.25%, Jul-15-2022 11,296,233 10,539,564 6,235,000 Spain Government Bond 1.45%, Apr-30-2029 9,610,597 9,922,817 9,587,913 Asterix Inc. 3.90%, Apr-30-2023 9,587,913 9,587,913 6,400,000 Bundesrepublik Deutschland, Zero Coupon, Aug-15-2026 9,711,742 9,561,420
671,200,000 Japanese Government Bond 0.80%, Mar-20-2048 8,401,711 8,874,134 4,470,000 Netherlands Government Bond 2.00%, Jul-15-2024 7,524,295 7,233,055 4,680,000 French Republic Bond 0.50%, May-25-2025 7,223,492 7,113,428
3,777 Wells Fargo & Co., Preferred Series L, Non-Cumulative 6,052,558 7,105,278 3,084,000 Bundesrepublik Deutschland 2.50%, Aug-15-2046 6,210,749 7,040,056 4,000,000 United Kingdom Gilt 0.50%, Jul-22-2022 6,830,629 6,873,913 6,770,000 Australian Government Bond 2.25%, May-21-2028 6,389,406 6,621,411 4,926,000 Continental Resources Inc. 5.00%, Sep-15-2022 6,577,242 6,439,284 4,240,000 Government of Indonesia 1.40%, Oct-30-2031 6,164,005 6,130,857
505,350,000 Japanese Government Bond 0.10%, Sep-20-2023 6,124,308 6,092,470 4,680,000 MUFG Union Bank, N.A., Floating Rate Note Dec-09-2022 6,167,772 6,081,009 3,358,000 United Kingdom Gilt 1.50%, Jul-22-2047 5,369,265 5,984,164
500,000,000 Aflac Inc., 1.12%, Dec-16-2039 6,071,165 5,892,932 4,530,000 Athene Global Funding 2.95%, Nov-12-2026 5,962,071 5,869,079 3,985,000 Perusahaan Listrik Negara PT., 1.88%, Nov-05-2031 5,764,726 5,760,977
The Equitable Life Invesco Global Bond Fund is 100% invested in the Invesco Global Bond Fund. The following is based on information as provided by Invesco Canada Ltd. It
represents the top 25 holdings within the underlying fund.
77

Equitable Life Invesco Global Bond FundSTATEMENTS OF FINANCIAL POSITIONAs at December 31
Assets 2019 2018
Investments at fair value 30,625,649$ 27,082,010$
Cash and cash equivalents - -
30,625,649 27,082,010 Liabilities
Accounts payable 2,175 5,813
2,175 5,813
Net assets attributable to contractholders 30,623,474$ 27,076,197$
Net assets attributable to contractholders, per unit
Initial series 19.72$ 19.29$
Select series 12.00$ 11.70$
STATEMENTS OF COMPREHENSIVE INCOMEFor the twelve months ended December 31
Investment income (loss) 2019 2018
Interest, dividends and fee income 755,784$ 1,565,214$
Net realized and unrealized gain (loss) 707,990 186,871
1,463,774 1,752,085 Expenses
Management fees (note 5) 666,638 645,014
Insurance fees, HST and other expenses 106,431 144,531
773,069 789,545
Net increase (decrease) in net assets from operations attributable to contractholders 690,705$ 962,540$
Net increase (decrease) in net assets from operations attributable to contractholders, per unit (note 7)
Initial series 0.39$ 0.62$
Select series 0.31$ 0.42$
STATEMENTS OF CHANGES IN NET ASSETS ATTRIBUTABLE TO CONTRACTHOLDERSFor the twelve months ended December 31
2019 2018
Net assets attributable to contractholders - beginning of period 27,076,197$ 28,444,475$
Contractholders' contributions 11,588,275 5,522,156
Contractholders' withdrawals (8,731,703) (7,852,974)
Net increase (decrease) from contractholders' transactions 2,856,572 (2,330,818)
Net increase (decrease) in net assets from operations attributable to contractholders 690,705 962,540
Net assets attributable to contractholders - end of period 30,623,474$ 27,076,197$
STATEMENTS OF CASH FLOWS
For the twelve months ended December 31
Operating cash inflows (outflows) 2019 2018
Interest, dividend and other investment income received 736,486$ 1,505,093$
Operating expenses paid (757,408) (725,668)
Proceeds from sale of investments 33,182,035 4,921,710
Purchase of investments (36,017,685) (3,373,036)
Contractholders' contributions 11,588,275 5,522,156
Contractholders' withdrawals (8,731,703) (7,852,974)
Cash provided by (used in) operating activities - (2,719)
Increase (decrease) in cash and cash equivalents during the period - (2,719)
Cash and cash equivalents - beginning of period - 2,719
Cash and cash equivalents - end of period -$ -$
78

Equitable Life Invesco Global Bond FundANNUAL COMPOUND NET RETURNS - the following unaudited schedule is provided for Funds in existence for greater than 12 monthsAs at December 31
Since Inception
Date of inception 1 Year 3 Year 5 Year 10 Year (if <10 yrs)
Initial series February 1999 2.2% 1.7% 1.5% 2.6% N/A
Select series September 2013 2.6% 2.1% 1.9% N/A 2.3%
As at December 31¹
For the twelve months ended December 31² 2019 2019* 2018 2017 2016 2015
Net asset value per unit (Initial series)1$19.72 $19.29 $18.66 $18.76 $19.28
Net asset value per unit (Select series)1$12.00 $11.70 $11.27 $11.29 $11.57
Number of units outstanding (Initial series)1605,072 636,530 764,461 925,753 1,054,227
Number of units outstanding (Select series)11,557,778 1,265,237 1,257,889 1,207,617 720,102
Management expense ratio (Initial series)22.82% 2.84% 2.83% 2.83% 2.82% 2.83%
Management expense ratio (Select series)22.45% 2.47% 2.46% 2.46% 2.45% 2.44%
Net assets (000s)1$30,623 $27,076 $28,444 $31,002 $28,659
Portfolio turnover rate2 (note 6) 114.85% 12.23% 14.53% 12.72% 10.72%
* Represents the pro-forma management expense ratio as described in note 5.
For additional product or segregated fund information please refer to your contract and information folder.
FINANCIAL HIGHLIGHTS - the following unaudited schedule shows select key financial information about the Fund and is intended to help you
understand the Fund's financial performance for the past five years
79
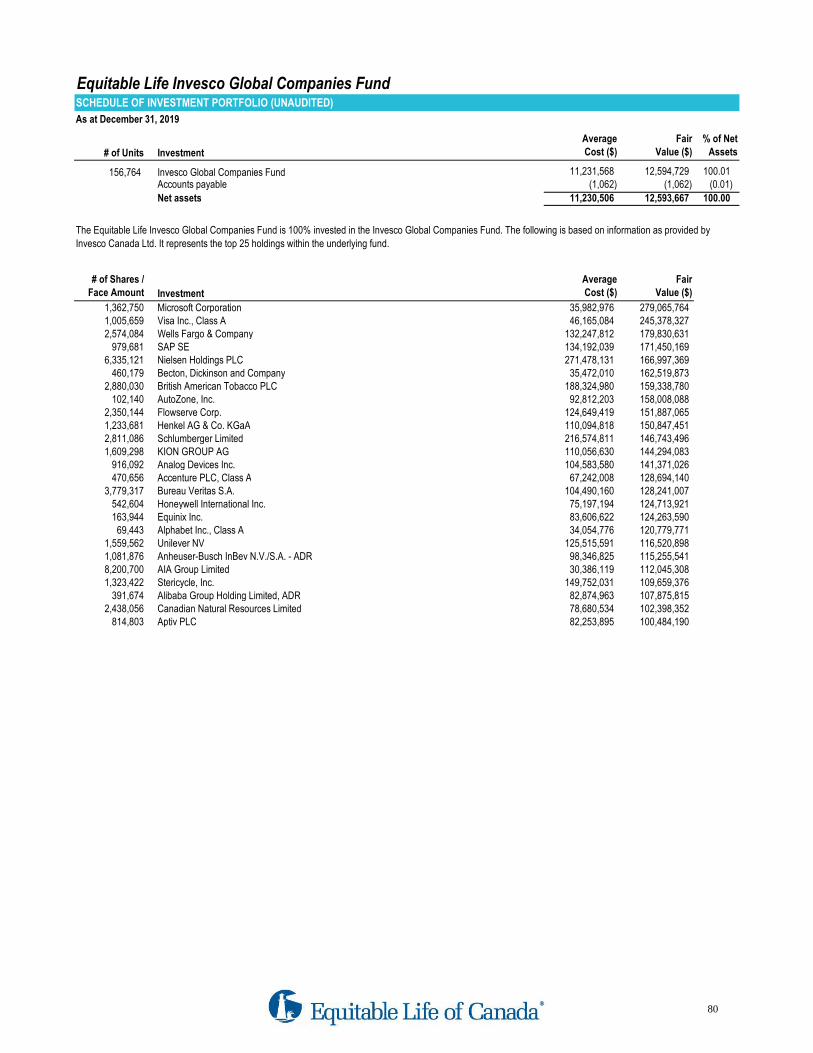
Equitable Life Invesco Global Companies FundSCHEDULE OF INVESTMENT PORTFOLIO (UNAUDITED)
As at December 31, 2019
# of Units Investment
Average
Cost ($)
Fair
Value ($)
% of Net
Assets
156,764 Invesco Global Companies Fund 11,231,568 12,594,729 100.01 Accounts payable (1,062) (1,062) (0.01)
Net assets 11,230,506 12,593,667 100.00
# of Shares /
Face Amount Investment
Average
Cost ($)
Fair
Value ($)
1,362,750 Microsoft Corporation 35,982,976 279,065,764 1,005,659 Visa Inc., Class A 46,165,084 245,378,327 2,574,084 Wells Fargo & Company 132,247,812 179,830,631
979,681 SAP SE 134,192,039 171,450,169 6,335,121 Nielsen Holdings PLC 271,478,131 166,997,369
460,179 Becton, Dickinson and Company 35,472,010 162,519,873 2,880,030 British American Tobacco PLC 188,324,980 159,338,780
102,140 AutoZone, Inc. 92,812,203 158,008,088 2,350,144 Flowserve Corp. 124,649,419 151,887,065 1,233,681 Henkel AG & Co. KGaA 110,094,818 150,847,451 2,811,086 Schlumberger Limited 216,574,811 146,743,496 1,609,298 KION GROUP AG 110,056,630 144,294,083
916,092 Analog Devices Inc. 104,583,580 141,371,026 470,656 Accenture PLC, Class A 67,242,008 128,694,140
3,779,317 Bureau Veritas S.A. 104,490,160 128,241,007 542,604 Honeywell International Inc. 75,197,194 124,713,921 163,944 Equinix Inc. 83,606,622 124,263,590
69,443 Alphabet Inc., Class A 34,054,776 120,779,771 1,559,562 Unilever NV 125,515,591 116,520,898 1,081,876 Anheuser-Busch InBev N.V./S.A. - ADR 98,346,825 115,255,541 8,200,700 AIA Group Limited 30,386,119 112,045,308 1,323,422 Stericycle, Inc. 149,752,031 109,659,376
391,674 Alibaba Group Holding Limited, ADR 82,874,963 107,875,815 2,438,056 Canadian Natural Resources Limited 78,680,534 102,398,352
814,803 Aptiv PLC 82,253,895 100,484,190
The Equitable Life Invesco Global Companies Fund is 100% invested in the Invesco Global Companies Fund. The following is based on information as provided by
Invesco Canada Ltd. It represents the top 25 holdings within the underlying fund.
80

Equitable Life Invesco Global Companies FundSTATEMENTS OF FINANCIAL POSITIONAs at December 31
Assets 2019 2018
Investments at fair value 12,594,729$ 8,662,186$
Cash and cash equivalents - -
12,594,729 8,662,186 Liabilities
Accounts payable 1,062 2,186
1,062 2,186
Net assets attributable to contractholders 12,593,667$ 8,660,000$
Net assets attributable to contractholders, per unit
Select series 11.68$ 9.73$
STATEMENTS OF COMPREHENSIVE INCOMEFor the twelve months ended December 31
Investment income (loss) 2019 2018
Interest, dividends and fee income 279,979$ 201,355$
Net realized and unrealized gain (loss) 2,053,736 (617,489)
2,333,715 (416,134) Expenses
Management fees (note 5) 316,427 154,896
Insurance fees, HST and other expenses 78,139 50,192
394,566 205,088
Net increase (decrease) in net assets from operations attributable to contractholders 1,939,149$ (621,222)$
Net increase (decrease) in net assets from operations attributable to contractholders, per unit (note 7)
Select series 1.82$ (1.13)$
STATEMENTS OF CHANGES IN NET ASSETS ATTRIBUTABLE TO CONTRACTHOLDERSFor the twelve months ended December 31
2019 2018
Net assets attributable to contractholders - beginning of period 8,660,000$ 2,231,895$
Contractholders' contributions 5,311,019 7,751,548
Contractholders' withdrawals (3,316,501) (702,221)
Net increase (decrease) from contractholders' transactions 1,994,518 7,049,327
Net increase (decrease) in net assets from operations attributable to contractholders 1,939,149 (621,222)
Net assets attributable to contractholders - end of period 12,593,667$ 8,660,000$
STATEMENTS OF CASH FLOWS
For the twelve months ended December 31
Operating cash inflows (outflows) 2019 2018
Interest, dividend and other investment income received 246,386$ 172,975$
Operating expenses paid (362,098) (174,700)
Proceeds from sale of investments 2,363,906 190,198
Purchase of investments (4,242,712) (7,237,800)
Contractholders' contributions 5,311,019 7,751,548
Contractholders' withdrawals (3,316,501) (702,221)
Cash provided by (used in) operating activities - -
Increase (decrease) in cash and cash equivalents during the period - -
Cash and cash equivalents - beginning of period - -
Cash and cash equivalents - end of period -$ -$
81

Equitable Life Invesco Global Companies FundANNUAL COMPOUND NET RETURNS - the following unaudited schedule is provided for Funds in existence for greater than 12 monthsAs at December 31
Since Inception
Date of inception 1 Year 3 Year 5 Year 10 Year (if <10 yrs)
Select series May 2017 20.0% N/A N/A N/A 6.2%
As at December 31¹
For the twelve months ended December 31² 2019 2019* 2018 2017 2016 2015
Net asset value per unit (Select series)1$11.68 $9.73 $10.26 N/A N/A
Number of units outstanding (Select series)11,078,525 889,769 217,482 N/A N/A
Management expense ratio (Select series)23.08% 3.11% 3.09% 3.12% N/A N/A
Net assets (000s)1$12,594 $8,660 $2,232 N/A N/A
Portfolio turnover rate2 (note 6) 20.36% 3.34% 11.45% N/A N/A
* Represents the pro-forma management expense ratio as described in note 5.
For additional product or segregated fund information please refer to your contract and information folder.
FINANCIAL HIGHLIGHTS - the following unaudited schedule shows select key financial information about the Fund and is intended to help you
understand the Fund's financial performance for the past five years
82
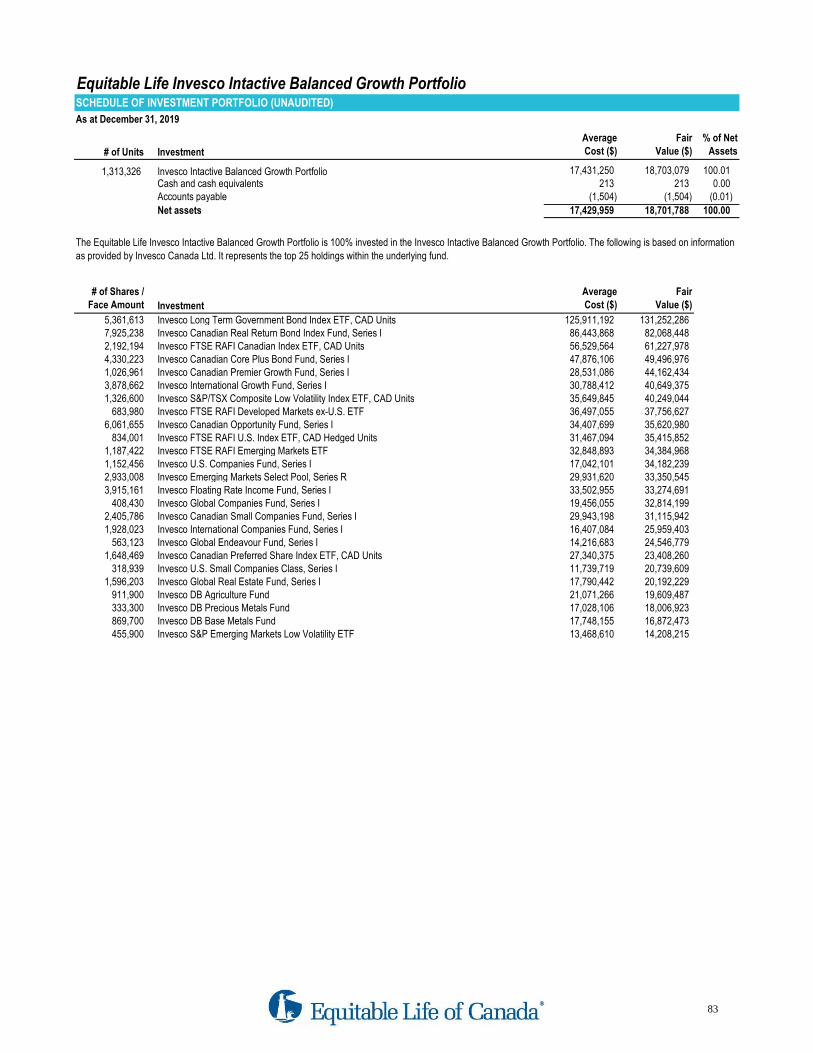
Equitable Life Invesco Intactive Balanced Growth PortfolioSCHEDULE OF INVESTMENT PORTFOLIO (UNAUDITED)
As at December 31, 2019
# of Units Investment
Average
Cost ($)
Fair
Value ($)
% of Net
Assets
1,313,326 Invesco Intactive Balanced Growth Portfolio 17,431,250 18,703,079 100.01 Cash and cash equivalents 213 213 0.00 Accounts payable (1,504) (1,504) (0.01)
Net assets 17,429,959 18,701,788 100.00
# of Shares /
Face Amount Investment
Average
Cost ($)
Fair
Value ($)
5,361,613 Invesco Long Term Government Bond Index ETF, CAD Units 125,911,192 131,252,286 7,925,238 Invesco Canadian Real Return Bond Index Fund, Series I 86,443,868 82,068,448 2,192,194 Invesco FTSE RAFI Canadian Index ETF, CAD Units 56,529,564 61,227,978 4,330,223 Invesco Canadian Core Plus Bond Fund, Series I 47,876,106 49,496,976 1,026,961 Invesco Canadian Premier Growth Fund, Series I 28,531,086 44,162,434 3,878,662 Invesco International Growth Fund, Series I 30,788,412 40,649,375 1,326,600 Invesco S&P/TSX Composite Low Volatility Index ETF, CAD Units 35,649,845 40,249,044
683,980 Invesco FTSE RAFI Developed Markets ex-U.S. ETF 36,497,055 37,756,627 6,061,655 Invesco Canadian Opportunity Fund, Series I 34,407,699 35,620,980
834,001 Invesco FTSE RAFI U.S. Index ETF, CAD Hedged Units 31,467,094 35,415,852 1,187,422 Invesco FTSE RAFI Emerging Markets ETF 32,848,893 34,384,968 1,152,456 Invesco U.S. Companies Fund, Series I 17,042,101 34,182,239 2,933,008 Invesco Emerging Markets Select Pool, Series R 29,931,620 33,350,545 3,915,161 Invesco Floating Rate Income Fund, Series I 33,502,955 33,274,691
408,430 Invesco Global Companies Fund, Series I 19,456,055 32,814,199 2,405,786 Invesco Canadian Small Companies Fund, Series I 29,943,198 31,115,942 1,928,023 Invesco International Companies Fund, Series I 16,407,084 25,959,403
563,123 Invesco Global Endeavour Fund, Series I 14,216,683 24,546,779 1,648,469 Invesco Canadian Preferred Share Index ETF, CAD Units 27,340,375 23,408,260
318,939 Invesco U.S. Small Companies Class, Series I 11,739,719 20,739,609 1,596,203 Invesco Global Real Estate Fund, Series I 17,790,442 20,192,229
911,900 Invesco DB Agriculture Fund 21,071,266 19,609,487 333,300 Invesco DB Precious Metals Fund 17,028,106 18,006,923 869,700 Invesco DB Base Metals Fund 17,748,155 16,872,473 455,900 Invesco S&P Emerging Markets Low Volatility ETF 13,468,610 14,208,215
The Equitable Life Invesco Intactive Balanced Growth Portfolio is 100% invested in the Invesco Intactive Balanced Growth Portfolio. The following is based on information
as provided by Invesco Canada Ltd. It represents the top 25 holdings within the underlying fund.
83
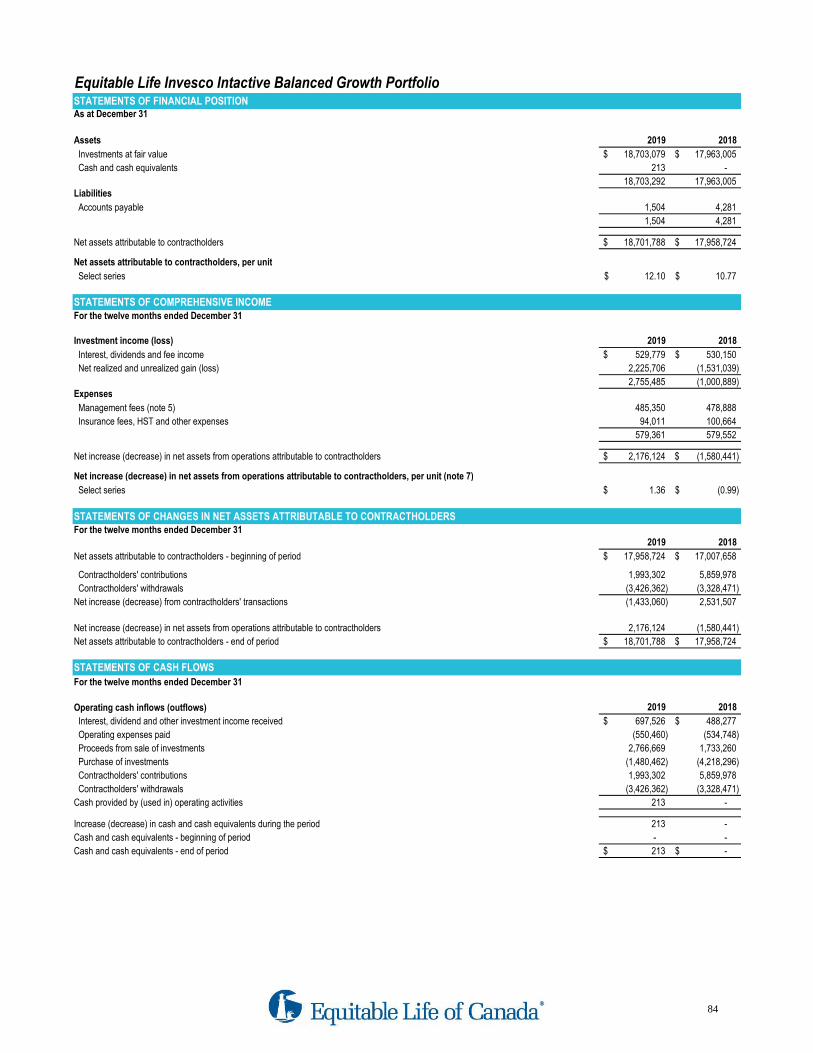
Equitable Life Invesco Intactive Balanced Growth PortfolioSTATEMENTS OF FINANCIAL POSITIONAs at December 31
Assets 2019 2018
Investments at fair value 18,703,079$ 17,963,005$
Cash and cash equivalents 213 -
18,703,292 17,963,005 Liabilities
Accounts payable 1,504 4,281
1,504 4,281
Net assets attributable to contractholders 18,701,788$ 17,958,724$
Net assets attributable to contractholders, per unit
Select series 12.10$ 10.77$
STATEMENTS OF COMPREHENSIVE INCOMEFor the twelve months ended December 31
Investment income (loss) 2019 2018
Interest, dividends and fee income 529,779$ 530,150$
Net realized and unrealized gain (loss) 2,225,706 (1,531,039)
2,755,485 (1,000,889) Expenses
Management fees (note 5) 485,350 478,888
Insurance fees, HST and other expenses 94,011 100,664
579,361 579,552
Net increase (decrease) in net assets from operations attributable to contractholders 2,176,124$ (1,580,441)$
Net increase (decrease) in net assets from operations attributable to contractholders, per unit (note 7)
Select series 1.36$ (0.99)$
STATEMENTS OF CHANGES IN NET ASSETS ATTRIBUTABLE TO CONTRACTHOLDERSFor the twelve months ended December 31
2019 2018
Net assets attributable to contractholders - beginning of period 17,958,724$ 17,007,658$
Contractholders' contributions 1,993,302 5,859,978
Contractholders' withdrawals (3,426,362) (3,328,471)
Net increase (decrease) from contractholders' transactions (1,433,060) 2,531,507
Net increase (decrease) in net assets from operations attributable to contractholders 2,176,124 (1,580,441)
Net assets attributable to contractholders - end of period 18,701,788$ 17,958,724$
STATEMENTS OF CASH FLOWS
For the twelve months ended December 31
Operating cash inflows (outflows) 2019 2018
Interest, dividend and other investment income received 697,526$ 488,277$
Operating expenses paid (550,460) (534,748)
Proceeds from sale of investments 2,766,669 1,733,260
Purchase of investments (1,480,462) (4,218,296)
Contractholders' contributions 1,993,302 5,859,978
Contractholders' withdrawals (3,426,362) (3,328,471)
Cash provided by (used in) operating activities 213 -
Increase (decrease) in cash and cash equivalents during the period 213 -
Cash and cash equivalents - beginning of period - -
Cash and cash equivalents - end of period 213$ -$
84

Equitable Life Invesco Intactive Balanced Growth PortfolioANNUAL COMPOUND NET RETURNS - the following unaudited schedule is provided for Funds in existence for greater than 12 monthsAs at December 31
Since Inception
Date of inception 1 Year 3 Year 5 Year 10 Year (if <10 yrs)
Select series September 2013 12.4% 3.2% 2.3% N/A 3.1%
As at December 31¹
For the twelve months ended December 31² 2019 2019* 2018 2017 2016 2015
Net asset value per unit (Select series)1$12.10 $10.77 $11.72 $11.01 $10.41
Number of units outstanding (Select series)11,545,422 1,668,051 1,451,312 1,221,424 898,583
Management expense ratio (Select series)23.13% 3.15% 3.12% 3.10% 3.11% 3.10%
Net assets (000s)1$18,702 $17,959 $17,008 $13,445 $9,356
Portfolio turnover rate2 (note 6) 7.93% 9.45% 14.08% 8.19% 6.99%
* Represents the pro-forma management expense ratio as described in note 5.
For additional product or segregated fund information please refer to your contract and information folder.
FINANCIAL HIGHLIGHTS - the following unaudited schedule shows select key financial information about the Fund and is intended to help you
understand the Fund's financial performance for the past five years
85

Equitable Life Invesco Intactive Balanced Income PortfolioSCHEDULE OF INVESTMENT PORTFOLIO (UNAUDITED)
As at December 31, 2019
# of Units Investment
Average
Cost ($)
Fair
Value ($)
% of Net
Assets
573,726 Invesco Intactive Balanced Income Portfolio 7,078,977 7,419,419 100.01 Cash and cash equivalents (306) (306) (0.00) Accounts payable (576) (576) (0.01)
Net assets 7,078,095 7,418,537 100.00
# of Shares /
Face Amount Investment
Average
Cost ($)
Fair
Value ($)
6,873,755 Invesco Canadian Core Plus Bond Fund, Series I 76,327,750 78,571,030 6,290,224 Invesco Canadian Real Return Bond Index Fund, Series I 69,349,779 65,137,335 2,558,967 Invesco Long Term Government Bond Index ETF, CAD Units 60,118,859 62,643,512 4,663,039 Invesco Floating Rate Income Fund, Series I 39,766,239 39,630,856
881,055 Invesco FTSE RAFI Canadian Index ETF, CAD Units 22,890,394 24,607,866 364,786 Invesco FTSE RAFI Developed Markets ex-U.S. ETF 19,459,241 20,136,683 447,313 Invesco FTSE RAFI U.S. Index ETF, CAD Hedged Units 16,878,882 18,995,147 637,454 Invesco FTSE RAFI Emerging Markets ETF 17,591,345 18,459,179 359,326 Invesco Canadian Premier Growth Fund, Series I 10,398,452 15,452,098 469,900 Invesco S&P/TSX Composite Low Volatility Index ETF, CAD Units 12,639,193 14,256,766
1,210,170 Invesco International Growth Fund, Series I 9,566,130 12,682,895 2,128,212 Invesco Canadian Opportunity Fund, Series I 11,956,187 12,506,323
841,153 Invesco Canadian Small Companies Fund, Series I 10,372,636 10,879,304 363,740 Invesco U.S. Companies Fund, Series I 5,482,424 10,788,644 127,951 Invesco Global Companies Fund, Series I 6,051,719 10,279,888 807,842 Invesco Emerging Markets Select Pool, Series R 8,281,220 9,185,781 390,000 Invesco DB Agriculture Fund 8,853,064 8,386,555 574,992 Invesco Canadian Preferred Share Index ETF, CAD Units 9,508,674 8,164,886 604,517 Invesco International Companies Fund, Series I 5,174,555 8,139,372 144,100 Invesco DB Precious Metals Fund 7,302,318 7,785,171 176,651 Invesco Global Endeavour Fund, Series I 4,665,170 7,700,291 375,200 Invesco DB Base Metals Fund 7,692,738 7,279,006 509,087 Invesco Global Real Estate Fund, Series I 5,571,444 6,440,032
97,682 Invesco U.S. Small Companies Class, Series I 3,629,817 6,351,960 256,000 Invesco DB Energy Fund 4,711,764 4,863,433
The Equitable Life Invesco Intactive Balanced Income Portfolio is 100% invested in the Invesco Intactive Balanced Income Portfolio. The following is based on information
as provided by Invesco Canada Ltd. It represents the top 25 holdings within the underlying fund.
86

Equitable Life Invesco Intactive Balanced Income PortfolioSTATEMENTS OF FINANCIAL POSITIONAs at December 31
Assets 2019 2018
Investments at fair value 7,419,419$ 7,843,311$
Cash and cash equivalents (306) (585)
7,419,113 7,842,726 Liabilities
Accounts payable 576 1,815
576 1,815
Net assets attributable to contractholders 7,418,537$ 7,840,911$
Net assets attributable to contractholders, per unit
Select series 11.87$ 10.76$
STATEMENTS OF COMPREHENSIVE INCOMEFor the twelve months ended December 31
Investment income (loss) 2019 2018
Interest, dividends and fee income 220,605$ 255,726$
Net realized and unrealized gain (loss) 788,461 (561,066)
1,009,066 (305,340) Expenses
Management fees (note 5) 195,718 219,975
Insurance fees, HST and other expenses 38,128 37,511
233,846 257,486
Net increase (decrease) in net assets from operations attributable to contractholders 775,220$ (562,826)$
Net increase (decrease) in net assets from operations attributable to contractholders, per unit (note 7)
Select series 1.14$ (0.73)$
STATEMENTS OF CHANGES IN NET ASSETS ATTRIBUTABLE TO CONTRACTHOLDERSFor the twelve months ended December 31
2019 2018
Net assets attributable to contractholders - beginning of period 7,840,911$ 8,692,851$
Contractholders' contributions 1,003,915 2,982,222
Contractholders' withdrawals (2,201,509) (3,271,336)
Net increase (decrease) from contractholders' transactions (1,197,594) (289,114)
Net increase (decrease) in net assets from operations attributable to contractholders 775,220 (562,826)
Net assets attributable to contractholders - end of period 7,418,537$ 7,840,911$
STATEMENTS OF CASH FLOWS
For the twelve months ended December 31
Operating cash inflows (outflows) 2019 2018
Interest, dividend and other investment income received 297,727$ 252,270$
Operating expenses paid (222,033) (246,639)
Proceeds from sale of investments 1,917,835 2,157,095
Purchase of investments (795,656) (1,874,197)
Contractholders' contributions 1,003,915 2,982,222
Contractholders' withdrawals (2,201,509) (3,271,336)
Cash provided by (used in) operating activities 279 (585)
Increase (decrease) in cash and cash equivalents during the period 279 (585)
Cash and cash equivalents - beginning of period (585) -
Cash and cash equivalents - end of period (306)$ (585)$
87

Equitable Life Invesco Intactive Balanced Income PortfolioANNUAL COMPOUND NET RETURNS - the following unaudited schedule is provided for Funds in existence for greater than 12 monthsAs at December 31
Since Inception
Date of inception 1 Year 3 Year 5 Year 10 Year (if <10 yrs)
Select series September 2013 10.3% 2.6% 2.0% N/A 2.8%
As at December 31¹
For the twelve months ended December 31² 2019 2019* 2018 2017 2016 2015
Net asset value per unit (Select series)1$11.87 $10.76 $11.48 $10.99 $10.52
Number of units outstanding (Select series)1625,139 728,422 756,944 578,945 419,313
Management expense ratio (Select series)23.00% 3.04% 3.00% 2.99% 2.99% 2.94%
Net assets (000s)1$7,419 $7,841 $8,693 $6,360 $4,411
Portfolio turnover rate2 (note 6) 10.18% 21.52% 7.75% 32.89% 16.06%
* Represents the pro-forma management expense ratio as described in note 5.
For additional product or segregated fund information please refer to your contract and information folder.
FINANCIAL HIGHLIGHTS - the following unaudited schedule shows select key financial information about the Fund and is intended to help you
understand the Fund's financial performance for the past five years
88
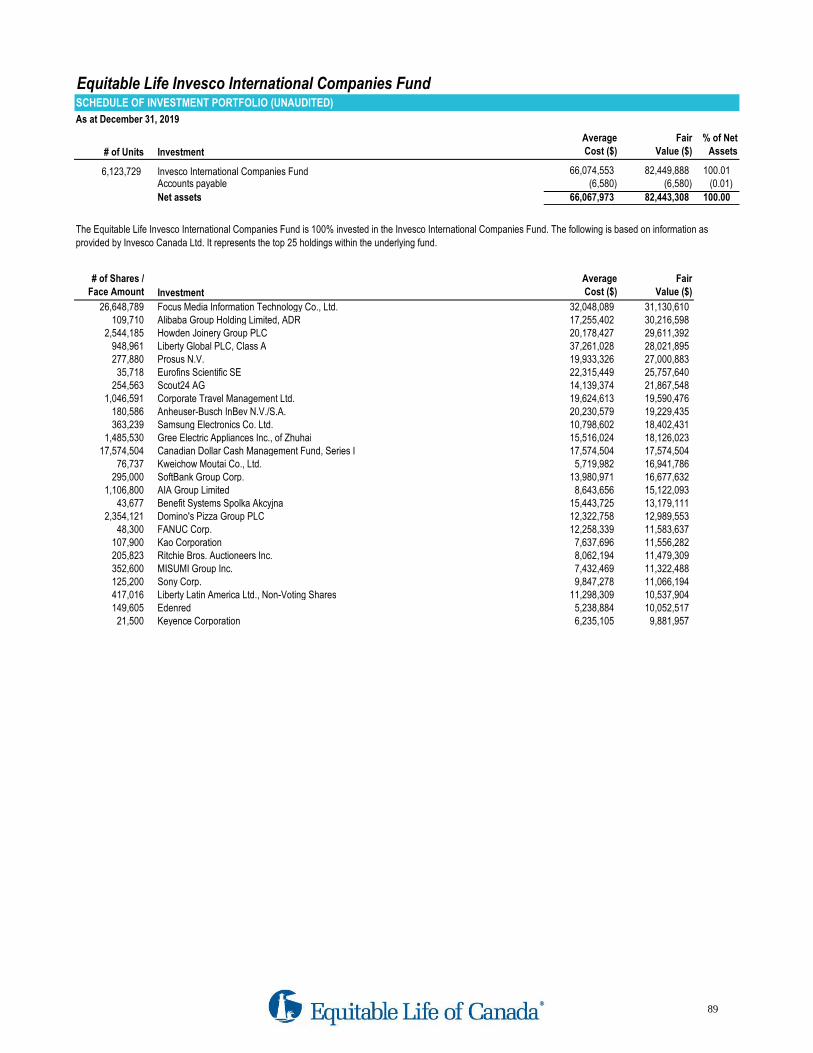
Equitable Life Invesco International Companies FundSCHEDULE OF INVESTMENT PORTFOLIO (UNAUDITED)
As at December 31, 2019
# of Units Investment
Average
Cost ($)
Fair
Value ($)
% of Net
Assets
6,123,729 Invesco International Companies Fund 66,074,553 82,449,888 100.01 Accounts payable (6,580) (6,580) (0.01)
Net assets 66,067,973 82,443,308 100.00
# of Shares /
Face Amount Investment
Average
Cost ($)
Fair
Value ($)
26,648,789 Focus Media Information Technology Co., Ltd. 32,048,089 31,130,610 109,710 Alibaba Group Holding Limited, ADR 17,255,402 30,216,598
2,544,185 Howden Joinery Group PLC 20,178,427 29,611,392 948,961 Liberty Global PLC, Class A 37,261,028 28,021,895 277,880 Prosus N.V. 19,933,326 27,000,883
35,718 Eurofins Scientific SE 22,315,449 25,757,640 254,563 Scout24 AG 14,139,374 21,867,548
1,046,591 Corporate Travel Management Ltd. 19,624,613 19,590,476 180,586 Anheuser-Busch InBev N.V./S.A. 20,230,579 19,229,435 363,239 Samsung Electronics Co. Ltd. 10,798,602 18,402,431
1,485,530 Gree Electric Appliances Inc., of Zhuhai 15,516,024 18,126,023 17,574,504 Canadian Dollar Cash Management Fund, Series I 17,574,504 17,574,504
76,737 Kweichow Moutai Co., Ltd. 5,719,982 16,941,786 295,000 SoftBank Group Corp. 13,980,971 16,677,632
1,106,800 AIA Group Limited 8,643,656 15,122,093 43,677 Benefit Systems Spolka Akcyjna 15,443,725 13,179,111
2,354,121 Domino's Pizza Group PLC 12,322,758 12,989,553 48,300 FANUC Corp. 12,258,339 11,583,637
107,900 Kao Corporation 7,637,696 11,556,282 205,823 Ritchie Bros. Auctioneers Inc. 8,062,194 11,479,309 352,600 MISUMI Group Inc. 7,432,469 11,322,488 125,200 Sony Corp. 9,847,278 11,066,194 417,016 Liberty Latin America Ltd., Non-Voting Shares 11,298,309 10,537,904 149,605 Edenred 5,238,884 10,052,517
21,500 Keyence Corporation 6,235,105 9,881,957
The Equitable Life Invesco International Companies Fund is 100% invested in the Invesco International Companies Fund. The following is based on information as
provided by Invesco Canada Ltd. It represents the top 25 holdings within the underlying fund.
89

Equitable Life Invesco International Companies FundSTATEMENTS OF FINANCIAL POSITIONAs at December 31
Assets 2019 2018
Investments at fair value 82,449,888$ 60,717,859$
Cash and cash equivalents - -
82,449,888 60,717,859 Liabilities
Accounts payable 6,580 14,568
6,580 14,568
Net assets attributable to contractholders 82,443,308$ 60,703,291$
Net assets attributable to contractholders, per unit
Initial series 17.21$ 13.73$
B series 16.54$ 13.25$
Select series 18.99$ 15.10$
STATEMENTS OF COMPREHENSIVE INCOMEFor the twelve months ended December 31
Investment income (loss) 2019 2018
Interest, dividends and fee income 846,644$ 556,430$
Net realized and unrealized gain (loss) 17,557,746 (8,806,887)
18,404,390 (8,250,457) Expenses
Management fees (note 5) 1,866,931 1,533,021
Insurance fees, HST and other expenses 383,840 302,132
2,250,771 1,835,153
Net increase (decrease) in net assets from operations attributable to contractholders 16,153,619$ (10,085,610)$
Net increase (decrease) in net assets from operations attributable to contractholders, per unit (note 7)
Initial series 3.54$ (2.41)$
B series 3.21$ (2.16)$
Select series 3.82$ (2.94)$
STATEMENTS OF CHANGES IN NET ASSETS ATTRIBUTABLE TO CONTRACTHOLDERSFor the twelve months ended December 31
2019 2018
Net assets attributable to contractholders - beginning of period 60,703,291$ 45,665,789$
Contractholders' contributions 24,623,000 42,355,758
Contractholders' withdrawals (19,036,602) (17,232,646)
Net increase (decrease) from contractholders' transactions 5,586,398 25,123,112
Net increase (decrease) in net assets from operations attributable to contractholders 16,153,619 (10,085,610)
Net assets attributable to contractholders - end of period 82,443,308$ 60,703,291$
STATEMENTS OF CASH FLOWS
For the twelve months ended December 31
Operating cash inflows (outflows) 2019 2018
Interest, dividend and other investment income received 730,787$ 474,892$
Operating expenses paid (2,142,902) (1,742,735)
Proceeds from sale of investments 5,951,774 4,642,730
Purchase of investments (10,126,057) (28,497,999)
Contractholders' contributions 24,623,000 42,355,758
Contractholders' withdrawals (19,036,602) (17,232,646)
Cash provided by (used in) operating activities - -
Increase (decrease) in cash and cash equivalents during the period - -
Cash and cash equivalents - beginning of period - -
Cash and cash equivalents - end of period -$ -$
90

Equitable Life Invesco International Companies FundANNUAL COMPOUND NET RETURNS - the following unaudited schedule is provided for Funds in existence for greater than 12 monthsAs at December 31
Since Inception
Date of inception 1 Year 3 Year 5 Year 10 Year (if <10 yrs)
Initial series September 2006 25.4% 8.7% 8.8% 9.1% N/A
B series September 2006 24.9% 8.2% 8.4% 8.8% N/A
Select series September 2013 25.7% 9.0% 9.2% N/A 10.9%
As at December 31¹
For the twelve months ended December 31² 2019 2019* 2018 2017 2016 2015
Net asset value per unit (Initial series)1$17.21 $13.73 $16.14 $13.42 $13.15
Net asset value per unit (B series)1$16.54 $13.25 $15.64 $13.07 $12.88
Net asset value per unit (Select series)1$18.99 $15.10 $17.66 $14.64 $14.32
Number of units outstanding (Initial series)1341,549 436,189 435,999 449,879 435,140
Number of units outstanding (B series)132,211 35,502 64,722 43,955 41,815
Number of units outstanding (Select series)14,004,883 3,592,286 2,130,629 1,317,514 774,777
Management expense ratio (Initial series)23.26% 3.26% 3.27% 3.26% 3.26% 3.28%
Management expense ratio (B series)23.61% 3.61% 3.66% 3.69% 3.70% 3.70%
Management expense ratio (Select series)22.87% 2.87% 2.88% 2.89% 2.89% 2.91%
Net assets (000s)1$82,443 $60,703 $45,666 $25,907 $17,356
Portfolio turnover rate2 (note 6) 8.13% 7.86% 6.68% 6.90% 10.50%
* Represents the pro-forma management expense ratio as described in note 5.
For additional product or segregated fund information please refer to your contract and information folder.
FINANCIAL HIGHLIGHTS - the following unaudited schedule shows select key financial information about the Fund and is intended to help you
understand the Fund's financial performance for the past five years
91
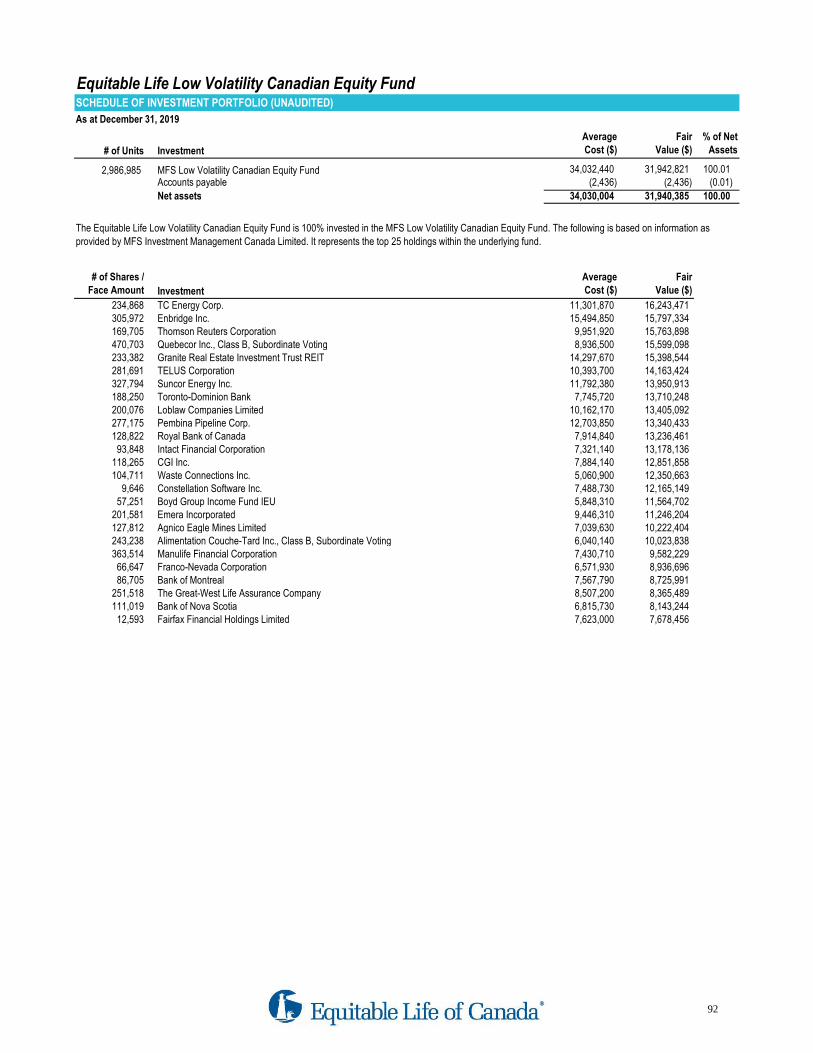
Equitable Life Low Volatility Canadian Equity FundSCHEDULE OF INVESTMENT PORTFOLIO (UNAUDITED)
As at December 31, 2019
# of Units Investment
Average
Cost ($)
Fair
Value ($)
% of Net
Assets
2,986,985 MFS Low Volatility Canadian Equity Fund 34,032,440 31,942,821 100.01 Accounts payable (2,436) (2,436) (0.01)
Net assets 34,030,004 31,940,385 100.00
# of Shares /
Face Amount Investment
Average
Cost ($)
Fair
Value ($)
234,868 TC Energy Corp. 11,301,870 16,243,471 305,972 Enbridge Inc. 15,494,850 15,797,334 169,705 Thomson Reuters Corporation 9,951,920 15,763,898 470,703 Quebecor Inc., Class B, Subordinate Voting 8,936,500 15,599,098 233,382 Granite Real Estate Investment Trust REIT 14,297,670 15,398,544 281,691 TELUS Corporation 10,393,700 14,163,424 327,794 Suncor Energy Inc. 11,792,380 13,950,913 188,250 Toronto-Dominion Bank 7,745,720 13,710,248 200,076 Loblaw Companies Limited 10,162,170 13,405,092 277,175 Pembina Pipeline Corp. 12,703,850 13,340,433 128,822 Royal Bank of Canada 7,914,840 13,236,461
93,848 Intact Financial Corporation 7,321,140 13,178,136 118,265 CGI Inc. 7,884,140 12,851,858 104,711 Waste Connections Inc. 5,060,900 12,350,663
9,646 Constellation Software Inc. 7,488,730 12,165,149 57,251 Boyd Group Income Fund IEU 5,848,310 11,564,702
201,581 Emera Incorporated 9,446,310 11,246,204 127,812 Agnico Eagle Mines Limited 7,039,630 10,222,404 243,238 Alimentation Couche-Tard Inc., Class B, Subordinate Voting 6,040,140 10,023,838 363,514 Manulife Financial Corporation 7,430,710 9,582,229
66,647 Franco-Nevada Corporation 6,571,930 8,936,696 86,705 Bank of Montreal 7,567,790 8,725,991
251,518 The Great-West Life Assurance Company 8,507,200 8,365,489 111,019 Bank of Nova Scotia 6,815,730 8,143,244
12,593 Fairfax Financial Holdings Limited 7,623,000 7,678,456
The Equitable Life Low Volatility Canadian Equity Fund is 100% invested in the MFS Low Volatility Canadian Equity Fund. The following is based on information as
provided by MFS Investment Management Canada Limited. It represents the top 25 holdings within the underlying fund.
92

Equitable Life Low Volatility Canadian Equity FundSTATEMENTS OF FINANCIAL POSITIONAs at December 31
Assets 2019 2018
Investments at fair value 31,942,821$ 26,407,151$
Cash and cash equivalents - -
31,942,821 26,407,151 Liabilities
Accounts payable 2,436 6,044
2,436 6,044
Net assets attributable to contractholders 31,940,385$ 26,401,107$
Net assets attributable to contractholders, per unit
Initial series 40.33$ 33.29$
B series 38.69$ 32.06$
Select series 16.33$ 13.45$
STATEMENTS OF COMPREHENSIVE INCOMEFor the twelve months ended December 31
Investment income (loss) 2019 2018
Interest, dividends and fee income 931,479$ 930,486$
Net realized and unrealized gain (loss) 5,450,566 (2,575,237)
6,382,045 (1,644,751) Expenses
Management fees (note 5) 723,201 766,128
Insurance fees, HST and other expenses 107,444 114,827
830,645 880,955
Net increase (decrease) in net assets from operations attributable to contractholders 5,551,400$ (2,525,706)$
Net increase (decrease) in net assets from operations attributable to contractholders, per unit (note 7)
Initial series 7.31$ (2.77)$
B series 6.83$ (2.84)$
Select series 2.77$ (1.24)$
STATEMENTS OF CHANGES IN NET ASSETS ATTRIBUTABLE TO CONTRACTHOLDERSFor the twelve months ended December 31
2019 2018
Net assets attributable to contractholders - beginning of period 26,401,107$ 35,102,885$
Contractholders' contributions 6,439,335 3,036,930
Contractholders' withdrawals (6,451,457) (9,213,002)
Net increase (decrease) from contractholders' transactions (12,122) (6,176,072)
Net increase (decrease) in net assets from operations attributable to contractholders 5,551,400 (2,525,706)
Net assets attributable to contractholders - end of period 31,940,385$ 26,401,107$
STATEMENTS OF CASH FLOWS
For the twelve months ended December 31
Operating cash inflows (outflows) 2019 2018
Interest, dividend and other investment income received 1,893,687$ 1,407,224$
Operating expenses paid (834,254) (877,632)
Proceeds from sale of investments 4,404,877 7,888,115
Purchase of investments (5,452,188) (2,241,635)
Contractholders' contributions 6,439,335 3,036,930
Contractholders' withdrawals (6,451,457) (9,213,002)
Cash provided by (used in) operating activities - -
Increase (decrease) in cash and cash equivalents during the period - -
Cash and cash equivalents - beginning of period - -
Cash and cash equivalents - end of period -$ -$
93
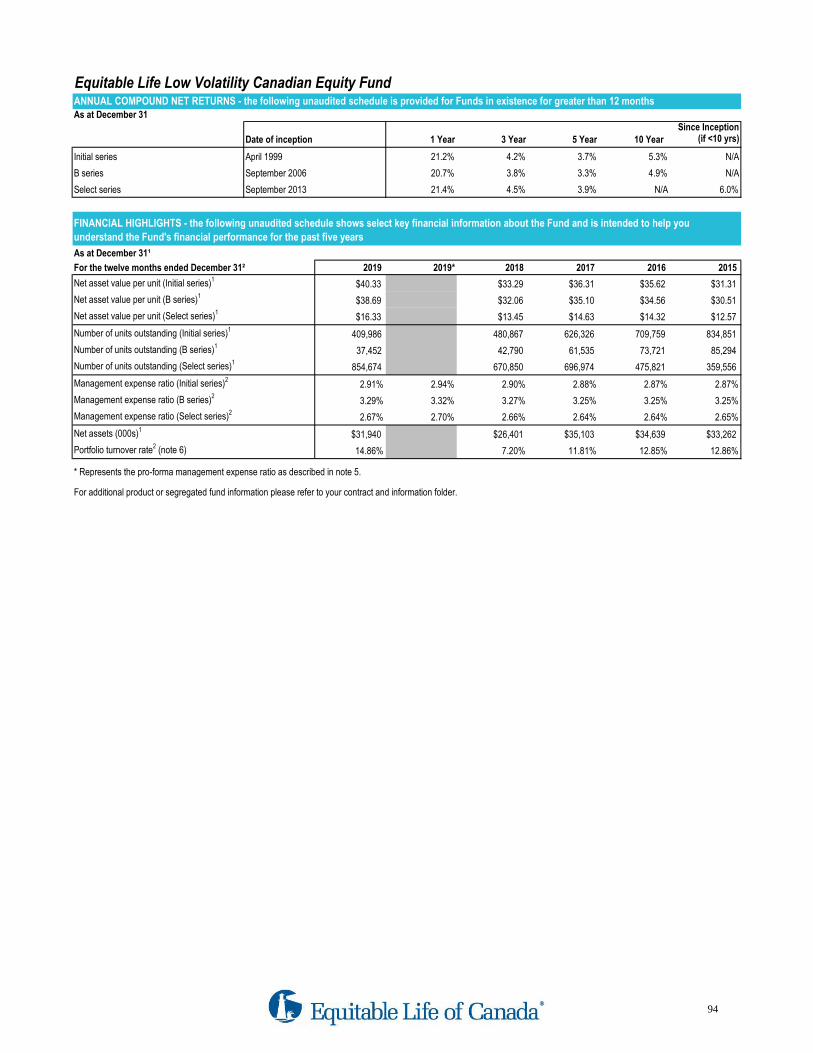
Equitable Life Low Volatility Canadian Equity FundANNUAL COMPOUND NET RETURNS - the following unaudited schedule is provided for Funds in existence for greater than 12 monthsAs at December 31
Since Inception
Date of inception 1 Year 3 Year 5 Year 10 Year (if <10 yrs)
Initial series April 1999 21.2% 4.2% 3.7% 5.3% N/A
B series September 2006 20.7% 3.8% 3.3% 4.9% N/A
Select series September 2013 21.4% 4.5% 3.9% N/A 6.0%
As at December 31¹
For the twelve months ended December 31² 2019 2019* 2018 2017 2016 2015
Net asset value per unit (Initial series)1$40.33 $33.29 $36.31 $35.62 $31.31
Net asset value per unit (B series)1$38.69 $32.06 $35.10 $34.56 $30.51
Net asset value per unit (Select series)1$16.33 $13.45 $14.63 $14.32 $12.57
Number of units outstanding (Initial series)1409,986 480,867 626,326 709,759 834,851
Number of units outstanding (B series)137,452 42,790 61,535 73,721 85,294
Number of units outstanding (Select series)1854,674 670,850 696,974 475,821 359,556
Management expense ratio (Initial series)22.91% 2.94% 2.90% 2.88% 2.87% 2.87%
Management expense ratio (B series)23.29% 3.32% 3.27% 3.25% 3.25% 3.25%
Management expense ratio (Select series)22.67% 2.70% 2.66% 2.64% 2.64% 2.65%
Net assets (000s)1$31,940 $26,401 $35,103 $34,639 $33,262
Portfolio turnover rate2 (note 6) 14.86% 7.20% 11.81% 12.85% 12.86%
* Represents the pro-forma management expense ratio as described in note 5.
For additional product or segregated fund information please refer to your contract and information folder.
FINANCIAL HIGHLIGHTS - the following unaudited schedule shows select key financial information about the Fund and is intended to help you
understand the Fund's financial performance for the past five years
94
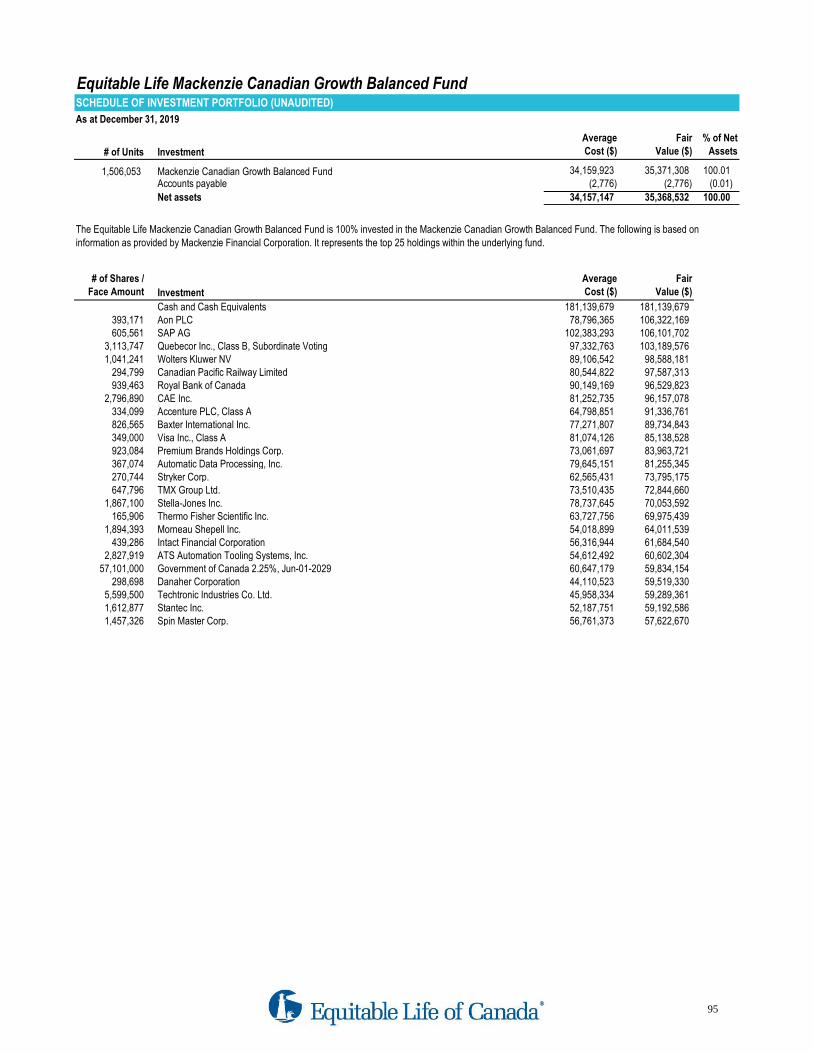
Equitable Life Mackenzie Canadian Growth Balanced FundSCHEDULE OF INVESTMENT PORTFOLIO (UNAUDITED)
As at December 31, 2019
# of Units Investment
Average
Cost ($)
Fair
Value ($)
% of Net
Assets
1,506,053 Mackenzie Canadian Growth Balanced Fund 34,159,923 35,371,308 100.01 Accounts payable (2,776) (2,776) (0.01)
Net assets 34,157,147 35,368,532 100.00
# of Shares /
Face Amount Investment
Average
Cost ($)
Fair
Value ($)
Cash and Cash Equivalents 181,139,679 181,139,679 393,171 Aon PLC 78,796,365 106,322,169 605,561 SAP AG 102,383,293 106,101,702
3,113,747 Quebecor Inc., Class B, Subordinate Voting 97,332,763 103,189,576 1,041,241 Wolters Kluwer NV 89,106,542 98,588,181
294,799 Canadian Pacific Railway Limited 80,544,822 97,587,313 939,463 Royal Bank of Canada 90,149,169 96,529,823
2,796,890 CAE Inc. 81,252,735 96,157,078 334,099 Accenture PLC, Class A 64,798,851 91,336,761 826,565 Baxter International Inc. 77,271,807 89,734,843 349,000 Visa Inc., Class A 81,074,126 85,138,528 923,084 Premium Brands Holdings Corp. 73,061,697 83,963,721 367,074 Automatic Data Processing, Inc. 79,645,151 81,255,345 270,744 Stryker Corp. 62,565,431 73,795,175 647,796 TMX Group Ltd. 73,510,435 72,844,660
1,867,100 Stella-Jones Inc. 78,737,645 70,053,592 165,906 Thermo Fisher Scientific Inc. 63,727,756 69,975,439
1,894,393 Morneau Shepell Inc. 54,018,899 64,011,539 439,286 Intact Financial Corporation 56,316,944 61,684,540
2,827,919 ATS Automation Tooling Systems, Inc. 54,612,492 60,602,304 57,101,000 Government of Canada 2.25%, Jun-01-2029 60,647,179 59,834,154
298,698 Danaher Corporation 44,110,523 59,519,330 5,599,500 Techtronic Industries Co. Ltd. 45,958,334 59,289,361 1,612,877 Stantec Inc. 52,187,751 59,192,586 1,457,326 Spin Master Corp. 56,761,373 57,622,670
The Equitable Life Mackenzie Canadian Growth Balanced Fund is 100% invested in the Mackenzie Canadian Growth Balanced Fund. The following is based on
information as provided by Mackenzie Financial Corporation. It represents the top 25 holdings within the underlying fund.
95
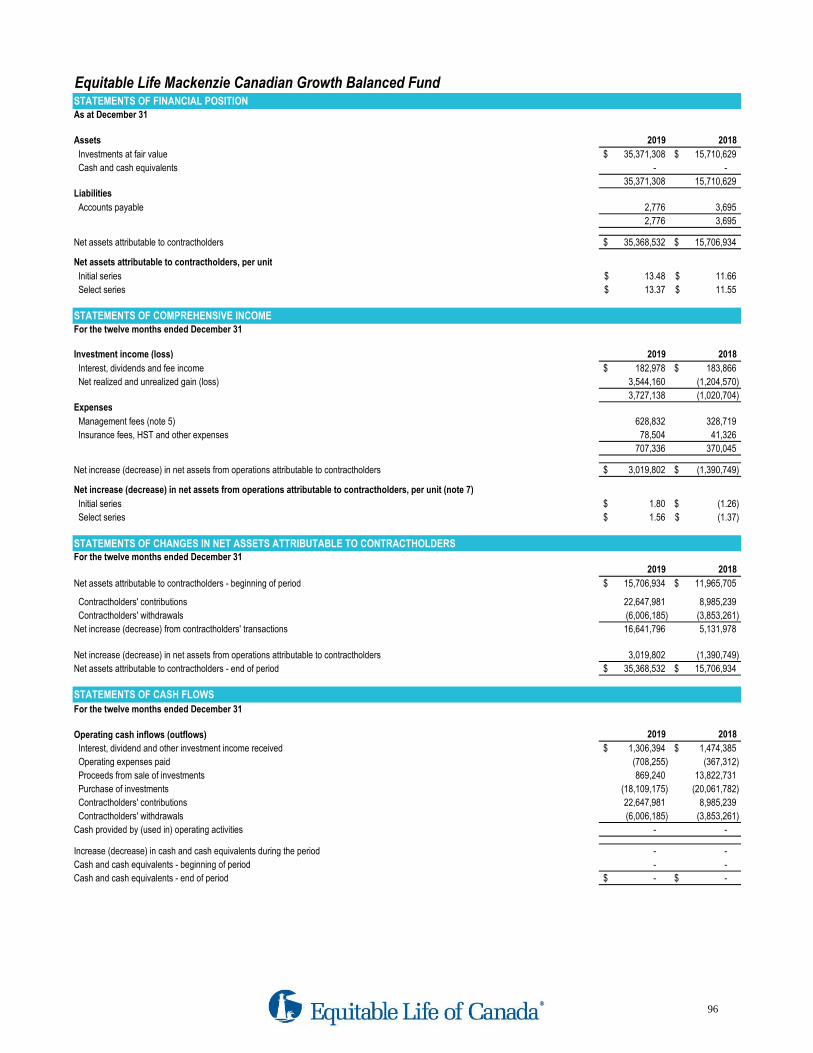
Equitable Life Mackenzie Canadian Growth Balanced FundSTATEMENTS OF FINANCIAL POSITIONAs at December 31
Assets 2019 2018
Investments at fair value 35,371,308$ 15,710,629$
Cash and cash equivalents - -
35,371,308 15,710,629 Liabilities
Accounts payable 2,776 3,695
2,776 3,695
Net assets attributable to contractholders 35,368,532$ 15,706,934$
Net assets attributable to contractholders, per unit
Initial series 13.48$ 11.66$
Select series 13.37$ 11.55$
STATEMENTS OF COMPREHENSIVE INCOMEFor the twelve months ended December 31
Investment income (loss) 2019 2018
Interest, dividends and fee income 182,978$ 183,866$
Net realized and unrealized gain (loss) 3,544,160 (1,204,570)
3,727,138 (1,020,704) Expenses
Management fees (note 5) 628,832 328,719
Insurance fees, HST and other expenses 78,504 41,326
707,336 370,045
Net increase (decrease) in net assets from operations attributable to contractholders 3,019,802$ (1,390,749)$
Net increase (decrease) in net assets from operations attributable to contractholders, per unit (note 7)
Initial series 1.80$ (1.26)$
Select series 1.56$ (1.37)$
STATEMENTS OF CHANGES IN NET ASSETS ATTRIBUTABLE TO CONTRACTHOLDERSFor the twelve months ended December 31
2019 2018
Net assets attributable to contractholders - beginning of period 15,706,934$ 11,965,705$
Contractholders' contributions 22,647,981 8,985,239
Contractholders' withdrawals (6,006,185) (3,853,261)
Net increase (decrease) from contractholders' transactions 16,641,796 5,131,978
Net increase (decrease) in net assets from operations attributable to contractholders 3,019,802 (1,390,749)
Net assets attributable to contractholders - end of period 35,368,532$ 15,706,934$
STATEMENTS OF CASH FLOWS
For the twelve months ended December 31
Operating cash inflows (outflows) 2019 2018
Interest, dividend and other investment income received 1,306,394$ 1,474,385$
Operating expenses paid (708,255) (367,312)
Proceeds from sale of investments 869,240 13,822,731
Purchase of investments (18,109,175) (20,061,782)
Contractholders' contributions 22,647,981 8,985,239
Contractholders' withdrawals (6,006,185) (3,853,261)
Cash provided by (used in) operating activities - -
Increase (decrease) in cash and cash equivalents during the period - -
Cash and cash equivalents - beginning of period - -
Cash and cash equivalents - end of period -$ -$
96

Equitable Life Mackenzie Canadian Growth Balanced FundANNUAL COMPOUND NET RETURNS - the following unaudited schedule is provided for Funds in existence for greater than 12 monthsAs at December 31
Since Inception
Date of inception 1 Year 3 Year 5 Year 10 Year (if <10 yrs)
Initial series January 2011 15.7% 3.1% 3.2% N/A 3.4%
Select series September 2013 15.8% 3.3% 3.5% N/A 4.7%
As at December 31¹
For the twelve months ended December 31² 2019 2019* 2018 2017 2016 2015
Net asset value per unit (Initial series)1$13.48 $11.66 $12.91 $12.31 $10.60
Net asset value per unit (Select series)1$13.37 $11.55 $12.75 $12.13 $10.42
Number of units outstanding (Initial series)1219,140 184,828 227,160 196,876 181,754
Number of units outstanding (Select series)12,423,846 1,173,842 708,619 340,888 187,201
Management expense ratio (Initial series)23.16% 3.17% 3.16% 3.17% 3.18% 3.18%
Management expense ratio (Select series)22.83% 2.84% 2.84% 2.85% 2.88% 2.89%
Net assets (000s)1$35,369 $15,707 $11,966 $6,557 $3,877
Portfolio turnover rate2 (note 6) 3.52% 107.84% 10.54% 15.56% 16.06%
* Represents the pro-forma management expense ratio as described in note 5.
For additional product or segregated fund information please refer to your contract and information folder.
FINANCIAL HIGHLIGHTS - the following unaudited schedule shows select key financial information about the Fund and is intended to help you
understand the Fund's financial performance for the past five years
97
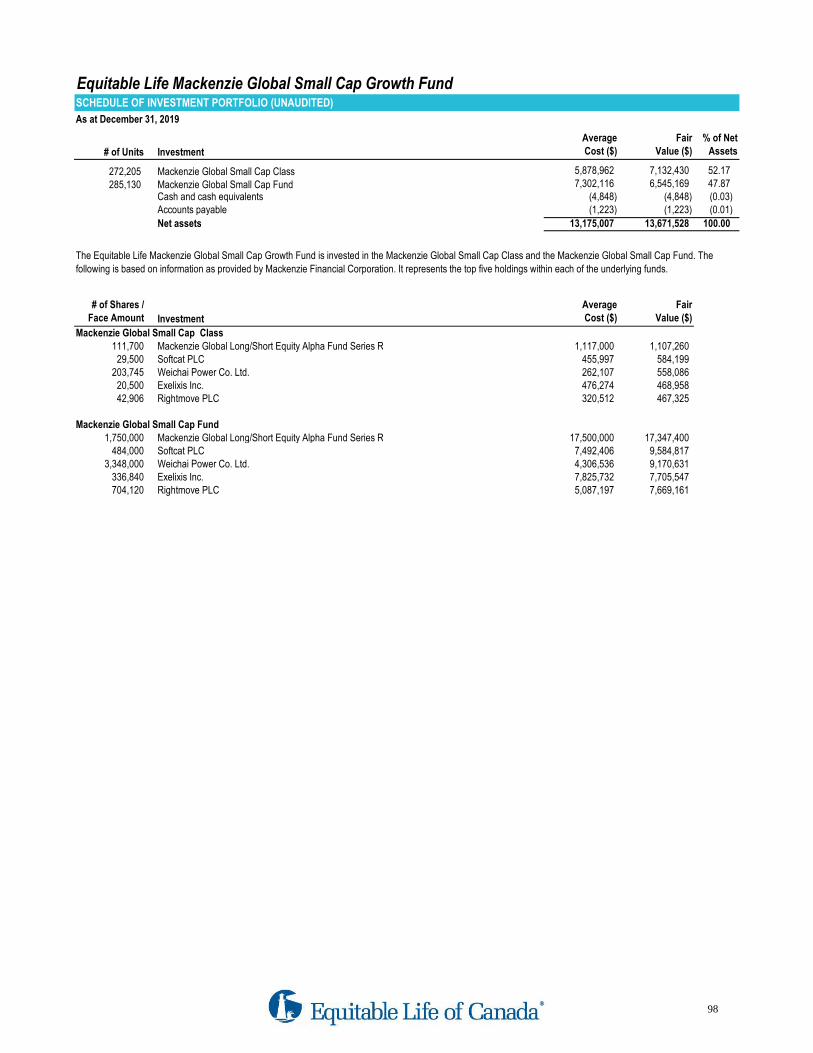
Equitable Life Mackenzie Global Small Cap Growth FundSCHEDULE OF INVESTMENT PORTFOLIO (UNAUDITED)
As at December 31, 2019
# of Units Investment
Average
Cost ($)
Fair
Value ($)
% of Net
Assets
272,205 Mackenzie Global Small Cap Class 5,878,962 7,132,430 52.17
285,130 Mackenzie Global Small Cap Fund 7,302,116 6,545,169 47.87 Cash and cash equivalents (4,848) (4,848) (0.03) Accounts payable (1,223) (1,223) (0.01)
Net assets 13,175,007 13,671,528 100.00
# of Shares /
Face Amount Investment
Average
Cost ($)
Fair
Value ($)
Mackenzie Global Small Cap Class
111,700 Mackenzie Global Long/Short Equity Alpha Fund Series R 1,117,000 1,107,260 29,500 Softcat PLC 455,997 584,199
203,745 Weichai Power Co. Ltd. 262,107 558,086 20,500 Exelixis Inc. 476,274 468,958 42,906 Rightmove PLC 320,512 467,325
Mackenzie Global Small Cap Fund
1,750,000 Mackenzie Global Long/Short Equity Alpha Fund Series R 17,500,000 17,347,400 484,000 Softcat PLC 7,492,406 9,584,817
3,348,000 Weichai Power Co. Ltd. 4,306,536 9,170,631 336,840 Exelixis Inc. 7,825,732 7,705,547 704,120 Rightmove PLC 5,087,197 7,669,161
The Equitable Life Mackenzie Global Small Cap Growth Fund is invested in the Mackenzie Global Small Cap Class and the Mackenzie Global Small Cap Fund. The
following is based on information as provided by Mackenzie Financial Corporation. It represents the top five holdings within each of the underlying funds.
98
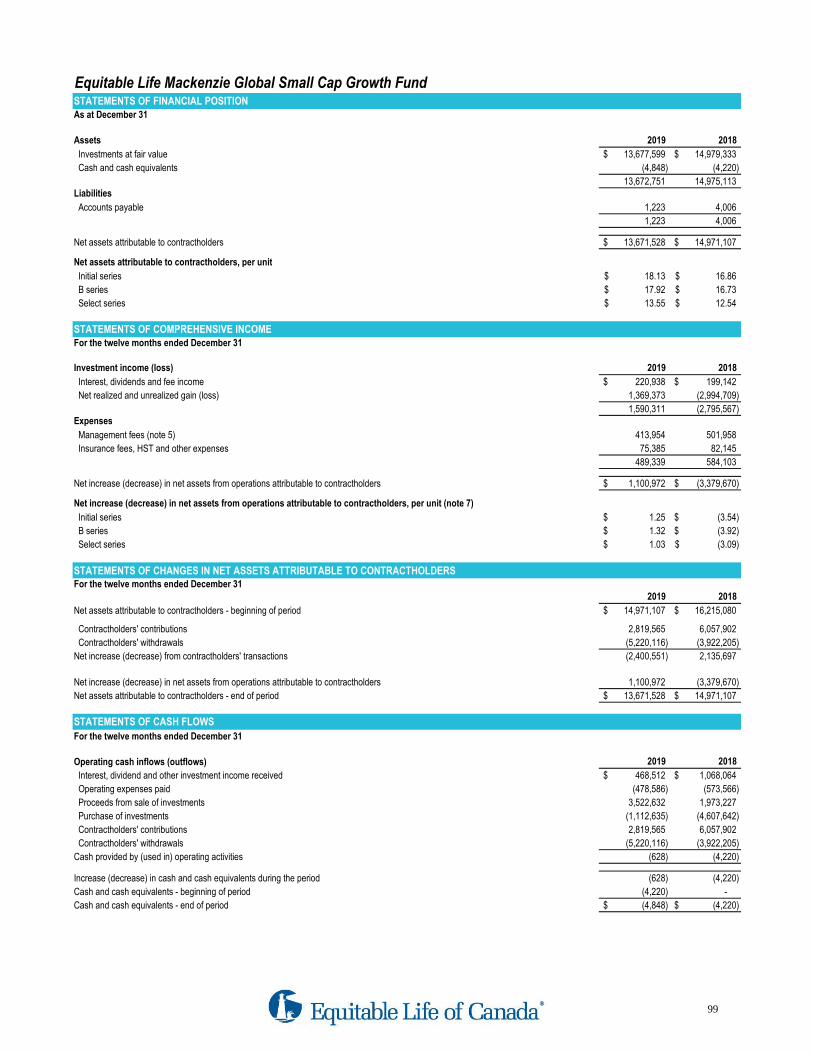
Equitable Life Mackenzie Global Small Cap Growth FundSTATEMENTS OF FINANCIAL POSITIONAs at December 31
Assets 2019 2018
Investments at fair value 13,677,599$ 14,979,333$
Cash and cash equivalents (4,848) (4,220)
13,672,751 14,975,113 Liabilities
Accounts payable 1,223 4,006
1,223 4,006
Net assets attributable to contractholders 13,671,528$ 14,971,107$
Net assets attributable to contractholders, per unit
Initial series 18.13$ 16.86$
B series 17.92$ 16.73$
Select series 13.55$ 12.54$
STATEMENTS OF COMPREHENSIVE INCOMEFor the twelve months ended December 31
Investment income (loss) 2019 2018
Interest, dividends and fee income 220,938$ 199,142$
Net realized and unrealized gain (loss) 1,369,373 (2,994,709)
1,590,311 (2,795,567) Expenses
Management fees (note 5) 413,954 501,958
Insurance fees, HST and other expenses 75,385 82,145
489,339 584,103
Net increase (decrease) in net assets from operations attributable to contractholders 1,100,972$ (3,379,670)$
Net increase (decrease) in net assets from operations attributable to contractholders, per unit (note 7)
Initial series 1.25$ (3.54)$
B series 1.32$ (3.92)$
Select series 1.03$ (3.09)$
STATEMENTS OF CHANGES IN NET ASSETS ATTRIBUTABLE TO CONTRACTHOLDERSFor the twelve months ended December 31
2019 2018
Net assets attributable to contractholders - beginning of period 14,971,107$ 16,215,080$
Contractholders' contributions 2,819,565 6,057,902
Contractholders' withdrawals (5,220,116) (3,922,205)
Net increase (decrease) from contractholders' transactions (2,400,551) 2,135,697
Net increase (decrease) in net assets from operations attributable to contractholders 1,100,972 (3,379,670)
Net assets attributable to contractholders - end of period 13,671,528$ 14,971,107$
STATEMENTS OF CASH FLOWS
For the twelve months ended December 31
Operating cash inflows (outflows) 2019 2018
Interest, dividend and other investment income received 468,512$ 1,068,064$
Operating expenses paid (478,586) (573,566)
Proceeds from sale of investments 3,522,632 1,973,227
Purchase of investments (1,112,635) (4,607,642)
Contractholders' contributions 2,819,565 6,057,902
Contractholders' withdrawals (5,220,116) (3,922,205)
Cash provided by (used in) operating activities (628) (4,220)
Increase (decrease) in cash and cash equivalents during the period (628) (4,220)
Cash and cash equivalents - beginning of period (4,220) -
Cash and cash equivalents - end of period (4,848)$ (4,220)$
99

Equitable Life Mackenzie Global Small Cap Growth FundANNUAL COMPOUND NET RETURNS - the following unaudited schedule is provided for Funds in existence for greater than 12 monthsAs at December 31
Since Inception
Date of inception 1 Year 3 Year 5 Year 10 Year (if <10 yrs)
Initial series January 2004 7.6% 0.1% 1.1% 7.0% N/A
B series September 2006 7.2% -0.3% 0.8% 6.9% N/A
Select series September 2013 8.0% 0.6% 1.5% N/A 3.9%
As at December 31¹
For the twelve months ended December 31² 2019 2019* 2018 2017 2016 2015
Net asset value per unit (Initial series)1$18.13 $16.86 $20.69 $18.07 $18.11
Net asset value per unit (B series)1$17.92 $16.73 $20.65 $18.06 $18.14
Net asset value per unit (Select series)1$13.55 $12.54 $15.33 $13.32 $13.29
Number of units outstanding (Initial series)1233,695 290,577 336,822 437,467 551,316
Number of units outstanding (B series)118,520 25,864 28,450 33,381 45,125
Number of units outstanding (Select series)1671,798 768,501 564,898 431,624 380,766
Management expense ratio (Initial series)23.56% 3.58% 3.56% 3.56% 3.57% 3.56%
Management expense ratio (B series)23.83% 3.85% 3.80% 3.80% 3.81% 3.80%
Management expense ratio (Select series)23.09% 3.11% 3.09% 3.09% 3.08% 3.07%
Net assets (000s)1$13,672 $14,971 $16,215 $14,256 $15,859
Portfolio turnover rate2 (note 6) 7.65% 11.43% 19.05% 12.93% 12.84%
* Represents the pro-forma management expense ratio as described in note 5.
For additional product or segregated fund information please refer to your contract and information folder.
FINANCIAL HIGHLIGHTS - the following unaudited schedule shows select key financial information about the Fund and is intended to help you
understand the Fund's financial performance for the past five years
100
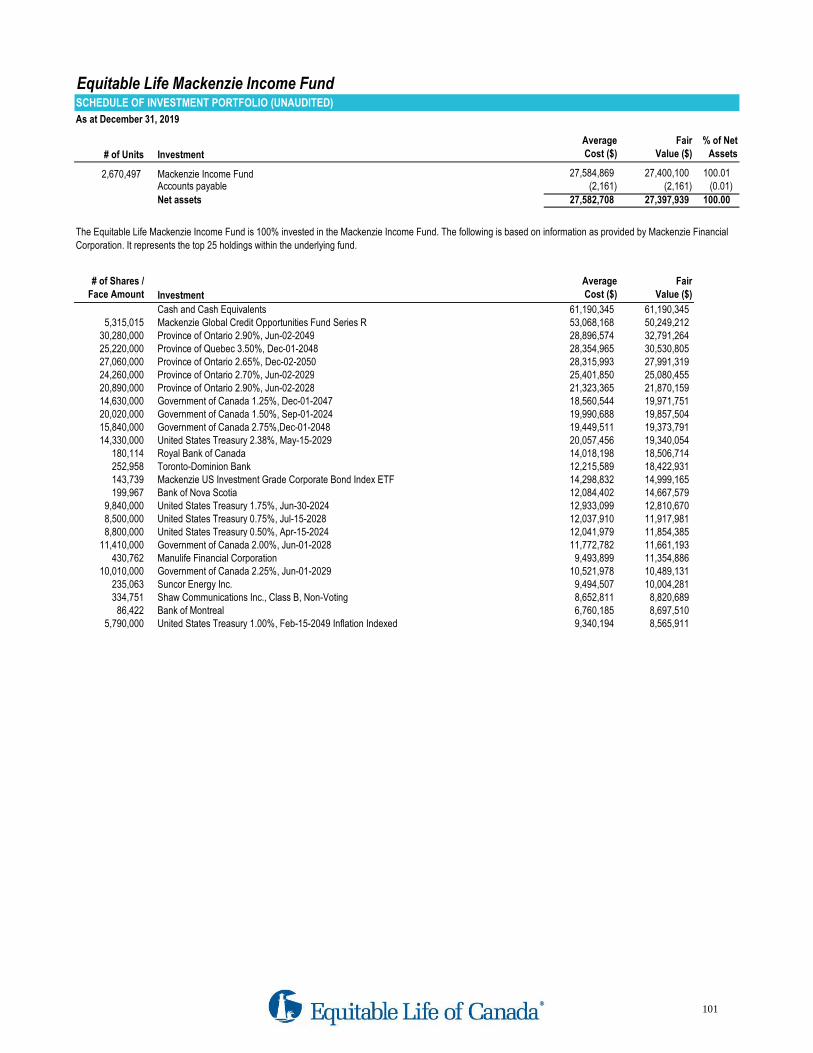
Equitable Life Mackenzie Income FundSCHEDULE OF INVESTMENT PORTFOLIO (UNAUDITED)
As at December 31, 2019
# of Units Investment
Average
Cost ($)
Fair
Value ($)
% of Net
Assets
2,670,497 Mackenzie Income Fund 27,584,869 27,400,100 100.01 Accounts payable (2,161) (2,161) (0.01)
Net assets 27,582,708 27,397,939 100.00
# of Shares /
Face Amount Investment
Average
Cost ($)
Fair
Value ($)
Cash and Cash Equivalents 61,190,345 61,190,345 5,315,015 Mackenzie Global Credit Opportunities Fund Series R 53,068,168 50,249,212
30,280,000 Province of Ontario 2.90%, Jun-02-2049 28,896,574 32,791,264 25,220,000 Province of Quebec 3.50%, Dec-01-2048 28,354,965 30,530,805 27,060,000 Province of Ontario 2.65%, Dec-02-2050 28,315,993 27,991,319 24,260,000 Province of Ontario 2.70%, Jun-02-2029 25,401,850 25,080,455 20,890,000 Province of Ontario 2.90%, Jun-02-2028 21,323,365 21,870,159 14,630,000 Government of Canada 1.25%, Dec-01-2047 18,560,544 19,971,751 20,020,000 Government of Canada 1.50%, Sep-01-2024 19,990,688 19,857,504 15,840,000 Government of Canada 2.75%,Dec-01-2048 19,449,511 19,373,791 14,330,000 United States Treasury 2.38%, May-15-2029 20,057,456 19,340,054
180,114 Royal Bank of Canada 14,018,198 18,506,714 252,958 Toronto-Dominion Bank 12,215,589 18,422,931 143,739 Mackenzie US Investment Grade Corporate Bond Index ETF 14,298,832 14,999,165 199,967 Bank of Nova Scotia 12,084,402 14,667,579
9,840,000 United States Treasury 1.75%, Jun-30-2024 12,933,099 12,810,670 8,500,000 United States Treasury 0.75%, Jul-15-2028 12,037,910 11,917,981 8,800,000 United States Treasury 0.50%, Apr-15-2024 12,041,979 11,854,385
11,410,000 Government of Canada 2.00%, Jun-01-2028 11,772,782 11,661,193 430,762 Manulife Financial Corporation 9,493,899 11,354,886
10,010,000 Government of Canada 2.25%, Jun-01-2029 10,521,978 10,489,131 235,063 Suncor Energy Inc. 9,494,507 10,004,281 334,751 Shaw Communications Inc., Class B, Non-Voting 8,652,811 8,820,689
86,422 Bank of Montreal 6,760,185 8,697,510 5,790,000 United States Treasury 1.00%, Feb-15-2049 Inflation Indexed 9,340,194 8,565,911
The Equitable Life Mackenzie Income Fund is 100% invested in the Mackenzie Income Fund. The following is based on information as provided by Mackenzie Financial
Corporation. It represents the top 25 holdings within the underlying fund.
101
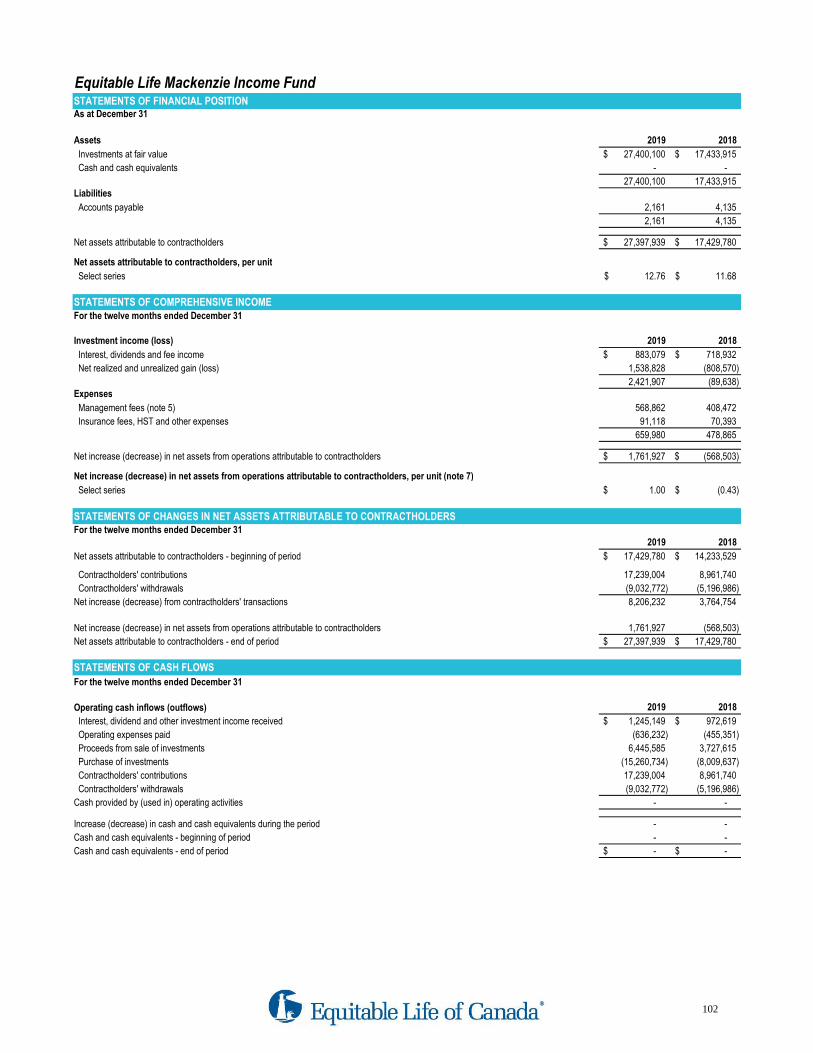
Equitable Life Mackenzie Income FundSTATEMENTS OF FINANCIAL POSITIONAs at December 31
Assets 2019 2018
Investments at fair value 27,400,100$ 17,433,915$
Cash and cash equivalents - -
27,400,100 17,433,915 Liabilities
Accounts payable 2,161 4,135
2,161 4,135
Net assets attributable to contractholders 27,397,939$ 17,429,780$
Net assets attributable to contractholders, per unit
Select series 12.76$ 11.68$
STATEMENTS OF COMPREHENSIVE INCOMEFor the twelve months ended December 31
Investment income (loss) 2019 2018
Interest, dividends and fee income 883,079$ 718,932$
Net realized and unrealized gain (loss) 1,538,828 (808,570)
2,421,907 (89,638) Expenses
Management fees (note 5) 568,862 408,472
Insurance fees, HST and other expenses 91,118 70,393
659,980 478,865
Net increase (decrease) in net assets from operations attributable to contractholders 1,761,927$ (568,503)$
Net increase (decrease) in net assets from operations attributable to contractholders, per unit (note 7)
Select series 1.00$ (0.43)$
STATEMENTS OF CHANGES IN NET ASSETS ATTRIBUTABLE TO CONTRACTHOLDERSFor the twelve months ended December 31
2019 2018
Net assets attributable to contractholders - beginning of period 17,429,780$ 14,233,529$
Contractholders' contributions 17,239,004 8,961,740
Contractholders' withdrawals (9,032,772) (5,196,986)
Net increase (decrease) from contractholders' transactions 8,206,232 3,764,754
Net increase (decrease) in net assets from operations attributable to contractholders 1,761,927 (568,503)
Net assets attributable to contractholders - end of period 27,397,939$ 17,429,780$
STATEMENTS OF CASH FLOWS
For the twelve months ended December 31
Operating cash inflows (outflows) 2019 2018
Interest, dividend and other investment income received 1,245,149$ 972,619$
Operating expenses paid (636,232) (455,351)
Proceeds from sale of investments 6,445,585 3,727,615
Purchase of investments (15,260,734) (8,009,637)
Contractholders' contributions 17,239,004 8,961,740
Contractholders' withdrawals (9,032,772) (5,196,986)
Cash provided by (used in) operating activities - -
Increase (decrease) in cash and cash equivalents during the period - -
Cash and cash equivalents - beginning of period - -
Cash and cash equivalents - end of period -$ -$
102

Equitable Life Mackenzie Income FundANNUAL COMPOUND NET RETURNS - the following unaudited schedule is provided for Funds in existence for greater than 12 monthsAs at December 31
Since Inception
Date of inception 1 Year 3 Year 5 Year 10 Year (if <10 yrs)
Select series September 2013 9.2% 3.0% 3.0% N/A 4.0%
As at December 31¹
For the twelve months ended December 31² 2019 2019* 2018 2017 2016 2015
Net asset value per unit (Select series)1$12.76 $11.68 $12.07 $11.68 $11.11
Number of units outstanding (Select series)12,147,950 1,492,482 1,179,687 869,216 496,216
Management expense ratio (Select series)22.87% 2.89% 2.90% 2.90% 2.91% 2.89%
Net assets (000s)1$27,398 $17,430 $14,234 $10,150 $5,514
Portfolio turnover rate2 (note 6) 28.97% 23.60% 12.29% 7.34% 13.69%
* Represents the pro-forma management expense ratio as described in note 5.
For additional product or segregated fund information please refer to your contract and information folder.
FINANCIAL HIGHLIGHTS - the following unaudited schedule shows select key financial information about the Fund and is intended to help you
understand the Fund's financial performance for the past five years
103

Equitable Life Mackenzie Ivy Canadian Balanced FundSCHEDULE OF INVESTMENT PORTFOLIO (UNAUDITED)
As at December 31, 2019
# of Units Investment
Average
Cost ($)
Fair
Value ($)
% of Net
Assets
595,179 Mackenzie Ivy Canadian Balanced Fund 8,149,509 8,103,362 100.01 Accounts payable (629) (629) (0.01)
Net assets 8,148,880 8,102,733 100.00
# of Shares /
Face Amount Investment
Average
Cost ($)
Fair
Value ($)
493,758 Brookfield Asset Management Inc., Class A Limited Voting 17,932,123 37,046,663 672,574 Pembina Pipeline Corp. 25,296,854 32,370,987 711,365 Dollarama Inc. 30,918,242 31,748,220 998,603 Shaw Communications Inc., Class B, Non-Voting 25,803,875 26,313,189 319,775 Onex Corporation, Subordinated Voting 25,600,487 26,275,912 130,481 Johnson & Johnson 21,069,318 24,710,822 255,300 Premium Brands Holdings Corp. 22,482,532 23,222,088
1,561,200 Amcor PLC 21,753,832 22,143,571 297,193 Bank of Nova Scotia 17,313,898 21,799,107 203,100 Royal Bank of Canada 16,386,205 20,868,525 281,688 Toronto-Dominion Bank 14,103,493 20,515,337 481,688 Alimentation Couche-Tard Inc., Class B, Subordinate Voting 15,143,828 19,850,362 215,488 Henry Schein Inc. 16,022,482 18,666,077 330,528 CCL Industries Inc., Class B, Non-Voting 17,862,539 18,284,809 162,600 Reckitt Benckiser Group PLC 16,825,681 17,131,531 123,400 Henkel AG & Co. KGaA 20,254,748 16,568,100 612,732 Manulife Financial Corporation 13,042,895 16,151,616 288,800 Emera Incorporated 14,619,816 16,112,152 123,300 Canadian National Railway Company 11,182,860 14,484,051 430,400 Quebecor Inc., Class B, Subordinate Voting 13,712,710 14,263,456 293,300 Seven & I Holdings Co. Ltd. 13,437,434 14,028,880 201,100 TC Energy Corp. 11,024,015 13,908,076
30,020 W.W. Grainger, Inc. 10,611,349 13,193,771 10,640,000 Government of Canada 2.75%,Dec-01-2048 12,439,938 13,013,708
1,289,315 Mackenzie Global Credit Opportunities Fund Series R 12,873,260 12,189,439
The Equitable Life Mackenzie Ivy Canadian Balanced Fund is 100% invested in the Mackenzie Ivy Canadian Balanced Fund. The following is based on information as
provided by Mackenzie Financial Corporation. It represents the top 25 holdings within the underlying fund.
104

Equitable Life Mackenzie Ivy Canadian Balanced FundSTATEMENTS OF FINANCIAL POSITIONAs at December 31
Assets 2019 2018
Investments at fair value 8,103,362$ 4,800,839$
Cash and cash equivalents - -
8,103,362 4,800,839 Liabilities
Accounts payable 629 1,114
629 1,114
Net assets attributable to contractholders 8,102,733$ 4,799,725$
Net assets attributable to contractholders, per unit
Select series 10.78$ 9.51$
STATEMENTS OF COMPREHENSIVE INCOMEFor the twelve months ended December 31
Investment income (loss) 2019 2018
Interest, dividends and fee income 91,776$ 27,909$
Net realized and unrealized gain (loss) 810,997 (232,780)
902,773 (204,871) Expenses
Management fees (note 5) 166,211 77,261
Insurance fees, HST and other expenses 20,012 9,738
186,223 86,999
Net increase (decrease) in net assets from operations attributable to contractholders 716,550$ (291,870)$
Net increase (decrease) in net assets from operations attributable to contractholders, per unit (note 7)
Select series 1.14$ (0.96)$
STATEMENTS OF CHANGES IN NET ASSETS ATTRIBUTABLE TO CONTRACTHOLDERSFor the twelve months ended December 31
2019 2018
Net assets attributable to contractholders - beginning of period 4,799,725$ 1,497,252$
Contractholders' contributions 4,063,073 4,591,302
Contractholders' withdrawals (1,476,615) (996,959)
Net increase (decrease) from contractholders' transactions 2,586,458 3,594,343
Net increase (decrease) in net assets from operations attributable to contractholders 716,550 (291,870)
Net assets attributable to contractholders - end of period 8,102,733$ 4,799,725$
STATEMENTS OF CASH FLOWS
For the twelve months ended December 31
Operating cash inflows (outflows) 2019 2018
Interest, dividend and other investment income received 373,609$ 291,674$
Operating expenses paid (186,709) (86,002)
Proceeds from sale of investments 894,201 305,592
Purchase of investments (3,667,559) (4,105,607)
Contractholders' contributions 4,063,073 4,591,302
Contractholders' withdrawals (1,476,615) (996,959)
Cash provided by (used in) operating activities - -
Increase (decrease) in cash and cash equivalents during the period - -
Cash and cash equivalents - beginning of period - -
Cash and cash equivalents - end of period -$ -$
105

Equitable Life Mackenzie Ivy Canadian Balanced FundANNUAL COMPOUND NET RETURNS - the following unaudited schedule is provided for Funds in existence for greater than 12 monthsAs at December 31
Since Inception
Date of inception 1 Year 3 Year 5 Year 10 Year (if <10 yrs)
Select series May 2017 13.3% N/A N/A N/A 2.9%
As at December 31¹
For the twelve months ended December 31² 2019 2019* 2018 2017 2016 2015
Net asset value per unit (Select series)1$10.78 $9.51 $10.24 N/A N/A
Number of units outstanding (Select series)1752,026 504,838 146,201 N/A N/A
Management expense ratio (Select series)22.83% 2.88% 2.85% 2.84% N/A N/A
Net assets (000s)1$8,103 $4,800 $1,497 N/A N/A
Portfolio turnover rate2 (note 6) 13.64% 10.06% 1.21% N/A N/A
* Represents the pro-forma management expense ratio as described in note 5.
For additional product or segregated fund information please refer to your contract and information folder.
FINANCIAL HIGHLIGHTS - the following unaudited schedule shows select key financial information about the Fund and is intended to help you
understand the Fund's financial performance for the past five years
106
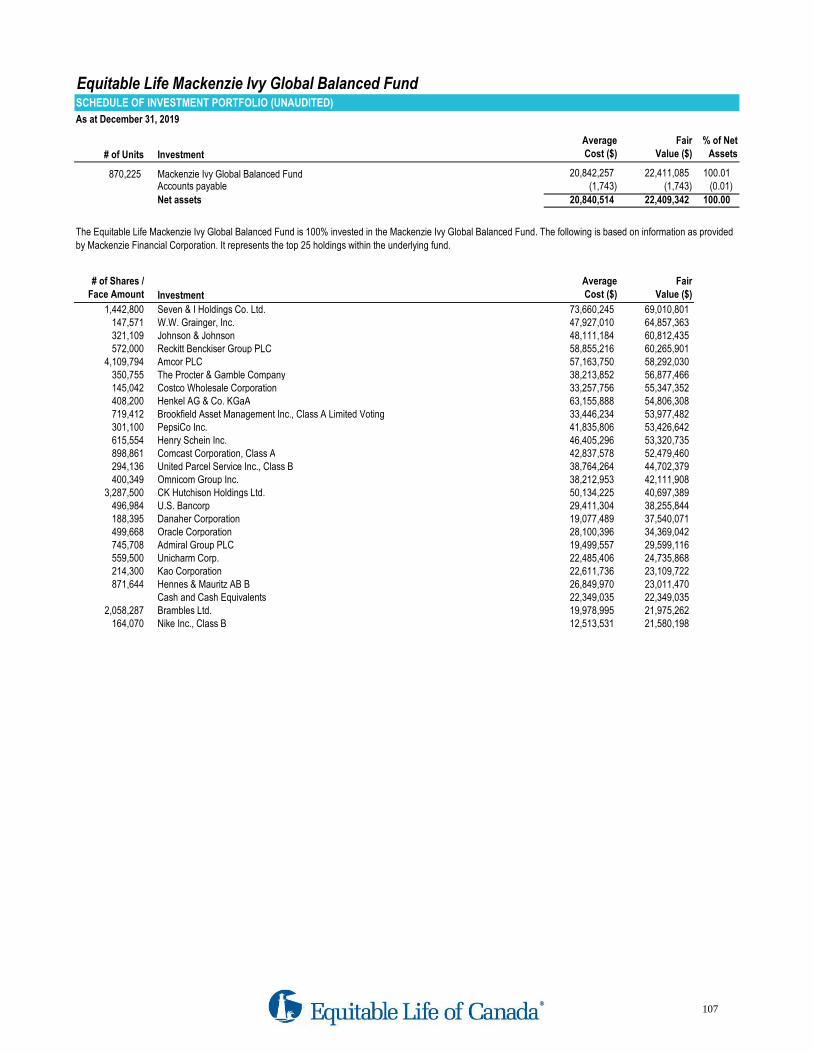
Equitable Life Mackenzie Ivy Global Balanced FundSCHEDULE OF INVESTMENT PORTFOLIO (UNAUDITED)
As at December 31, 2019
# of Units Investment
Average
Cost ($)
Fair
Value ($)
% of Net
Assets
870,225 Mackenzie Ivy Global Balanced Fund 20,842,257 22,411,085 100.01 Accounts payable (1,743) (1,743) (0.01)
Net assets 20,840,514 22,409,342 100.00
# of Shares /
Face Amount Investment
Average
Cost ($)
Fair
Value ($)
1,442,800 Seven & I Holdings Co. Ltd. 73,660,245 69,010,801 147,571 W.W. Grainger, Inc. 47,927,010 64,857,363 321,109 Johnson & Johnson 48,111,184 60,812,435 572,000 Reckitt Benckiser Group PLC 58,855,216 60,265,901
4,109,794 Amcor PLC 57,163,750 58,292,030 350,755 The Procter & Gamble Company 38,213,852 56,877,466 145,042 Costco Wholesale Corporation 33,257,756 55,347,352 408,200 Henkel AG & Co. KGaA 63,155,888 54,806,308 719,412 Brookfield Asset Management Inc., Class A Limited Voting 33,446,234 53,977,482 301,100 PepsiCo Inc. 41,835,806 53,426,642 615,554 Henry Schein Inc. 46,405,296 53,320,735 898,861 Comcast Corporation, Class A 42,837,578 52,479,460 294,136 United Parcel Service Inc., Class B 38,764,264 44,702,379 400,349 Omnicom Group Inc. 38,212,953 42,111,908
3,287,500 CK Hutchison Holdings Ltd. 50,134,225 40,697,389 496,984 U.S. Bancorp 29,411,304 38,255,844 188,395 Danaher Corporation 19,077,489 37,540,071 499,668 Oracle Corporation 28,100,396 34,369,042 745,708 Admiral Group PLC 19,499,557 29,599,116 559,500 Unicharm Corp. 22,485,406 24,735,868 214,300 Kao Corporation 22,611,736 23,109,722 871,644 Hennes & Mauritz AB B 26,849,970 23,011,470
Cash and Cash Equivalents 22,349,035 22,349,035 2,058,287 Brambles Ltd. 19,978,995 21,975,262
164,070 Nike Inc., Class B 12,513,531 21,580,198
The Equitable Life Mackenzie Ivy Global Balanced Fund is 100% invested in the Mackenzie Ivy Global Balanced Fund. The following is based on information as provided
by Mackenzie Financial Corporation. It represents the top 25 holdings within the underlying fund.
107
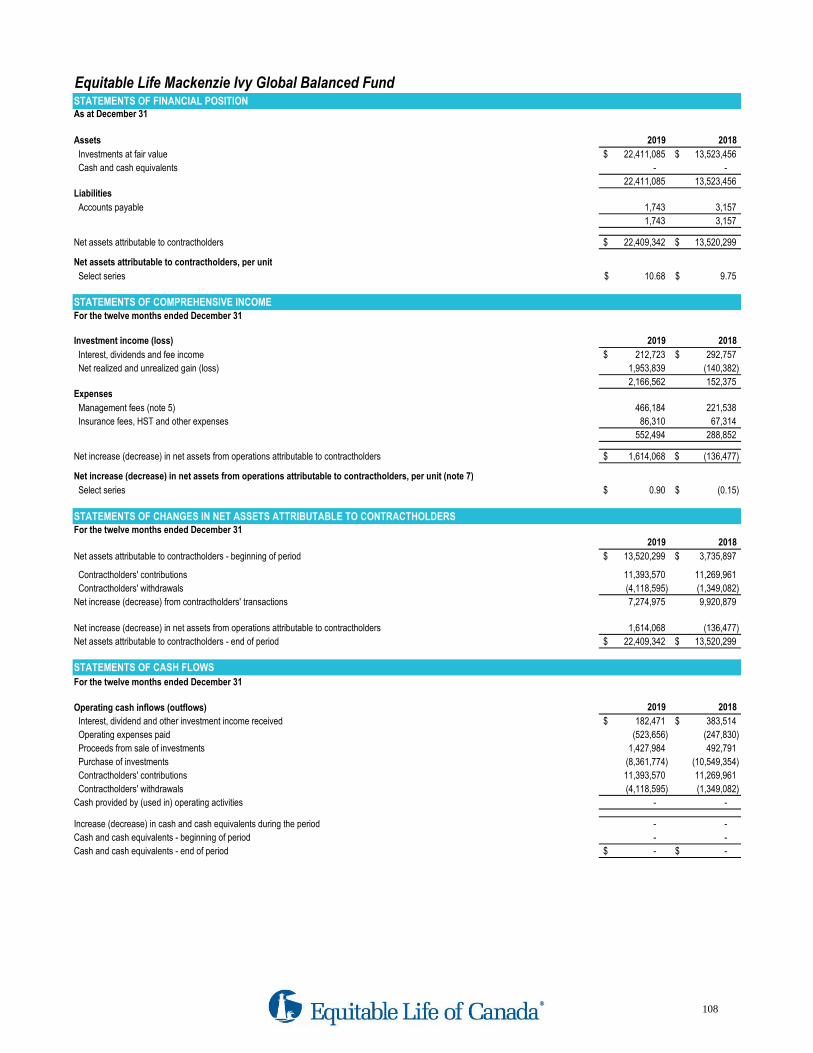
Equitable Life Mackenzie Ivy Global Balanced FundSTATEMENTS OF FINANCIAL POSITIONAs at December 31
Assets 2019 2018
Investments at fair value 22,411,085$ 13,523,456$
Cash and cash equivalents - -
22,411,085 13,523,456 Liabilities
Accounts payable 1,743 3,157
1,743 3,157
Net assets attributable to contractholders 22,409,342$ 13,520,299$
Net assets attributable to contractholders, per unit
Select series 10.68$ 9.75$
STATEMENTS OF COMPREHENSIVE INCOMEFor the twelve months ended December 31
Investment income (loss) 2019 2018
Interest, dividends and fee income 212,723$ 292,757$
Net realized and unrealized gain (loss) 1,953,839 (140,382)
2,166,562 152,375 Expenses
Management fees (note 5) 466,184 221,538
Insurance fees, HST and other expenses 86,310 67,314
552,494 288,852
Net increase (decrease) in net assets from operations attributable to contractholders 1,614,068$ (136,477)$
Net increase (decrease) in net assets from operations attributable to contractholders, per unit (note 7)
Select series 0.90$ (0.15)$
STATEMENTS OF CHANGES IN NET ASSETS ATTRIBUTABLE TO CONTRACTHOLDERSFor the twelve months ended December 31
2019 2018
Net assets attributable to contractholders - beginning of period 13,520,299$ 3,735,897$
Contractholders' contributions 11,393,570 11,269,961
Contractholders' withdrawals (4,118,595) (1,349,082)
Net increase (decrease) from contractholders' transactions 7,274,975 9,920,879
Net increase (decrease) in net assets from operations attributable to contractholders 1,614,068 (136,477)
Net assets attributable to contractholders - end of period 22,409,342$ 13,520,299$
STATEMENTS OF CASH FLOWS
For the twelve months ended December 31
Operating cash inflows (outflows) 2019 2018
Interest, dividend and other investment income received 182,471$ 383,514$
Operating expenses paid (523,656) (247,830)
Proceeds from sale of investments 1,427,984 492,791
Purchase of investments (8,361,774) (10,549,354)
Contractholders' contributions 11,393,570 11,269,961
Contractholders' withdrawals (4,118,595) (1,349,082)
Cash provided by (used in) operating activities - -
Increase (decrease) in cash and cash equivalents during the period - -
Cash and cash equivalents - beginning of period - -
Cash and cash equivalents - end of period -$ -$
108

Equitable Life Mackenzie Ivy Global Balanced FundANNUAL COMPOUND NET RETURNS - the following unaudited schedule is provided for Funds in existence for greater than 12 monthsAs at December 31
Since Inception
Date of inception 1 Year 3 Year 5 Year 10 Year (if <10 yrs)
Select series May 2017 9.6% N/A N/A N/A 2.6%
As at December 31¹
For the twelve months ended December 31² 2019 2019* 2018 2017 2016 2015
Net asset value per unit (Select series)1$10.68 $9.75 $9.80 N/A N/A
Number of units outstanding (Select series)12,097,950 1,386,604 381,377 N/A N/A
Management expense ratio (Select series)22.84% 2.86% 2.88% 2.89% N/A N/A
Net assets (000s)1$22,409 $13,520 $3,736 N/A N/A
Portfolio turnover rate2 (note 6) 7.77% 5.64% 1.95% N/A N/A
* Represents the pro-forma management expense ratio as described in note 5. .For additional product or segregated fund information please refer to your contract and information folder.
FINANCIAL HIGHLIGHTS - the following unaudited schedule shows select key financial information about the Fund and is intended to help you
understand the Fund's financial performance for the past five years
109
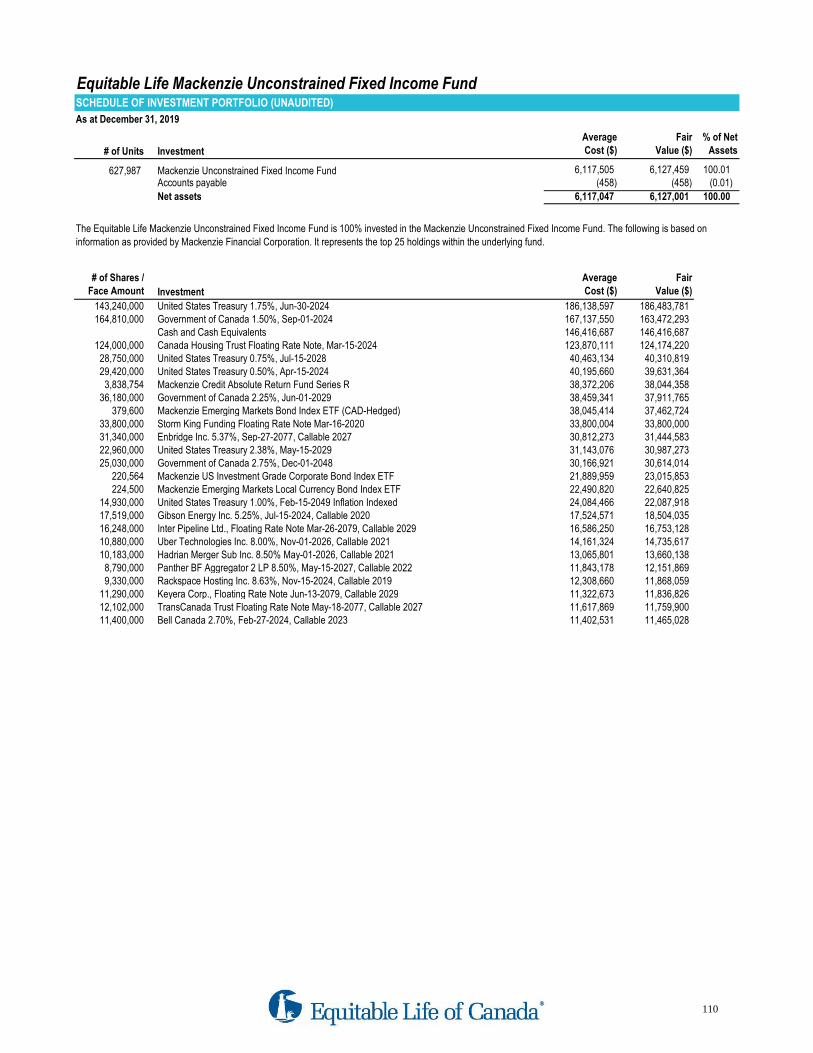
Equitable Life Mackenzie Unconstrained Fixed Income FundSCHEDULE OF INVESTMENT PORTFOLIO (UNAUDITED)
As at December 31, 2019
# of Units Investment
Average
Cost ($)
Fair
Value ($)
% of Net
Assets
627,987 Mackenzie Unconstrained Fixed Income Fund 6,117,505 6,127,459 100.01 Accounts payable (458) (458) (0.01)
Net assets 6,117,047 6,127,001 100.00
# of Shares /
Face Amount Investment
Average
Cost ($)
Fair
Value ($)
143,240,000 United States Treasury 1.75%, Jun-30-2024 186,138,597 186,483,781 164,810,000 Government of Canada 1.50%, Sep-01-2024 167,137,550 163,472,293
Cash and Cash Equivalents 146,416,687 146,416,687 124,000,000 Canada Housing Trust Floating Rate Note, Mar-15-2024 123,870,111 124,174,220
28,750,000 United States Treasury 0.75%, Jul-15-2028 40,463,134 40,310,819 29,420,000 United States Treasury 0.50%, Apr-15-2024 40,195,660 39,631,364
3,838,754 Mackenzie Credit Absolute Return Fund Series R 38,372,206 38,044,358 36,180,000 Government of Canada 2.25%, Jun-01-2029 38,459,341 37,911,765
379,600 Mackenzie Emerging Markets Bond Index ETF (CAD-Hedged) 38,045,414 37,462,724 33,800,000 Storm King Funding Floating Rate Note Mar-16-2020 33,800,004 33,800,000 31,340,000 Enbridge Inc. 5.37%, Sep-27-2077, Callable 2027 30,812,273 31,444,583 22,960,000 United States Treasury 2.38%, May-15-2029 31,143,076 30,987,273
220,564 Mackenzie US Investment Grade Corporate Bond Index ETF 21,889,959 23,015,853 224,500 Mackenzie Emerging Markets Local Currency Bond Index ETF 22,490,820 22,640,825
14,930,000 United States Treasury 1.00%, Feb-15-2049 Inflation Indexed 24,084,466 22,087,918 17,519,000 Gibson Energy Inc. 5.25%, Jul-15-2024, Callable 2020 17,524,571 18,504,035 16,248,000 Inter Pipeline Ltd., Floating Rate Note Mar-26-2079, Callable 2029 16,586,250 16,753,128 10,880,000 Uber Technologies Inc. 8.00%, Nov-01-2026, Callable 2021 14,161,324 14,735,617 10,183,000 Hadrian Merger Sub Inc. 8.50% May-01-2026, Callable 2021 13,065,801 13,660,138
8,790,000 Panther BF Aggregator 2 LP 8.50%, May-15-2027, Callable 2022 11,843,178 12,151,869 9,330,000 Rackspace Hosting Inc. 8.63%, Nov-15-2024, Callable 2019 12,308,660 11,868,059
11,290,000 Keyera Corp., Floating Rate Note Jun-13-2079, Callable 2029 11,322,673 11,836,826 12,102,000 TransCanada Trust Floating Rate Note May-18-2077, Callable 2027 11,617,869 11,759,900 11,400,000 Bell Canada 2.70%, Feb-27-2024, Callable 2023 11,402,531 11,465,028
The Equitable Life Mackenzie Unconstrained Fixed Income Fund is 100% invested in the Mackenzie Unconstrained Fixed Income Fund. The following is based on
information as provided by Mackenzie Financial Corporation. It represents the top 25 holdings within the underlying fund.
110
25,030,000 Government of Canada 2.75%, Dec-01-2048 3 0,166,921 30,614,014
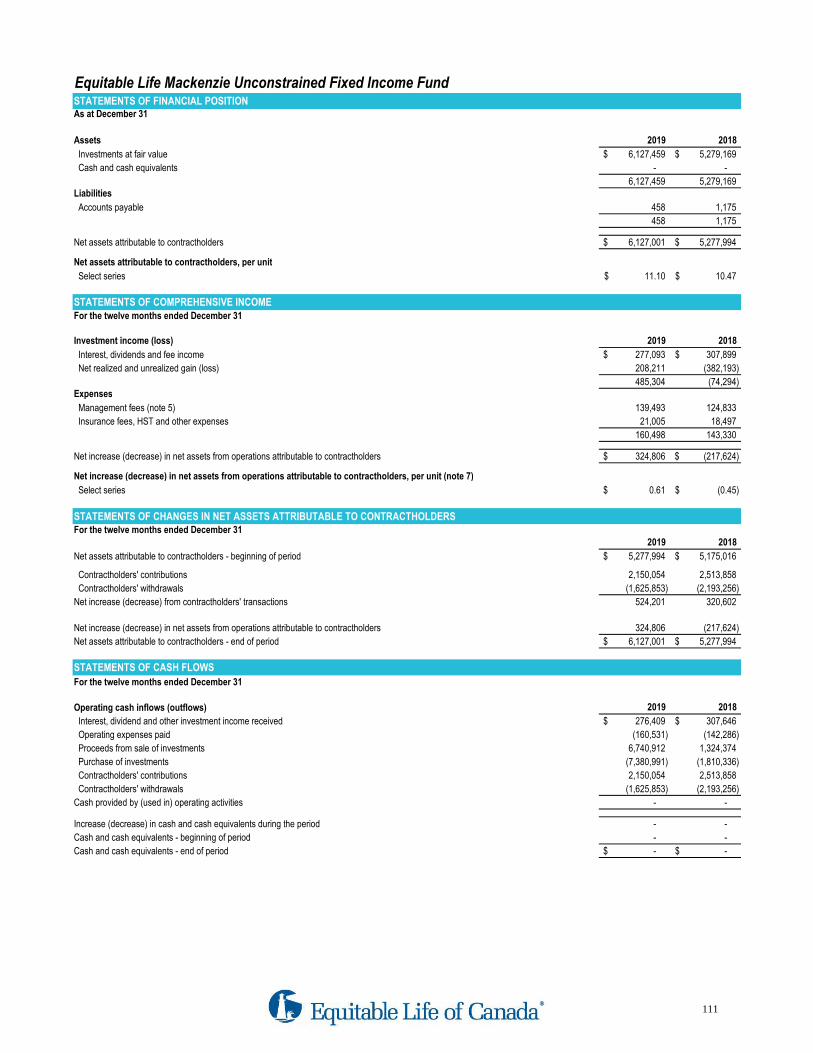
Equitable Life Mackenzie Unconstrained Fixed Income FundSTATEMENTS OF FINANCIAL POSITIONAs at December 31
Assets 2019 2018
Investments at fair value 6,127,459$ 5,279,169$
Cash and cash equivalents - -
6,127,459 5,279,169 Liabilities
Accounts payable 458 1,175
458 1,175
Net assets attributable to contractholders 6,127,001$ 5,277,994$
Net assets attributable to contractholders, per unit
Select series 11.10$ 10.47$
STATEMENTS OF COMPREHENSIVE INCOMEFor the twelve months ended December 31
Investment income (loss) 2019 2018
Interest, dividends and fee income 277,093$ 307,899$
Net realized and unrealized gain (loss) 208,211 (382,193)
485,304 (74,294) Expenses
Management fees (note 5) 139,493 124,833
Insurance fees, HST and other expenses 21,005 18,497
160,498 143,330
Net increase (decrease) in net assets from operations attributable to contractholders 324,806$ (217,624)$
Net increase (decrease) in net assets from operations attributable to contractholders, per unit (note 7)
Select series 0.61$ (0.45)$
STATEMENTS OF CHANGES IN NET ASSETS ATTRIBUTABLE TO CONTRACTHOLDERSFor the twelve months ended December 31
2019 2018
Net assets attributable to contractholders - beginning of period 5,277,994$ 5,175,016$
Contractholders' contributions 2,150,054 2,513,858
Contractholders' withdrawals (1,625,853) (2,193,256)
Net increase (decrease) from contractholders' transactions 524,201 320,602
Net increase (decrease) in net assets from operations attributable to contractholders 324,806 (217,624)
Net assets attributable to contractholders - end of period 6,127,001$ 5,277,994$
STATEMENTS OF CASH FLOWS
For the twelve months ended December 31
Operating cash inflows (outflows) 2019 2018
Interest, dividend and other investment income received 276,409$ 307,646$
Operating expenses paid (160,531) (142,286)
Proceeds from sale of investments 6,740,912 1,324,374
Purchase of investments (7,380,991) (1,810,336)
Contractholders' contributions 2,150,054 2,513,858
Contractholders' withdrawals (1,625,853) (2,193,256)
Cash provided by (used in) operating activities - -
Increase (decrease) in cash and cash equivalents during the period - -
Cash and cash equivalents - beginning of period - -
Cash and cash equivalents - end of period -$ -$
111

Equitable Life Mackenzie Unconstrained Fixed Income FundANNUAL COMPOUND NET RETURNS - the following unaudited schedule is provided for Funds in existence for greater than 12 monthsAs at December 31
Since Inception
Date of inception 1 Year 3 Year 5 Year 10 Year (if <10 yrs)
Select series September 2013 6.1% 1.5% 1.7% N/A 1.7%
As at December 31¹
For the twelve months ended December 31² 2019 2019* 2018 2017 2016 2015
Net asset value per unit (Select series)1$11.10 $10.47 $10.92 $10.63 $9.67
Number of units outstanding (Select series)1551,793 504,211 473,985 245,521 187,012
Management expense ratio (Select series)22.73% 2.79% 2.72% 2.71% 2.72% 2.69%
Net assets (000s)1$6,127 $5,278 $5,175 $2,609 $1,807
Portfolio turnover rate2 (note 6) 115.43% 25.47% 12.43% 25.03% 31.04%
* Represents the pro-forma management expense ratio as described in note 5.
For additional product or segregated fund information please refer to your contract and information folder.
FINANCIAL HIGHLIGHTS - the following unaudited schedule shows select key financial information about the Fund and is intended to help you
understand the Fund's financial performance for the past five years
112

Equitable Life Quotential Balanced Growth PortfolioSCHEDULE OF INVESTMENT PORTFOLIO (UNAUDITED)
As at December 31, 2019
# of Units Investment
Average
Cost ($)
Fair
Value ($)
% of Net
Assets
8,296,759 Franklin Quotential Balanced Growth Portfolio 71,607,157 100,694,442 100.01 Accounts payable (8,710) (8,710) (0.01)
Net assets 71,598,447 100,685,732 100.00
# of Shares /
Face Amount Investment
Average
Cost ($)
Fair
Value ($)
25,940,040 Franklin Bissett Canadian Government Bond Fund, Series O 255,952,766 258,811,564 16,320,558 Franklin Bissett Core Plus Bond Fund, Series O 244,698,138 255,364,499 13,803,002 Franklin U.S. Core Equity Fund, Series O 136,788,915 146,759,042
6,053,390 FTIF Franklin Liberty Global Aggregate Bond Fund 124,545,893 128,331,868 4,850,925 Franklin FTSE U.S. Index ETF 103,173,785 113,608,664
625,749 Franklin Bissett Canadian Equity Fund, Series O 70,342,522 101,693,589 4,357,550 Franklin FTSE Canada All Cap Index ETF 91,818,440 97,195,153 1,036,120 Franklin U.S. Rising Dividends Fund, Series O 50,591,833 91,377,609 8,386,968 Franklin International Core Equity Fund, Series O 82,091,035 85,280,368 8,434,836 Franklin Canadian Core Equity Fund, Series O 83,185,750 85,201,967 1,669,754 Franklin U.S. Opportunities Fund, Series O 39,836,732 78,662,288
914,555 iShares Core MSCI EAFE ETF 75,148,465 77,481,703 2,614,550 Franklin LibertyQT U.S. Equity Index ETF 56,300,338 69,102,557 6,513,347 Franklin Bissett Short Term Bond Fund, Series O 68,764,128 67,978,499 5,397,583 Templeton Global Bond Fund, Series O 66,907,403 62,231,968 5,967,302 Franklin Templeton Canadian Large Cap Fund, Series O 61,780,818 58,421,078 2,023,830 Franklin FTSE Europe Ex U.K. Index ETF 42,188,747 45,536,175 3,460,602 Franklin Emerging Market Core Equity Fund, Series O 35,280,416 36,940,546
519,740 iShares Core MSCI Emerging Markets ETF 34,877,212 36,284,470 1,398,079 Templeton Emerging Markets Fund, Series O 31,269,510 31,993,491
Cash and Cash Equivalents (12,177,389) (12,177,389)
The Equitable Life Quotential Balanced Growth Portfolio is 100% invested in the Franklin Quotential Balanced Growth Portfolio. The following is based on information as
provided by Franklin Templeton Investments Corp. This fund has 21 holdings.
113

Equitable Life Quotential Balanced Growth PortfolioSTATEMENTS OF FINANCIAL POSITIONAs at December 31
Assets 2019 2018
Investments at fair value 100,694,442$ 105,138,315$
Cash and cash equivalents - -
100,694,442 105,138,315 Liabilities
Accounts payable 8,710 27,365
8,710 27,365
Net assets attributable to contractholders 100,685,732$ 105,110,950$
Net assets attributable to contractholders, per unit
Initial series 16.08$ 14.58$
B series 15.56$ 14.15$
Select series 13.45$ 12.15$
STATEMENTS OF COMPREHENSIVE INCOMEFor the twelve months ended December 31
Investment income (loss) 2019 2018
Interest, dividends and fee income 1,657,151$ 1,853,185$
Net realized and unrealized gain (loss) 12,360,247 (5,212,023)
14,017,398 (3,358,838) Expenses
Management fees (note 5) 3,022,472 3,347,489
Insurance fees, HST and other expenses 411,819 451,926
3,434,291 3,799,415
Net increase (decrease) in net assets from operations attributable to contractholders 10,583,107$ (7,158,253)$
Net increase (decrease) in net assets from operations attributable to contractholders, per unit (note 7)
Initial series 1.57$ (0.95)$
B series 1.48$ (0.93)$
Select series 1.30$ (0.80)$
STATEMENTS OF CHANGES IN NET ASSETS ATTRIBUTABLE TO CONTRACTHOLDERSFor the twelve months ended December 31
2019 2018
Net assets attributable to contractholders - beginning of period 105,110,950$ 120,674,913$
Contractholders' contributions 14,327,377 17,523,232
Contractholders' withdrawals (29,335,702) (25,928,942)
Net increase (decrease) from contractholders' transactions (15,008,325) (8,405,710)
Net increase (decrease) in net assets from operations attributable to contractholders 10,583,107 (7,158,253)
Net assets attributable to contractholders - end of period 100,685,732$ 105,110,950$
STATEMENTS OF CASH FLOWS
For the twelve months ended December 31
Operating cash inflows (outflows) 2019 2018
Interest, dividend and other investment income received 1,866,489$ 3,498,441$
Operating expenses paid (3,368,862) (3,694,050)
Proceeds from sale of investments 21,084,258 15,468,060
Purchase of investments (4,573,560) (6,866,741)
Contractholders' contributions 14,327,377 17,523,232
Contractholders' withdrawals (29,335,702) (25,928,942)
Cash provided by (used in) operating activities - -
Increase (decrease) in cash and cash equivalents during the period - -
Cash and cash equivalents - beginning of period - -
Cash and cash equivalents - end of period -$ -$
114

Equitable Life Quotential Balanced Growth PortfolioANNUAL COMPOUND NET RETURNS - the following unaudited schedule is provided for Funds in existence for greater than 12 monthsAs at December 31
Since Inception
Date of inception 1 Year 3 Year 5 Year 10 Year (if <10 yrs)
Initial series January 2005 10.3% 2.8% 2.7% 4.1% N/A
B series September 2006 9.9% 2.5% 2.4% 3.8% N/A
Select series September 2013 10.7% 3.2% 3.2% N/A 4.5%
As at December 31¹
For the twelve months ended December 31² 2019 2019* 2018 2017 2016 2015
Net asset value per unit (Initial series)1$16.08 $14.58 $15.58 $14.82 $14.64
Net asset value per unit (B series)1$15.56 $14.15 $15.16 $14.47 $14.33
Net asset value per unit (Select series)1$13.45 $12.15 $12.93 $12.25 $12.05
Number of units outstanding (Initial series)12,834,020 3,637,696 4,179,937 4,812,815 5,518,679
Number of units outstanding (B series)1638,029 798,891 1,022,004 1,178,770 1,381,986
Number of units outstanding (Select series)13,359,839 3,353,844 3,099,781 2,262,432 1,478,184
Management expense ratio (Initial series)23.30% 3.30% 3.31% 3.31% 3.30% 3.31%
Management expense ratio (B series)23.61% 3.61% 3.60% 3.60% 3.60% 3.60%
Management expense ratio (Select series)22.90% 2.90% 2.89% 2.89% 2.89% 2.89%
Net assets (000s)1$100,686 $105,111 $120,675 $116,085 $118,426
Portfolio turnover rate2 (note 6) 4.33% 5.94% 9.16% 6.13% 10.56%
* Represents the pro-forma management expense ratio as described in note 5.
For additional product or segregated fund information please refer to your contract and information folder.
FINANCIAL HIGHLIGHTS - the following unaudited schedule shows select key financial information about the Fund and is intended to help you
understand the Fund's financial performance for the past five years
115

Equitable Life Quotential Balanced Income PortfolioSCHEDULE OF INVESTMENT PORTFOLIO (UNAUDITED)
As at December 31, 2019
# of Units Investment
Average
Cost ($)
Fair
Value ($)
% of Net
Assets
3,770,040 Franklin Quotential Balanced Income Portfolio 32,797,573 38,433,291 100.01 Accounts payable (3,110) (3,110) (0.01)
Net assets 32,794,463 38,430,181 100.00
# of Shares /
Face Amount Investment
Average
Cost ($)
Fair
Value ($)
16,354,443 Franklin Bissett Canadian Government Bond Fund, Series O 161,292,218 163,173,189 10,275,439 Franklin Bissett Core Plus Bond Fund, Series O 154,045,422 160,777,746
3,815,045 FTIF Franklin Liberty Global Aggregate Bond Fund 78,425,838 80,878,954 4,101,054 Franklin Bissett Short Term Bond Fund, Series O 43,321,677 42,801,885 3,771,131 Franklin U.S. Core Equity Fund, Series O 37,515,383 40,096,170 3,405,795 Templeton Global Bond Fund, Series O 42,377,526 39,267,450 1,315,125 Franklin FTSE U.S. Index ETF 28,235,395 30,800,228 1,354,495 Franklin FTSE Canada All Cap Index ETF 28,602,462 30,212,011
175,795 Franklin Bissett Canadian Equity Fund, Series O 20,418,422 28,569,395 279,842 Franklin U.S. Rising Dividends Fund, Series O 14,068,362 24,679,883
2,347,540 Franklin Canadian Core Equity Fund, Series O 23,150,485 23,712,967 2,289,777 Franklin International Core Equity Fund, Series O 22,490,450 23,282,907
448,225 Franklin U.S. Opportunities Fund, Series O 11,158,560 21,115,932 243,715 iShares Core MSCI EAFE ETF 20,082,186 20,647,696 700,675 Franklin LibertyQT U.S. Equity Index ETF 15,300,430 18,518,840
1,875,781 Franklin Templeton Canadian Large Cap Fund, Series O 19,355,050 18,364,276 539,665 Franklin FTSE Europe Ex U.K. Index ETF 11,293,222 12,142,463 953,987 Franklin Emerging Market Core Equity Fund, Series O 9,743,649 10,183,431 142,900 iShares Core MSCI Emerging Markets ETF 9,612,567 9,976,240 384,282 Templeton Emerging Markets Fund, Series O 8,606,643 8,793,862
Cash and Cash Equivalents (4,436,558) (4,436,558)
The Equitable Life Quotential Balanced Income Portfolio is 100% invested in the Franklin Quotential Balanced Income Portfolio. The following is based on information as
provided by Franklin Templeton Investments Corp. This fund has 21 holdings.
116
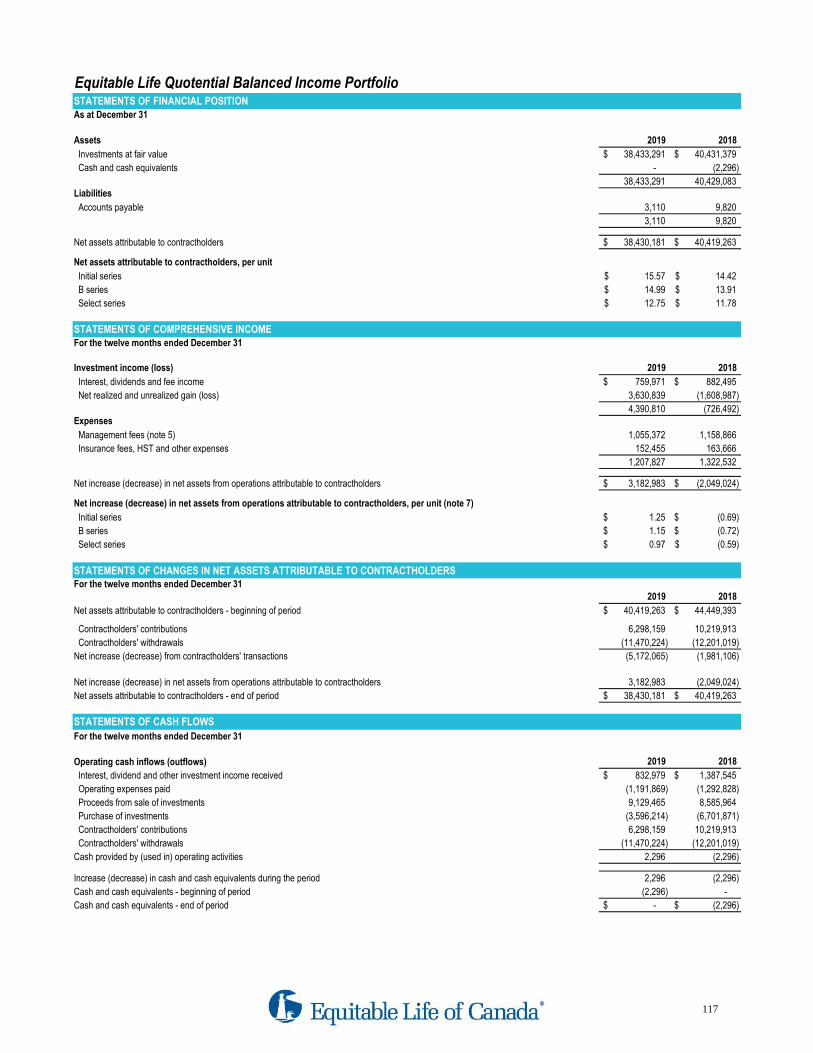
Equitable Life Quotential Balanced Income PortfolioSTATEMENTS OF FINANCIAL POSITIONAs at December 31
Assets 2019 2018
Investments at fair value 38,433,291$ 40,431,379$
Cash and cash equivalents - (2,296)
38,433,291 40,429,083 Liabilities
Accounts payable 3,110 9,820
3,110 9,820
Net assets attributable to contractholders 38,430,181$ 40,419,263$
Net assets attributable to contractholders, per unit
Initial series 15.57$ 14.42$
B series 14.99$ 13.91$
Select series 12.75$ 11.78$
STATEMENTS OF COMPREHENSIVE INCOMEFor the twelve months ended December 31
Investment income (loss) 2019 2018
Interest, dividends and fee income 759,971$ 882,495$
Net realized and unrealized gain (loss) 3,630,839 (1,608,987)
4,390,810 (726,492) Expenses
Management fees (note 5) 1,055,372 1,158,866
Insurance fees, HST and other expenses 152,455 163,666
1,207,827 1,322,532
Net increase (decrease) in net assets from operations attributable to contractholders 3,182,983$ (2,049,024)$
Net increase (decrease) in net assets from operations attributable to contractholders, per unit (note 7)
Initial series 1.25$ (0.69)$
B series 1.15$ (0.72)$
Select series 0.97$ (0.59)$
STATEMENTS OF CHANGES IN NET ASSETS ATTRIBUTABLE TO CONTRACTHOLDERSFor the twelve months ended December 31
2019 2018
Net assets attributable to contractholders - beginning of period 40,419,263$ 44,449,393$
Contractholders' contributions 6,298,159 10,219,913
Contractholders' withdrawals (11,470,224) (12,201,019)
Net increase (decrease) from contractholders' transactions (5,172,065) (1,981,106)
Net increase (decrease) in net assets from operations attributable to contractholders 3,182,983 (2,049,024)
Net assets attributable to contractholders - end of period 38,430,181$ 40,419,263$
STATEMENTS OF CASH FLOWS
For the twelve months ended December 31
Operating cash inflows (outflows) 2019 2018
Interest, dividend and other investment income received 832,979$ 1,387,545$
Operating expenses paid (1,191,869) (1,292,828)
Proceeds from sale of investments 9,129,465 8,585,964
Purchase of investments (3,596,214) (6,701,871)
Contractholders' contributions 6,298,159 10,219,913
Contractholders' withdrawals (11,470,224) (12,201,019)
Cash provided by (used in) operating activities 2,296 (2,296)
Increase (decrease) in cash and cash equivalents during the period 2,296 (2,296)
Cash and cash equivalents - beginning of period (2,296) -
Cash and cash equivalents - end of period -$ (2,296)$
117

Equitable Life Quotential Balanced Income PortfolioANNUAL COMPOUND NET RETURNS - the following unaudited schedule is provided for Funds in existence for greater than 12 monthsAs at December 31
Since Inception
Date of inception 1 Year 3 Year 5 Year 10 Year (if <10 yrs)
Initial series January 2005 8.0% 2.2% 2.3% 3.6% N/A
B series September 2006 7.7% 1.9% 2.0% 3.3% N/A
Select series September 2013 8.2% 2.4% 2.5% N/A 3.7%
As at December 31¹
For the twelve months ended December 31² 2019 2019* 2018 2017 2016 2015
Net asset value per unit (Initial series)1$15.57 $14.42 $15.15 $14.59 $14.44
Net asset value per unit (B series)1$14.99 $13.91 $14.68 $14.19 $14.08
Net asset value per unit (Select series)1$12.75 $11.78 $12.36 $11.88 $11.72
Number of units outstanding (Initial series)1935,398 1,278,347 1,557,187 1,832,245 2,069,689
Number of units outstanding (B series)1145,240 190,027 223,083 272,463 299,646
Number of units outstanding (Select series)11,701,174 1,642,483 1,423,140 1,152,817 734,045
Management expense ratio (Initial series)23.03% 3.04% 3.03% 3.04% 3.03% 3.03%
Management expense ratio (B series)23.36% 3.37% 3.37% 3.36% 3.37% 3.38%
Management expense ratio (Select series)22.84% 2.85% 2.84% 2.84% 2.83% 2.87%
Net assets (000s)1$38,430 $40,419 $44,449 $44,298 $42,702
Portfolio turnover rate2 (note 6) 8.97% 15.43% 14.06% 12.29% 13.77%
* Represents the pro-forma management expense ratio as described in note 5.
For additional product or segregated fund information please refer to your contract and information folder.
FINANCIAL HIGHLIGHTS - the following unaudited schedule shows select key financial information about the Fund and is intended to help you
understand the Fund's financial performance for the past five years
118
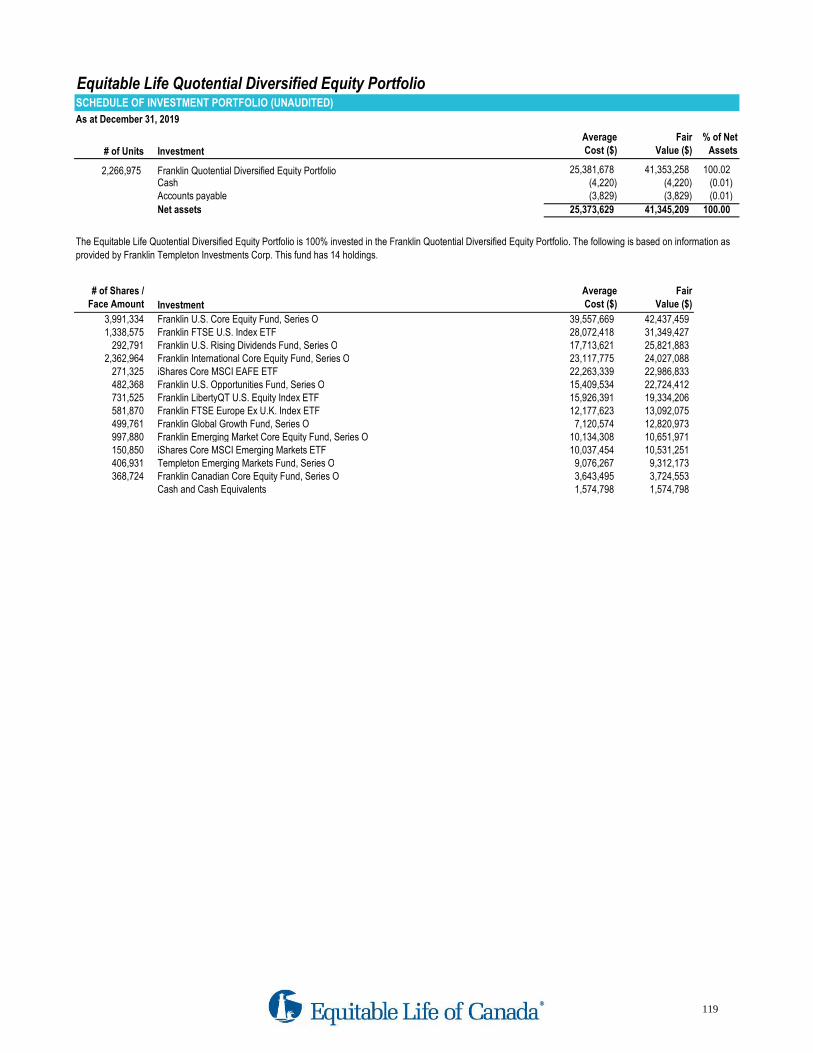
Equitable Life Quotential Diversified Equity PortfolioSCHEDULE OF INVESTMENT PORTFOLIO (UNAUDITED)
As at December 31, 2019
# of Units Investment
Average
Cost ($)
Fair
Value ($)
% of Net
Assets
2,266,975 Franklin Quotential Diversified Equity Portfolio 25,381,678 41,353,258 100.02 Cash (4,220) (4,220) (0.01) Accounts payable (3,829) (3,829) (0.01)
Net assets 25,373,629 41,345,209 100.00
# of Shares /
Face Amount Investment
Average
Cost ($)
Fair
Value ($)
3,991,334 Franklin U.S. Core Equity Fund, Series O 39,557,669 42,437,459 1,338,575 Franklin FTSE U.S. Index ETF 28,072,418 31,349,427
292,791 Franklin U.S. Rising Dividends Fund, Series O 17,713,621 25,821,883 2,362,964 Franklin International Core Equity Fund, Series O 23,117,775 24,027,088
271,325 iShares Core MSCI EAFE ETF 22,263,339 22,986,833 482,368 Franklin U.S. Opportunities Fund, Series O 15,409,534 22,724,412 731,525 Franklin LibertyQT U.S. Equity Index ETF 15,926,391 19,334,206 581,870 Franklin FTSE Europe Ex U.K. Index ETF 12,177,623 13,092,075 499,761 Franklin Global Growth Fund, Series O 7,120,574 12,820,973 997,880 Franklin Emerging Market Core Equity Fund, Series O 10,134,308 10,651,971 150,850 iShares Core MSCI Emerging Markets ETF 10,037,454 10,531,251 406,931 Templeton Emerging Markets Fund, Series O 9,076,267 9,312,173 368,724 Franklin Canadian Core Equity Fund, Series O 3,643,495 3,724,553
Cash and Cash Equivalents 1,574,798 1,574,798
The Equitable Life Quotential Diversified Equity Portfolio is 100% invested in the Franklin Quotential Diversified Equity Portfolio. The following is based on information as
provided by Franklin Templeton Investments Corp. This fund has 14 holdings.
119

Equitable Life Quotential Diversified Equity PortfolioSTATEMENTS OF FINANCIAL POSITIONAs at December 31
Assets 2019 2018
Investments at fair value 41,353,258$ 39,113,347$
Cash and cash equivalents (4,220) -
41,349,038 39,113,347 Liabilities
Accounts payable 3,829 10,818
3,829 10,818
Net assets attributable to contractholders 41,345,209$ 39,102,529$
Net assets attributable to contractholders, per unit
Initial series 17.02$ 14.57$
B series 16.80$ 14.39$
Select series 15.23$ 12.98$
STATEMENTS OF COMPREHENSIVE INCOMEFor the twelve months ended December 31
Investment income (loss) 2019 2018
Interest, dividends and fee income 183,951$ 281,447$
Net realized and unrealized gain (loss) 7,665,823 (2,342,114)
7,849,774 (2,060,667) Expenses
Management fees (note 5) 1,219,354 1,253,593
Insurance fees, HST and other expenses 216,282 219,412
1,435,636 1,473,005
Net increase (decrease) in net assets from operations attributable to contractholders 6,414,138$ (3,533,672)$
Net increase (decrease) in net assets from operations attributable to contractholders, per unit (note 7)
Initial series 2.50$ (1.29)$
B series 2.47$ (1.18)$
Select series 2.24$ (1.31)$
STATEMENTS OF CHANGES IN NET ASSETS ATTRIBUTABLE TO CONTRACTHOLDERSFor the twelve months ended December 31
2019 2018
Net assets attributable to contractholders - beginning of period 39,102,529$ 40,761,312$
Contractholders' contributions 7,274,231 12,105,784
Contractholders' withdrawals (11,445,689) (10,230,895)
Net increase (decrease) from contractholders' transactions (4,171,458) 1,874,889
Net increase (decrease) in net assets from operations attributable to contractholders 6,414,138 (3,533,672)
Net assets attributable to contractholders - end of period 41,345,209$ 39,102,529$
STATEMENTS OF CASH FLOWS
For the twelve months ended December 31
Operating cash inflows (outflows) 2019 2018
Interest, dividend and other investment income received 140,709$ 760,308$
Operating expenses paid (1,399,383) (1,423,850)
Proceeds from sale of investments 7,316,101 5,020,374
Purchase of investments (1,890,189) (6,231,203)
Contractholders' contributions 7,274,231 12,105,784
Contractholders' withdrawals (11,445,689) (10,230,895)
Cash provided by (used in) operating activities (4,220) 518
Increase (decrease) in cash and cash equivalents during the period (4,220) 518
Cash and cash equivalents - beginning of period - (518)
Cash and cash equivalents - end of period (4,220)$ -$
120

Equitable Life Quotential Diversified Equity PortfolioANNUAL COMPOUND NET RETURNS - the following unaudited schedule is provided for Funds in existence for greater than 12 monthsAs at December 31
Since Inception
Date of inception 1 Year 3 Year 5 Year 10 Year (if <10 yrs)
Initial series January 2005 16.8% 5.2% 4.8% 6.1% N/A
B series September 2006 16.7% 5.1% 4.7% 6.0% N/A
Select series September 2013 17.3% 5.6% 5.2% N/A 6.7%
As at December 31¹
For the twelve months ended December 31² 2019 2019* 2018 2017 2016 2015
Net asset value per unit (Initial series)1$17.02 $14.57 $15.89 $14.62 $14.66
Net asset value per unit (B series)1$16.80 $14.39 $15.71 $14.47 $14.53
Net asset value per unit (Select series)1$15.23 $12.98 $14.10 $12.92 $12.90
Number of units outstanding (Initial series)11,023,577 1,218,302 1,310,776 1,647,072 1,948,887
Number of units outstanding (B series)1308,798 400,503 478,089 621,707 725,783
Number of units outstanding (Select series)11,230,721 1,200,782 880,836 648,211 449,222
Management expense ratio (Initial series)23.55% 3.56% 3.53% 3.53% 3.54% 3.54%
Management expense ratio (B series)23.63% 3.64% 3.64% 3.64% 3.64% 3.65%
Management expense ratio (Select series)23.12% 3.13% 3.12% 3.12% 3.12% 3.11%
Net assets (000s)1$41,345 $39,103 $40,761 $41,445 $44,917
Portfolio turnover rate2 (note 6) 4.60% 12.02% 6.55% 4.51% 8.84%
* Represents the pro-forma management expense ratio as described in note 5.
For additional product or segregated fund information please refer to your contract and information folder.
FINANCIAL HIGHLIGHTS - the following unaudited schedule shows select key financial information about the Fund and is intended to help you
understand the Fund's financial performance for the past five years
121
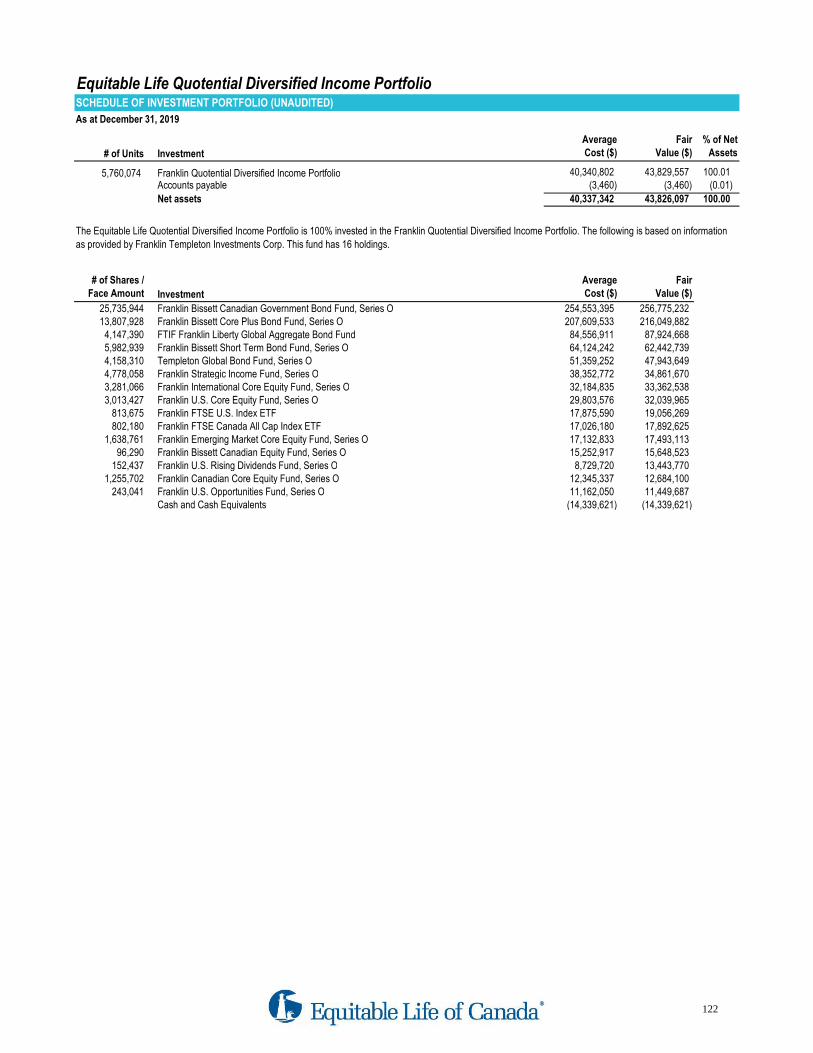
Equitable Life Quotential Diversified Income PortfolioSCHEDULE OF INVESTMENT PORTFOLIO (UNAUDITED)
As at December 31, 2019
# of Units Investment
Average
Cost ($)
Fair
Value ($)
% of Net
Assets
5,760,074 Franklin Quotential Diversified Income Portfolio 40,340,802 43,829,557 100.01 Accounts payable (3,460) (3,460) (0.01)
Net assets 40,337,342 43,826,097 100.00
# of Shares /
Face Amount Investment
Average
Cost ($)
Fair
Value ($)
25,735,944 Franklin Bissett Canadian Government Bond Fund, Series O 254,553,395 256,775,232 13,807,928 Franklin Bissett Core Plus Bond Fund, Series O 207,609,533 216,049,882
4,147,390 FTIF Franklin Liberty Global Aggregate Bond Fund 84,556,911 87,924,668 5,982,939 Franklin Bissett Short Term Bond Fund, Series O 64,124,242 62,442,739 4,158,310 Templeton Global Bond Fund, Series O 51,359,252 47,943,649 4,778,058 Franklin Strategic Income Fund, Series O 38,352,772 34,861,670 3,281,066 Franklin International Core Equity Fund, Series O 32,184,835 33,362,538 3,013,427 Franklin U.S. Core Equity Fund, Series O 29,803,576 32,039,965
813,675 Franklin FTSE U.S. Index ETF 17,875,590 19,056,269 802,180 Franklin FTSE Canada All Cap Index ETF 17,026,180 17,892,625
1,638,761 Franklin Emerging Market Core Equity Fund, Series O 17,132,833 17,493,113 96,290 Franklin Bissett Canadian Equity Fund, Series O 15,252,917 15,648,523
152,437 Franklin U.S. Rising Dividends Fund, Series O 8,729,720 13,443,770 1,255,702 Franklin Canadian Core Equity Fund, Series O 12,345,337 12,684,100
243,041 Franklin U.S. Opportunities Fund, Series O 11,162,050 11,449,687 Cash and Cash Equivalents (14,339,621) (14,339,621)
The Equitable Life Quotential Diversified Income Portfolio is 100% invested in the Franklin Quotential Diversified Income Portfolio. The following is based on information
as provided by Franklin Templeton Investments Corp. This fund has 16 holdings.
122
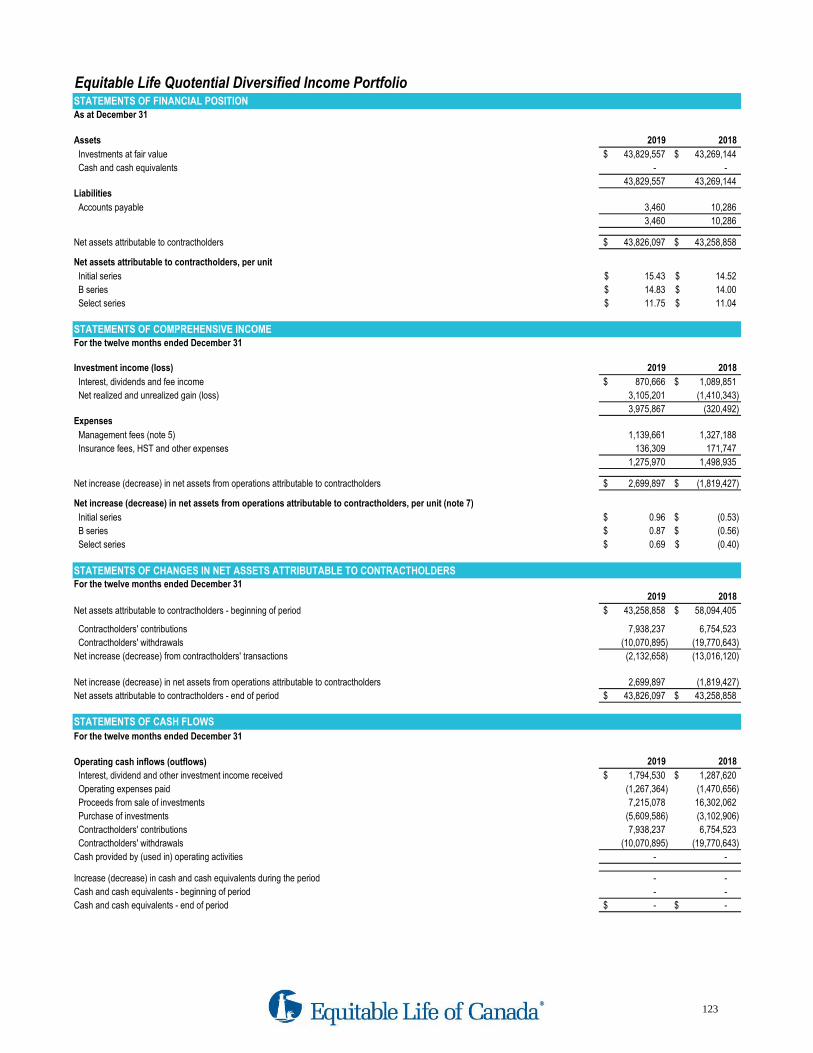
Equitable Life Quotential Diversified Income PortfolioSTATEMENTS OF FINANCIAL POSITIONAs at December 31
Assets 2019 2018
Investments at fair value 43,829,557$ 43,269,144$
Cash and cash equivalents - -
43,829,557 43,269,144 Liabilities
Accounts payable 3,460 10,286
3,460 10,286
Net assets attributable to contractholders 43,826,097$ 43,258,858$
Net assets attributable to contractholders, per unit
Initial series 15.43$ 14.52$
B series 14.83$ 14.00$
Select series 11.75$ 11.04$
STATEMENTS OF COMPREHENSIVE INCOMEFor the twelve months ended December 31
Investment income (loss) 2019 2018
Interest, dividends and fee income 870,666$ 1,089,851$
Net realized and unrealized gain (loss) 3,105,201 (1,410,343)
3,975,867 (320,492) Expenses
Management fees (note 5) 1,139,661 1,327,188
Insurance fees, HST and other expenses 136,309 171,747
1,275,970 1,498,935
Net increase (decrease) in net assets from operations attributable to contractholders 2,699,897$ (1,819,427)$
Net increase (decrease) in net assets from operations attributable to contractholders, per unit (note 7)
Initial series 0.96$ (0.53)$
B series 0.87$ (0.56)$
Select series 0.69$ (0.40)$
STATEMENTS OF CHANGES IN NET ASSETS ATTRIBUTABLE TO CONTRACTHOLDERSFor the twelve months ended December 31
2019 2018
Net assets attributable to contractholders - beginning of period 43,258,858$ 58,094,405$
Contractholders' contributions 7,938,237 6,754,523
Contractholders' withdrawals (10,070,895) (19,770,643)
Net increase (decrease) from contractholders' transactions (2,132,658) (13,016,120)
Net increase (decrease) in net assets from operations attributable to contractholders 2,699,897 (1,819,427)
Net assets attributable to contractholders - end of period 43,826,097$ 43,258,858$
STATEMENTS OF CASH FLOWS
For the twelve months ended December 31
Operating cash inflows (outflows) 2019 2018
Interest, dividend and other investment income received 1,794,530$ 1,287,620$
Operating expenses paid (1,267,364) (1,470,656)
Proceeds from sale of investments 7,215,078 16,302,062
Purchase of investments (5,609,586) (3,102,906)
Contractholders' contributions 7,938,237 6,754,523
Contractholders' withdrawals (10,070,895) (19,770,643)
Cash provided by (used in) operating activities - -
Increase (decrease) in cash and cash equivalents during the period - -
Cash and cash equivalents - beginning of period - -
Cash and cash equivalents - end of period -$ -$
123

Equitable Life Quotential Diversified Income PortfolioANNUAL COMPOUND NET RETURNS - the following unaudited schedule is provided for Funds in existence for greater than 12 monthsAs at December 31
Since Inception
Date of inception 1 Year 3 Year 5 Year 10 Year (if <10 yrs)
Initial series January 2005 6.3% 1.6% 1.6% 3.3% N/A
B series September 2006 5.9% 1.3% 1.2% 3.0% N/A
Select series September 2013 6.4% 1.7% 1.7% N/A 2.4%
As at December 31¹
For the twelve months ended December 31² 2019 2019* 2018 2017 2016 2015
Net asset value per unit (Initial series)1$15.43 $14.52 $15.07 $14.70 $14.55
Net asset value per unit (B series)1$14.83 $14.00 $14.59 $14.28 $14.18
Net asset value per unit (Select series)1$11.75 $11.04 $11.45 $11.16 $11.04
Number of units outstanding (Initial series)11,393,589 1,646,645 2,354,224 2,795,411 3,228,433
Number of units outstanding (B series)185,683 93,037 135,989 172,379 220,307
Number of units outstanding (Select series)11,791,735 1,635,506 1,803,294 1,287,793 979,749
Management expense ratio (Initial series)22.91% 2.92% 2.93% 2.93% 2.93% 2.92%
Management expense ratio (B series)23.27% 3.28% 3.28% 3.27% 3.27% 3.25%
Management expense ratio (Select series)22.81% 2.82% 2.82% 2.82% 2.83% 2.82%
Net assets (000s)1$43,826 $43,259 $58,094 $57,911 $60,910
Portfolio turnover rate2 (note 6) 12.80% 6.15% 17.93% 9.47% 12.56%
* Represents the pro-forma management expense ratio as described in note 5.
For additional product or segregated fund information please refer to your contract and information folder.
FINANCIAL HIGHLIGHTS - the following unaudited schedule shows select key financial information about the Fund and is intended to help you
understand the Fund's financial performance for the past five years
124
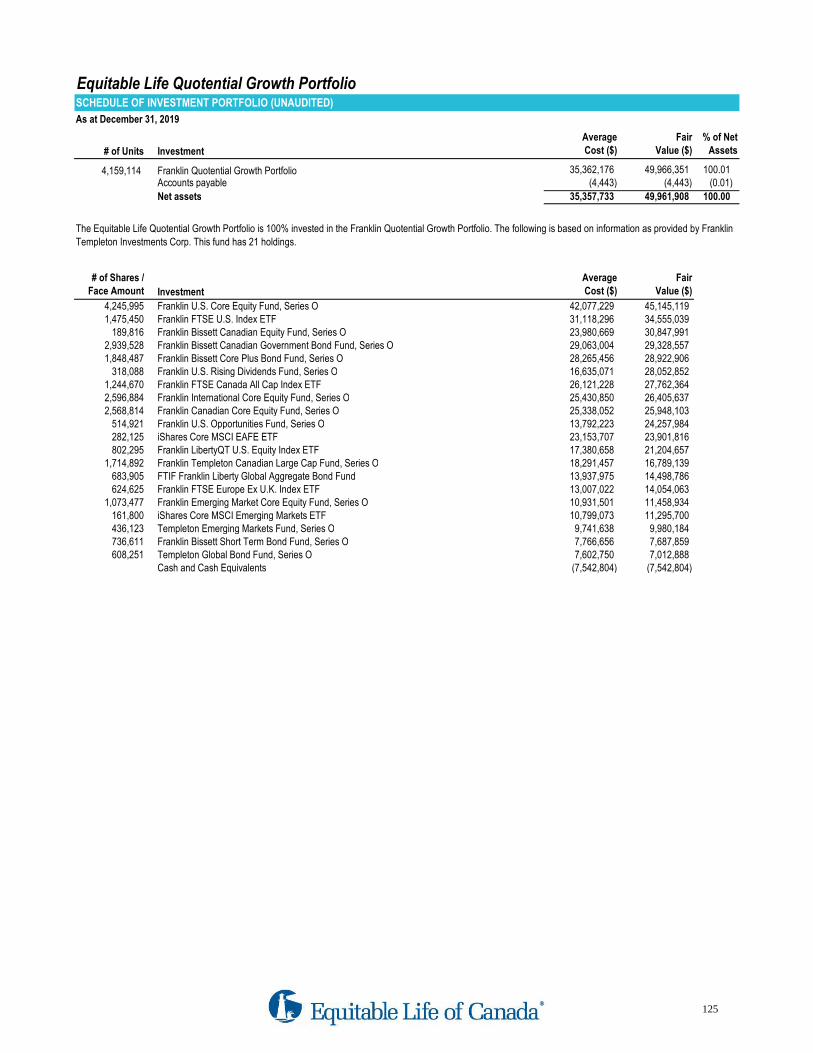
Equitable Life Quotential Growth PortfolioSCHEDULE OF INVESTMENT PORTFOLIO (UNAUDITED)
As at December 31, 2019
# of Units Investment
Average
Cost ($)
Fair
Value ($)
% of Net
Assets
4,159,114 Franklin Quotential Growth Portfolio 35,362,176 49,966,351 100.01 Accounts payable (4,443) (4,443) (0.01)
Net assets 35,357,733 49,961,908 100.00
# of Shares /
Face Amount Investment
Average
Cost ($)
Fair
Value ($)
4,245,995 Franklin U.S. Core Equity Fund, Series O 42,077,229 45,145,119 1,475,450 Franklin FTSE U.S. Index ETF 31,118,296 34,555,039
189,816 Franklin Bissett Canadian Equity Fund, Series O 23,980,669 30,847,991 2,939,528 Franklin Bissett Canadian Government Bond Fund, Series O 29,063,004 29,328,557 1,848,487 Franklin Bissett Core Plus Bond Fund, Series O 28,265,456 28,922,906
318,088 Franklin U.S. Rising Dividends Fund, Series O 16,635,071 28,052,852 1,244,670 Franklin FTSE Canada All Cap Index ETF 26,121,228 27,762,364 2,596,884 Franklin International Core Equity Fund, Series O 25,430,850 26,405,637 2,568,814 Franklin Canadian Core Equity Fund, Series O 25,338,052 25,948,103
514,921 Franklin U.S. Opportunities Fund, Series O 13,792,223 24,257,984 282,125 iShares Core MSCI EAFE ETF 23,153,707 23,901,816 802,295 Franklin LibertyQT U.S. Equity Index ETF 17,380,658 21,204,657
1,714,892 Franklin Templeton Canadian Large Cap Fund, Series O 18,291,457 16,789,139 683,905 FTIF Franklin Liberty Global Aggregate Bond Fund 13,937,975 14,498,786 624,625 Franklin FTSE Europe Ex U.K. Index ETF 13,007,022 14,054,063
1,073,477 Franklin Emerging Market Core Equity Fund, Series O 10,931,501 11,458,934 161,800 iShares Core MSCI Emerging Markets ETF 10,799,073 11,295,700 436,123 Templeton Emerging Markets Fund, Series O 9,741,638 9,980,184 736,611 Franklin Bissett Short Term Bond Fund, Series O 7,766,656 7,687,859 608,251 Templeton Global Bond Fund, Series O 7,602,750 7,012,888
Cash and Cash Equivalents (7,542,804) (7,542,804)
The Equitable Life Quotential Growth Portfolio is 100% invested in the Franklin Quotential Growth Portfolio. The following is based on information as provided by Franklin
Templeton Investments Corp. This fund has 21 holdings.
125
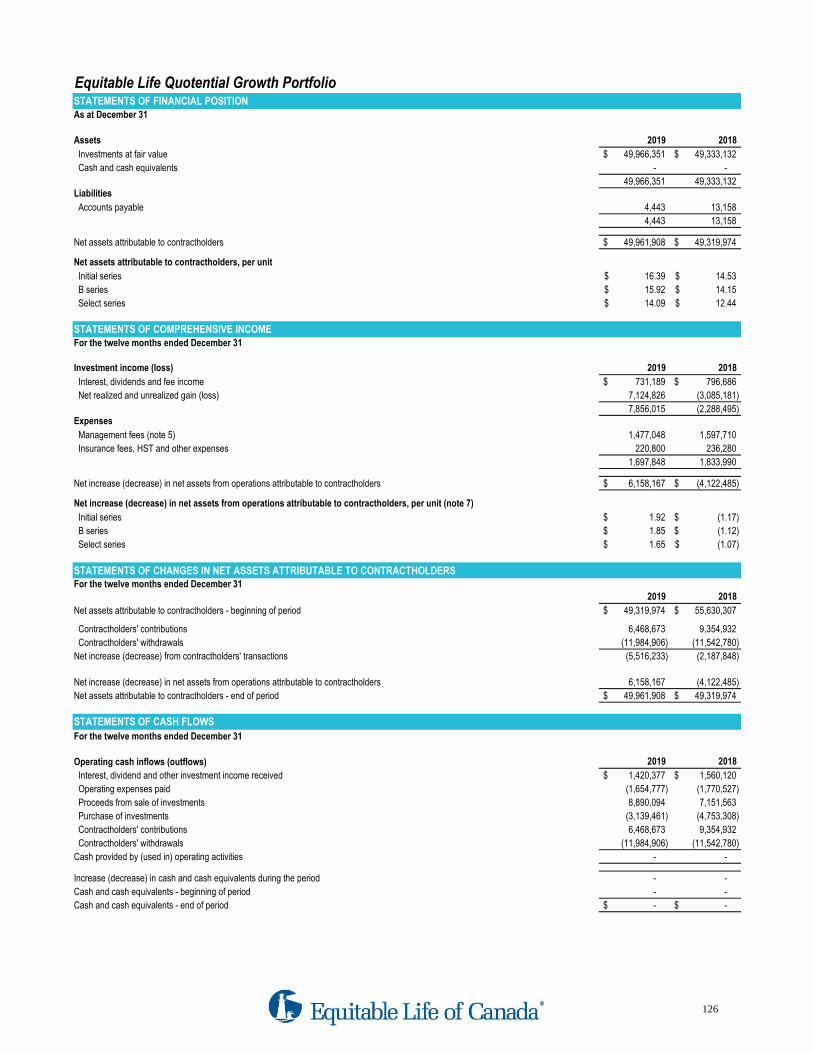
Equitable Life Quotential Growth PortfolioSTATEMENTS OF FINANCIAL POSITIONAs at December 31
Assets 2019 2018
Investments at fair value 49,966,351$ 49,333,132$
Cash and cash equivalents - -
49,966,351 49,333,132 Liabilities
Accounts payable 4,443 13,158
4,443 13,158
Net assets attributable to contractholders 49,961,908$ 49,319,974$
Net assets attributable to contractholders, per unit
Initial series 16.39$ 14.53$
B series 15.92$ 14.15$
Select series 14.09$ 12.44$
STATEMENTS OF COMPREHENSIVE INCOMEFor the twelve months ended December 31
Investment income (loss) 2019 2018
Interest, dividends and fee income 731,189$ 796,686$
Net realized and unrealized gain (loss) 7,124,826 (3,085,181)
7,856,015 (2,288,495) Expenses
Management fees (note 5) 1,477,048 1,597,710
Insurance fees, HST and other expenses 220,800 236,280
1,697,848 1,833,990
Net increase (decrease) in net assets from operations attributable to contractholders 6,158,167$ (4,122,485)$
Net increase (decrease) in net assets from operations attributable to contractholders, per unit (note 7)
Initial series 1.92$ (1.17)$
B series 1.85$ (1.12)$
Select series 1.65$ (1.07)$
STATEMENTS OF CHANGES IN NET ASSETS ATTRIBUTABLE TO CONTRACTHOLDERSFor the twelve months ended December 31
2019 2018
Net assets attributable to contractholders - beginning of period 49,319,974$ 55,630,307$
Contractholders' contributions 6,468,673 9,354,932
Contractholders' withdrawals (11,984,906) (11,542,780)
Net increase (decrease) from contractholders' transactions (5,516,233) (2,187,848)
Net increase (decrease) in net assets from operations attributable to contractholders 6,158,167 (4,122,485)
Net assets attributable to contractholders - end of period 49,961,908$ 49,319,974$
STATEMENTS OF CASH FLOWS
For the twelve months ended December 31
Operating cash inflows (outflows) 2019 2018
Interest, dividend and other investment income received 1,420,377$ 1,560,120$
Operating expenses paid (1,654,777) (1,770,527)
Proceeds from sale of investments 8,890,094 7,151,563
Purchase of investments (3,139,461) (4,753,308)
Contractholders' contributions 6,468,673 9,354,932
Contractholders' withdrawals (11,984,906) (11,542,780)
Cash provided by (used in) operating activities - -
Increase (decrease) in cash and cash equivalents during the period - -
Cash and cash equivalents - beginning of period - -
Cash and cash equivalents - end of period -$ -$
126
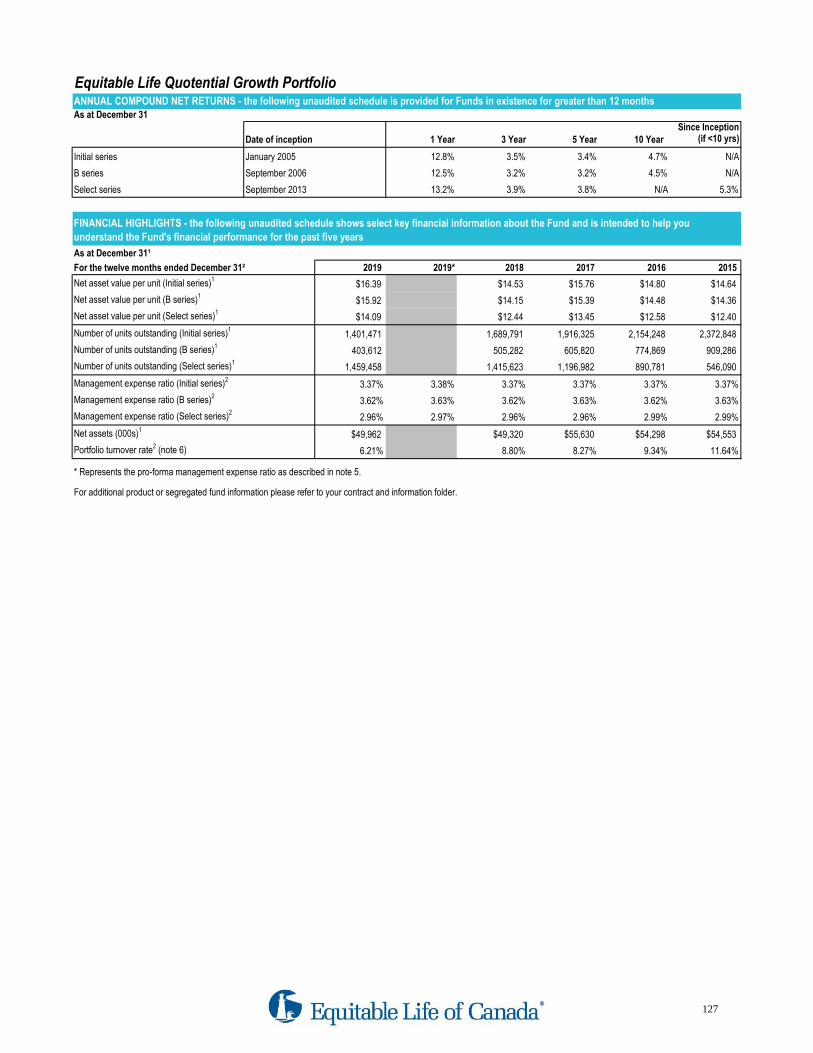
Equitable Life Quotential Growth PortfolioANNUAL COMPOUND NET RETURNS - the following unaudited schedule is provided for Funds in existence for greater than 12 monthsAs at December 31
Since Inception
Date of inception 1 Year 3 Year 5 Year 10 Year (if <10 yrs)
Initial series January 2005 12.8% 3.5% 3.4% 4.7% N/A
B series September 2006 12.5% 3.2% 3.2% 4.5% N/A
Select series September 2013 13.2% 3.9% 3.8% N/A 5.3%
As at December 31¹
For the twelve months ended December 31² 2019 2019* 2018 2017 2016 2015
Net asset value per unit (Initial series)1$16.39 $14.53 $15.76 $14.80 $14.64
Net asset value per unit (B series)1$15.92 $14.15 $15.39 $14.48 $14.36
Net asset value per unit (Select series)1$14.09 $12.44 $13.45 $12.58 $12.40
Number of units outstanding (Initial series)11,401,471 1,689,791 1,916,325 2,154,248 2,372,848
Number of units outstanding (B series)1403,612 505,282 605,820 774,869 909,286
Number of units outstanding (Select series)11,459,458 1,415,623 1,196,982 890,781 546,090
Management expense ratio (Initial series)23.37% 3.38% 3.37% 3.37% 3.37% 3.37%
Management expense ratio (B series)23.62% 3.63% 3.62% 3.63% 3.62% 3.63%
Management expense ratio (Select series)22.96% 2.97% 2.96% 2.96% 2.99% 2.99%
Net assets (000s)1$49,962 $49,320 $55,630 $54,298 $54,553
Portfolio turnover rate2 (note 6) 6.21% 8.80% 8.27% 9.34% 11.64%
* Represents the pro-forma management expense ratio as described in note 5.
For additional product or segregated fund information please refer to your contract and information folder.
FINANCIAL HIGHLIGHTS - the following unaudited schedule shows select key financial information about the Fund and is intended to help you
understand the Fund's financial performance for the past five years
127
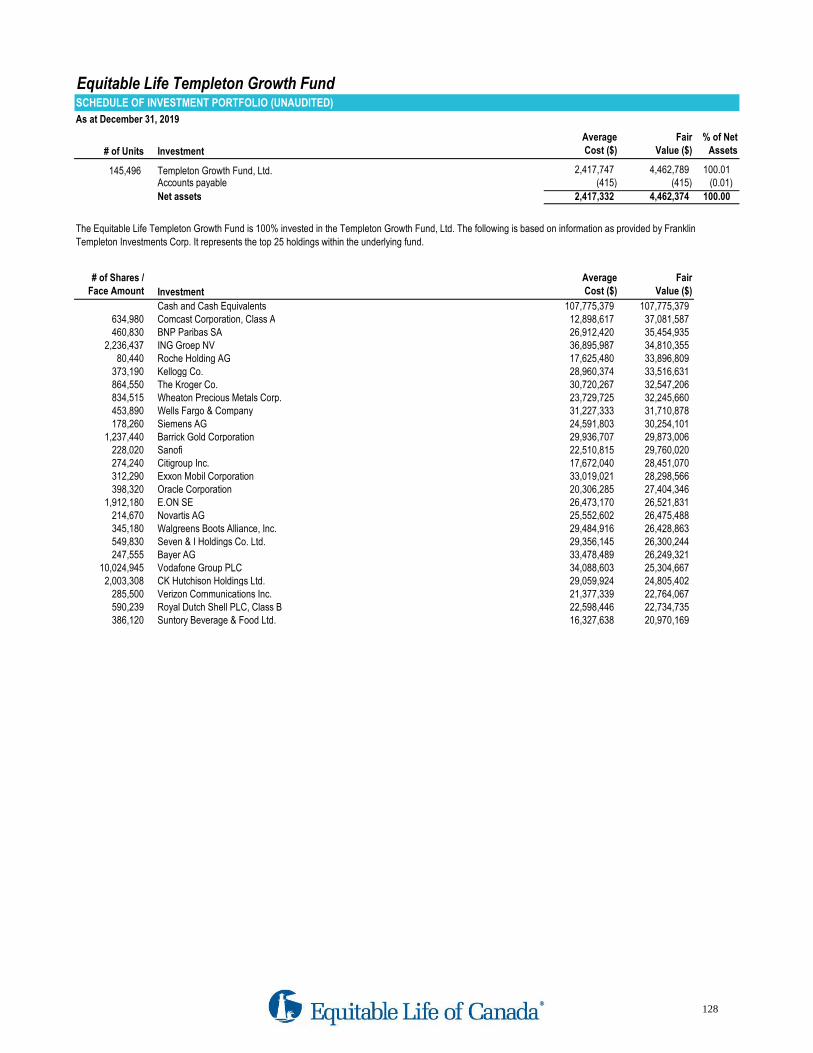
Equitable Life Templeton Growth FundSCHEDULE OF INVESTMENT PORTFOLIO (UNAUDITED)
As at December 31, 2019
# of Units Investment
Average
Cost ($)
Fair
Value ($)
% of Net
Assets
145,496 Templeton Growth Fund, Ltd. 2,417,747 4,462,789 100.01 Accounts payable (415) (415) (0.01)
Net assets 2,417,332 4,462,374 100.00
# of Shares /
Face Amount Investment
Average
Cost ($)
Fair
Value ($)
Cash and Cash Equivalents 107,775,379 107,775,379 634,980 Comcast Corporation, Class A 12,898,617 37,081,587 460,830 BNP Paribas SA 26,912,420 35,454,935
2,236,437 ING Groep NV 36,895,987 34,810,355 80,440 Roche Holding AG 17,625,480 33,896,809
373,190 Kellogg Co. 28,960,374 33,516,631 864,550 The Kroger Co. 30,720,267 32,547,206 834,515 Wheaton Precious Metals Corp. 23,729,725 32,245,660 453,890 Wells Fargo & Company 31,227,333 31,710,878 178,260 Siemens AG 24,591,803 30,254,101
1,237,440 Barrick Gold Corporation 29,936,707 29,873,006 228,020 Sanofi 22,510,815 29,760,020 274,240 Citigroup Inc. 17,672,040 28,451,070 312,290 Exxon Mobil Corporation 33,019,021 28,298,566 398,320 Oracle Corporation 20,306,285 27,404,346
1,912,180 E.ON SE 26,473,170 26,521,831 214,670 Novartis AG 25,552,602 26,475,488 345,180 Walgreens Boots Alliance, Inc. 29,484,916 26,428,863 549,830 Seven & I Holdings Co. Ltd. 29,356,145 26,300,244 247,555 Bayer AG 33,478,489 26,249,321
10,024,945 Vodafone Group PLC 34,088,603 25,304,667 2,003,308 CK Hutchison Holdings Ltd. 29,059,924 24,805,402
285,500 Verizon Communications Inc. 21,377,339 22,764,067 590,239 Royal Dutch Shell PLC, Class B 22,598,446 22,734,735 386,120 Suntory Beverage & Food Ltd. 16,327,638 20,970,169
The Equitable Life Templeton Growth Fund is 100% invested in the Templeton Growth Fund, Ltd. The following is based on information as provided by Franklin
Templeton Investments Corp. It represents the top 25 holdings within the underlying fund.
128
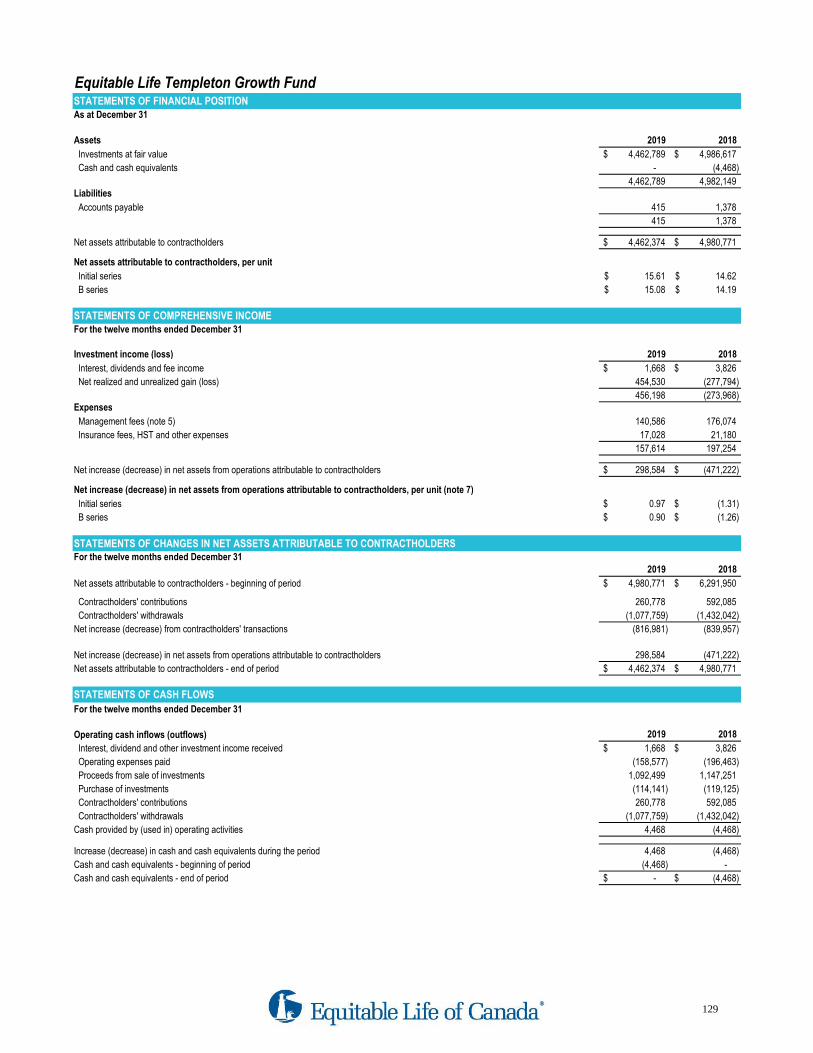
Equitable Life Templeton Growth FundSTATEMENTS OF FINANCIAL POSITIONAs at December 31
Assets 2019 2018
Investments at fair value 4,462,789$ 4,986,617$
Cash and cash equivalents - (4,468)
4,462,789 4,982,149 Liabilities
Accounts payable 415 1,378
415 1,378
Net assets attributable to contractholders 4,462,374$ 4,980,771$
Net assets attributable to contractholders, per unit
Initial series 15.61$ 14.62$
B series 15.08$ 14.19$
STATEMENTS OF COMPREHENSIVE INCOMEFor the twelve months ended December 31
Investment income (loss) 2019 2018
Interest, dividends and fee income 1,668$ 3,826$
Net realized and unrealized gain (loss) 454,530 (277,794)
456,198 (273,968) Expenses
Management fees (note 5) 140,586 176,074
Insurance fees, HST and other expenses 17,028 21,180
157,614 197,254
Net increase (decrease) in net assets from operations attributable to contractholders 298,584$ (471,222)$
Net increase (decrease) in net assets from operations attributable to contractholders, per unit (note 7)
Initial series 0.97$ (1.31)$
B series 0.90$ (1.26)$
STATEMENTS OF CHANGES IN NET ASSETS ATTRIBUTABLE TO CONTRACTHOLDERSFor the twelve months ended December 31
2019 2018
Net assets attributable to contractholders - beginning of period 4,980,771$ 6,291,950$
Contractholders' contributions 260,778 592,085
Contractholders' withdrawals (1,077,759) (1,432,042)
Net increase (decrease) from contractholders' transactions (816,981) (839,957)
Net increase (decrease) in net assets from operations attributable to contractholders 298,584 (471,222)
Net assets attributable to contractholders - end of period 4,462,374$ 4,980,771$
STATEMENTS OF CASH FLOWS
For the twelve months ended December 31
Operating cash inflows (outflows) 2019 2018
Interest, dividend and other investment income received 1,668$ 3,826$
Operating expenses paid (158,577) (196,463)
Proceeds from sale of investments 1,092,499 1,147,251
Purchase of investments (114,141) (119,125)
Contractholders' contributions 260,778 592,085
Contractholders' withdrawals (1,077,759) (1,432,042)
Cash provided by (used in) operating activities 4,468 (4,468)
Increase (decrease) in cash and cash equivalents during the period 4,468 (4,468)
Cash and cash equivalents - beginning of period (4,468) -
Cash and cash equivalents - end of period -$ (4,468)$
129
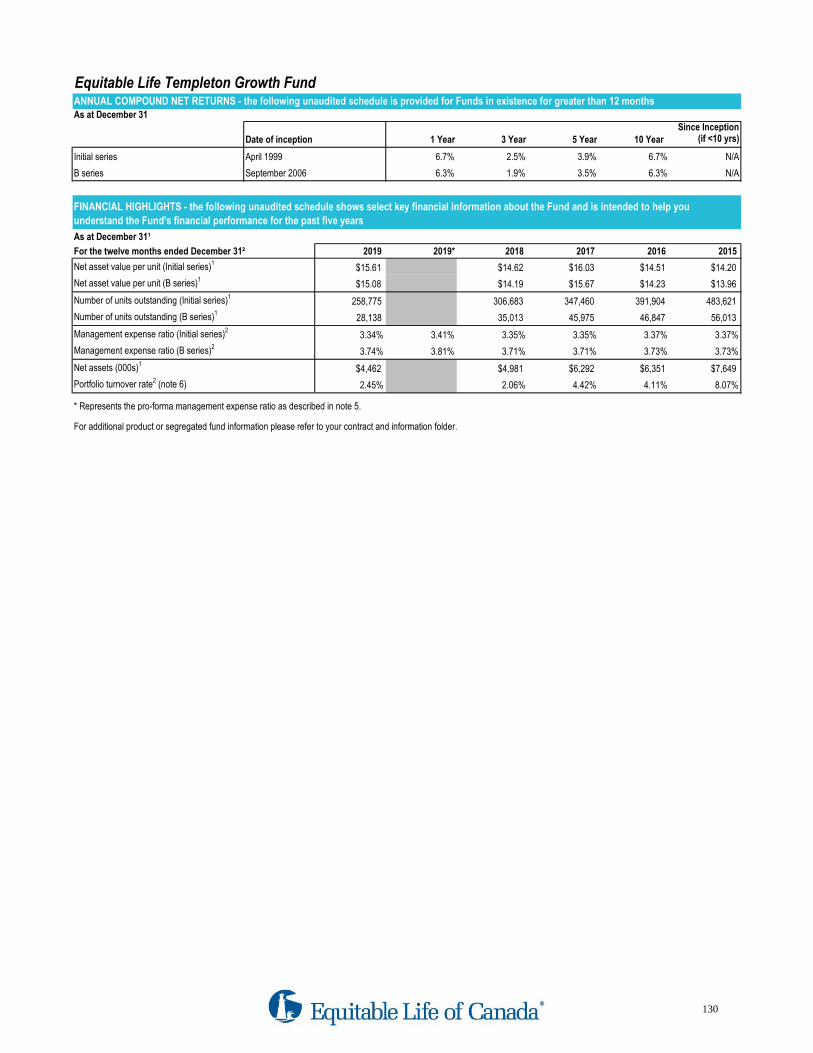
Equitable Life Templeton Growth FundANNUAL COMPOUND NET RETURNS - the following unaudited schedule is provided for Funds in existence for greater than 12 monthsAs at December 31
Since Inception
Date of inception 1 Year 3 Year 5 Year 10 Year (if <10 yrs)
Initial series April 1999 6.7% 2.5% 3.9% 6.7% N/A
B series September 2006 6.3% 1.9% 3.5% 6.3% N/A
As at December 31¹
For the twelve months ended December 31² 2019 2019* 2018 2017 2016 2015
Net asset value per unit (Initial series)1$15.61 $14.62 $16.03 $14.51 $14.20
Net asset value per unit (B series)1$15.08 $14.19 $15.67 $14.23 $13.96
Number of units outstanding (Initial series)1258,775 306,683 347,460 391,904 483,621
Number of units outstanding (B series)128,138 35,013 45,975 46,847 56,013
Management expense ratio (Initial series)23.34% 3.41% 3.35% 3.35% 3.37% 3.37%
Management expense ratio (B series)23.74% 3.81% 3.71% 3.71% 3.73% 3.73%
Net assets (000s)1$4,462 $4,981 $6,292 $6,351 $7,649
Portfolio turnover rate2 (note 6) 2.45% 2.06% 4.42% 4.11% 8.07%
* Represents the pro-forma management expense ratio as described in note 5.
For additional product or segregated fund information please refer to your contract and information folder.
FINANCIAL HIGHLIGHTS - the following unaudited schedule shows select key financial information about the Fund and is intended to help you
understand the Fund's financial performance for the past five years
130
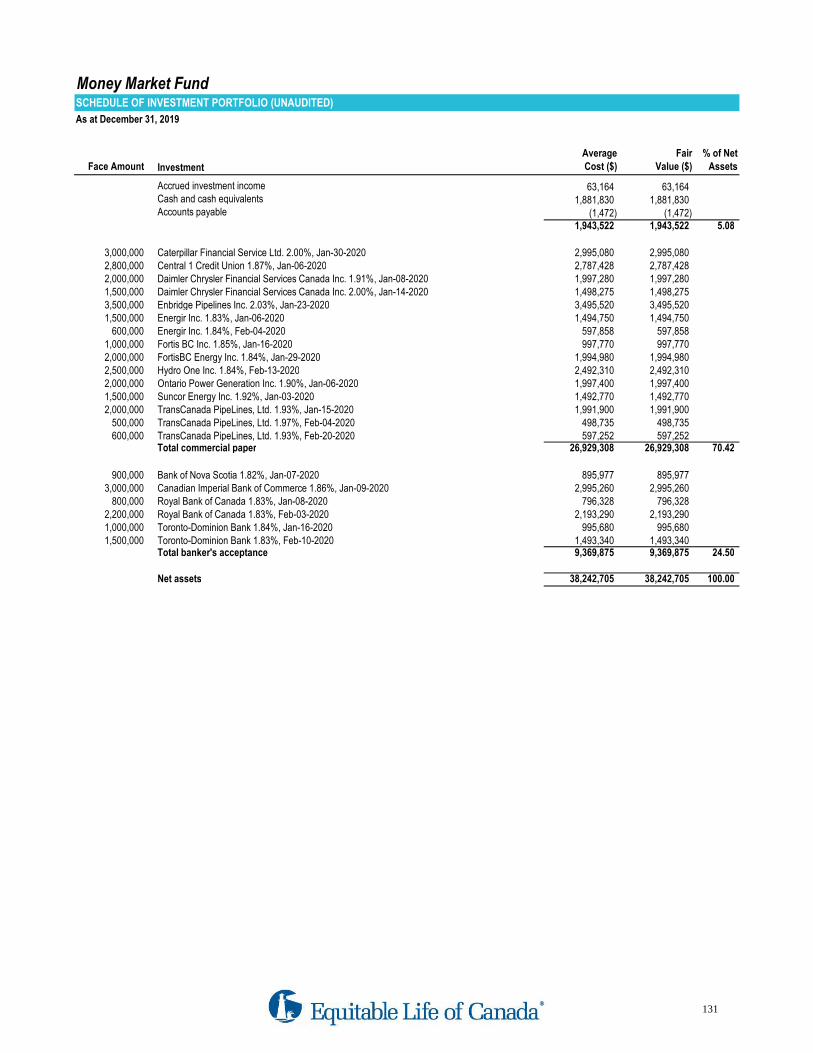
Money Market FundSCHEDULE OF INVESTMENT PORTFOLIO (UNAUDITED)
As at December 31, 2019
Face Amount Investment
Average
Cost ($)
Fair
Value ($)
% of Net
Assets
Accrued investment income 63,164 63,164 Cash and cash equivalents 1,881,830 1,881,830 Accounts payable (1,472) (1,472)
1,943,522 1,943,522 5.08
3,000,000 Caterpillar Financial Service Ltd. 2.00%, Jan-30-2020 2,995,080 2,995,080 2,800,000 Central 1 Credit Union 1.87%, Jan-06-2020 2,787,428 2,787,428 2,000,000 Daimler Chrysler Financial Services Canada Inc. 1.91%, Jan-08-2020 1,997,280 1,997,280 1,500,000 Daimler Chrysler Financial Services Canada Inc. 2.00%, Jan-14-2020 1,498,275 1,498,275 3,500,000 Enbridge Pipelines Inc. 2.03%, Jan-23-2020 3,495,520 3,495,520 1,500,000 Energir Inc. 1.83%, Jan-06-2020 1,494,750 1,494,750
600,000 Energir Inc. 1.84%, Feb-04-2020 597,858 597,858 1,000,000 Fortis BC Inc. 1.85%, Jan-16-2020 997,770 997,770 2,000,000 FortisBC Energy Inc. 1.84%, Jan-29-2020 1,994,980 1,994,980 2,500,000 Hydro One Inc. 1.84%, Feb-13-2020 2,492,310 2,492,310 2,000,000 Ontario Power Generation Inc. 1.90%, Jan-06-2020 1,997,400 1,997,400 1,500,000 Suncor Energy Inc. 1.92%, Jan-03-2020 1,492,770 1,492,770 2,000,000 TransCanada PipeLines, Ltd. 1.93%, Jan-15-2020 1,991,900 1,991,900
500,000 TransCanada PipeLines, Ltd. 1.97%, Feb-04-2020 498,735 498,735 600,000 TransCanada PipeLines, Ltd. 1.93%, Feb-20-2020 597,252 597,252
Total commercial paper 26,929,308 26,929,308 70.42
900,000 Bank of Nova Scotia 1.82%, Jan-07-2020 895,977 895,977 3,000,000 Canadian Imperial Bank of Commerce 1.86%, Jan-09-2020 2,995,260 2,995,260
800,000 Royal Bank of Canada 1.83%, Jan-08-2020 796,328 796,328 2,200,000 Royal Bank of Canada 1.83%, Feb-03-2020 2,193,290 2,193,290 1,000,000 Toronto-Dominion Bank 1.84%, Jan-16-2020 995,680 995,680 1,500,000 Toronto-Dominion Bank 1.83%, Feb-10-2020 1,493,340 1,493,340
Total banker's acceptance 9,369,875 9,369,875 24.50
Net assets 38,242,705 38,242,705 100.00
131
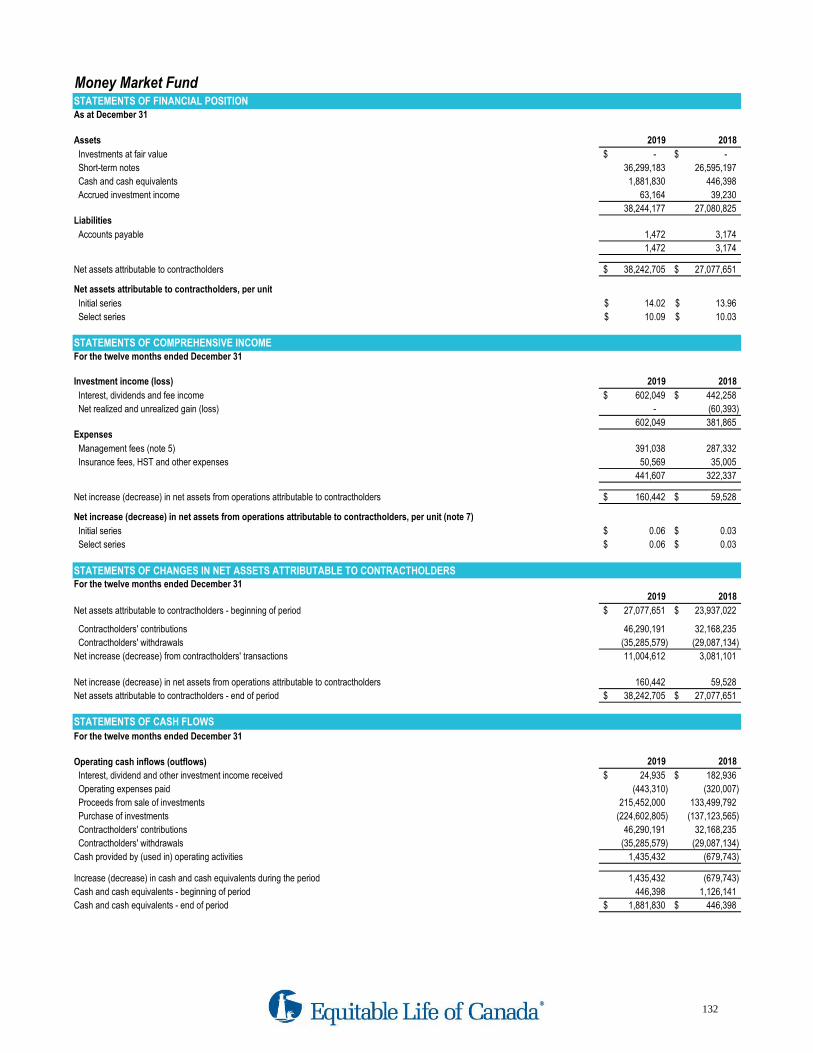
Money Market FundSTATEMENTS OF FINANCIAL POSITIONAs at December 31
Assets 2019 2018
Investments at fair value -$ -$
Short-term notes 36,299,183 26,595,197
Cash and cash equivalents 1,881,830 446,398
Accrued investment income 63,164 39,230
38,244,177 27,080,825 Liabilities
Accounts payable 1,472 3,174
1,472 3,174
Net assets attributable to contractholders 38,242,705$ 27,077,651$
Net assets attributable to contractholders, per unit
Initial series 14.02$ 13.96$
Select series 10.09$ 10.03$
STATEMENTS OF COMPREHENSIVE INCOMEFor the twelve months ended December 31
Investment income (loss) 2019 2018
Interest, dividends and fee income 602,049$ 442,258$
Net realized and unrealized gain (loss) - (60,393)
602,049 381,865 Expenses
Management fees (note 5) 391,038 287,332
Insurance fees, HST and other expenses 50,569 35,005
441,607 322,337
Net increase (decrease) in net assets from operations attributable to contractholders 160,442$ 59,528$
Net increase (decrease) in net assets from operations attributable to contractholders, per unit (note 7)
Initial series 0.06$ 0.03$
Select series 0.06$ 0.03$
STATEMENTS OF CHANGES IN NET ASSETS ATTRIBUTABLE TO CONTRACTHOLDERSFor the twelve months ended December 31
2019 2018
Net assets attributable to contractholders - beginning of period 27,077,651$ 23,937,022$
Contractholders' contributions 46,290,191 32,168,235
Contractholders' withdrawals (35,285,579) (29,087,134)
Net increase (decrease) from contractholders' transactions 11,004,612 3,081,101
Net increase (decrease) in net assets from operations attributable to contractholders 160,442 59,528
Net assets attributable to contractholders - end of period 38,242,705$ 27,077,651$
STATEMENTS OF CASH FLOWS
For the twelve months ended December 31
Operating cash inflows (outflows) 2019 2018
Interest, dividend and other investment income received 24,935$ 182,936$
Operating expenses paid (443,310) (320,007)
Proceeds from sale of investments 215,452,000 133,499,792
Purchase of investments (224,602,805) (137,123,565)
Contractholders' contributions 46,290,191 32,168,235
Contractholders' withdrawals (35,285,579) (29,087,134)
Cash provided by (used in) operating activities 1,435,432 (679,743)
Increase (decrease) in cash and cash equivalents during the period 1,435,432 (679,743)
Cash and cash equivalents - beginning of period 446,398 1,126,141
Cash and cash equivalents - end of period 1,881,830$ 446,398$
132
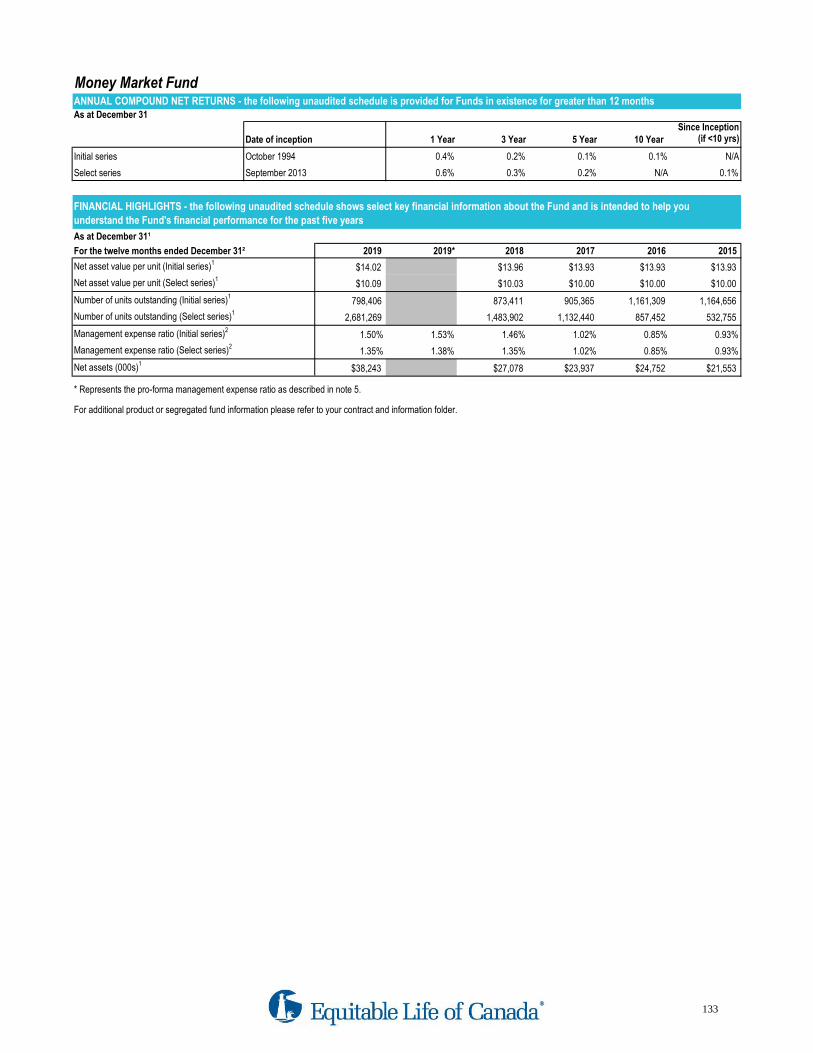
Money Market FundANNUAL COMPOUND NET RETURNS - the following unaudited schedule is provided for Funds in existence for greater than 12 monthsAs at December 31
Since Inception
Date of inception 1 Year 3 Year 5 Year 10 Year (if <10 yrs)
Initial series October 1994 0.4% 0.2% 0.1% 0.1% N/A
Select series September 2013 0.6% 0.3% 0.2% N/A 0.1%
As at December 31¹
For the twelve months ended December 31² 2019 2019* 2018 2017 2016 2015
Net asset value per unit (Initial series)1$14.02 $13.96 $13.93 $13.93 $13.93
Net asset value per unit (Select series)1$10.09 $10.03 $10.00 $10.00 $10.00
Number of units outstanding (Initial series)1798,406 873,411 905,365 1,161,309 1,164,656
Number of units outstanding (Select series)12,681,269 1,483,902 1,132,440 857,452 532,755
Management expense ratio (Initial series)21.50% 1.53% 1.46% 1.02% 0.85% 0.93%
Management expense ratio (Select series)21.35% 1.38% 1.35% 1.02% 0.85% 0.93%
Net assets (000s)1$38,243 $27,078 $23,937 $24,752 $21,553
* Represents the pro-forma management expense ratio as described in note 5.
For additional product or segregated fund information please refer to your contract and information folder.
FINANCIAL HIGHLIGHTS - the following unaudited schedule shows select key financial information about the Fund and is intended to help you
understand the Fund's financial performance for the past five years
133
NOTES TO FINANCIAL STATEMENTS
1. Corporate information
2. Summary of significant accounting policies
(a) Financial assets and financial liabilities
(b)
(c)
(d) Foreign currency translation
(e) Securities lending
The fair values of foreign currency denominated investments included in the statements of financial position are translated into Canadian dollars at rates of exchange in effect at
December 31. Gains (losses) arising from translation are included in the change in unrealized appreciation of investments.
Foreign currency denominated transactions, as well as cost amounts included in the schedule of investment portfolio, are translated into Canadian dollars at the rates of exchange
on the dates of the related transactions.
Security transactions are accounted for on the date the securities are purchased or sold. Interest income is accrued daily and recorded on the interest payment due date. Dividend
income is recorded on the ex-dividend date. The maturity dates of short-term investments and bonds shown in the schedule of investment portfolio are the contractual repricing dates
for these investments.
The net asset value per unit of the Funds is computed by dividing the net assets on the valuation date by the number of contractholder units outstanding on that day.
The Funds initially recognize financial assets and financial liabilities at fair value through profit or loss (FVTPL) on the trade date, which is the date on which the Funds become a
party to the contractual provisions of the instrument. Other financial assets and financial liabilities are recognized on the date on which they are originated.
- It is held within a business model whose objective is to hold assets to collect contractual cash flows; and
- Its contractual terms give rise on specified dates to cash flows that are solely payments of principal and interest (SPPI)
The Equitable Life Insurance Company of Canada is a mutual company domiciled in Canada and incorporated under the Insurance Companies Act (Canada). Together with its
subsidiaries (collectively, "the Company"), it operates in the life insurance industry. Operations cover the development, marketing, and servicing of life, health and annuity products to
individual and group customers as well as asset management services to individual customers including segregated funds (the "Funds"). The head office of the Company is located at
One Westmount Road North, Waterloo, Ontario, Canada.
These financial statements were approved by the Company's Board of Directors on February 11, 2020.
The Funds classified financial assets into the following categories:
- Financial assets held at FVTPL: investments at fair value
- Financial assets at amortized cost: cash and cash equivalents
The Funds derecognize a financial liability when the contractual obligations are discharged or cancelled, or expire. On derecognition of a financial liability, the difference between the
carrying amount extinguished and the consideration paid is recognized in profit or loss.
On initial recognition, the Funds classify financial assets as measured at amortized cost or FVTPL. A financial asset is measured at amortized cost if it meets both the following
conditions and is not designated as FVTPL:
Certain Funds may enter into securities lending transactions to generate additional income. These transactions will be used in conjunction with other investment strategies in order to
seek enhanced returns.
The Funds designated all the investments as at FVTPL on initial recognition as these securities are managed on a fair value basis in accordance with the investment strategy.
Financial assets as FVTPL are subsequently measured at fair value. Net gains and losses, including any interest or dividend income and expense, are recognized in profit or loss in
investment income (loss) in the statement of comprehensive income.
‘Fair value’ is the price that would be received to sell an asset or paid to transfer a liability in an orderly transaction between market participants at the measurement date in the
principal, or in its absence, the most advantageous market to which the Fund has access to at that date. The fair value of a liability reflects its non-performance risk.
When available, the Funds measure the fair value of an instrument using the quoted price in an active market for that instrument. A market is regarded as active if transactions for the
asset or liability take place with sufficient frequency and volume to provide pricing information on an ongoing basis.
The Funds derecognize a financial asset when the contractual rights to the cash flows from the asset expire, or the rights to receive the contractual cash flows in a transaction are
transferred in which substantially all of the risks and rewards of ownership of the financial asset are transferred or in which the Funds neither transfer nor retains substantially all of
the risks and rewards of ownership and does not retain control of the financial asset. On derecognition of a financial asset, the difference between the carrying amount of the asset
and the consideration received is recognized in profit or loss.
Financial liabilities are classified as measured at amortized cost or FVTPL. A financial liability is classified as at FVTPL if it is classified as held-for-trading, it is a derivative or it is
designated as such on initial recognition. All of the Funds’ financial liabilities are classified at amortized cost.
134
These financial statements have been prepared in accordance with International Financial Reporting Standards (IFRS). These financial statements are presented in Canadian dollars,
which is the Company's functional currency.
The securities on loan are included in the schedules of investment portfolio and are included in the total value on the statements of financial position at fair value. Where applicable,
income earned from securities lending is included in "Interest, dividends and fee income" in the statements of comprehensive income.
NOTES TO FINANCIAL STATEMENTS (CONTINUED)
3. Investments – determination of fair values and fair value hierarchy
The table below sets out fair value measurements using the fair value hierarchy.
(thousands of dollars)
December 31, 2019 Level 1 Level 2 Level 3 Total
Cash and short-term notes $ 5,920 $ 36,299 - $ 42,219
Bonds - 41,357 - 41,357
Mutual/pooled units 1,240,855 - - 1,240,855
$ 1,246,775 $ 77,656 - $ 1,324,431
December 31, 2018 Level 1 Level 2 Level 3 Total
Cash and short-term notes $ 3,819 $ 26,595 - $ 30,414
Bonds - 36,060 - 36,060
Mutual/pooled units 1,043,883 - - 1,043,883
$ 1,047,702 $ 62,655 - $ 1,110,357
Level 1 – valued using quoted prices in active markets for identical assets
Level 2 – valued by reference to valuation techniques using observable inputs other than quoted prices included within Level 1
Level 3 – valued by reference to valuation techniques using inputs that are not based on observable market data
4. Financial instruments - associated risks
(i) Market price risk
(ii)
(iii)
(iv)
(v)
5. Management fees and expenses
The management expense ratios (“MER”) for the year are the percentages obtained by dividing:
(i)
(ii)
Foreign currency risk is the risk that fair value or future cash flows of a financial instrument will fluctuate because of changes in foreign exchange rates. The Fund invests in financial
instruments and enters into transactions denominated in various foreign currencies, other than the Fund’s measurement currency. Consequently, the Fund is exposed to risks that
the exchange rate of the various currencies may change in a manner that has an adverse affect on the value of the portion of the Fund’s assets denominated in currencies other
than the Canadian dollar.
Interest rate risk refers to the adverse consequences of interest rate changes on the Fund’s cash flows, financial position and income. Interest rate changes have an impact on the
assets in the Fund. The Fund uses investment diversification to manage this risk.
Liquidity risk is the risk that the Fund will encounter difficulty in meeting obligations as they fall due. The Fund maintains an investment policy, which contains asset mix guidelines
which help to ensure the Fund is able to liquidate investments to meet its obligations.
Categorization within the hierarchy has been determined on the basis of the lowest level input that is significant to the fair value measurement of the relevant assets as follows:
Credit risk is the risk of loss in the event the counterparty to a transaction defaults or otherwise fails to perform under the terms of a contract. The Fund uses investment
diversification to manage this risk. In addition, securities lending exposes the Funds to credit risk.
Market price risk is the risk that a value of an instrument will fluctuate as a result of changes in market prices, whether caused by factors specific to an individual investment, its issuer
or all factors affecting all instruments traded in the market. As all of the Fund’s financial instruments are carried at fair value with fair value changes recognized in the statement of
comprehensive income, all changes in market conditions will directly affect the increase (decrease) in net assets from operations attributable to contractholders. Market price risk is
managed through construction of a diversified portfolio of instruments traded on various markets and across various industries.
Interest rate risk
Credit risk
Liquidity risk
the amount of the average net asset value of the Fund for the financial year and multiplying by 100.
Foreign currency risk
Each Fund pays an annual management fee to the Company, calculated as a percentage of the Fund’s net asset value and deducted daily.
The Company, and the underlying fund managers as applicable, provide all management services required by the Funds, including investment management and advisory services,
portfolio administration, marketing and distribution services.
the aggregate of all fees, charges and other expenses paid or payable by the Fund during or in respect of the financial year less absorbed operating expenses and waived
management fees; by,
135
NOTES TO FINANCIAL STATEMENTS (CONTINUED)
6. Portfolio turnover rate
7. Net increase (decrease) in net assets from operations attributable to contractholders, per unit
8. Income taxes
9. Product availability
10. Name changes and fund changes
Former Fund Name New Fund Name
Equitable Life Canadian Equity Value Fund Equitable Life Low Volatility Canadian Equity Fund
Equitable Life Dynamic Far East Value Fund Equitable Life Dynamic Asia Pacific Equity Fund
Equitable Life Mackenzie Canadian All Cap Balanced Fund Equitable Life Mackenzie Canadian Growth Balanced Fund
Equitable Life Mackenzie Corporate Bond Fund Equitable Life Mackenzie Unconstrained Fixed Income Fund
Equitable Life Templeton Global Bond Fund Equitable Life Invesco Global Bond Fund
Equitable Life Trimark Diversified Yield Fund Equitable Life Invesco Diversified Yield Fund
Equitable Life Trimark Europlus Fund Equitable Life Invesco Europlus Fund
Equitable Life Trimark Fund Equitable Life Invesco Global Companies Fund
Equitable Life Trimark Global Balanced Fund Equitable Life Invesco Global Balanced Fund
Equitable Life Trimark International Companies Fund Equitable Life Invesco International Companies Fund
All fees, charges and other expenses above exclude commission and brokerage fees that are paid or payable directly by the Fund on the purchase and sale of portfolio securities and
income taxes paid or payable by the Fund to which the Fund is subject. The actual management expense ratios charged to the Fund are comprised of management fees, insurance fees,
operating expenses, incidental administrative fees allocated by the underlying funds and taxes of any kind (other than income taxes).
The pro-forma management expense ratio is calculated in the same manner as the actual management expense ratio described above, but including management fees waived and
certain operating expenses absorbed by the Company. This waiving or absorption of fees and expenses results in a lower actual MER for the Fund than would otherwise occur. Currently,
the Company waives certain management fees and absorbs certain operating expenses including transaction, custodial, audit and legal fees. The waiver of management fees and
absorption of operating expenses shall continue at the Company’s discretion and may be terminated by the Company at any time.
The average net asset value of the Fund is calculated by averaging the net asset value of the Fund on each valuation date.
In April 2019, the names of the following Funds were changed:
The Funds are related segregated fund trusts within the meaning of the Income Tax Act (Canada) and, accordingly, the income of the Funds is deemed payable to the contractholders
under the segregated fund policies. The Funds are not liable to pay income taxes and no provision for income taxes has been made in these financial statements.
The Fund's portfolio turnover rate indicates how actively the Fund's portfolio advisor manages its portfolio investments. A portfolio turnover rate of 100% is equivalent to the Fund buying
and selling all of the securities in its portfolio once in the course of the year. The higher a Fund's portfolio turnover rate in a year, the greater the trading costs payable by the Fund in the
year, and the greater the chance of an investor receiving taxable capital gains or losses in the year. There is not necessarily a relationship between a high turnover rate and the
performance of a Fund. Portfolio turnover rates will exceed 100% in periods where a series of units of a Fund is replaced by another series.
In April 2019, the underlying funds for the following Funds were changed:
Initial series includes units held in the Pivotal Solutions, Pivotal Solutions DSC, and Personal Investment Portfolio products. These products are no longer available for new contracts.
B series includes units held in the Pivotal Solutions II product. This product is no longer available for new contracts.
Select series includes units held in the Pivotal Select product.
The Fund calculates the net increase (decrease) in net assets from operations attributable to contractholders, per unit by taking the net increase (decrease) in net assets from operations
attributable to contractholders (by series) divided by the weighted average number of units outstanding.
Fund Name Former Underlying Fund New Underlying Fund
Equitable Life Mackenzie Unconstrained Fixed Income Fund Mackenzie Corporate Bond Fund Mackenzie Unconstrained Fixed Income Fund
Equitable Life Invesco Global Bond Fund Templeton Global Bond Fund Invesco Global Bond Fund
136

1058(2019/12/31)
Works for me.®
Canadians have turned to Equitable Life since 1920 to protect what matters most. We work with independent advisors across Canada to offer individual insurance, savings and retirement and group benefits solutions to meet your needs.
Equitable Life is not your typical financial services company. We have the knowledge, experience and ability to find solutions that work for you. We’re friendly, caring and interested in helping. And we’re owned by our participating policyholders, not shareholders, allowing us to focus on your needs and providing you with personalized service, financial protection and peace of mind.
® denotes a trademark of The Equitable Life Insurance Company of Canada.
One Westmount Road North, Waterloo, Ontario N2J 4C7 1 800 886-5210 www.equitable.ca