Embed Size (px)
Citation preview

HALF-YEAR REPORT
201820182018

KEY FIGURES
Key Figures as of June 30, 2018 (IFRS)
in € millions (unless otherwise stated) HY1 2018 HY1 2017 +/– as %
+/– as % acc 1 Q2 2018 Q2 2017 +/– as %
+/– as % acc 1
Revenue 392.3 413.3 –5 1 205.7 207.4 –1 4
Digital Business Platform (DBP) 202.9 210.3 –4 3 107.1 104.4 3 7
of which DBP not including Cloud & IoT 191.2 203.9 –6 0 101.8 100.9 1 6
of which Cloud & IoT 11.6 6.4 81 88 5.3 3.5 52 56
Adabas & Natural (A&N) 97.3 100.3 –3 4 52.6 52.3 0 7
Licenses 87.6 92.2 –5 1 53.5 47.3 13 17
Maintenance 204.2 214.0 –5 2 101.7 107.0 –5 1
SaaS 8.1 4.1 98 107 4.3 2.2 97 103
ARR 2 DBP including Cloud & IoT 287.5 262.8
ARR 2 Cloud & IoT 24.8 12.2
EBITA (non-IFRS) 112.7 117.6 –4 61.5 61.3 0
as % of revenue 28.7 28.4 29.9 29.5
DBP segment earnings 57.5 60.6 –5 30.8 30.6 1
Segment margin as % 28.3 28.8 28.8 29.3
A&N segment earnings 68.7 67.4 2 37.5 36.4 3
Segment margin as % 70.6 67.2 71.3 69.6
Net income (non-IFRS) 78.7 77.5 1 42.2 40.2 5
Earnings per share (non-IFRS) 3 1.06 1.03 3 0.57 0.54 6
Net cash provided by operating activities 95.1 108.4 –12 33.5 46.6 –28
CapEx 4 6.5 22.6 5.0 4.1
Free cash flow 88.6 85.8 3 28.5 42.5 –33
Balance sheet June 30,
2018Dec. 31,
2017
Total assets 1,897.3 1,907.5 –1
Cash and cash equivalents 388.0 365.8 6
Net liquid assets/(net debt) in acc. with IFRS 72.7 55.2 32
Employees (full-time equivalents) 4,655 4,596 1
¹ acc = At constant currency 2 Annual recurring revenue 3 Based on weighted average shares outstanding (basic) Q2 2018: 74.0 mn/Q2 2017: 74.8 mn/HY1 2018: 74.0 mn/HY1 2017: 75.3 mn4 Cash flow from investing activities adjusted for acquisitions and investments in debt instruments
In some cases, rounding could mean that values in this report do not add up to the exact sum given or percentages do not equal the values presented.
SOFTWARE AG | 2018 HALF-YEAR REPORT
2

TABLE OF CONTENTS
HIGHLIGHTS 4
SOFTWARE AG’S SHARE 6
CONSOLIDATED INTERIM MANAGEMENT REPORT 10Fundamental Aspects of the Group 10Group Business Summary 11Financial Performance 13Financial Position 16Assets 16Employees 18Opportunity and Risk Report 19Outlook 19
CONSOLIDATED INTERIM FINANCIAL STATEMENTS 20Consolidated Income Statement 20Statement of Comprehensive Income 21Consolidated Balance Sheet 22Consolidated Statement of Cash Flows 24Consolidated Statement of Changes in Equity 26
NOTES TO THE CONSOLIDATED INTERIM FINANCIAL STATEMENTS 28General 28Notes to the Consolidated Balance Sheet 35Other Disclosures 36
ADDITIONAL INFORMATION 43Financial Calendar/Publication Credits 43
For more information about Software AG, please refer to the Image and Strategy Brochure at www.Software.AG/AR.
Preliminary RemarksThis half-year report contains forward-looking statements. They are based on plans, estimates and projections that are currently available to Software AG’s Management Board. Forward-looking statements therefore apply only to the date on which they were made. Software AG accepts no obligation to develop forward-looking state-ments based on new information or future events. Forward- looking statements by nature contain factors of risk and uncertainty. A number of important factors can contribute to actual results deviating considerably from forward-looking statements. All of the information in this
report that does not represent forward-looking statements relates to the situation on June 30, 2018, unless otherwise stated. Software AG’s segment reporting is prepared in accordance with IFRS 8 (Segment Reporting). Segmenta-tion is by business line and corresponds to the Group’s internal controlling and reporting lines: Accordingly, Software AG reports on the following business lines: Digital Business Platform (DBP, including the webMethods, ARIS, Alfabet, Apama, Cumulocity and Terracotta product families), Adabas & Natural (A&N, including the Adabas and Natural product families) and Consulting.
3
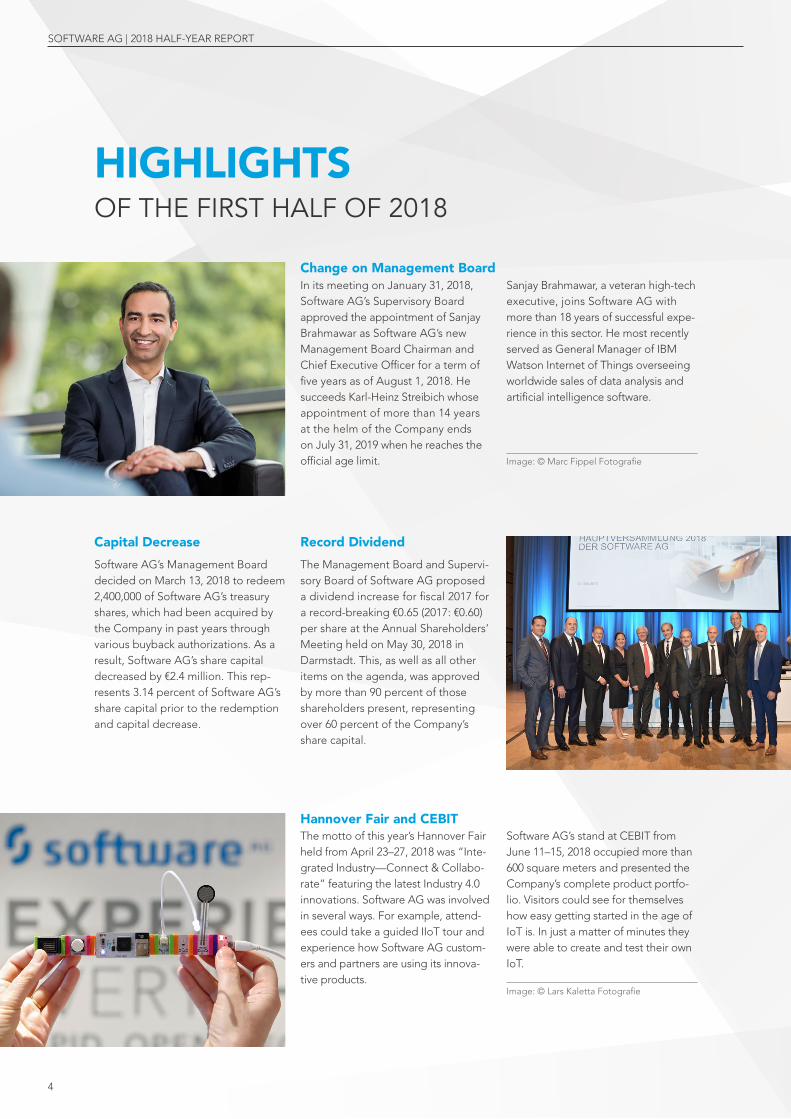
Change on Management Board In its meeting on January 31, 2018, Software AG’s Supervisory Board approved the appointment of Sanjay Brahmawar as Software AG’s new Management Board Chairman and Chief Executive Officer for a term of five years as of August 1, 2018. He succeeds Karl-Heinz Streibich whose appointment of more than 14 years at the helm of the Company ends on July 31, 2019 when he reaches the official age limit.
Sanjay Brahmawar, a veteran high-tech executive, joins Software AG with more than 18 years of successful expe-rience in this sector. He most recently served as General Manager of IBM Watson Internet of Things overseeing worldwide sales of data analysis and artificial intelligence software.
Image: © Marc Fippel Fotografie
HIGHLIGHTS OF THE FIRST HALF OF 2018
Capital Decrease
Software AG’s Management Board decided on March 13, 2018 to redeem 2,400,000 of Software AG’s treasury shares, which had been acquired by the Company in past years through various buyback authorizations. As a result, Software AG’s share capital decreased by €2.4 million. This rep-resents 3.14 percent of Software AG’s share capital prior to the redemption and capital decrease.
Hannover Fair and CEBITThe motto of this year’s Hannover Fair held from April 23–27, 2018 was “Inte-grated Industry—Connect & Collabo-rate” featuring the latest Industry 4.0 innovations. Software AG was involved in several ways. For example, attend-ees could take a guided IIoT tour and experience how Software AG custom-ers and partners are using its innova-tive products.
Software AG’s stand at CEBIT from June 11–15, 2018 occupied more than 600 square meters and presented the Company’s complete product portfo-lio. Visitors could see for themselves how easy getting started in the age of IoT is. In just a matter of minutes they were able to create and test their own IoT.
Image: © Lars Kaletta Fotografie
Record Dividend
The Management Board and Supervi-sory Board of Software AG proposed a dividend increase for fiscal 2017 for a record-breaking €0.65 (2017: €0.60) per share at the Annual Shareholders’ Meeting held on May 30, 2018 in Darmstadt. This, as well as all other items on the agenda, was approved by more than 90 percent of those shareholders present, representing over 60 percent of the Company’s share capital.
SOFTWARE AG | 2018 HALF-YEAR REPORT
4

Acquisition of TrendMiner
Software AG’s acquisition of Trend-Miner expands its leading position in the rapidly growing IoT market. TrendMiner is an intuitive Web-based analytics platform that enables flexi-ble visualization of industrial pro-cesses and measurement data. Trend-Miner complements Software AG’s Cumulocity IoT portfolio and allows companies to quickly and easily recognize patterns and trends in their process data, identify production
irregularities, and make necessary process adjustments early—without the help of IT specialists or data scientists. TrendMiner was founded in 2008 as a spin-off of the K.U. Leuven University in Belgium. Headquartered in Belgium, it has sales offices in the Netherlands, Germany, Spain and the USA.
Image: © Lars Kaletta Fotografie
IoT Innovation Tour
Software AG’s IoT Innovation Tour made stops in Stuttgart, Munich and Hamburg in May. Customers from manufacturing, logistics and com-merce showcased their success stories with real-life IoT solutions and demonstrated to attendees how to implement them. The tour will visit three more venues in September 2018: Dusseldorf, Germany on Sep-tember 13, Vienna, Austria on Sep-tember 19 and Zurich, Switzerland on September 26.
DBP Cloud & IoT
IoT mega trend: Software AG started reporting on the DBP Cloud & IoT business separately at the beginning of 2018.This will provide a metric for the momentum of the cloud and IoT business. Based on strong business performance in the first quarter and expected deals in 2018, the Manage-ment Board raised its forecast on April 13 for fiscal 2018 Cloud & IoT revenue growth from between 70 and 100 percent to between 100 and 135 percent.
New Partnerships
Software AG announced new strate-gic partnerships and signed new customers in the first half of 2018. Its partnership with GFT aims to support medium-sized companies in defining and implementing IoT strategies. In cooperation with Bilfinger SE, Software AG will help companies in the process industry significantly reduce risk, value creation time and the cost of implementing IoT.
Software AG also began collaborating with A1 Digital, Telefónica and CirrusLabs this year. Furthermore, Trackerando, POST Luxembourg, Sensor-Technik Wiedemann and Ooredoo started using Software AG’s Cumulocity IoT. And, the British Ministry of Defence now employs Software AG’s webMethods API plat-form.
5
HIGHLIGHTS

January February March April May June80
100
120
SOFTWARE AG’S SHARE
FIRST HALF OF 2018Political Uncertainty Curbed Stock Market OptimismGeopolitical events dominated stock market sentiment this half-year. The increasingly protectionist attitude of the U.S. administration as well as Italy’s election outcome and the subsequent lengthy formation of government caused economic unpredictability. Furthermore, Brexit negotia-tions and the economic consequences of a “hard Brexit” were in the spotlight again this half-year. In addition to these events, the challenges associated with the refugee crisis in Europe continued to fuel insecurities and concern over a growing divide between EU nations.
Software AG operates in more than 70 countries and generates the majority of its revenue in core European countries and the USA. Changing political landscapes, exchange rate fluctuations and other activities in these regions can influence business at national levels. Software AG’s customers are diversified across many industries. Its software is firmly anchored in customers’ systems. And a large percentage of sales are recurring maintenance revenues. Thanks to these factors, Software AG’s business model and share price are rela-tively resistant to macroeconomic effects. Changes in
exchange rates are reflected in reported revenues (currency translation effects). But due to Software AG’s relatively high percentage of local costs, they only have a minimal impact on earnings (natural hedging).
Software AG’s Share Price PerformanceWhile the DAX remained virtually unaffected from political uncertainties last year, investors saw a sluggish climate in the German benchmark index at the beginning of 2018. Ultimately, the DAX closed out the period with a loss of just under 5 percent. Software AG’s share price started off the year at €47.00 and peaked on January 19 at €48.69, which is the highest it has been in more than 15 years. Investors’ profit-taking tendencies continued in light of the price increase.
Software AG published its preliminary results for the first quarter of 2018 in an ad hoc release on April 13, 2018 due its raised outlook for the year in the Cloud & IoT business. This correction did not have a lasting impact on the reserved mood of investors though. In general, tech shares were seen more critically due to their high valua-tions. And, investors became more cautious—despite growth forecasts for the whole sector and Software AG. That led to continued profit takes and corrections at the end of the half-year period. Software AG’s share still
Software AG Share Price Performance Compared to DAX and TecDAX (indexed)
Software AG DAX TecDAX
Source: Inventis service
SOFTWARE AG | 2018 HALF-YEAR REPORT
6
ended the first six months of the current fiscal year at €39.91, reflecting a gain of more than 4 percent year-on-year. Software AG exceeded the stock market’s liquidity requirement in the first half of 2018 with an XETRA aver-age daily trading volume of 278,897 and therefore did not need a designated sponsor for ensuring smooth trading transactions. Software AG placed 12th in the Deutsche Börse AG’s ranking of TecDAX companies based on mar-ket capitalization as of June 2018.
The Deutsche Börse will restructure the MDAX and SDAX as of September 20, 2018. The change will allow high-tech TecDax companies—such as Software AG—to also be listed in the MDAX or SDAX. Software AG currently expects to be added to the MDAX.
Key Figures
2018 2017
Half-year closing price in € 39.91 38.35
Half-year high in € 48.69 43.14
Half-year low in € 38.57 31.63
Total number of shares outstanding 74,000,000 76,400,000
Market capitalization at end of first half year in € millions 2,953.34 2,929.94
Free float as % 66.27% 64.06%
Based on XETRA closing prices on June 29, 2018
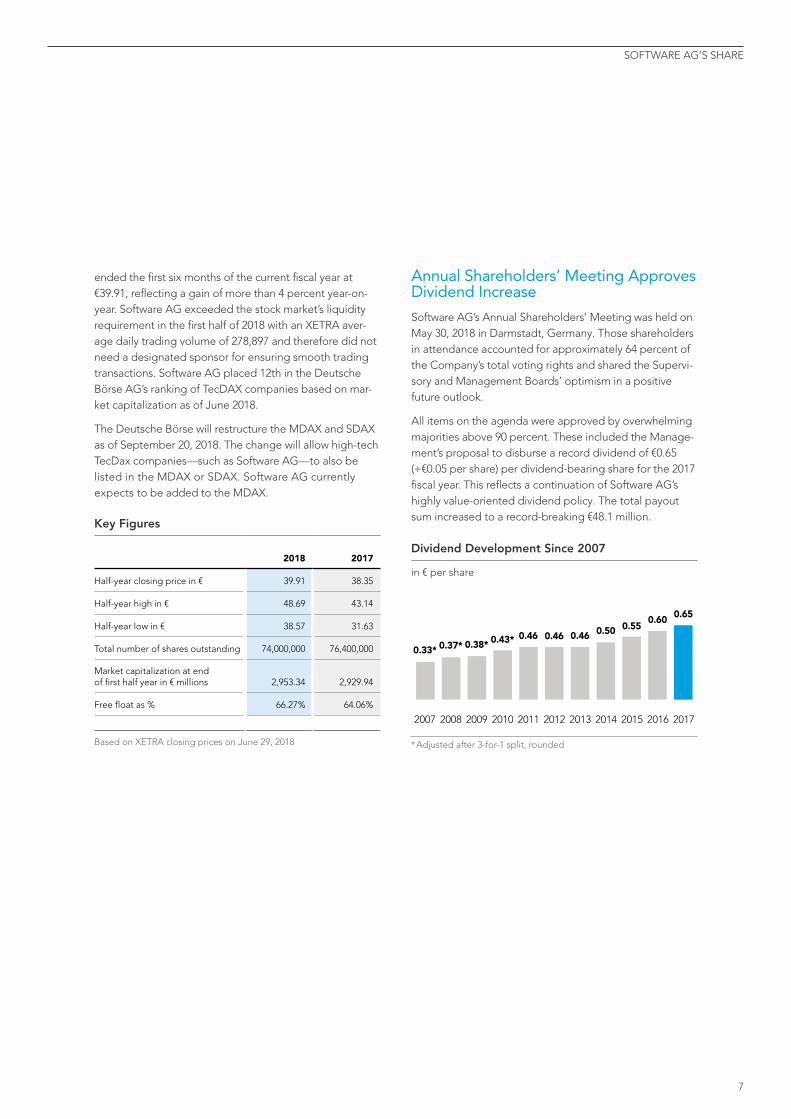
2007
0.33* 0.37* 0.38* 0.43* 0.46 0.46 0.46 0.50 0.550.650.60
2008 2009 2010 2011 2012 2013 2014 2015 20172016
Dividend Development Since 2007
* Adjusted after 3-for-1 split, rounded
in € per share
Annual Shareholders’ Meeting Approves Dividend IncreaseSoftware AG’s Annual Shareholders’ Meeting was held on May 30, 2018 in Darmstadt, Germany. Those shareholders in attendance accounted for approximately 64 percent of the Company’s total voting rights and shared the Supervi-sory and Management Boards’ optimism in a positive future outlook.
All items on the agenda were approved by overwhelming majorities above 90 percent. These included the Manage-ment’s proposal to disburse a record dividend of €0.65 (+€0.05 per share) per dividend-bearing share for the 2017 fiscal year. This reflects a continuation of Software AG’s highly value-oriented dividend policy. The total payout sum increased to a record-breaking €48.1 million.
7
SOFTWARE AG’S SHARE
High Degree of Attention from Capital MarketIn addition to engaging in an ongoing dialog with existing shareholders, active investor relations work also involves adapting the base in targeted ways. Addressing specific potential investors is a challenging aspect of investor rela-tions work and requires the precise analysis of financial markets.
Numerous meetings were conducted with investors and analysts during the first half of 2018. Software AG partici-pated in a total of six capital market conferences in Ger-many and abroad.
In addition, roadshows and analyst visits in Germany, the U.K. and Ireland, France and the U.S. were also an important medium for engaging the investor community. Software AG continued to enjoy a high degree of atten-tion from financial analysts in the first half of the current fiscal year. This was reflected in the large number of well-known securities brokerage firms in Germany and abroad tracking Software AG’s share. Software AG hosted its annual Capital Market Day, focusing on the new DBP Cloud & IoT business, on March 12, 2018 in Darmstadt. Numerous investors and financial analysts from Germany, the U.K., France and Switzerland were invited to corporate headquarters to learn about Software AG’s strategy in this young market. The high degree of interest among inves-tors and financial analysts was also reflected in the number of attendees that participated in Software AG’s investor relations program at this year’s Hannover Fair and CeBIT.
Analysts from 22 investment banks tracked Software AG and regularly published their investment recommenda-tions in the first half of 2018. Software AG’s stock received a positive or neutral rating from 15 of them at the end of the first six months of 2018. Analysts’ overall average price target was €43.98.
Share RedemptionOn March 27, 2018 Software AG redeemed 2,400,000 of its 2,423,761 treasury shares (3.14 percent of its share capital prior to the redemption and capital decrease). This was approved by Software AG’s Management Board by way of its authorization granted on May 31, 2016. The Company’s new share capital totaling €74 million is divided into 74 million registered.
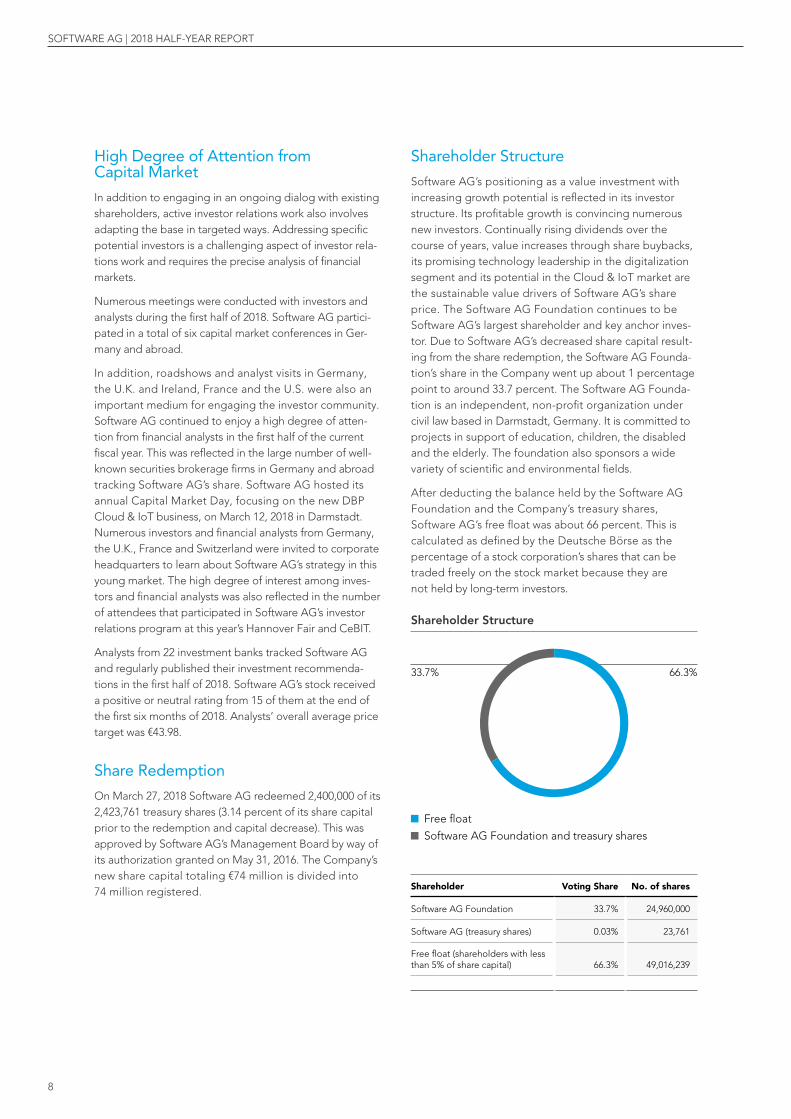
Shareholder StructureSoftware AG’s positioning as a value investment with increasing growth potential is reflected in its investor structure. Its profitable growth is convincing numerous new investors. Continually rising dividends over the course of years, value increases through share buybacks, its promising technology leadership in the digitalization segment and its potential in the Cloud & IoT market are the sustainable value drivers of Software AG’s share price. The Software AG Foundation continues to be Software AG’s largest shareholder and key anchor inves-tor. Due to Software AG’s decreased share capital result-ing from the share redemption, the Software AG Founda-tion’s share in the Company went up about 1 percentage point to around 33.7 percent. The Software AG Founda-tion is an independent, non-profit organization under civil law based in Darmstadt, Germany. It is committed to projects in support of education, children, the disabled and the elderly. The foundation also sponsors a wide variety of scientific and environmental fields.
After deducting the balance held by the Software AG Foundation and the Company’s treasury shares, Software AG’s free float was about 66 percent. This is calculated as defined by the Deutsche Börse as the percentage of a stock corporation’s shares that can be traded freely on the stock market because they are not held by long-term investors.
Shareholder Voting Share No. of shares
Software AG Foundation 33.7% 24,960,000
Software AG (treasury shares) 0.03% 23,761
Free float (shareholders with less than 5% of share capital) 66.3% 49,016,239
Free float
Software AG Foundation and treasury shares
33.7% 66.3%
Shareholder Structure
SOFTWARE AG | 2018 HALF-YEAR REPORT
8

Disclosure of Voting Share Changes Pursuant to Section 40 (1) of WpHG Voting Share Date Threshold Met
Norges Bank Investment Management >3% Oct. 5, 2017
Deutsche Asset Mgt. Investment >3% Oct. 20, 2017
Axxion S.A.* >3% March 13, 2018
JPMorgan Chase Bank* >3% April 26, 2018
BlackRock, Inc* >3% May 24, 2018
Software AG (treasury shares) <3% March 27, 2018**
* Including shares attributable to other companies** Disclosure pursuant to section 40 (1), sentence 2 of WpHG
Select Indices
TecDAX
Prime All Share
LTecDAX
Technology All Share
HDAX
CDAX
EURO STOXX
TecDAX Kursindex
DAXglobal Sarasin Sustainability Germany Index EUR
DAXglobal Sarasin Sustainability Germany
Top Investors
Institution
InvestorPercentage of
share capitalPercentage of
free float
Deutsche Asset Management Investment GmbH 4.66% 7.03%
Norges Bank Investment Management 3.25% 4.90%
J.P. Morgan Asset Management, LTD 3.00% 4.54%
Shareholder Value Management AG 2.12% 3.20%
The Vanguard Group, Inc. 1.63% 2.46%
Investec Asset Management, LTD 1.52% 2.30%
Allianz Global Investors GmbH 1.45% 2.20%
Dimensional Fund Advisors, L.P. 1.31% 1.98%
Source: IPREO, June 30, 2018
Key Share Data
ISIN DE 000A2GS401
WKN A2GS40
Symbol SOW
LEI 529900M1LIO0SLOBAS50
Reuters SOWGn.DE
Bloomberg SOW:GR
Stock exchange Frankfurt
Market segment Prime Standard
Index TecDAX
IPO on April 26, 1999
Issue price (adjusted)* €10*
Stock split 1:3 (2011)
* 3-for-1 split in May 2001
Germany USA U.K.
Scandinavia France and Benelux
Switzerland Rest of World
6%12%
3 %15%
31%32%
1%
Regional Distribution of the Free Float
Source: IPREO, June 30, 2018
9
SOFTWARE AG’S SHARE

CONSOLIDATED INTERIM MANAGEMENT REPORT
FUNDAMENTAL ASPECTS OF THE GROUPFor more details on Software AG’s organization, corporate structure, business operations, strategy and objectives, please refer to its combined Management Report for fiscal 2017 (in the 2017 Annual Report, starting on p. 35). From the Company’s point of view, there were no significant changes in the first half of 2018.
Internal Corporate Control SystemSoftware AG’s unequivocal goal is to sustainably increase enterprise value and thus focus on profitable growth and ongoing improvement of its financial position. To achieve these strategic goals, the Company employs an internal control system. DBP and A&N product revenue (at con-stant currency) as well as operating profit margin (non-IFRS) are key strategic indicators for managing the Company. The operating profit margin (non-IFRS) is the focal point of internal controlling. Operating earnings per share (non-IFRS) also account for tax-related factors.
These performance indicators are calculated as follows:
Operating margin (EBITA, non-IFRS)
Earnings before interest and taxes (EBIT)
+ Acquisition-related depreciation of intangible assets
+ Acquisition-related decreases in product revenue due to purchase price allocations
+/– Other acquisition-related effects on earnings
+/– Income/expense resulting from share price-based remuneration
+ Restructuring/severance/litigation
= EBITA (non-IFRS)
The operating profit margin (EBITA, non-IFRS) is calculated by dividing EBITA (non-IFRS) by Group revenue adjusted for acquisition-related product revenue decreases.
Operating earnings per share (non-IFRS)
Earnings before income taxes:
+ Other taxes
+/– Net financial income/expense
EBIT (before all taxes)
+ Acquisition-related depreciation of intangible assets
+ Acquisition-related decreases in product revenue due to purchase price allocations
+/– Other acquisition-related effects on earnings
+/– Income/expense resulting from share price-based remuneration
+ Restructuring/severance/litigation
EBITA (non-IFRS)
+/– Net financial income/expense
– Other taxes
Operating income before income taxes
– Income tax based on Company’s income tax rates
Operating net income (non-IFRS)
÷ Divided by average number of shares outstanding
= Operating earnings per share (non-IFRS)
For further information on the Company’s internal management indicators, please refer to the 2017 Annual Report starting on p. 46.
SOFTWARE AG | 2018 HALF-YEAR REPORT
10

GROUP BUSINESS SUMMARYPerformance in the Second Quarter of 2018Despite currency translation effects totaling –€9.5 million, Software AG reported €205.7 million (2017: €207.4 million) in total revenue in the quarter under review. This is a rise of 4 percent at constant currency. This growth is due primarily to the strong performance of Group license revenue, which increased 17 percent at constant currency to €53.5 million (2017: €47.3 million). Group maintenance revenue totaled €101.7 million (2017: €107.0 million) (1 percent growth at constant currency). Usage-based SaaS revenue increased to €4.3 million (2017: €2.2 million) in the second quarter, which is 103 percent growth at con-stant currency. Accordingly, Software AG’s second-quarter product revenue, consisting of license, maintenance and SaaS income, was up 7 percent at constant currency to total €159.7 million (2017: €156.7million).
A growing number of large global companies are employ-ing Software AG’s leading technologies to digitize their business processes. Contributing more than half of total Group revenue, the Digital Business Platform (DBP) business line reported €107.1 million (2017: €104.4 million) in revenue in the second quarter, which reflects 3 percent (7 percent at constant currency) growth. This solid perfor-mance was fueled by the significant increase in DBP’s Cloud & IoT revenue to €5.3 million (2017: €3.5 million), which represents 56 percent growth at constant currency over last year. So far, mandatory first-time application of the new IFRS 15 revenue reporting norm has had a posi-tive impact this fiscal year; nevertheless, its application in fiscal 2017 would not have significantly changed the DBP revenue growth presented in this report. Annual recurring revenue from the Cloud & IoT business increased 106 per-cent at constant currency. This growth trend confirms the increasing demand for cloud solutions in the IoT market. DBP license revenue not including Cloud & IoT rose 11 percent at constant currency to €35.7 million (2017: €33.4 million) in the second quarter. Maintenance revenue
was €66.1 million (2017: €67.5 million), which reflects 3 per-cent growth over last year at constant currency. Accord-ingly, DBP product revenue totaled €101.8 million (2017: €100.9 million) in the second quarter of 2018. This is an increase of about 6 percent at constant currency. DBP’s segment margin was 28.8 percent (2017: 29.3 percent).
The Adabas & Natural (A&N) business line also started off 2018 on a strong note. License revenue in this business line went up 38 percent at constant currency to €17.6 million (2017: €13.2 million) in the second quarter. Maintenance revenue was €34.8 million (2017: €38.9 million). A&N prod-uct revenue grew 7 percent at constant currency to total €52.4 million (2017: €52.2 million). First-time application of IFRS 15 resulted in a €2.5 million decrease in reported A&N revenue. In the quarter under review, A&N’s seg-ment margin improved from an already high level to 71.3 percent (2017: 69.6 percent). The overall positive per-formance underlines the stability of this segment and the high degree of loyalty of the A&N customer base. With the Adabas & Natural 2050+ innovation program, Software AG is protecting customers’ long-term invest-ment and enabling them to modernize their IT landscapes.
Second-quarter revenue in the Consulting business line was €46.0 million (2017: €50.7 million). The segment margin was 12.6 percent (2017: 14.0 percent).
EBIT in the second quarter of 2018 surpassed last year’s figure by a significant 9 percent, reaching €52.2 million (2017: €48.1 million). As a result, the EBIT margin increased 220 basis points to 25.4 percent (2017: 23.2 per-cent). Software AG’s net income saw an equally clear increase, up 15 percent to €35.8 million (2017: €31.3 million). Accordingly, earnings per share rose 14 percent to €0.48 (2017: €0.42) in the second quarter.
Following the extremely high free cash flow reported in the second quarter of 2017, free cash flow was down in the second quarter of 2018 at €28.5 million (2017: €42.5 million) due to the seasonality of the license business in the first quarter. Free cash flow per share dropped accordingly to €0.39 (2017: €0.57) in the second quarter of 2018. However, both figures rose for the half-year period.
11
FUNDAMENTAL ASPECTS OF THE GROUP | GROUP BUSINESS SUMMARY | FINANCIAL PERFORMANCE | FINANCIAL POSITION | ASSETS | EMPLOYEES | OPPORTUNITY AND RISK REPORT | OUTLOOK
CONSOLIDATED INTERIM MANAGEMENT REPORT

Management’s Assessment of the Half-Year ResultsWith a significant improvement over the first quarter, our results from June 30, 2018 continue to chart a course of success. DBP license revenue reached a record high in the fourth quarter of 2017. We were able to raise our outlook for DBP Cloud & IoT revenue for fiscal 2018 in the first quarter of this year. The second quarter of 2018 was the fifth consecutive quarter in which we reported A&N license growth. Our financial indicators for the first half of 2018 as well as our new strategic IoT partnerships with global companies like Bilfinger, Telefónica, A1 Digital and Ooredoo confirm our position as a technology leader in digitalization and IoT.
A further highlight of the first half of the year was our acquisition of TrendMiner. The Web-based TrendMiner analytics platform enables visualization of industrial pro-cesses and measurement data. It is highly relevant in process and mechanical engineering.
We made significant progress in the Cloud & IoT field during the past six months. Furthermore, our extensive partner ecosystem has laid the foundation for exponential growth. Our key success indicators show that the level of interest among current and prospective customers in our DBP Cloud & IoT solutions continues to be high. SaaS revenue rose in the first half of the year by 107 percent (at constant currency). ARR for DBP Cloud & IoT also doubled since last year with 106 growth (at constant currency). This market is clearly gaining relevance with respect to our enterprise value.
ARR: DBP Cloud & IoT Performance
0
5
10
15
20
25
Q1 2017 Q2 2017 Q1 2018 Q2 2018Q3 2017 Q4 2017
106% growth from Q2 2017 to Q2 2018¹ +27%²
1 At constant currency (based on year-on-year rates) 2 Compared to last quarter
in € millions (As of Q2 2018)
SaaS Maintenance License subscriptions
Our digital business, comprising the Digital Business Plat-form, performed according to expectations in the first half of the year and is within the forecast range for the fiscal year. The second half of the year has demonstrated growth momentum in past years. We are certain that this trend will continue, particularly given the outlook for a strong revenue pipeline in the third quarter.
The Adabas & Natural (A&N) success story also carries on. License revenue in the first half of 2018 grew 32 percent year-on-year at constant currency. This growth was fueled by large deals signed in North America. A&N’s segment margin of 70.6 percent was excellent in the first half of the year. A&N’s ongoing strong performance of the last five quarters illustrates not only its significance for our custom-ers’ mission-critical applications, but also the success of our Adabas & Natural 2050+ innovation program as well. We expect license renewals to plateau slightly in the sec-ond half of the year. But we expect to hit the upper end of the forecast range for the full fiscal year.
The focus of the Consulting business line remains strategic customer projects with sophisticated consulting services and high profitability. The revenue decline in the second quarter was due primarily to negative currency effects and the cancellation of a project in the U.K. At 10.8 percent (2017: 12.2 percent), the Consulting segment’s margin was down from last year, but high compared to the sector average nevertheless.
As expected, the first half of 2018 was very negatively affected by currency effects. This was true for revenue from all other business lines as well. These effects came from two primary currencies: the U.S. Dollar and the Brazil-ian real. We expect a slight relief in the second half of 2018, at least with regard to the U.S. dollar year-on-year.
Group revenue showed a moderate 1 percent increase at constant currency. Profitability growth is apparent based on the rise in EBIT to €94.3 million (2017: €89.6 million). This is a year-on-year increase of 5 percent. The operating profit margin (EBITA, non-IFRS) was 28.7 percent (2017: 28.4 percent) in the first half of 2018. This makes us one of the most profitable companies in the high-tech sector. The continued earnings improvement is not a one-time effect. It is a result of sales efficiency and an improved worldwide structure whereby the balance between high and low-cost locations is optimized on an ongoing basis. These factors enabled us to further increase our already high margin and continue the positive earnings trend of the past quarters.
Software AG is positioned extremely well in all of its market segments and received multiple awards recognizing its leading technology. After the first two quarters and strong start to the second half of 2018, we consider the Company to be right on target and confirm our outlook for fiscal 2018.
SOFTWARE AG | 2018 HALF-YEAR REPORT
12
FINANCIAL PERFORMANCETotal RevenueDespite negative currency translation effects, Software AG reported stable performance and increased profitability year-on-year. Group revenue for the period rose by 1 per-cent year-on-year at constant currency to reach €392.3 mil-lion (2017: €413.3 million).
Product revenue, consisting of license, maintenance and SaaS sales in the Digital Business Platform (DBP) and Adabas & Natural (A&N) product lines, was €299.9 million (2017: €310.2 million) in the first half of 2018. The two product business lines generated €87.6 million (2017: €92.2 million) in license revenue, which is 1 percent growth at constant currency. Total maintenance revenue was €204.2 million (2017: €214.0 million). This is a 2 percent gain at constant currency. At €8.1 million (2017: €4.1 million), SaaS income nearly doubled in the first six months of the year. This is a rise of 107 percent at constant currency. This increase is due to the accelerated growth in DBP Cloud & IoT, which hit a new record in the period.
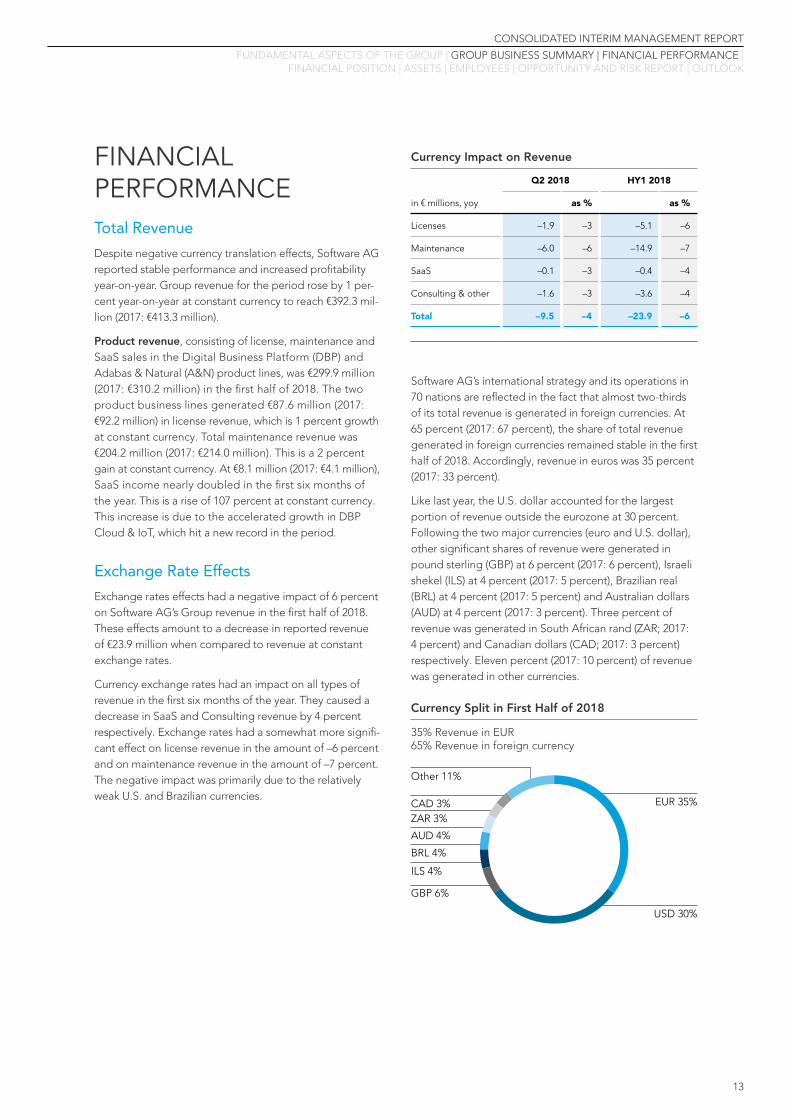
Exchange Rate EffectsExchange rates effects had a negative impact of 6 percent on Software AG’s Group revenue in the first half of 2018. These effects amount to a decrease in reported revenue of €23.9 million when compared to revenue at constant exchange rates.
Currency exchange rates had an impact on all types of revenue in the first six months of the year. They caused a decrease in SaaS and Consulting revenue by 4 percent respectively. Exchange rates had a somewhat more signifi-cant effect on license revenue in the amount of –6 percent and on maintenance revenue in the amount of –7 percent. The negative impact was primarily due to the relatively weak U.S. and Brazilian currencies.
Currency Impact on Revenue
Q2 2018 HY1 2018
in € millions, yoy as % as %
Licenses –1.9 –3 –5.1 –6
Maintenance –6.0 –6 –14.9 –7
SaaS –0.1 –3 –0.4 –4
Consulting & other –1.6 –3 –3.6 –4
Total –9.5 –4 –23.9 –6
Currency Split in First Half of 2018
35% Revenue in EUR65% Revenue in foreign currency
Other 11%
CAD 3% EUR 35%
ZAR 3%
AUD 4%
BRL 4%
ILS 4%
GBP 6%
USD 30%
Software AG’s international strategy and its operations in 70 nations are reflected in the fact that almost two-thirds of its total revenue is generated in foreign currencies. At 65 percent (2017: 67 percent), the share of total revenue generated in foreign currencies remained stable in the first half of 2018. Accordingly, revenue in euros was 35 percent (2017: 33 percent).
Like last year, the U.S. dollar accounted for the largest portion of revenue outside the eurozone at 30 percent. Following the two major currencies (euro and U.S. dollar), other significant shares of revenue were generated in pound sterling (GBP) at 6 percent (2017: 6 percent), Israeli shekel (ILS) at 4 percent (2017: 5 percent), Brazilian real (BRL) at 4 percent (2017: 5 percent) and Australian dollars (AUD) at 4 percent (2017: 3 percent). Three percent of revenue was generated in South African rand (ZAR; 2017: 4 percent) and Canadian dollars (CAD; 2017: 3 percent) respectively. Eleven percent (2017: 10 percent) of revenue was generated in other currencies.
13
CONSOLIDATED INTERIM MANAGEMENT REPORT
FUNDAMENTAL ASPECTS OF THE GROUP | GROUP BUSINESS SUMMARY | FINANCIAL PERFORMANCE | FINANCIAL POSITION | ASSETS | EMPLOYEES | OPPORTUNITY AND RISK REPORT | OUTLOOK
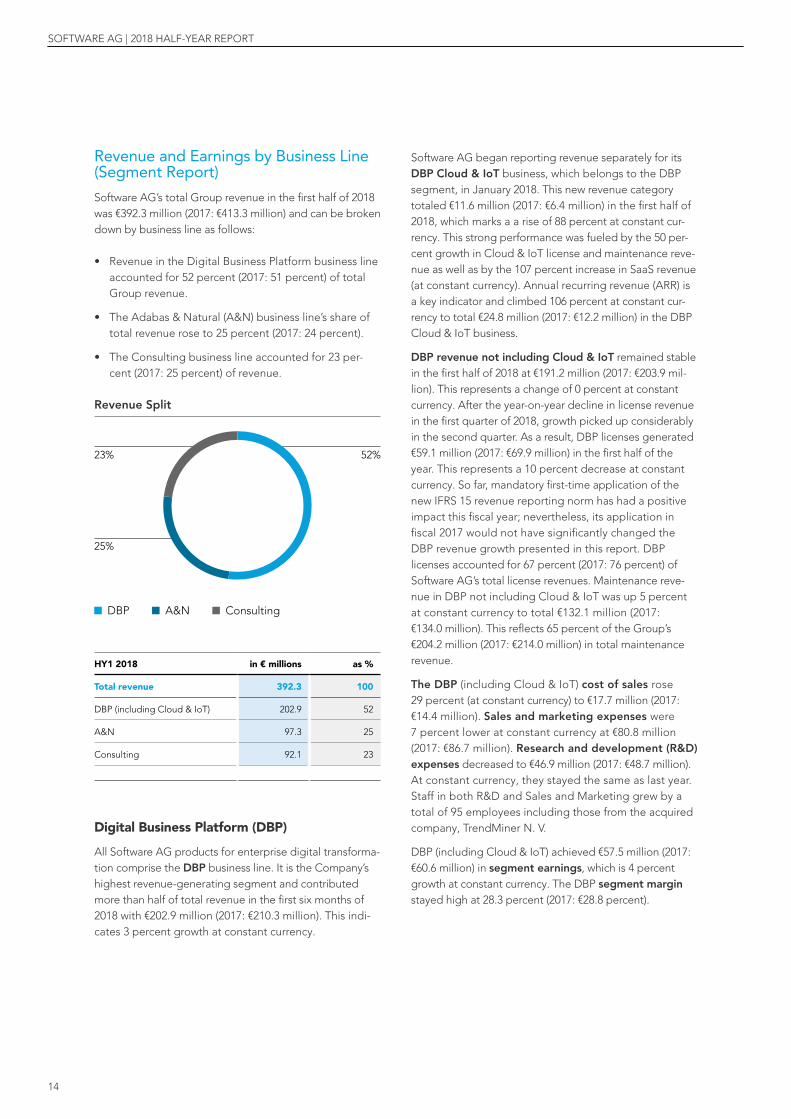
Revenue and Earnings by Business Line (Segment Report)Software AG’s total Group revenue in the first half of 2018 was €392.3 million (2017: €413.3 million) and can be broken down by business line as follows:
• Revenue in the Digital Business Platform business line accounted for 52 percent (2017: 51 percent) of total Group revenue.
• The Adabas & Natural (A&N) business line’s share of total revenue rose to 25 percent (2017: 24 percent).
• The Consulting business line accounted for 23 per-cent (2017: 25 percent) of revenue.
Software AG began reporting revenue separately for its DBP Cloud & IoT business, which belongs to the DBP segment, in January 2018. This new revenue category totaled €11.6 million (2017: €6.4 million) in the first half of 2018, which marks a a rise of 88 percent at constant cur-rency. This strong performance was fueled by the 50 per-cent growth in Cloud & IoT license and maintenance reve-nue as well as by the 107 percent increase in SaaS revenue (at constant currency). Annual recurring revenue (ARR) is a key indicator and climbed 106 percent at constant cur-rency to total €24.8 million (2017: €12.2 million) in the DBP Cloud & IoT business.
DBP revenue not including Cloud & IoT remained stable in the first half of 2018 at €191.2 million (2017: €203.9 mil-lion). This represents a change of 0 percent at constant currency. After the year-on-year decline in license revenue in the first quarter of 2018, growth picked up considerably in the second quarter. As a result, DBP licenses generated €59.1 million (2017: €69.9 million) in the first half of the year. This represents a 10 percent decrease at constant currency. So far, mandatory first-time application of the new IFRS 15 revenue reporting norm has had a positive impact this fiscal year; nevertheless, its application in fiscal 2017 would not have significantly changed the DBP revenue growth presented in this report. DBP licenses accounted for 67 percent (2017: 76 percent) of Software AG’s total license revenues. Maintenance reve-nue in DBP not including Cloud & IoT was up 5 percent at constant currency to total €132.1 million (2017: €134.0 million). This reflects 65 percent of the Group’s €204.2 million (2017: €214.0 million) in total maintenance revenue.
The DBP (including Cloud & IoT) cost of sales rose 29 percent (at constant currency) to €17.7 million (2017: €14.4 million). Sales and marketing expenses were 7 percent lower at constant currency at €80.8 million (2017: €86.7 million). Research and development (R&D) expenses decreased to €46.9 million (2017: €48.7 million). At constant currency, they stayed the same as last year. Staff in both R&D and Sales and Marketing grew by a total of 95 employees including those from the acquired company, TrendMiner N. V.
DBP (including Cloud & IoT) achieved €57.5 million (2017: €60.6 million) in segment earnings, which is 4 percent growth at constant currency. The DBP segment margin stayed high at 28.3 percent (2017: €28.8 percent).
DBP A&N Consulting
25%
23% 52%
Revenue Split
HY1 2018 in € millions as %
Total revenue 392.3 100
DBP (including Cloud & IoT) 202.9 52
A&N 97.3 25
Consulting 92.1 23
Digital Business Platform (DBP)
All Software AG products for enterprise digital transforma-tion comprise the DBP business line. It is the Company’s highest revenue-generating segment and contributed more than half of total revenue in the first six months of 2018 with €202.9 million (2017: €210.3 million). This indi-cates 3 percent growth at constant currency.
SOFTWARE AG | 2018 HALF-YEAR REPORT
14
Adabas & Natural (A&N)
The Adabas & Natural business line posted revenue in the amount of €97.3 million (2017: €100.3 million) in the first half of the year. This represents a 4 percent increase at constant currency.
As expected, maintenance revenue demonstrated a slight decline at €70.5 million (2017: €78.9 million) in the first half of the year. This is a 3 percent drop at constant currency. License revenue, however, increased significantly, climbing to €26.5 million (2017: €21.1 million). This marks a 32 percent increase at constant currency year-on-year. First-time application of IFRS 15 led to a €2.4 million decrease in reported A&N revenue. This development confirms the long-term importance of A&N software for mission-critical applications. But it is also a result of Software AG’s suc-cessful Adabas & Natural 2050+ innovation program. This program offers A&N customers long-term investment protection with innovations, support and updates through the year 2050 and beyond.
The A&N cost of sales dropped 39 percent year-on-year at constant currency to €2.7 million (2017: €4.8 million). Sales and marketing expenses went down 7 percent at constant currency to €14.5 million (2017: €16.1 million). R&D expenses were also down 3 percent (at constant currency) to €11.5 million (2017: €12.0 million).
Segment earnings rose to €68.7 million (2017: €67.4 mil-lion), which reflects growth of 11 percent at constant cur-rency. A&N’s segment margin was 70.6 percent (2017: 67.2 percent), which was even higher than last year. Due to the strong pipeline for the second half of the year, the stability of maintenance sales and the typical seasonality of the business, Software AG regards its full-year outlook optimistically.
Consulting
The Consulting business line accounted for €92.1 million (2017: €102.7 million) of total revenue in the first half of 2018 . This represents a decline of 7 percent at constant currency.
The cost of sales in this segment dropped 5 percent to €73.5 million (2017: €80.3 million). Expenses for sales and marketing were reduced by 8 percent at constant cur-rency to €8.6 million (2017: €9.9 million).
The Consulting line posted €10.0 million (2017: €12.5 mil-lion) in segment earnings. This represents a segment margin of 10.8 percent (2017: 12.1 percent). This continues to be a very good number compared to the industry aver-age and confirms Software AG’s successful consulting transformation from a traditional project implementer to a strategic partner with sophisticated customer services.
Group Earnings PerformanceSoftware AG’s total cost of sales again grew at a lower rate than revenue, falling 5 percent (at constant currency) to €97.9 million (2017: €106.7 million) in the first half of 2018. As a result, gross profit increased 3 percent at constant currency to €294.5 million (2017: €306.7 million). The gross profit margin continued to rise to 75.1 percent (2017: €74.2 percent). This strong indicator of profitability confirms Software AG’s successful focus on a growing product business with sustainable profitability.
R&D expenses were €58.4 million (2017: €60.7 million) in the first six months of fiscal 2018. At constant currency, they are on par with last year. In contrast, sales and marketing expenses went down to €110.5 million (2017: €121.7 million) and administrative expenses to €35.0 mil-lion (2017: €38.0 million). This is a 4 percent decrease for both (at constant currency). It is important to note that R&D and Sales and Marketing staff has increased by 103 full-time employees since December 31, 2017.
Fueled by the high profits, EBIT (earnings before interest and tax) outperformed last year’s €89.6 million by 5 per-cent to total €94.3 million. EBIT margin rose accordingly, surpassing last year’s 21.7 percent with 24.0 percent this year.
EBITA (non-IFRS) was €112.7 million (2017: €117.6 million) in the first half of 2018. In line with total revenue, this reflects a 4 percent decrease. This year’s first-half operat-ing profit margin (non-IFRS) slightly outperformed last year at 28.7 percent (2017: 28.4 percent). Software AG attributes the further increase in profitability to its excel-lent cost structure whereby the balance between high and low-cost locations is optimized on an ongoing basis.
Net financial income improved to €2.1 million (2017: €0.0). This is due primarily to a reduced average credit volume with improved financing terms and excellent investment options outside of the eurozone. Income taxes were just above last year’s figure at €27.4 million (2017: €27.3 million), whereas other taxes were 14 percent lower at €3.2 million (2017: €3.7 million). Accordingly, Software AG’s total imputed tax rate went down to 31.7 percent (2017: 34.6 percent).
In total, net income went up 12 percent year-on-year to €65.8 million (2017: €58.6 million). Earnings per share (basic) continued to rise to €0.89 (2017: €0.78).
15
CONSOLIDATED INTERIM MANAGEMENT REPORT
FUNDAMENTAL ASPECTS OF THE GROUP | GROUP BUSINESS SUMMARY | FINANCIAL PERFORMANCE | FINANCIAL POSITION | ASSETS | EMPLOYEES | OPPORTUNITY AND RISK REPORT | OUTLOOK
FINANCIAL POSITIONNet cash provided by operating activities was down year-on-year from €108.4 million in 2017 to €95.1 million in the first half of 2018 due to reduced liabilities and provi-sions.
Cash outflows from investing activities decreased to €36.4 million compared to €68.4 million one year ago. Payments in the amount of €29.6 million were made for the acquisition of TrendMiner N. V. compared with last year’s period in which Cumulocity GmbH was acquired as well as an office building near corporate headquarters in Darmstadt.
Cash outflows from financing activities were down from €101.3 in the first half of 2017 to €36.4 million in 2018. The 2017 figure included share repurchases totaling €89.6 mil-lion. Dividend payments were higher due to the decision to increase the dividend per dividend-bearing share to €0.65 (2017: €0.60). The total dividend disbursement to Software AG shareholders went up to a record-breaking €48.3 million (2017: €44.3 million). This reflects Software AG’s commitment to a value-driven dividend policy. Net pro-ceeds from external financing totaled €11.8 million, com-pared to €31.3 million one year ago.
Cash and cash equivalents were €388.0 million (2017: €303.8 million) as of June 30, 2018 compared to €365.8 mil-lion at the beginning of the year. Free cash flow in the first half of fiscal 2018 went up to €88.6 (2017: €85.8) mil-lion. The free cash flow to revenue ratio was 22.6 percent (2017: 20.8 percent) and free cash flow to net income was 134.7 percent (2017: 146.4 percent). Accordingly, free cash flow per share was €1.20 (2017: €1.14) in the period under review.
All in all, Software AG’s statement of cash flows reflects its value-oriented focus on profitable growth. Specifically, this means that the Company employs its cash flow for future-oriented investments, dividends and share buyback programs.
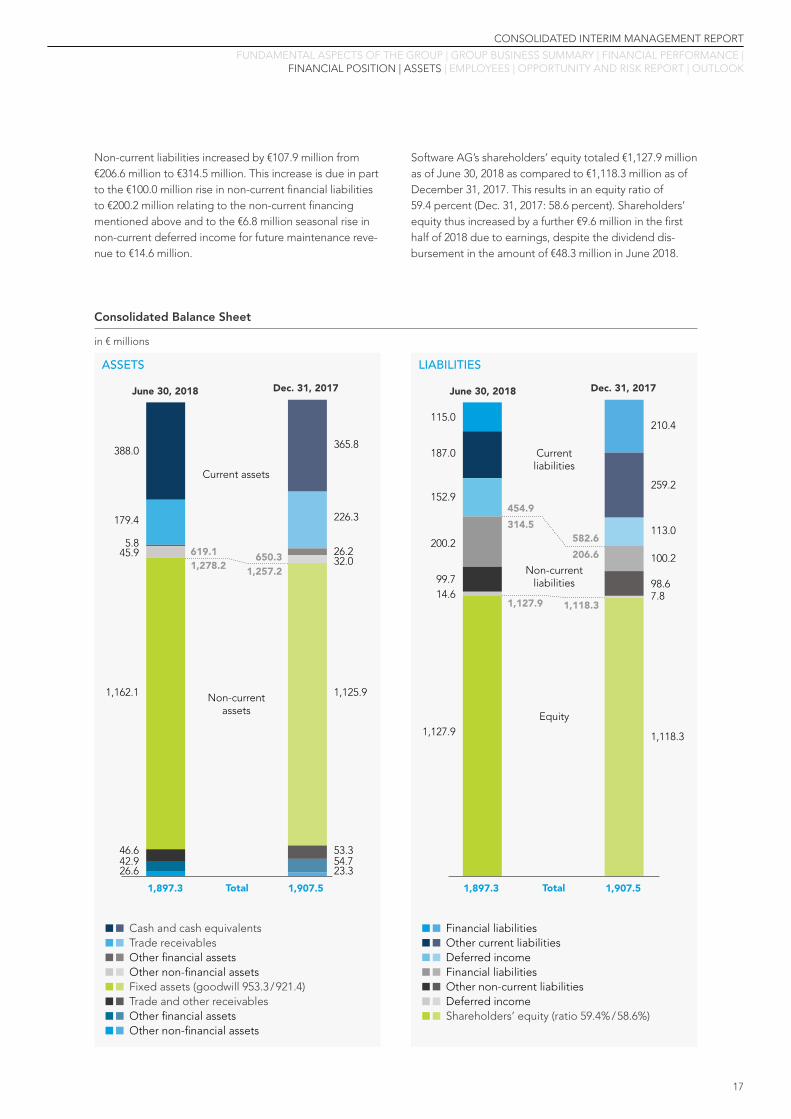
ASSETSSoftware AG continued to have a strong balance sheet. Software AG’s total assets were €1,897.3 million as of June 30, 2018 compared to €1,833.5 million the year before and €1,907.5 million as of December 31, 2017.
On the assets side, current assets were down €31.2 million from €650.3 million as of December 31, 2017 to €619.1 mil-lion as of June 30, 2018. This drop is due primarily to the changes in the balance sheet described below. Current trade receivables and other receivables fell €46.9 million to €179.5 million due to active working capital management and lower (season-related) license revenue in the second quarter compared to the fourth quarter of 2017. Further-more, other financial assets were down by €20.4 million. This decrease results from hedging transactions having been closed out through the exercise of employee stock options and performance phantom shares. Cash and cash equivalents, in contrast, increased by €22.2 million from €365.8 million at the beginning of the year to €388.0 million.
Non-current assets increased from €1,257.2 million by €11.0 million to total €1,278.2 million. Specifically, intangi-ble assets rose by €5.5 million to €137.1 million resulting from the balance of effects relating to the acquisition of TrendMiner and exchange rate fluctuations as well as from the amortization of this item in the first half of 2018. Good-will went up by €31.8 million to reach €953.3 million. This increase also resulted from the acquisition of TrendMiner and exchange rate fluctuations. Non-current other financial assets went down €11.8 million to €42.9 million, largely due to value changes from hedging transactions for employee stock options.
Current liabilities fell by €127.7 million from €582.6 million to €454.9 million. Current financial liabilities decreased by €95.3 million to €115.0 million due to a long-term refinanc-ing. Other non-financial liabilities decreased by €59.4 mil-lion to €91.0 million. This reduction is due mainly to the disbursement of variable remuneration components and employee options and to the payment of tax liabilities in the first half of 2018. Deferred income, in contrast, went up mainly because of seasonal factors by €39.9 million to total €152.9 million. This is a 35 percent increase which reflects the Company’s strategic focus on high-margin recurring maintenance revenues.
SOFTWARE AG | 2018 HALF-YEAR REPORT
16
Consolidated Balance Sheet
ASSETS LIABILITIES
June 30, 2018 June 30, 2018
388.0
Non-current assets Equity
Non-current liabilities
Current liabilities
Current assets
115.0
365.8
210.4
179.4
187.0
200.2
152.9
99.7
226.3
5.826.2
113.0
259.2
45.9
26.6
14.6
32.0
98.67.8
100.2
1,162.1
46.642.9
1,127.9
1,125.9
54.753.3
23.3
1,118.3
Dec. 31, 2017 Dec. 31, 2017
1,897.3
1,278.2
1,127.9
619.1
314.5
454.9
1,257.2
1,118.3
650.3 206.6
582.6
1,897.3Total Total1,907.5 1,907.5
in € millions
Cash and cash equivalents Trade receivables Other financial assets Other non-financial assets Fixed assets (goodwill 953.3 / 921.4) Trade and other receivables Other financial assets Other non-financial assets
Financial liabilities Other current liabilities Deferred income Financial liabilities Other non-current liabilities Deferred income Shareholders’ equity (ratio 59.4% / 58.6%)
Non-current liabilities increased by €107.9 million from €206.6 million to €314.5 million. This increase is due in part to the €100.0 million rise in non-current financial liabilities to €200.2 million relating to the non-current financing mentioned above and to the €6.8 million seasonal rise in non-current deferred income for future maintenance reve-nue to €14.6 million.
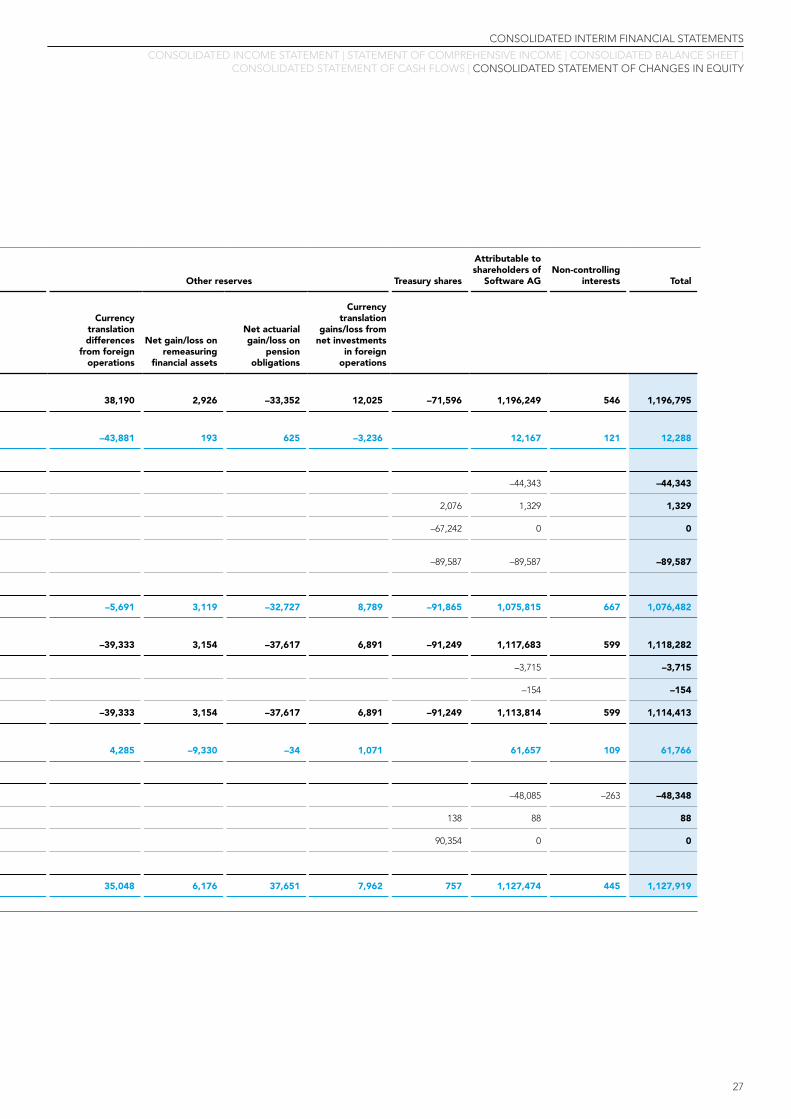
Software AG’s shareholders’ equity totaled €1,127.9 million as of June 30, 2018 as compared to €1,118.3 million as of December 31, 2017. This results in an equity ratio of 59.4 percent (Dec. 31, 2017: 58.6 percent). Shareholders’ equity thus increased by a further €9.6 million in the first half of 2018 due to earnings, despite the dividend dis-bursement in the amount of €48.3 million in June 2018.
17
CONSOLIDATED INTERIM MANAGEMENT REPORT
FUNDAMENTAL ASPECTS OF THE GROUP | GROUP BUSINESS SUMMARY | FINANCIAL PERFORMANCE | FINANCIAL POSITION | ASSETS | EMPLOYEES | OPPORTUNITY AND RISK REPORT | OUTLOOK

Germany
India
USA
Other countries
803 (17%)
574 (13 %)
2,060 (44 %) 1,218 (26 %)
Headcount by Region*
* According to P&L structure as of Dec. 31, 2017 (year-on-year)
Consulting & Services
Research & Development
Sales & Marketing
Administration
1,205 (26%)
936 (20%)
604 (13%) 1,910 (41%)
Headcount by Function*
EMPLOYEESAs of June 30, 2018, the Software AG Group employed 4,655 (2017: 4,570) people (full-time equivalents). This reflects the addition of 85 new employees, which is a 2 percent increase. The expansion is primarily a result of Software AG’s acquisition of TrendMiner, which has staff at six locations in Germany, Belgium, Spain, Portugal, the USA and Netherlands.
Software AG is committed to investing in a future-oriented Group structure and profitable growth. Broken down by department, the number of employees at the end of the first six months of 2018 in Service and Consulting was 1,910 (2017: 1,920), in R&D 1,205 (2017: 1,158), in Sales and
Marketing 936 (2017: 888) and in Administration 604 (2017: 605) . The strategically key R&D and Sales and Marketing departments expanded by 47 (+4 percent) and 48 (+5 per-cent) new employees respectively.
The international structure of Software AG’s staff reflects its global business operations. The regional distribution of employees can be broken down as follows: As of June 30, 2018, the Software AG Group employed 1,218 (2017: 1,183) people in Germany, 803 (2017: 785) in India and 574 (2017: 597) in the USA . A total of 2,060 (2017: 2,005) people were employed in countries other than those mentioned above.
SOFTWARE AG | 2018 HALF-YEAR REPORT
18
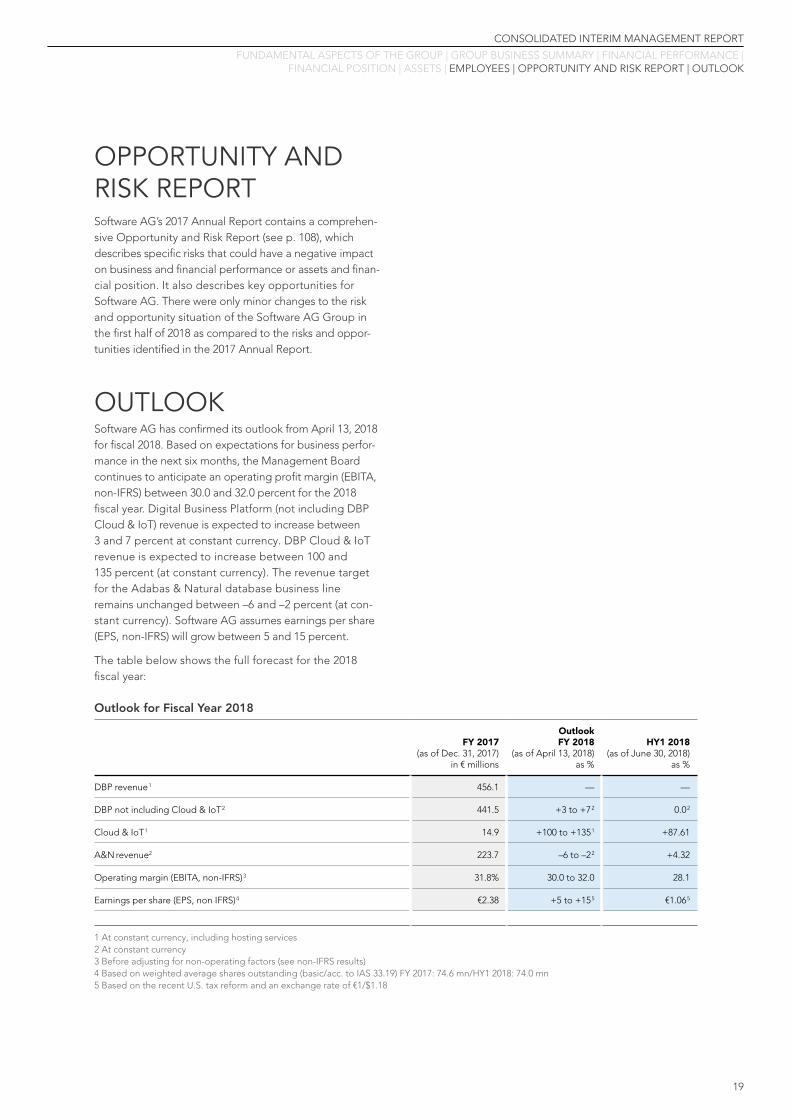
Outlook for Fiscal Year 2018
FY 2017 (as of Dec. 31, 2017)
in € millions
Outlook FY 2018
(as of April 13, 2018) as %
HY1 2018(as of June 30, 2018)
as %
DBP revenue 1 456.1 — —
DBP not including Cloud & IoT 2 441.5 +3 to +7 2 0.0 2
Cloud & IoT 1 14.9 +100 to +135 1 +87.61
A&N revenue2 223.7 –6 to –2 2 +4.32
Operating margin (EBITA, non-IFRS) 3 31.8% 30.0 to 32.0 28.1
Earnings per share (EPS, non IFRS) 4 €2.38 +5 to +15 5 €1.06 5
1 At constant currency, including hosting services2 At constant currency3 Before adjusting for non-operating factors (see non-IFRS results)4 Based on weighted average shares outstanding (basic/acc. to IAS 33.19) FY 2017: 74.6 mn/HY1 2018: 74.0 mn5 Based on the recent U.S. tax reform and an exchange rate of €1/$1.18
OPPORTUNITY AND RISK REPORTSoftware AG’s 2017 Annual Report contains a comprehen-sive Opportunity and Risk Report (see p. 108), which describes specific risks that could have a negative impact on business and financial performance or assets and finan-cial position. It also describes key opportunities for Software AG. There were only minor changes to the risk and opportunity situation of the Software AG Group in the first half of 2018 as compared to the risks and oppor-tunities identified in the 2017 Annual Report.
OUTLOOKSoftware AG has confirmed its outlook from April 13, 2018 for fiscal 2018. Based on expectations for business perfor-mance in the next six months, the Management Board continues to anticipate an operating profit margin (EBITA, non-IFRS) between 30.0 and 32.0 percent for the 2018 fiscal year. Digital Business Platform (not including DBP Cloud & IoT) revenue is expected to increase between 3 and 7 percent at constant currency. DBP Cloud & IoT revenue is expected to increase between 100 and 135 percent (at constant currency). The revenue target for the Adabas & Natural database business line remains unchanged between –6 and –2 percent (at con-stant currency). Software AG assumes earnings per share (EPS, non-IFRS) will grow between 5 and 15 percent.
The table below shows the full forecast for the 2018 fiscal year:
19
CONSOLIDATED INTERIM MANAGEMENT REPORT
FUNDAMENTAL ASPECTS OF THE GROUP | GROUP BUSINESS SUMMARY | FINANCIAL PERFORMANCE | FINANCIAL POSITION | ASSETS | EMPLOYEES | OPPORTUNITY AND RISK REPORT | OUTLOOK

CONSOLIDATED INTERIM FINANCIAL STATEMENTS
CONSOLIDATED INCOME STATEMENT
for the six months ended June 30, 2018 (IFRS)
in € thousands HY1 2018 HY1 2017
Licenses 87,636 92,213
Maintenance 204,168 213,952
SaaS 8,062 4,065
Services 92,100 102,708
Other 368 384
Total revenue 392,334 413,322
Cost of sales –97,876 –106,664
Gross profit 294,458 306,658
Research and development expenses –58,378 –60,655
Sales, marketing and distribution expenses –110,462 –121,703
General and administrative expenses –35,029 –38,006
Other taxes –3,212 –3,738
Operating earnings 87,377 82,556
Other income 9,444 6,085
Other expenses –5,759 –2,762
Financing income 5,171 4,609
Financing expenses –3,084 –4,632
Earnings before income taxes 93,149 85,856
Income taxes –27,375 –27,270
Net income 65,774 58,586
thereof attributable to shareholders of Software AG 65,665 58,465
thereof attributable to non-controlling interests 109 121
Earnings per share in € (basic) 0.89 0.78
Earnings per share in € (diluted) 0.89 0.78
Weighted average number of shares outstanding (basic) 73,977,152 75,326,261
Weighted average number of shares outstanding (diluted) 73,980,793 75,336,515
SOFTWARE AG | 2018 HALF-YEAR REPORT
20

STATEMENT OF COMPREHENSIVE INCOME
for the six months ended June 30, 2018 (IFRS)
in € thousands HY1 2018 HY1 2017
Net income 65,774 58,586
Currency translation differences from foreign operations 4,285 –43,881
Net gain/loss on remeasuring financial assets –9,330 193
Currency translation gain/loss from net investments in foreign operations 1,071 –3,236
Items to be be reclassified to the income statement if certain conditions are met –3,974 –46,924
Net actuarial gain/loss on pension obligations –34 625
Items not to be reclassified to the income statement –34 625
Other comprehensive income –4,008 –46,299
Comprehensive income 61,766 12,287
thereof attributable to shareholders of Software AG 61,657 12,166
thereof attributable to non-controlling interests 109 121
21
CONSOLIDATED INCOME STATEMENT | STATEMENT OF COMPREHENSIVE INCOME | CONSOLIDATED BALANCE SHEET | CONSOLIDATED STATEMENT OF CASH FLOWS | CONSOLIDATED STATEMENT OF CHANGES IN EQUITY
CONSOLIDATED INTERIM FINANCIAL STATEMENTS

CONSOLIDATED BALANCE SHEET
as of June 30, 2018 (IFRS)
ASSETS
in € thousands June 30, 2018 Dec. 31, 2017*
Current assets
Cash and cash equivalents 387,972 365,815
Other financial assets 5,782 26,165
Trade and other receivables 179,452 226,314
Other non-financial assets 20,531 17,366
Income tax receivables 25,393 14,632
619,130 650,292
Non-current assets
Intangible assets 137,134 131,664
Goodwill 953,256 921,415
Property, plant and equipment 71,675 72,815
Other financial assets 42,919 54,730
Trade and other receivables 46,592 53,273
Other non-financial assets 2,783 199
Income tax receivables 8,838 8,575
Deferred tax receivables 14,987 14,507
1,278,184 1,257,178
Total Assets 1,897,314 1,907,470
SOFTWARE AG | 2018 HALF-YEAR REPORT
22

EQUITY AND LIABILITIES
in € thousands June 30, 2018 Dec. 31, 2017*
Current liabilities
Financial liabilities 115,023 210,347
Trade and other payables 30,704 37,617
Other non-financial liabilities 91,019 150,416
Other provisions 36,420 43,708
Income tax liabilities 28,875 27,505
Deferred Income 152,854 112,964
454,895 582,557
Non-current liabilities
Financial liabilities 200,203 100,250
Trade and other payables 3,630 3,677
Other non-financial liabilities 568 640
Other provisions 31,282 34,297
Provisions for pensions and similar obligations 43,708 43,869
Income tax liabilities 4,199 4,509
Deferred tax liabilities 16,306 11,599
Deferred income 14,604 7,790
314,500 206,631
Equity
Share capital 74,000 76,400
Capital reservesd 22,665 22,715
Retained earnings 1,102,479 1,176,722
Other reserves –70,913 –66,905
Treasury shares –757 –91,249
Attributable to shareholders of Software AG 1,127,474 1,117,683
Non-controlling interests 445 599
1,127,919 1,118,282
Total Equity and Liabilities 1,897,314 1,907,470
* The 2017 balance sheet did not have to be adjusted for the new accounting and valuation methods because of the transition approach used by Software AG for the adoption of IFRS 15 und IFRS 9.
23
CONSOLIDATED INTERIM FINANCIAL STATEMENTS
CONSOLIDATED INCOME STATEMENT | STATEMENT OF COMPREHENSIVE INCOME | CONSOLIDATED BALANCE SHEET | CONSOLIDATED STATEMENT OF CASH FLOWS | CONSOLIDATED STATEMENT OF CHANGES IN EQUITY
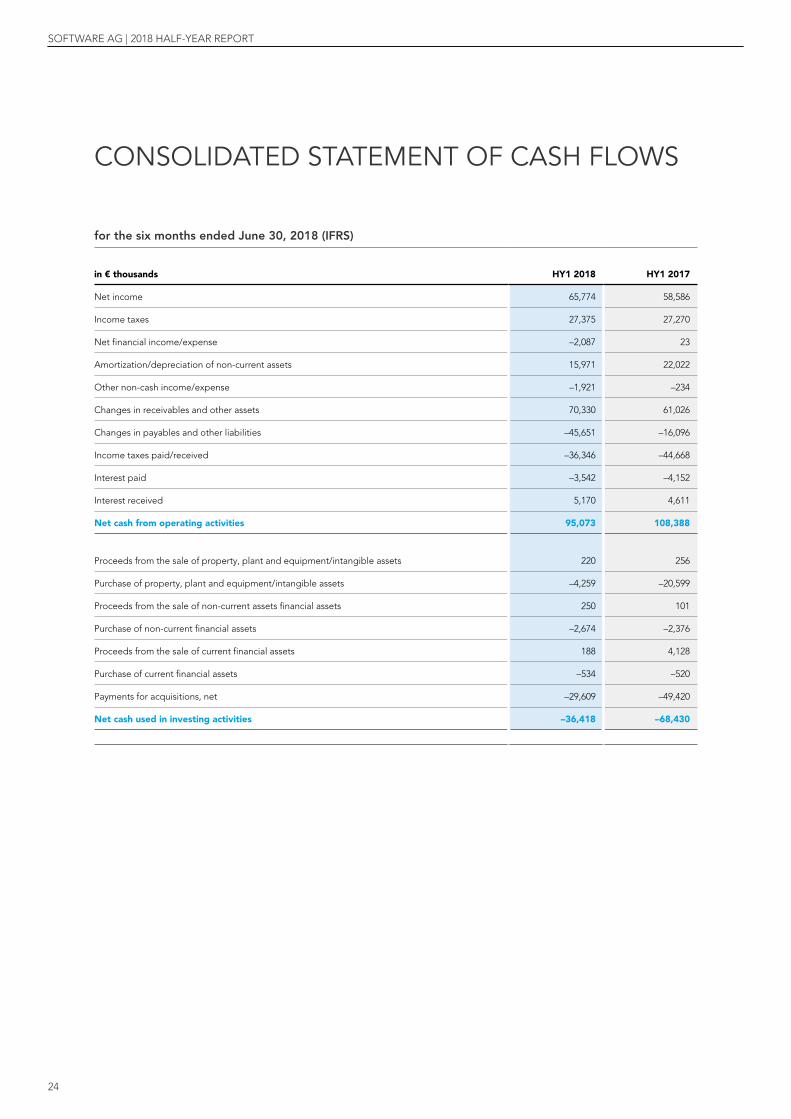
CONSOLIDATED STATEMENT OF CASH FLOWS
for the six months ended June 30, 2018 (IFRS)
in € thousands HY1 2018 HY1 2017
Net income 65,774 58,586
Income taxes 27,375 27,270
Net financial income/expense –2,087 23
Amortization/depreciation of non-current assets 15,971 22,022
Other non-cash income/expense –1,921 –234
Changes in receivables and other assets 70,330 61,026
Changes in payables and other liabilities –45,651 –16,096
Income taxes paid/received –36,346 –44,668
Interest paid –3,542 –4,152
Interest received 5,170 4,611
Net cash from operating activities 95,073 108,388
Proceeds from the sale of property, plant and equipment/intangible assets 220 256
Purchase of property, plant and equipment/intangible assets –4,259 –20,599
Proceeds from the sale of non-current assets financial assets 250 101
Purchase of non-current financial assets –2,674 –2,376
Proceeds from the sale of current financial assets 188 4,128
Purchase of current financial assets –534 –520
Payments for acquisitions, net –29,609 –49,420
Net cash used in investing activities –36,418 –68,430
SOFTWARE AG | 2018 HALF-YEAR REPORT
24
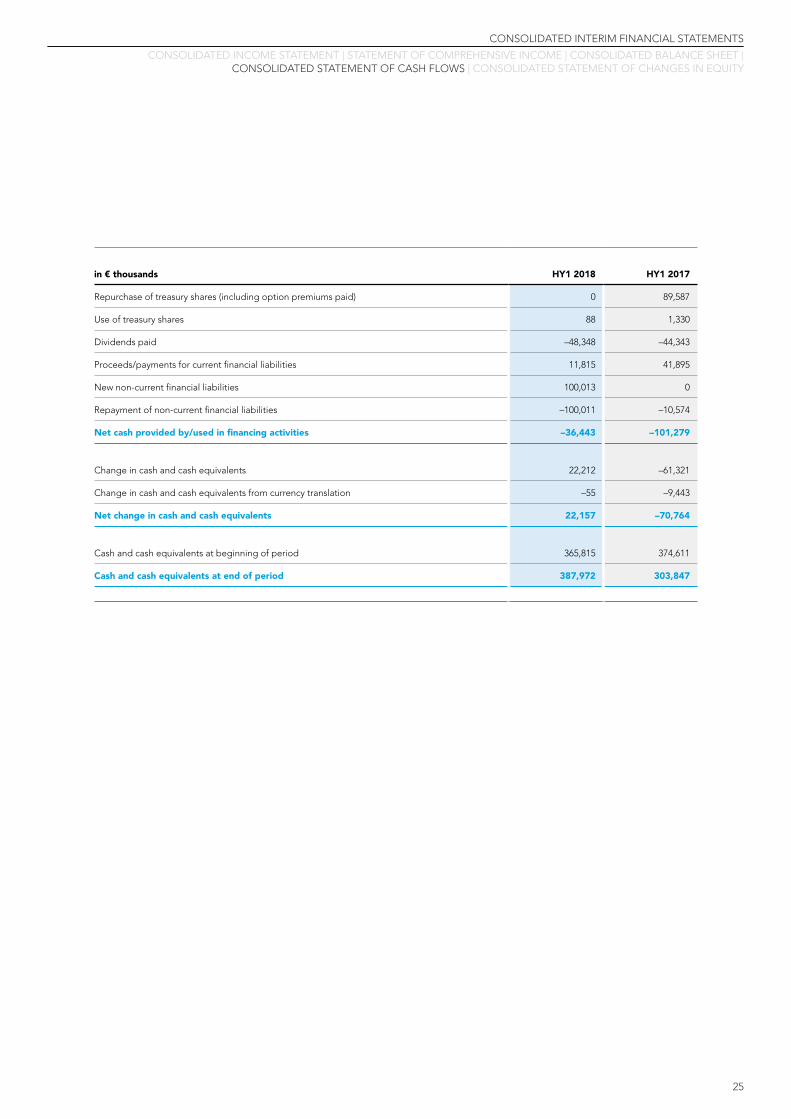
in € thousands HY1 2018 HY1 2017
Repurchase of treasury shares (including option premiums paid) 0 89,587
Use of treasury shares 88 1,330
Dividends paid –48,348 –44,343
Proceeds/payments for current financial liabilities 11,815 41,895
New non-current financial liabilities 100,013 0
Repayment of non-current financial liabilities –100,011 –10,574
Net cash provided by/used in financing activities –36,443 –101,279
Change in cash and cash equivalents 22,212 –61,321
Change in cash and cash equivalents from currency translation –55 –9,443
Net change in cash and cash equivalents 22,157 –70,764
Cash and cash equivalents at beginning of period 365,815 374,611
Cash and cash equivalents at end of period 387,972 303,847
25
CONSOLIDATED INTERIM FINANCIAL STATEMENTS
CONSOLIDATED INCOME STATEMENT | STATEMENT OF COMPREHENSIVE INCOME | CONSOLIDATED BALANCE SHEET | CONSOLIDATED STATEMENT OF CASH FLOWS | CONSOLIDATED STATEMENT OF CHANGES IN EQUITY
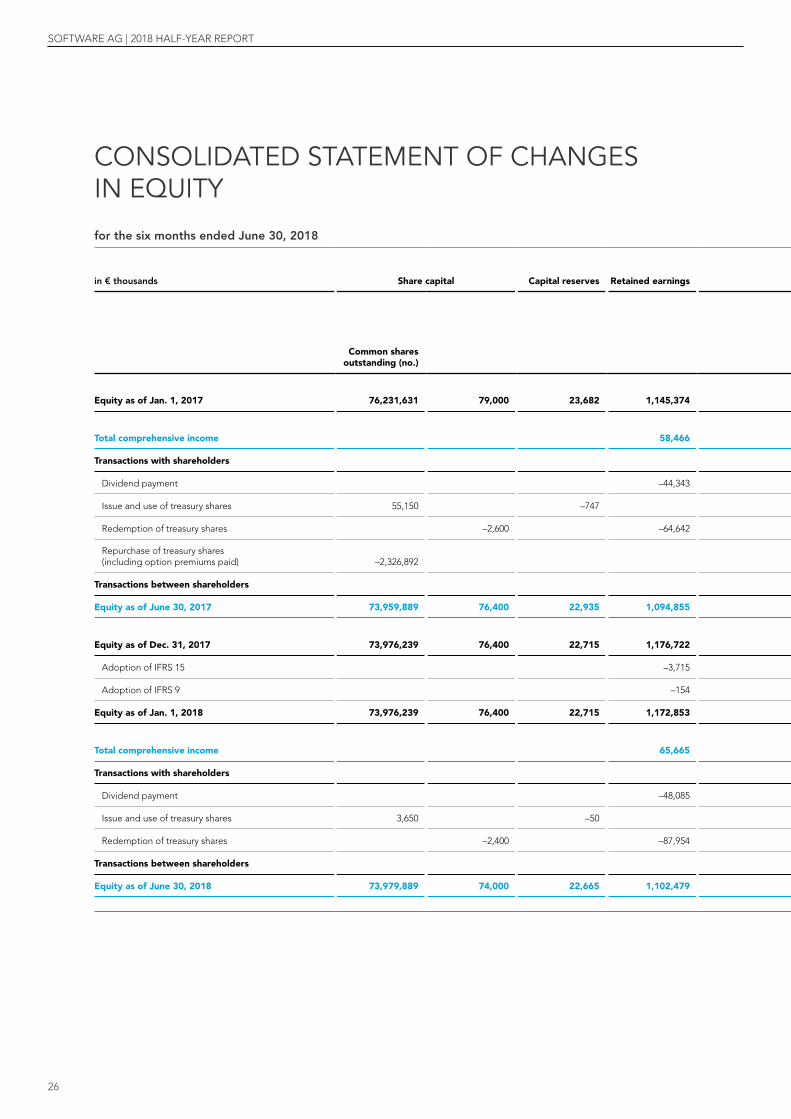
CONSOLIDATED STATEMENT OF CHANGES IN EQUITY
for the six months ended June 30, 2018
in € thousands Share capital Capital reserves Retained earnings Other reserves Treasury shares
Attributable to shareholders of
Software AGNon-controlling
interests Total
Common shares outstanding (no.)
Currency translation differences
from foreign operations
Net gain/loss on remeasuring
financial assets
Net actuarial gain/loss on
pension obligations
Currency translation
gains/loss from net investments
in foreign operations
Equity as of Jan. 1, 2017 76,231,631 79,000 23,682 1,145,374 38,190 2,926 –33,352 12,025 –71,596 1,196,249 546 1,196,795
Total comprehensive income 58,466 –43,881 193 625 –3,236 12,167 121 12,288
Transactions with shareholders
Dividend payment –44,343 –44,343 –44,343
Issue and use of treasury shares 55,150 –747 2,076 1,329 1,329
Redemption of treasury shares –2,600 –64,642 –67,242 0 0
Repurchase of treasury shares(including option premiums paid) –2,326,892 –89,587 –89,587 –89,587
Transactions between shareholders
Equity as of June 30, 2017 73,959,889 76,400 22,935 1,094,855 –5,691 3,119 –32,727 8,789 –91,865 1,075,815 667 1,076,482
Equity as of Dec. 31, 2017 73,976,239 76,400 22,715 1,176,722 –39,333 3,154 –37,617 6,891 –91,249 1,117,683 599 1,118,282
Adoption of IFRS 15 –3,715 –3,715 –3,715
Adoption of IFRS 9 –154 –154 –154
Equity as of Jan. 1, 2018 73,976,239 76,400 22,715 1,172,853 –39,333 3,154 –37,617 6,891 –91,249 1,113,814 599 1,114,413
Total comprehensive income 65,665 4,285 –9,330 –34 1,071 61,657 109 61,766
Transactions with shareholders
Dividend payment –48,085 –48,085 –263 –48,348
Issue and use of treasury shares 3,650 –50 138 88 88
Redemption of treasury shares –2,400 –87,954 90,354 0 0
Transactions between shareholders
Equity as of June 30, 2018 73,979,889 74,000 22,665 1,102,479 35,048 6,176 37,651 7,962 757 1,127,474 445 1,127,919
SOFTWARE AG | 2018 HALF-YEAR REPORT
26
for the six months ended June 30, 2018
in € thousands Share capital Capital reserves Retained earnings Other reserves Treasury shares
Attributable to shareholders of
Software AGNon-controlling
interests Total
Common shares outstanding (no.)
Currency translation differences
from foreign operations
Net gain/loss on remeasuring
financial assets
Net actuarial gain/loss on
pension obligations
Currency translation
gains/loss from net investments
in foreign operations
Equity as of Jan. 1, 2017 76,231,631 79,000 23,682 1,145,374 38,190 2,926 –33,352 12,025 –71,596 1,196,249 546 1,196,795
Total comprehensive income 58,466 –43,881 193 625 –3,236 12,167 121 12,288
Transactions with shareholders
Dividend payment –44,343 –44,343 –44,343
Issue and use of treasury shares 55,150 –747 2,076 1,329 1,329
Redemption of treasury shares –2,600 –64,642 –67,242 0 0
Repurchase of treasury shares(including option premiums paid) –2,326,892 –89,587 –89,587 –89,587
Transactions between shareholders
Equity as of June 30, 2017 73,959,889 76,400 22,935 1,094,855 –5,691 3,119 –32,727 8,789 –91,865 1,075,815 667 1,076,482
Equity as of Dec. 31, 2017 73,976,239 76,400 22,715 1,176,722 –39,333 3,154 –37,617 6,891 –91,249 1,117,683 599 1,118,282
Adoption of IFRS 15 –3,715 –3,715 –3,715
Adoption of IFRS 9 –154 –154 –154
Equity as of Jan. 1, 2018 73,976,239 76,400 22,715 1,172,853 –39,333 3,154 –37,617 6,891 –91,249 1,113,814 599 1,114,413
Total comprehensive income 65,665 4,285 –9,330 –34 1,071 61,657 109 61,766
Transactions with shareholders
Dividend payment –48,085 –48,085 –263 –48,348
Issue and use of treasury shares 3,650 –50 138 88 88
Redemption of treasury shares –2,400 –87,954 90,354 0 0
Transactions between shareholders
Equity as of June 30, 2018 73,979,889 74,000 22,665 1,102,479 35,048 6,176 37,651 7,962 757 1,127,474 445 1,127,919
27
CONSOLIDATED INTERIM FINANCIAL STATEMENTS
CONSOLIDATED INCOME STATEMENT | STATEMENT OF COMPREHENSIVE INCOME | CONSOLIDATED BALANCE SHEET | CONSOLIDATED STATEMENT OF CASH FLOWS | CONSOLIDATED STATEMENT OF CHANGES IN EQUITY

NOTES TO THE CONSOLIDATED INTERIM FINANCIAL STATEMENTS
GENERAL
[1] Basis of Presentation Software AG’s condensed and unaudited interim financial statements (half-year financial statements) as of June 30, 2018 have been prepared in accordance with the Interna-tional Accounting Standards Board’s (IASB ) International Financial Reporting Standards (IFRS), as applicable in the European Union (EU). The IFRS applicable as of June 30, 2018 were observed, as were the corresponding interpre-tations of the International Financial Reporting Interpre-tations Committee (IFRIC). Due to the introduction of accounting in accordance with the new IFRS 15 and IFRS 9 standards as of January 1, 2018, a number of Software AG’s accounting policies have changed.
Software AG is a registered stock corporation under Ger-man law with registered offices in Darmstadt. It is the prin-cipal parent company of a Group that is globally active in the fields of software development, licensing and mainte-nance as well as IT services. The functional currency of Software AG is the euro.
The consolidated financial statements of Software AG are expressed in thousands of euros unless otherwise stated. Software AG waived a voluntary audit and a review of the consolidated interim financial statements (half-year report).
[2] Scope of Consolidation The following changes occurred in the consolidated Group in the first six months of fiscal 2018.
Germany Foreign Total
Jan. 1, 2018 9 71 80
Additions 1 3 4
Disposals (including mergers) 0 0 0
June 30, 2018 10 74 84
The additions consist of the acquisition of TrendMiner N.V., Hasselt, Belgium, including three subsidiaries in the Netherlands, Germany and the USA. The change to the scope of consolidation had no significant effect on com-parability to last year.
[3] Accounting Policies The same accounting policies have been applied to the consolidated interim financial statements as were appli-cable to the consolidated financial statements as of December 31, 2017; any exceptions result from the man-datory first-application of IFRS 15 and IFRS 9 and are described below. For more detailed information on accounting policies, please see Note 3 of the consolidated financial statements for fiscal 2017. These half-year state-ments have been prepared in accordance with IAS 34: Interim Financial Reporting.
Total revenue
Since the introduction of IFRS 15, accounting policies for revenue recognition are as follows:
SOFTWARE AG | 2018 HALF-YEAR REPORT
28

Categories of sales revenueSoftware AG sales revenues consist primarily of revenue from granting software licenses of temporary or indefinite duration, revenue from Software as a Service (SaaS) offerings, maintenance revenue and revenue from ser-vices. With respect to SaaS offerings, a customer is not entitled to terminate a hosting agreement or take the software into its own possession, either to operate in its own IT infrastructure or to engage an entity other than Software AG to provide software hosting or management services.
Identification of contractual obligations Software AG’s agreements with customers often include various products and services. The products and services described under Categories of Sales Revenue are usually to be treated as separate contractual performance obli-gations. The relevant portion of the contractual price is recognized separately. The determination as to whether a product or a service is treated as a separate contractual performance obligation requires judgment to be exer-cised.
When customers purchase products or services, Software AG sometimes offers them options for buying additional products or services. When determining whether such options give the customer a substantive right that it wouldn’t have without signing this agreement, Software AG exercises its own judgment. In making this determination, the Company considers whether the options entitle the customer to a discount that is greater than the discount provided with the relevant products or services sold with the option.
Determination of transaction price Software AG also exercises judgment when determining the consideration that it expects to receive in exchange for the transfer of products or services to a customer. This includes estimations as to whether and to what extent the customer is entitled to subsequent concessions or pay-ments and whether the customer will pay the contractually agreed consideration as expected. In this exercise of judg-ment, primarily previous experiences with a specific or a comparable customer are considered.
Some agreements include significant financing elements. Software AG recognizes financing elements when the period of time between the transfer of purchased prod-ucts or services to the customer and payment of these products or services by the customer is at least one year.
Division of transaction price The transaction price is generally divided between the individual contractual performance obligations based on the individual sales prices. Software licenses of indefinite duration are often sold in combination with maintenance and services. In this case, when an agreement involves multiple elements, revenue recognition is based on the individually identifiable performance obligations of the transaction. Because it is impossible to calculate reliable individual sale prices for software licenses, revenue is divided among the individual revenue types using the residual method. Under the residual method, all determin-able individual sale prices are deducted from the total transaction value. The residual amount is then attributed to the elements for which no reliable individual sales prices can be determined, using list prices.
29
NOTES TO THE CONSOLIDATED INTERIM FINANCIAL STATEMENTS
GENERAL | NOTES TO THE CONSOLIDATED BALANCE SHEET | OTHER DISCLOSURES
Recognition of sales revenueSoftware AG accounts for revenue from Software as a Service based on time elapsed during the period in which the relevant services are rendered.
Software license revenues are recognized as of the date on which the customer is granted access to the software and the license period begins when access is granted. Software AG recognizes revenues for these on-premise licenses as of the date on which the customer receives access to and thus control over the software. When decid-ing whether software offerings grant customers the right to use Software AG’s intellectual property and not the right to access its intellectual property, the usefulness of its software for customers—without subsequent updates—is considered.
Maintenance revenues are recognized on a pro rata basis over the term of the maintenance contract period.
Revenue resulting from services invoiced on the basis of hours performed is recognized according to services ren-dered by a Software AG entity. Revenues and expenses from fixed-price service contracts are recognized in accor-dance with the percentage-of-completion (POC) method if Software AG’s service generates an asset that does not provide Software AG with any alternative options for use and Software AG is legally entitled to payment for services already rendered. Should Software AG’s service from a fixed-price contract generate or improve an asset and should the customer have control over the asset, the PoC method is also used for revenue recognition. The stage of completion of a contract is calculated on the basis of the percentage of total estimated contract costs incurred for work performed as of the balance sheet date. Some of the costs for making this calculation are estimated using the number of consulting hours/consulting days charged.
Incremental costs when acquiring new orders The assets that Software AG capitalizes as costs associ-ated with acquiring a new customer order consist primarily of sales employee commissions. The assets are amortized over the expected contract term using the straight-line method. Depreciation periods range from two to five years. The amortization of capitalized costs for the acquisi-tion of new orders is included in sales and marketing expenses.
Software AG recognizes incremental costs for acquiring new orders as expenses as of the date on which they are incurred when the depreciation period is not assumed to be longer than one year.
Non-derivative financial assetsSoftware AG recognizes non-derivative financial assets as of the date it acquires the contractual right to receive cash or other financial assets from another entity. Standard purchases and sales are measured at fair value as of the value date.
Subsequent measurement is carried out based on the following categories of financial assets:
a) Amortized cost (AC)
b) Fair value through profit or loss (FVPL)
c) Fair value through other comprehensive income (FVOCI)
Software AG classified its balance of equity securities as of December 31, 2017 at fair value through other compre-hensive income. Software AG generally uses the option that allows it to classify each new equity security individu-ally as FVOCI or FVPL.
Trade receivablesTrade receivables are classified based on the business model (hold-to-collect versus hold-to-sell). Receivables which are not intended for sale and/or sale is not an option are measured at amortized cost (about 80 percent of receivable balance). Receivables available for sale are measured using fair value through profit or loss (FVPL) (about 20 percent of the receivable balance).
Software AG applies a simplified impairment model based on an impairment matrix. This impairment matrix is based primarily on historical data on credit losses and current data on receivables overdue.
Furthermore, outstanding receivables are monitored on an ongoing basis at local and central levels to determine if the relevant receivables show any objective indications of jeopardized creditworthiness. If, using this approach, Software AG arrives at the assumption that realization of a receivable is improbable, the relevant receivables are writ-ten down in part or in whole based on the values in the impairment matrix.
SOFTWARE AG | 2018 HALF-YEAR REPORT
30
Derivative financial instruments If derivative financial instruments are financial assets or financial liabilities in accordance with IFRS 9, they are rec-ognized at fair value. Instruments for which hedge accounting is not applied are classified as FVPL. Changes in the fair value of the instruments are recognized directly in profit or loss.
If the criteria for hedge accounting in accordance with IFRS 9 are met, the derivative financial instrument is desig-nated as a hedging instrument and accounted for pursu-ant to the hedge accounting provisions of IFRS 9.
Accordingly, in the case of cash flow hedges, the effective portion of changes in the fair value of derivatives is recog-nized directly in equity. The ineffective portion is recog-nized directly in profit or loss. Cumulative amounts previ-ously recognized in equity are reclassified to the income statement for the fiscal years in which the hedged item affects profit or loss.
The Company did not recognize any fair value hedges.
If derivative financial instruments are equity instruments in accordance with IAS 32, they are reported as equity. Accordingly, paid premiums for acquired call options that entitle Software AG to buy back a set number of treasury shares for a set amount are deducted from equity.
All hedge accounting relationships as of December 31, 2017 continued to meet the hedge accounting require-ments set forth by IFRS 9.
Non-derivative financial liabilitiesIn accordance with IFRS 9, Software AG classifies non-de-rivative financial liabilities at amortized cost (AC) or at fair value through profit or loss (FVPL).
Subsequent measurement of financial liabilities classified at AC is carried out using the effective interest rate.
Financial liabilities are derecognized when the contractual obligation has been settled, canceled or has expired.
New accounting rules applied in the fiscal year
The IASB published IFRS 15, “Revenue from Contracts with Customers,” in May 2014. IFRS 15 replaces IAS 11 “Production Orders” and IAS 18 “Revenue Income” and the corresponding interpretations. According to the new standard, revenue recognition should reflect the transfer of promised goods or services to a customer as the amount of the consideration that the company expects to receive in exchange for these goods or services. Revenue is recognized when the customer receives power of con-trol over the goods or services. Furthermore, IFRS 15 includes requirements on disclosing assets or liabilities from contracts with customers depending on the relation-ship between the service rendered by the company and payment made by the customer. In addition, the new stan-dard requires disclosure of various quantitative and quali-tative data that enable users of the consolidated financial statements to understand the type, the amount, the tim-ing and possible uncertainty of revenues and cash flows from contracts with customers. In September 2015 the IASB decided to postpone the date of first-time applica-tion of the standard to fiscal years that begin on or after January 1, 2018; early application was permitted. In April 2016 a number of clarifications to IFRS 15 were published, in particular with regard to identifying separate contrac-tual obligations, differentiating between principal and agent and recognizing licensing income. These clarifica-tions were published on November 9, 2017 in the Official Journal of the European Union; IFRS 15 and the amend-ment to IFRS 15 on postponement of the date of first-time application were published on October 29, 2016 in the Official Journal of the European Union.
Software AG analyzed the rules of IFRS 15 and depicted how they will impact its business model. The relevant departments of the Company (Business & Sales Manage-ment, Finance, Product Management) received in-depth training and instruction.
Software AG did not exercise the option of early applica-tion before fiscal year 2018. In addition to complete retrospective application of IFRS 15, the standard permits modified retrospective application. The standard will be applied only after the date of first-time application so that periods being compared do not need to be adjusted ret-rospectively, with the exception of adjustments to equity. It that case, as of the date of first application, a company must balance only those contracts that, pursuant to the current accounting principles, have not yet expired prior to the date of first application in accordance with the new rules. Software AG applied the standard using a modified retrospective method starting January 1, 2018.
31
NOTES TO THE CONSOLIDATED INTERIM FINANCIAL STATEMENTS
GENERAL | NOTES TO THE CONSOLIDATED BALANCE SHEET | OTHER DISCLOSURES
The IASB published the final version of IFRS 9 “Financing Instruments” in July 2014, which replaces all previous versions and concludes the project to replace IAS 39 “Financing Instruments.” IFRS 9 is introducing a uniform approach for classification and measurement of financial assets. The standard uses cash flow characteristics and the business model by which they are managed as its refer-ence. It is also introducing a new impairment model that is based on expected loan defaults. Furthermore, IFRS 9 contains new rules for hedge accounting.
Software AG will adopt IFRS 9 on January 1, 2018 when it takes effect. Software AG is exercising its right to optional exceptions to rules regarding complete retrospective application and will show the effects of the first-time appli-cation as an adjustment to the initial balance of retained earnings.
Effects of application of IFRS 15
The findings of an in-depth impact analysis show that IFRS 15 requires a new way of determining the point in time at which sales revenue for some contractual obligations is recognized. The effects of first-time application of IFRS 15 described below do not account for deferred taxes. According to rules in effect until 2017, income from tem-porary licenses resembling a transfer of use in nature (leas-ing licenses and subscriptions) was recognized in install-ments during the period of use. According to IFRS 15, revenue allocated to the license portion is recognized at the beginning of the transfer of use. This aspect of appli-cation of IFRS 15 resulted in a positive conversion effect recognized in equity as of January 1, 2018 in the amount of €717 thousand; deferred income decreased by the cor-responding amount. This value refers to the license por-tion of licenses and subscriptions, which, according to previous revenue recognition policies, was to be recog-nized in subsequent periods, and which, pursuant to IFRS 15, must be allocated in whole at the time of transfer of use. This license revenue will therefore not be reported as revenues in the Consolidated Income Statement in subse-quent periods (so called “black hole”). License revenue reported for the first half of the year went down accord-ingly by €255 thousand.
IFRS 15 requires license revenue from leasing licenses and subscriptions to be recognized as of the beginning of the transfer of use. Previously applied reporting policies required it to be recognized over the period of use.
Software AG utilized the transition to new reporting poli-cies to better address the recent change in customer behavior. It drew up significantly more subscription-based (OPEX) agreements than unlimited transfer of use (CAPEX) agreements. As discussed above, the contractual license percentages must be recognized immediately in these types of agreements so that the date of revenue recognition is not affected. Due to this approach, Software AG expects to be able to close deals faster and achieve higher cash flows from the customer base. The Company signed license revenue subscription agree-ments totaling €5,784 thousand in the first half of 2018.
According to the accounting methods used until 2017, the revenue portion attributable to software licenses in a multi-component transaction was regularly determined using the residual method. Under the residual method, all determinable market values were deducted from the total transaction value. Some agreements offered customers options to purchase future services. According to IFRS 15, these options represent a substantive right to which a separate value must be assigned. Application of IFRS 15 resulted in a negative conversion effect recognized in equity in the amount of €5,304 thousand as of January 1, 2018; deferred income increased accordingly. This conver-sion effect will be recognized as maintenance revenue over the assumed term of the substantive right in subse-quent years. Of that amount, €622 thousand will be attributed to the first six months of the current fiscal year.
Some of Software AG’s agreements grant customers rights of use for a limited period of time. When such a contract is renewed, the customer’s temporary rights of use are extended. According to accounting methods in effect until 2017, the resulting license revenue could be recognized before the period of renewal began. According to IFRS 15 license revenue cannot be recognized before the period of renewal has begun. Application of IFRS 15 resulted in a negative conversion effect recognized in equity in the amount of €4,581 thousand as of January 1, 2018; deferred income increased accordingly. This conversion effect had to be recognized as license revenue in the first half of the year.
SOFTWARE AG | 2018 HALF-YEAR REPORT
32

When determining the transaction price for an individual contract, IFRS 15 requires an estimate of the amount of variable considerations. First-time application of this approach in accordance with IFRS 15 resulted in a decrease in license revenue of €2,896 thousand, in maintenance revenue of €871 thousand and in service revenue of €455 thousand in the first half of 2018; trade receivables went down accordingly.
The total impact of adoption of IFRS 15 on DBP product revenue was €9,204 thousand in the first half of 2018. The majority of this amount relates to the conversion of licens-ing structures and the associated go-to-market activities focusing more intensively on OPEX. This proactive adapta-tion of contract modalities would not have happened without the adoption of IFRS 15. The aforementioned figure is therefore a theoretical IFRS 15-induced amount of no economic significance. Had Software AG applied IFRS 15 last fiscal year as well as this fiscal year, DBP product revenue would have increased by a similar total rate with the change in reporting policies from IAS 18 to IFRS 15 as presented in this report.
The impact of adoption of IFRS 15 on A&N product reve-nue was –€2,239 thousand in the first half of 2018.
Pursuant to IFRS 15, costs incurred from acquiring new orders must be capitalized and then amortized subse-quently. Software AG did not capitalize costs related to new orders until 2018. Application of IFRS 15 resulted in a positive conversion effect recognized in equity as of January 1, 2018 in the amount of €4,294 thousand due to capitalization of costs from new orders; other non-finan-cial assets increased accordingly. Sales and marketing expenses are recognized in the income statement in that amount as of January 1, 2018.
Operating expenses went down by €215 thousand due to the reduction of sales and marketing expenses in the first half of 2018. This resulted from capitalization of sales com-missions as non-financial assets less amortization of the capitalized amounts.
The total impact of the aforementioned effects on earn-ings in the first half of 2018 was €6,725 thousand. This figure was due mainly to the IRFS-related earnings dis-cussed above from the conversion of the go-to-market model, which would not have resulted without the adop-tion of IFRS 15. Therefore, this amount is also specific to the IFRS approach and of no economic significance.
Effects of application of IFRS 9
Software AG was able to retain the existing classification for the majority of its financial assets. There are thus no significant effects from the changed classification or sub-sequent valuation.
An analysis of past defaults on trade receivables and the resulting impairment matrix shows that trade receivables decreased by €154 thousand as of January 1, 2018; the corresponding negative effect was recognized in equity. Under classification of trade receivables based on business model (hold-to-collect versus hold-to-sell), approximately 80 percent of receivables are classified as AC and approxi-mately 20 percent as FVPL.
Because all hedge accounting relationships as of Decem-ber 31, 2017 met the requirements of hedge accounting in accordance with IFRS 9, there were no resulting effects.
Software AG therefore considers the effects of first-time application of IFRS 9 and the consequences described above to be insignificant to its consolidated financial statements.
33
NOTES TO THE CONSOLIDATED INTERIM FINANCIAL STATEMENTS
GENERAL | NOTES TO THE CONSOLIDATED BALANCE SHEET | OTHER DISCLOSURES
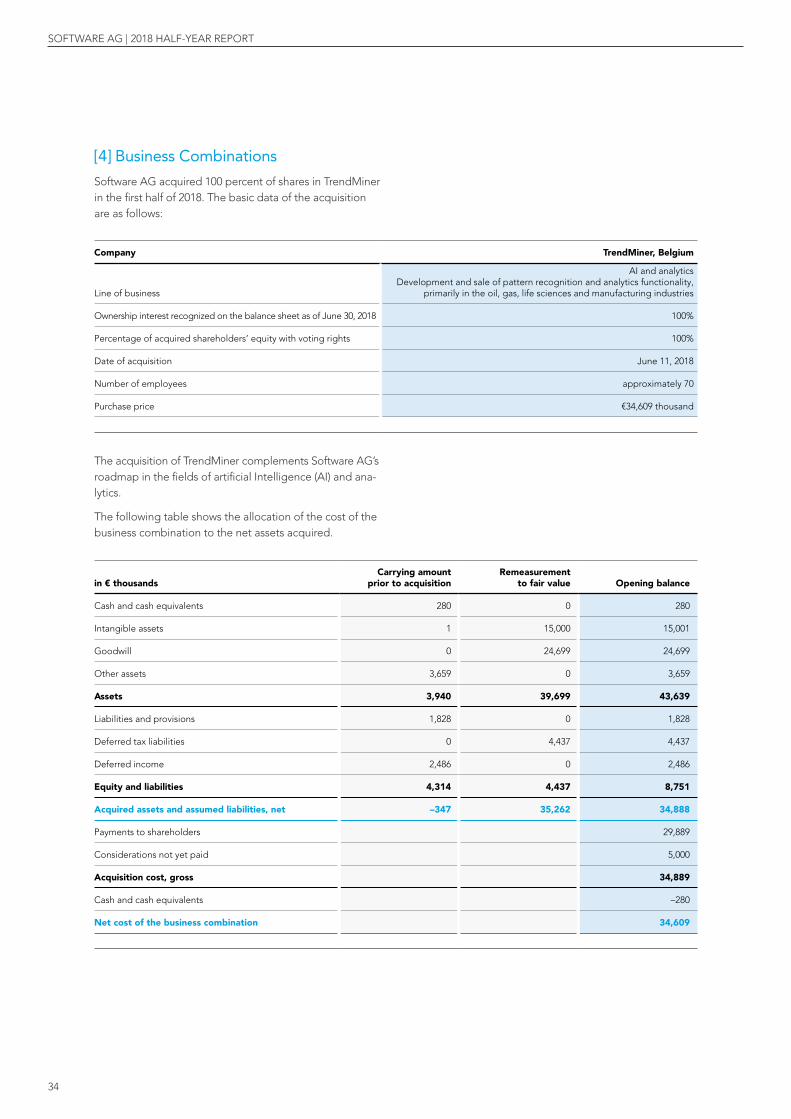
[4] Business CombinationsSoftware AG acquired 100 percent of shares in TrendMiner in the first half of 2018. The basic data of the acquisition are as follows:
in € thousandsCarrying amount
prior to acquisition Remeasurement
to fair value Opening balance
Cash and cash equivalents 280 0 280
Intangible assets 1 15,000 15,001
Goodwill 0 24,699 24,699
Other assets 3,659 0 3,659
Assets 3,940 39,699 43,639
Liabilities and provisions 1,828 0 1,828
Deferred tax liabilities 0 4,437 4,437
Deferred income 2,486 0 2,486
Equity and liabilities 4,314 4,437 8,751
Acquired assets and assumed liabilities, net –347 35,262 34,888
Payments to shareholders 29,889
Considerations not yet paid 5,000
Acquisition cost, gross 34,889
Cash and cash equivalents –280
Net cost of the business combination 34,609
The acquisition of TrendMiner complements Software AG’s roadmap in the fields of artificial Intelligence (AI) and ana-lytics.
The following table shows the allocation of the cost of the business combination to the net assets acquired.
Company TrendMiner, Belgium
Line of business
AI and analytics Development and sale of pattern recognition and analytics functionality,
primarily in the oil, gas, life sciences and manufacturing industries
Ownership interest recognized on the balance sheet as of June 30, 2018 100%
Percentage of acquired shareholders’ equity with voting rights 100%
Date of acquisition June 11, 2018
Number of employees approximately 70
Purchase price €34,609 thousand
SOFTWARE AG | 2018 HALF-YEAR REPORT
34

The full amount of goodwill resulting from the preliminary purchase price allocation was assigned to the Digital Busi-ness Platform segment.
The recognition of goodwill resulted mainly from the fact that synergies and staff are not separable intangible assets within the meaning of IAS 38. The goodwill arising from this acquisition is not likely to be tax deductible.
The earnings of TrendMiner were included in the consoli-dated income statement as of the date of acquisition.
Since the acquisition, about €0.1 million of Software AG’s Group revenue and –€0.5 million of Group earnings have resulted from TrendMiner.
Providing fictitious amounts for Group revenue and net income for the fiscal year calculated under the assumption that TrendMiner had been acquired at the beginning of the year is not possible with the information available.
NOTES TO THE CONSOLIDATED BALANCE SHEET[5] Intangible Assets/GoodwillGoodwill amounted to €953,256 thousand as of June 30, 2018, an increase of €31,841 thousand compared to December 31, 2017. This increase is a result of €24,699 from the initial consolidation of TrendMiner N.V. and €7,142 from positive exchange rate changes.
[6] Equity
Share capital
As of June 30, 2018, Software AG’s share capital totaled €74,000 thousand (Dec. 31, 2017: €76,400 thousand). Software AG’s share capital is divided into 74,000,000 (Dec. 31, 2017: 76,400,000) registered shares. Each share entitles its holder to one vote.
As of June 30, 2018 Software AG held 20,111 (Dec. 31, 2017: 2,423,761) treasury shares representing an interest of €20,111 (Dec. 31, 2017: €2,423,761) or 0.03 percent (2017: 3.2 percent) of the share capital.
Pursuant to the Annual Shareholders’ Meeting resolution from May 31, 2016, the Company is authorized until May 30, 2021 to purchase Software AG shares totaling a maxi-mum of 10 percent of the share capital at the time of the resolution. The shares purchased, together with other treasury shares that the Company has already purchased and still holds or that are attributable to it in accordance with sections 71d and 71e of the German Stock Corpora-tion Act, may not account for more than 10 percent of the respective share capital at any time.
Dividend
Pursuant to the proposal of the Management Board and the Supervisory Board, the Annual Shareholders’ Meeting resolved on May 30, 2018 to appropriate €48,085 thousand (2017: €44,343 thousand) for a dividend payout from the net retained profits of €83,914 thousand reported by Software AG, the controlling Group company, in 2017. This corresponded to a dividend of €0.65 (2017: €0.60) per share. A total amount of €35,829 thousand (2017: €94,754 thousand) was carried forward.
Acquisition of treasury shares
At the beginning of the reporting period Software AG held 2,423,761 treasury shares representing €2,423,761 or 3.2 percent of the share capital.
Software AG’s balance of treasury shares changed as follows in fiscal 2017:
Date/period No. of shares Reason for change
Jan. 1, 2018 2,423,761
Q1 2018 –2,400,000Redemption and capital decrease
Q2 2018 –3,650Used for settling share-based plans (MIP III)
June 30, 2018 20,111
35
NOTES TO THE CONSOLIDATED INTERIM FINANCIAL STATEMENTS
GENERAL | NOTES TO THE CONSOLIDATED BALANCE SHEET | OTHER DISCLOSURES

OTHER DISCLOSURES
[7] Segment ReportingSegmentation is in accordance with the internal control of the Group. Internal control focuses primarily on product revenue at constant currency for the two product seg-ments. Margins and earnings are controlled largely at Group level. Of considerably less importance are the seg-ments’ contributions and earnings at secondary level of control. Software AG therefore reports on the following three segments:
• Digital Business Platform (including Cloud & IoT) (DBP: integration, business process management and big data with the webMethods, ARIS, Alfabet, Apama, Terracotta, Cumulocity, TrendMiner, etc. product families)
• Adabas & Natural (A&N: data management with the Adabas-Natural products)
• Consulting (implementation of Software AG products)
Segment report for the six months ended June 30, 2018
Digital Business Platform(DBP including Cloud & IoT)
Adabas & Natural(A&N) Consulting Reconciliation Total
in € thousandsHY1 2018
IFRSHY1 2018
acc 1HY1 2017
IFRS 2, 3HY1 2018
IFRSHY1 2018
acc 1HY1 2017
IFRS 2HY1 2018
IFRSHY1 2018
acc 1HY1 2017
IFRS 2, 3HY1 2018
IFRSHY1 2017
IFRSHY1 2018
IFRSHY1 2018
acc 1HY1 2017
IFRS 2
Licenses 61,099 64,877 71,151 26,537 27,862 21,062 0 0 0 0 0 87,636 92,739 92,213
Maintenance 133,696 142,568 135,004 70,472 76,459 78,948 0 0 0 0 0 204,168 219,027 213,952
SaaS 8,062 8,434 4,065 0 0 0 0 0 0 0 0 8,062 8,434 4,065
Product revenue 202,857 215,879 210,220 97,009 104,321 100,010 0 0 0 0 0 299,866 320,200 310,230
Services 0 0 0 0 0 0 92,100 95,670 102,708 0 0 92,100 95,670 102,708
Other 41 46 30 323 324 334 4 4 20 0 0 368 374 384
Total revenue 202,898 215,925 210,250 97,332 104,645 100,344 92,104 95,674 102,728 0 0 392,334 416,244 413,322
Cost of sales –17,704 –18,541 –14,360 –2,679 –2,917 –4,819 –73,506 –76,281 –80,300 –3,987 –7,185 –97,876 –106,664
Gross profit 185,194 197,384 195,890 94,653 101,728 95,525 18,598 19,393 22,428 –3,987 –7,185 294,458 306,658
Sales, marketing and distribution expenses –80,847 –85,860 –86,670 –14,458 –14,928 –16,076 –8,637 –9,104 –9,890 –6,520 –9,067 –110,462 –121,703
Segment contribution 104,347 111,524 109,220 80,195 86,800 79,449 9,961 10,289 12,538 –10,507 –16,252 183,996 184,955
Research and development expenses –46,867 –48,811 –48,654 –11,511 –11,600 –12,001 0 0 0 0 0 –58,378 –60,655
Segment earnings 57,480 62,713 60,566 68,684 75,200 67,448 9,961 10,289 12,538 –10,507 –16,252 125,618 124,300
General and administrative expenses –35,029 –38,006
Other taxes –3,212 –3,738
Operating earnings 87,377 82,556
Other operating income/expenses, net 3,685 3,323
Net financial income/expenses 2,087 –23
Earnings before income taxes 93,149 85,856
Income taxes –27,375 –27,270
Net income 65,774 58,586
1 acc = At constant currency2 To improve the informative value of its financial statements—particularly regarding earnings performance—Software AG restructured the
revenue section of its income statement as of January 1, 2018. Accordingly, revenue from Software as a Service (SaaS) contracts is reported separately. Figures from 2017 were adjusted to reflect the new presentation structure.
3 As part of the change described above, segment assignment was also adjusted. Revenue from managed service agreements previously recognized in the Consulting segment is now shown in the DBP segment as Cloud & IoT revenue. The corresponding expenses were reallocated accordingly. Figures from 2017 were adjusted to reflect the new presentation structure.
SOFTWARE AG | 2018 HALF-YEAR REPORT
36

Segment report for the six months ended June 30, 2018
Digital Business Platform(DBP including Cloud & IoT)
Adabas & Natural(A&N) Consulting Reconciliation Total
in € thousandsHY1 2018
IFRSHY1 2018
acc 1HY1 2017
IFRS 2, 3HY1 2018
IFRSHY1 2018
acc 1HY1 2017
IFRS 2HY1 2018
IFRSHY1 2018
acc 1HY1 2017
IFRS 2, 3HY1 2018
IFRSHY1 2017
IFRSHY1 2018
IFRSHY1 2018
acc 1HY1 2017
IFRS 2
Licenses 61,099 64,877 71,151 26,537 27,862 21,062 0 0 0 0 0 87,636 92,739 92,213
Maintenance 133,696 142,568 135,004 70,472 76,459 78,948 0 0 0 0 0 204,168 219,027 213,952
SaaS 8,062 8,434 4,065 0 0 0 0 0 0 0 0 8,062 8,434 4,065
Product revenue 202,857 215,879 210,220 97,009 104,321 100,010 0 0 0 0 0 299,866 320,200 310,230
Services 0 0 0 0 0 0 92,100 95,670 102,708 0 0 92,100 95,670 102,708
Other 41 46 30 323 324 334 4 4 20 0 0 368 374 384
Total revenue 202,898 215,925 210,250 97,332 104,645 100,344 92,104 95,674 102,728 0 0 392,334 416,244 413,322
Cost of sales –17,704 –18,541 –14,360 –2,679 –2,917 –4,819 –73,506 –76,281 –80,300 –3,987 –7,185 –97,876 –106,664
Gross profit 185,194 197,384 195,890 94,653 101,728 95,525 18,598 19,393 22,428 –3,987 –7,185 294,458 306,658
Sales, marketing and distribution expenses –80,847 –85,860 –86,670 –14,458 –14,928 –16,076 –8,637 –9,104 –9,890 –6,520 –9,067 –110,462 –121,703
Segment contribution 104,347 111,524 109,220 80,195 86,800 79,449 9,961 10,289 12,538 –10,507 –16,252 183,996 184,955
Research and development expenses –46,867 –48,811 –48,654 –11,511 –11,600 –12,001 0 0 0 0 0 –58,378 –60,655
Segment earnings 57,480 62,713 60,566 68,684 75,200 67,448 9,961 10,289 12,538 –10,507 –16,252 125,618 124,300
General and administrative expenses –35,029 –38,006
Other taxes –3,212 –3,738
Operating earnings 87,377 82,556
Other operating income/expenses, net 3,685 3,323
Net financial income/expenses 2,087 –23
Earnings before income taxes 93,149 85,856
Income taxes –27,375 –27,270
Net income 65,774 58,586
1 acc = At constant currency2 To improve the informative value of its financial statements—particularly regarding earnings performance—Software AG restructured the
revenue section of its income statement as of January 1, 2018. Accordingly, revenue from Software as a Service (SaaS) contracts is reported separately. Figures from 2017 were adjusted to reflect the new presentation structure.
3 As part of the change described above, segment assignment was also adjusted. Revenue from managed service agreements previously recognized in the Consulting segment is now shown in the DBP segment as Cloud & IoT revenue. The corresponding expenses were reallocated accordingly. Figures from 2017 were adjusted to reflect the new presentation structure.
The segment contribution does not include the amortiza-tion expense associated with acquisitions of intangible assets. These charges are therefore shown separately under reconciliation. This presentation corresponds with internal control and reporting lines (management approach). The majority of sales and marketing expenses are classified based on revenue percentage. A focus on absolute earnings contributions therefore only makes sense in certain scenarios given the interdependency between the two product segments. Research and devel-
opment expenses are assigned to the segments based on expense components directly attributable to the R&D department as well as the overhead coded to R&D. They have no direct impact on internal management.
The table below shows the segment data for the first half of 2018:
37
NOTES TO THE CONSOLIDATED INTERIM FINANCIAL STATEMENTS
GENERAL | NOTES TO THE CONSOLIDATED BALANCE SHEET | OTHER DISCLOSURES

[8] Contingent Liabilities The carrying amount of collateral received was €319 thou-sand (2017: €83 thousand).
Disclosures on leases
The Group’s rental agreements and operating leases relate chiefly to office space, vehicles and IT equipment. Lease payments under operating leases are recognized as an expense over the term of the lease.
The following contractually agreed payments existed as of June 30, 2018:
in € thousands Up to 1 year >1 to 5 years > 5 years Total
Contractually agreed payments 9,980 42,602 1,451 54,033
Estimated income from subleases 340 2,365 0 2,705
DBP segment with revenue distribution for the six months ended June 30, 2018 (IFRS)
DBP Cloud & IoTDigital Business Platform
(DBP not including Cloud & IoT)Digital Business Platform
(DBP including Cloud & IoT)
in € thousandsHY1 2018
IFRSHY1 2018
acc 1HY1 2017
IFRS 2HY1 2018
IFRSHY1 2018
acc 1HY1 2017
IFRS 2HY1 2018
IFRSHY1 2018
acc 1HY1 2017
IFRS 2
Licenses 1,993 2,035 1,333 59,106 62,842 69,818 61,099 64,877 71,151
Maintenance 1,575 1,610 1,038 132,121 140,958 133,966 133,696 142,568 135,004
SaaS 8,062 8,434 4,065 0 0 0 8,062 8,434 4,065
Product revenue 11,630 12,079 6,436 191,227 203,800 203,784 202,857 215,879 210,220
Services 0 0 0 0 0 0 0 0 0
Other 0 0 0 41 46 30 41 46 30
Total revenue 11,630 12,079 6,436 191,268 203,846 203,814 202,898 215,925 210,250
Cost of sales –17,704 –18,541 –14,360
Gross profit 185,194 197,384 195,890
Sales, marketing and distribution expenses –80,847 –85,860 –86,670
Segment contribution 104,347 111,524 109,220
Research and develop-ment expenses –46,867 –48,811 –48,654
Segment earnings 57,480 62,713 60,566
1 acc = At constant currency2 To improve the informative value of its financial statements—earnings performance in particular—Software AG changed the structure of the
revenues section of its income statement as of January 1, 2018. Accordingly, revenue from Software as a Service (SaaS) contracts is reported separately. Figures from 2017 were adjusted to reflect the new presentation structure.
SOFTWARE AG | 2018 HALF-YEAR REPORT
38

The following contractually agreed payments existed as of June 30, 2017:
in € thousands Up to 1 year >1 to 5 years > 5 years Total
Contractually agreed payments 9,477 40,864 4,531 54,872
Estimated income from subleases 341 1,138 0 1,479
[9] Seasonal Influences Revenues and pre-tax earnings were distributed over fiscal year 2017 as follows:
in € thousands Q1 2017 Q2 2017 Q3 2017 Q4 2017 2017
License revenue 46,253 48,913 46,221 115,342 256,729
as % of license revenue for the year 18 19 18 45 100
Total revenue 205,939 207,382 197,283 268,379 878,983
as % of revenue for the year 23 24 22 31 100
Earnings before taxes 39,379 46,447 48,486 82,743 217,055
as % of earnings for the year 18 22 22 38 100
Based on historical data, the revenue and earnings distri-bution from 2017 is not fully representative. The distribu-tion of revenue and earnings is regularly affected by large individual deals and is thus difficult to predict.
The following graph illustrates the development of license revenues in 2017 and 2016.
License revenue in 2017 and 2016
Q1 Q2 Q3 Q4
18 19 18
45
22 19 18
41
as % of total annual license revenue
Distribution in 2017 Distribution in 2016
39
NOTES TO THE CONSOLIDATED INTERIM FINANCIAL STATEMENTS
GENERAL | NOTES TO THE CONSOLIDATED BALANCE SHEET | OTHER DISCLOSURES

[10] Litigation In February 2010, a software company in Virginia, USA sued Software AG together with 11 additional defendants, including IBM and SAP, for infringement of several of its software patents. The lawsuit was filed with a court in Vir-ginia. By order of the court, the proceedings were sus-pended for Software AG and all other defendants except for one, which was actively pursued. The court dismissed the case to set a precedent, upon which the plaintiff filed an appeal. The court of appeals rejected the appeal in January 2012. In response to further legal action brought by the plaintiff, the appellate court partially acknowledged the case and partially referred it back to the court of first instance in October 2013. In September 2014 the court ordered for proceedings to remain suspended until the U.S. Patent Office makes a decision regarding its review of the patents in question, which was initiated by the defen-dants. In summary proceedings in May 2015, the court decided in favor of one defendant; the plaintiff filed an appeal against the decision and won in part, which was reported by the plaintiff on August 18, 2016. After the original judge withdrew herself from the case, a new judge was assigned. The U.S. Patent Office has since confirmed a decision relating to the invalidity of a TecSec patent. The proceedings are still pending for Software AG.
A number of legal actions have been have been filed with the Regional Court of Saarbrücken in connection with the control and profit transfer agreement with IDS Scheer AG. In these proceedings, the petitioners are seeking an increase in their cash settlements and annual compensa-tory payments. Software AG considers the objections as to valuation to be groundless. In response to the court’s order to hear evidence issued in September 2013, Warth & Klein GmbH Wirtschafsprüfungsgesellschaft provided a written opinion on questions concerning valuation in the capacity of expert auditor in July 2014. A hearing was held in the Regional Court of Saarbrücken on February 21, 2018. The Regional Court of Saarbrücken ruled on June 6, 2018 to reject the plaintiff’s appeal. Multiple plaintiffs filed complaints against this decision within the appeal period.
In connection with the merger of IDS Scheer AG and Software AG, a large number of legal challenges were filed with Regional Court of Saarbrücken, in which the plaintiffs seek a legal review of the set exchange ratio and cash compensation. Software AG considers the objections as to valuation to be groundless. In its decision of March 15, 2013, the Regional Court of Saarbrücken determined that the market value ratio method be employed for valuation and that cash compensation in the amount of €7.22 for every share held by outside shareholders be paid. This could result in a maximum risk of approximately €7.6 mil-lion. Software AG appealed the decision. The court-or-dered expert witness submitted a report in the third quar-ter of 2017. Software AG presented a detailed opinion on the report in the fourth quarter of 2017. The court resolved on January 12, 2018 that the expert witness must appear for a hearing to explain the report and add to it prior to the appointment. The date has not yet been scheduled. Provisions are set up based on the estimated probable actual resource outflow.
The Spanish cartel authority (Comisión Nacional de los Mercados y la Competencia [CNMC]) searched the offices of Software AG España, S.A. Unipersonal (Software AG Spain) on October 28 and 29, 2015 for suspicion of an inadmissible anti-competitive agreement. On April 25, 2016 the Spanish cartel authority (CNMC) published on its website that it was initiating antitrust proceedings against 11 companies, including Software AG Spain. CNMC extended the case to three additional companies on October 19, 2017. CNMC is accusing Software AG Spain of inadmissible price fixing and “covert tenders.” Software AG rejects the accusations and has established provisions based on current estimates as to the probable actual resource outflow. Following a hearing on June 12, 2018, Software AG expects a decision by the Spanish car-tel authorities by August 8, 2018. For information on the ruling of the Spanish cartel authority on July 31, 2018, please see Note [14] Events After the Balance Sheet Date.
SOFTWARE AG | 2018 HALF-YEAR REPORT
40

Status proceedings were brought to the Regional Court of Frankfurt on the matter of a motion submitted by share-holder Erzberger to determine whether Software AG’s Supervisory Board must be constituted in accordance with the requirements of the Codetermination Act. The regional court ruled to reject the motion on December 21, 2017. The plaintiff filed a complaint against the decision on the last day of the appeal period, which it has since rescinded.
The risk evaluation for other litigation and legal risks was updated; and provisions were set up based on a new cal-culation of the probable actual resource outflow.
Provisions for litigation totaled €15,704 thousand (Dec. 31, 2017: €16,081 thousand) as of June 30, 2018. In addition, contingent liabilities in the amount of €16,604 thousand (Dec. 31, 2017: €19,593 thousand) existed. But since a resource outflow as of the balance sheet date was not probable, no provisions were set up. These are also related to specific legal disputes, for which accounting provisions were made.
[11] Stock Option Plans Software AG has various stock option plans for members of the Management Board, managers and other Group employees. All plans as of June 30, 2018 are described in detail on pages 209 – 213 of Software AG’s 2017 Annual Report.
Management Incentive Plan 2018
The rights granted under Management Incentive Plan 2018 changed as follows in the first six months of the fiscal year:
Balance as of Dec. 31, 2017 1,464,122
Granted 0
Expired –6,998
Balance as of June 30, 2018 1,457,124
Management Incentive Plan 2017
The rights granted under Management Incentive Plan 2017 changed as follows in the first six months of the fiscal year:
Balance as of Dec. 31, 2017 1,785,676
Granted 0
Expired –13,275
Balance as of June 30, 2018 1,772,401
Management Incentive Plan 2016
The rights granted under Management Incentive Plan 2016 changed as follows in the first six months of the fiscal year:
Balance as of Dec. 31, 2017 441,497
Granted 0
Expired –2,787
Balance as of June 30, 2018 438,710
41
NOTES TO THE CONSOLIDATED INTERIM FINANCIAL STATEMENTS
GENERAL | NOTES TO THE CONSOLIDATED BALANCE SHEET | OTHER DISCLOSURES

Management Incentive Plan 2007 – 2011 (MIP III)
The rights granted under Management Incentive Plan 2007 – 2011 (MIP III) changed as follows in the first six months of the fiscal year:
Number of rights outstanding
Exercise price per right in €
Weighted average remaining
Term (years)Aggregated intrinsic value (€ thousands)
Balance as of Dec. 31, 2017 12,400 24.12 1.5 282*
Expired 0
Exercised –3,650
Balance as of June 30, 2018 8,750 24.12 1.0 138*
thereof exercisable as of June 30, 2018 8,750 24.12 138*
* Based on the respective closing price
[12] Employees As of June 30, 2018, the average number of employees (part-time employees are taken into account on a pro rata basis only) by area of activity was as follows:
June 30, 2018
June 30, 2017
Maintenance and Services 1,924 1,906
Sales and Marketing 902 876
R&D 1,201 1,140
Administration 606 607
4,633 4,529
In absolute terms (part-time employees are counted in full), the Group employed 4,818 (2017: 4,701) people as of June 30, 2018.
[13] Changes and Information Regarding Corporate Bodies There were no changes on the Management Board or Supervisory Board between January 1, 2018 and June 30, 2017.
[14] Events After the Balance Sheet Date Karl-Heinz Streibich stepped down from the Management Board due to age between June 30, 2018 and the release of this half-year report. Sanjay Brahmawar commenced activities as CEO of Software AG on August 1, 2018.
In the matter of the Spanish anti-trust case, the Spanish cartel authority ruled on July 31, 2018 to impose a penalty on 11 companies including Software AG Spain. The pen-alty against Software AG Spain consists of a fine of €6,016 thousand. Software AG is currently evaluating all legal options to challenge the decision, including ways to file for temporary legal protection against the administrative act so as to avoid paying a fine before a legally binding court ruling has been made. An initial evaluation of all legal options carried out by advising independent attor-neys concludes that the fine will be due in 2019 at the earliest, if at all. Risks associated with this case are accounted for in full in the half-year statements for 2018.
SOFTWARE AG | 2018 HALF-YEAR REPORT
42

S. Brahmawar
Dr. W. Jost
A. Zinnhardt
E. Duffaut
Dr. S. Sigg
Date and authorization for issue
Software AG’s Management Board approved the consoli-dated financial statements on August 7, 2018.
Responsibility statement
To the best of our knowledge, and in accordance with the applicable reporting principles, the consolidated financial statements give a true and fair view of the assets, liabilities, financial position and profit or loss of the Group. And the Combined Management Report includes a fair review of the development and performance of the business and the position of the Company and Group, together with a description of the principal opportunities and risks associ-ated with the expected development of the Company and Group.
Darmstadt, August 7, 2018
Software AG
FINANCIAL CALENDAR For the latest information on events and roadshows, please visit: SoftwareAG.com/financialcalendar
PUBLICATION CREDITSPublisher
Software AG Corporate Communications Uhlandstraße 12 64297 Darmstadt Germany Tel. + 49 6151 92-0 Fax + 49 6151 92-1191 [email protected] SoftwareAG.com
Concept and Layout
MPM Corporate Communication Solutions, Mainz www.mpm.de
ADDITIONAL INFORMA-TION
43
FINANCIAL CALENDAR | CREDITS
ADDITIONAL INFORMATION
ContactSoftware AGCorporate Headquarters Uhlandstraße 1264297 DarmstadtGermanyTel. + 49 6151 92− 0Fax + 49 6151 92− 1191www.SoftwareAG.com