Embed Size (px)
Citation preview

SUSTAINABILITY REPORT Salar de Olaroz Lithium Facility2018
For
per
sona
l use
onl
y

Report Overview
This is Orocobre’s second Sustainability Report, covering the second full year of commercial lithium production at the Salar de Olaroz Lithium Facility (Olaroz Lithium Facility).
This report is structured to present the sustainability performance of Orocobre Limited (Orocobre or the Company) as joint venture partner and manager of the Olaroz Lithium Facility. The report has been prepared in accordance with the GRI Standards (Core), our progress with regards to the 10 principles of the UN Global Compact in Environment, Labour, Human Rights and Anti-Corruption, and our contribution to the UN Sustainable Development Goals (SDGs) as an integrated component of our core business activities.
In all we do, we seek to find ways to enhance our contribution to society through commercially beneficial programs and initiatives. As such, our reporting and performance focuses on the three core areas of our contribution:
• Sustainable Product• Efficient Operations• Local Development.
Icons will be used to indicate which UN SDGs are directly addressed by our activities and contributions.
As the development and performance of Orocobre’s Olaroz Lithium Facility remain the central focus of our investors and shareholders, we continue to focus our reporting on Sales de Jujuy S.A. (the operating company for the Olaroz Lithium Facility) and its activities.
Our material issues have been reviewed and updated based on material announcements and developments in 2018 and validated through engagement with our investors.
The data and content provided in this report covers the period 1 July 2017 to 30 June 2018. We are finalising our sustainability reporting systems and processes to ensure data consistency and reliability and will be well-positioned to seek limited report assurance in 2019.
For any questions or feedback regarding this report, please contact our Investor Relations Manager via [email protected].
Forward Looking Statements
The 2018 Orocobre Sustainability Report: Salar de Olaroz Lithium Facility contains forward looking statements, including statements regarding plans, strategies and objectives of management; operations or facilities; and regulatory developments.
Forward looking statements may be identified by the use of terminology including, but not limited to, ‘intend’, ‘aim’, ‘project’, ‘anticipate’, ‘estimate’, ‘plan’, ‘believe’, ‘expect’, ‘may’, ‘should’, ‘will’, ‘continue’ or similar words. These statements discuss future expectations or provide other forward looking information.
These forward looking statements are not guarantees or predictions of future performance and involve known and unknown risks, uncertainties and other factors, many of which are beyond our control and which may cause
actual results to differ materially from those expressed in the statements contained in this Sustainability Report.
There can be no assurance that forward looking statements will prove to be accurate, as actual results and future events could differ materially from those anticipated in such information.
Accordingly, readers should not place undue reliance on forward-looking information. Orocobre Limited does not undertake to update any forward-looking information, except in accordance with applicable securities laws.
Actual results may differ materially from those expressed in such statements as a result of a variety of factors, including our ability to profitably produce and transport products to applicable markets; the impact of foreign currency exchange rates on market prices of products that we produce; activities of government authorities in the countries where we are exploring or developing projects/facilities, including increases in taxes, changes in environmental and other regulations and political uncertainty; labour unrest; and other factors identified in the Risk Management section of the 2018 Orocobre Annual Report (see page 46).
Past performance cannot be relied on as a guide to future performance.
For details on approach, boundary and scope of this Sustainability Report, please refer to page 16.
2
For
per
sona
l use
onl
y

SDG 14 (Life Below Water) and 16 (Peace, Justice and Strong Institutions) are not included as they have no relevance within the context of our operations.
To indicate the alignment of our sustainability initiatives and disclosures with the UN SDGs, SDG icons will be posted at the top of each page to highlight the goals being covered.
98
54 6
7
13 15
10 11 12
17
21 3
No poverty
Quality education
Affordable & clean energy
Reduced inequalities
Climate action
Zero Hunger
Gender equality
Decent work & economic growth
Sustainable cities & communities
Life on land
Good health & well-being
Clean water & sanitation
Industry, innovation & infrastructure
Responsible consumption & production
Partnerships for the goals
OROCOBRE SUSTAINABILITY REPORT 2018 3
For
per
sona
l use
onl
y

OlarozGuayatayoc
Cauchari25% JV
20KM
SAN SALVADORDE JUJUY
SAN ANTONIODE LOS COBRE
OLACAPATO
SALTA
Argentina
Orocobre Limited
Orocobre Limited through its role as joint venture partner and manager of the Olaroz Lithium Facility is a dynamic global lithium chemicals supplier. Orocobre is dual listed on the Australian Securities Exchange (ASX:ORE) and the Toronto Stock Exchange (TSX:ORL) and is included in the S&P/ASX 200 Index. Orocobre lithium operations are conducted through:
Sales de Jujuy S.A.Operating company for the Olaroz Lithium Facility, a large-scale de-novo brine-based lithium project in Jujuy Province of Argentina, Sales de Jujuy (SDJ) is a joint venture (JV) between Orocobre Limited, Toyota Tsusho Corporation (TTC) and the Mining Company of the Argentina provincial government of Jujuy, Jujuy Energia y Mineria Sociedad del Estado (JEMSE).
Orocobre’s current focus is the optimisation of Stage 1, the fully funded Stage 2 Expansion at the Olaroz Lithium Facility and progressing plans for a 10,000 tonnes per annum (tpa) Lithium Hydroxide Plant to be built in Naraha, Japan.
4
For
per
sona
l use
onl
y

OROCOBRE SUSTAINABILITY REPORT 2018 5
For
per
sona
l use
onl
y

6
For
per
sona
l use
onl
y

Orocobre(Australia)
Guarantor(JOGMEC)
Toyota Tsusho (TTC)(Japan)
JEMSE(Jujuy, Argentina)
TTC is the exclusive sales agent, with Orocobre and
TTC exercising joint control over marketing, product
allocation and terms.
Holding Company — Sales de Jujuy Pte Ltd(Singapore)
Project Company — Sales de Jujuy S.A.(Jujuy, Argentina)
72.68%(SDJ S.A. 66.5%)
27.32%(SDJ S.A. 25%)
15%
91.5% (Common Share)
Lender(Mizuho)
Debt Guarantee
8.5% (Class B Share)
Sales de Jujuy
The Company’s key properties are owned and held by Argentine operating company Sales de Jujuy S.A. (ORE 66.5%) and contain those properties associated with the Olaroz Lithium Facility.
The Olaroz Lithium Facility Joint Venture is managed through the operating company, SDJ. The shareholders are Sales de Jujuy Pte Ltd (SDJ PTE) and JEMSE, a mining investment company owned by the provincial government of Jujuy, Argentina. SDJ PTE is a Singaporean company that is the JV vehicle for Orocobre and TTC.
* TTC – 15% equity holding in Orocobre
Joint Venture Structure
OROCOBRE SUSTAINABILITY REPORT 2018 7
For
per
sona
l use
onl
y

1 2 3 4
+ + + +
+ + +
Brine from bores
ReagentsSoda Ash
Evaporation Ponds Heat
Precipitate
Filter
Micronising
Heat
Ion Exchange Re-precipitate
Primary Purification Dry & Bag
Dissolve
Lithium Carbonate
CO2
Olaroz Lithium Facility
The Olaroz Lithium Facility is located in Jujuy Province in northern Argentina, approximately 230 kilometres northwest of the provincial capital city of Jujuy. The operations are at an altitude of 3,900 metres above sea level and produce lithium carbonate from the Salar de Olaroz brine resource. The Olaroz Lithium Facility is unique as it incorporates a large-scale purification circuit with the ability to produce 100% battery grade lithium carbonate on site.
8
For
per
sona
l use
onl
y

Second full year of production totaling
2yr
Gross Cash Margin of 67%, delivering
Record yearly revenue
US$148.9 millionUS$40 million
12,470 tonnes
up 5%up 24%
Record EBITDAIX of Average price received of
up 33%
per tonne, up 29% per tonne, up 39%
US$94.6 millionUS$12,578 US$8,384
Stage 2 Expansion early works program underway with new boreholes, ponds, roads and camp infrastructure
Our second full year of production
2018 was the second full year of commercial production at the Olaroz Lithium Facility.
The Olaroz Lithium Facility produces a range of highly sought-after lithium carbonate products that are sold into global markets. Demand for lithium chemicals continues to increase as the world’s consumers require high quality lithium batteries in applications that are increasingly dominated by state of the art, high performance electric vehicles (EV) and grid power storage applications at residential and commercial scale. Consumer electronics continue to provide significant underlying demand, but it is the wholesale adoption of EV technology by global auto manufacturers that will drive unprecedented growth in lithium demand over the next decade.
We are determined to meet the world’s growing demand for lithium through the sustainable development of our assets, including staged expansions of the Olaroz Lithium Facility.
In 2018 we were excited to launch an early works program for the Stage 2 Expansion which included the drilling of new boreholes and construction of new ponds, roads and camp infrastructure. On completion, the Expansion will increase overall nameplate production capacity to 42,500 tpa.
This report provides an overview of our key sustainability challenges and achievements over the past year and sets our areas for focused improvement in coming years.
OROCOBRE SUSTAINABILITY REPORT 2018 9
For
per
sona
l use
onl
y
10
For
per
sona
l use
onl
y

Contents
Value Chain Communities
People & Capability Culture
Long-Term Outlook Environment
OROCOBRE SUSTAINABILITY REPORT 2018 11
For
per
sona
l use
onl
y
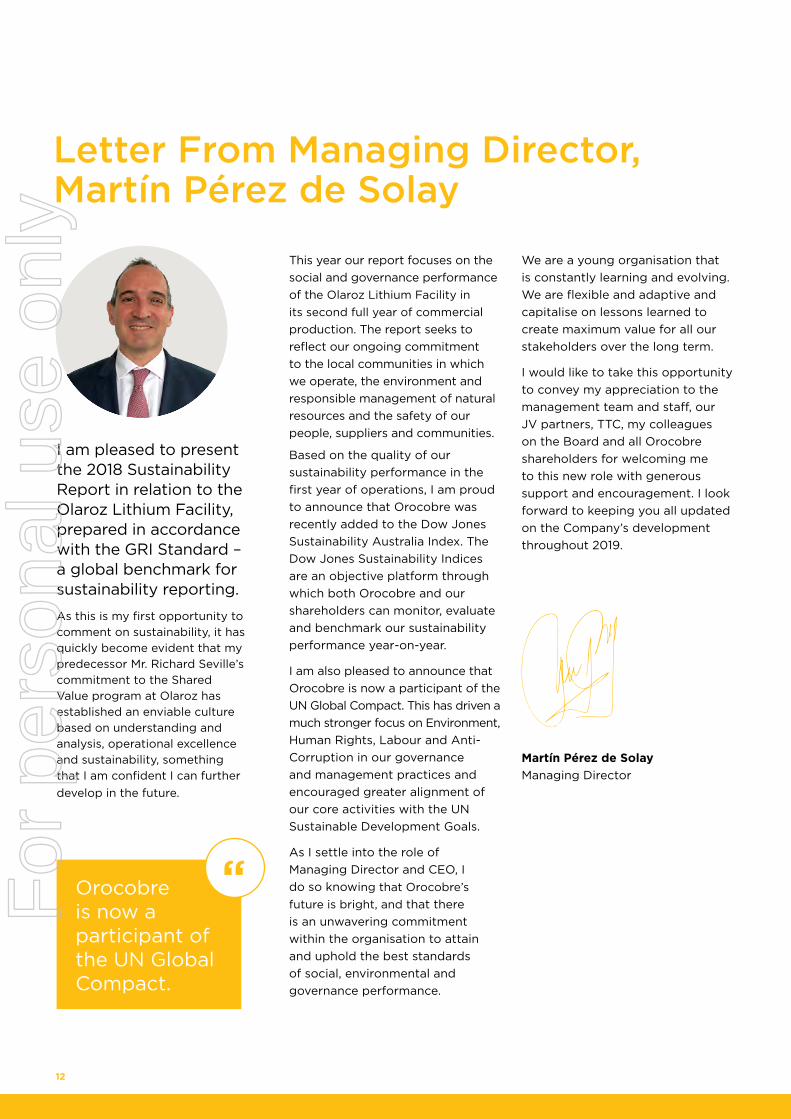
I am pleased to present the 2018 Sustainability Report in relation to the Olaroz Lithium Facility, prepared in accordance with the GRI Standard – a global benchmark for sustainability reporting.
As this is my first opportunity to comment on sustainability, it has quickly become evident that my predecessor Mr. Richard Seville’s commitment to the Shared Value program at Olaroz has established an enviable culture based on understanding and analysis, operational excellence and sustainability, something that I am confident I can further develop in the future.
This year our report focuses on the social and governance performance of the Olaroz Lithium Facility in its second full year of commercial production. The report seeks to reflect our ongoing commitment to the local communities in which we operate, the environment and responsible management of natural resources and the safety of our people, suppliers and communities.
Based on the quality of our sustainability performance in the first year of operations, I am proud to announce that Orocobre was recently added to the Dow Jones Sustainability Australia Index. The Dow Jones Sustainability Indices are an objective platform through which both Orocobre and our shareholders can monitor, evaluate and benchmark our sustainability performance year-on-year.
I am also pleased to announce that Orocobre is now a participant of the UN Global Compact. This has driven a much stronger focus on Environment, Human Rights, Labour and Anti-Corruption in our governance and management practices and encouraged greater alignment of our core activities with the UN Sustainable Development Goals.
As I settle into the role of Managing Director and CEO, I do so knowing that Orocobre’s future is bright, and that there is an unwavering commitment within the organisation to attain and uphold the best standards of social, environmental and governance performance.
We are a young organisation that is constantly learning and evolving. We are flexible and adaptive and capitalise on lessons learned to create maximum value for all our stakeholders over the long term.
I would like to take this opportunity to convey my appreciation to the management team and staff, our JV partners, TTC, my colleagues on the Board and all Orocobre shareholders for welcoming me to this new role with generous support and encouragement. I look forward to keeping you all updated on the Company’s development throughout 2019.
Orocobre is now a participant of the UN Global Compact.
“
Letter From Managing Director, Martín Pérez de Solay
Martín Pérez de Solay Managing Director
12
For
per
sona
l use
onl
y

OROCOBRE SUSTAINABILITY REPORT 2018 13
For
per
sona
l use
onl
y
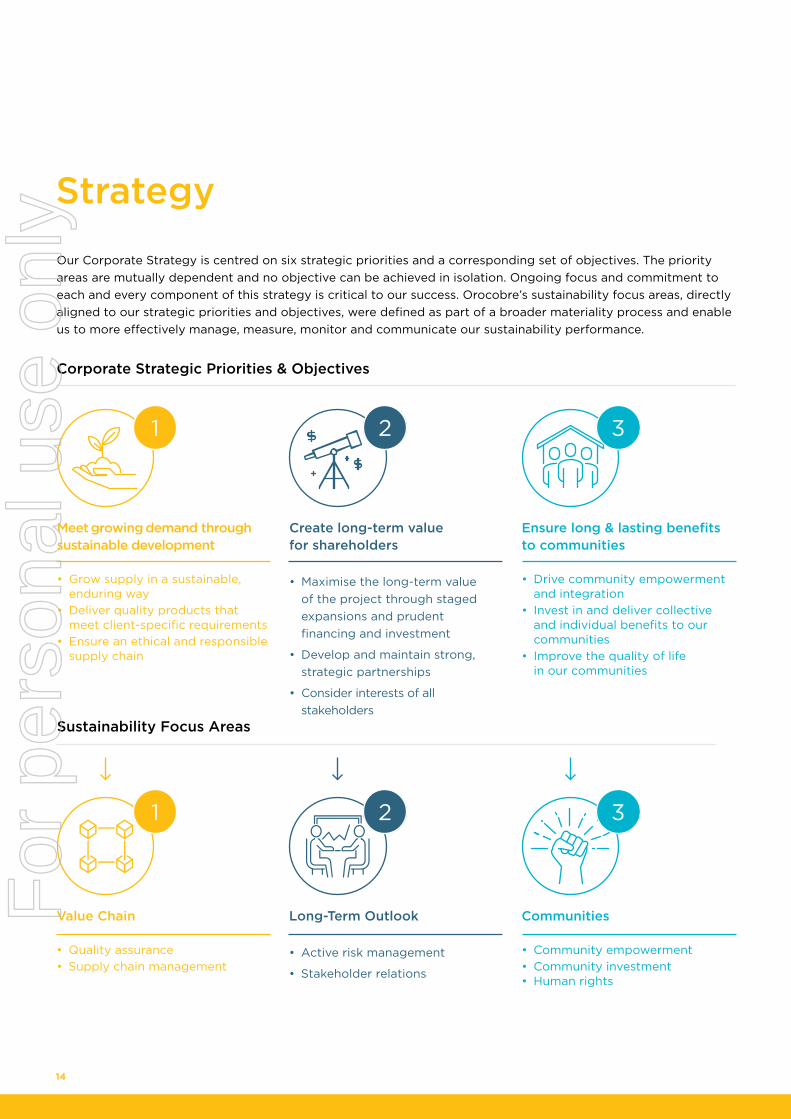
Strategy
Value Chain
• Quality assurance• Supply chain management
Long-Term Outlook
• Active risk management
• Stakeholder relations
Communities
• Community empowerment• Community investment• Human rights
Meet growing demand through sustainable development
• Grow supply in a sustainable, enduring way
• Deliver quality products that meet client-specific requirements
• Ensure an ethical and responsible supply chain
Create long-term value for shareholders
• Maximise the long-term value of the project through staged expansions and prudent financing and investment
• Develop and maintain strong, strategic partnerships
• Consider interests of all stakeholders
Ensure long & lasting benefits to communities
• Drive community empowerment and integration
• Invest in and deliver collective and individual benefits to our communities
• Improve the quality of life in our communities
1
1
2
2
3
3
Our Corporate Strategy is centred on six strategic priorities and a corresponding set of objectives. The priority areas are mutually dependent and no objective can be achieved in isolation. Ongoing focus and commitment to each and every component of this strategy is critical to our success. Orocobre’s sustainability focus areas, directly aligned to our strategic priorities and objectives, were defined as part of a broader materiality process and enable us to more effectively manage, measure, monitor and communicate our sustainability performance.
Sustainability Focus Areas
Corporate Strategic Priorities & Objectives
14
For
per
sona
l use
onl
y
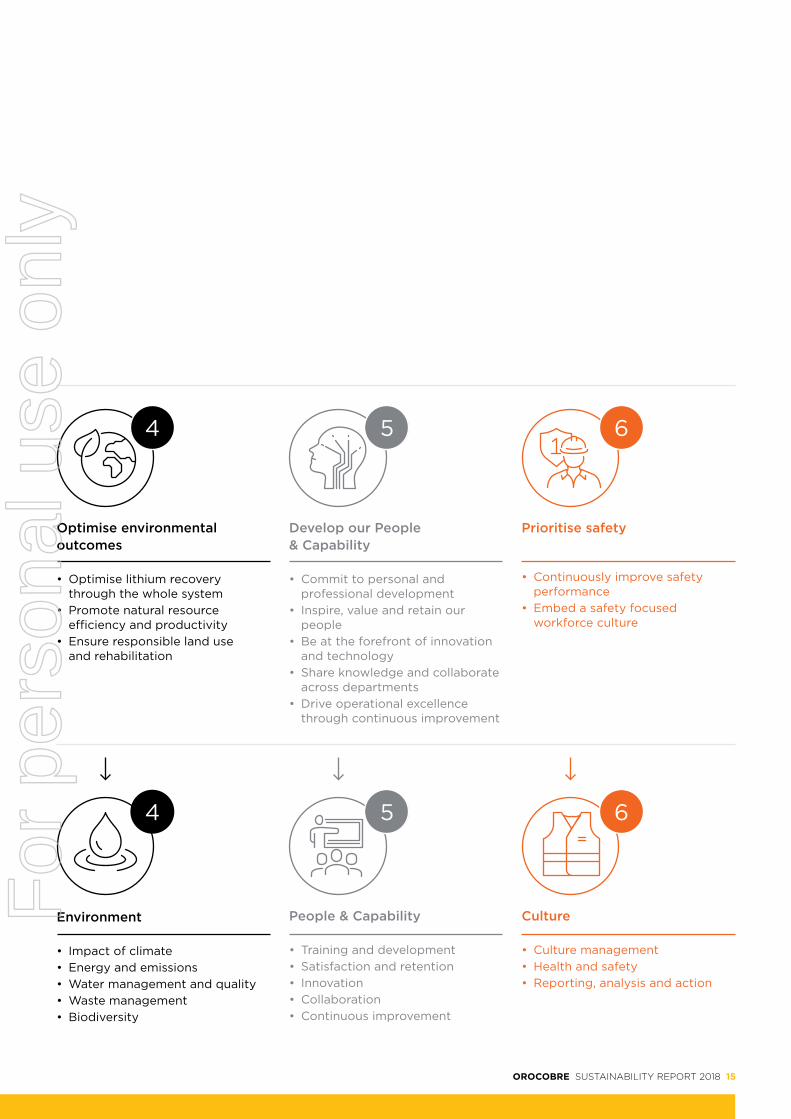
Environment
• Impact of climate• Energy and emissions• Water management and quality• Waste management• Biodiversity
People & Capability
• Training and development• Satisfaction and retention• Innovation• Collaboration• Continuous improvement
Culture
• Culture management• Health and safety• Reporting, analysis and action
Optimise environmental outcomes
• Optimise lithium recovery through the whole system
• Promote natural resource efficiency and productivity
• Ensure responsible land use and rehabilitation
Develop our People & Capability
• Commit to personal and professional development
• Inspire, value and retain our people
• Be at the forefront of innovation and technology
• Share knowledge and collaborate across departments
• Drive operational excellence through continuous improvement
Prioritise safety
• Continuously improve safety performance
• Embed a safety focused workforce culture
4
4
5
5
6
6
OROCOBRE SUSTAINABILITY REPORT 2018 15
For
per
sona
l use
onl
y
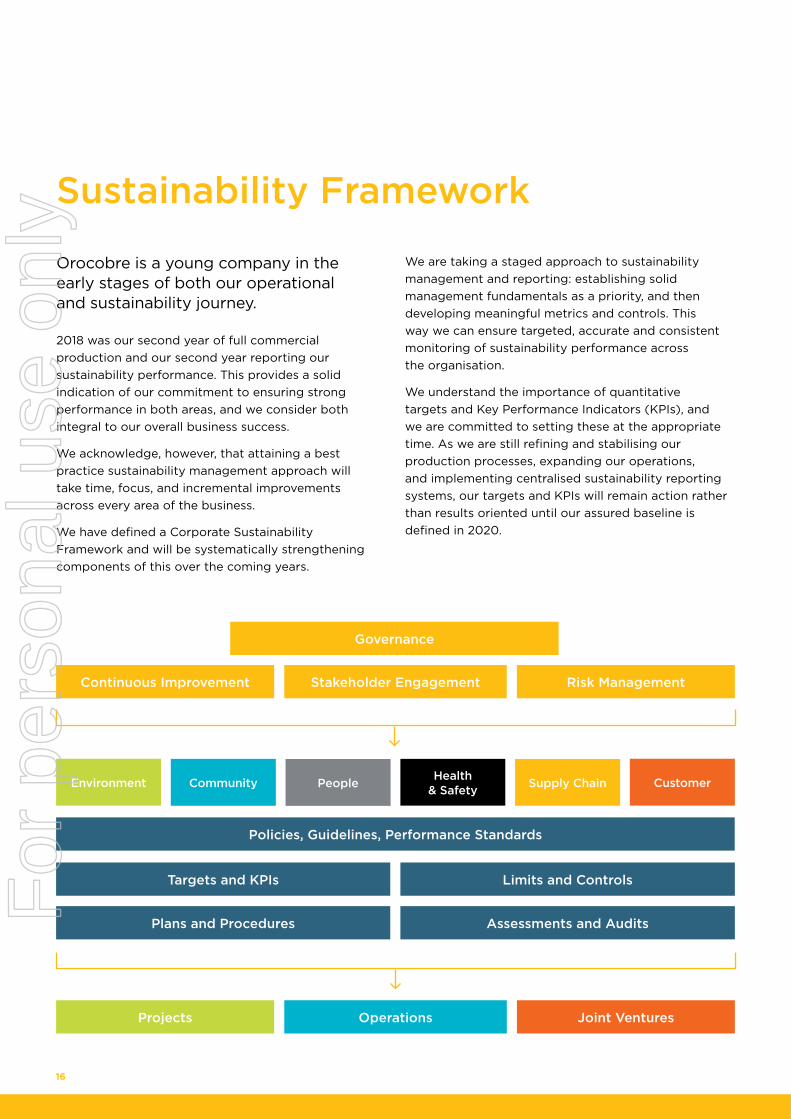
Sustainability Framework
Orocobre is a young company in the early stages of both our operational and sustainability journey.
2018 was our second year of full commercial production and our second year reporting our sustainability performance. This provides a solid indication of our commitment to ensuring strong performance in both areas, and we consider both integral to our overall business success.
We acknowledge, however, that attaining a best practice sustainability management approach will take time, focus, and incremental improvements across every area of the business.
We have defined a Corporate Sustainability Framework and will be systematically strengthening components of this over the coming years.
We are taking a staged approach to sustainability management and reporting: establishing solid management fundamentals as a priority, and then developing meaningful metrics and controls. This way we can ensure targeted, accurate and consistent monitoring of sustainability performance across the organisation.
We understand the importance of quantitative targets and Key Performance Indicators (KPIs), and we are committed to setting these at the appropriate time. As we are still refining and stabilising our production processes, expanding our operations, and implementing centralised sustainability reporting systems, our targets and KPIs will remain action rather than results oriented until our assured baseline is defined in 2020.
Targets and KPIs
Projects
Environment Health & Safety
Continuous Improvement
Operations
Community Supply Chain
Stakeholder Engagement
Joint Ventures
People Customer
Risk Management
Plans and Procedures
Policies, Guidelines, Performance Standards
Governance
Limits and Controls
Assessments and Audits
16
For
per
sona
l use
onl
y

To provide our investors with a clear indication of the activities and timelines we envisage for complete implementation of our Sustainability Framework, as well as the external benchmarks that we will be using to objectively evaluate our progress, we have developed the following 5-year plan.
• Benchmark Sustainability Performance
• Evaluate Sustainability Strengths and Weaknesses
• Establish Sustainability Management Framework
• Develop Strategy and Roadmap
• Implement Enterprise Management System
• Refine Policies, Guidelines and Performance Standards
• Undertake specific Sustainability Risk and Opportunity Assessments
• Assurance Readiness
• Establish Quantitative Targets and KPIs
• Set Limits and Controls
• Refine Plans and Procedures
• Establish Assured Sustainability Baseline
• Conduct Regular Audits and Assessments
• Implement Continuous Improvement Initiatives
• Commence Social Impact Reporting
• Implement Renewable Energy Projects
• Objective External Review of Sustainability Performance
• Explore Integrated Reporting
• Redefine Sustainability Strategy and Roadmap
2018
2019
2020
2021
2022
• DJSI Australia
• CDP Response (limited)
• GRI (Core)
• UNGC CoP (Learner)
• CDP Response (detailed)
• UNGP Report (limited)
• GRI (Core)
• UNGC CoP (Active)
• Improve DJSI & CDP UNGP Report (detailed)
• GRI (Comprehensive)
• UNGC CoP (Advanced)
• DJSI Asia Pacific
• LBG Report
• IRMA Certification
• Improve DJSI, CDP, LBG
• Integrated Reporting Pilot
External BenchmarkActivity
5-Year Plan
OROCOBRE SUSTAINABILITY REPORT 2018 17
For
per
sona
l use
onl
y

Highlights & Commitments
Optimise returns for shareholders Focus area: Long-Term Outlook
Meet growing demand through sustainable development
Focus area: Value Chain
Ensure long & lasting benefits to communities Focus area: Communities
Capacity building for community suppliers
Conduct and schedule Climate Risk Assessments
Conduct and schedule Human Rights Risk Assessments
Develop systems for supplier monitoring and compliance
Establish metrics to demonstrate long-term value generation
Improve position on the Dow Jones Sustainability Indices
Advance Cauchari Lithium Project Joint Venture to Feasibility Study
Deliver the Stage 2 Expansion within budget
Successfully deliver the Naraha Lithium Hydroxide Plant with TTC within budget
Strengthen strategic partnerships to advance Sustainable Development in the region
Establish baseline for community wellbeing across our local communities
Work with Jujuy Government to maximise distribution of benefits
Promote transparency of royalty distribution
Co
mm
itm
ents
1yr
3yr
1yr
3yr
1yr
3yr
Hig
hlig
hts
Status Target
Supplier Code of Conduct
Delivery Performance Measure
Enhance consistency across Impurity Profile
Status Target
Provide support to Advantage Lithium
Basin management approach
Communicate ESG investments to our investors
Status Target
Finalise and implement Community Investment Strategy
Establish agreements with local communities outside Olaroz Chico
Supplier review and performance standards
Naraha Lithium Hydroxide Plant
Fully funded Stage 2 Expansion
Local supplier development program with INTI
DJSI Australia Member
Cauchari drilling success and project progress
Enabled 24 businesses across 10 communities through microcredit program
18
For
per
sona
l use
onl
y

Increase participation in employee engagement survey
Increase % of workforce with technical qualifications
Incorporate KPIs and objectives into annual performance review
Establish targeted development and succession plans
Complete cultural review program
Implement integrated data management and reporting system
Conduct safety culture change program using the DuPont Safety System
Incorporate fire protection system in plant
Undertake contractor safety training and awareness
Prepare and train emergency response brigade
Optimise environmental outcomes Focus area: Environment
Develop our People & Capability Focus area: People & Capability
Prioritise safety Focus area: Culture
ProgressingAchieved Not achieved
1yr 1yr
3yr
1yr
3yr3yr
Integrate energy and emissions performance into corporate and operational KPIs
Assurance of environmental data
Establish solid baseline for environmental performance based on assured data
Set short-and long-term targets for energy and emissions intensity reduction
Status Target
Increase local representatives in participatory monitoring
Reuse and recycle water to minimise extraction
Implement emissions reporting framework
Reduce water intensity by 15%
Status Target
Formalise industry-specific training into certified course program
Develop specific training programs to address identified capability gaps
Increase % of workforce educated to secondary level
Status Target
0 fatalities
Zero harm
Turnover below 15% Participatory Environmental Monitoring Program recognised by UNDP
Audit and Certification of Integrated Management System (including OHSAS18001)
Employee satisfaction above 95%
No days lost due to industrial actionEnvironmental Management
System recertified to ISO14001:2015 standard
Reduced TRIFR from 3.9 to 3.3
OROCOBRE SUSTAINABILITY REPORT 2018 19
For
per
sona
l use
onl
y

Stakeholder Engagement
Investor and other stakeholder consultations and analyses used to review and update key interest areas.
Five-Part Materiality Test
Detailed analysis of internal and external sources to determine list of material issues.
Validation & Prioritisation
Executive review, validation and prioritisation of Sustainability Focus Areas and specific 2018 Financial Year (FY18) disclosures.
Our Focus
To determine the material topics and issues for disclosure in this report the following process was undertaken:
20
For
per
sona
l use
onl
y

Outcomes
Our materiality process enabled us to reaffirm, update and reprioritise our Sustainability Focus Areas: the topics of ongoing relevance to our operations based on their significance to our stakeholders and our business.
Through the materiality process we also identified a series of discrete issues of specific relevance to our performance during the reporting year. This Sustainability Report covers these discrete FY18 Focus issues specifically.
Soci
ety’
s Ex
pect
atio
ns
Relevance to Orocobre
LOW
LOW
MEDIUM
ME
DIU
M
HIGH
HIG
H
Control Manage Master
• Collaboration• Culture
Management
• Satisfaction & Retention
• Human Rights
• Reporting, Analysis & Action
• Supply Chain Management
• Training & Development• Health & Safety
• Impact of Climate• Quality Assurance• Community
Empowerment• Community Investment• Active Risk Management
• Stakeholder Relations
• Energy & Emissions• Water Management
& Quality
• Waste Management
• Biodiversity
• Innovation• Continuous
Improvement
Prioritisation of Sustainability Focus Areas
OROCOBRE SUSTAINABILITY REPORT 2018 21
For
per
sona
l use
onl
y

Long-Term Outlook
Stakeholder Engagement
Communities
FY18 Focus
Product Optimisation
Tailoring our product to meet customer needs and future market demands
Value Chain Optimisation
Redefining organisational structure and systems to enhance control and efficiency of our value chain
2 1
Structuring for the Future
Solidifying our relationship with TTC and ensuring effective leadership transition for long term success
Preparing for the Future
Bringing new capacity online to gain market advantage, while managing long-term collective impact
Community Empowerment
Developing community capability to participate in project and non-project related activities
Community Investment
Aligning our community investment strategy with the UN SDGs and evaluating the social impact
4
6
3
5
Value Chain
Shared Value Case Studies
22
For
per
sona
l use
onl
y

Culture Management
Reinforcing our code of conduct and anti-corruption procedures
Health & Safety
Analysing and enhancing our health and safety approach
Impact of Climate
Managing the impact of climate on production and expansion activities
Impact on Environment
Better understanding our energy and emissions profile and water consumption across our operations
8 7
Environment
People & Capability
People Data
Myth-Busters
Changing Nature of our Workforce
Recruiting specialists to assume strategic functions and highly-skilled project work
Employee Satisfaction & Morale
Maintaining positive morale in the workforce through a period of structural and leadership changes
10 9
Health & Safety Performance
Culture
12 11
OROCOBRE SUSTAINABILITY REPORT 2018 23
For
per
sona
l use
onl
y

Value Chain
Future Commitments
Conduct and schedule Climate Risk Assessments
Conduct and schedule Human Rights Risk Assessments
Capacity Building for Community Suppliers
Develop systems for Supplier Monitoring and Compliance
24 VALUE CHAIN
For
per
sona
l use
onl
y

Lithium carbonate from the Olaroz Lithium Facility is sold to a range of markets across a spread of geographies.
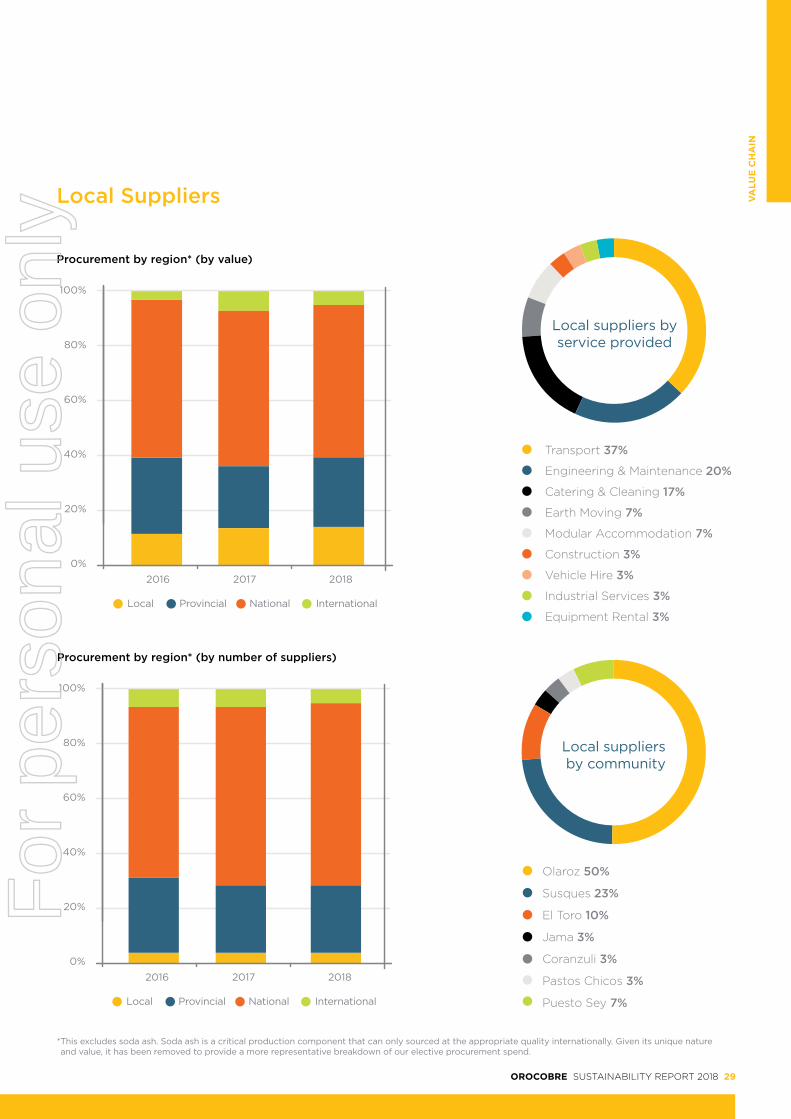
We prioritise local suppliers for the provision of services to the project and source as many materials as we can from the local region and/or other provinces of Argentina. That said, there are certain critical production inputs (e.g. soda ash) and services that we can only source at appropriate quality from overseas.
Lithium-ion batteries provide power for: Smartphones, tablets, laptop computers, power tools.
Larger format Lithium-ion batteries provide power for: Electric cars, scooters, electric bikes, buses, forklifts & other forms of transportation.
Suppliers
International suppliers
make up 6% of services and materials This excludes soda ash
National suppliers
make up 94% of services and materials
Customers
End users
A significant driver of lithium consumption is the world-wide adoption of electric vehicles (EVs) encouraged by government incentives and infrastructure, falling costs of battery packs, improved performance of rechargeable batteries and a greater range of EV models to suit end-consumer needs. While EV penetration was approaching 1% worldwide in 2016, in certain countries in Europe penetration is as high as 25% and the general consensus is global EV penetration will be at approximately 4.5% by 2020.
Similarly, forecast lithium demand from the energy storage systems (ESS) segment varies widely with growth between 20% to 25% p.a. being recorded in
the past 3 years. As renewable energy targets are more likely to be achieved when renewable energy sources are combined with ESS, Orocobre believes ESS development will continue and exceed 30% p.a. growth by 2020.
EV and ESS together with healthy baseload demand in line with GDP growth will require at least 350 ktpa of lithium carbonate equivalent (LCE) production by 2020. While there are concerns regarding significant lithium carbonate supply shortage given market tightness, Orocobre is well positioned to bring new resource online in coming years to address the surge in demand.
7
OROCOBRE SUSTAINABILITY REPORT 2018 25
VALU
E C
HA
IN
For
per
sona
l use
onl
y

Product Optimisation
Tailoring our product to meet customers’ specifications
As a lithium producer, we are often categorised as a mining company. However, mining companies extract and process mineral/ore which is then sold based on an established commodity price, with degrees of variance based on mineral/ore grades.
Lithium production is different: it is a chemical process, not a mineral extraction and refining process.
Our lithium products vary in both physical and chemical composition. We produce micronised lithium for batteries and compacted lithium for the ceramic and glass industries. Detailed chemical specifications are defined by each client based on their specific needs.
In addition to lithium carbonate, our products may also contain varying quantities of other chemical elements as highlighted in the periodic table below.
Quality assurance is not just about ensuring we achieve the required lithium carbonate percentage in the final product, but also ensuring we meet the specific parts per million (PPM) limit for each
additional chemical in the product, as defined by the customer. This PPM breakdown is commonly referred to as the ‘impurity profile’.
When we discuss quality assurance, we are referring to the process by which we can ensure that the lithium carbonate and its impurity profile consistently meets the specific client specifications. Additional considerations include moisture content, magnetic particles, loss on ignition values, and physical form.
In this sense, lithium production from brine is a more complex operation than traditional mining extraction and processing. Customer specifications change and evolve. To continually and effectively tailor our products to meet customer requirements we must be able to constantly adapt and ensure the quality of our production processes.
In 2018 we enhanced consistency across the impurity profile, reducing the standard deviation by half on our primary lithium carbonate product on a bag-by-bag basis.
26 VALUE CHAIN
For
per
sona
l use
onl
y

Leveraging product optimisation opportunities along our value chain
Recognising the change in battery technology to high nickel based cathodes which require lithium hydroxide, Orocobre and JV Partner TTC have accelerated plans for development of a 10,000 tpa lithium hydroxide plant to be built in Naraha, Japan.
The project is also expected to enhance margins on the volume of Olaroz lithium carbonate production used as feedstock, diversify Orocobre’s lithium product range and enhance Orocobre and TTC’s relationships with key lithium end users in Japan. The proposed location is well situated near potential customers and reduces the risks of caking and degradation of product when lithium hydroxide is transported and exposed to humidity and atmospheric air.
The proposed Naraha Lithium Hydroxide Plant will have a production capacity of 10,000 tpa of lithium hydroxide.
9
Test work has demonstrated that a very high-quality, battery grade, lithium hydroxide can be produced.
“
OROCOBRE SUSTAINABILITY REPORT 2018 27
VALU
E C
HA
IN
For
per
sona
l use
onl
y

12
Value Chain Optimisation
Enhancing control & efficiency of the value chain
In 2018 the structure of the supply chain function at SDJ was redefined to enhance control and efficiency across our broader value chain.
Inbound supply chain activities including purchasing, contracts and inbound logistics now report to the General Manager of Business Services, who is equally responsible for the oversight of finance and controls. This enables greater effectiveness and efficiency in the procurement and delivery of goods and services to the operation.
Outbound supply chain activities including liaison with customers via TTC (exclusive sales agent) and outbound logistics associated with the delivery of lithium carbonate to port now report through to our General Manager of Operations. This enables greater alignment between production, operations and customer delivery, ensuring the integration of contractual obligations into operational controls.
Over the coming 12 months, the focus for our inbound supply chain will remain on assuring continuity of supply and reducing the costs and demand for materials and services.
This includes improvements to decision-making and delegation at the line-management level; capacity building in SAP; increasing the level of spend-under-contract; contract administration and commercial skills; the implementation of bar-coding technology in our warehouses and an evaluation of the use of third-party site services and labour.
For our outbound supply chain activities, the focus over the coming 12 months will be on assuring the quality of the product in line with customer specifications (see page 26) and defining and integrating a delivery performance measure to ensure greater integration and accountability across our production and sales functions.
Promoting the performance of our suppliers
One of the strategic initiatives in the supply chain area for 2018 has been a comprehensive review of SDJ’s truck-transport operations. This commenced with definition of operating standards that establish SDJ’s minimum requirements for safe, reliable and sustainable transport operations. These standards have subsequently been taken to market and transport contracts will be established for SDJ’s inbound and outbound supply chains. These will only be with those transport companies that meet the minimum standards.
The requirement for these standards was reinforced by an incident in early 2018 with a transport supplier spilling hydrochloric acid between Susques and Olaroz. The new operating standards establish (amongst other requirements) that yearly testing be carried out on the integrity of all tanker vessels, in order to avoid any similar incidents. Other areas of focus within the standard are ensuring adequate controls over key risks such as driver fatigue and emergency response procedures.
The review of transport operations also places a special focus on local community transport service providers. These companies currently undertake a considerable portion of SDJ’s transport services and are recognised as important to SDJ’s ongoing community investment commitment. The challenge will be to ensure that these community companies comply with the established operating standards and to this end SDJ looks to work directly with them to identify their current gaps and opportunities for improvement. This will then be the focus of a targeted capacity building program for community transport suppliers in 2019.
8
28 VALUE CHAIN
For
per
sona
l use
onl
y
100%
80%
60%
40%
20%
0%
Local Provincial National International
2016 2017 2018
100%
80%
60%
40%
20%
0%
Local Provincial National International
2016 2017 2018
Local Suppliers
Transport 37%
Engineering & Maintenance 20%
Catering & Cleaning 17%
Earth Moving 7%
Modular Accommodation 7%
Construction 3%
Vehicle Hire 3%
Industrial Services 3%
Equipment Rental 3%
Local suppliers by service provided
Olaroz 50%
Susques 23%
El Toro 10%
Jama 3%
Coranzuli 3%
Pastos Chicos 3%
Puesto Sey 7%
Local suppliers by community
Procurement by region* (by number of suppliers)
Procurement by region* (by value)
* This excludes soda ash. Soda ash is a critical production component that can only sourced at the appropriate quality internationally. Given its unique nature and value, it has been removed to provide a more representative breakdown of our elective procurement spend.
OROCOBRE SUSTAINABILITY REPORT 2018 29
VALU
E C
HA
IN
For
per
sona
l use
onl
y

Long Term Outlook
Future Commitments
Establish metrics to demonstrate long-term value generation
Deliver the Stage 2 Expansion within budget
Successfully deliver the Naraha Lithium Hydroxide Plant with TTC within budget
Improve position on the Dow Jones Sustainability Indices
Advance Cauchari Lithium Project Joint Venture to Feasibility Study
30 LONG-TERM OUTLOOK
For
per
sona
l use
onl
y

Shareholder Composition
Institutional 52%
Retail 20%
Corporate 17%
Unallocated 9%
Related Party 2%
Australia 31%
United States 15%
Japan 15%
Germany 10%
Sweden 4%
Rest of Europe 9%
Rest of World 8%
Unallocated 8%
Growth 25%
Index 20%
GARP 17%
Value 9%
Hedge Fund 7%
Other 22%
Institutional Shares by
Investment Style
Total Shareholder Composition
Total Shares by Geography
2018 Financial Highlights
2yr
Record yearly revenue
up 24%up 5%
US$148.9 million
Record EBITDAIX of
up 33%
US$94.6 million
Second full year of production totaling
Average price received of
Gross Cash Margin of 67%, delivering
12,470 tonnes US$12,578 US$8,384
per tonne, up 29% per tonne, up 39%
OROCOBRE SUSTAINABILITY REPORT 2018 31
LON
G-T
ER
M O
UTL
OO
K
For
per
sona
l use
onl
y

Solidifying long-term relationship with TTC
2018 was a hallmark year for the JV Partnership between Orocobre and TTC. In February 2018, Orocobre announced the finalisation of a 15% strategic placement to TTC, granting the JV Partner 37,544,920 shares at an issue price of $7.50 Australian Dollars (A$) per share.
This strategic placement (valued at A$281.6 million) coupled with a pro rata entitlement offer, which allowed existing shareholders to participate at A$6.55 per share (ultimately valued at A$79.3 million), generated the funds required to progress with Stage 2 Expansion at Olaroz and the construction of the Naraha Lithium Hydroxide Plant.
Under the terms of the strategic placement, TTC was entitled to nominate one non-executive director to the Orocobre Board. This entitlement remains valid for as long as TTC retains at least 10% of Orocobre shares. Accordingly, in April 2018 Mr Masaharu Katayama from TTC was officially appointed to the Orocobre Board. A two-year standstill agreement caps TTC’s relevant interest in Orocobre shares at 15% with anti-dilution rights for two years subject to TTC having a relevant interest in at least 10% of the shares.
Building on the successful JV Partnership already in place, it was agreed that Orocobre and TTC would have joint control over strategic marketing, the allocation of volume to customers and commercial terms of sale contracts with TTC to remain the exclusive sales agent for Olaroz Stage 2. Joint control will enable greater support and development of the sales function so it can successfully manage a potential 42,500 tonnes of annual production.
Details of the Strategic Placement between Orocobre and TTC can be found on the Company website www.orocobre.com (see ASX Release ‘Recent Strategic Placement and Entitlement Offer Finalised’ dated 28 February 2018).
With regards to the Naraha Lithium Hydroxide Plant development, TTC will have operational control with support and oversight from the Orocobre Board and nominated executive resources.
2018 was a hallmark year for the Joint Venture Partnership between Orocobre and TTC.
“
Former Orocobre Managing Director and CEO Mr Richard Seville and Mr Masaharu Katayama from Toyota Tsusho Corporation.
32 LONG-TERM OUTLOOK
For
per
sona
l use
onl
y
17
OROCOBRE SUSTAINABILITY REPORT 2018 33
LON
G-T
ER
M O
UTL
OO
K
For
per
sona
l use
onl
y

Preparing for the Future
Bringing new capacity online to gain price & market advantages
Based on strong demand observed by both Orocobre and TTC, the Olaroz JV agreed to undertake an extension to the Olaroz Stage 2 Expansion.
Bringing the expanded resource online quickly and effectively will enable Orocobre to capitalise on existing lithium prices, expand market share and position the company effectively for future growth.
The Olaroz Stage 2 Expansion will add 25,000 tpa of lithium carbonate production capacity to the Olaroz Lithium Facility, taking total nameplate capacity to 42,500 tpa. This will position Orocobre as one of the world’s largest and lowest cost lithium chemical producers, with lower Stage 2 operating costs further enhancing Orocobre’s low cost base.
Long lead time activities including the construction of new roads, new evaporation and harvest ponds, a secondary liming plant, boreholes, the expansion of existing site infrastructure and camp accommodation commenced in FY18. Commissioning of the Stage 2 Expansion is expected in H2 CY20.
Working collaboratively to manage & mitigate collective impact
As one of several brine-based lithium producers operating and/or developing operations in the region, we acknowledge the importance of collective impact on the local social and environmental frameworks.
Last year we raised the importance of effective Basin Management, recognising that the long-term health of our brine resource and its surrounding ecosystem could not be monitored or managed by us in isolation.
Following further discussions with the provincial government and local peers in 2018, it was agreed that extraction data of all operators would be submitted to and monitored by the provincial government to ensure flow rates and extraction limits are respected and remain within sustainable parameters.
In addition to environmental and resource considerations from a risk perspective, we also acknowledge the potential for positive collective impact within the local communities, particularly through the establishment of shared regional development programs and initiatives.
Working collaboratively with Advantage Lithium on topics of social and environmental significance is facilitated by our JV partnership. For other operators in the region, establishing a collaborative approach will be more complicated, particularly given the differing stages of project development.
We are confident that through further discussion and engagement with these players, and with the local and provincial governments and authorities, we can develop a system for effectively monitoring and managing our collective impact on the social, environmental and economic wellbeing of all stakeholders in the region.
17
34 LONG-TERM OUTLOOK
For
per
sona
l use
onl
y

Stakeholder Engagement
Stakeholders
Orocobre’s success as an organisation is grounded firmly in the quality of our relationships with numerous, diverse stakeholder groups locally, nationally and internationally.
Ensuring we have the systems, processes and resources to effectively monitor, engage, understand and respond to these various stakeholder groups is paramount. Currently, stakeholder relationships are managed directly and independently by diverse teams across the organisation.
In coming years, we will seek to establish common systems and frameworks for stakeholder management across the organisation. This will enable us to enhance the consistency and transparency of our engagement and, in turn, strengthen the quality of our relationships with all stakeholders.
External
Stakeholders who we respect and
consider but do not actively engage with
on a regular basis
Internal
Stakeholders who work within the
organisation to deliver on our objectives
Institutional
Stakeholders who impact, or are impacted by, the organisation at a regional, national or
international level
Organisational Capability & Culture
Environment
Value Chain
CommunitiesLong-Term Outlook
Stakeholders
EXTER
NA
L
Operational
Stakeholders who impact, or are impacted by, our operations and
activities at a local level
INSTITUT
ION
AL
OPERATIO
NA
L
INT
ER
NA
L
OROCOBRE SUSTAINABILITY REPORT 2018 35
LON
G-T
ER
M O
UTL
OO
K
For
per
sona
l use
onl
y

Engagement Methods
Operational
Employees
• Induction workshops
• Ongoing direct personal dialogue
• Employee consultation meetings
• Suggestions box
• Annual performance reviews
• Employee satisfaction surveys
• Director visits to site
• Reporting channel for unethical behaviour
• Intranet, newsletters, emails, billboards
Contractors
• Induction workshops
• Ongoing direct personal dialogue
• Suggestions box
• Reporting channel for unethical behaviour
• Intranet, newsletters, emails, billboards
Suppliers
• Supplier survey
• Annual breakfast with vendors/meetings
• Annual performance assessment
• Suggestions box
Customers
• Customer relationships directly managed by TTC
• Regular confirmation of customer needs
• Customer satisfaction surveys
Regulatory Bodies
• Audits
• Monthly and annual reports
• Permit and licence requests and submissions
Communities
• Ongoing dialogue via Shared Value team
• Program development and evaluation activities
• Monthly assemblies, cultural and religious events
• Monthly Town Hall meetings
• Participation in environmental monitoring
• Direct face to face communication
• Telephone communication
• Meetings with community institutions
NGOs
• Meetings on request, as required
• Mail, phone, direct engagement
Local Government
• Meetings and presentations
• Spaces for debate and public-private dialogue
• Public-private linkage programs
• Emails, phone calls and direct engagement
Unions
• Regular face-to-face meetings
• Formal negotiations and approvals for changes
• Union representative within workforce
• Emails, phone calls
Internal
36 LONG-TERM OUTLOOK
For
per
sona
l use
onl
y

The issues raised by our stakeholders in FY18 were incorporated into the Materiality Assessment which determined the focus topics for this report.
Industry Peers
• Communication via email/forums
• Dinners/events with industry peers
• Emails and discussions re topics of relevance
Future Generations
• Precautionary principle
• Ensure best possible environment (physical and socio-economic) for future wellbeing
External
Institutional
Investors
• Continuous disclosure via website and emails
• Periodic disclosures via quarterly, half and full-year reporting and the Annual General Meeting
• Specific Information Disclosures via ASX Release.
• Meetings, interviews and surveys
Shareholders
• Online: Toronto + Australian stock exchanges
• Road shows
• Shareholder meetings
• Statutory reporting and accounts
National Government
• Meetings with government representatives and ministries
• Involvement in industry and policy focused working groups
JV Partners
• Regular ongoing meetings with TTC
• Technical assistance
• Meetings with business representatives
Trade Associations
• Memberships
• Regular meetings and events
• Contribution to advocacy platforms
Universities
• Course development
• Training programs
• Internships
• Research collaborations
Media
• Press releases
• Interviews
• Mail, phone and face-to-face engagement
OROCOBRE SUSTAINABILITY REPORT 2018 37
LON
G-T
ER
M O
UTL
OO
K
For
per
sona
l use
onl
y

Communities
Future Commitments
Work with Jujuy Government to maximise distribution of benefits
Promote transparency of royalty distribution
Establish baseline for community wellbeing across our local communities
Strengthen strategic partnerships to advance Sustainable Development in the region
38 COMMUNITIES
For
per
sona
l use
onl
y

Our Communities
San Antonio de los Cobres
Olaroz Lithium Facility
Community
Towns
Road Accessto Projects
Orocobre Lithium Projects
LEGEND
Susques
Pastos Chicos
San Juan Quillayes
Coranzuli
El Toro
Olaroz Chico
Jama
Catua
Huancar
Puesto Sey
Cobres
Chile
Jujuy212km
Purmamarca
Casabindo
Abra Pampa
Salar de Pocitos Santa Rosa
de los Pastos Grandes
Reserva Nacional Los Flamercos
Santa Rosa de Tastil
OROCOBRE SUSTAINABILITY REPORT 2018 39
CO
MM
UN
ITIE
S
For
per
sona
l use
onl
y

Approach to Community Engagement
Community
AnalyseAnalysis of the
local context
DiagnoseIdentification and
classification of variables
DesignDevelopment of Community Engagement and Development Plan
ImplementImplementation of Community Engagement and Development Plan
Monitor Track initiatives, progress and corrective actions
ReviseIdentification of new needs and responses
EngageFeedback from
communities and strategic partners
Re-evaluateEvaluation of approach:
re-analyse and diagnose
1
4
2
3
Our Approach for Maintaining Strong Relations with our Community
Provide regular opportunity for engagement and consultation
Understand community expectations and demands
Deliver targeted support initiatives in the communities
Work with employees in the community (see People & Capability on page 74)
Work with community suppliers (see Value Chain on page 26)
40 COMMUNITIES
For
per
sona
l use
onl
y

Community Empowerment
Developing community capability to participate in project activities
SDJ is committed to the socio-economic development of our local communities. To achieve this, we promote local economic development initiatives that are independent from our activities and also capacity building initiatives to enable community involvement in project-related activities (see Empowerment and Education Case Studies on page 46).
In addition to capacity building to enable the creation of new community businesses and suppliers, we also appreciate the importance of supporting and developing existing community suppliers to ensure they are able to operate in accordance with the standards and requirements defined by SDJ.
Throughout 2017–2018, we developed and delivered a targeted supplier development program with INTI (the National Institute of Industrial Technology).
The program identified the key services that the community-based small-medium enterprises (SMEs) tend to provide (general services, civil works and transportation) and then worked with individual SMEs to identify specific improvement opportunities.
Several topics were considered relevant for all suppliers and were incorporated into the development program for all participants. These included:
• Cost Management
• Quality
• Handling of Chemical Products
• Safety
• Stock Management
• Human Resources.
Of the 16 local community SMEs, 14 participated in the training programs, with an average 22 man-hours of training delivered per month. INTI spent an average of 70 hours a month working directly with the suppliers on the project.
All participants reported improvements in their organisation following the training and one third indicated that further training was desired.
A review of our supply chain in 2018 identified the need to improve the social and environmental performance of our transport suppliers. Given that a large proportion of our transport suppliers are from the local communities, we will be delivering a targeted capacity building program for community transport suppliers in 2019.
Managing increased expectations due to expansion
The nature of site-based activity differs significantly during development and operations.
Throughout project development there are a lot of low-skill employment and supply opportunities. During operation there tends to be fewer, more highly-skilled roles.
It was therefore not surprising to see an increase in local community expectations following announcement of the Olaroz Stage 2 Expansion, as they know that development activity presents more opportunities for them to engage.
The focus for SDJ’s Shared Value program team in FY18 was therefore on both capacity building and the effective management of expectations.
While we are committed to developing capacity and capability to ensure that local communities can engage as fully as possible with project activities, we also acknowledge that there is a limit to the number of low-skilled supply and employment opportunities available.
Additional resources have been assigned to manage expansion-related community engagement.
8 10
OROCOBRE SUSTAINABILITY REPORT 2018 41
CO
MM
UN
ITIE
S
For
per
sona
l use
onl
y

Community Investment
Aligning our community investment strategy with UN SDGs
Over the past decade, our community investment strategy has been centred on the five pillars of our Shared Value strategy: Education, Empowerment, Transparency, Production and Natural Resources and Health.
Given the increased focus from all sectors over the past few years on the United Nations’ Sustainable Development Goals (SDGs), we appreciate the value of aligning our community investment strategy to these global goals and targets. Not only will it facilitate the identification of cross-sectoral partnerships and collaboration opportunities, it will also enable us to more effectively track our contribution to broader global development goals.
In 2018 we undertook a detailed process of alignment, which combined the objectives of the UN SDGs with the core components of Porter and Kramer’s Shared Value model (i.e. local cluster development, value chain productivity, product and market innovation) to provide a consolidated framework for managing, monitoring and measuring our performance against the UN SDGs.
1. For each SDG, identify the social issues of relevance to our local operating context;
2. Categorise the social issues within the five pillars of Shared Value;
3. Define specific sub-categories within each pillar to reflect the social issue;
4. Identify the business relevance for each;
5. Prioritise focus areas for community investment based on social and business relevance; and
6. Define the social indicators to evaluate performance.
Working through this process enabled us to gain greater insight into the role of our community investment strategy within our broader contribution to shared value and the SDGs. It also prompted us to consider
the most effective structures and vehicles to manage and maximise our overall contribution to society.
As such, in 2019 our focus will be on establishing the internal and external structures to more effectively administer and evaluate our community investment strategy.
Evaluating the impact & effectiveness of our investment
Over the past year we have worked to prepare our community investment data in accordance with the established global standard for community investment reporting: the London Benchmarking Group (LBG) Framework. This has enabled us to categorise our community contributions by type and by input and to identify gaps in our approach. It has also highlighted areas requiring additional data collection and management.
Currently we can report on the outputs and outcomes of our community activities, such as the number of participants in our education programs, or the number of community employees with secondary school qualifications. Impact metrics at a community level are a little more complex as we do not necessarily have the appropriate social baseline data to evaluate this effectively across all our program areas.
A social baseline study was conducted in 2010. This provided a base set of community data and indicators on which our community investment strategy was founded. That said, the data and indicators generated in that baseline study do not provide the level of detail required to enable the effective monitoring and evaluation of impact across our communities.
In 2019, the focus will be on defining a solid Theory of Change for the organisation, to provide additional strength and rigour to our community investment strategy and to facilitate the identification of suitable short, medium and long-term indicators for social impact.
1
42 COMMUNITIES
For
per
sona
l use
onl
y

Government Payments
Cash contributions
Time*
In-kind donations**
Management costs
Charitable donations*
Community investment
Commercial initiatives**
Nature of Contribution
US$1m
Type of Contribution
US$530k
Royalty and other Government Payments USD
Provincial Royalty 1,641,172
Other provincial and municipal taxes 132,995
Other national taxes 849,644
Employment taxes paid by SDJ 1,486,995
Total Paid by SDJ 4,110,806
Provincial withholding tax to local business 582,780
National withholding tax on salaries 550,341
National withholding tax to local business 5,265,468
Total Withheld by SDJ 6,398,589
Royalty Payments in Argentina
The payment of royalties in Argentina is determined by law. As such, Orocobre pays 3% of the ‘mine mouth’ value of the mineral extracted to the Provincial Government of Jujuy, who is then legally required to distribute that amount evenly across all 61 municipalities in the Province.
While Argentina is not an Extractive Industries’ Transparency Initiative (EITI) nation, we are committed to ensuring transparency and will continue to disclose our payments to local government and communities as we develop.
In 2018 we have paid approximately 47 million Argentinian Pesos (ARS) or US$1.6 million dollars in royalties to the Government of Jujuy.
Corporate Taxes
Orocobre’s current operations are focused solely in Argentina. Orocobre is committed not only to full compliance with the tax laws of Argentina but also to ensuring all profits from its Argentina operations are taxed in Argentina.
SDJ does not currently pay corporate tax due to the carried
forward tax losses incurred during construction and commissioning of the project. However, at current Lithium Carbonate selling prices, corporate tax is projected to be paid from FY20 onwards. In determining its taxable income SDJ does not participate in any transfer pricing arrangements with export selling prices being on a Free On Board (FOB) basis.
In September 2018, the Argentine Government introduced an export duty of ARS$3 per US$1 exported. Based on the exchange rate at that time (~ARS$37.5/US$1), the company estimated the duty would result in a cost of approximately 8% of its sales revenues. This export duty will remain in place until December 2020.
1
* Charitable Donations were made by SDJ in 2018 to support communities in the Jujuy province that were affected by heavy rains. As these were not donations made to our 10 local communities we did not capture the payments as part of our community spend. We will be revising our systems in 2019 to ensure all charitable contributions (including those administered beyond our community and Shared Value strategy) are captured.
** In FY18 we included our sponsorship of industry events supporting sustainable mining in the region in Commercial Initiatives.
* We do not currently have a system in place to track time invested by employees volunteering in community initiatives. There is no formal volunteering program in place. Employee time is contributed on an as-needs basis based on the activity and skills required.
** Tracking of in-kind donations has proven complicated in 2018 due to changes in internal reporting. We will be seeking to establish more robust tracking and measurement of in-kind donations across departments in coming years.
The provincial government continues to benefit from the increasing value of the Olaroz asset through an 8.5% holding in SDJ by their mining and investment entity (JEMSE).
“
OROCOBRE SUSTAINABILITY REPORT 2018 43
CO
MM
UN
ITIE
S
For
per
sona
l use
onl
y

Shared Value
Outcomes & Impact
Five Pillars of Shared Value
Operational Objectives of Shared Value
Case Studies
Empowerment
Seize opportunities to strengthen communities and promote wellbeing
Build capacity of communities and local suppliers
Provide and promote space for cross-sectoral dialogue and collaboration
Transparency
Local Production & Natural Resources
Education
Health
1
A
B
C
2
3
4
5
Case Study 1
Community Microcredits Program
Case Study 2
Education: Certification & Infrastructure
Case Study 3
Artisan Development Project
Case Study 4
Raising Recycled Walls
44 COMMUNITIES
For
per
sona
l use
onl
y

Case Studies
OROCOBRE SUSTAINABILITY REPORT 2018 45
CO
MM
UN
ITIE
S
For
per
sona
l use
onl
y

8 10
Empowerment
Community Microcredits Program – Case Study 1
SDJ made a commitment to our local communities, indigenous people of the Atacama, to support the development of new businesses within the region that are independent of the company’s operations to help nurture sustainable socio-economic development.
A support plan for entrepreneurs was created, which provides Community Microcredits to help locals implement small business ideas.
It is important to note that the purpose of the Community Microcredit Program is to support ventures that are not related to mining, to assist in the comprehensive growth and development of local economies.
The first round of credit instalments was distributed in October 2017 with the second round being distributed in December 2017.
Beneficiaries
To begin the evaluation process of potential community microcredit beneficiaries, SDJ held workshops in each of the 10 communities to support the development of business ideas. From this, 64 business plans were presented to SDJ for evaluation with 24 successfully meeting SDJ’s investment evaluation requirements. The 64 business plans were evaluated on the following criteria:
• Personal Entrepreneurial Skills (40%)
• Potential of the Business Idea (35%)
• Technical and Economic Feasibility of Implementation (25%).
Distribution of Community Microcredit beneficiaries are outlined below:
CommunityWorkshop
Participants (Business Plan)
Projects Delivered
Selected Beneficiaries
Olaroz 8 5 1
Susques 15 8 3
Coranzuli 28 9 4
San Juan 12 6 1
El Toro 7 6 2
Catua 17 7 4
Puesto Sey 12 1 1
Pastos Chicos 6 6 2
Jama 23 10 4
Huancar 7 6 2
TOTAL 135 64 24
Funds Invested 872,970 ARS*
Coranzuli 20%
Jama 15%
Susques 12%
Catua 12%
El Toro 10%
Pastos Chicos 10%
Huancar 9%
Puesto Sey 6%
San Juan 4%
Olaroz 2%
1
* ~$25,000 USD
46 COMMUNITIES
For
per
sona
l use
onl
y

Invested/Recovered Amounts
As of 30 June 2018, the total amount invested via the Community Microcredits Program totaled ARS 872,970 (approximately US$25,000). While there was a budget of ARS 100,000 per community, funds were only presented to viable ideas that met SDJ’s investment evaluation requirements.
Businesses from each of the 10 communities that met the investment evaluation requirements are outlined below:
Community Business Operational Comments
Olaroz Grocery StoreBenefiting from the population increase in Olaroz
due to SDJ expansion.
Susques
Hardware Store
Personal Protective Equipment Store
Bookstore/ReligiousSuccessful business selling religious images and souvenirs.
Hopes to expand.
Coranzuli
Restaurant
ButcherGoing well and is now exploring the potential of opening
a restaurant.
Quinoa Production
Quinoa Production
San Juan Entertainment VenueIncreasing clientele, focused on fun for children and adolescents,
looking to improve the infrastructure.
El ToroEntertainment Venue
Has become meeting point for the small community, fast food and refreshment spaces included to boost the business.
Hostel
Catua
Photocopy Services
Clothes Store
Bakery Produces and sells to the community directly and supports the café
business of fellow Catua beneficiary.
CaféComplemented by the new local bakery, the café is operating
successfully in the community.
Puesto Sey Grocery Store
Pastos ChicosLaundry
Tyre Repairs
Jama
Artisan – Wool Production
HostelWorking well and used frequently by SDJ contractors
and suppliers.
Tyre Repairs
Mechanic
HuancarRestaurant
Grocery Store
OROCOBRE SUSTAINABILITY REPORT 2018 47
CO
MM
UN
ITIE
S
For
per
sona
l use
onl
y

17
Education
Certification & Infrastructure – Case Study 2
SDJ’s Education Plan aims to improve the level of education of operating personnel, promoting autonomy as the personal competence from which all other qualities and abilities are developed.
The plan was developed in accordance with the compulsory primary and secondary education legislation in Argentina, together with various training specialisations helping support each operator’s specific role while developing their skillsets to allow for future promotions.
The three core objectives of SDJ’s Education Plan are:
• To align SDJ’s growth and expansion with the educational development of its employees
• To work collaboratively across sectors, engaging proactively with communities, government agencies and other organisations
• To improve the level of education for the entire SDJ workforce, in accordance with the legislation of Argentina.
Baccalaureate Program
In 2014, SDJ worked collaboratively with the provincial government and our 10 local communities to develop a Regional Baccalaureate Program.
Classes began in February 2015 with 25 students attending. Classes were run by a professor appointed
by the Jujuy Ministry of Education’s Distance Learning Coordinator. Classes were given Tuesday to Thursday from 5:00 pm to 7:00 pm and 7:00 pm to 9:00 pm to afford both night and day shift SDJ employees the opportunity to attend.
The Baccalaureate was offered not only to SDJ employees seeking to obtain a secondary degree, but also to the employees of contractor companies working with SDJ.
In December 2016, the Baccalaureate Program reached its first milestone with 19 students graduating from the program. The ceremony was held in Susques and was attended by key representatives of SDJ and the Provincial Government. The Baccalaureate Program runs from February to December each year. In 2018, SDJ’s Baccalaureate Program had 27 students: 19 at Level 1, two at Level 2, and six at Level 3.
Since the program began, classes continue to run on schedule and the level of enthusiasm amongst students remains high. It is expected that enrolment in the program will continue to grow and, based on the progress of current students, SDJ is expecting more graduates this year.
Since the SDJ Education Plan was implemented we’ve seen the percentage of local employees with secondary education increase to 40%. Our objective is to reach 66% by 2020 and 100% by 2025.
Commence the Regional Bachelaureate Program at SDJ
532 41
Conduct Education Survey of all SDJ Employees
Establish Remote Education Facility (HQ - Olaroz Project)
Sign Agreement with Jujuy’s Ministry of Education
Register SDJ Employees in Knowledge Review Cycle
2014 2015
4
48 COMMUNITIES
For
per
sona
l use
onl
y

Community Workforce Education Levels
100
80
60
40
20
0
Primary Complete
Secondary Complete
Completing Secondary
2014 2017 2020* 2025*
100%
17%
66%
17%26%
40%
34%
49%
26%
25%
*Target figures
OROCOBRE SUSTAINABILITY REPORT 2018 49
CO
MM
UN
ITIE
S
For
per
sona
l use
onl
y

Additional Training Programs
Additional courses that were delivered in the reporting period include:
• Craft Bakery Courses – delivered collaboratively with Cookins (SDJ’s catering supplier) across three communities. There were two classes per community, with over 200 people participating.
• Introduction to Chemistry Course – ran from July to September 2017, with 13 classes per community. Upon completion of the course, three students with the best average grades were invited to join the SDJ workforce as operators in the salt harvest area.
Education Infrastructure
In 2018, the Technical School of Chemistry was inaugurated in Olaroz. This school was developed collaboratively with SDJ contributing project funds, the community constructing the school and the local government defining course content and its delivery in alignment with regional education priorities. Throughout FY18 SDJ has been working with the Olaroz community to construct a chemistry lab that will complement the facilities provided at the Olaroz Technical School of Chemistry.
50 COMMUNITIES
For
per
sona
l use
onl
y
Production & Natural Resources
Artisan Development Project – Case Study 3
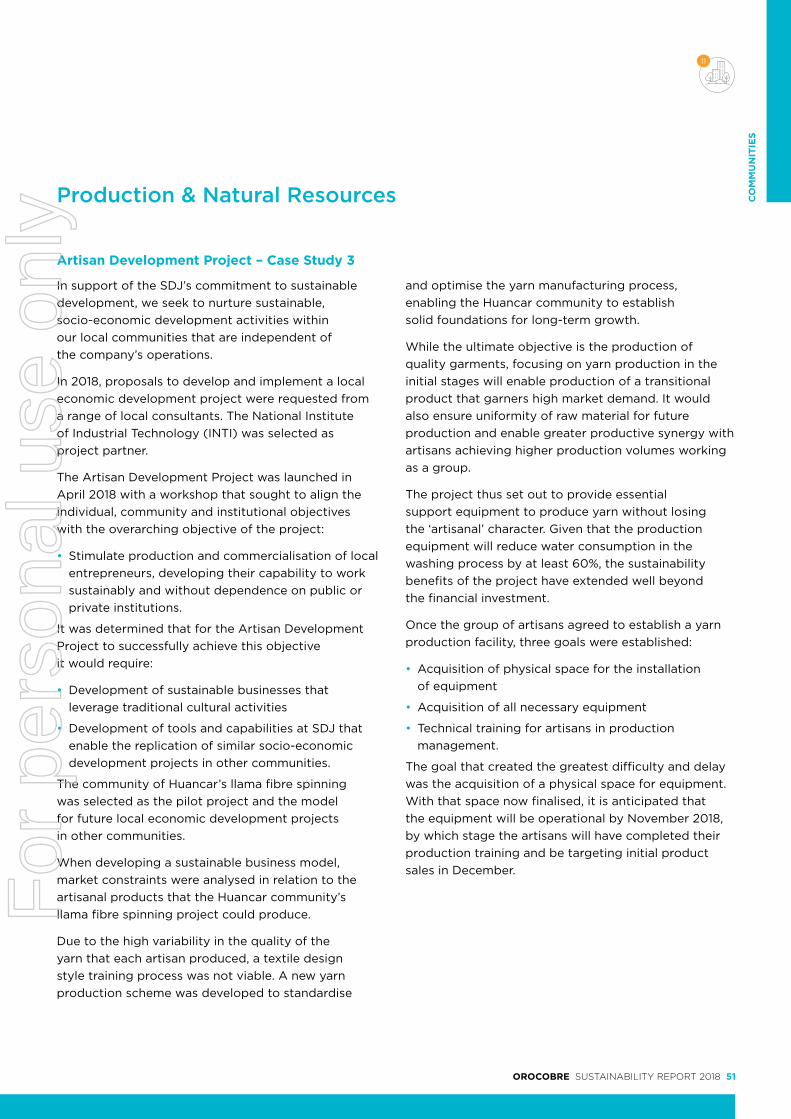
In support of the SDJ’s commitment to sustainable development, we seek to nurture sustainable, socio-economic development activities within our local communities that are independent of the company’s operations.
In 2018, proposals to develop and implement a local economic development project were requested from a range of local consultants. The National Institute of Industrial Technology (INTI) was selected as project partner.
The Artisan Development Project was launched in April 2018 with a workshop that sought to align the individual, community and institutional objectives with the overarching objective of the project:
• Stimulate production and commercialisation of local entrepreneurs, developing their capability to work sustainably and without dependence on public or private institutions.
It was determined that for the Artisan Development Project to successfully achieve this objective it would require:
• Development of sustainable businesses that leverage traditional cultural activities
• Development of tools and capabilities at SDJ that enable the replication of similar socio-economic development projects in other communities.
The community of Huancar’s llama fibre spinning was selected as the pilot project and the model for future local economic development projects in other communities.
When developing a sustainable business model, market constraints were analysed in relation to the artisanal products that the Huancar community’s llama fibre spinning project could produce.
Due to the high variability in the quality of the yarn that each artisan produced, a textile design style training process was not viable. A new yarn production scheme was developed to standardise
and optimise the yarn manufacturing process, enabling the Huancar community to establish solid foundations for long-term growth.
While the ultimate objective is the production of quality garments, focusing on yarn production in the initial stages will enable production of a transitional product that garners high market demand. It would also ensure uniformity of raw material for future production and enable greater productive synergy with artisans achieving higher production volumes working as a group.
The project thus set out to provide essential support equipment to produce yarn without losing the ‘artisanal’ character. Given that the production equipment will reduce water consumption in the washing process by at least 60%, the sustainability benefits of the project have extended well beyond the financial investment.
Once the group of artisans agreed to establish a yarn production facility, three goals were established:
• Acquisition of physical space for the installation of equipment
• Acquisition of all necessary equipment
• Technical training for artisans in production management.
The goal that created the greatest difficulty and delay was the acquisition of a physical space for equipment. With that space now finalised, it is anticipated that the equipment will be operational by November 2018, by which stage the artisans will have completed their production training and be targeting initial product sales in December.
11
OROCOBRE SUSTAINABILITY REPORT 2018 51
CO
MM
UN
ITIE
S
For
per
sona
l use
onl
y

11
Raising Recycled Walls – Case Study 4
The Raising Recycled Walls Project supports the construction of greenhouses in the local communities of Pastos Chicos and Huancar using plastic bottles recycled from the Olaroz Lithium Facility.
The project was developed to address malnutrition, which was identified as a particular health issue in these communities.
The project is designed to provide future agricultural production facilities for local communities. It also provides an effective way to recycle plastic bottles used on site and in the community, with the bottles serving as the fundamental construction material for the greenhouses.
The project is rolled out over the following stages:
Any additional construction materials are sourced and transferred to the construction sites through collaboration with suppliers and the Municipal Commission of Susques.
Construct greenhouse
532 41
Collect used plastic bottles from Olaroz
Transfer bottles from Olaroz to the community
Fill bottles with earth
Transfer bottles to construction site
2
52 COMMUNITIES
For
per
sona
l use
onl
y

Pastos Chicos
The greenhouse at Pastos Chicos is complete and the following crops have been planted: lettuce, swiss chard, zucchini, pomegranate, aloe vera, strawberry and pine in a pot.
The owner of the Pastos Chicos greenhouse has great expectations that it will enable him to sow crops and consume fresh fruit and vegetables all year round. He is very grateful to have been involved in the Raising Recycled Walls Project.
He is the President of the local producers’ groups and has shared his experience with other producers, helping to generate great interest in delivery of similar projects.
Huancar
Another greenhouse located in Huancar is nearing completion. The roof structure is in place awaiting installation of translucent sheets of plastic. To strengthen the overall structure during construction, sections of the walls were plastered with mud and a structural support post was placed in the centre of the greenhouse floor.
OROCOBRE SUSTAINABILITY REPORT 2018 53
CO
MM
UN
ITIE
S
For
per
sona
l use
onl
y

Environment
Future Commitments
Assurance of environmental data
Establish solid baseline for environmental performance based on assured data
Integrate energy and emissions performance into corporate and operational KPIs
Set short-and long-term targets for energy and emissions intensity reduction
54 ENVIRONMENT
For
per
sona
l use
onl
y

Environmental Impacts
Impact of Environment on our Operations
Impacts on Value Chain
Water Energy Emissions
Impacts on our Operations Impacts on Community
Impact of our Operations on the Environment
Port Infrastructure ImpactsExtreme weather impacting distribution channels through ports.
There are two sources of water extraction: brine from the salar and industrial water (groundwater) which is treated and used for processing. Water is returned to the evaporation ponds after processing to recover residual lithium. There are no discharges to the environment.
Energy is generated by the natural gas generators to power processes in the production plant and provide electricity for the camp.
There are 3 main emission sources; energy generation, process emissions and transport related emissions.
Brine extraction
Emissions within our operation
Emissions in our value chain
Industrial water extraction
Energy used to treat water for production.
By enabling clean energy alternatives, we offset emissions.
Thermal energy is captured and reused wherever possible through heat exchangers.
1 1
2
3
32
Road ClosuresExtreme weather impacting distribution channels across border and access roads.
Evaporation PondsClimatic conditions impacting our evaporation ponds and expansion activities.
Community Impact Extreme weather impacting on communities’ health, productivity.
Flash flooding, landslides.
Sun, wind, rain. Droughts, natural disasters.
12 13
OROCOBRE SUSTAINABILITY REPORT 2018 55
EN
VIR
ON
ME
NT
For
per
sona
l use
onl
y

Impact of Climate
Climatic variables & their impact on production volumes
Our production process utilises natural solar energy to evaporate brine extracted from the salar and concentrate the lithium content before it enters the processing plant. Because natural evaporation forms a critical part of our production process, our productivity is dependent on contributing climatic variables.
In the March quarter of 2018, we were forced to revise our annual production guidance due to unfavourable climatic conditions in the region. The February mean evaporation rate was the lowest recorded since 2011 and less than half of February 2017. This resulted in lower than expected brine concentrations at the beginning of March.
Brine concentrations were dually affected by both the reduction in solar radiation due to cloudy conditions and the above normal rainfall. While concentrations improved during March, they did not recover to the level expected, affecting production performance in the final half of the financial year.
While we acknowledge the impact of adverse climatic conditions on our operations, data indicates that these conditions are not representative of a regular climatic pattern or trend in the region.
We are exploring ways to improve pond management and reduce losses in the event of unfavourable climatic conditions. This includes the potential adoption and implementation of new technology (including a large crystalliser) to stimulate the evaporation process in periods of low solar radiation. Maintaining higher pond inventory levels and increasing overall pond evaporation area are also being investigated as potential mitigation methods.
Impacts on our evaporation process place greater demands on our production process, requiring greater energy and material inputs to compensate for reduced brine concentration levels.
In this regard, climatic variables impact not only our productivity and operational efficiency, but also our environmental performance.
13
Our production process utilises natural solar energy to evaporate brine extracted from the salar and concentrate the lithium content before it enters the processing plant.
“
56 ENVIRONMENT
For
per
sona
l use
onl
y

Impact on Environment
Improving our energy productivity & carbon emissions profile
Energy
We have a relatively clean energy profile. While we are yet to develop any renewable energy sources, our operations are based predominantly on natural gas with diesel (and in rare cases petrol) being used for some stationary and transport equipment.
We use natural gas for two primary purposes: generation of electricity for our operations and the generation of heat in our production process.
In 2018 our total energy consumption increased 8%. But given increased production volumes our total energy intensity only increased by 3%. Electricity consumption increased 18% which reflects increased production, the adoption of additional chillers in our purification circuit and the shift from gravity transfer to electric pumps in our pond system.
There was no change in heat energy consumption in the plant in 2018, though we did see a 5% improvement in heat intensity due to increased production volumes.
With the commencement of Stage 2 Expansion activities in 2018, there was an increase in the number of people and activities on site which equally increased the demands for electricity across our operations.
We are currently exploring initiatives that will reduce the demand for heating in our processes including the use of more efficient heat exchangers and the recapture and reuse of vapor to capitalise on existing heat in the system.
As part of our expansion activities we are also exploring renewable energy alternatives to power our remote well-sites and to provide electricity to the operations. We are also investigating new technology leveraging solar thermal generation to reduce the consumption of natural gas in the generation of heat for production processes.
200,000
160,000
120,000
80,000
40,000
0
25
20
15
10
5
0
Electricity
Heat
Total Energy
Electricity Intensity
Heat Intensity
Total Energy Intensity
2016 2017 2018
MW
h
MW
h/t
Energy Consumption (MWh)
Natural Gas 91%
Diesel 9%
Petrol negligible
Fuel Consumption 734,660 GJ
12
OROCOBRE SUSTAINABILITY REPORT 2018 57
EN
VIR
ON
ME
NT
For
per
sona
l use
onl
y

Emissions
In 2018 we commissioned an external consultancy to prepare a thorough emissions inventory for our SDJ operation. Data was collected from both the Olaroz Production Facility and our office in Jujuy, with a view to reporting completely on our Scope 1 and Scope 2 emissions and, where possible, our key Scope 3 emissions.
The inventory provided us not only with a robust baseline, but also a documented methodology and procedures based on the GHG Protocol. This will ensure that the data we are collating and reporting is an accurate and consistent representation of our performance year on year.
This was the critical initial step towards enabling assurance of our data in future years. In the coming year we will be implementing a cloud-based data management system that will capture and control critical data points across the organisation and automatically calculate our emissions performance using pre-defined methodologies and emissions factors.
With both the methodology and data management system established, we will be well placed to assure our data on an annual basis, and thus provide greater confidence to our investors and the global community regarding our commitment and contribution to reducing global GHG emissions.
We submitted our first report to the Carbon Disclosure Project in 2018, disclosing our 2017 emissions performance and broader climate risk information.
We will continue to disclose to CDP over coming years and, as with the DJSI, see CDP as an opportunity to objectively evaluate and benchmark our carbon and broader climate risk management performance over time.
Emissions by Source (%)
Scope 1 76%
Scope 2 negligible
Scope 3 24%
Emissions by Scope (%)
Scope 1
Electricity generation 34%
Process heat 33%
Transport 7%
Other Scope 1 sources 2%
Scope 2
Purchased electricity negligible
Scope 3
Soda ash production 11%
E, P, & T 12%
Other Scope 3 sources 1%
58 ENVIRONMENT
For
per
sona
l use
onl
y

9
Understanding & managing our consumption
Water
In 2017 we identified that while we had visibility of our overall water consumption, we did not have a clear way of identifying in which parts of our operations that water was being consumed and in what quantity.
In 2018 we installed a series of meters to provide a clear break-down of consumption across our operations. This affirmed the high consuming areas of the plant and identified areas where consumption was higher than anticipated, allowing us to initiate targeted reduction campaigns. It also highlighted some inefficiencies in the piping infrastructure that we will be working to address in the coming year.
Water extraction
Water extraction remains the best indicator of our total water consumption. We do not extract water from any surface or fresh water sources. The water we extract is industrial groundwater which must be treated onsite prior to use in our operations. The low quality of this water means that it is not used for any other means by any other groups or industries.
700,000
600,000
500,000
400,000
300,000
200,000
100,000
0
14,000
12,000
10,000
8,000
6,000
4,000
2,000
0
Extraction of Groundwater (m3)
Total Production (tonnes)
2016 2017 2018
m3
t LC
E
Industrial Water Consumption
12
Source 2016 2017 2018 % Change
Industrial Water Extraction (m3) 371,096 485,300 607,608 25%
OROCOBRE SUSTAINABILITY REPORT 2018 59
EN
VIR
ON
ME
NT
For
per
sona
l use
onl
y

Water intensity
We had a target to reduce water intensity by 15% in 2018. This target was set in 2017 based on our forecast production figures for 2018.
Given climatic conditions negatively impacted our production levels in Q3, we were required to use more water to generate product from less concentrated brine. Our final production output was also less given the additional processing time required. As a result, rather than decreasing by 15% our water intensity increased by 18%.
It should be noted that in Q2 we also brought online an additional boiler within the plant which resulted in greater water intensity per tonne of lithium produced across both our prime and purified products.
We have identified opportunities to increase efficiencies in production through the capture and reuse of water and vapor in our processes.
That said, preparing and installing the necessary infrastructure to capitalise on that opportunity is not a quick and easy process. Having developed the project plan and acquired the budget, the procurement and installation of equipment may take anywhere from 6-12 months.
These lessons learned in current production are being integrated into the design and development of the new lithium carbonate plant to be constructed as part of the Stage 2 Expansion.
2016 2017 2018 % Change
Intensity (m3/t) Prime* Purified Prime Purified Prime Purified Prime
Water Intensity by Product 53.76 58.9 36.8 66.5 44.2 13% 20%
Water Intensity – Total Production 53.76 41.6 49.1 18%
Water Intensity by Product
70
60
50
40
30
20
10
0
2016 2017 2018
Prime
Purified
m3 /
t
*We did not produce a purified lithium carbonate product in 2016.
60 ENVIRONMENT
For
per
sona
l use
onl
y

Waste water
For water consumed in non-production-related activities, we have waste water treatment facilities on site. Once treated and quality tested, the water is reused for certain operational tasks including dust suppression and watering of roads.
Treated water that is not recycled on site is sent to the provincial water treatment facility for further treatment and recycled at a provincial level.
Unlike traditional mining operations, and even some of the existing brine-based operations, we do not have any waste water discharges from production.
Any water used in production is either vaporised or discharged back to the pond system for evaporation and concentration, so we do not have tailings dams (see Debunking Myth #4 on page 68).
Water Intensity – Total Production
60
50
40
30
20
10
0
14,000
12,000
10,000
8,000
6,000
4,000
2,000
0
Water Intensity (m3/t)
Total Production (tonnes)
2016 2017 2018
m3 /
t
t LC
E
OROCOBRE SUSTAINABILITY REPORT 2018 61
EN
VIR
ON
ME
NT
For
per
sona
l use
onl
y

By TypeWaste (t)
By Disposal MethodNon-Hazardous Waste (t)
16
14
12
10
8
6.
4
2
0
Recovery Treatment and Disposal
100
80
60
40
20
0
Recycled Landfill
2016 2017 2018
8.67 71.68 15.77 78.58 18.06 89.75
2016 2017 2018
4.47 13.83 5.44 11.82 4.36 14.53
t LC
E
t L
CE
140
120
100
80
60
40
20
0
Organic
Recyclable
Non-recyclable
Hazardous
2016 2017 2018
t LC
E
Hazardous Waste (t)
12
Waste
Waste at the Olaroz Lithium Facility is classified and treated according to its type and associated handling risks. Each area is responsible for classifying their waste, managing waste disposal in containers that are sufficiently and appropriately labelled and organising timely and efficient waste collection from their respective areas.
SDJ is a registered generator of hazardous waste and all hazardous waste is managed and transported in accordance with the standards set by National Law 24.051.
Organic and non-recyclable waste is sent to Jujuy's Provincial Waste Facility in Palpalá and recyclable waste is either stored on site and reused or sent to specific recycling facilities.
Given the high proportion of organic and recyclable waste, we are continuing to explore disposal opportunities that minimise the amount of waste being sent to landfill.
62 ENVIRONMENT
For
per
sona
l use
onl
y

Biodiversity
As part of our broader commitment to the environment and natural resource management, Orocobre is committed to maintaining, enhancing and conserving local biodiversity and ecosystems.
While the Olaroz Lithium Facility is not located within a national or international protected area, the 18,000 ha site is located within the Olaroz-Cauchari Reserve.
The Reserve was created in 1981 by the Jujuy provincial government to protect the vicuña, which had become a threatened species. Art. II of the Provincial Law 3820 established the reserve as a multi-use area in which agricultural, mining and scientific-technical research programs could be carried out. Any activity related to hunting or the introduction of exotic fauna and flora is prohibited.
Given the minimal biodiversity impact identified for our operations in the short, medium and long-term, it is not a high-priority issue for our operations, but it does remain a constant focus. We are committed to preserving local biodiversity and to ensuring controls are in place to monitor and maintain potential impacts.
The project’s main biodiversity impact relates to the risk of vehicular movement on fauna. We have various precautionary measures in place to manage this including restrictions on vehicular circulation, employee training on wildlife preservation and warning signs and maximum speeds in sectors with animal presence.
Our pond system was designed to conform with the local topography to minimise land-use impact and
facilitate future remediation. Other practices we adopt to ensure minimal land-use impact include restrictions on surface-level intervention, strict requirements for new road construction and preventive maintenance of roads to avert erosive processes.
A biodiversity baseline was conducted in 2010 as part of the project’s detailed Environmental Impact Assessment. In the four subsequent EIA updates (conducted biennially) there has been no identified impact on biodiversity or ecological processes. We regularly evaluate our impacts with monitoring undertaken quarterly over a defined series of data points and locations.
15
OROCOBRE SUSTAINABILITY REPORT 2018 63
EN
VIR
ON
ME
NT
For
per
sona
l use
onl
y

Myth-Busters
Debunking Myth #1: Soda Ash & Emissions
We have found that in many investor and analyst reports, our emissions risk is considered quite high. Given the low emissions profile of both our operations and our product we have never really understood why.
Undertaking the emissions inventory, we learned that the use of soda ash (otherwise known as sodium carbonate - Na2CO3) in production generally constitutes a large source of Scope 1 emissions. For this reason, consumption per ton of soda ash is assigned a specific value of CO2 and emissions are calculated on that basis. If calculated on this basis, our CO2 emissions from soda ash would have been equivalent to the emissions associated with the generation of electricity on site.
Fortunately for the environment, the use of soda ash in the production of lithium carbonate does not produce CO2 emissions.
Soda ash is added in the form of a solution and mixed with lithium in the brine, precipitating Li2CO3 (as solids) and leaving sodium ions as solution. As the addition of soda ash is chemically proportional to the concentration of lithium present in the brine, there are no CO2 emissions. And if there is an excess of soda ash, the sodium and carbonate ions remain in solution, so there are no CO2 emissions in that case either.
What we do consider in our emissions inventory, however, are the Scope 3 emissions relating to the production of soda ash that we consume in our operations. And the soda ash that we use in our operations is the natural form of soda ash that has a lower emissions profile than some other forms of soda ash used by companies in production.
12
64 ENVIRONMENT
For
per
sona
l use
onl
y

Debunking Myth #2: Water Stress in the Puna
We have found that in many investor and analyst reports, we are considered high risk with regards to water stress.
This seems unusual to us given the relatively low water intensity of our operations, the fact that we do not draw from any surface water sources and that the groundwater we consume is from the Archibarca Basin in the province of Jujuy (a well-managed basin with adequate water resources and draw-downs monitored and managed by the provincial government).
We acknowledge the realities of a changing global climate, so decided to explore future scenarios to identify and evaluate the exact nature of the perceived water stress risk.
We identified the exact location of our water sources and referred to World Resource Institute’s AQUEDUCT Water Risk Atlas, which enables visualisation of current and future water stress risks to identify which of our sources were currently impacted or could be impacted in future.
6 13
Figure 1: WRI AQUEDUCT Water Stress Risk Map (General) for Olaroz: Low Risk (0-1)
Monte Quemado
Tupiza
Abra Pampa
Calama
Tocopilla
Antofagasta
Taltal
Mina La Casualidad
Antofagasta de la Sierra
Salta
Cafayate
El Galpon
Rosario de la Frontera
Taco Pozo
Castelli
Apolinario Saravia
Las Lajitas
Laguna YemaSan Salvadorde Jujuy
San Ramon de la Nueva Oran
Tartagal
Libertador GeneralSan Martin
Humahuaca
Yacuiba
Tarija
Colonia Neuland
Low risk
Low to medium risk
Medium to high risk
High risk
Extremely high risk
LEGEND
The project zone demarcated indicates SDJs current EIS extraction areas.
OROCOBRE SUSTAINABILITY REPORT 2018 65
EN
VIR
ON
ME
NT
For
per
sona
l use
onl
y

Tupiza
Abra Pampa
Calama
Tocopilla
Antofagasta
Taltal
Mina La Casualidad
Antofagasta de la Sierra
Salta
Cafayate
El Galpon
Rosario de la Frontera
Taco Pozo
Monte QuemadoCastelli
Apolinario Saravia
Las Lajitas
Laguna YemaSan Salvadorde Jujuy
San Ramon de la Nueva Oran
Tartagal
Libertador GeneralSan Martin
Humahuaca
Yacuiba
Tarija
Colonia Neuland
LEGEND2.8x or greater decrease
2x decrease
1.4x decrease
Near normal
1.4x increase
2x increase
2.8x or greater increase
No data
Tupiza
Abra Pampa
Calama
Tocopilla
Antofagasta
Taltal
Mina La Casualidad
Antofagasta de la Sierra
Salta
Cafayate
El Galpon
Rosario de la Frontera
Taco Pozo
Monte QuemadoCastelli
Apolinario Saravia
Las Lajitas
Laguna YemaSan Salvadorde Jujuy
San Ramon de la Nueva Oran
Tartagal
Libertador GeneralSan Martin
Humahuaca
Yacuiba
Tarija
Colonia Neuland
Low risk
Low to medium risk
Medium to high risk
High risk
Extremely high risk
LEGEND
Figure 3: WRI AQUEDUCT Water Stress Risk Map, 2040 forecast: No change
Figure 2: WRI AQUEDUCT Water Stress Risk Map (Mining) for Olaroz: Low Risk (0-1)
The project zone demarcated indicates SDJs current EIS extraction areas.
66 ENVIRONMENT
For
per
sona
l use
onl
y

Debunking Myth #3: Archibarca Basin & Coranzuli
There was some commentary in the past 12 months regarding Orocobre’s use of a basin near Coranzuli as a source of water for our operations.
To ensure transparency and clarity regarding our water sources, we would like to present a graphic representation of our wells and groundwater sources relative to the communities that are local to our operations.
Coyahuaima
El Toro
Coranzuli
San JuanSan Juan De Quinllaques
Susques
Huancar
Jama
Olaroz Chico
Catua
Muñayoc
Guadalupe De La Peña
Industrial Wells
LEGEND
OROCOBRE SUSTAINABILITY REPORT 2018 67
EN
VIR
ON
ME
NT
For
per
sona
l use
onl
y

Debunking Myth #4: Mineral Waste & Tailings
Unlike traditional mining operations and the operations of some of our brine-based peers, we do not require tailings facilities. Liquid waste from our production process is immediately fed back to the pond system, therefore we do not require a tailings management system.
In terms of mineral waste, we manage salt (mainly halite and sylvite) buildup in our evaporation ponds. This is done through a process of salt harvesting, which is conducted every three years.
Salt harvesting involves sequential draining of certain ponds and the removal of the majority of contained salts. These salts are then transferred to a harvested salt stockpile, where leaching and drainage enables the recovery of highly concentrated lithium brine.
So not only do our waste minerals (salts) mirror those naturally occurring in the local environment, they also provide an additional, high-quality source of lithium for use in production.
RAW WATER
REVERSE OSMOSIS
DRY & BAGGING
BELT FILTER
DRYER
RE-PULPREACTOR
CRYSTALLISER
THICKENER
PURIFIEDPRIMARY
SOLID IMPURITIES
FILTER
IMPURITY SCAVENGING
MICRONISER
PRIMEPURIFIED MICRONISED
LITHIUM CARBONATE PACKAGING
5
WELLS
1
PURIFICATIONCIRCUIT
CUSTOMERS
4
BORE FIELD
BRINE FEED
PONDS
2
PRIMARY CIRCUIT
3
FEED PONDEVAPORATION
PONDS
BURNT LIME SILO
SODA ASH SILO
HEATING
CENTRIFUGES
SODA ASH MIXING
LITHIUMCARBONATEPRECIPITATE
LIME SLAKING
BRINE LIMING
HARVEST PONDS
PRECIPITATION REACTOR
SATURATED LITHIUM CARBONATE ( Li2CO3 ) BRINE
HARVESTED SALT STOCKPILE
POLISHREACTOR
MAGNETICFILTERS
+
68 ENVIRONMENT
For
per
sona
l use
onl
y

12
OROCOBRE SUSTAINABILITY REPORT 2018 69
EN
VIR
ON
ME
NT
For
per
sona
l use
onl
y

2018
2016
2017
People & Capability
Future Commitments
Increase % of workforce with technical qualifications
Incorporate KPIs and objectives into annual performance review
Increase participation in employee engagement survey
Establish targeted development and succession plans
Complete cultural review program
70 PEOPLE & CAPABILITY
For
per
sona
l use
onl
y

Total Male Female Local Provincial National International <30 30 – 50 >50
9 7 2 7 2 2 7
64 50 14 4 26 32 2 13 48 3
178 160 18 91 57 30 95 78 5
251 86% 14% 38% 33% 27% 2% 43% 51% 6%
8 6 2 6 2 3 5
67 53 14 21 23 22 2 7 54 7
207 180 27 121 53 32 112 83 11
282 85% 15% 50% 27% 21% 2% 42% 50% 8%
11 9 2 8 3 8 3
92 78 14 5 40 44 3 8 77 7
206 176 30 133 48 25 88 108 10
309 85% 15% 45% 28% 25% 2% 31% 62% 7%
2018
2016
2017
Workforce Breakdown
Male 85%
Female 15%
<30 31%
30–50 62%
>50 7%
Local 45%
Provincial 28%
National 25%
International 2%
Age Diversity
Gender Diversity
Local Employment
Senior Managers Middle Managers Operators
OROCOBRE SUSTAINABILITY REPORT 2018 71
PE
OP
LE &
CA
PAB
ILIT
Y
For
per
sona
l use
onl
y

Changing Workforce
Transitioning from general to specialist workforce
As our project matures and evolves, so too does the demand for specialist staff to undertake more highly skilled, strategic functions within our operations.
We have attracted skilled labour regionally, nationally and internationally, with the relocation of key managerial staff from Australia to Argentina to assume strategic operational roles.
We have also placed increasing focus on the identification and development of high-potential employees, providing tailored development programs that support their progression into specialist and leadership roles.
In addition to meeting the capability demands of our rapidly maturing lithium operation, in 2018 we were required to recruit a highly skilled project team to manage the Stage 2 Expansion.
The project team has drawn talent nationally and internationally to fill lead roles in project management, engineering, hydrogeology, finance and contracts management.
Leveraging synergies across our operational and development activities has been achieved through the provision of detailed shared services and matrix reporting structures. This has enabled expertise and capability to be effectively leveraged and supported across both sides of the business.
Having recruited and developed such high calibre people to these specialist and leadership roles, our focus remains on employee satisfaction and retention.
We have increased our target turnover rate to under 15% in the short to medium term, acknowledging that a higher turnover rate is inevitable as we resource the company more effectively for future growth.
In the future we will seek to drop this rate to 10-12% once we have achieved greater stability and maturity in our operations.
Maintaining commitment to local employment
Developing and retaining our workforce for the long term has always been a key focus for the Company and it will become increasingly more significant in future years as other large-scale operators move into the region.
Given the need for an increased percentage of highly skilled labour across the Company’s operations, we acknowledge that maintaining our commitment to local employment will require a greater focus on local education and skills development.
As part of our community agreement with Olaroz Chico, we committed funds for the construction of a Technical College (Chemistry) to serve as a tertiary training facility for local communities that specialises in chemical processing.
The construction was funded by SDJ, the building was constructed by local communities, with a curriculum and training program that was developed by the provincial government to promote capability development in the province in alignment with local career opportunities.
The newly constructed facility will provide space for five classrooms, administrative area, multimedia room, library, laboratory, health services, disabled toilets, full kitchen, dining room, covered patio and recreational area for cultural and sports activities.
The Secondary School and Technical College (Chemistry) in Olaroz Chico will both operate in the same facility. There are also plans to construct a neighbouring student residence for students who have travelled from other communities in the region to attend the college.
8
72 PEOPLE & CAPABILITY
For
per
sona
l use
onl
y

Employee Satisfaction
Leadership changes & impact on employee morale
In 2018, two core leadership changes were announced which had the potential to generate uncertainty and insecurity within the SDJ workforce.
The first leadership change was the replacement of SDJ’s General Manager (GM) with two new, discrete General Manager roles focused on Operations and Shared Services (March 2018).
As the new GMs already held responsibility in part for these respective areas, the transition was smooth. The Company’s COO assumed a more prominent role in SDJ throughout the transition period to support the new GMs and ensure seamless business continuity.
The second leadership change was the announcement by Orocobre CEO that he would be stepping down (see ASX Release dated 17 April 2018). This came very soon after the changes at SDJ and so managing employee perceptions and morale through this period was fundamental.
A continuing focus on our values and engagement with employees and workers unions throughout this period enabled the Company to maintain a strong morale in the workplace.
We had no lost days due to union activity during the reporting period and while employee results
from our engagement survey remained high at 99%, we acknowledge that the percentage of employee participation is dropping each year with only 53% participating in 2018. In 2019 we will work to determine whether this reduction in employee participation is due to logistical considerations such as access and availability of the survey, or if it is itself an indication of a decreasing level of engagement within the workforce.
Implementing systems for employee management
To enable SDJ’s People Development team to focus more intently on ensuring the satisfaction, development and productivity of the workforce, the Company deployed a dedicated IT system in 2018 which automated some aspects of employee administration.
The new system enables SDJ to more easily manage and support employees by liberating resources within the People Development team to focus on staff development and delivery rather than basic employee administration.
The facilitated entry, monitoring and evaluation of employee-related metrics provides a valuable platform through which the Company can develop and implement more robust managerial approaches to employee engagement, career development, succession planning and objectives-based performance evaluation and remuneration.
100%
80%
60%
40%
20%
0%
% employees responded to survey
% respondents actively engaged
2016 2017 2018
16.00
14.00
12.00
10.00
8.00
6.00
4.00
2.00
0.00
59% 99% 53% 99%78% 86%
Engagement Survey Results
OROCOBRE SUSTAINABILITY REPORT 2018 73
PE
OP
LE &
CA
PAB
ILIT
Y
For
per
sona
l use
onl
y

5 8
Total Male Female Local Provincial National International <30 30 – 50 >50
55 50 5 9 22 22 2 23 27 5
22% 91% 9% 16% 40% 40% 4% 42% 49% 9%
42 40 2 27 6 8 1 24 16 2
15% 95% 5% 64% 14% 19% 2% 57% 38% 5%
63 47 16 18 23 21 1 17 44 2
20% 75% 25% 29% 37% 33% 2% 27% 70% 3%
Total EmployeeInitiated
CompanyInitiated
27 16 11
11% 59% 41%
29 21 8
10% 72% 28%
41 20 21
13% 49% 51%
2018
2018
2016
2016
2017
2017
Retention Rates
New Hires
100% of our workforce receive Professional Development Reviews
Turnover
A 20% increase from the
previous year
25% of new hires were female
74 PEOPLE & CAPABILITY
For
per
sona
l use
onl
y

Remuneration Ratios
We have a unionised workforce and as such, salaries are standardised based on function, regardless of sex, age or any other characteristic.
Local 15%
Regional 42%
National 41%
International 2%
<30 66%
30 – 50 32%
>50 2%
Turnover by region
Turnover by age
Turnover by gender
Employee Initiated Turnover
$0.93 $1.00
Company Initiated Turnover
Male Female
Gender Salary Ratio
Executive Employee Ratio
2016 2017 2018
Senior Managers 1.01 1.00 0.91
Middle Managers 0.90 0.96 0.97
Operators 1.11 0.92 0.92
Total 1.01 0.96 0.93
2016 2017 2018
Ratio of the annual total compensation for the organisation’s highest-paid individual in the country to the median annual total compensation for all employees in the country
5.16 5.04 4.78
Ratio of percentage increase in annual total compensation for the organisation’s highest-paid individual to the median percentage increase in annual total compensation for all employees
1.24 1.19 0.68
5
20172018
Collective Bargaining Agreement
Union Membership Female Male
81% 100% 40% 36%
OROCOBRE SUSTAINABILITY REPORT 2018 75
PE
OP
LE &
CA
PAB
ILIT
Y
For
per
sona
l use
onl
y

Parental Leave
2016
2017
2018
5
13
24
100%
100%
100%
100%
100%
100%
2
8
2
8
22
22
3
5
2
3
5
2
5
13
24
Employees eligible for Parental Leave
Employees eligible for Parental Leave
Employees eligible for Parental Leave
Returned after 6 months
Returned after 6 months
Returned after 6 months
Retained after 12 months
Retained after 12 months
Retained after 12 months
Employees who took Parental Leave
Employees who took Parental Leave
Employees who took Parental Leave
100%
100%
100%
Male Female
76 PEOPLE & CAPABILITY
For
per
sona
l use
onl
y

OROCOBRE SUSTAINABILITY REPORT 2018 77
PE
OP
LE &
CA
PAB
ILIT
Y
For
per
sona
l use
onl
y

Culture
78 CULTURE
For
per
sona
l use
onl
y

Code of Conduct
Orocobre’s code of conduct defines the standard with which our board, management and employees are to comply when dealing with each other, with shareholders and with the broader community. It affirms our commitment to human rights, to the ideal of equal employment opportunity and to providing a safe workplace that is free of harassment and discrimination.
In accordance with the Code, Orocobre’s Board and Management comply with all legal obligations and act ethically and responsibly in all their dealings. We take a strong stance against corruption in all its forms including extortion and bribery and have had a zero-tolerance approach to corruption since the initiation of our activities in Argentina. We acknowledge that bribery and corruption can occur at all levels of the organisation and across all departments and dealings, both internal and external, and are working to systematically embed our zero-tolerance policy.
We respect and value the competitive advantage of diversity and the benefit it brings to our organisation, recognising that diversity enriches our perspective, improves corporate performance, increases shareholder value and maximises the probability of us achieving our goals. Our operations in Argentina boast a diverse workforce in terms of culture and gender, and we look forward to further strengthening this diversity in future.
We act with honesty, integrity and fairness in all dealings with the community. We respect the cultural heritage of our local and indigenous communities, and act responsibly towards the environment, acknowledging the strong connection between land and peoples. Any non-compliance with the code of conduct is reported directly to the Chief Operating Officer/Managing Director or Chairperson, as appropriate, and may result in disciplinary action. There is a whistleblower program in place across all our operations, enabling anonymous reporting of breaches at all levels of the organisation.
Culture Management
Reinforcing our values & culture
Guiding Principles
Responsibility
We assume responsibility for our actions and commitments
Respect
We recognise and promote all without distinction of age, sex or position, maintaining attitudes and actions that help our community and improve our environment
Honesty
We behave and engage with sincerity and consistency
Integrity
We act with integrity in every situation
Commitment
We convert our different opinions into shared convictions to achieve a common vision
Solidarity
We strive for the common good, acknowledging that we are all responsible for our collective wellbeing
OROCOBRE SUSTAINABILITY REPORT 2018 79
CU
LTU
RE
For
per
sona
l use
onl
y

Culture Management
Code of Conduct & Culture Review
In FY18 an employment contract was terminated due to a breach of our code of conduct. This prompted a review of the implementation of our code of conduct to understand how well it is understood and upheld by members of our workforce.
It also prompted a review of Orocobre’s Whistleblower Policy and its effectiveness as a trusted channel for reporting concerns. Following the review, a new Orocobre Whistleblower Policy (available on the Company website www.orocobre.com) was drafted which provided distinct communication channels for both Australia and Argentina to confidently, effectively and anonymously report issues as they arise.
The Code of Conduct review prompted a more in-depth review of organisational culture and the norms and behaviours that have become part of the way people work at SDJ.
A program was initiated, with Stage 1 diagnostics launching in early FY19, to provide a holistic view of established and aspirational cultural norms across the organisation. More information on the outcomes of this program will be reported in next year’s sustainability report.
Anti-Corruption: Reinforcing Zero-Tolerance
Orocobre upholds a zero-tolerance approach to bribery and corruption and this has been a core pillar of the culture and values espoused by the Orocobre Board and Executive over the past decade.
Becoming participants of the UN Global Compact in 2018 encouraged us to focus more intently on the practical realities of this zero-tolerance approach and on the effectiveness of our internal policies and processes to ensure that it was ingrained, respected and enforced at all levels of the organisation.
A standalone Anti-Bribery and Corruption Policy (available on the Company website www.orocobre.com) was prepared and approved by the Board which outlines the responsibilities of Orocobre’s Directors, employees, contractors and agents in observing and upholding Orocobre’s zero-tolerance position on bribery and other forms of corrupt behaviour.
The policy defines the Company’s approach to bribes, political and charitable contributions/sponsorships, gifts and hospitality and dealings with third parties. It also outlines the consequences of policy breach for employees and agents, including termination of employment or contract.
Training on the policy has been integrated as part of the induction process for all employees, with existing employees receiving regular training on the implementation of and compliance with the policy.
Over the coming 12 months we will seek to establish systems and processes to evaluate and monitor high risk areas within the organisation.
We will draw on the tools provided by the UN Global Compact to implement more robust approaches at both a corporate and operational level.
80 CULTURE
For
per
sona
l use
onl
y

Health & Safety Performance
Consolidating Health & Safety
Orocobre fosters a ‘zero harm’ approach when it comes to the safety of our employees and project contractors. We are committed to reducing workplace risks and incidents, and consistently review our management and reporting systems to enhance the safety of our operations.
In 2018 we consolidated our health and safety teams to enable a more cohesive and integrated management approach. The restructure saw a Health, Safety and Environment Manager appointed to the Leadership Team, reporting directly to the General Manager of Operations, with responsibility for the ongoing management of SDJ’s health, safety and environmental performance.
Health services have always been provided as part of our employee benefits, and as such were being managed by our People Development Department. Safety, on the other hand, was managed by our Risk Management Department. Given the success witnessed in 2017 through greater collaboration between these two areas, it was acknowledged that an integrated health and safety approach would enable greater visibility of emerging trends and, in turn, more targeted and effective training and prevention initiatives.
Thus far, the results have been positive with improvements in both preventive and responsive areas of performance. This is evidenced by the reduction of our TRIFR from 3.9 to 3.3 in the reporting period.
We have also implemented safety campaigns which extend to the families of our employees and contractors and expand key health and safety messaging beyond the context of our operations.
Health & Safety Highlights
• Reduction of the TRIFR from 3.9 to 3.3
• Recertification audit of our Integrated Management System (in accordance with new versions of the ISO standards of Environment and Quality).
CONTRACTORS 2017 2018
LTIFR* 3.5 1.7
TRIFR 3.5 3.5
EMPLOYEES 2017 2018
LTIFR 3.9 3.0
TRIFR 3.9 3.3
*LTIFR: Lost Time Injury Frequency Rate.
3
OROCOBRE SUSTAINABILITY REPORT 2018 81
CU
LTU
RE
For
per
sona
l use
onl
y

Health & Safety Performance
Future Commitments
Incorporate fire protection system in plant
Prepare and train emergency response brigade
Conduct safety culture change program using the DuPont Safety System
Undertake contractor safety training and awareness
Implement integrated data management and reporting system
Assessing Improvement Opportunities
An in-depth Safety Audit was conducted by DuPont in January 2018 which evaluated SDJ’s safety performance using the DuPont™ Bradley Curve™ (see page 83). This has provided a critical baseline and tool to objectively benchmark our journey to world-class safety performance.
Over the coming years, we will be undertaking a comprehensive safety culture change program, to support our progression towards benchmark best safety performance.
An improvement roadmap was developed to address the key risks and priorities identified during the audit, and this has formed the foundation for detailed improvement planning.
The following five areas have been selected for targeted improvement initiatives:
• Visible Leadership
• Behavioural Observations
• Risk Identification, Evaluation and Control
• Incident Management
• Training and Capacity Building.
To optimise resource allocation and guarantee effective implementation of improvement initiatives, a Safety Management Committee (SMC) was formed to develop and implement a 2-year change program, prioritising initiatives that would have the greatest impact and coverage.
In the first year, the priority is reinforcing management commitment through visible leadership and transforming safety behaviours across the site-based workforce, with the SMC ensuring actions and KPIs are clearly defined and respected.
In the second year, the focus will be on enhancing procedures relating to the identification, evaluation and control of risks, improving communication of lessons learned as part of the incident management process, and the inclusion of targeted safety content in site induction and leadership training.
A 6-month plan was also developed for the Expansion to ensure effective safety controls and systems, particularly focusing on contractor management.
82 CULTURE
For
per
sona
l use
onl
y

DuPont Safety System
“In a mature safety culture (interdependent stage), safety is truly sustainable, with injury rates approaching zero. People feel empowered to act as needed to work safely. They support and challenge each other. Decisions are made at the appropriate level and people live by those decisions. The organisation realises the significant business benefits through higher quality, greater productivity and increased profits” DuPont Sustainable Solutions.
• Safety Audit• Performance Benchmark• Improvement Roadmap
• Visible Leadership• Safety Behaviours
• Risk Identification, Evaluation and Control
• Incident Management• Training and Capacity Building
SDJ Safety Culture Change Program
DuPont™ Bradley Curve™
Supported by implementation of an enhanced safety data and incident reporting system
Relative Culture Strength
SDJ Safety Performance
Natural Instinct
Supervision
Benchmark Best
SDJ Safety Culture Change Program
Inju
ry R
ate
Reactive Dependent Independent Interdependent
Teams
Self
2018 2019 2020
OROCOBRE SUSTAINABILITY REPORT 2018 83
CU
LTU
RE
For
per
sona
l use
onl
y

Risk & Opportunity Management
84
For
per
sona
l use
onl
y

7
Ris
kO
pp
ort
unit
y
Environment
We continue to identify and monitor the social, environmental and economic risks and opportunities associated with our activities and implement action and initiatives accordingly.
We acknowledge that many of these risks and opportunities are dependent on, or affected by, third part activity – be it government, suppliers, or other operators in the region.
As such, a central component to our risk and opportunity management approach lies in regular and proactive engagement with third parties.
Low carbon operations
Reduce energy consumption per unit
of production.
Manage/mitigate associated emissions.
Energy, water & biodiversity
Develop and leverage strong local partnerships to enhance
community access to clean and affordable energy, clean water,
and biodiversity.
Low carbon future
Produce battery grade lithium for clean transport
options and energy storage.
Environmental impact on production
Increase operational buffers.
Prioritise process innovation to mitigate impact of climate
on production.
Environmental integrity of the Basin
Prioritise, adopt, and promote a proactive approach to
Basin Management.
Environmental impact on communities
Constant monitoring of environmental impacts.
Perceptions of our impact on environment
Enhanced communications; Community participation in environmental monitoring.
Government licenses & permits
Ensure compliance with environmental regulations; demonstrate best practice.
Environmental impact on distribution
Identify, evaluate and mitigate climate risk along
our value chain.
COMMUNITIES PRODUCTOPERATIONS
A Climate Risk Assessment will be conducted in 2020.
13 15
OROCOBRE SUSTAINABILITY REPORT 2018 85
For
per
sona
l use
onl
y

Social
COMMUNITIES PRODUCTOPERATIONS
Diversity
Promote diversity in employee/supplier
training and selection.
Responsive benefits, and work-life balance
arrangements.
Capacity Building
Identify capability gaps, provide training and
development programs.
Health & Safety
Health and safety management system (ISO18001), reporting
and training programs.
Industrial Action
Work closely with AOMA* and maintain focus on employee
engagement and satisfaction.
Employee Retention
Monitor voluntary turnover rates.
Promote employee satisfaction.
Managing Community Expectations
Open and honest engagement with our communities; direct
community agreements; community involvement in the project; and shared ownership
of project outcomes.
Community Safety
Community training and awareness,
increased signage, supplier standards and community
whistleblowers.
Customer Satisfaction
Rigorous product quality testing.
Industrial Action
Contingency measures in place to ensure alternate
import/export routes.
Community development
Work with government to support and complement development initiatives.
Implement strategic community investment strategy to ensure
enduring Shared Value.
Enhance supplier performance
Deliver training and compliance programs for our suppliers.
Ris
kO
pp
ort
unit
y
A Human Rights Risk Assessment will be conducted in 2019.
*Asociación Obrera Minera Argentina (the Mining Union of Argentina)
86
For
per
sona
l use
onl
y

Economic
Opportunity for multiple phases of expansion
Long life asset with significant potential
for higher levels of production.
Timing of funds to finance expansion
Delay expansion until operations generate
sufficient capital.
Distribution of financial benefits
Work with government to ensure effective
distribution of financial benefits to communities.
Investor Sentiment
Investor engagement.
Commodity Price
Enhanced commercial capability.
Increasing Supply to Market
Increasingly competitive market as new projects come online.
Employment
Educate and train local communities (primary/
secondary, technical and entrepreneurial skills).
Competitive Advantage in Growing Market
Position ourselves early as supplier of choice through
leading practice Sustainability, Supply Chain and Quality
performance.
Ris
k
We realise that some of these challenges are going to require a long-term approach, while others we can start to address immediately. We also acknowledge that this is only our second year of production and as such there is still much to learn, adapt and refine over the coming years.
While we may not have all the answers now, we are firmly committed to effectively minimising and mitigating these risks (and any others that may arise) whilst capitalising on opportunities to deliver transformative societal change, be it in the support of global energy transitions, or local socio-economic development.
COMMUNITIES PRODUCTOPERATIONS
Op
po
rtun
ity
OROCOBRE SUSTAINABILITY REPORT 2018 87
For
per
sona
l use
onl
y

Governance
88
For
per
sona
l use
onl
y

Board of Directors
At June 30 2018, Orocobre’s Board comprised eight Directors: seven Non-Executive and our Managing Director and Chief Executive Officer. Each of the Board’s Committees – Audit and Risk Committee, Remuneration Committee, and Related Party Committee – are made up of three Non-Executive Directors.1
In addition to these Directors, Orocobre also has three Key Management Personnel (KMP) who have the authority and responsibility for planning, directing and controlling the activities of the organisation. These are our Chief Financial Officer and our General Counsel (joint Company Secretaries), as well as our Chief Operating Officer.
Audit and Risk Committee
Key Management Personnel
Board of Directors
Remuneration Committee
Related Party Committee
The Audit and Risk Committee is responsible for monitoring public reporting, risk management processes, corporate conduct and compliance with laws and regulation. Identifying stakeholders and associated risks and reviewing the effectiveness of communication regarding risk to those stakeholders is also a core component of the Audit and Risk Committee’s responsibilities.
The Remuneration Committee works to develop remuneration policies which motivate Directors and Management to pursue long-term value creation. This ensures the focus of the Orocobre management team on those areas of sustainable development key to long-term value creation.
The Related Party Committee is responsible for reviewing transactions between Orocobre, its related parties and any shareholder having a substantial shareholding. The Committee’s role is to ensure transactions are in the best interests of Orocobre and its shareholders as a whole; fall within the ambit of a normal business relationship; and contain terms no more favourable than those negotiated on an arm’s length basis. The Committee also advises whether shareholder approval of the transaction is necessary or appropriate.
Orocobre’s Governance Framework, including the code of conduct, charters for the operation of the Board and its committees, and other matters relevant to the Governance Framework, are fully disclosed on the Company website www.orocobre.com.
1 Detailed information regarding Board Composition, attendance and Committee Charters can be found in our 2018 Annual Report – Directors’ Report.
OROCOBRE SUSTAINABILITY REPORT 2018 89
For
per
sona
l use
onl
y

Economic/Financial
Includes issues related to sales, investments, costs, income, expenses and returns to shareholders
Continuous Improvement
The virtuous circle of planning-action-review which applies to performance of people, process and equipment across all areas of our operations
Sustainability
Pursuing best practice in production, community engagement, resource utilisation, health and safety, quality and environment. These elements ensure first rate operations and are fundamental to the pursuit of excellence
Customer
Relates to the satisfaction of our current and future customers
Performance against our strategic objectives and our commitment to Sustainable Development is managed at all levels of the organisation via our Balanced Scorecard, which comprises four core categories:
The remuneration policies of Orocobre and its application to Key Management Personnel were fully disclosed in the 2018 Annual Report which can be found on the Company website www.orocobre.com.
Incentive plans are biased to the long term and share price appreciation rather than short-term cash rewards. The cash short-term incentive component of executive incentives was reduced in proportion to the increase in the long-term incentive component in 2018 (see page 54 of the Company’s 2018 Annual Report).
The drivers of the STI now more substantively reflect individual goals of Executive KMPs integral to achieving the strategic corporate objectives of Orocobre and its annual business plan and budget. The Balanced Scorecard format remains with variable weightings for each KMP across the Group and Individual Performance components in accordance with their capacity to exert greatest influence.
90
For
per
sona
l use
onl
y

OROCOBRE SUSTAINABILITY REPORT 2018 91
For
per
sona
l use
onl
y

Memberships & Affiliations
92
For
per
sona
l use
onl
y

External Initiatives Memberships & Associations
Management Systems Certified
Other
In addition to its current involvement with industry bodies and associations, Orocobre seeks to align with recognised external initiatives that will support a robust and holistic approach to sustainability management and disclosure.
Consejo Empresario Argentino para el Desarrollo Sostenible
Orocobre operates in accordance with industry standards, and maintains certified management systems for Environment, Quality and Health & Safety.
OROCOBRE SUSTAINABILITY REPORT 2018 93
For
per
sona
l use
onl
y

UNGC & GRI Contents Indexes
94
For
per
sona
l use
onl
y

UN Global Compact Principles
Human Rights Section Page
Principle 1 Businesses should support and respect the protection of internationally proclaimed human rights
Human Rights Policy website
Communities Policy website
Culture Management 79
Risk & Opportunity Management 84
Principle 2 Businesses should make sure they are not complicit in human rights abuses
Value Chain 28
Risk & Opportunity Management 84
Labour
Principle 3 Businesses should uphold the freedom of association and the effective recognition of the right to collective bargaining
People & Capability 75
Human Rights Policy website
Principle 4 Businesses should uphold the elimination of all forms of forced and compulsory labour
People & Capability 71–73
Value Chain 24, 28
Principle 5 Businesses should uphold the effective abolition of child labour
People & Capability 71–73
Value Chain 24, 28
Principle 6 Businesses should uphold the elimination of discrimination in respect of employment and occupation
People & Capability 74
Culture Management 79
Environment
Principle 7 Businesses should support a precautionary approach to environmental challenges
Environmental Policy website
Environment 54–63
Risk & Opportunity Management 85
Principle 8 Businesses should undertake initiatives to promote greater environmental responsibility
Environmental Policy website
Environment 57–63
Principle 9 Businesses should encourage the development and diffusion of environmentally friendly technologies
Sustainable Development Policy website
Communities 38
Value Chain 28
Environment 57
Anti-Corruption
Principle 10 Businesses should work against corruption in all its forms, including extortion and bribery
Anti-Bribery & Corruption Policy website
Culture Management 79–80
OROCOBRE SUSTAINABILITY REPORT 2018 95
For
per
sona
l use
onl
y

GRI Index
GRI Standard Disclosure Page number(s) / URL(s)
General Disclosures Section Page
Organisational Profile
102-1 Name of the organisation Orocobre Limited 4
102-2 Activities, brands, products, and services Orocobre Limited 4
102-3 Location of headquarters Orocobre Limited 4
102-4 Location of operations Orocobre Limited 5
102-5 Ownership and legal form Orocobre Limited Sales de Jujuy
4 7
102-6 Markets served Value Chain 25
102-7 Scale of the organisation Orocobre Limited Long Term Outlook
4 30
102-8 Information on employees and other workers People & Capability 71, 74–75
102-9 Supply chain Value Chain 27–29
102-10 Significant changes to the organisation and its supply chain Value Chain Long Term Outlook
27–29 32
102-11 Precautionary Principle or approach Environmental Policy Environment Risk & Opportunity Management
website 54–68 84
102-12 External initiatives Memberships & Affiliations 93
102-13 Membership of associations Memberships & Affiliations 93
Strategy
102-14 Statement from senior decision-maker Letter from Managing Director 12
102-15 Key impacts, risks, and opportunities Risk & Opportunity Management Highlights & Commitments Our Focus
8418-19 20–21
Ethics & Integrity
102-16 Values, principles, standards, and norms of behaviour Culture 79–80
102-17 Mechanisms for advice and concerns about ethics Culture 79–80
Governance
102-18 Governance structure Governance 89
Stakeholder Engagement
102-40 List of stakeholder groups Stakeholder Engagement 35–37
102-41 Collective bargaining agreements People & Capability 75
102-42 Identifying and selecting stakeholders Stakeholder Engagement 35–37
102-43 Approach to stakeholder engagement Stakeholder Engagement 35–37
102-44 Key topics and concerns raised Our Focus 20–21
Reporting Practice
102-45 Entities included in the consolidated financial statements 2018 Annual Report 75, 113
102-46 Defining report content and topic Boundaries Report Overview 2
102-47 List of material topics Report Overview 2
102-48 Restatements of information Report Overview 2
102-49 Changes in reporting Report Overview 2
102-50 Reporting period Report Overview 2
102-51 Date of most recent report Report Overview 2
102-52 Reporting cycle Report Overview 2
96
For
per
sona
l use
onl
y

GRI Standard Disclosure Page number(s) / URL(s)
Reporting Practice
102-53 Contact point for questions regarding the report Report Overview 2
102-54 Claims of reporting in accordance with the GRI Standards Report Overview 2
102-55 GRI content index GRI Content Index 96
102-56 External assurance Report Overview 2
Material Topics
200 – ECONOMIC
201 – Economic Performance
103-1 Explanation and Boundaries Communities 39, 41
103-2 Management Approach Communities 40, 42–43
201-1 Direct economic value generated and distributed Long-Term Outlook Communities
30 43
201-2 Financial implications and other risks and opportunities due to climate change
Environment Risk & Opportunity Management
55–56 85
201-4 Financial assistance received from government Value Chain 27
202 – Market Presence
103-1 Explanation and Boundaries People & Capability 72
103-2 Management Approach People & Capability 72–73
202-1 Ratios of standard entry level wage by gender compared to local minimum wage
People & Capability 75
202-2 Proportion of senior management hired from the local community
People & Capability 71, 74
203 – Indirect Economic Impacts
103-1 Explanation and Boundaries Communities 39, 41
103-2 Management Approach Communities 42–43
203-1 Infrastructure investments and services supported Communities 43, 46–53
203-2 Significant indirect economic impacts Communities 46–53
204 – Procurement Practices
103-1 Explanation and Boundaries Value Chain 25, 28–29
103-2 Management Approach Value Chain 25, 28–29 41
204-1 Proportion of spending on local suppliers Value Chain 25, 29
300 – ENVIRONMENTAL
302 – Energy
103-1 Explanation and Boundaries Energy 55
103-2 Management Approach Energy 57
302-1 Energy consumption within the organisation Energy 57
302-3 Energy intensity Energy 57
302-4 Reduction of energy consumption Energy 57
303 – Water
103-1 Explanation and Boundaries Water 59–60
103-2 Management Approach Water 59–60
303-1 Water withdrawal by source Water 59
303-2 Water sources significantly affected by withdrawal of water Water 60
303-3 Water recycled and reused Water 61
OROCOBRE SUSTAINABILITY REPORT 2018 97
For
per
sona
l use
onl
y

GRI Standard Disclosure Page number(s) / URL(s)
304 – Biodiversity
103-1 Explanation and Boundaries Biodiversity 63
103-2 Management Approach Biodiversity 63
304-1 Operational sites in/near areas of high biodiversity value Biodiversity 63
305 – Emissions
103-1 Explanation and Boundaries Emissions 58
103-2 Management Approach Emissions 58
305-1 Direct (Scope 1) GHG emissions Emissions 58
305-4 GHG emissions intensity Emissions 58
305-5 Reduction of GHG emissions Emissions 58
306 – Effluents & Waste
103-1 Explanation and Boundaries Waste Water 61
103-2 Management Approach Waste Water 61
306-1 Water discharge by quality and destination Waste Water 61
306-2 Waste by type and disposal method Waste 61
306-3 Significant Spills None to report –
306-4 Transport of Hazardous Waste Waste 62
306-5 Water bodies affected by water discharges / runoff Waste Water 61
307 - Environmental Compliance
103-1 Explanation and Boundaries 2018 Annual Report 47
103-2 Management Approach 2018 Annual Report 47
307-1 Non-compliance with environmental laws and regulations 2018 Annual Report 47
308 - Supplier Environmental Assessment
103-1 Explanation and Boundaries Value Chain 28–29
103-2 Management Approach Value Chain 28–29
308-1 New suppliers that were screened using environmental criteria
Value Chain 28
308-2 Negative environmental impacts in the supply chain and actions taken
Value Chain 28
400 – SOCIAL
401 – Employment
103-1 Explanation and Boundaries People & Capability 71–76
103-2 Management Approach People & Capability 71–76
401-1 New employee hires and employee turnover People & Capability 74
401-3 Parental leave People & Capability 76
403 – Occupational Health & Safety
103-1 Explanation and Boundaries Health & Safety 81–83
103-2 Management Approach Health & Safety 81–83
403-1 Workers representation in formal joint management–worker health and safety committees
Health & Safety 81–82
403-2 Types of injury and rates of injury, occupational diseases, lost days, and absenteeism, and number of work-related fatalities
Health & Safety 19, 81
GRI Index
98
For
per
sona
l use
onl
y

GRI Standard Disclosure Page number(s) / URL(s)
403 – Occupational Health & Safety
403-3 Workers with high incidence or high risk of diseases related to their occupation
Health & Safety 81–82
403-4 Health and safety topics covered in formal agreements with trade unions
Health & Safety 81–82
404 – Training & Education
103-1 Explanation and Boundaries People & Capability 72
103-2 Management Approach People & Capability 72–73
404-1 Average hours of training per year per employee Not reported in 2018: revising data collection methodology for 2019
404-2 Programs for upgrading employee skills and transition assistance programs
Communities 48–50
404-3 Percentage of employees receiving regular performance and career development reviews
People & Capability 74
405 – Diversity & Equal Opportunity
103-1 Explanation and Boundaries Culture Management 79
103-2 Management Approach People & Capability 72–73
405-1 Diversity of governance bodies and employees People & Capability 71
405-2 Ratio of basic salary and remuneration of women to men People & Capability 75
411 – Rights of Indigenous Peoples
103-1 Explanation and Boundaries Culture Management 79
103-2 Management Approach Culture Management 79
411-1 Incidents of violations involving rights of indigenous peoples None to report
412 – Human Rights Assessment
103-1 Explanation and Boundaries Culture Management 79
103-2 Management Approach Culture Management 79
412-1 Operations that have been subject to human rights reviews or impact assessments
Risk & Opportunity Management 86
412-2 Employee training on human rights policies or procedures Culture Management 79–80
413 - Local Communities
103-1 Explanation and Boundaries Communities 39–40
103-2 Management Approach Communities 39–44
413-1 Operations with local community engagement, impact assessments and development programs
Communities 40–53
413-2 Operations with significant actual and potential negative impacts on local communities
Risk & Opportunity Management 86
414 - Supplier Social Assessment
103-1 Explanation and Boundaries Value Chain 28–29
103-2 Management Approach Value Chain 28–29
414-1 New suppliers that were screened using social criteria Value Chain 28
414-2 Negative social impacts in the supply chain and actions taken Value Chain 28
OROCOBRE SUSTAINABILITY REPORT 2018 99
For
per
sona
l use
onl
y

A$ Australian Dollars
Advantage Lithium Advantage Lithium Corp.
ARS Argentinian Pesos
Asociación Obrera Minera Argentina
Mining Union of Argentina
ASX Australian Securities Exchange
ASX:ORE Orocobre Limited share code for the Australian Securities Exchange
Audit and Risk Committee
Responsible for monitoring public reporting, risk management processes, corporate conduct and compliance with laws and regulation
Cauchari Lithium Project
Cauchari Lithium Project is a joint venture between Advantage Lithium Corp. (who hold 75% of Cauchari) and Orocobre Limited (who owns 33.5% of Advantage Lithium’s issued capital and 25% directly in the joint venture)
CDP Response The Carbon Disclosure Project (CDP) is an organisation based in the United Kingdom which supports companies and cities to disclose the environmental impact of major corporations. It aims to make environmental reporting and risk management a business norm and drive disclosure, insight and action towards a sustainable economy.
CDP UNGP Report Carbon Disclosure Project - United Nations Guiding Principles Report
CEO Chief Executive Officer
CFO Chief Financial Officer
CO2 Carbon Dioxide
COO Chief Operating Officer
Cookins Sales de Jujuy’s Catering Supplier
Core see: GRI Standard
Corporate Sustainability Framework
Orocobre Limited are taking a staged approach to sustainability management and reporting: establishing solid management fundamentals as a priority, and then developing meaningful metrics and controls. This ensures targeted, accurate and consistent monitoring of sustainability performance across the organisation.
CY17 Calendar Year 2017
CY18 Calendar Year 2018
CY19 Calendar Year 2019
CY20 Calendar Year 2020
DJSI Asia Pacific see: Dow Jones Sustainability™ Australia Index
DJSI Australia see: Dow Jones Sustainability™ Australia Index
DJSI UNGP Report Dow Jones Sustainability™ Australia Index - United Nations Guiding Principles Report
Dow Jones Sustainability™ Australia Index
The Dow Jones Sustainability™ Australia Index is composed of sustainability leaders as identified by RobecoSAM through a corporate sustainability assessment. The index represents the top 30% of companies in the S&P/ASX 200 based on long-term economic, environmental, and social criteria.
DuPont Safety System see: DuPont™ Bradley Curve™
DuPont™ Bradley Curve™
A proven, proprietary system designed to businesses comprehend and benchmark the journey toward world-class safety performance
EBITDAIX Earnings before interest, taxes, depreciation, amortisation, impairment and foreign currency gains/(losses)
EBITIX Earnings before interest, taxes, impairment and foreign currency gains/(losses)
EBTIX Earnings before taxes, impairment and foreign currency gains/(losses)
EIA Environmental Impact Assessment
Glossary
100
For
per
sona
l use
onl
y
EITI Extractive Industries’ Transparency Initiative
English-speaking stakeholders
Investors, Customers and other Stakeholders
ERP Enterprise Resource Planning
ESS Energy Storage Systems
EV Electric Vehicles
Five Pillars of Shared Value
Over the past decade, Orocobre Limited’s community investment strategy has been centred on the five pillars of our Shared Value strategy: Education, Empowerment, Transparency, Production and Natural Resources, and Health
FOB Free On Board
FY17 Financial Year 2017
FY18 Financial Year 2018
FY19 Financial Year 2019
FY20 Financial Year 2020
GDP Gross Domestic Product
GHG Emissions Greenhouse Gas Emissions
GM General Manager
GRI Global Reporting Initiative
GRI Standard Global Benchmark for Sustainability Reporting
Gross Cash Margin Orocobre’s total sales revenue minus cost of goods sold
Groundwater Industrial Water
H1 Half One (Financial Year First Half)
H2 Half Two (Financial Year Second Half)
Impurity Profile Parts Per Million (PPM) Breakdown
INTI National Institute of Industrial Technology
IRMA Initiative for Responsible Mining Assurance - IRMA seeks to drive positive change in industrial-scale mining using credible certification: a tool that has been proven to deliver better social and environmental outcomes in industries such as agriculture, forestry and fishing
IRMA Certification see: IRMA
ISO The International Organisation for Standardisation
ISO14001:2015 Internationally recognised standard that specifies requirements for an effective environmental management system (2015 standard)
ISO18001 Occupational Health and Safety Assessment Series (officially BS OHSAS 18001) is a British Standard for occupational health and safety management systems
ISO26000 Internationally recognised standard developed to help organisations effectively assess and address social responsibilities that are relevant and significant to their mission and vision; operations and processes; customers, employees, communities, and other stakeholders; and environmental impact
ISO31000 Internationally recognised standard of Risk Management that includes guidelines, principles, framework and a process for managing risk
ISO9001:2015 Internationally recognised standard of Quality Management System (2015 standard)
JEMSE Jujuy Energia y Mineria Sociedad del Estado (Mining Company of the Argentina provincial government of Jujuy)
JOGMEC Japanese state-owned Japan Oil, Gas and Metals National Corporation
OROCOBRE SUSTAINABILITY REPORT 2018 101
For
per
sona
l use
onl
y

JV Joint Venture
KMP Key Management Personnel
KPIs Key Performance Indicators
LBG London Benchmarking Group – The global standard in measuring and managing corporate community investment
LBG Report see: LBG
LCE Lithium Carbonate Equivalent
Li2CO3 Lithium Carbonate
LTIFR Lost Time Injury Frequency Rate
m3 International Bureau of Weights and Measures definition of a Cubic Metre
m3/t Cubic Metre per Tonne
MD Managing Director
Mizuho Mizuho Bank, Ltd. (Japanese bank)
MWh Megawatt Hour
MWh/t Megawatt Hour per Tonne
Na2CO3 Sodium Carbonate
NGOs Non-Governmental Organisations
OHSAS18001 see: ISO18001
Olaroz Lithium Facility Orocobre Limited’s Salar de Olaroz Lithium Facility
Olaroz Stage 2 Expansion
The Olaroz Stage 2 Expansion will add 25,000 tpa of lithium carbonate production capacity to the Olaroz Lithium Facility, taking total nameplate capacity to 42,500 tpa
Orocobre Orocobre Limited
PPM Parts Per Million
Q1 First Quarter (Jan - Mar)
Q2 Second Quarter (Apr - Jun)
Q3 Third Quarter (Jul - Sept)
Q4 Fourth Quarter (Oct - Dec)
QMS Quality Management System
QOQ Quarter-On-Quarter
Related Party Committee
Responsible for reviewing transactions between Orocobre, its related parties and any shareholder having a substantial shareholding
Remuneration Committee
Works to develop remuneration policies which motivate Directors and Management to pursue long-term value creation
RobecoSAM The RobecoSAM Corporate Sustainability Assessment (CSA) is an annual evaluation of companies’ sustainability practices
Sales de Jujuy S.A. SDJ S.A. (Operating company for the Olaroz Lithium Facility)
SAP Systems, Applications and Products Enterprise Resource Planning (ERP) Software
SDG Sustainable Development Goals
SDG 1 Sustainable Development Goal 1: No Poverty
SDG 2 Sustainable Development Goal 2: Zero Hunger
Glossary
102
For
per
sona
l use
onl
y
SDG 3 Sustainable Development Goal 3: Good Health and Well-being
SDG 4 Sustainable Development Goal 4: Quality Education
SDG 5 Sustainable Development Goal 5: Gender Equality
SDG 6 Sustainable Development Goal 6: Clean Water and Sanitation
SDG 7 Sustainable Development Goal 7: Affordable and Clean Energy
SDG 8 Sustainable Development Goal 8: Decent Work and Economic Growth
SDG 9 Sustainable Development Goal 9: Industry, Innovation and Infrastructure
SDG 10 Sustainable Development Goal 10: Reduced Inequality
SDG 11 Sustainable Development Goal 11: Sustainable Cities and Communities
SDG 12 Sustainable Development Goal 12: Responsible Consumption and Production
SDG 13 Sustainable Development Goal 13: Climate Action
SDG 14 Sustainable Development Goal 14: Life Below Water
SDG 15 Sustainable Development Goal 15: Life on Land
SDG 16 Sustainable Development Goal 16: Peace and Justice Strong Institutions
SDG 17 Sustainable Development Goal 17: Partnerships to achieve the Goal
SDJ Sales de Jujuy
SDJ PTE Sales de Jujuy Pte Ltd
SMC Safety Management Committee
SMEs Small-Medium Enterprises
t Tonnes
t LCE Tonnes of Lithium Carbonate Equivalent
The Company Orocobre Limited
tpa Tonnes Per Annum
TRIFR Total Recordable Injury Frequency Rate
TSX Toronto Stock Exchange
TSX:ORL Orocobre Limited share code for the Toronto Stock Exchange
TTC Toyota Tsusho Corporation
UN United Nations
UN Global Compact The United Nations Global Compact is a non-binding United Nations pact to encourage businesses worldwide to adopt sustainable and socially responsible policies, and to report on their implementation
UN Sustainable Development Goals
United Nations Sustainable Development Goals
UNGC CoP United Nations Global Compact Communication on Progress
UNGP United Nations Guiding Principles
UNGP Report United Nations Guiding Principles Report
US$ see: USD
USD United States Dollars
WRI World Resource Institute
YOY Year-On-Year
OROCOBRE SUSTAINABILITY REPORT 2018 103
For
per
sona
l use
onl
y
orocobre.com
For
per
sona
l use
onl
y