Embed Size (px)
Citation preview

VOTER ANALYSIS REPORTCAMPAIGN FINANCE BOARD APRIL 2020
2019–2020


Board Chair
Frederick P. Schaffer
Board Members
Gregory T. Camp
Richard J. Davis
Marianne Spraggins
Naomi B. Zauderer
Amy M. Loprest
Executive Director
Kitty Chan
Chief of Staff
Sauda Chapman
Assistant Executive Director for Campaign Finance Administration
Daniel Cho
Assistant Executive Director for Candidate Guidance and Policy
Eric Friedman
Assistant Executive Director for Public Affairs
Hillary Weisman
General Counsel
NEW YORK CITY
CAMPAIGN FINANCE BOARD

VAAC Chair
Naomi B. Zauderer
Members
Daniele Gerard
Joan P. Gibbs
Christopher Malone
Okwudiri Onyedum
Mazeda Akter Uddin
Jumaane Williams
New York City Public Advocate (Ex-Officio)
Michael Ryan
Executive Director, New York City Board of Elections (Ex-Officio)
The VAAC advises the CFB on voter engagement and recommends
legislative and administrative changes to improve NYC elections.
THE VOTER ASSISTANCE
ADVISORY COMMITTEE

2019–2020
NYC VOTES TEAMPublic Affairs
Eric Friedman
Assistant Executive Director
for Public Affairs
Amanda Melillo
Deputy Director for Public Affairs
Marketing and Digital Communications
Charlotte Levitt
Director
Winnie Ng
Art Director
Jen Sepso
Graphic Designer
Crystal Choy
Production Manager
Chase Gilbert
Web Content Manager
Public Relations
Matt Sollars
Director
William Fowler
Public Relations Aide
Partnerships and Outreach
Sabrina Castillo
Director
Matthew George-Pitt
Engagement Coordinator
Sean O'Leary
Field Coordinator
Olivia Brady
Youth Coordinator Intern
Maya Vesneske
Youth Coordinator Intern
Policy and Research
Allie Swatek
Director
Jaime Anno
Data Manager
Jordan Pantalone
Intergovernmental Liaison
NYC Votes Street Team
Olivia Brady
Adriana Espinal
Emily O'Hara
Kevin Suarez
Maya Vesneske

VOTER ANALYSIS REPORT
TABLE OF CONTENTS
How COVID-19 is Affecting 2020 Elections VIII
Introduction XIV
I. Executive Summary 1
Programming Highlights 9
II. Overview and Analysis of the 2019 Election 13
III. Participation Score Research 25
IV. Policy & Legislative Recommendations 45
Appendix 65

VIII
As the city and state governments considered
dramatic interventions in response to the pandemic,
a special election for Queens Borough President
scheduled for March 24 hung in the balance. At its
regular meeting on March 10, the Board of Elections
in New York City described special measures it was
putting in place to protect poll workers and voters,
adding protective shields for the tablets used for
voter check-ins that could be more easily cleaned,
and ensuring sufficient disinfecting supplies were
available for every poll site.
As early voting began, on March 14, Governor
Andrew Cuomo issued Executive Order 202.2,
which expanded access to vote by mail in the
interest of limiting crowds at the poll sites. The order
provided that voters concerned about contraction
of the COVID-19 virus could cite “temporary illness”
as a valid reason to request an absentee ballot for
elections scheduled through the beginning of April.
The order also extended the deadline for voters
to apply for absentee ballots to March 23 (the day
before the election), and extended the deadline to
submit an absentee ballot to March 24. Finally, the
order allowed for voters to submit an application
electronically, “with no requirement for in-person
signature or appearance.”
With the deadline for candidates to collect petition
signatures for the June 23 state primary only days
away, the order also suspended signature gathering
March 14Early Voting for Queens
Borough President Special
Election begins
Governor Cuomo issues
Executive Order 202.2 which
expands access to vote by mail
March 10New York City Board of
Elections puts in place special
measures to protect poll
workers and voters during the
Queens Special Election
HOW COVID-19 IS AFFECTING 2020 ELECTIONS APRIL 24, 2020 As this report was nearing completion in March 2020, the city’s democratic systems and processes — along with practically every aspect of daily life in New York City — were disrupted by the massive effort to slow the spread of a novel coronavirus (COVID-19).

NEW YORK CITY CAMPAIGN FINANCE BOARD | VOTER ANALYSIS REPORT 2019 – 2020 IX
March 15Mayor de Blasio issues
Executive Order No. 100
which postpones the March
24 Queens Special Election
March 28Governor Cuomo issues
Executive Order 202.12
postponing New York's
Presidential Primary to June 23
March 30Governor Cuomo issues
Executive Order 202.13 which
reschedules the Queens Special
Election to June 23
April 3Fiscal Year 2021 New York
State budget signed into law
as of March 17 and cut the signature requirement to
30 percent of the stated threshold in the interest of
limiting most in-person canvassing. A subsequent
act of the Legislature extended the deadline for
filing petitions until March 20.
On March 15, Mayor Bill de Blasio announced that
the March 24 special election would be canceled
pursuant to Emergency Executive Order No. 100,
issued the following day. His announcement left the
election in limbo, with the prospect of an appointed
acting borough president serving in that role
through the November general election.
On March 28, Governor Cuomo postponed New
York’s presidential primary elections (along with all
special elections scheduled for April 28) to June
23, the date of the federal and state primaries, via
Executive Order 202.12. Two days later, Executive
Order 202.13 rescheduled the special election
for Queens Borough President for the same date,
and clarified that no further gathering of petition
signatures to appear on the June 23 ballot would
be allowed.
The enacted New York State budget for Fiscal
Year 2021, signed into law by Governor Cuomo
on April 3, raised the prospect that the state’s
presidential primary would be canceled completely.
A provision in the budget amended state election
law to allow the commissioners of the New York
State Board of Elections to remove candidates of
their own party from the presidential primary ballot
if those candidates announce they are terminating
or suspending their campaign, or if they ask to be
removed from the ballot.1
1 Eleven candidates filed valid petitions to appear on the Democratic
presidential primary ballot in New York. On April 8, Senator Bernie
Sanders, the closest competitor to former Vice President Joe Biden for the
Democratic nomination, announced his withdrawal from the race; on April
14, Sanders endorsed Biden’s candidacy. As of April 15, no announcement
about removing candidates from the primary ballot had been made.

X
Then, on April 9 Governor Cuomo issued Executive
Order 202.15, which granted New Yorkers expanded
access to vote by mail for the June elections
under the same conditions set by EO 202.2 — the
potential for contraction of COVID-19 is covered
by “temporary illness,” and electronic applications
without a signature are allowed.
On April 20, Spectrum News NY1 reported that
Governor Cuomo planned to “issue an executive
order sending ballots to all registered voters in New
York State.”2 The story also suggested a decision on
“whether to cancel the [presidential] primary” would
be made in the coming days. On April 24, Governor
Cuomo announced an executive order mandating
the Board of Elections to automatically mail every
New York voter a postage-paid application for an
absentee ballot.
New York was not the only state to face painful
decisions about maintaining open and accessible
elections in the face of an unprecedented public
health emergency. With states across the nation
scheduled to vote in presidential primaries
throughout March and April, these conversations
played out from coast to coast.
Four states had primaries scheduled on March 17.
Three of them went ahead as scheduled: Florida,
Illinois, and Arizona. Each saw diminished in-person
turnout, poll worker no-shows, and voter confusion
resulting from poll site closings. In an 11th-hour
maneuver in defiance of a court order,
2 https://www.ny1.com/nyc/all-boroughs/politics/2020/04/20/new-york-
voting-by-mail-to-be-allowed-for-june-elections-queens-borough-president-
congress (accessed on April 23, 2020)
April 9Governor Cuomo issues
Executive Order 202.15 which
expands the definition of
"temporary illness" to include the
potential of contracting COVID-19
April 24Governor Cuomo issues an
executive order mandating
that every eligible New Yorker
receives a postage-paid
application for an absentee ballot

NEW YORK CITY CAMPAIGN FINANCE BOARD | VOTER ANALYSIS REPORT 2019 – 2020 XI
Governor Mike DeWine of Ohio postponed his state’s primary to June 2. Other
states with presidential primary elections scheduled in late March and early
April, including Georgia and Louisiana, postponed voting into late spring.
The sole state to proceed with an election during the month of April was
Wisconsin. Over the objections of partisans in the Wisconsin State Legislature,
that state’s governor attempted to postpone the April 7 primary election and
extend the deadline for absentee balloting. The Legislature petitioned the
state’s highest court to reverse the governor’s action, which they did. On the
day before the election, the U.S. Supreme Court upheld the decision, ensuring
the election went ahead as scheduled.
While 71 percent of the votes cast in Wisconsin’s April 2020 election — more
than one million — were cast via absentee ballot, the state’s failure to extend
the absentee balloting deadline forced an awful choice upon tens of thousands
of additional voters who could not obtain their mail-in ballot timely.3 With a
shortage of workers willing to man the polls, a limited number of in-person poll
sites were available to voters. The state’s largest city, Milwaukee, has 181 poll
sites open in a normal election; on April 7, it had five. Even with a statewide
stay-at-home order in place, nearly half a million voters chose to vote in person.
The concentration of poll sites led to long lines and wait times, creating a public
health risk.
These novel and frightening barriers to voting have the potential to upend the
entire crucial 2020 election year in every state. The challenges of in-person
voting during a pandemic are clear and significant. Elections traditionally
provide a time for citizens to gather together in large numbers to engage in the
practice of democracy. But restrictions on public gatherings recommended by
public health authorities in response to the spread of COVID-19 cast regular poll
site operations in a new light.
In jurisdictions around the country, many voters wait packed together in long lines
to make their voices heard. Institutions that regularly serve as poll sites may be
justifiably concerned about allowing potential carriers to pass through their
doors — especially senior centers or schools. While early voting opportunities
can provide space for voters to follow physical distancing guidelines, they offer
no such protection to the dedicated poll workers who interact with each voter
requesting a ballot.
3 By comparison, in April 2016 only 12 percent of votes — roughly 250,000 in Wisconsin’s spring election — were cast
via absentee ballot.

XII
In response, many election experts and advocates have advocated for prompt
and widespread adoption of vote by mail.
Washington State, for instance, mails ballots to every registered voter 18
days before each election. Voters can mail their ballots back or return them
to designated ballot drop boxes by the end of Election Day. Four other
states — Colorado, Hawaii, Oregon, and Utah — conduct all-mail elections.
In New York State, mail-in or absentee voting is available only to voters who can
attest to a specific reason they will be unable to appear at the polls, either for
absence or illness. While Governor Cuomo’s order expanded the meaning of
“temporary illness” to cover those seeking to stem the spread of COVID-19, its
effects are temporary. As issued, it applies only to elections through June 23.
By whatever means are available, expanded access to vote by mail should be
offered to New Yorkers on a permanent basis.4
What we’ve learned in this moment is that universally-accessible vote by mail is
not merely a turnout-boosting convenience. It can provide necessary resilience
for our democratic system when the logistics of in-person balloting become
impossible or impractical to maintain. It is one of a series of critical measures
that should be available to administrators to ensure the continuity of our
elections. New York should act promptly and decisively to implement it here.
The COVID-19 response effort is also shifting the way that organizers and
campaigners approach the work of engaging voters. Traditional methods of
registering voters will need to be rethought and campaign plans will need to
be redesigned to adapt to the reality of an election year conducted during
a pandemic. At minimum, a response that preserves New Yorkers’ access to
elections through crises will require New York to finally end its reliance on a
paper-based voter registration system that depends heavily on face-to-face
interaction to bring new voters into the democratic process.
4 The New York State Constitution requires voters to attest to a reason they cannot appear at the polls in order to
apply for an absentee ballot. In January 2019, the Legislature passed legislation to amend the Constitution to allow
no-excuse absentee voting in New York State. Such legislation must be passed a second time in a subsequent
consecutive session of the Legislature, and then put before voters in a statewide referendum before it can be enacted.

NEW YORK CITY CAMPAIGN FINANCE BOARD | VOTER ANALYSIS REPORT 2019 – 2020 XIII
Times of crisis can force hard choices upon us; they demand we articulate our
values and protect the things we value most. Elections are essential, particularly
and especially in these difficult moments. In just the last twenty years, New
Yorkers have come together to vote in the wake of a terrorist attack and in the
aftermath of a destructive storm. Each instance demonstrates anew that our
election laws and systems badly need flexibility to ensure elections can adapt
effectively to public challenges like this one.
DEMOCRACY WILL PERSIST — IF WE CHOOSE IT.Amy M. Loprest Executive Director, Campaign Finance Board

INTRODUCTIONXIV
The aim of this Charter-mandated report is to take a look back at the year
recently finished, and review the activities and processes of voter registration
and voting in New York City.
We are pleased to report that 2019 was a year during which New York
took unprecedented, historic strides towards building a more participatory,
responsive democracy for all its citizens. After decades of inaction, successive
waves of reform have thoroughly transformed elections in New York. Those
reforms are setting the stage for a crucial two-year series of elections — starting
with this June and culminating with the election of a new mayor and City
Council in November of 2021.
As recently as two years ago, analysts and
advocates still decried New York’s voting system
as among the worst in the nation. States seeking to
roll back their own reforms were pointing to New
York’s more restrictive voting laws as justification for
erecting new barriers to the ballot.
In 2019, New York finally turned the page. As the
year began, a backlog of long-awaited voting
reforms rolled through the State Legislature and onto the governor’s desk for
enactment. New York joined 37 other states to offer early voting, expanding
access to the polls for an additional nine days before the traditional single
15–hour Election Day. Early voting had a successful rollout in November of 2019,
with 61 poll sites across New York City providing new flexibility for busy voters
seeking the opportunity to cast a vote in person. (For further discussion on the
implementation of early voting, see page 21.)
But early voting wasn’t all. New York made a new commitment to engaging
the emerging youth electorate by allowing 16- and 17-year-olds to pre-register
as voters. The state consolidated the state and federal primary elections into
INTRODUCTIONAfter decades of inaction, waves of reform have transformed New York elections.
“ A backlog of long-awaited voting reforms rolled through the State Legislature and onto the governor's desk for enactment.

NEW YORK CITY CAMPAIGN FINANCE BOARD | VOTER ANALYSIS REPORT 2019 – 2020 XV
a single date in June, requiring one fewer trip to
the polls for voters to express their preferences.
The state eased the deadline for voters to change
their party enrollment — an issue of particular
resonance for voters who had intended to cast
votes in the presidential primary election. Starting
this November, voters will get ballots that are easier
to read, better ensuring that every voter’s intent is
accurately reflected on their ballot.
And the Legislature took the first concrete steps
towards giving voters the opportunity to approve
a constitutional amendment that will expand access to vote by mail and
establish same-day voter registration for New York State. If the Legislature
approves these measures again next year, they could be on the ballot as soon
as November 2021. (For discussion of proposals to further update New York’s
election laws, see page 45.)
While voters across New York State have started to realize the benefits of
easier, more convenient access to their elections, New York City has continued
innovating its way towards a more open, participatory local democracy.
In November, New York City voters approved — by a three-to-one margin (73.6
percent) — the adoption of ranked choice voting (RCV) for primary and special
elections for city office.
Ranked choice voting more cleanly and completely reflects voter preferences
than traditional winner-takes-all elections. In Council primaries, the old system
has regularly produced plurality winners supported by fewer than one in three
of their districts’ voters. In citywide races, the failure
of a plurality winner to earn 40 percent of the vote
triggered a separate runoff election, which invariably
attracted few voters back to the polls.
By asking voters to rank up to five candidates, the
new ranked choice system will spur candidates to
speak to a broader audience and better identify the
candidate with the broadest support. The zero-sum
negative campaigns that are a persistent feature
of winner-take-all elections will be less successful
“ Early voting had a successful rollout in 2019, with 61 poll sites across New York City providing new flexibility for busy voters seeking the opportunity to cast a vote in person.
“ In November 2019, New York City voters approved the adoption of Ranked Choice Voting (RCV) for primary and special elections for city office.
INTRODUCTIONXVI
in the ranked-choice system, creating new norms
of campaigning as candidates seek second-choice
votes from voters who may support their opponents.
With prominent advocates, lawmakers, and editorial
boards making the case for ranked choice voting
during the presidential primaries, there is a growing
recognition that RCV has the potential to remake
American elections for the better. As the largest
jurisdiction to adopt ranked choice voting, a
successful implementation in New York City has the
potential to lead the way for the nation.
As the city prepares to introduce the new system for the June 2021 local
primary elections, the CFB will play a substantial role: the City Charter
amendment directs the CFB to lead a voter-education campaign to familiarize
voters with ranked choice voting. That effort will be part of a broader voter
engagement campaign, the planning for which is well underway. (For further
discussion of plans to implement ranked choice voting in New York City, see
page 63.)
As we look ahead to the 2021 elections, the CFB is also preparing to administer
a newly expanded public matching funds system citywide for the first time.
Changes proposed by the 2018 Charter Revision Commission and approved by
the voters in November of that year make it more possible for candidates to run
for office with small-dollar support.
Next year, term limits will create wide-open races for mayor, comptroller, up to
four of the borough presidencies, and most of the City Council. Initial indications
are that voters will have an unprecedented range of choices in those elections.
With many candidates already building their
campaigns this year in anticipation of the June 2021
primary, we expect a record-breaking number of
candidates on the ballot. By further encouraging the
participation of everyday New Yorkers in funding
campaigns, the improvements to the matching funds
program will ensure that voters’ priorities are kept
front and center in next year’s elections.
“ As the largest jurisdiction to adopt ranked choice voting, a successful implementation in New York City has the potential to lead the way for the nation.
“ In 2021, term limits will create wide-open races for mayor, comptroller, up to four borough presidencies, and most of City Council.

NEW YORK CITY CAMPAIGN FINANCE BOARD | VOTER ANALYSIS REPORT 2019 – 2020 XVII
With a highly anticipated presidential election looming on the horizon and a
wide-open city election following close behind, 2019 became a year to lay the
groundwork for a vastly improved landscape for democratic participation and
engagement in New York City.
In February, New Yorkers voted for public advocate and a City Council seat in
Brooklyn in special elections, and for district attorney in Queens, judgeships and
five ballot questions in the fall. (For further discussion of voter turnout in the 2019
elections, see page 13. Along with the agency’s regular outreach work, for
the CFB and its NYC Votes engagement campaign 2019 was largely a year to
assess the changing landscape, make plans for the future, and start work on
the programs that will build on the intensifying interest in this year’s national
elections.
Even with these broad-based improvements in making our democracy
more accessible, research shows that additional work is needed to
encourage certain populations to participate. In addition to our broad
public information responsibilities, the CFB’s Charter mandate directs the
agency to give a particular focus to communities that are underrepresented
in the city’s electorate and assess where its work can make the greatest
impact — particularly for youth voters and voters with limited English proficiency.
Through this mandate, the Charter makes it the
CFB’s mission to foster an electorate in New York
City that is fully representative of all New Yorkers.
A fully engaged electorate keeps our government
honest, and ensures it reflects the priorities of the
governed. The work of the agency aims to ensure
that electorate can speak with a clear voice in 2020,
and participate fully in setting the direction of the
city in 2021.
As an independent, nonpartisan city agency, the
CFB is particularly well-positioned to accomplish
this work. Without directives from any single elected
official or partisan oversight body, the CFB can rely
on a non-political analysis of available data on voter
behavior to inform the agency’s decisions about
where to focus its resources so that its work makes
the greatest impact.
“ CFB’s mission to foster a New York City electorate that is fully representative of all New Yorkers. A fully engaged electorate keeps our government honest, and ensures it reflects the priorities of the governed.

INTRODUCTIONXVIII
While registration rates are generally high, New
York City voters do not show up to vote nearly
often enough. There were a few conclusions
that shone through the study of voter behavior
published in the 2018–19 Voter Analysis Report,
reinforcing two main areas of focus for the agency’s
planning for 2020–21. Consistent with the research,
the CFB identified two strategic goals for its NYC Votes campaign during this
critical two-year run of elections, which were announced in September.
♦ Immigrant turnout: Higher levels of naturalized citizens in a neighborhood
were found to be a strong predictor of lower turnout. These effects were
particularly acute across a handful of neighborhoods in South Brooklyn, and
in northern and central Queens. The 20K in 2020 initiative aims to register
20,000 naturalized citizens to vote in 10 neighborhoods5 with large immigrant
populations and persistently low voter turnout, and deliver 50 percent of them
to vote in either 2020 or 2021.
♦ Youth turnout: Unlike patterns across most of the country, young (18–29)
voters turn out at levels comparable to other age cohorts for presidential
elections (and in other high-profile elections, like the 2018 midterms).
However, younger voters participate at a particularly low rate in municipal
elections. The We Power NYC campaign aims to double youth turnout for the
November 2021 general election by getting 250,000 voters 18–29 to the polls.
For the 2019 Voter Analysis Report, the CFB has compiled an even richer
analysis of voting behavior across New York City. Using voter history data
from the past 10 years, the agency has created a “participation score” for
every New York City voter, and referenced those scores against U.S. Census
data to compile an authoritative picture of which
demographic variables are most predictive of New
Yorkers’ voting behavior.
This is the agency’s most comprehensive look at
voting behavior in New York to date. While many
of the conclusions echo those from previous
rounds of research, a few additional observations
5 Bensonhurst East, Bensonhurst West, Brighton Beach, Homecrest, and Sunset Park East in Brooklyn; Elmhurst,
Jamaica, Queensborough Hill, Richmond Hill, and South Ozone Park in Queens.
“ While registration rates are generally high, New York City voters do not show up to vote nearly often enough.
“ Using voter history data from the past 10 years, the CFB has created a “Participation Score” for every New York City voter.

NEW YORK CITY CAMPAIGN FINANCE BOARD | VOTER ANALYSIS REPORT 2019 – 2020 XIX
stand out. In particular, the analysis shows that
affiliation with a political party is a strong predictor
of voting behavior — lack of affiliation with a party
had the single largest negative impact on voting
participation of any variable in the study. This finding
is consistent with national research, and is an
important observation about the role of political parties in New York City
elections. (Details on the voting participation score research can be found
starting at page 25.)
The CFB has also applied this voting participation research to a series of
community profiles, which will provide advocates, organizers, and researchers
with a detailed picture of voting behavior and key demographics for every
neighborhood in New York City. (The community profiles can be accessed at
www.nyccfb.info/CommunityProfiles.)
These detailed studies of New York City’s voting population should provide a
valuable contribution to the broader conversation about voting rights and voter
engagement in New York City. As the work of engaging voters in the coming
months and years continues, this research will help direct resources to the
communities that need the most attention.
An engaged electorate has the best chance to build a government that is
representative of all its citizens, and responsive to all its needs. In 2019,
both the state and the city took significant, historic actions to build an election
system that encourages every New Yorker to cast a ballot, and ensures their
preferences are clearly expressed and heard. While much important work
remains, New Yorkers should enter this critical election year with confidence
and comfort that we have made major strides in strengthening our democracy.
“ Analysis shows that affiliation with a political party is a strong predictor of voting behavior.

SECTION I.
EXECUTIVESUMMARY

SECTION I. EXECUTIVE SUMMARY3
OVERVIEW AND ANALYSIS OF THE
2019 ELECTION SEE PAGE 13
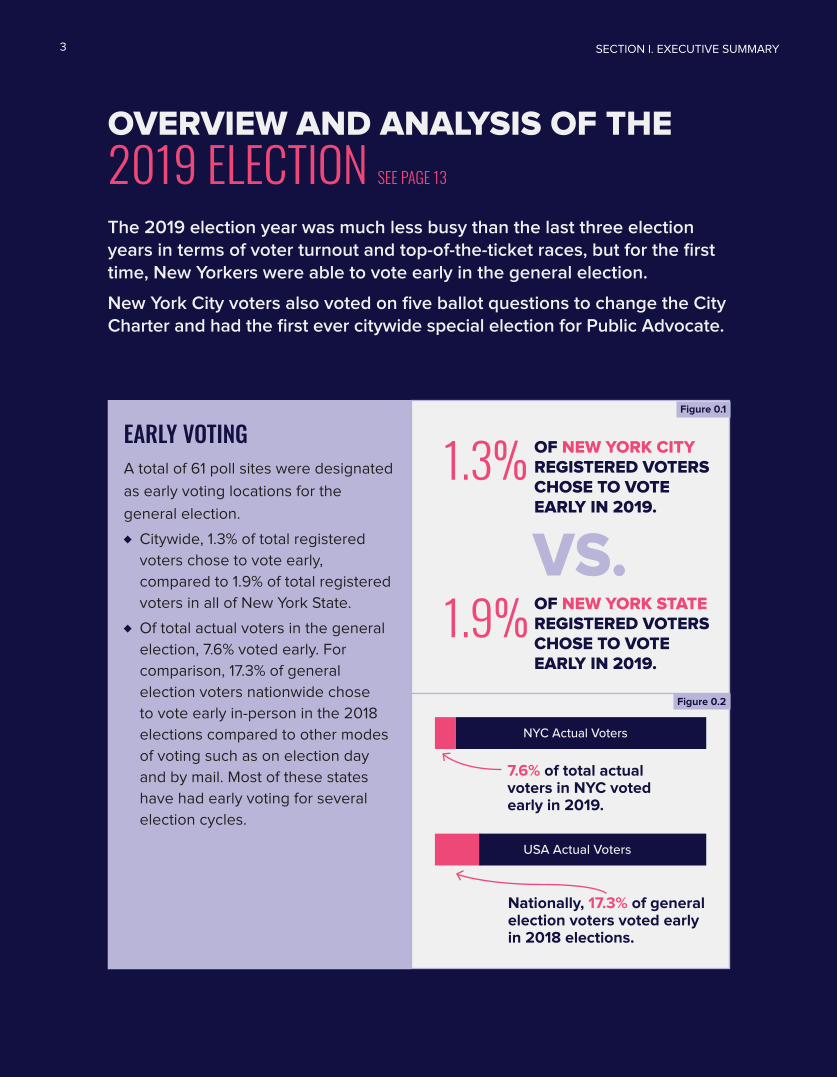
The 2019 election year was much less busy than the last three election years in terms of voter turnout and top-of-the-ticket races, but for the first time, New Yorkers were able to vote early in the general election.
New York City voters also voted on five ballot questions to change the City Charter and had the first ever citywide special election for Public Advocate.
EARLY VOTINGA total of 61 poll sites were designated
as early voting locations for the
general election.
♦ Citywide, 1.3% of total registered
voters chose to vote early,
compared to 1.9% of total registered
voters in all of New York State.
♦ Of total actual voters in the general
election, 7.6% voted early. For
comparison, 17.3% of general
election voters nationwide chose
to vote early in-person in the 2018
elections compared to other modes
of voting such as on election day
and by mail. Most of these states
have had early voting for several
election cycles.
Figure 0.1
Figure 0.2
SECTION I. EXECUTIVE SUMMARY3
1.3% OF NEW YORK CITY REGISTERED VOTERS CHOSE TO VOTE EARLY IN 2019.
OF NEW YORK STATE REGISTERED VOTERS CHOSE TO VOTE EARLY IN 2019.
1.9%
Nationally, 17.3% of general election voters voted early in 2018 elections.
7.6% of total actual voters in NYC voted early in 2019.
NYC Actual Voters
USA Actual Voters

NEW YORK CITY CAMPAIGN FINANCE BOARD | VOTER ANALYSIS REPORT 2019 – 2020 4
All Eligible Voters for the 2019 General Election 5,429,295 Eligible Voters
84.6% of eligible voters are registered to vote4,592,591 Registered Voters
17.2% of registered voters turned out to vote.791,329 Actual Voters
YOUNG VOTERSYoung voters, defined as 18–29 years
old, continued a trend of higher
turnout since 2016. In the 2019 general
election, young voters made up 9.9%
of actual voters; in 2015, young voters
only made up 5.3% of actual voters.
During presidential election years,
young voters participate at the same
level as older age groups, therefore the
2020 presidential election year, ahead
of the 2021 citywide races, is the time
to focus on getting younger people
registered and engaged in voting.
2019
In the 2019 general election, young voters made up 9.9% of actual voters.
2015
In 2015, young voters made up 5.3% of actual voters.
VOTER TURNOUTIn general election 2019, overall voter
turnout increased compared to the
last judicial election year in 2015,
continuing the national trend of higher
voter turnout since 2016. However,
only 17.2% of registered voters turned
out to vote.
Geographically across the five
boroughs, turnout continues to be
highest in Manhattan and Brooklyn
and lowest in the Bronx. Even greater
turnout disparity can be seen from
a community district level, which
indicates that voter education and
outreach to get out the vote should
be focused on communities with
consistently low voter turnout.
Figure 0.3 General Election Turnout Shown with Registered Voters and Citizens of Voting Age
Figure 0.4
Additional interactive maps showing
voter turnout and registration rates are
available at nyccfb.info/VAR2019
NEW YORK CITY CAMPAIGN FINANCE BOARD | VOTER ANALYSIS REPORT 2019–2020 4

SECTION I. EXECUTIVE SUMMARY5 SECTION I. EXECUTIVE SUMMARY5
1,0
00
,00
00
Participation Score
Vote
rs
1000
4,606,170 NYC voters Mean = 29.2 Std. Deviation = 27.221.4% of voters in this
study had a participation score of 0
3.1% of voters in this study had a perfect participation score of 100
♦ Only 3.1% of voters in this study had
a perfect score of 100, meaning they
voted in every election they were
eligible to vote in.
♦ However, 21.4% of voters in this
study had a participation score of
0, meaning they have never voted
once from 2008 to 2018.
PARTICIPATION SCORE
RESEARCH SEE PAGE 25
Our first-of-its-kind, ten year longitudinal study of voting behavior in New York City assigned a unique “participation score” to every New York City registered voter ranging from 0 to 100. This participation score is a ratio of the number of elections a person voted in over the number of elections they were eligible to vote in. It is weighted by number of eligible elections, given that it is easier to get a perfect score if you are eligible for one election than it is if you are eligible for 20 elections.
number of elections a person voted in
VotingParticipation
Scorenumber of elections a person was eligible to vote in
Figure 0.6 Histogram of 2018 Participation Scores
Figure 0.5

NEW YORK CITY CAMPAIGN FINANCE BOARD | VOTER ANALYSIS REPORT 2019 – 2020 6NEW YORK CITY CAMPAIGN FINANCE BOARD | VOTER ANALYSIS REPORT 2019–2020 6
29
Stat
en Is
land
Que
ens
28
Man
hatta
n
34
Broo
klyn
28
Bron
x
24
City
wid
e
28
Manhattan has the highest weighted mean score.The Bronx has the
lowest weighted mean score.
WEIGHTED MEAN PARTICIPATION SCOREThese individual scores are weighted
in order to count people who were
eligible for many elections as more
important than the people who
have only been eligible for a couple
elections and then averaged to
determine a Community District Voting
Participation Score for all of New York
City: 28.
♦ The weighted mean score for
Manhattan tops all boroughs at 34.
♦ The Bronx has the lowest weighted
mean score at 24.
Figure 0.7 Participation Score Citywide and by Borough
Top Negative Finding
A high level of blank party affiliation, or
voters who are not registered with a
political party, have a negative effect on a
census tract’s average participation score.
Top Positive Finding
A high percentage of voters aged 50 or
older have a positive effect on a census
tract’s average participation score.
TOP TWO FINDINGSLastly, we ran a linear regression
with variables taken from the Census
Bureau’s American Community Survey
in order to test if certain demographic
characteristics and socioeconomic
factors impact the voting behavior
of New Yorkers. Our analysis drew a
number of conclusions but our top two
findings are:

SECTION I. EXECUTIVE SUMMARY7 SECTION I. EXECUTIVE SUMMARY7
POLICY & LEGISLATIVE
RECOMMENDATIONS SEE PAGE 45
This section discusses several recommended policy and legislative reforms to expand voting rights and to make voting as easy as possible.
LEGISLATIVE RECOMMENDATIONSWhile much has been
accomplished through
legislative means
in the past year, the
report makes several
recommendations to
improve access to
voter registration and
voting for New Yorkers.
RIGHTS RESTORATION FOR PAROLEESRecommendation 1.
Pass legislation to automatically restore voting rights
to parolees
VOTER REGISTRATIONRecommendation 2.
Pass same day voter registration and no excuse
absentee voting for the second time in next year’s
Albany legislative session
Recommendation 3.
Pass Automatic Voter Registration and online voter
registration laws that will make it easier for New Yorkers
to register to vote

NEW YORK CITY CAMPAIGN FINANCE BOARD | VOTER ANALYSIS REPORT 2019 – 2020 8NEW YORK CITY CAMPAIGN FINANCE BOARD | VOTER ANALYSIS REPORT 2019–2020 8
POLICY RECOMMENDATIONSOther policy recom-
mendations are aimed
at improving election
administration, taking
into consideration early
voting, additional
language interpretrer
support provided by
the new Civic Engage-
ment Commission, and
implementing ranked
choice voting for 2021
municipal elections.
EARLY VOTINGRecommendation 4.
Open additional early voting polling sites
Recommendation 5.
Replace some or all assigned poll sites with vote centers
LANGUAGE ACCESSRecommendation 6.
Distribute poll site interpreters to reflect location of
limited English proficient communities
RANKED CHOICE VOTING IN 2021Recommendation 7.
Continue using DS200 voting machines for Ranked
Choice Voting elections
Recommendation 8.
Publish guidelines for election night results reporting
Recommendation 9.
Prepare a robust voter education plan to educate New
Yorkers about Ranked Choice Voting in 2021

SECTION I. EXECUTIVE SUMMARY9
IMMIGRANTS Since 2013, the CFB has partnered with the U.S.
Citizenship and Immigration Services to offer newly-
naturalized citizens the opportunity to register to vote
immediately following their naturalization ceremonies.
With support from the New York City Board of Elections
and Dominicanos USA, the NYC Votes campaign
registered more than 5,300 new voters at over 75
ceremonies throughout the year at the Federal Building in
Lower Manhattan.
Research suggests that naturalized citizens need regular
information about the political process and guidance on
navigating an election system that is new to them as well
as encouragement to participate. To help convert these
new registrants to new voters, NYC Votes continues its
engagement with new citizens well beyond the naturalization
ceremonies through canvassing events, nonpartisan get-
out-the-vote phone banks, and digital outreach.
With the research published in the 2018–19 Voter Analysis
Report as a guide, the CFB’s outreach to New York’s
immigrant community will be expanded through the
2021 elections to encompass on-the-ground outreach to
immigrant voters in 10 neighborhoods across Brooklyn
and Queens with high rates of naturalized citizens and
persistently low voter turnout.
NYC VOTES
PROGRAMMING HIGHLIGHTSThe ongoing work of the CFB’s Public Affairs division — particularly its efforts to engage new immigrants and youth voters — laid the groundwork for the NYC Votes engagement strategy for 2020–21. The research into New Yorkers’ voting behavior that defined the campaign’s two main areas of focus aligns well with the CFB’s existing Charter mandates and builds on the agency’s work during 2019. Key examples are provided below.
BY THE NUMBERS
NYC VOTES
75+NATURALIZATION CEREMONIES AT THE FEDERAL BUILDING IN LOWER MANHATTAN
5,300NEW VOTERS REGISTERED AT NATURALIZATION CEREMONIES
Keira Knightley

NEW YORK CITY CAMPAIGN FINANCE BOARD | VOTER ANALYSIS REPORT 2019 – 2020 10
YOUTHEvery summer, NYC Votes Street Team interns conduct
workshops with young people across the five boroughs to
deliver the basics on civic engagement and voting, helping
students understand the power they have to improve their
lives by engaging in their democracy.
In summer 2019, the team redeveloped NYC Votes’
civic curriculum around a peer-to-peer model. For most
students, the most effective messengers are their peers.
As the team presented, they did a lot of listening to their
peers. They heard that many young people are extremely
active in their communities, and knowledgeable about the
issues that impact them and their families. Still, youth voter
turnout rates suggest that their activism does not always
translate into showing up at the polls. Through dialogue,
the Street Team’s presentations help both groups identify
the information and resources they need to connect their
voting power to their lived experience, help them make
confident, informed choices at the polls, and energize and
educate their peers in their own communities.
Responding to this feedback, the Street Team’s
redeveloped training curriculum provides young people
with information about voting patterns along with
institutional knowledge about government and elections,
to help young people better understand the power of their
voice in city elections. Using examples like affordable
housing and public safety, the curriculum connects
the issues young people care about to the roles and
responsibilities of their elected officials.
The presentations help students address barriers to voting
in their voter mobilization and organizing efforts. The
presentation provides additional information for students
who do not have access to voting or who are not eligible
to vote due to their immigration status, as well as information
on voting rights and accessibility for individuals without
permanent housing, survivors of domestic violence, or
individuals who were formerly incarcerated.
BY THE NUMBERS
NYC VOTES STREET TEAM
36WORKSHOPS BETWEEN JUNE AND DECEMBER 2019
1,600YOUNG PEOPLE TRAINED TO ENGAGE IN THEIR NEIGHBORHOODS
Keira Knightley

SECTION I. EXECUTIVE SUMMARY11
NYC Votes worked with partners across city
government — including the Department of Youth and
Community Development (DYCD) and its Summer Youth
Employment Programs; the Department of Education;
and DemocracyNYC — and with community-based
organizations, including the New York, Brooklyn, and
Queens Public Libraries. The Street Team held 36
workshops between June and December 2019, training
nearly 1,600 young people across the city to deliver the
message of engagement and empowerment to their
own neighborhoods.
To supplement these efforts, on August 7 the Street Team
organized a first-of-its kind public hearing of the Voter
Assistance Advisory Committee, organized by and for
youth. Entitled We the Young People, the hearing featured
testimony from 20 young people from around the city.
(Another 10 students who could not attend provided
written testimony.)
The hearing provided an opportunity for the Street Team
interns to train students — most of whom had never testified
at a public hearing before — on how to prepare testimony
and present their thoughts at a government meeting.
The student leaders who attended the hearing talked
about their activism and the issues they care about, and
about their experiences with elections. They talked about
the barriers they perceive to more robust participation
among their peers — including lack of access to trusted
information, and a lack of civic education in the schools.
BY THE NUMBERS
WE THE YOUNG PEOPLE HEARING
20YOUNG PEOPLE GIVE TESTIMONY
10STUDENTS PROVIDE WRITTEN TESTIMONY

NEW YORK CITY CAMPAIGN FINANCE BOARD | VOTER ANALYSIS REPORT 2019 – 2020 12
WE POWER NYC
CAMPAIGNOur Goal: To double youth turnout in the 2021 general election.
These efforts provided a strong foundation for the We
Power NYC campaign, a two-year effort to double youth
turnout in the 2021 general election. That campaign
represents a commitment to put youth voices at the
forefront of future NYC Votes programming, and brings
together the quantitative research highlighted in the
2018–19 Voter Analysis Report with qualitative research—
including focus groups with engaged youth from across
the five boroughs—into messages and issues that best
represent the voices of New York City youth.

SECTION II.
OVERVIEW AND ANALYSIS OF THE 2019 ELECTION


ON THE BALLOT IN 2019While 2019 was a historic year for election reform, it was a relatively quiet year
for elections. There were no state or federal races on the ballot in New York
City. At the municipal level, vacancies resulted in special elections for public
advocate and for City Council in District 45. City civil court and supreme court
judgeships were on the ballot in every borough and the Bronx, Queens, and
Staten Island elected district attorneys.
In the general election, New Yorkers also voted on five ballot questions to
amend the City Charter, and for the first time ever, could vote early in person,
for nine days prior to general election day, at designated early voting poll sites.
GENERAL ELECTIONVoter turnout for the November 2019 general election was high compared to
the previous comparable general election in November 2015.1 The total citywide
voter turnout, calculated from the number of actual voters over the number of
registered eligible voters, was 17.2 percent.2 This is compared to a total citywide
voter turnout of 10.0 percent in 2015.
Figure 1.1
General Election 2019 — Citywide Voter Turnout
Compared to the previous three election cycles, voter turnout in November 2019
was much lower because, other than the public advocate race, there were no
executive and legislative races on the ballot for municipal, state, or federal races
to draw interest. Presidential election years reliably net the greatest voter
turnout — which makes the current 2020 presidential year a crucial time to register,
inform, and engage first-time voters ahead of the 2021 municipal elections.
1 Comparing voter turnout rates between election years is complicated by what types of elections occured in the
given years. The 2019 general election turnout is calculated from the citywide public advocate total. The 2015
general election had no citywide race on the ballot, so turnout is calculated from voters in Senate District 19,
Assembly Districts 29 and 46, and City Council Districts 23 and 51. Turnout in judicial races only is not part of the
2015 calculation.
2 Turnout rate is calculated as the number of election voters over the number of registered eligible voters unless
otherwise specified in a footnote. All turnout calculations use the New York City Board of Elections voter history file
compiled February 2020, unless otherwise cited.
SECTION II. OVERVIEW AND ANALYSIS OF THE 2019 ELECTION15
Voters Registered Voters Turnout
791,329 4,592,591 17.2%

Figure 1.2
General Election 2015–2019 — Voter Turnout by Election Cycle
For the second year in a row, New Yorkers voted on ballot proposals to amend
the City Charter. A total of 19 different changes were grouped by category into
five separate questions.3
♦ Ballot Proposal 1 dealt with elections changes including replacing plurality,
single-choice voting with ranked choice voting for city primary and special
elections.
♦ Ballot Proposal 2 made administrative and structural changes to the
Civilian Complaint Review Board, the main New York City Police Department
oversight body, and also expanded their investigatory powers.
♦ Ballot Proposal 3 addressed miscellaneous ethics and governance related
changes, including requiring the City Council’s sign-off on the Mayor’s
appointment of the Corporation Counsel.
♦ Ballot Proposal 4 made procedural changes to the city budget and provided
minimum budgets for certain elected offices.
♦ Ballot Proposal 5 changed the timeline and process of the city’s Uniform
Land Use Review Procedure.
Even though the questions appeared on the second page of the general
election ballot, there was surprisingly little drop-off between total ballots cast
3 2019 New York City Charter Revision Commission. (2019, August 2). Final Report of The 2019 New York City Charter
Revision Commission. Retrieved from https://static1.squarespace.com/static/5bfc4cecfcf7fde7d3719c06/t/5d83dffbf8
b08c5b3087ecc4/1568923645088/Final+Report_8.2.pdf
NEW YORK CITY CAMPAIGN FINANCE BOARD | VOTER ANALYSIS REPORT 2019 – 2020 16
Year On the Ballot Across New York City Turnout
2015 Judicial Civil court and supreme court judgeships 10.0%
2016 Federal President 60.4%
2017 NYC Mayor, Public Advocate, Comptroller, Borough President,
City Council
25.2%
2018 Federal U.S. Senate, U.S. Congress 46.0%
State Governor, Lt. Governor, Attorney General, Comptroller,
State Senate, State Assembly
City Citywide Ballot Ballot Proposals
2019 Judicial Civil court and supreme court judgeships 17.2%
NYC Public Advocate, Citywide Ballot Ballot Proposals

and votes cast on each ballot question.4 Votes cast for Ballot Proposal 1 were
13.0 percent less than total votes cast, with drop-off growing progressively
between the first and last questions; 16.9 percent fewer votes were cast for
Ballot Proposal 5 than the total number of votes.5
In 2018, drop-off rates for the three proposals made by the 2018 Charter
Revision Commission were higher. Ballot Proposal 1 – Campaign Finance had
a drop-off of 25.4 percent citywide, Ballot Proposal 2 – Civic Engagement
Commission had a drop–off of 26.3 percent, and Ballot Proposal 3 – Community
Boards had a drop-off of 26.1 percent.6
Figure 1.3
General Election 2019 — Ballots Cast for Ballot Proposals
Three boroughs exceeded the citywide total voter turnout of 17.2 percent:
Queens with 17.3 percent, Manhattan with 19.5 percent, and Staten Island with
20.3 percent. Voter turnout in the Bronx and Brooklyn was 13.6 percent and 16.8
percent respectively, both below the citywide voter turnout rate. In years past,
the voter turnout rate in the Bronx and Brooklyn has fallen behind that of the
overall city rate. So, while turnout was higher in 2019 than in previous off-cycle
election years, the geographic distribution of voter turnout has remained largely
the same.
4 Kimball, David and Martha Kropf. (n.d.) Voting technology, ballot measures and residual votes. University of Missouri-
St. Louis. Retrieved from http://www.umsl.edu/~kimballd/kkapr08april.pdf
5 Roll–off, or residual votes, are calculated as the difference between total ballots cast and votes cast for each
ballot question.
6 2018–2019 Voter analysis report, 35. (2019). New York City Campaign Finance Board.
Retrieved from https://www.nyccfb.info/pdf/Voter_Analysis_Report_2019.pdf
SECTION II. OVERVIEW AND ANALYSIS OF THE 2019 ELECTION17
Votes Drop-Off
Total Ballots Cast 796,253
Ballot Proposal 1 Elections 693,053 −13.0%
Ballot Proposal 2 Civilian Complaint Review Board 684,317 −14.1%
Ballot Proposal 3 Ethics & Governance 671,927 −15.6%
Ballot Proposal 4 City Budget 670,528 −15.8%
Ballot Proposal 5 Land Use 661,584 −16.9%

Figure 1.4
General Election 2019 Turnout Citywide and by Borough
Voter turnout also varied between the city’s 59 Community Districts, which are
administrative districts that correlate to community board boundaries. Brooklyn
Community District 6 (Carroll Gardens and Park Slope) saw voter turnout almost
8.3 percent greater than the citywide average, while Bronx Community District 1
(Mott Haven and Montrose) saw voter turnout almost 7 percent lower than the
citywide average.7 In past years, wealthy neighborhoods with high levels of
education, particularly in Manhattan, have consistently seen turnout higher than
the citywide turnout, and that trend continued in 2019. Looking at voter turnout
on a community district level highlights the potential value of focusing voter
education and outreach efforts on communities with consistently low voter turnout.
7 Brooklyn Community District 6 includes the neighborhoods of Carroll Gardens, Cobble Hill, Columbia St, Gowanus,
Park Slope and Red Hook. Bronx Community District 1 includes the neighborhoods of Melrose, Mott Haven and
Port Morris.
NEW YORK CITY CAMPAIGN FINANCE BOARD | VOTER ANALYSIS REPORT 2019 – 2020 18
17.2%
13.6%
16.8%
19.5%
17.3%
20.3%
Citywide
Bronx
Brooklyn
Manhattan
Queens
Staten Island

Figure 1.5
General Election 2019 Voter Turnout By Community District
SECTION II. OVERVIEW AND ANALYSIS OF THE 2019 ELECTION19
BK06MN07BK02BK08QN14MN02
SI03SI01
QN02QN06MN10MN04MN06QN11MN08BX08QN01BK07
MN09BX10BK09SI02
QN13BK14BK10
Park Slope, Carroll GardensWest Side, Upper West Side
Brooklyn Heights, Fort GreeneCrown Heights North
The Rockaways, Broad ChannelGreenwich Village, Soho
Tottenville, Woodrow, Great KillsStapleton, Port Richmond
Sunnyside, WoodsideForest Hills, Rego Park
Central HarlemChelsea, Clinton
Stuyvesant Town, Turtle BayBayside, Douglaston, Little Neck
Upper East SideRiverdale, Kingsbridge, Marble Hill
Astoria, Long Island CitySunset Park, Windsor Terrace
Manhattanville, Hamilton HeightsThrogs Nk., Co-op City, Pelham Bay
Crown Heights South, WingateNew Springville, South Beach
Queens Village, RosedaleFlatbush, Midwood
Bay Ridge, Dyker HeightsBK03BK17QN08MN03QN05QN12BK18QN03MN12QN07MN11MN01BX12MN05BK16BK12BK04BX11BK01BX04QN10QN09BK05BX09BK15QN04BK13BX03BK11BX07BX02BX05BX06BX01
Bedford StuyvesantEast Flatbush, Rugby, FarragutFresh Meadows, BriarwoodLower East Side, ChinatownRidgewood, Glendale, MaspethJamaica, St. Albans, HollisCanarsie, FlatlandsJackson Heights, North CoronaWashington Heights, InwoodFlushing, Bay TerraceEast HarlemBattery Park City, TribecaWakefield, WilliamsbridgeMidtown Business DistrictBrownsville, Ocean HillBorough Park, Ocean ParkwayBushwickPelham Pkwy, Morris Park, LaconiaWilliamsburg, GreenpointHighbridge, Concourse VillageOzone Park, Howard BeachWoodhaven, Richmond HillEast New York, Starrett CitySoundview, ParkchesterSheepshead Bay, Gerritsen BeachElmhurst, South CoronaConey Island, Brighton BeachMorrisania, Crotona Park EastBensonhurst, Bath BeachBedford Park, Norwood, FordhamHunts Point, LongwoodUniversity Hts., Fordham, Mt. HopeEast Tremont, BelmontMelrose, Mott Haven, Port Morris
10 15 20 25Turnout Above and Below NYC Total Turnout
Co
mm
un
ity D
istr
ict
Total Turnout in NYC is 17.23%

As in previous elections, older voters made up a larger percentage of actual
voter turnout in the 2019 general election than younger voters. However,
voters between the ages of 18 and 29 nearly doubled their share of total votes
compared to the 2015 general election. In 2019, voters aged 18–29 made up 9.9
percent of actual voters, but in 2015 young voters only made up 5.3 percent of
actual voters.8
During presidential election years, voters aged 18–29 generally participate at
the same level as other age groups. Anticipating increased interest among
younger voters in participating in the November 2020 election, the CFB plans
a focus on getting young people registered and engaged during the 2020
presidential election year, as a first step to build excitement for the 2021
citywide races.
Figure 1.6
General Election 2019 Actual Voters by Age Group
8 Percentages of voters by age group calculated as number of voters in each age group over number of total voters
in the election.
NEW YORK CITY CAMPAIGN FINANCE BOARD | VOTER ANALYSIS REPORT 2019 – 2020 20
15.8%
9.9%
18―29 30―39 40―49 50―59 60―69 70 and up
15.1%
18.4%
20.2%
20.6%
0%
20%
40%
60%
80%
100%
Pe
rce
nta
ge
of
Vo
ters
Age Group

EARLY VOTINGFor the first time ever, New Yorkers were able to vote early in person for
nine days prior to general election day at designated early voting poll sites.9
Voters were assigned specific early voting sites based on their proximity to
the identified sites.
In total there were 61 early voting locations in New York City, with 11 in the
Bronx, 18 in Brooklyn, 14 in Queens, and 9 each in Manhattan and Staten
Island.10 The Bronx and Queens saw the smallest percentage of early ballots
cast out of the total number of general election voters, with 5 percent and 6.5
percent respectively. Citywide, 7.6 percent of general election voters chose
to vote early. The federal Election Assistance Commission reports that, of the
states surveyed in 2018, 17.3 percent of general election voters chose to vote
early in-person compared to other modes of voting such as on election day
and by mail.11
Figure 1.7
General Election 2019 — Early Voting By Borough
The CFB has several recommended changes to early voting in the Legislative
and Policy Recommendations section of this report, and we hope to perform
additional site-specific analysis of early voting as more data from the Board of
Elections becomes available.
9 Early voting took place from Saturday, October 26 through Sunday November 3, 2019. Early voting pollsite hours
varied by day: from 10am to 4pm on Saturday and Sunday; from 9am to 5pm on Monday, Wednesday and Thursday;
and from 7am to 8pm on Tuesday and Friday. See: New York City Board of Election. (n.d.) Information on early
voting. Vote NYC. Retrieved from https://www.vote.nyc.ny.us/html/voters/earlyVoting.shtml
10 New York City Board of Elections. (n.d) Information on early voting. Vote NYC. Retrieved from https://www.vote.nyc.
ny.us/html/voters/earlyVoting.shtml
11 Election administration and voting survey 2018 comprehensive report, 11–12. (2018, January 6). Election Assistance
Commission. Retrieved from https://www.eac.gov/sites/default/files/eac_assets/1/6/2018_EAVS_Report.pdf
SECTION II. OVERVIEW AND ANALYSIS OF THE 2019 ELECTION21
Borough Early Voters Percent of Ballots Cast Early
Bronx 4,893 5.0%
Brooklyn 17,976 7.4%
Manhattan 19,865 10.3%
Queens 13,129 6.5%
Staten Island 4,247 7.3%
Total 60,110 7.6%

PRIMARY ELECTIONNo citywide offices were on the ballot in the June 2019 primary election.
Brooklyn Council District 45 (Flatbush, East Flatbush, Midwood, Marine Park,
Flatlands, Kensington) and the Queens district attorney races were the most
closely contested races in June 2019.
Voter turnout for all of Queens and the neighborhoods that make up Council
District 45 was 11.9 percent. Younger voters continued the trend of turning out at
higher rates than normal in off-cycle election years. Voters aged 18–29 made up
9.2 percent of total voters for the 2019 primary, compared to only 6.0 percent of
total voters in a 2015 Council District 23 primary election.12
Figure 1.8
Primary Election 2019 Voters by Age Group
12 Percentages of voters by age group calculated as number of voters in each age group over number of total voters
in the election.
NEW YORK CITY CAMPAIGN FINANCE BOARD | VOTER ANALYSIS REPORT 2019 – 2020 22
14.1%
9.2%
18―29 30―39 40―49 50―59 60―69 70 and up
12.7%
16.6%
22.4%
25.0%
0%
20%
40%
60%
80%
100%
Pe
rce
nta
ge
of
Vo
ters
Age Group

SPECIAL ELECTIONSLetitia James’ election as New York State Attorney General in November 2018
led to a vacancy in the office of public advocate; Jumaane Williams’s victory in
the ensuing special election led to a City Council vacancy in Council District
45. While recent special elections, particularly ones for city office, have shown
higher voter turnout than in years past, they still lag behind turnout for primary
and general elections.
The special election for public advocate, which was also the first-ever citywide
special election, was held on February 26, 2019 and drew a voter turnout of
9.5 percent. A record number of 17 candidates made it on the ballot.13
Voter turnout for the Brooklyn City Council District 45 race held on May 14, 2019
was 10.6 percent. A total of eight candidates were listed on the ballot.14
Figure 1.9
Special Elections Turnout
13 New York City Board of Elections. (n.d.) Special election public advocate – February 26, 2019, certified election
results. Vote NYC. Retrieved from https://vote.nyc/page/election–results–summary#p3
14 New York City Board of Elections. (n.d.) Special election city council district 45 – May 14, 2019, certified election
results. Vote NYC. Retrieved from https://vote.nyc/page/election–results–summary#p3
SECTION II. OVERVIEW AND ANALYSIS OF THE 2019 ELECTION23
Voters Turnout
Council District 45 9,728 10.6%
Public Advocate 422,946 9.5%

NEW YORK CITY CAMPAIGN FINANCE BOARD | VOTER ANALYSIS REPORT 2019 – 2020 24

SECTION III.
PARTICIPATION SCORE RESEARCH


In furtherance of the CFB’s Charter mandate to analyze the factors that impact voter participation in New York City, the CFB has undertaken original research to help planners, activists, administrators, and advocates better understand which New Yorkers vote, and why.
Last year’s Voter Analysis Report included a section analyzing the influence of
demographics at the neighborhood level on voter turnout in the 2018 general
election.15 Our analysis showed that the age, race, education, and population of
naturalized citizens of a neighborhood had the biggest impact on voter turnout
in November 2018.
This year, to further our analysis, we created a ten year longitudinal study at a
smaller geography, the census tract level, with similar research questions:
1. Which areas of New York City had the lowest voter turnout across the last
10 years?
2. Who lives in those low turnout areas?
3. Which demographic and socioeconomic factors impacted the voting
behavior of New Yorkers over the last 10 years? What differentiates low
turnout and high turnout areas?
For this longitudinal study, we analyzed data at the census tract level instead of
by neighborhoods in order to detect voting behavior patterns at a more granular
level. We also chose to look at voting behavior over the decade-long period
from 2008–2018, because it is the most natural starting point for studying this
era of voting behavior. Nationwide, the 2008 Presidential election recorded the
most votes in history.16 2008 also marks the year Millennials started to enter the
electorate, producing record-breaking turnout for youth and minority voters.17
In New York City, the 2008 general election produced the highest percentage
turnout in recent memory.
This ten-year model shows that the demographics that impact turnout positively
are: being older (50 years old and over), having more education (high school
diploma or more), and being Asian or White. The factors that impact turnout
negatively are: being unaffiliated with a political party and being a naturalized citizen.
15 2018-2019 Voter Analysis Report. (n.d.) New York City Campaign Finance Board.
Retrieved from https://www.nyccfb.info/media/reports/2018-2019-voter-analysis-report/
16 Barr, Andy. (2008, November 5) 2008 turnout shatters all records. Politico.
Retrieved from https://www.politico.com/story/2008/11/2008-turnout-shatters-all-records-015306
17 Hais, Michael & Morley Winograd. (18 December, 2008). It’s official: Millennials realigned american politics in 2008.
HuffPost. Retrieved from https://www.huffpost.com/entry/its-official-millennials_b_144357
SECTION III. PARTICIPATION SCORE RESEARCH27

PARTICIPATION SCORINGFor this analysis, we created a unique “participation score” for each individual
voter in New York City.18 Instead of looking at participation within the view of a
single election, our participation score takes a longer view. The ten-year time
frame allowed us to identify voters who score highly because they vote in every
election or most elections, versus voters who vote intermittently or not at all.
Fig 2.1
Participation Score Calculation
We used two types of files from the New York City Board of Elections:
1. The active voter file, which lists an up-to-date address registered to the
voter, thus allowing us to determine eligible elections for each voter in
each year, and
2. The voter history file used to determine every election a voter voted in.19
Both files identify each registered voter with a CountyEMSID, a unique serial
number given to every registered voter in the city.
The New York City Board of Elections active voter file contains the following
pertinent information: CountyEMSID, and identifying information about each
voter, including address; date of birth; date of voter registration; gender; political
party affiliation; and the following political districts: election district, state
assembly district, congressional district, city council district, state senate district,
civil court district, judicial district.
18 All participation score voting history calculations use the New York City Board of Elections active voter and voter
history files.
19 The participation score includes all elections for federal, state, and municipal representatives, including special and
off-cycle elections. It does not include judicial or county committee elections where no representative offices are on
the ballot.
number of elections a person voted in
VotingParticipation
Scorenumber of elections a person was eligible to vote in
NEW YORK CITY CAMPAIGN FINANCE BOARD | VOTER ANALYSIS REPORT 2019 – 2020 28

Figure 2.2
Example of Voter File
The New York City Board of Elections voter history file lists every election that
each registered voter voted in while they were registered to vote in New York
City. It includes the following pertinent information: CountyEMSID, the political
party the voter was affiliated with at the time of voting, and the election date
and type. If a voter did not vote in an election, the history file does not list their
EMSID for that election date. The voter history file does not contain which
candidate a person voted for.
Figure 2.3
Example of Voter History
SECTION III. PARTICIPATION SCORE RESEARCH29

NEW YORK CITY CAMPAIGN FINANCE BOARD | VOTER ANALYSIS REPORT 2019 – 2020 30
Thanks to our partnership with the CUNY Center for Urban Research at The
Graduate Center, we were able to gather 10 years worth of active voter files
to trace back eligibility for each election that happened in New York City from
2008–2018, even in the case of active voters moving within the city during that
ten-year period. We used the February 2019 history file, which contains every
election a voter voted in up through the November 2018 general election, to
determine whether a person voted in an eligible election or not.
The New York City Board of Elections voter file already contains political districts
for each voter based on their address. Each of the ten active voter files were
geocoded using the New York City Department of City Planning’s Geosupport
tool to place all voters in a Community District, Neighborhood Tabulation Area
(NTA), and census tract and block.
Creating a participation score for each individual voter was a three step process:
1. We combined all ten voter files in order to collate all active voters.
This process also incorporated newly registered voters and voters who
became active after being inactive, as well as new address information
for voters who moved.
2. We then used the 2019 history file to identify which elections from
2008–2018 a voter actually participated in.
3. If a voter was in the voter file from a previous year but was no longer
active in 2018, we took them out of the study. All other voters who were
eligible for an election and were found to have voted in an election were
given a "1" for that election. If a voter was not eligible for a particular
election (for instance they were not living in a district with a special
election or a primary election, or if their registration date was after the
election), they were given an "NA" for that election. If a voter was eligible
for an election but was not in the history file as having voted in that
election, they were given a "0" for that election.
This process gave us the participation score, or a ratio of the number of
elections a person voted in over the number of elections they were eligible to
vote in. The participation score ranges from 0 to 100.
The table with participation score calculations does not contain any personally-
identifiable information, except the CountyEMSID. A completely anonymized
version of the table will be posted on the New York City Open Data portal. The
CFB will not reveal individual participation scores with personally identifiable
information attached.

WEIGHTINGTo account for the fact that it is easier to vote in the only election you have been
eligible for than it is to vote in the past 20 elections you have been eligible for,
we decided to weight the eligible elections value. We could not ascertain a
pattern in the participation or eligibility that correlates with age, so we decided
to weight based on proportion. The maximum number of eligible elections for
voters in the 2018 active voter file was 32 elections. This therefore became
the unweighted value, and each other eligibility sum became weighted by its
proportion to 32. For example, 1 eligible election is weighted by 1/32, 2 eligible
elections is weighted by 2/32, etc.20
Figure 2.4
Frequency of Eligible Elections
20 This weighting methodology was conceptualized with the help of Robert Y. Shapiro, Wallace S. Sayre Professor of
Government and Professor of International and Public Affairs at Columbia University School of International and
Public Affairs, who has expertise in voting, elections, and quantitative methods.
0 5 10 15 20 25 30
010
0,00
020
0,00
030
0,00
040
0,00
0
Fre
qu
en
cy
Number of Eligible Elections
Mean = 15
Std. Dev. = 8
N = 4,663,751
SECTION III. PARTICIPATION SCORE RESEARCH31

Figure 2.5
Frequency of 2018 Participation Scores
0 20 40 60 80 100
020
0,00
060
0,00
01,0
00,0
00
Fre
qu
en
cy
Participation Score
Mean = 29.2
Std. Dev. = 27.2
N = 4,606,170
NEW YORK CITY CAMPAIGN FINANCE BOARD | VOTER ANALYSIS REPORT 2019 – 2020 32
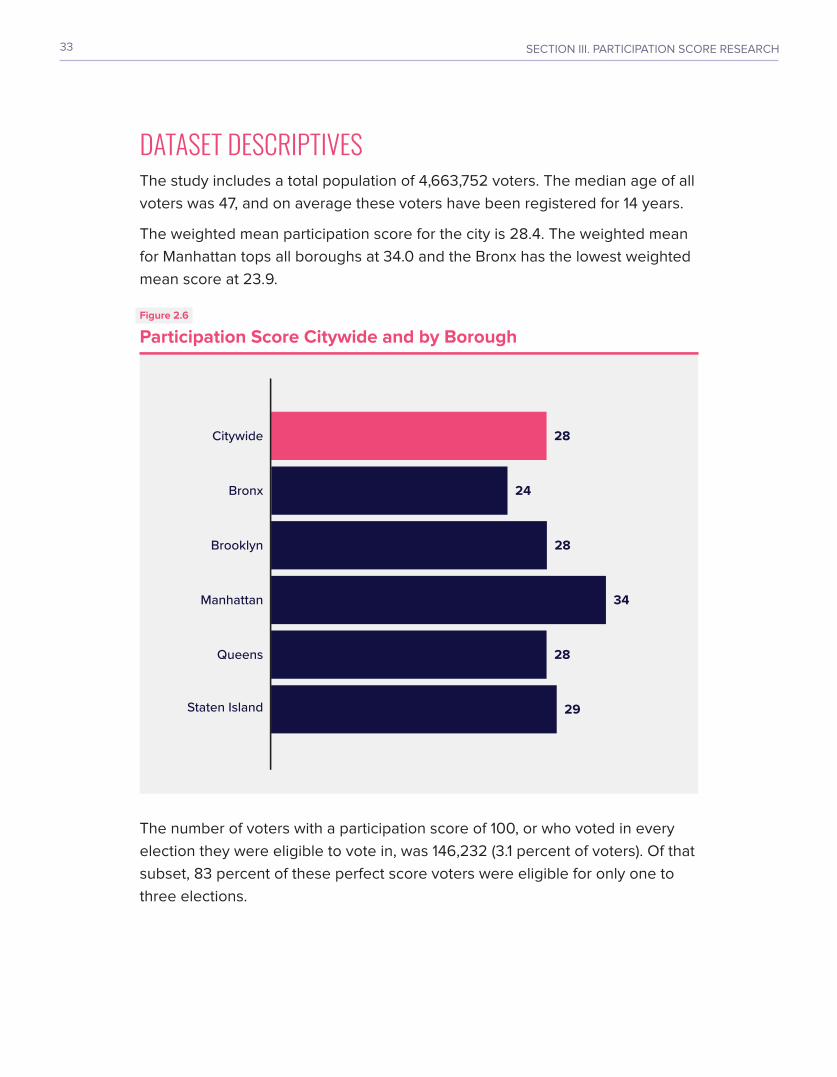
DATASET DESCRIPTIVESThe study includes a total population of 4,663,752 voters. The median age of all
voters was 47, and on average these voters have been registered for 14 years.
The weighted mean participation score for the city is 28.4. The weighted mean
for Manhattan tops all boroughs at 34.0 and the Bronx has the lowest weighted
mean score at 23.9.
Figure 2.6
Participation Score Citywide and by Borough
The number of voters with a participation score of 100, or who voted in every
election they were eligible to vote in, was 146,232 (3.1 percent of voters). Of that
subset, 83 percent of these perfect score voters were eligible for only one to
three elections.
29Staten Island
28Queens
34Manhattan
28Brooklyn
24Bronx
28Citywide
SECTION III. PARTICIPATION SCORE RESEARCH33

Figure 2.7
Histogram of Eligible Elections for Only Those With
a Perfect Participation Score of 100
Furthermore, 989,496 registered voters (21.4 percent) eligible for at least 1
election have never voted once in the years between 2008–2018 and have a
participation score of "0". A geographical pattern emerges where areas with low
participation scores have high numbers of registered voters with a participation
score of "0". The mean years a registered voter who has never voted has been
registered is 11 years.
020
,000
60,0
0040
,000
80,0
00
Fre
qu
en
cy
0 5 10 15 20 25 30Number of Eligible Elections
NEW YORK CITY CAMPAIGN FINANCE BOARD | VOTER ANALYSIS REPORT 2019 – 2020 34

Figure 2.8
Weighted Participation Score Averaged by
New York City Census Tract
SECTION III. PARTICIPATION SCORE RESEARCH35
0.0–21.1
21.1–26.6
26.7–31.7
31.8–37.9
38.0–59.1
NYC Parks and Greenspace

Figure 2.9
Number of Registered Voters Who Have Not Voted
in Any Eligible Election from 2008–2018
0–311
312–508
509–742
743–1,083
1,084–2,463
NYC Parks and Greenspace
NEW YORK CITY CAMPAIGN FINANCE BOARD | VOTER ANALYSIS REPORT 2019 – 2020 36

DEMOGRAPHIC VARIABLESAfter surveying election research literature, with input from our outreach staff,
we determined a list of demographic variables that might impact whether a
voter turns out to vote. Then, we assessed what data is available through the
2013–2017 American Community Survey 5-Year Estimates at the census tract level:
In addition, we added the party affiliation variable from the voter file.
All independent variables are constructed as a percentage of the population
fitting those characteristics at the census-tract level.
A NOTE ABOUT US CENSUS VARIABLESMany of the Census variables we wanted to look at are highly collinear.
Collinearity, or multicollinearity, is defined as two or more independent variables
that influence each other so much that the value of one variable can predict the
other variable. An example of this is household income and internet access —
as a household’s income goes up, the likelihood that the household has
internet access in their home also goes up. Using these correlated variables in
a model to try to predict a dependent variable can distort the relationship each
independent variable has with the dependent variable.
To construct our multiple regression, we manually eliminated some of the
extraneous independent variables that were highly correlated with each other
according to our initial analyses, which included a correlation matrix and a
principle components analysis (page 68 – page 70). Through these
analyses we eliminated language, veterans, and internet access variables from
our regression. We also re-coded some of our data, like constructing an income
♦ Naturalized citizens
♦ Age
♦ Sex
♦ Citizens of voting age
♦ Race
♦ Ethnicity
♦ Benefits usage
♦ Veteran status
♦ Disability status
♦ Length of residency in current home
♦ Ownership of residence
♦ Limited English proficiency
♦ Languages spoken other than English
♦ Educational attainment
♦ Median household income
♦ Unemployment
♦ Poverty status
♦ Commute time
♦ Modes of commute transportation
♦ Internet access
♦ Job sector/class of worker
♦ Health insurance
SECTION III. PARTICIPATION SCORE RESEARCH37

variable that collapses multiple categories of top household incomes, which
allows us to completely eliminate low income categories from our model. We
re-coded certain variables to make them dichotomous — meaning that if we can
detect an impact in voting behavior in top income households, we can assume
that the opposite pattern is happening in low income households.
BUILDING THE LINEAR REGRESSION MODELWhile building the model, we also eliminated census tracts with a population
of less than 100, because they can produce artificially high percentages for our
variables. This eliminated 57 (2.6 percent) New York City census tracts from our
original total of 2,168 census tracts.
After manually eliminating some of the more obvious non-essential collinear
variables, we used the Least Absolute Shrinkage and Selection Operator
(LASSO) to select our variables and create an even more parsimonious model.21
(A parsimonious model will contain the fewest number of predictors that also
give the most prediction power.) Through this process, we eliminated three
additional variables:
1. Percent 18–29 years old
2. Percentage with no health insurance
3. Percentage of citizens of voting age who are Limited English Proficient (LEP)22
The discussion part of this section goes into further detail about how individual
variables impact the model on the whole.
21 LASSO is a type of linear regression that uses L1 regularization to place a constraint on the regression coefficients,
allowing the least important coefficients to shrink to zero and the variables can be eliminated from the model.
We used this type of regression because it is particularly suited for feature selection in models with high
multicollinearity. See: Tibshirani, Robert. (1996). Regression shrinkage and selection via the lasso. Journal of the
Royal Statistical Society, Series B (Methodological), 58(1), 267-288.
22 Limited English Proficiency is defined in the ACS as “speaks English less than very well.”
NEW YORK CITY CAMPAIGN FINANCE BOARD | VOTER ANALYSIS REPORT 2019 – 2020 38

THE FINAL LINEAR REGRESSION MODELAfter feature selection using LASSO, we ran an Ordinary Least Squares
linear regression to reduce the bias of the coefficients in the LASSO model.23
This model has an adjusted r-squared of 0.67, meaning that the model explains
67 percent of turnout in the last 10 years at the census tract level. All variables
are significant except the variable for percentage of Black or African American
residents.24
Having no party affiliation is the top contributor in predicting whether someone
will vote in an election (ß=-0.50).25 If the percentage of blank party affiliation in a
census tract goes up 1 percent, the participation score goes down 0.55 points.
The next most important predictors are residents aged 50 or older (ß=0.35),
percentage of the population holding a high school degree or higher (ß=0.32),
and percentage of Asian (ß=0.27) and White residents (ß=0.26). These 4
predictors all have a positive relationship with the participation score, meaning
as the proportion of the population matching those variables goes up, and all
other variables are held constant, the participation score also goes up.
In the second tier of predictors in our model are percentage of residents who
are naturalized citizens of voting age (ß=-.18), percentage of residents aged
30–49 (ß=0.17), percentage of residents with a commute of 1 hour or more
(ß= -0.09), percentage of disability, age 18 and over (ß=-0.07), and percentage
of Latino residents (ß=-0.07). In the third tier of predictors are household income
of $75,000 or more (ß=0.05), and government workers (ß=-0.04). Percentage of
Black or African American residents was not significant in our model.
23 The creators of the LASSO technique allow for running LASSO-selected features in an unrestricted linear model.
See: Hastie, T.,et al. (2017, January) The Elements of Statistical Learning: Data Mining, Inference, and Prediction. Jan
2017, 91.
24 All variables are significant at the 0.001 level except for the following variables: Latino (p=0.05), household income of
75K+ (p=0.05), government worker (p=0.01). The Black or African American variable was not significant in this model.
25 Beta coefficients, or ß, measure the total effect of the independent variable on the dependent variable, compared to
the other variables in the model.
SECTION III. PARTICIPATION SCORE RESEARCH39

Figure 2.10
Variable Importance from our OLS Model (ß Coefficients)
NEW YORK CITY CAMPAIGN FINANCE BOARD | VOTER ANALYSIS REPORT 2019 – 2020 40
0 10 20 30 5040
The x-axis (“Importance”) is the absolute value of the beta coe�cients. See footnote 25.
Importance
% Blank Party A liation
% Age 50+
% HS or more
% Asian
% White
% Naturalized Citizens of Voting Age
% Age 30–49
% Commute of 60m+
% Disability
% Latino
% Black
% HHI of $75K
% Government worker
Tier 3 Variables
Tier 2 Variables
Tier 1 Variables

Figure 2.11
B Coefficients.
Variable
-0.4
-0.2
0.0
0.2
B
Measures the e�ect the independent variable has, all other variables held constant, on the dependent variable.
Blan
k Pa
rty
A�lia
tion D
isab
ility
(age
18+)
Nat
ural
ized
CVA
P
Com
mut
e of
1 hr
or m
ore
Gov
ernm
ent w
orke
rs
Latin
o
Blac
k
75K+
HH
I
Whi
te
Asia
n
Age
30–4
9
Hig
h Sc
hool
Dip
lom
a or
hig
her
Age
50 a
nd o
lder
SECTION III. PARTICIPATION SCORE RESEARCH41

DISCUSSIONThough we reviewed a larger set of observations and elections broken out
across smaller geographic units, our results show some similarities with
our 2018 model, which looked at only 2018 general election turnout at the
neighborhood level. Age, race, and education were some of the strongest
demographic predictors in both models. As in the 2018 model, age brackets
of 30 or older were found to have positive impacts on voting behavior — which
suggests younger voters are still voting at lower rates compared to older
voters. Within both models, percent of naturalized citizens had a negative
impact on voting behavior, while Limited English Proficiency had no predictive
impact — which suggests an outreach plan targeting immigrant voters more
broadly can reach both audiences at once. The ten-year model added a political
party affiliation variable to the study, which may account for why a ‘blank’ party
affiliation has the strongest relationship with the participation score in the
2008–2018 model while the 30–39 age group was the strongest predictor in the
2018 model.
Our findings are mostly consistent with national research on voting
behavior — age and education have a strong positive impact on voting in
an election.26 Our model finds that being an unaffiliated voter, or political
independent, is the strongest predictor for not voting in New York City and is
the variable with the most impact on our model. In a national poll conducted
before the 2018 midterm elections, the Public Religion Research Institute and
The Atlantic found that voters who identify with a political party are more likely
to be electorally engaged than political independents; only 24 percent of
independents in their poll report being Consistent Voters and 26 percent of
independents report being Non-Voters.27 The 100 Million Project, a research
study by the Knight Foundation on chronic non-voters, also found that non-
voters are more likely to affiliate themselves with minor parties or no party at all
(i.e. Independent).28 Those who are unaffiliated with a political party are usually
not included in get-out-the-vote efforts by major party campaigns like mailings,
calls, or door knocking that function as a reminder of upcoming elections.
26 Who votes, who doesn’t, and why: regular voters, intermittent voters, and those who don't. (2006, October 18).
Pew Research Center. Retrieved from https://www.people-press.org/2006/10/18/who-votes-who-doesnt-and-why/
27 Vandermaas-Peeler, Alex, et. al. (2018, July 17). American democracy in crisis: The challenges of voter knowledge,
participation, and polarization. Public Religion Research Institute. Retrieved from
https://www.prri.org/research/American-democracy-in-crisis-voters-midterms-trump-election-2018/
28 The 100 million project: The untold story of american non-voters. (2020, February). Knight Foundation. Retrieved
from https://knightfoundation.org/wp-content/uploads/2020/02/The-100-Million-Project_KF_Report_2020.pdf
NEW YORK CITY CAMPAIGN FINANCE BOARD | VOTER ANALYSIS REPORT 2019 – 2020 42

Latino or Hispanic residents have a small negative relationship with our
voting participation score. For every 1 percent increase in Latino residents in
a census tract, the participation score goes down 0.02 points. This follows the
national trend of lower Latino turnout across the country.29 Nationally, Latino
voters report numerous barriers to registering to vote or to voting, including long
wait times and voting administration issues.30 This could also be a trend of
undermobilization of newly naturalized and infrequent voters.31 More research
is needed on voting barriers affecting the Latino population in New York City,
specifically.
In our model, if the percentage of Asian Americans in a census tract increased
by 1 percent, then the mean weighted participation score increases by 0.10
points. Asian Americans have faced historical barriers to citizenship and voting
in New York City. In 2009, Council Member Margaret Chin became the first
Asian-American municipal elected official when she won her City Council
District 1 seat. After advocating before several redistricting commissions,
Asian American civic groups proved to be organized in enough numbers to
establish districts where Asian-Americans could be an effective voting bloc, as
well as increase Asian-American turnout.32 Although our model did not find a
relationship between not understanding English and voter turnout in the city,
community polling suggests language access is still a voting barrier for many
Asian Americans.33 Nationally, Asian Americans also vote in high numbers.34
Black New Yorkers have also faced historical barriers to voting. Both our 2018
model and our 2008–2018 model contained variables for percentage of Black
residents and in both models those variables were not significant. This indicates
that Black voters turn out in roughly the same numbers as White residents in
New York City and so do not contribute significantly to our model.35 We also
29 Varela, Julio Ricardo. (2017, May 15). New census data says 2016 national latino voter turnout rate did not increase.
Latino USA. Retrieved from https://www.latinousa.org/2017/05/15/new-census-data-says-2016/
30 Pantoja, Adrian. (26, October 2018). Nearly half of latino voters experienced electoral barrier. Latino Decisions.
Retrieved from https://latinodecisions.com/blog/nearly-half-of-latino-voters-experienced-electoral-barrier/
31 Barreto, Matthew, A. (2018). The cycle of undermobilization of minority voters. Journal of Race, Ethnicity and Politics
3(1), 185–188.
32 First asian american wins citywide office and two asian americans join city council in historic NYC elections. (2009,
November 4). AALDEF.
33 The asian american vote 2016. (2017, April 18). AALDEF. Retrieved from https://www.aaldef.org/uploads/pdf/
TheAsianAmericanVote2016-AALDEF.pdf
34 Ao Minnis, Terry, & Moua, Mee. (2015, August 4). 50 Years of the voting rights act: The asian american perspective.
Retrieve from https://www.advancingjustice-aajc.org/sites/default/files/2016-09/50-years-of-VRA.pdf
35 The NYC election atlas: voting by ethnicity 2009-2012. (n.d.). NYC Election Atlas. Retrieved from http://www.
nycelectionatlas.com/tables.html
SECTION III. PARTICIPATION SCORE RESEARCH43
found a very high correlation between Black or African American race and
affiliation with the Democratic Party (r2=0.70), which may explain why Black
turnout is on par with the city average — we know that affiliation with a major
party increases turnout.
Our 2018 model found that naturalized citizenship was one of the strongest
negative predictors of voting behavior. In our ten-year model, this variable was
the sixth most important. If naturalized citizens of voting age increased by 1
percent in a census tract, the mean participation score would decrease 0.07
points. This pattern in New York City mirrors the national trend of immigrant
voters turning out in lower numbers than US born voters.36 Pew Research Center
also notes that naturalization rates are increasing among US immigrants;
nationally there was a 37 percent increase in the total number of naturalized
immigrants from 2005 to 2015.
The fact that almost a quarter of New York City registered voters have not
voted within the ten-year study period indicates the problem in the city is not
registration rates, but a problem with turnout and get out the vote efforts. Or it is
perhaps, in part, a problem of election administration and law. In 2019, the state
legislature passed sweeping election reform measures that include early voting,
combined primaries, and pre-registration for 16- and 17-year olds. The CFB is
committed to continuing this voter participation research in order to identify
trends that indicate voting is increasing and barriers to voting are falling.
FUTURE RESEARCH QUESTIONS AND NEXT STEPSWhile this comprehensive study provides a detailed picture of voting behavior
across New York City, it is only the start. The conclusions raise numerous
interesting questions that are best addressed through further qualitative research,
in consultation with demographic and regional experts and community partners.
Areas for future research beyond this longitudinal participation study could
include: registered voters who have never voted, Asian American voters, Black
or African American voters, and Latino voters. Additional research could also
explore whether trends for these groups are unique to New York or fit into the
broader national voting trend narrative.
36 Budiman, Abby, et.al. (2020, February 26). Naturalized citizens make up record one-in-ten U.S. eligible voters in
2020. Pew Research Center: Hispanic Trends. Retrieved from https://www.pewresearch.org/hispanic/2020/02/26/
naturalized-citizens-make-up-record-one-in-ten-u-s-eligible-voters-in-2020/
NEW YORK CITY CAMPAIGN FINANCE BOARD | VOTER ANALYSIS REPORT 2019 – 2020 44

SECTION IV.
POLICY & LEGISLATIVE RECOMMENDATIONS


LOOKING FORWARDThis is an incredibly exciting time for voting in New York City. With the
Legislature and Governor enacting a series of election reforms that finally are
starting to bring New York elections into the 21st century, the next two years
provide a unique opportunity to engage voters in elections. In 2020, New
Yorkers will go to the polls to cast their vote for president. Based on increased
turnout during the 2018 midterm elections in both New York City and across
the country, it would be reasonable to expect that turnout levels in 2020 will be
even higher than in previous presidential elections.
LEGISLATIVE CHANGES TO IMPROVE VOTINGSince the 2018 Voter Analysis Report was published in April 2019, many
legislative and policy changes have been made to voting access in New York
City. The state government passed laws allowing 16 and 17-year olds to pre-
register as voters and also made ballots easier for voters to read and use.
They also moved the party enrollment deadline closer to election day and
consolidated primary elections into a single date in June. Last but not least, the
Legislature took the first step in a multi-year process to enact two significant
reforms that require a constitutional amendment — same day voter registration
and no-excuse absentee voting.
While much has been accomplished through legislative means in the past year,
the CFB recommends several proposals that build on the successes of the
current session.
SECTION IV. POLICY & LEGISLATIVE RECOMMENDATIONS47

RIGHTS RESTORATION FOR PAROLEESIn 2018, Governor Cuomo issued
Executive Order 181 granting
consideration of a conditional voting
rights restoration pardon to any
individuals being released from
incarceration onto parole supervision
and individuals who are currently
under parole supervision.37 Prior to
this executive order, State Election
Law barred parolees with felony
convictions from registering to vote.
To restore their voting rights, parolees
had to wait until they were discharged from parole or reached the maximum
expiration date of their sentence. At the time of signing his executive order, the
Governor’s office estimated that parolee voting restrictions impacted around
35,000 parolees in New York, nearly 75 percent of which are people of color.38
On May 22, 2018, Governor Cuomo issued his first group of conditional
pardons to 24,046 parolees.39 New pardons are considered every month by
the Governor’s office on an individual, case-by-case basis and are conditional,
meaning that if a person is re-incarcerated their voting rights can be revoked.40
Parole officers are meant to deliver pardons directly to individuals under their
supervision and provide information and the form to register to vote.41
37 New York state governor’s office executive order 181. (2018, April 18). Retrieved from
https://www.governor.ny.gov/sites/governor.ny.gov/files/atoms/files/EO_181.pdf
38 Governor Cuomo signs executive order to restore voting rights to New Yorkers on parole. (2018, April 18). Retrieved
from https://www.governor.ny.gov/news/governor-cuomo-signs-executive-order-restore-voting-rights-new-yorkers-
parole
39 Governor Cuomo issues first group of conditional pardons restoring the right to vote to New Yorkers on parole.
(2018, May 22). Retrieved from https://www.governor.ny.gov/news/governor-cuomo-issues-first-group-conditional-
pardons-restoring-right-vote-new-yorkers-parole
40 Voting restoration pardons. (n.d.). Retrieved from https://www.ny.gov/services/apply-clemency
41 Ibid.
Recommendation 1
Automatic Restoration of Voting Rights to Parolees
The New York State legislature should
pass legislation to automatically restore
voting rights and provide voter registration
to parolees immediately upon release
from prison.
NEW YORK CITY CAMPAIGN FINANCE BOARD | VOTER ANALYSIS REPORT 2019 – 2020 48

In last year’s report, the CFB recommended a permanent legislative solution to
protect parolee voting rights and to bring New York State in line with the group
of states that automatically restore voting rights once an individual is released
from prison. In 2019, Nevada and Colorado joined this group of states, plus the
District of Columbia, bringing that total number to 18 states.42
The Governor’s conditional pardons are a step in the right direction to restore
the franchise to parolees. However, legislation would provide a more permanent
solution and reduce confusion for election administrators, parole officers, and
parolees themselves.43 In early 2019, state legislators introduced bills in both
houses that would restore voting rights to people on parole and also provide
a clear process for new parolees to be registered to vote immediately upon
release from prison.44
Codifying the restoration of voting rights to parolees can eliminate the
administrative burden of the monthly pardon process on the Department of
Corrections and Community Supervision and the Governor’s office. It would also
eliminate confusion for parole officers and parolees around whether parolees
need to actively register to vote and for boards of elections administrators who
rely on the Election law to know who is eligible to vote.45
42 Colorado, District of Columbia, Hawaii, Illinois, Indiana, Maryland, Massachusetts, Michigan, Montana, Nevada, New
Hampshire, North Dakota, Ohio, Oregon, Pennsylvania, Rhode Island, and Utah provide automatic voting rights
restoration after release. In Maine and Vermont, felons never lose the right to vote, even when serving their prison
sentences. Since last year’s report, Florida now requires additional action by parolees to restore voting rights. See:
Felon voting rights. (2019, October 14). National Conference on State Legislatures. Retrieved from
https://www.ncsl.org/research/elections-and-campaigns/felon-voting-rights.aspx
43 Voting rights restoration efforts in New York. (2020, February 5). Brennan Center for Justice. Retrieved from https://
www.brennancenter.org/our-work/research-reports/voting-rights-restoration-efforts-new-york
44 Retrieved from A.4987. (n.d.) https://www.nysenate.gov/legislation/bills/2019/a4987 and
S. 1931 https://www.nysenate.gov/legislation/bills/2019/s1931
45 Voting rights restoration efforts in New York. (2020, February 5). Brennan Center for Justice. Retrieved from https://
www.brennancenter.org/our-work/research-reports/voting-rights-restoration-efforts-new-york
SECTION IV. POLICY & LEGISLATIVE RECOMMENDATIONS49

VOTER REGISTRATIONTwo voting reform bills passed by
the state legislature in 2019 require
amending the state constitution:
same-day voter registration and
no-excuse absentee voting.
The New York State Constitution
currently describes specific criteria
required in order to receive an
absentee ballot and also requires
that a voter be registered at least
ten days before each election. As a result, in order to become law, both same-
day registration and no-excuse absentee voting require a Constitutional
amendment.46 A Constitutional amendment must pass the legislature in two
consecutive two-year legislative sessions and then ultimately ends up before
voters as a ballot referendum.47
In last year’s report, the CFB recommended that both laws be passed by the
State legislature, which they did at the start of 2019. Next, the legislature must
pass both bills again in the 2021–2022 legislative session.48 If the Legislature
approves these measures early in 2021, both referenda could be on the ballot
as early as November 2021, and take effect January 1, 2022.49
Same-day voter registration will provide eligible New Yorkers the opportunity
to register to vote in person and cast a ballot, all on one day. This reform
eliminates barriers to voting for New Yorkers who missed the registration
deadline and for those who go to vote on Election Day only to find they are not
in the poll books. A total of 21 states plus the District of Columbia currently allow
same-day or election day registration.50
No-excuse absentee voting will expand access to voters who want to vote
by mail but do not currently meet the limited “excuse” criteria laid out in the
46 New York State Constitution, Article II, Section 5.
47 New York Civil Liberties Union. (2019, February) Guide to amending the New York state constitution. Retrieved from
https://drive.google.com/uc?export=download&id=1qxYmyfIMkMKN4Ukb_H960BBJZgTFIV7y
48 Ibid.
49 Ibid.
50 Same day voter registration. (2019, June 28). National Conference on State Legislatures. Retrieved from
https://www.ncsl.org/research/elections-and-campaigns/same-day-registration.aspx
Recommendation 2
Same-Day Voter Registration and No-Excuse Absentee Voting
In the upcoming 2021–2022 legislative
session, the New York State legislature
should prioritize passing same-day voter
registration and no-excuse absentee voting
early enough to ensure both referenda are
put on the November 2021 ballot.
NEW YORK CITY CAMPAIGN FINANCE BOARD | VOTER ANALYSIS REPORT 2019 – 2020 50

Election law and the State Constitution.51 Currently, 33 states plus the District of
Columbia offer voters the ability to request a “no excuse” absentee ballot.52
As discussed in the previous year’s Voter Analysis Report, not only does no-
excuse absentee voting benefit voters with disabilities, the elderly, parents of
young children, and many others who are not covered by the current absentee
ballot criteria, but it should also be an important component of elections disaster
contingency plans.53 Many states have shared plans for continuity of operations
with the Elections Assistance Commission (EAC), including Colorado, Minnesota,
Montana, Virginia, Washington, and Wisconsin.54 Both the State and City Boards
of Elections have contingency plans but they are not available publicly.55
In just the last twenty years, New York has twice had instances when elections
were scheduled during or immediately following major disasters. In 2001, after
the September 11th terrorist attack, state legislators took action and rescheduled
the citywide primary election from September 11th to September 25th, since
voting was interrupted mid-day and many voters did not make it to the polls.56
In November 2012, the Board of Elections found replacement poll sites and
the Governor issued an emergency executive order to allow voters to cast
provisional ballots during the general election that was scheduled one week
after Hurricane Sandy.57
In 2020, the presidential election cycle is happening concurrently with the
outbreak of COVID-19, a novel coronavirus that has grown to pandemic
proportions starting in January 2020. Primary elections, as well as some local
or state level elections, have been postponed in some states and counties and
51 New York State Constitution, Article II, Section 2.
52 Absentee and early voting. (2020, February 20). National Conference on State Legislatures. Retrieved from https://
www.ncsl.org/research/elections-and-campaigns/absentee-and-early-voting.aspx
53 Kaplan, Thomas. (2013, November 13). Using hurricane Sandy as a lesson for future elections. The New York Times.
Retrieved from https://www.nytimes.com/2013/11/13/nyregion/lessons-from-hurricane-sandy-being-applied-to-
election-planning.html
54 Individual counties in California and Florida have also made contingency plans available to the EAC.
See: Elections Management Resources: Contingency Plans. (n.d.) Election Assistance Commission. Retrieved from
https://www.eac.gov/election-officials/contingency-plans
55 Kaplan, Thomas. (2013, November 13). Using hurricane Sandy as a lesson for future elections. The New York Times.
Retrieved from https://www.nytimes.com/2013/11/13/nyregion/lessons-from-hurricane-sandy-being-applied-to-
election-planning.html
56 Nagourney, Adam. (2001, September 14). Primary rescheduled for Sept. 25, with runoff, if necessary, set for Oct.
11. The New York Times. Retrieved from https://www.nytimes.com/2001/09/14/us/after-attacks-election-primary-
rescheduled-for-sept-25-with-runoff-if-necessary.html
57 Halbfinger, David M., Thomas Kaplan, & Wendy Ruderman. (2012, November 6). Officials rush to find ways for the
storm-tossed to vote. The New York Times. Retrieved from https://www.nytimes.com/2012/11/06/nyregion/after-
hurricane-sandy-efforts-to-help-the-displaced-vote.html
SECTION IV. POLICY & LEGISLATIVE RECOMMENDATIONS51

there is uncertainty around when primary elections can take place in all states
(see page VIII for additional context). However, uncertainty during crises
can be alleviated by contingency plans and by providing flexible legal options
to election administrators. Some of the elections contingency plans provided
to the EAC that are designed specifically with flu or disease outbreak in mind
recommend increased use of absentee ballots and for universal vote by mail be
introduced.58
The ability to request no-excuse absentee ballots, or a disaster plan option
that converts an entire election to vote by mail, would reduce in-person voting
exposure threats for poll-workers and voters. It also would reduce or eliminate
the need for physical poll sites during a vulnerable time when traditional poll
sites such as schools, libraries, elections offices, and other public service spaces
are closed or are operating at reduced capacity. Allowing New Yorkers to no-excuse
vote via absentee ballot, particularly during emergencies, is not only essential to
our democracy, but to the health and safety of our fellow New Yorkers.
There are two bills currently before
the State legislature that would
dramatically improve the process
of voter registration: Automatic
Voter Registration and online voter
registration. These proposed changes
would impact a total of 848,568
New York City residents who are
eligible to vote but are not registered,
representing 15.6 percent of the
citizens of voting age population.59
Automatic Voter Registration (AVR) is a process by which voters are
automatically registered to vote after interacting with another government
agency. A voter can opt-out of being registered when interacting with the state
agency, but otherwise the agency will transfer a new voter’s information directly
to the state board of elections. Currently, the National Voter Registration Act
(NVRA) requires all state motor vehicles agencies, and certain public assistance
58 Montana, Wisconsin, and the EAC recommendations on contingency planning all contemplate absentee ballots
or vote by mail as possible options. See: Elections management resources: contingency plans. (n.d.) Election
Assistance Commission. Retrieved from https://www.eac.gov/election-officials/contingency-plans
59 Number of registered voters as of October 11, 2019, the deadline to register for the November 2019 election.
Citizens of voting age population taken from the Census Bureau’s 2013–17 American Community Survey 5-year
Estimate.
Recommendation 3
Automatic Voter Registration and Online Voter Registration
The New York State legislature should pass
legislation to allow for Automatic Voter
Registration and for the CFB’s online voter
registration platform to be used to register
voters.
NEW YORK CITY CAMPAIGN FINANCE BOARD | VOTER ANALYSIS REPORT 2019 – 2020 52

and disability offices, to provide eligible residents with an opportunity to register
to vote when interacting with the agency but does not automatically transfer
their information.60
There are 16 states, plus the District of Columbia, that have adopted AVR.
Partly as a result of the success of the “motor voter” aspect of the NVRA, most
designate the state’s motor vehicles agency as the main agency tasked with
automatically registering voters.61 The AVR bill, which passed the Senate but has
yet to pass the Assembly, names the New York Department of Motor Vehicles
and Department of Health as participating AVR agencies, while an Assembly bill
which has not yet been passed allows the State Board of Elections to designate
participating agencies.62
In testimony before the Senate Election Committee, the CFB recommended
that designated agencies be named within the bill text.63 Designated agencies
should include the DMV but also public-facing agencies such as NYCHA, all
SUNY and CUNY locations, public housing authorities, the Department of
Corrections and Community Supervision, the Department of Labor, and the
New York Division of Military and Naval Affairs. The CFB supports having
language in the legislation to allow additional agencies to be added, but also
clearly enumerate the criteria required to be considered a designated agency.
Online voter registration simply supplements the traditional paper-based
process of voter registration with one that is also available electronically.
A total of 39 states plus the District of Columbia offer online voter registration
in addition to traditional paper-based voter registration.64
60 U.S. Department of Justice. (1993). The National Voter Registration Act of 1993: Questions and answers. Retrieved
from https://www.justice.gov/crt/national-voter-registration-act-1993-nvra
61 California, Colorado, Connecticut, District of Columbia, New Mexico, Nevada, Oregon, Vermont, and West Virginia
require only the state’s motor vehicle agency to participate in AVR. Illinois, Maine, Maryland, Massachusetts,
New Jersey, Rhode Island, and Washington require the state’s motor vehicle agency and other designated agencies
to participate in AVR. Alaska only requires the Permanent Fund Dividend to participate in AVR. See: Automatic
voter registration. (2019, April 22). National Conference on State Legislatures. Retrieved from https://www.ncsl.org/
research/elections-and-campaigns/automatic-voter-registration.aspx
62 New York State Senate S6457B. (2019). Retrieved from https://www.nysenate.gov/legislation/bills/2019/s6457
A8280A https://www.nysenate.gov/legislation/bills/2019/a8280
63 Loprest, Amy. (2019, May 30). Testimony of Amy Loprest, Executive Director of the New York City Campaign Finance
Board to the New York State Senate Elections Committee. New York CIty Campaign Finance Board. Retrieved from
https://www.nyccfb.info/media/testimony/testimony-of-amy-loprest-executive-director-of-the-new-york-city-
campaign-finance-board-to-the-new-york-state-senate-elections-committee/
64 Online voter registration. (2020, February 3). National Conference on State Legislatures. Retrieved from
https://www.ncsl.org/research/elections-and-campaigns/electronic-or-online-voter-registration.aspx
SECTION IV. POLICY & LEGISLATIVE RECOMMENDATIONS53

Currently, New York allows online voter registration in a limited capacity through
the Department of Motor Vehicles (DMV).65 Since 2012, New Yorkers with a
driver's license or non-driver state ID can use the DMV’s Motor Voter online
registration platform to register to vote or make changes to their existing
voter registration. However, New York City residents who do not have driver’s
licenses or non-driver state IDs do not have the option of using the DMV system
to register to vote online.
In 2019, Governor Cuomo directed that a portion of the New York State
Executive budget be used to create an online voter registration system,
however, there is no deadline by which the system must be created.66 In 2017,
the City Council, through local law, directed the Campaign Finance Board to
create an online voter registration platform to capture the population of New
York City voters who would like to register online but do not have a driver's
license or state ID. The CFB created an online voter registration platform which
is not currently able to be used by the City Board of Elections because they
are lacking specific guidance from the State Board of Elections on whether it is
permissible to accept registration forms in this manner. A current bill before the
Legislature would allow the CFB to host an online voter registration platform.67
65 Register to vote online - Electronic voter registration application. (n.d.) New York State Department of Motor
Vehicles. Retrieved from https://dmv.ny.gov/more-info/electronic-voter-registration-application
66 Governor Cuomo announces highlights of FY 2020 budget. (2019, April 1). Retrieved from https://www.governor.
ny.gov/news/governor-cuomo-announces-highlights-fy-2020-budget
67 New York City Council LL 238-2017.
NEW YORK CITY CAMPAIGN FINANCE BOARD | VOTER ANALYSIS REPORT 2019 – 2020 54

POLICY CHANGES TO IMPROVE VOTINGThe CFB also has several policy recommendations to improve election
administration, taking into consideration early voting, additional language
interpreter support provided by the new Civic Engagement Commission, and
implementation of ranked choice voting for municipal elections in 2021.
RECOMMENDATIONS TO IMPROVE EARLY VOTINGFor the first time ever, in November
2019, New Yorkers were able to vote
early in person for nine days prior
to general election day. Citywide,
1.3 percent of total registered voters
voted early compared to all of New
York State, where 1.9 percent of total
registered voters voted early.68
It is difficult to say with any certainty
whether the availability of early voting might have contributed to the increase
in turnout in the 2019 election vs. the comparable 2015 election. However,
many observers credited early voting with making the overall voting experience
easier and more seamless for voters. The New York State Board of Elections co-
chairs noted “Voters reported enjoying the convenience of selecting a day and
having time to go and vote... Wait times were minimal and the experience was
streamlined.”69
While early voters represented a small percentage of the total registered voting
population, about 7.6 percent of actual voters chose to vote early, indicating it was
possibly a popular method for those who were likely already planning to vote.
We hope to do additional early voting site analysis as more data from the Board
of Elections becomes available, in particular to see whether distance from an
early poll site impacted a voter’s likelihood to vote early.
68 Reisman, Nick. (2019, November 4). The First Year of Early Voting, by the Numbers. Spectrum Local News. Retrieved
from https://spectrumlocalnews.com/nys/central-ny/politics/2019/11/04/the-first-year-of-early-voting — by-the-
numbers
69 First year with early voting deemed a success, as turnout in NYC and other counties appears up: Officials. (2019,
November 20). NBC 4 New York. Retrieved from https://www.nbcnewyork.com/news/local/first-year-with-early-
voting-deemed-success-nyc-turnout-up-officials/2205663/
Recommendation 4
Open Additional Assigned Early Voting Poll Sites
The CFB recommends that the City Board
of Elections open additional poll sites to
reduce the distance between voters and
their assigned early poll sites and to ensure
equal access for voters in each borough.
SECTION IV. POLICY & LEGISLATIVE RECOMMENDATIONS55

In New York City, voters were assigned a specific early voting site based on its
proximity to their residential address. According to the Election Law, all voters
must have access to a polling location “on a substantially equal basis.”70 In total
there were 61 early voting locations in New York City, with 11 in the Bronx, 18 in
Brooklyn, 14 in Queens, and 9 each in Manhattan and Staten Island.71 Although
the law passed by the State legislature only required 34 poll sites in all five
boroughs, it was estimated that the $75 million designated for early voting in
the city’s fiscal year 2020 executive budget could cover up to 100 poll sites.72
Distribution of the 61 general election voting sites was unequal between
boroughs and was not connected to the number of potential voters expected
per poll site. Voters in the Rockaways had the furthest to travel between their
residential address census tract and their assigned early voting site nearly
6.5 miles away.73 When compared to the number of citizens of voting age per
borough, Manhattan and Queens had far fewer poll sites compared to the other
three boroughs.
Figure 3.1
General Election 2019 — Sites per Number of Registered Voters
70 N.Y. Election Law § 8-600(3)
71 New York City Board of Elections. (n.d.) Information on early voting. Vote NYC. Retrieved from https://www.vote.nyc.
ny.us/html/voters/earlyVoting.shtml
72 New York City Mayor’s Office. (2019, April 29). Mayor de Blasio to Board of Elections: Get early voting right.
Retrieved from https://www1.nyc.gov/office-of-the-mayor/news/223-19/mayor-de-blasio-board-elections-get-early-
voting-right#/0
73 Analysis measuring the direct distance between the geospatial center of each census tract and the assigned poll site.
Borough Registered Voters Number of Sites
Registered Voters/
Number of Sites
Bronx 726,402 11 66,037
Brooklyn 1,461,103 18 81,172
Manhattan 1,002,419 9 111,380
Queens 1,184,884 14 84,635
Staten Island 291,727 9 32,414
Total 4,666,535 61 76,501
NEW YORK CITY CAMPAIGN FINANCE BOARD | VOTER ANALYSIS REPORT 2019 – 2020 56

Figure 3.2
General Election 2019 — Early Voting Poll Sites
SECTION IV. POLICY & LEGISLATIVE RECOMMENDATIONS57

Some other New York counties that
implemented early voting in 2019 used
vote centers instead of assigned poll
sites. Vote centers allow voters to cast
a ballot at any vote center within the
county. A benefit of this model is that
voters can choose to vote at the poll
site closest to their work, their child’s
school, or even near their grocery
store.74 Some studies have even
shown that vote centers can increase
turnout among sporadic voters who do
not vote every year.75
Vote centers were implemented for early voting in Nassau County on Long
Island, which rolled out 15 early vote centers for 944,873 registered voters.76
Nassau County utilizes electronic poll books to identify voters and verify their
signatures before a poll worker prints their precinct-specific ballot with a ballot-
on-demand printer designed for early voting.77 There were 56 different “ballot
variation,” or layouts that differ by what races are listed depending on the
voter’s precinct, in Nassau County in 2019. Onondaga County, which includes
the city of Syracuse, offered six early vote centers for 292,716 registered voters,
and also provided ballot-on-demand printing.78
The Election Law stipulates that “any voter may vote at any polling place for
early voting” in the county they are registered to vote in unless it is “impractical”
to provide all early voting ballots in one location or if the site did not use
74 Vote centers. National Conference on State Legislatures. (n.d.) Retrieved from https://www.ncsl.org/research/
elections-and-campaigns/vote-centers.aspx
75 Stein, Robert M. & Greg Vonnahme. (2008, April 2). Engaging the unengaged voter. Rice University's Baker Institute
for Public Policy. Retrieved from https://www.bakerinstitute.org/research/engaging-unengaged-voter/
76 Jessica Huseman. (2019, May 17). New York City’s early voting plan will favor white, affluent voters, advocacy groups
say. ProPublica. Retrieved from https://www.propublica.org/article/new-york-citys-early-voting-plan-will-favor-white-
affluent-voters-advocacy-groups-say; For Number of registered voters in Nassau County as of Nov. 1, 2019, See:
https://www.elections.ny.gov/EnrollmentCounty.html.
77 Seidman, Alyssa. (2019, October 24). Polling sites prepare for early voters. LIHerald. Retrieved from
https://www.liherald.com/stories/polling-sites-prepare-for-early-voters,119270?
78 Weiner, Mark. (2019, November 4). New York early voting: Success or waste of money? Syracuse University.
Retrieved from https://www.syracuse.com/news/2019/11/new-york-early-voting-success-or-waste-of-money.html;
Harding, Robert. (2019, October 23). Early voting in Onondaga County: What you should know about times, locations
and more. Auburnpub Retrieved from https://auburnpub.com/blogs/eye_on_ny/early-voting-in-onondaga-county-
what-you-should-know-about/article_8e3c0745-e64d-5e71-9c7e-0e701ece71f0.html; For number of registered
voters in Onondaga County as of Nov. 1, 2019, see https://www.elections.ny.gov/EnrollmentCounty.html
Recommendation 5
Replace Some or all Assigned Poll Sites with Vote Centers
The CFB recommends that the City Board
of Elections implement vote centers during
early voting to replace some or all of the
assigned poll sites.
NEW YORK CITY CAMPAIGN FINANCE BOARD | VOTER ANALYSIS REPORT 2019 – 2020 58

electronic poll books.79 The City Board of Elections chose not to create vote
centers in order to minimize the ballot variations that would need to be available
at each early poll site, including in numerous language variations.80 They have
stated that in future elections, vote centers might be used on a county-basis,
reducing the number of potential ballot variations to a more manageable
amount like in Syracuse and Nassau County.81
LANGUAGE ACCESSTwo years ago, in November 2018,
New York City voters approved a
ballot initiative to create the Civic
Engagement Commission (NYCCEC).
Part of the CEC’s job is to “develop a
plan to consider the language access
needs of limited English proficient
(LEP) New Yorkers... and provide
language interpreters at poll sites
by the 2020 general election, with
advice from a language assistance
advisory committee.”82 Limited English
proficient is defined by the Census Bureau’s American Community Survey as
speaking English less than very well.83
The City Board of Elections, as required by the Federal Voting Rights Act,
provides translation and interpreter services in Bengali, Chinese, Korean, and
Spanish. However, of our 1.8 million LEP residents, about 300,000 (16.7 percent)
speak a language that is not protected under the federal VRA. The Poll Site
Language Assistance Program will provide interpreters at New York City poll
sites to assist LEP voters with casting a ballot, beyond whatever assistance is
already provided by the Board of Elections.
79 N.Y. Election Law § 8-600(3)
80 McKinley, Jesse & Jeffery C. Mays. (2019, October 24). The state kind of dumped this on us: Early voting stirs anxiety
in N.Y. The New York Times. Retrieved from https://www.nytimes.com/2019/10/24/nyregion/early-voting-ny-election.
html
81 Ibid.
82 About. (n.d.) New York City Civic Engagement Commission. Retrieved from https://www1.nyc.gov/site/
civicengagement/about/about.page
83 Language use: About this topic. (n.d.) U.S. Census Bureau. Retrieved from https://www.census.gov/topics/population/
language-use/about.html
Recommendation 6
Distribute Poll Site Interpreters to Reflect Location of Limited English Proficient Communities
The CFB recommends the NYCCEC should
allocate poll site interpreters based on the
census tract level data for citizens of voting
age who are limited English Proficient
(CVAP LEP) aggregated by census tracts
assigned to each poll site.
SECTION IV. POLICY & LEGISLATIVE RECOMMENDATIONS59

The NYCCEC developed an initial methodology to determine which languages
are eligible for services and the poll sites where such services would be
provided that takes into consideration the LEP needs of the whole city, rather
than each individual location when determining when to provide assistance.84
1. Determine CVAP LEP population by poll site using census tract-level data
For example, each registered voter is currently assigned an early voting
and an election day poll site based on their residential address. It is therefore
possible to aggregate CVAP LEP data from each census tract to get the
total poll site population of CVAP LEP. This step should disregard Bengali,
Chinese, Korean, and Spanish speakers who are covered by the VRA.
2. Prioritize High CVAP LEP poll sites
Then each poll site can be ranked from greatest to least CVAP LEP.
Depending on how much money has been allocated for interpretation
services, priority should be given to the poll sites with the greatest CVAP LEP.
3. Determine the threshold for language interpretation services
at each poll site
Next, the program can choose to set a threshold for providing interpreters
at a site (for example, greater than or equal to 5 percent of CVAP LEP) or
provide interpreters for only the languages with the greatest number of
CVAP (for example, only the top three LEP languages).
IMPLEMENTATION OF RANKED CHOICE VOTING IN 2021Last year, in November 2019, voters approved a ballot initiative to implement
Ranked Choice Voting (RCV) in primary and special elections for mayor, public
advocate, comptroller, borough president, and members of the City Council.
Cities in the Midwest and California, as well as the state of Maine, have used
RCV and can serve as an important resource for how to transition from plurality
voting to ranked choice.85
For voters, RCV is relatively simple and straightforward. Voters can rank up to
five candidates in order of most preferred to least preferred, instead of selecting
only one candidate in each race. After all ballots are cast, if one candidate
receives a majority of first round votes, he or she wins. If not, then the candidate
84 New York City Civic Engagement Commission. (n.d.) Proposed methodology for poll site interpretation services.
Retrieved from https://www1.nyc.gov/assets/civicengagement/downloads/pdf/proposed-poll-site-intepretation-
methodology-for-public-comment.pdf
85 Where ranked choice voting is used. (2019, December). Ranked Choice Voting Resource Center. Retrieved from
https://www.rankedchoicevoting.org/where_used
NEW YORK CITY CAMPAIGN FINANCE BOARD | VOTER ANALYSIS REPORT 2019 – 2020 60

with the fewest first-choice votes is eliminated. Next, the votes cast for that
candidate are transferred to the next ranked candidate on those ballots. This
process repeats in rounds until two candidates remain, and the candidate with
the most votes at that point wins.
RCV eliminates the need for run-off elections because one is simulated as
candidates are successively eliminated until two remain in the final round. This
means all voters who show up on election day can participate in the decisive
election round. It also empowers voters to vote their true preferences, and not
guess whether their preferred candidate is “electable” compared to the rest of
the field.
Switching election systems involves efforts to ensure processes work within state
and federal laws and also follow best practices in election administration. It also
requires efforts to make sure voters and candidates are educated on how the
new system works and how it may be different from the previous system.
By June 1, 2020, the City Board of
Elections is required by the Charter to
“submit to the mayor and speaker of
the council a report containing a plan
for achieving timely implementation
of ranked choice voting.”86 Although
citywide primary elections are being
held on June 22, 2021, RCV will be
used starting January 1, 2021 for any
special elections that might arise due
to a vacancy in elected office.
While the Charter outlines
specific baseline requirements
for implementing RCV, the Board
of Elections is tasked with determining procedures and actually producing
materials to make implementation possible, such as designing the ballot,
procuring technology that will allow for RCV results tabulation, and establishing
a process for reporting results, among many other important implementation
choices. The State Board of Elections must also certify any changes made to
voting machines, which will take additional time.
86 New York City Charter § 1057-g(i).
Recommendation 7
Continue Using DS200 Voting Machines for RCV Elections
The CFB recommends that the City Board
of Elections continue to use existing ES&S
DS200 voting machines, with the addition
of the ExpressRunoff module, and submit
the new voting technology for certification
by the State Board of Elections as soon as
possible to ensure timely implementation of
RCV by January 1, 2021.
SECTION IV. POLICY & LEGISLATIVE RECOMMENDATIONS61

Implementing RCV can be done using our existing Election Systems & Security
(ES&S) DS200 voting machines and ES&S Electionware election management
system.87 ES&S has supported multiple RCV election implementations, and
helped Maine create RCV grid-style ballots that are required by the Charter
amendment.88 It can also produce a ballot with both RCV and plurality voting
contests, which will be required in election years that State or Federal races
are on the ballot with RCV races.89 However, the Board of Elections will need to
acquire and configure the RCV tabulation software, ExpressRunoff, to produce
results using individual voting machine cast vote records.90 Purchasing new
machines will add time to the already tight implementation process timeline and
also be very expensive — the total cost will be $40 million.91 It is also not clear
whether new machines provide any extra benefits to voters who are already
familiar with the DS200 voting machines.92
Another section of the Charter requires
the Board of Elections to post night-of
results for races where there is a clear
winner in the first round and to post
eventual certified election results that
show round by round voting outcomes.93
The Board of Elections typically posts
night-of results for all races, and it is
rare that a race is so close that it can’t
be called that night or ends in a margin
of victory that necessitates a hand recount. However, the Board of Elections and
other elected officials have correctly noted that more races will not be able to
be called on election night with RCV. City Board of Elections Executive Director
Mike Ryan has stated numerous times that it “could take them as long as two
weeks to calculate preliminary results.”94 State Board of Elections Commissioner
87 Major Voting Equipment Vendors’ Ranked Choice Voting Capabilities. (2019, May). Ranked Choice Voting Resource
Center. Retrieved from https://drive.google.com/file/d/0B3K2g6lIQMWsWmJDYWRvMjdqM28/view
88 New York City Charter § 1057-g(d).
89 Ibid.
90 Ibid.
91 Bergen, Brigid. (2020, January 15). NY contemplates new touchscreen voting machines with troubled track record.
WNYC. Jan. 15 2020. Retrieved from https://gothamist.com/news/ny-touchscreen-voting-machines-election-2020
92 Ibid.
93 New York City Charter § 1057-g(f).
94 Bergen, Brigid. (2019, November 7). The 2019 election was a snoozer that will change NYC's political future.” WNYC.
Retrieved from https://gothamist.com/news/2019-election-was-snoozer-will-change-nycs-political-future
Recommendation 8
Publish Guidelines for Election Night Results Reporting
The CFB recommends that the Board of
Elections publish guidelines for election
night results reporting and make sure that
voters and candidates know what to expect.
NEW YORK CITY CAMPAIGN FINANCE BOARD | VOTER ANALYSIS REPORT 2019 – 2020 62

Douglas Kellner noted that “other jurisdictions still have preliminary election
results on election night, except in very tight races,” while also noting that it
would be more work for election administrators to generate night-of results.95
The New York City Charter designates
the CFB with the role of conducting
a voter education campaign related
to ranked choice voting.96 The
experience of other jurisdictions has
highlighted the importance of voter
education campaigns to the successful
implementation of ranked choice voting.
Surveys conducted after the first
San Francisco citywide RCV election
indicated that voters with prior
knowledge of RCV were more likely to understand voting instructions, indicating
that the information transmitted by voter education and outreach campaigns
can carry through to voters’ experiences at the ballot box.97 Evidence out of
Minneapolis shows that understanding of RCV increases over time — in 2017,
92 percent of Minneapolis voters said that RCV was “simple to use,” compared
to 85 percent of voters when it was first rolled out. FairVote Minnesota
attributed this increased understanding in part to “more effective voter
education tools and processes.”98
It is important for voter education campaigns to reach both high and low
information voters and also residents outside of civic and good government
circles. While providing online sample ballots and training is an effective
part of voter education campaigns, these are elements that often only reach
already-engaged audiences without targeting hard to reach communities.99
For example, FairVote Minnesota’s campaign involved hiring lead organizers
specifically for Somali, Latino, and Hmong community outreach.100
95 Ibid.
96 New York City Charter § 1057-g(h).
97 Francis Neely, Corey Cook, and Lisel Blash. “An Assessment of Ranked-Choice Voting in the San Francisco 2005
Election.” Jul. 2006. 14.
98 FairVote Minnesota. “RANKED CHOICE VOTING 2017 ELECTIONS REPORT.”
https://www.fairvotemn.org/ranked-choice-voting-2017-elections-report
99 Ranked Choice Voting Resource Center. “RCV Model Implementation Plan.” Dec 2018.
https://drive.google.com/file/d/0B3K2g6lIQMWsbmw0MlpoMFU0bkU/view.
100 FairVote Minnesota. “RANKED CHOICE VOTING 2017 ELECTIONS REPORT.”
https://www.fairvotemn.org/ranked-choice-voting-2017-elections-report
Recommendation 9
Prepare a Robust Voter Education Plan to Educate New Yorkers About Ranked Choice Voting in 2021
The CFB plans to create a robust voter
education plan for RCV in 2021 as part of
the agency’s NYC Votes engagement and
Get Out The Vote plan.
SECTION IV. POLICY & LEGISLATIVE RECOMMENDATIONS63

The CFB plans on incorporating RCV voter education into our existing
naturalized citizen and youth outreach efforts and also conducting a robust
advertising campaign that covers all types of media. We will also be performing
focus groups to get messaging feedback from underrepresented communities
and conducting direct outreach to groups in Minnesota and San Francisco to
learn what voter education methods were most effective.
Most voters only think about voting immediately before or on the day that
they vote! Therefore, day of voting communications, such as oral instructions
from poll workers at an early voting site or Election Day poll site, and clear
written directions on the ballot itself are important to focus on for effective
messaging.101
Also, while the process of ranking candidates is relatively intuitive to voters, the
majority threshold for victory and the process by which votes are redistributed
in rounds can be confusing to voters.102 The CFB plans on leveraging our digital
and printed Voter Guide to educate voters about ranked choice voting and
make it a tool that voters can use to make choices about ranking candidates.
This will involve a full usability study and redesign to incorporate feedback from
voters and community groups. At the same time, we will be producing our own
educational video content for our website and social media to explain more
confusing aspects of RCV.
101 Ranked Choice Voting Resource Center. “RCV Model Implementation Plan.” Dec 2018.
https://drive.google.com/file/d/0B3K2g6lIQMWsbmw0MlpoMFU0bkU/view.
102 Ibid.
NEW YORK CITY CAMPAIGN FINANCE BOARD | VOTER ANALYSIS REPORT 2019 – 2020 64

SECTION V.
APPENDIX


Figure A.1
Participation Score by Borough — Boxplot
Bronx Brooklyn Manhattan Queens Staten Island
Borough
Pa
rtic
ipa
tio
n S
core
100
0
20
40
60
80
SECTION V. APPENDIX67

Figure A.2
Original List of Independent Variables
NEW YORK CITY CAMPAIGN FINANCE BOARD | VOTER ANALYSIS REPORT 2019 – 2020 68
♦ Female
♦ Race: White
♦ Race: Black or African
American
♦ Race: Asian
♦ Race: Two or more races
♦ Race: Other race
♦ Ethnicity: Latino or Hispanic
♦ Ethnicity: Asian Indian
♦ Ethnicity: Chinese
♦ Ethnicity: Filipino
♦ Ethnicity: Japanese
♦ Ethnicity: Korean
♦ Ethnicity: Vietnamese
♦ Ethnicity: Other Asian
♦ Ethnicity: Cuban
♦ Ethnicity: Mexican
♦ Ethnicity: Puerto Rican
♦ Ethnicity: Dominican
♦ Ethncity: Central American
♦ Ethnicity: South American
♦ Ethnicity: Other Latino
♦ Language: Spanish
♦ Language: Spanish LEP
♦ Language: Chinese
♦ Language: Chinese LEP
♦ Language: Russian
♦ Language: Russian LEP
♦ Language: Haitian
♦ Language: Haitian LEP
♦ Language: Korean
♦ Language: Korean LEP
♦ Ethnicity: Puerto Rican
♦ Ethnicity: Dominican
♦ Ethnicity: Central American
♦ Ethnicity: South American
♦ Ethnicity: Other Latino
♦ Language: Spanish
♦ Language: Spanish LEP
♦ Language: Chinese
♦ Language: Chinese LEP
♦ Language: Russian
♦ Language: Russian LEP
♦ Language: Haitian
♦ Language: Haitian LEP
♦ Language: Korean
♦ Language: Korean LEP
♦ Age 18–24
♦ Age 25–29
♦ Age 30–39
♦ Age 40–49
♦ Age 50–59
♦ Age 60–69
♦ Age 70–79
♦ Age 80–84
♦ Age 85 and over
♦ Highest Education: Less
than 9th grade
♦ Highest Education: High
school, no diploma
♦ Highest Education: High
school graduate or
equivalency
♦ Highest Education: Some
college, no degree
♦ Highest Education:
Associate’s degree
♦ Highest Education:
Bachelor’s degree
♦ Highest Education:
Graduate degree
♦ Annual household income:
Less than $10,000
♦ Annual household income:
$10,000–$14,999
♦ Annual household income:
$15,000–$24,999
♦ Annual household income:
$25,000–$34,999
♦ Annual household income:
$35,000–$49,999
♦ Annual household income:
$50,000–$74,999
♦ Annual household income:
$75,000–$99,999
♦ Annual household income:
$100,000–$149,999
♦ Annual household income:
$150,000–$199,999
♦ Annual household income:
$200,000 and over
♦ Unemployment rate
♦ Population living below
poverty level
♦ Population using
SNAP benefits
♦ Veterans
♦ Disability (age 18 and over)
♦ Moved in the last year
♦ Rent their current residence
♦ Work commute is 60
minutes or more
♦ Commute to work on
public transit
♦ Household internet access
♦ Household internet access
via smartphone only
♦ Party affiliation
♦ Citizens of voting age
♦ Citizens of voting age who
do not speak english
♦ Car commute
♦ Government worker
♦ No health insurance
♦ Public health insurance

Figure A.3
Principal Components Analysis Scree Plot
A scree plot is a line plot of the eigenvalues of principal components in an
analysis. The scree plot is used to determine the number of factors to retain in
the analysis.
20
15
10
1 2 3 4 5 6 7 8 9 10
5
0
Pe
rce
nta
ge
of
exp
lain
ed
va
ria
nce
s
Dimensions
SECTION V. APPENDIX69

Figure A.4
PCA Variable Contribution Plot
♦ If variables are grouped together, they are positively correlated
♦ If variables are negatively correlated, they will be in opposite quadrants from
one another.
♦ The color of each variable displays the amount of contribution a variable
contributes to its dimensions.
P_black_only
0
10
-10
-20
10 20
12
8
4
-20 10 0
P_commute_pubtransit
with_pub_health_insur
P_Dis_18_64
P_commut_60mP_honeInternetonly
gov_worker
P_VeteransP_HA
P_30-49)P_Moved
P_RUP_18_29P_KO P_BlkParty.18
P_CH
Per_CVAP_Nat
no_health_insur
P_SPLEPP_CVAP_LEP
P_Asian_onlyP_RULEP
P_KOLEP
P_CHLEP
Dim1 (23.6%)
ContributionDim
2 (
17.4
%)
P_Latino_any
P_SPP_Rent
P_50_plus
P_InternetAccess
P_HSormore
P_HHI_75Kplus
P_White_only
P_HALEP
NEW YORK CITY CAMPAIGN FINANCE BOARD | VOTER ANALYSIS REPORT 2019 – 2020 70

Figure A.5
Cross Validation Curve
♦
LASSO MODELChoosing lambda.
Lambda is a tuning parameter which controls the strength of the L1 penalty.
As lambda increases, bias increases and variance decreases. We chose lambda
based on a 10-fold cross validation. This separates the data into 10 training and
validation subsets, records the error, and then gives us a cross-validation error
curve, which we use to choose the turning parameter, lambda, that minimizes
this curve. See the cross-validation error curve for our data below.
Our minimum lambda (the lowest cross validation mean-squared error; in the
figure below it is the dashed line on the left hand side) equals 0.006. This did
not shrink the coefficients enough to eliminate some of them.
Our lambda within 1 standard error from the minimum lambda (right dashed line
in the figure below) equals 0.15.
16 16 16 16 16 16 16 14 13 13 12 10 9 6 6 6 6 4 1 1 1
Log (λ)
1520
3025
3540
-5 -4 -3 -2 -1 0 1
Me
an
-Sq
ua
red
Err
or
SECTION V. APPENDIX71

Figure A.6
Output of OLS Regression With LASSO-Selected Variables
## Residual standard error: 3.563 on 2096 degrees of freedom
## Multiple R-squared: 0.6738, Adjusted R-squared: 0.6718
## F-statistic: 333.1 on 13 and 2096 DF, p-value: < 0.00000000000000022
NEW YORK CITY CAMPAIGN FINANCE BOARD | VOTER ANALYSIS REPORT 2019 – 2020 72
Variable ß Coefficients B Coefficients P-value
% Blank Party Affiliation -0.50 -0.55 <0.001
% Age 50 and over 0.35 0.23 <0.001
% High School Diploma/GED or higher 0.32 0.17 <0.001
% Asian 0.27 0.10 <0.001
% White 0.26 0.06 <0.001
% Naturalized Citizens -0.18 -0.07 <0.001
% Age 30 to 49 0.17 0.16 <0.001
% with a commute of 1 hour or more -0.09 -0.05 <0.001
% with a disability (age 18+) -0.07 -0.09 <0.001
% Latino (any race) -0.07 -0.02 0.05
% Household income of $75,000 or more 0.05 0.02 0.05
% government workers -0.04 -0.04 0.01
% Black or African American -0.06 -0.01 Not significant

NYC Votes is the nonpartisan voter engagement initiative of the New York City Campaign Finance Board (CFB), an independent agency that administers the city’s small-dollar matching funds program for city elections.
NYC Votes gives New Yorkers a voice in shaping their city by connecting them to their elections. Together with our partners and volunteers, we engage underrepresented communities through outreach initiatives and provide New Yorkers with the information they need to participate in our democracy.