Embed Size (px)
Citation preview

ABOVE TOP: Photo of Citigold’s Central mine site and the entrance to the underground ramp portal. ABOVE: Shows the gold areas to be mined in PINK and, the BROWN areas were previously mined.GREY lines are 1 kilometer grid spacing, large gold deposit is in PINK and mining gold starts at shallow 300 metres deep.Long section looking south, showing the drill pierce points through the Central Area Indicated Mineral Resource structures. Above diagram, see Technical Report page 107, ASX announcement dated 21 May 2012 Mineral Resources & Reserves Report.The above diagram is based on estimates of mineral resources. The material assumptions and technical parameters underpinning the estimates continue to apply and have not materially changed.
Entra
nce T
o The U
ndergro
und Mine
CHARTERS TOWERS GOLD PROJECT - CENTRAL MINE
2019ANNUALREPORT

Citigold Corporation LimitedPage ii
BUSINESS OVERVIEW
CORPORATE DIRECTORY
REGISTERED OFFICE & PRINCIPAL PLACE OF BUSINESS
86 Brookes Street,[PO Box 1133]
Fortitude Valley, QLD, 4006, AustraliaTelephone: +61 7 3839 4041
Email: [email protected]: www.citigold.com
CHARTERS TOWERS MINE SITE10 Nagle Street,
[PO Box 10]Charters Towers, QLD, 4820, Australia
DIRECTORSMr Mark Lynch (Executive Chairman)
Mr John Foley (Non-Executive Director)Mr Arun Panchariya (Non-Executive Director)Dr Sibasis Acharya (Non-Executive Director)
COMPANY SECRETARY Mr Niall Nand
STOCK EXCHANGE LISTINGAustralia (ASX) Code ‘CTO’
SHARE REGISTRYLink Market Services Limited
ABN 54 083 214 537Level 21 / 10 Eagle Street
Brisbane QLD 4000Telephone: 1300 554 474
AUDITORKS Black & Co
ABN 48 117 620 556Level 1 / 251 Elizabeth Street
Sydney NSW 2000
BANKWestpac Banking Corporation Limited
ABN 33 007 457 141260 Queen Street
Brisbane QLD 4000
Citigold Corporation Limited (Citigold) is an Australian gold mining and exploration company, operating on the high grade Charters Towers goldfield in north east Australia, 1,000 kilometres north of Brisbane, Queensland, and 130 kilometres south west from the major coastal port of Townsville.
The Company’s prime focus is the Charters Towers Gold Project. The Project comprises of the 11 million ounce gold deposit, with an Inferred Mineral Resource of 25 million tonnes at 14 grams per tonne gold and 620,000 ounces of gold in the Probable Ore Reserve (2.5 Mt @ 7.7 g/t Au at a 4 g/t cut-off). See ASX announcement dated 21 May 2012 Mineral Resources and Reserves Report. See full Technical Report at www.citigold.com click Mining, then Technical Reports then Mineral Resources and Reserves 2012.
The Charters Towers Project is one of Australia’s largest high grade pure gold deposits.
The Company does not require additional mine acquisitions to sustain long term gold production. Citigold has already invested over $200 million in acquiring the gold deposit, developing the infrastructure and mines at Charters Towers. Test mining operations have produced over 100,000 ounces of gold.
Our aim is to be a 300,000 plus ounces per annum ultra-low-cost gold producer in five years using state of the art technologies and efficiencies, all with the aim of returning substantial profits to shareholders in harmonywith the local environment.
The Company is seeking to raise the required capital funding to complete the underground capital works.
The business plan and capital expenditure program shows gold production to commence within 12 months of the injection of the required capital.
The Charters Towers gold deposit is large and forecasts show that it has the potential to generate substantial positive cash flows for decades. This will help generate large returns for all shareholders over time.

Citigold Corporation LimitedPage iii
CONTENTS
BUSINESS OVERVIEW . ................................................................................................................................................IICORPORATE DIRECTORY . ........................................................................................................................................IICHAIRMAN’S LETTER . ................................................................................................................................................IVREVIEW OF OPERATIONS . ...................................................................................................................................... VJORC CHECKLIST . ........................................................................................................................................................... XDIRECTORS’ REPORT . ...................................................................................................................................................1AUDITORS INDEPENDENCE DECLARATION . ............................................................................................7CONSOLIDATED STATEMENT OF PROFIT OR LOSSAND OTHER COMPREHENSIVE INCOME . ...................................................................................................8CONSOLIDATED STATEMENT OF FINANCIAL POSITION . .................................................................9CONSOLIDATED STATEMENT OF CHANGES IN EQUITY . .............................................................. 10CONSOLIDATED STATEMENT OF CASH FLOWS . ...................................................................................11NOTES TO THE FINANCIAL STATEMENTS . .................................................................................................12DIRECTORS’ DECLARATION . ................................................................................................................................30AUDITORS REPORT . ...................................................................................................................................................31ASX ADDITIONAL INFORMATION . ...................................................................................................................36

Citigold Corporation LimitedPage iv
CHAIRMAN’S LETTER
Mark Lynch Executive Chairman
Dear Shareholders,
The 2019 financial year has seen continued focus on advancing discussions with major strategic funding partners in developing the production ready Charters Towers Gold Project.
The past year has seen the Company further refine its development strategy, and innovation plans, that aim to optimise the asset at Charters Towers and become an ultra-low-cost gold producer. Through the engagement of skilled project managers and an outsourced operations model the move to commercial gold production should be cost-efficient. Additionally, these savings will include reducing the currently modest environmental surface footprint of the mine over time.
The period has seen an improvement in the gold price indicating an increased appetite for gold by investors and furthermore has seen an increased interest in our production ready gold project by investors.
The Project comprises 100% control of the 11 million ounce gold deposit, with an Inferred Mineral Resource of 25 million tonnes at 14 grams per tonne gold and 620,000 ounces of gold in the Probable Ore Reserve (2.5 Mt @ 7.7 g/t Au at a 4 g/t cut-off) (See ASX announcement dated 21 May 2012 Mineral Resources and Reserves Report). The Company is positive about realising the true substancial value of the Charters Towers Gold Project.
The Company does not require additional mine acquisition to sustain long term production. Citigold has already invested over $200 million in acquiring the gold deposit, permitting, developing underground access tunnels and infrastructure including workshops, offices, road, water, electricity at Charters Towers. Test mining operations have produced over 100,000 ounces of gold.
Our aim is to be a 300,000 plus ounces per annum ultra-low-cost gold producer in five years using state of the art technologies and efficiencies, all with the aim of returning substantial profits to shareholders in harmony with the local environment.
During the year, I inspected our Charters Towers mine sites and they are in excellent order and ready for work. We all look forward to actively progressing our strategic business plan and moving through development towards gold production.
Personally, I would like to thank our shareholders for the continued strong support of the Company. Also, thank you to our dedicated management, personnel and contractors, whose commitment and dedication is appreciated.
The Charters Towers project can provide a long and profitable mine life for the Company, shareholders and the local community.
Sincerely,

Citigold Corporation LimitedPage v
REVIEW OF OPERATIONS
FINANCIAL HIGHLIGHTS
CORPORATE
During the 2019 Financial Year, the Charters Towers Gold Project remained the Company’s prime focus. The Project comprises 100% control of the 11 million ounce gold deposit, with an Inferred Mineral Resource of 25 million tonnes at 14 grams per tonne gold and 620,000 ounces of gold in the Probable Ore Reserve (2.5 Mt @ 7.7 g/t Au at a 4 g/t cut-off). The material assumptions and technical parameters underpinning the estimates continue to apply and have not materially changed. See ASX announcement dated 21 May 2012 Mineral Resources and Reserves Report. See full Technical Report at www.citigold.com click Mining, then Technical Reports then Mineral Resources and Reserves 2012.
Citigold continues to advance discussions with major strategic funding partners in developing the production ready Charters Towers Gold Project. The period has seen an improvement in the gold price indicating an increased appetite for gold by investors.
The Company continues to review its business plans, schedules and strategies in readiness for moving back into gold mining and production.
Our aim is to be a 300,000 plus ounces per annum ultra-low-cost gold producer in five years using state of the art technologies and efficiencies, all with the aim of returning substantial profits to shareholders in harmony with the local environment.
The Charters Towers Gold Project still remains one of Australia’s largest high grade pure gold deposits.
As at 30th June 2019, the loss after tax for the Company was $2.47 million for the year (2018: profit of $13.3 million). The net assets of the Company was $100 million (2018: $101 million).
Post 30th June 2019, the Company raised $1.21 million in capital raising, confirming the continued support of investors and shareholders.
The major project funding discussions continue with potential interested strategic partners to expand Citigold’s production ready Charters Towers gold project. With the recent strength in the US$ gold price, near US$1,500 (AU$2,200) per ounce, interest in our production ready gold project has increased.
The ore in the test tubes is part of a larger very high grade selected hand sample, from previous actual underground trial mining by Citigold, of 1030 g/t (33 ounces per tonne). While this is the exception and not the norm, it does show just how high grades can be, and still the gold is not readily visable to the unassisted eye. (Was not used in any of the reserve or resource assessments)
CORPORATE GOVERNANCEPlease refer to the Company’s website https://www.citigold.com/corporategovernance for the 2019 Corporate Governance.
Citigold Mineral Resources and Ore Reserves for the overall Charters Towers Gold Project are reported in accordance with the Australasian JORC Reporting Code 2012. As at 30 June 2019 the Mineral Resources and Ore Reserves are tabled below.
A JORC checklist of assessment and reporting criteria has also been included. No gold production or infill drilling was undertaken in the year and the resources and reserves remain unchanged since the start of the financial year. The material assumptions and technical parameters underpinning the estimates continue to apply and have not materially changed.
MINERALS RESOURCE AND ORE RESERVES
Gold ‘dore’ bars from Citigold’s previous mining operaions at Charters Towers.

Citigold Corporation LimitedPage vi
See ASX announcement dated 21 May 2012 Mineral Resources and Reserves Report. See full Technical Report at www.citigold.com click Mining, then Technical Reports then Mineral Resources and Reserves 2012.
In accordance with JORC requirements the Technical Report states the confidence level is ±10 to 15% for the contained ounces in the Probable Ore Reserve. The confidence level is ±30% for the contained ounces in the Inferred Mineral Resource, because two mining factors have been included (a minimum mining width of one metre, and a substantial discount of the tonnes (70%) based on known mine payability on the reefs).
The gold mineralisation in the main east-west striking reefs generally start about 100 metres below surface. It is planned that the Mineral Resources are effectively converted to Mineral Reserve during the actual process of mining.
Therefore, Citigold’s Financial Model for the go forward gold production has applied a conservative 20% discount to the in-situ Mineral Resource tonnes for the estimation of tonnes available to be mined in each of the reefs.
A JORC checklist of assessment and reporting criteria as required under the 2012 JORC code has also been included commencing on page x JORC CHECKLIST.
CATEGORY TONNES GRADEG/T
CUT-OFF CONTAINEDOUNCES
Inferred Mineral Resources* 25,000,000Gold 14 3.0g/t 11,000,000
Silver 9 - 7,000,000
Indicated Mineral Resources (includes Probable Ore Reserves) 3,200,000
Gold 7.6 4.0 g/t 780,000
Silver 5.1 - 520,000
Probable Ore Reserves (derived from and contained within Indicated Mineral Resource)
2,500,000Gold 7.7 4.0 g/t 620,000
Silver 5.1 - 410,000
*The 25 million tonne Inferred Mineral Resource is after discounting the original modelled planar structures, of 83 million tonnes, down to the 30% known payability from past mining (83M x 0.3 = 25 Million tonnes).
MINING OPERATIONS
PLANNED RESUMPTION OF MINING
Corporate plans for the resumption of mining remain unchanged with the main ‘Central’ mining underground to be the first area planned to be reopened.
Designs and strategies for the Central Mine continued to be refined during the year, including the decline development extension and the most efficient sizing and excavation method.
Resumption of mining at Charters Towers is contingent on a sufficient level of capital financing, with active planning and scheduling continuing during the year in readiness.
The Charters Towers Gold Project is the Company’s sole and therefore prime focus.
The ‘Central’ underground mine is to be the focus of future mining operations and is the area planned to be reopened. It is scheduled to grow progressively contributing to our aim of being a 300,000 ounces annual producer of gold in five years. The works begin once funding is in place.

Citigold Corporation LimitedPage vii
An outline of the mining plan for the Central mining area has been given in previous reports. The early development plan is, in summary:
• The Central Decline (access tunnel) extension is to be extended by about 1,100 metres roadway length down to a vertical depth of 360 metres. Initial mining is expected to be at a relatively shallow circa 300 metres depth.
• The first gold reefs (lodes) scheduled to be opened are the C03W, C38 and C39 and then move on to C05E. Access tunnels (ramps and crosscuts) to the C03W, C38 and C39 will come off the Central access tunnel extension, and gold reef access tunnels (drives) will be driven at nominal 20 meter vertical levels along the length of the reefs to provide closely- spaced grade control samples.
• Gold ore extraction (stoping) will commence once these levels are developed and a second ventilation and emergency exit (egress) are established.
With this solid data foundation to build on, the remaining project funding will be mainly used for the underground development of the ‘Central’ mining area. The plan is to have up to 15 working areas underground (‘stopes’) that are available for ore extraction, ensuring sufficient tonnage to meet schedule.
EXPLORATION
The period saw a particular focus on the upside potential for exploration areas held by the Company that surround our production leases that have along strike potential for extensions of existing mineral resources.
Furthermore, an assessment of the frequency of the payable sections of past mining and reassessment of geological information collected by the Company have lead to the geological conclusion that the payable sections of the reefs may be more frequent and/or closer spaced than previously thought. This new assessment means that there will be an ongoing reassessment of much of the surface and underground data collected with this new assessment in mind.
No new exploration drilling was undertaken during the year, with work continuing to be focused on consolidating geological data, technical evaluation, project assessment, feasibility and design in preparation for the upcoming period of expanded infield Charters Towers area exploration work and mine planning. No new results are reported.
During the period, there was an application for an additional small exploration area, EPM27287, that is within the overall project area. The Company has been optimising its mineral land holdings at Charters Towers with the aim of focusing on the core gold mining operations of the Charters Towers goldfield surrounding the resources and reserves already defined. Regulatory reporting continued during the period.
The Charters Towers project can provide a long and profitable mine life for the Company, shareholders and the local community.
Aereal overview of Citigold’s Central mine site showing the tunnel (decline) entrance to the Charters Towers underground during previous mining opeartions by Citigold. On page iv the wide screen panorama historic image shows the same Towers Hill in the background as here. When Operations resume the surface footprint at Central mine site is not expected to materially change.
Citigold Corporation LimitedPage viii
RESEARCH AND DEVELOPMENT
SAFETY, HEALTH, COMMUNITY AND ENVIRONMENT
Overall, Citigold’s innovation program in mining and exploration is driven by finding what is useful and works at Charters Towers, rather than what is applicable to the general industry.
The Company is currently considering further developing previously trialled technologies for wider application with the Company’s forward exploration program at Charters Towers.
Citigold’s innovation efforts and achievements will assist faster definition of the rich gold areas and the foundation for our automation and development plans are still continuing.
Renewable energy is planned, over time, to become the primary energy source. Modern renewable energy and storage systems provide benefits not available a decade ago.
Interest is being explored with external parties about the potential supply of renewable energy to the mining operations. There is the potential for a captive energy for the mining operations only and or the ability to export larger quantities above the mines own needs.
The Company plans to become a net-zero emissions underground mine over time. The underground is planned to optimise the use of electricity underground, eventually eliminating diesel engine power and its associated pollution.
This will make for a safer and cleaner air working environment. Furthermore, this then results in reduced energy use for powering the ventilation fans that are used to counter the effect of diesel engines that pollute the same air humans need to breathe. Diesel consumes oxygen and generates substantial excessive heat and airborne particulates.
There were no Lost Time Injuries, significant environmental, health or safety issues during the year.
The Company’s Lost Time and Disabling Injury Frequency Rate (LTIFR and DIRF) remains at zero. Citigold is committed to creating and maintaining both a safe environment at the workplace and in the local community.
There were no reportable environmental incidents during the year. The Company’s project strives for good environmental operations and continues its pleasing record. These favourable achievements, on the ground, are assisted by the relatively benign chemical properties of the local rocks and the operational care taken at the sites.
Citigold plans to continue to be a major contributor to the Community. Citigold has been involved in local groups in the Charters Towers community contributing over a very long period of time to local facilities, organisations and committees.
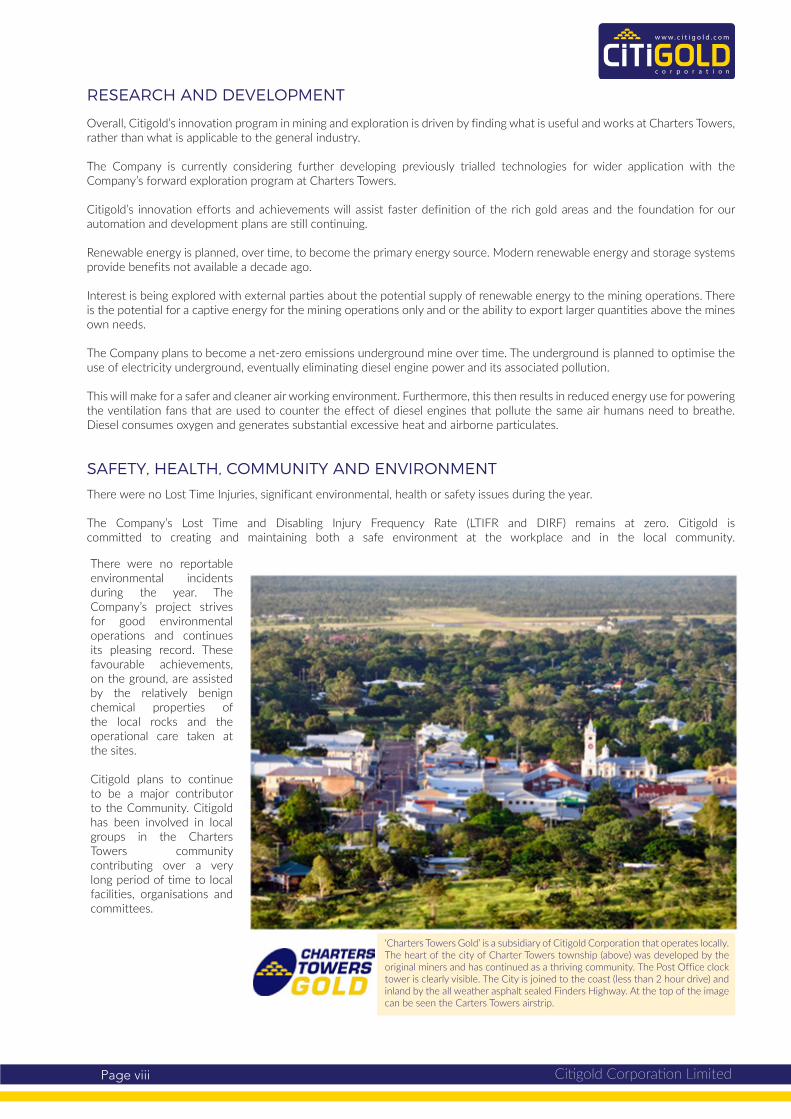
ʻCharters Towers Goldʼ is a subsidiary of Citigold Corporation that operates locally.The heart of the city of Charter Towers township (above) was developed by the original miners and has continued as a thriving community. The Post Office clock tower is clearly visible. The City is joined to the coast (less than 2 hour drive) and inland by the all weather asphalt sealed Finders Highway. At the top of the image can be seen the Carters Towers airstrip.

Citigold Corporation LimitedPage ix
The Charters Towers Goldfield is Australia’s all time largest high grade gold producer with 6,600,000 ounces of gold from 1872 to 1920, at a supreme average mining ore grade of 38 g/t (~1¼ ozs/tonne). Gold production was over 200,000 ozs/year for 20 consecutive years, from this orogenic style gold mineralisation characteristically having great lateral and vertical extent. The extent is proven by drilling to 2,000 metres deep and is expected to continue. The top centre picture is of the then Queen Cross Mine directors holding 16 of 480 oz gold bars for total 7,680 ozs from the May 1903 production, that if today would be valued at circa $17 million. Citigold’s plan is for initial ore mining to be relatively shallow commencing only 300 metres depth from surface.
INDIGENOUS ENGAGEMENT
As part of the Company’s continued community engagement program, the Company sponsored a local indigenous basketball team to assist them to compete in the 2019 NAIDOC Week Basketball competition held in Charters Towers.
Citigold has a long history of contributing to the recognition of indigenous achievements, after all it was the young indigenous Australian ‘Jupiter’ who in 1871 is credited with discovering gold that led to the building of Charters Towers.
Citigold’s recognition of Jupiter included commissioning two paintings in 1997 and 1999 depicting Jupiter as an elderly statesman of Charters Towers, and the second is an artists impression of the discovery of gold in Mosman Creek by Jupiter and the prospecting team.
The first painting hangs in Charters Towers at ‘The World Theatre’ foyer, once being the original banking chamber for the Bank of NSW, and the second ‘discovery’ painting until recent times hung in the reception of the Jupiter’s Casino in Townsville.

Citigold Corporation LimitedPage x
JORC CHECKLISTNo new drilling was done during the period or reported here. Below are the notes to accompany the discussion of exploration.
SECTION 1 SAMPLING TECHNIQUES AND DATA(Criteria in this section apply to all succeeding sections)
CRITERIA JORC CODE EXPLANATION COMMENTARYSampling techniques
Nature and quality of sampling (e.g. cut channels, random chips, or specific specialised industry standard measurement tools appropriate to the minerals under investigation, such as down hole gamma sondes, or handheld XRF instruments, etc.). These examples should not be taken as limiting the broad meaning of sampling.Include reference to measures taken to ensure sample representivity and the appropriate calibration of any measurement tools or systems used.Aspects of the determination of mineralisation that are Material to the Public Report.In cases where ‘industry standard’ work has been done this would be relatively simple (e.g. ‘reverse circulation drilling was used to obtain 1 m samples from which 3 kg was pulverised to produce a 30 g charge for fire assay’). In other cases more explanation may be required, such as where there is coarse gold that has inherent sampling problems. Unusual commodities or mineralisation types (e.g. submarine nodules) may warrant disclosure of detailed information.
• The Charters Towers area has been sampled by a mixture of diamond (HQ and NQ2) and Reverse Circulation percussion (‘RC’) drill holes for the purpose of identifying the location of mineralised structures and for identifying potential for mineralisation on these structures and for down-hole (‘DH’) geophysics.
• HQ / NQ core is typically cut in half (50%) using a diamond saw (100% of core recovered) and half or in some instances ¼ (25%) of the core is submitted for analysis. Only HQ-size drill core is used for quarter core samples.
• RC drilling was sampled on 1m intervals or through sections where mineralisation was known to occur. RC results are not reported.
• Due to the “narrow vein” style of mineralisation found at Charters Towers, the maximum HQ / NQ sample interval is 1m & minimum sample interval 0.1m.
• Zones of mineralisation are defined by sericite, chlorite and epidote alteration of granite surrounding narrow, but high grade quartz veins containing sulphides, other gangue minerals and gold. Samples are taken from the mineralised zone and on either side of the mineralisation into unaltered granite.
• Sampling methods follow guidelines and methodologies established by Citigold throughout its mining and exploration history. These methods are described in detail in the 2012 Mineral Resources and Reserves Report which can be found on the company’s website ( http://www.citigold.com/mining/technical-reports )
Drilling techniques Drill type (e.g. core, reverse circulation, open-hole hammer, rotary air blast, auger, Bangka, sonic, etc.) and details (e.g. core diameter, triple or standard tube, depth of diamond tails, face-sampling bit or other type, whether core is oriented and if so, by what method, etc.).
• Most diamond drilling has been 63.5mm diameter HQ core, although some NQ2 core (50.5mm diameter) has been drilled. RC pre-collars have been used for some drill holes where drilling was aimed at defining the location for the fracture. NQ2 drill core was typically used for the diamond tails on RC pre-collars.
• Downhole surveys have been taken at a minimum of every 50m down hole.• 60mm PN12 PVC piping has been inserted into many holes to accommodate the DH
geophysics tools and to maintain the internal integrity of the holes in case of further surveying requirements.
• In 2013-15, all drilling was completed under contract to Citigold. • Core orientation is carried out on all drill holes CT9000 and above in order to constrain the
geometry of load bearing fractures. Core orientation measurements are taken at 6m intervals by contracted drillers.
Drill sample recovery
Method of recording and assessing core and chip sample recoveries and results assessed.Measures taken to maximise sample recovery and ensure representative nature of the samples.Whether a relationship exists between sample recovery and grade and whether sample bias may have occurred due to preferential loss/gain of fine/coarse material.
• Core is recovered by wireline drilling, where core is collected inside a core barrel winched back to surface inside the drill rods. The core is marked up and measured by senior field assistants and geologists under the guidance of the senior geologist. Core recovered (CR) is compared with the meters drilled (MD, recorded by the drillers in their daily log-sheets) and a ‘core recovery’ percentage is calculated; CR/MD x 100 = % recovered. All data is recorded within the Citigold database where it is checked by senior geologists.
• Drilling is mostly within competent granites where core loss is minimal. However, in areas where high degrees of alteration and associated mineralisation occur, some core loss is expected and subsequently recorded. Accordingly, it is possible that some fine gold within clay could have been lost during drilling.
Logging Whether core and chip samples have been geologically and geotechnically logged to a level of detail to support appropriate Mineral Resource estimation, mining studies and metallurgical studies.Whether logging is qualitative or quantitative in nature. Core (or costean, channel, etc.) photo-graphy.The total length and percentage of the relevant intersections logged.
• 100% of core was logged. Samples were collected from intercepts where alteration or alteration and mineralisation were clearly seen. The nature of the ore-body is such that mineralisation or potentially mineralised structures are easily identified. Selected RC samples were geologically logged and sampled.
• The logging describes the dominant and minor rock types, colour, mineralisation, oxidation, degree of alteration, alteration type, vein type, core recovery, basic structure.
• Rock Quality Designation or RQD % has been noted in the core drill logs (also number of fractures per interval has been noted).
Sub-sampling techniques and sample preparation
If core, whether cut or sawn and whether quarter, half or all core taken.If non-core, whether riffled, tube sampled, rotary split, etc. and whether sampled wet or dry.For all sample types, the nature, quality and appropriateness of the sample preparation technique.Quality control procedures adopted for all sub-sampling stages to maximise representivity of samples.Measures taken to ensure that the sampling is representative of the in situ material collected, including for instance results for field duplicate/second-half sampling.Whether sample sizes are appropriate to the grain size of the material being sampled.
• Core is sawn in half and one half (50%) is submitted for analysis at NATA accredited laboratories in Townsville (Qld, Australia).
• Selected core is cut for ¼ core (25%) and submitted for analysis at NATA accredited labs in Townsville (Qld, Australia).
• The 25%-50% sampling of the HQ core is considered appropriate for the mineralisation type. NQ core is sampled for 50% only.
• Samples are couriered to NATA accredited laboratories where they are dried at 105°C; weighed; crushed to –6mm; and pulverised to 90% passing 75um where a 200g sub-sample is taken. 5% of samples are dual sub-sampled (second split) for sizing and analytical quality control purposes.
Fire assay: 50g of sample is added to a combustion flux and fired at 1000°C; the resultant lead button is separated from the slag and muffled at 950°C to produce a gold/silver prill; the prill is digested in aqua regia and the liquid read on an AAS.ICP40Q: A 0.2g sub-sample is digested using nitric/hydrochloric/ perchloric/hydrofluoric acids; the diluted digestion product is then presented to a Perkin Elmer 7300 ICP AES for analysis.Quality Control: second splits (5% of total); 2 in 45 sample repeats; and 2 CRM standards for each rack of 50 samples are analysed in all methods

Citigold Corporation LimitedPage xi
SECTION 1 SAMPLING TECHNIQUES AND DATA (CONT)
CRITERIA JORC CODE EXPLANATION COMMENTARYQuality of assay data and laboratory tests
The nature, quality and appropriateness of the assaying and laboratory procedures used and whether the technique is considered partial or total.For geophysical tools, spectrometers, handheld XRF instruments, etc., the parameters used in determining the analysis including instrument make and model, reading times, calibrations factors applied and their derivation, etc.Nature of quality control procedures adopted (e.g. standards, blanks, duplicates, external laboratory checks) and whether acceptable levels of accuracy (i.e. lack of bias) and precision have been established.
• Citigold uses standards sourced from Gannett Holdings Pty Ltd, Perth, Australia. Certificate number 13U20C-22-04-13.
• A blank sample and/or a standard sample and/or a duplicate sample are randomly inserted in approximately every 30 samples that are submitted.
• NATA accredited laboratories in Townsville have their own rigorous ‘in lab’ QA/QC procedures and are accredited for precious metal and base metal analyses.
• A complete discussion on assay techniques, sample sizes, assay variance and sample bias can be found in the Citigold 2012 Mineral Resources and Reserves report at: http://www.citigold.com/mining/technical-reports
Verification of sampling and assaying
TThe verification of significant intersections by either independent or alternative company personnel.The use of twinned holes.Documentation of primary data, data entry procedures, data verification, data storage (physical and electronic) protocols.Discuss any adjustment to assay data.
• Selected samples are submitted to other labs, including Citigold’s on-site lab to check for consistency, accuracy and as a second means of obtaining a comparison result.
• Anomalous holes or unusually high grade samples are resubmitted for assay.• No twinned holes were completed by Citigold since 2014. Prior exploration has engaged
diamond drilling or geophysics as a means of checking anomalous RC drilling and to confirm the precise depth of the mineralised structure.
• All drill holes are logged into laptop computers and checked before entering into database. Criteria have been established so that erroneous or incorrect characters within a given field are rejected thereby reducing the potential for transfer error. All logs are reviewed by the senior geologist.
• All samples logs are recorded onto paper and assigned a unique sample number once cut. The sample and other details are entered into the Citigold database.
• All significant intercepts are checked against the remaining core, checked for corresponding base metal grades and assessed for geological consistency.
Location of data points
Accuracy and quality of surveys used to locate drill holes (collar and down-hole surveys), trenches, mine workings and other locations used in Mineral Resource estimation.Specification of the grid system used.Quality and adequacy of topographic control.
• Citigold uses a combination of grids including a local mine grid and AMG AGD66 Zone 55 which closely approximates the local mine grid.
• Drill hole collars are surveyed using a Leica Viva Real Time Kinematic (RTK) Differential GPS system with a fully integrated radio, allowing for data capture in 3 dimensions at an accuracy of +/-25mm over baselines within 5km radius of the base station.
• All coordinates are provided in AMG AGD66 unless otherwise stated.• Citigold uses a geo-registered 50cm pixel satellite photograph acquired in September of
2013 as a secondary check on the spatial location of all surface points.• Down-hole surveys are obtained using either a Ranger or Camteq downhole survey
instrument. Survey tools are checked in Citigold’s base station (a precise DH camera alignment station) prior to drilling holes over 800m or approximately every 4-5 holes in other circumstances. DH geophysics are obtained from most drill holes at which time the holes are often re-surveyed with a Camteq Proshot acting as a secondary check of the original survey..
Data spacing and distribution
Data spacing for reporting of Exploration Results.Whether the data spacing and distribution is sufficient to establish the degree of geological and grade continuity appropriate for the Mineral Resource and Ore Reserve estimation procedure(s) and classifications applied.Whether sample compositing has been applied.
• Drill hole spacing and orientation is currently constrained by the requirements for DH geophysical surveying. Approximately 80m between points of intercept are planned, however; the nature of the structure may require alterations to the spatial pattern of holes.
• A full description of Citigold’s Mineral Resources and Reserves can be found in the 2012 Mineral Resources and Reserves Report at:
http://www.citigold.com/mining/technical-reports Orientation of data in relation to geological structure
Whether the orientation of sampling achieves unbiased sampling of possible structures and the extent to which this is known, considering the deposit type.If the relationship between the drilling orientation and the orientation of key mineralised structures is considered to have introduced a sampling bias, this should be assessed and reported if material.
• Drill holes are planned to intercept the mineralised structures (average 45 degree dip) at high angles. The presence of landholders and other features on the landscape prevent all holes from intercepting perpendicular to the structure. Typically, holes will be drilled in a fanning pattern with intercepts at no less than 60 degrees to the mineralised structure. True widths are determined only after the exact geometry of the structure is known from multiple drill holes.
• Holes intercepting at angles of less than an estimated 60 degrees are reported as such.• Lode-parallel drill holes have been completed by Citigold, specifically designed for geophysics,
and are not reported.Sample security The measures taken to ensure sample security. • All drill core is stored within locked yard guarded by contracted security.
• Samples are delivered by Citigold staff to NATA accredited laboratories and/or by registered courier.
• Standards are retained within the office of the chief geologist and only released under strict control.
The chain of sample custody is managed and closely monitored by Citigold (management and senior staff).
Audits or reviews The results of any audits or reviews of sampling techniques and data.
• A full Mineral Resources and Ore Reserves report was completed in May 2012, written in compliance with the then-current 2004 JORC Code. The report contains a comprehensive review and assessment of all sampling techniques and methodologies, sub-sampling techniques, data acquisition and storage, and reporting of results. Statements on QA and QC can be found on page 48 of the report. The report can be found on Citigold’s website at:
http://www.citigold.com/mining/technical-reports . • Citigold’s database has been audited by several independent consultants since 1998 and
most recently by Snowden in 2011. There have been no material changes to this report since May 2012

Citigold Corporation LimitedPage xii
SECTION 2 REPORTING OF EXPLORATION RESULTS(Criteria listed in the preceding section also apply to this section)
CRITERIA JORC CODE EXPLANATION COMMENTARYMineral tenement and land tenure status
Type, reference name/number, location and ownership including agreements or material issues with third parties such as joint ventures, partnerships, overriding royalties, native title interests, historical sites, wilderness or national park and environmental settings.The security of the tenure held at the time of reporting along with any known impediments to obtaining a licence to operate in the area.
• Citigold holds a number of different types of mineral tenements including Exploration Permit Minerals (EPM’s), Mineral Development Licenses (MDL’) and Mining Leases (ML’s). Citigold currently holds five (5) EPM’s, three (3) MDL’s and thirty one (31) ML’s:-EPM15964, EPM15966, EPM18465, EPM18813, EPM27287 MDL118, MDL119, MDL252,ML1343, ML1344, ML1347, ML1348, ML1385, ML1398, ML1424, ML1430, ML1472, ML1488, ML1490, ML1491, ML1499, ML1521, ML1545, ML1549, ML1585, ML10005, ML10032, ML10042, ML10091, ML10093, ML10193, ML10196, ML10208, ML10222, ML10281, ML10282, ML10283, ML10284, ML10335Citigold holds current Environmental Authorities over the tenements, and has already produced over 100,000 ounces of gold. There are no known impediments to continuing operations in the area.
Exploration done by other parties
Deposit type, geological setting and style of mineralisation. • Charters Towers is one of Australia’s richest gold deposits that was discovered in 1871. A plethora of historical data from the Charters Towers area has been collected, collated and is included within the Citigold geological database. Previous exploration was summarised in the 2012 Mineral Resources and Reserves Report which can be found at: ( http://www.citigold.com/mining/technical-reports ).
• Citigold’s drill hole database includes historical drilling including:1993 - Mt Leyshon Gold Mines Ltd extensions to CRA diamond drill holes in the areas. 1991 - Diamond and RC drilling by PosGold in a joint venture with Charters Towers Mines NL that covered parts of the Central area areas.1981-84 - Diamond-drilling by the Homestake/BHP joint venture in the Central area.1975, 1981-82, and 1987 - Diamond and RC drilling in central by A.O.G., CRA and Orion respectively.
• Citigold retains all diamond core and a collection of core drilled by other companies is its on-site core-yard.
Geology Deposit type, geological setting and style of mineralisation. • Mineralisation at Charters Towers is referred to as “orogenic” style vein mesothermal gold deposit. See the 2012 Mineral Resources and Reserves Report which can be found at: http://www.citigold.com/mining/technical-reports
• The many reefs are hosted within a series of variably-oriented fractures in granite and granodioritic host rocks. Mineralisation does occur in adjacent metasedimentary rocks.
• The gold-bearing reefs at Charters Towers are typically 0.3 metres to 1.5 meters thick, comprising hydrothermal quartz reefs in granite, tonalite and granodiorite host rocks. There are some 80 major reefs in and around Charters Towers city.
• The majority of the ore mined in the past was concentrated within a set of fractures over 5 km long East-West, and 500 meters to 1600 meters down dip in a North-South direction. The mineralised reefs lie in two predominant directions dipping at moderate to shallow angles to the north (main production), and the cross-reefs, which dip to the ENE.
• The reefs are hydrothermal quartz-gold systems with a gangue of pyrite, galena, sphalerite, carbonate, chlorite and clays. The reefs occur within sericitic hydrothermal alteration, historically known as “Formation”.
• The goldfield was first discovered in December 1871 and produced some 6.6 million ounces of gold from 6 million tons of ore from 1872 to 1920, with up to 40 companies operating many individual mining leases on the same ore bodies. There were 206 mining leases covering 127 mines working 80 lines of reef and 95 mills, cyaniding and chlorination plants. The field produced over 200,000 ounces per year for 20 consecutive years, and its largest production year was 1899 when it produced some 320,000 ounces.
Drill hole Information
A summary of all information material to the understanding of the exploration results including a tabulation of the following information for all Material drill holes: easting and northing of the drill hole collarelevation or RL (Reduced Level – elevation above sea level in metres) of the drill hole collar dip and azimuth of the hole down hole length and interception depth hole length. If the exclusion of this information is justified on the basis that the information is not Material and this exclusion does not detract from the understanding of the report, the Competent Person should clearly explain why this is the case..
•There are over 3,300 drill holes in the project area, and it is impracticable to list them all in this report. Drilling since 2004 has been tabulated on the Company’s web site and significant results listed in the Quarterly reports.
Summary information on and statistical analysis of the drilling is contained in the Company’s 2012 Mineral Resources and Ore Reserves report at:http://www.citigold.com/mining/technical-reports
Data aggregation methods
In reporting Exploration Results, weighting averaging techniques, maximum and/or minimum grade truncations (e.g. cutting of high grades) and cut-off grades are usually Material and should be stated.Where aggregate intercepts incorporate short lengths of high grade results and longer lengths of low grade results, the procedure used for such aggregation should be stated and some typical examples of such aggregations should be shown in detail.The assumptions used for any reporting of metal equivalent values should be clearly stated.
• The intercepts reported on in any public release are described in sufficient detail, including gold maxima and subintervals, to allow the reader to make an assessment of the balance of high and low grades in the intercept.
• All sample interval lengths are presented as “Depth from” and “Depth to” and intercept length.
• Assay results for Ag, Pb and Au are presented as ppm (equivalent to grams of metal per tonne of rock, written as g/t). In addition, Au (gold) is presented as metal accumulations (grade x width), in metre-grams per tonne (m.g/t), particularly where intervals are less than one metre, to put the results into perspective as the minimum mining width is one metre.
• No aggregation of sections have been used.• Metal equivalents are not used.
Citigold Corporation LimitedPage xiii
SECTION 2 REPORTING OF EXPLORATION RESULTS (CONT)
SECTION 3 ESTIMATION AND REPORTING OF MINERAL RESOURCES(Criteria listed in Section 1, and where relevant in Section 2, also apply to this section)
CRITERIA JORC CODE EXPLANATION COMMENTARYDatabase integrity Measures taken to ensure that data has not been corrupted by, for
example, transcription or keying errors, between its initial collection and its use for Mineral Resource estimation purposes.Data validation procedures used.
Databases were manually audited and checked on three occasions by external consultants since 1998 and most recently by Snowden in 2011. The SURPAC computer program has an automatic error checking procedure that checks for duplication and column errors.
Site visits Comment on any site visits undertaken by the Competent Person and the outcome of those visits.If no site visits have been undertaken indicate why this is the case.
The Competent Person (under the JORC Code) responsible for this report, Mr Christopher Alan John Towsey MSc BSc(Hons), DipEd, FAusIMM, CPGeo, MMICA, has been associated with the Project for 16 years from 1999 as a consultant geologist and employee. He joined the Company on full-time staff as General Manager Mining in July 2002, was promoted to Chief Operating Officer (‘COO’) in January 2004 and lived on-site at Charters Towers as COO and Site Senior Executive, managing the day-to-day operations of the underground mining operations of the Imperial Mine from October 2009 to January 2011. He has remained as a consultant geologist to the Company since January 2011. On 21 February 2014 he was appointed as a Non-Executive Director of Citigold Corporation Limited, and Executive Director in April 2015. He last visited the site on 22 September 2014. He was abreast of daily operations up until April 2011, and since 21 Feb 2014, including video links to the site. There have been no material changes to resources & reserves since 2012.
Geological interpretation
Confidence in (or conversely, the uncertainty of) the geological interpretation of the mineral deposit.Nature of the data used and of any assumptions made.The effect, if any, of alternative interpretations on Mineral Resource estimation.The use of geology in guiding and controlling Mineral Resource estimation.The factors affecting continuity both of grade and geology.
The geology is well known as the field has been mined since 1871 with some 180 km of underground drives and production of 6.6 million ounces of gold from 6 million tonnes of ore. The mineralisation is contained in fractures or shear zones (reefs) which have good geological continuity and predictability up to 2km along strike and down dip, but the reefs have an almost random distribution of ore grades within the reef. The reefs are widely spaced (usually >400m apart) and therefore drill intersections, especially with oriented drill-core, are usually clearly linkable to known reefs. The grade is known not to be continuous, making estimation of a Proved Reserve grade difficult without underground driving or bulk sampling. The statistical range derived from Ordinary and Indicator Kriging suggests a range of 6m to 8m (the distance an assay can be reliably projected away from the known point) but high grade areas have been found very close to sub-economic grade areas, meaning that a strike drive or potential stoping area often maintains an economic grade when averaged over say 200m. Drilling has also been found to underestimate the grade when compared to areas that have been mined and stoped. The variability in grade is compensated for by applying a mining factor, payability, to the resources – payability is the percentage of a nominated mineralised reef that can be economically mined based on previous production records. This variability is covered in the 2012 Mineral Resources and Ore Reserves report , which can be found at: http://www.citigold.com/mining/technical-reports
CRITERIA JORC CODE EXPLANATION COMMENTARYRelationship between mineralisation widths and intercept lengths
These relationships are particularly important in the reporting of Exploration Results.If the geometry of the mineralisation with respect to the drill hole angle is known, its nature should be reported.If it is not known and only the down hole lengths are reported, there should be a clear statement to this effect (e.g. ‘down hole length, true width not known’).
• All intercepts presented in tables in Quarterly Reports are reported as down-hole lengths unless stated as True Widths.
• Structures within Charters Towers are highly variable in width and can be variable in dip over short distances, however, every attempts is made to drill approximately perpendicular to the dip of the structure. The intercepts reported as intercept widths may not necessarily represent true widths in some cases.
• All tables clearly indicate “From” and “To” intervals. Diagrams Appropriate maps and sections (with scales) and tabulations of
intercepts should be included for any significant discovery being reported These should include, but not be limited to a plan view of drill hole collar locations and appropriate sectional views.
• There are over 3,300 drill holes in the project area, and it is impracticable to list them all in this report.
Significant drill hole collar locations are shown on Figure 14-11, page 87, of the 2012 Mineral Resources and Ore Reserves Report ( http://www.citigold.com/mining/technical-reports ).
Balanced reporting Where comprehensive reporting of all Exploration Results is not practicable, representative reporting of both low and high grades and/or widths should be practiced to avoid misleading reporting of Exploration Results.
• Almost every drill hole completed on the property from 2004 to 2011 is available from the Citigold website (http://www.citigold.com/mining/exploration).Drilling was suspended during 2012 and resumed in 2013. There was no drilling between 2016 to 31 December 2017
• Drill holes not included (regardless of intercepts and grade) are those that were drilled specifically for down-hole geophysics which were typically drilled parallel to the mineralised structure. All other drill holes have been reported, regardless of whether it has returned high or low grades.
• Higher grade drill holes (above 0.5m.g/t) are reported in Quarterly Reports. Other substantive exploration data
Other exploration data, if meaningful and material, should be reported including (but not limited to): geological observations; geophysical survey results; geochemical survey results; bulk samples – size and method of treatment; metallurgical test results; bulk density, groundwater, geotechnical and rock characteristics; potential deleterious or contaminating substances.
• The Project has produced over 100,000 ounces of gold. Details such as bulk density, metallurgical characteristics, groundwater and geotechnical data are covered in the 2012 Mineral Resources and Ore Reserves Report which can be found at: http://www.citigold.com/mining/technical-reports . Bulk sampling and geophysical survey results are reported Quarterly as available
Further work The nature and scale of planned further work (e.g. tests for lateral extensions or depth extensions or large-scale step-out drilling).Diagrams clearly highlighting the areas of possible extensions, including the main geological interpretations and future drilling areas, provided this information is not commercially sensitive.
• Future work will concentrate on in-fill drilling between drill hole intercepts in the Central area to increase the data density required to convert Inferred Resources to Indicated.

Citigold Corporation LimitedPage xiv
CRITERIA JORC CODE EXPLANATION COMMENTARYDimensions The extent and variability of the Mineral Resource expressed as length
(along strike or otherwise), plan width, and depth below surface to the upper and lower limits of the Mineral Resource.
There are 25 mineralised bodies included in the Mineral Resource estimate. These are up to 2 km along strike. Mineral resources are estimated to a maximum depth of 1200 m down dip. The tops of bodies in the Resources are terminated at 50 m below surface, as it is unlikely the top 50 m under the city can be safely mined without disturbing existing buildings and infrastructure such as rail lines and highways. Drilling has intersected mineralised structures down to 2000m depth. There are 30 significant drill intersections deeper than 1,000 metres, of which 27 are deeper than 1,100 metres and 18 deeper than 1,200 metres. The deepest significant intersection is 1,817.2 metres (0.4 grams per tonne Au), and the best gold grade deeper than 1,200 metres was 20.54 grams per tonne Au.
Estimation and modelling techniques
The nature and appropriateness of the estimation technique(s) applied and key assumptions, including treatment of extreme grade values, domaining, interpolation parameters and maximum distance of extrapolation from data points. If a computer assisted estimation method was chosen include a description of computer software and parameters used.The availability of check estimates, previous estimates and/or mine production records and whether the Mineral Resource estimate takes appropriate account of such data.The assumptions made regarding recovery of by-products.Estimation of deleterious elements or other non-grade variables of economic significance (e.g. sulphur for acid mine drainage characterisation).In the case of block model interpolation, the block size in relation to the average sample spacing and the search employed.Any assumptions behind modelling of selective mining units.Any assumptions about correlation between variables.Description of how the geological interpretation was used to control the resource estimates.Discussion of basis for using or not using grade cutting or capping.The process of validation, the checking process used, the comparison of model data to drill hole data, and use of reconciliation data if available.
Drilling has been separated into two main domains, the Central and Southern areas. For Inferred Mineral Resources, there was no cutting of high grades or exclusion of high-grade outliers, as log-probability plots indicated no anomalous populations. Indicated Mineral Resources used a Top Cut of 50 g/t. A lower cut-off of 1 metre-gram per tonne was used to define the reef outlines and 3 metre-grams per tonne used to define Indicated & Measured Resources. Reefs were modelled in SURPAC to produce 3D solids. Grades for Inferred Resources were based on the geometric mean applied over polygonal areas. Indicated Resources were based on arithmetic means of drill intersection accumulations (metre-grams per tonne) for the smaller polygons modelled for Indicated status. Validation by comparing recovered ounces from stopped areas with ounces defined ahead of mining has been satisfactory.
Moisture Whether the tonnages are estimated on a dry basis or with natural moisture, and the method of determination of the moisture content.
All tonnages are estimated on dry weight as all material is below the base of oxidation. Moisture content becomes an issue only for mill feed after mining and does not affect in situ Resources.
Cut-off parameters The basis of the adopted cut-off grade(s) or quality parameters applied. See Chapter 14 of the 2012 Mineral Resources and Ore Reserves Report. A lower cut-off grade of three grams of gold per tonne of mineralized material (grams per tonne Au) over a minimum sample true width of one metre (expressed as 3 metre-gram per tonne Au). No Top Cut was applied to Inferred Mineral Resources as there is no statistical basis to do so, as explained in Chapter 14 but an arbitrary Top Cut of 50 g/t was applied to Indicated Resources.
Mining factors or assumptions
Assumptions made regarding possible mining methods, minimum mining dimensions and internal (or, if applicable, external) mining dilution. It is always necessary as part of the process of determining reasonable prospects for eventual economic extraction to consider potential mining methods, but the assumptions made regarding mining methods and parameters when estimating Mineral Resources may not always be rigorous. Where this is the case, this should be reported with an explanation of the basis of the mining assumptions made.
Two mining factors have been included (a minimum mining width of one metre, and a substantial discount of the tonnes (70%) based on known mine payability on the reefs).See Chapter 14 of the 2012 Mineral Resources and Ore Reserves Report.
Metallurgical factors or assumptions
The basis for assumptions or predictions regarding metallurgical amenability. It is always necessary as part of the process of determining reasonable prospects for eventual economic extraction to consider potential metallurgical methods, but the assumptions regarding metallurgical treatment processes and parameters made when reporting Mineral Resources may not always be rigorous. Where this is the case, this should be reported with an explanation of the basis of the metallurgical assumptions made.
Over 100,000 ounces of gold and 45,000 ounces of silver have been produced since 1998. From 2006 to 2012, the Company’s Quarterly Reports to the Australian Securities Exchange listed the gold recovery from the plant. Recoveries were in the range of 95% to 98% recovery of gold entering the plant. A recovery of 98% has been used in the mining factors for estimating Ore Reserves and estimating mining and processing costs.See Chapter 13 of the 2012 Mineral Resources and Ore Reserves Report.
Environmental factors or assumptions
Assumptions made regarding possible waste and process residue disposal options. It is always necessary as part of the process of determining reasonable prospects for eventual economic extraction to consider the potential environmental impacts of the mining and processing operation. While at this stage the determination of potential environmental impacts, particularly for a greenfields project, may not always be well advanced, the status of early consideration of these potential environmental impacts should be reported. Where these aspects have not been considered this should be reported with an explanation of the environmental assumptions made.
The Project has been mining since 1994 with an accepted EMOS, granted mining leases and Environmental Authorities (‘EA’). The Tailings Storage Facility was constructed in 1997 and is inspected annually by a qualified consultant engineer. The site normally does not release water from the site due to the high local evaporation rates, but has approval to release provided discharge waters are compliant with the conditions of the EA.
Bulk density Whether assumed or determined. If assumed, the basis for the assumptions. If determined, the method used, whether wet or dry, the frequency of the measurements, the nature, size and representativeness of the samples.The bulk density for bulk material must have been measured by methods that adequately account for void spaces (vugs, porosity, etc.), moisture and differences between rock and alteration zones within the deposit.Discuss assumptions for bulk density estimates used in the evaluation process of the different materials.
The Project normally mines primary ore from underground. Oxidised ore was only mined in two trial open pits (Stockholm and Washington in 1997-2000). No oxidised material is included in Resources or Reserves. Extensive density measurements were carried out. A bulk density of 2.7 t/m3 was used. See section 14.5.4 Tonnage Estimates in the 2012 Mineral Resources Report for tables of density data (Tables 14.10 and 14.11 in the 2012 report).
SECTION 3 ESTIMATION AND REPORTING OF MINERAL RESOURCES (CONT)

Citigold Corporation LimitedPage xv
CRITERIA JORC CODE EXPLANATION COMMENTARYClassification The basis for the classification of the Mineral Resources into varying
confidence categories.Whether appropriate account has been taken of all relevant factors (i.e. relative confidence in tonnage/grade estimations, reliability of input data, confidence in continuity of geology and metal values, quality, quantity and distribution of the data).Whether the result appropriately reflects the Competent Person’s view of the deposit.
The confidence level is ±30% for the contained ounces in the Inferred Mineral Resource, because two mining factors have been included (a minimum mining width of one metre, and a substantial discount of the tonnes (70%) based on known mine payability on the reefs).
Audits or reviews The results of any audits or reviews of Mineral Resource estimates. The last peer review of the Mineral Resources was by Snowden Associates in June 2012. Snowden concluded that the 2012 Technical Report is written in accordance with the 2004 JORC Code. In addition, Snowden considers that Citigold’s approach to estimating Mineral Resources at Charters Towers are reasonable based on the nature of the mineralisation, the methodology adopted in preparing the estimate and the history of operations in the goldfield. There have been no material changes to Resources or Reserves since the 2012 report.
Discussion of relative accuracy/ confidence
Where appropriate a statement of the relative accuracy and confidence level in the Mineral Resource estimate using an approach or procedure deemed appropriate by the Competent Person. For example, the application of statistical or geostatistical procedures to quantify the relative accuracy of the resource within stated confidence limits, or, if such an approach is not deemed appropriate, a qualitative discussion of the factors that could affect the relative accuracy and confidence of the estimate.The statement should specify whether it relates to global or local estimates, and, if local, state the relevant tonnages, which should be relevant to technical and economic evaluation. Documentation should include assumptions made and the procedures used.These statements of relative accuracy and confidence of the estimate should be compared with production data, where available.
The confidence level is ±30% for the contained ounces in the Inferred Mineral Resource, because two mining factors have been included (a minimum mining width of one metre, and a substantial discount of the tonnes (70%) based on known mine payability on the reefs).
SECTION 4 ESTIMATION AND REPORTING OF ORE RESERVES(Criteria listed in Section 1, and where relevant in Sections 2 and 3, also apply to this section)
CRITERIA JORC CODE EXPLANATION COMMENTARYMineral Resource estimate for conversion to Ore Reserves
Description of the Mineral Resource estimate used as a basis for the conversion to an Ore Reserve.Clear statement as to whether the Mineral Resources are reported additional to, or inclusive of, the Ore Reserves.
The Indicated Mineral Resource is 3,200,000 tonnes at 7.6 grams per tonne gold and 5.1 grams per tonne silver, containing 780,000 ounces of gold and 520,000 ounces of silver. The Probable Ore Reserve is derived from, and not additional to, the Indicated Mineral Resource. There are 16 separate mineralised bodies in the Indicated Mineral Resource, and of these 16, fourteen met the criteria to be classified as ore bodies in the Probable Ore Reserve.
Site visits Comment on any site visits undertaken by the Competent Person and the outcome of those visits.If no site visits have been undertaken indicate why this is the case.
The Competent Person (under the JORC Code) responsible for this report, Mr Christopher Alan John Towsey MSc BSc(Hons), DipEd, FAusIMM, CPGeo, MMICA,, has been associated with the Project for 15 years from 1999 as a consultant geologist and employee. He joined the Company on full-time staff as General Manager Mining in July 2002, was promoted to Chief Operating Officer (‘COO’) in January 2004 and lived on-site at Charters Towers as COO and Site Senior Executive, managing the day-to-day operations of the underground mining operations of the Imperial Mine from October 2009 to January 2011. He remained as a consultant geologist to the Company from January 2011. On 21 February 2014 he was appointed as a Non-Executive Director of Citigold Corporation Limited. He inspected the operations in April and September 2011, and again the 19th and 20th December 2011, inspecting the Central Decline underground down to the Brilliant Block Shaft 180m vertically below the city, and inspecting the 830 and 840 production levels in the Sons of Freedom ore body in the Imperial Mine 5 km southeast of the city. He visited the site on 19 January 2012 and again on 29-30 April 2014. In April 2014 he was appointed as Executive Director & Chief Scientist. He was abreast of daily operations up until April 2011 and since 21 Feb 2014. His last site visit was November 2014. There have been no material changes to the resources and reserves since 2012.
Study status The type and level of study undertaken to enable Mineral Resources to be converted to OreReserves.The Code requires that a study to at least Pre-Feasibility Study level has been undertaken to convert Mineral Resources to Ore Reserves. Such studies will have been carried out and will have determined a mine plan that is technically achievable and economically viable, and that material Modifying Factors have been considered.
The project has been mining since 1993 and has produced over 100,000 ounces of gold and 45,000 ounces of silver in trial mining, which constitutes a full Feasibility Study, even though there is no single document with that title. Mining Leases have been granted, a two million tonne capacity tailings storage facility constructed and a processing plant built and operated since 1994. Actual mining costs have been obtained, together with purchased mining equipment and over $200 million already invested. Material Modifying Factors have been tested under actual production conditions and validated.
SECTION 3 ESTIMATION AND REPORTING OF MINERAL RESOURCES (CONT)

Citigold Corporation LimitedPage xvi
CRITERIA JORC CODE EXPLANATION COMMENTARYCut-off parameters The basis of the cut-off grade(s) or quality parameters
applied.See Chapter 14 of the 2012 Mineral Resources and Ore Reserves report , which can be found at: http://www.citigold.com/mining/technical-reports. A lower cut-off grade of three grams of gold per tonne of mineralized material (grams per tonne Au) over a minimum sample true width of one metre (expressed as 3 metre-gram per tonne Au). No Top Cut was applied to Inferred Resources as there is no statistical basis to do so, as explained in Chapter 14.For conversion of Indicated Mineral Resources to Probable Reserves, a lower cut-off grade of4 g/t gold was used to allow for physical losses and dilution during mining. An arbitrary Top Cutof 50 grams per tonne Au was applied to high assays in Ore Reserve estimation to reduce anypotential biasing effect of the high-grades. This is a conservative approach, as there is nostatistical basis for cutting high grades, as discussed in the Inferred Mineral Resources section,and several of the Central ore bodies averaged recovered grades of over 50 grams per tonnefor tens of years when mined previously.
Mining factors or assumptions
The method and assumptions used as reported in the Pre-Feasibility or Feasibility Study to convert the Mineral Resource to an Ore Reserve (i.e. either by application of appropriate factors by optimisation or by preliminary or detailed design).The choice, nature and appropriateness of the selected mining method(s) and other mining parameters including associated design issues such as pre-strip, access, etc.The assumptions made regarding geotechnical parameters (e.g. pit slopes, stope sizes, etc.), grade control and pre-production drilling.The major assumptions made and Mineral Resource model used for pit and stope optimisation (if appropriate).The mining dilution factors used.The mining recovery factors used.Any minimum mining widths used.The manner in which Inferred Mineral Resources are utilised in mining studies and the sensitivity of the outcome to their inclusion.The infrastructure requirements of the selected mining methods.
Mining method - Underground. Long-hole open stoping, 10m sub-levelsMinimum mining width - 1 metreDilution – 10% Gold losses - 5% Payability - Variable - 30% to 52%Pillars left - 0% due to payability factorUS Gold Price - USD $1,300Exchange Rate - 0.91Aus Gold Price - AUD $1,429Driving cost - AUD $3,000 per metre, 3.5m squareDriving cost equivalent - 2.1 Ounces per metre, 3.5m squareMill recovery - 95% of mill feedAll necessary infrastructure has already been built and some 100,000 ounces of gold already produced. For details of the Mining factors and assumptions, see Chapter 15 of the 2012 Mineral Resources and Ore Reserves report, which can be found at:http://www.citigold.com/mining/technical-reports.
Metallurgical factors or assumptions
The metallurgical process proposed and the appropriateness of that process to the style of mineralisation.Whether the metallurgical process is well-tested technology or novel in nature.The nature, amount and representativeness of metallurgical test work undertaken, the nature of the metallurgical domaining applied and the corresponding metallurgical recovery factors applied.Any assumptions or allowances made for deleterious elements.The existence of any bulk sample or pilot scale test work and the degree to which such samples are considered representative of the ore body as a whole.For minerals that are defined by a specification, has the ore reserve estimation been based on the appropriate mineralogy to meet the specifications?
Metallurgical characteristics are well-understood, having operated the processing plant since 1993 and recovered over 100,000 ounces of gold and 45,000 ounces of silver. Actual mill recoveries varied from 95% to 98% of mill feed. Mill recovery used for future projections is 95% of mill feed. See Chapter 13 of the 2012 Mineral Resources and Ore Reserves report, which can be found at: http://www.citigold.com/mining/technical-reports.
Environmental The status of studies of potential environmental impacts of the mining and processing operation. Details of waste rock characterisation and the consideration of potential sites, status of design options considered and, where applicable, the status of approvals for process residue storage and waste dumps should be reported.
This risk is assessed as Low Risk. Waste rock is benign granodiorite and classed as Non-Acid Forming. The main ore sulphides are galena and sphalerite which are acid-consuming, and the weathering of feldspars in the host rock is also acid-consuming, forming a self-neutralising system. Tailings deposited are made alkaline with added lime, which prevents the dissolution of heavy metals or any acid formation.The Company has an approved Environmental Management Overview Strategy (EMOS) and Environmental Authority (‘EA’) in place and has been conducting mining and processing operation since 1993, and expects to be able to continue to do so. In addition a Plan of Operations, in compliance with the EMOS, has also been lodged with the DRNM. These operating documents are in compliance with Queensland’s stringent Environmental Protection Act and Regulation.The Tailings Storage Facility has already been built and used since 1997. Adjacent land alongside has been acquired for any future expansion. Dry stacking of tailing above ground is being evaluated. The Company is continuing discussion with the Department of Environment, Heritage and Protection in regards to the adequacy of financial assurance provided for the purpose of mine rehabilitation. The potential liability can be up to a maximum of $8.5 million.
Infrastructure The existence of appropriate infrastructure: availability of land for plant development, power, water, transportation (particularly for bulk commodities), labour, accommodation; or the ease with which the infrastructure can be provided, or accessed.
Most of the infrastructure is in place, paid for and operational, having produced over 100,000 ounces of gold. Power is drawn from the State grid. The Project is mostly self-sufficient in water but could draw on local municipal supplies if necessary. There is major town in the Project area that supplies all accommodation, services, transport, emergency services and medical backup that may be required. There is a major port, international airport and city to the east, 1.5 hours drive by sealed highway, at Townsville with a population of 189,238 (30 June 2013). The major Mt Isa to Townsville rail line runs through the project area, as does the sealed Flinders Highway (east-west) and Gregory Developmental Road (north-south).
SECTION 4 ESTIMATION AND REPORTING OF THE RESERVES (CONT)

Citigold Corporation LimitedPage xvii
CRITERIA JORC CODE EXPLANATION COMMENTARYCosts The derivation of, or assumptions made, regarding projected
capital costs in the study.The methodology used to estimate operating costs.Allowances made for the content of deleterious elements.The derivation of assumptions made of metal or commodity price(s), for the principal minerals and co- products.The source of exchange rates used in the study.Derivation of transportation charges.The basis for forecasting or source of treatment and refining charges, penalties for failure to meet specification, etc.The allowances made for royalties payable, both Government and private.
Operating, transport, treatment, refining and capital costs are based on actual costs since 2006. A gold price of US$1300, an exchange rate of 0.91 and an Australian dollar gold price of $1430 were used, based on analysis of the supply and demand by the World Gold Council, and actual prices and exchange rates over the last 5 years. The deposit has low arsenic, selenium and mercury levels, and gold doré bars produced by the Company have met the refiner’s specifications since 1994 without penalty.Royalties are currently at 5% of the gross revenue received from precious metal sales. This set by the Queensland State Government and is subject to periodic change outside the Company’s control. The Government has not announced any plans to change the gold royalty. Transport costs of the final product are minimal – the maximum projected output is 330,000 ounces per year weighing 10.3 tonnes, or 197 kg per week. Raw doré gold is air-freighted to the Perth Mint refinery in Perth, Western Australia. Actual cash cost for the September 2013 Quarter was A$569, down from A$588 the previous Quarter (June 2013)
Revenue factors The derivation of, or assumptions made regarding revenue factors including head grade, metal or commodity price(s) exchange rates, transportation and treatment charges, penalties, net smelter returns, etc.The derivation of assumptions made of metal or commodity price(s), for the principal metals, minerals and co-products.
These are covered in Chapters 14-16, 19, 21 and 22 of the 2012 Mineral Resources and Ore Reserves report, which can be found at: http://www.citigold.com/mining/technical-reports.Future metal or commodity price(s) exchange rates, transportation and treatment charges, penalties, net smelter returns are simply unknown. Assumptions have been made based on the best available actual data and trends estimated by professional bodies and investment groups. Exchange rate variations combined with the USD gold price over the last 3 years has maintained the AUD gold price around A$1500 per ounce. Silver revenue is about 1.5% of the gold revenue and is immaterial to the Project, being less than the weekly variation in gold price, but the silver revenue covers the cost of secure transport, insurance and refining of the doré bars, with a small profit.
Market assessmen The demand, supply and stock situation for the particular commodity, consumption trends and factors likely to affect supply and demand into the future.A customer and competitor analysis along with the identification of likely market windows for the product.Price and volume forecasts and the basis for these forecasts.For industrial minerals the customer specification, testing and acceptance requirements prior to a supply contract.
Refined gold and silver are directly exchangeable for cash. There are no sale contracts, hedging contracts, forward sales or royalty contracts currently in place that lock the Company into any fixed sales arrangements. The Company has an agreement to refine its doré bullion at the Perth Mint precious metals refinery in Western Australia at market refining prices. There is an opportunity, but no obligation, for the Perth Mint to sell the gold and silver on the Company’s behalf if instructed by the Company. The Company retains full flexibility to choose if, when and where it sells its gold and silver, and whether or not to enter into hedging or royalty agreements. See Chapters 19,21 and 22 of the 2012 Mineral Resources and Ore Reserves report , which can be found at: http://www.citigold.com/mining/technical-reports. Hedging is seen a prudent strategy by locking in a future sale price, removing the risk of an unknown sale price or exchange rate, provided that certain conditions are adhered to. Citigold believes it is not prudent to hedge more than 50% of projected annual production or more than 50% of the ore reserve, and because delivery is dependent on production, the buyer cannot bring forward the delivery date.
Economic The inputs to the economic analysis to produce the net present value (NPV) in the study, the source and confidence of these economic inputs including estimated inflation, discount rate, etc.NPV ranges and sensitivity to variations in the significant assumptions and inputs.
The NPV in the 2012 report based upon Citigold’s financial model, was estimated at A$742 million based on a Discounted Cash Flow Rate of 20%. See Chapter 22 of the 2012 Mineral Resources and Ore Reserves report, which can be found at: http://www.citigold.com/mining/technical-reports.The Project NPV is sensitive to exchange rates and gold price (and therefore head grade & tonnes processed). However, recent analysis shows that as the USD gold price varies, the AUD exchange rate moves in the reverse, maintaining a reasonably steady AUD gold price around A$1500 per ounce. Most of the Project’s costs are in AUD, and therefore the project is robust to these changes. A 10% change in the exchange rate changes the NPV by 19%, and a 10% change in the gold price changes the NPV by 17%, but when the changes are simultaneous, the NPV is relatively unchanged (1.9%) as the effects are opposite. A 10% change in the operating cost only changes the NPV by 4%.
Social The status of agreements with key stakeholders and matters leading to social licence to operate.
This risk is assessed as Low Risk. There are no known social or heritage matters that are seen as having the potential to stop the Project proceeding. Any proposed government changes toroyalties, mining legislation, environmental protection or transport regulations would apply tothe whole of either Queensland’s or Australia’s mining sector, and would therefore not proceedwithout timely discussion and time to implement.
Other To the extent relevant, the impact of the following on the project and/or on the estimation and classification of the Ore Reserves:Any identified material naturally occurring risks.The status of material legal agreements and marketing arrangements.The status of governmental agreements and approvals critical to the viability of the project, such as mineral tenement status, and government and statutory approvals. There must be reasonable grounds to expect that all necessary Government approvals will be received within the timeframes anticipated in the Pre-Feasibility or Feasibility study. Highlight and discuss the materiality of any unresolved matter that is dependent on a third party on which extraction of the reserve is contingent.
The Company holds all the necessary land and permits it requires, all necessary infrastructure has been built and is operational. It has been mining since 1994 and has produced over 100,000 ounces of gold and 45,000 ounces of silver. There are no legal matters in hand that appear likely to interfere with expanding the Project.Refined gold and silver are directly exchangeable for cash and do not require specialist marketing.
Classification The basis for the classification of the Ore Reserves into varying confidence categories.Whether the result appropriately reflects the Competent Person’s view of the deposit.The proportion of Probable Ore Reserves that have been derived from Measured Mineral Resources (if any).
Probable Ore Reserves are derived from Indicated Mineral Resources, which in turn are based on drill and face sample data at intervals of 25 to 80 metres. The Probable Ore Reserves are derived from, contained within, and not additional to, the Indicated Mineral Resources. There are 16 separate mineralised bodies in the Indicated Mineral Resource, and of these 16, fourteen met the criteria to be classified as ore bodies in the Probable Ore Reserve
Audits or reviews The results of any audits or reviews of Ore Reserve estimates. The last peer review of the Ore Reserves was by Snowden Associates in June 2012. Snowden concluded that the 2012 Technical Report is written in accordance with the 2004 JORC Code. In addition, Snowden considers that Citigold’s approach to estimating Ore Reserves at Charters Towers are reasonable based on the nature of the mineralisation, the methodology adopted in preparing the estimate and the history of operations in the goldfield.
SECTION 4 ESTIMATION AND REPORTING OF THE RESERVES (CONT)

Citigold Corporation LimitedPage xviii
Diagrammatic representation of the mineralisation process that formed the Charters Towers reefs. The Central mine reef systems have an overall East-West extent of 5 kilometres with the major reefs dipping to the North. Most past gold production was from ore shoots within quartz reefs in remarkably persistent, kilometre scale sheet-like reef structures (faults).
The following statements apply in respect of the information in this report that relates to Exploration Results, Mineral Resources and Ore Reserves: The information is based on, and accurately reflects, information compiled by Mr Christopher Alan John Towsey, who is a Corporate Member and Fellow of the Australasian Institute of Mining and Metallurgy. Mr Towsey is a Chartered Professional (Geology) and currently independent of Citigold Corporation Limited, having previously been a Director of the Company from 2014-June 2016. He has the relevant experience in relation to the mineralisation being reported on to qualify as a Competent Person as defined in the Joint Ore Reserves Committee (JORC) Australasian Code for Reporting of Exploration Results, Identified Mineral Resources and Ore Reserves 2012. Mr Towsey has consented in writing to the inclusion in this report of the matters based on the information in the form and context in which it appears.
For full details see Technical Report on the Mineral Resources and Reserves at www.citigold.com click Mining >Technical Reports >Mineral Resources and Reserves 2012
CRITERIA JORC CODE EXPLANATION COMMENTARYDiscussion of relative accuracy/ confidence
Where appropriate a statement of the relative accuracy and confidence level in the Ore Reserve estimate using an approach or procedure deemed appropriate by the Competent Person. For example, the application of statistical or geostatistical procedures to quantify the relative accuracy of the reserve within stated confidence limits, or, if such an approach is not deemed appropriate, a qualitative discussion of the factors which could affect the relative accuracy and confidence of the estimate.The statement should specify whether it relates to global or local estimates, and, if local, state the relevant tonnages, which should be relevant to technical and economic evaluation. Documentation should include assumptions made and the procedures used.Accuracy and confidence discussions should extend to specific discussions of any applied Modifying Factors that may have a material impact on Ore Reserve viability, or for which there are remaining areas of uncertainty at the current study stage.It is recognised that this may not be possible or appropriate in all circumstances. These statements of relative accuracy and confidence of the estimate should be compared with production data, where available.
The confidence level is ±10 to 15% for the contained ounces in the Probable Ore Reserve.Assay duplicate precision has been audited and found to be within ±10% of the mean value, which is within acceptable limits for commercial assays. Selective re-assay of samples was undertaken following inspection of results where particularly high or anomalous assays were noted. Assay results were reviewed statistically, by cumulative frequency plots and histograms, and log normality of data sets was established for the mineralised zones. See the Company 2012 Mineral Resources and Ore Reserves Report, available on the Company’s web site at http://www.citigold.com/mining/technical-reports, pages 45 to 64. The normal range of precision from commercial laboratories (as used by the Company) is 10% to 15% (Bumstead, 1984 – see the 2012 Report), meaning that repeat samples vary from the average of the samples by up to 10% to 15%. Given that this precision of the most accurate starting number, the laboratory assay, is already ±10% to 15%, it is not possible to estimate contained ounces or confidence limits to a higher accuracy.

Citigold Corporation LimitedPage 1
DIRECTORS’ REPORTThe directors present their report together with the financial report of Citigold Corporation Limited and the consolidated financial report of the consolidated entity for the year ended 30 June 2019 and the auditor’s report therein.
The names and the relevant details of Directors of the Company in office during or since the end of the financial year are as follows.
1. DIRECTORS
CURRENT DIRECTORS
COMPANY SECRETARY
M J Lynch FAICD, MAusIMMAppointed 02/07/1993Actively involved in gold exploration and mining for over 30 years. Mr Lynch has extensive hands-on experience in mine operations and management from the pegging of mining leases through to pouring gold bars. During his corporate career, he has maintained a competitive focus on business efficiency centred on strategic planning and innovation. He has held the position of Director of the Queensland Resources Council for six years and is currently a Fellow of the Australian Institute of Company Directors, Member of the Australasian Institute of Mining & Metallurgy and IEEE Robotics & Automation Society. Other than as stated above, Mr Lynch has not served as a Director of any other listed companies in the three years immediately before the end of the 2019 financial year.
Executive Chairman, Member of Nomination, Remuneration, and Health, Safety, Environment & Risk Committees
N Nand CPA, B.Bus(Accy)Appointed 11/03/2016Certified Practising Accountant (CPA), Bachelor of Business with extended major in professional accounting. In small to large firms in the past 10 years he has played an integral role in the development of systems and processes to manage the corporate, statutory compliance and financial reporting. He has been associated with Citigold for a number of years in a corporate accounting role and has strong knowledge of the operations and business.
J J Foley BD, LLB, BL (Dub) Appointed 02/07/1993Graduating in law from the University of Sydney in 1969, Mr Foley was admitted to practise as a barrister in New South Wales in 1971. He was called to the Irish Bar in 1989 and admitted as a Member of the Honourable Society of Kings’ Inns in Dublin. Mr Foley has over 30 years’ experience in the gold mining industry, has been a guest speaker at the World Gold Council in New York and is a past Director of the Australian Gold Council. Mr Foley is currently a Non-Executive Director of Hudson Investment Group Limited. Other than as stated, Mr Foley has not served as a Director of any other listed companies in the three years immediately before the end of the 2019 financial year.
Non-Executive Director, Member of Audit and Finance, Nomination, Remuneration and Health, Safety, Environment and Risk Committees
S Acharya PhD, MSc, MTech, MBA, FIAET, FAusIMM, FIML, FCMI Appointed 21/06/2016
Dr. Acharya’s qualifications include a PhD(Metallurgical Engineering), MSc(Chemistry), MTech(Material Science), an MBA and an active technical consultant with over 19 years experience in metallurgy, material science and mineral processing across several countries. His strengths include extraction of metals, data analytics, process improvement, operations design and implementation. He brings big picture thinking, while attending to the detail of operational process, to drive managing for results focused innovation. Technical advisor on the Board. Other than as stated above, Dr Acharya has not served as a Director of any other listed companies in the three years immediately before the end of the 2019 financial year.
Non-Executive Director, Member of Audit and Finance and Health, Safety, Environment and Risk Committees
A PanchariyaAppointed 22/9/2013
His Excellency Arun Panchariya is The Consul General of The Republic of Liberia to Dubai, UAE, an Investment Banker & Entrepreneur with over two decades of experience in the financial markets He is founder of Global Finance & Capital Ltd (UK regulated) and led a global investors “West Africa Investment Forum” where infrastructure project development deals totalled USD17Billion. He set up various regulated financial institutions in several jurisdictions, including investment banks, securities & commodities broking firms, infrastructure funds, asset management, FX Trading(online). Other than as stated, Mr Panchariya has not served as a Director of any other listed companies in the three years immediately before the end of the 2019 financial year.
Non-Executive Director, Member of Audit and Finance, Nomination, Remuneration Committees

Citigold Corporation LimitedPage 2
The number of directors’ meetings (including board committees) held and the number of meetings attended by each director during the year ended 30 June 2019 was:
The relevant interest of each director in the shares and options issued by the companies within the consolidated entity and other related bodies corporate, as notified by the directors to the Australian Securities Exchange in accordance with s205G (1) of the Corporations Act, at the date of this report is detailed in the following table.
Information about the remuneration of the directors and senior management is set out in the Remuneration Report of the Directors’ Report.
During the year the principal activities of the consolidated entity consisted of exploration, development and mining of the Charters Towers Goldfield. There has been no significant change in the nature of these activities during the year.
2. PRINCIPAL ACTIVITIES
No amount has been paid or declared by way of dividend by the Company during the year. The directors do not recommend a dividend at this time.
3. DIVIDENDS – CITIGOLD CORPORATION LIMITED
MEETINGS OF DIRECTORS
DIRECTORS’ INTERESTS
REMUNERATION OF DIRECTORS AND SENIOR MANAGEMENT
*Not a member of the relevant committee Column A- Number of meetings held during the time the director held office or was a member of the relevant committeeColumn B- Number of meetings attended
BOARD MEETING AUDIT AND FINANCE
HEALTH, SAFETY, ENVIRONMENT
AND RISKREMUNERATION NOMINATION
A B A B A B A B A BM J Lynch 12 12 * * 2 2 2 2 1 1J J Foley 12 12 2 2 2 2 2 2 1 1A Panchariya 12 6 2 1 * * 2 1 1 0S Acharya 12 11 2 2 2 2 * * * *
DIRECTOR ORDINARY SHARES SHARE OPTIONSJ J Foley 23,450,738 -
M J Lynch 227,866,448 -A Panchariya - -
S Acharya - -TOTAL 251,317,186 -
Significant changes in the state of affairs on the consolidated entity during the financial year were as follows:(a) An increase in ordinary shares in the Company from 1,915,254,811 to 2,159,635,597 as a result of:
4. SIGNIFICANT CHANGES IN THE STATE OF AFFAIRS
TYPE OF ISSUE ISSUE PRICE NUMBER OF SHARES ISSUEDShare Purchase Plan $0.0063 127,501,690Share placement $0.0063 106,879,096 Share placement $0.006 10,000,000
Net cash received was used to continue the exploration, development and general activities of the Company. See Note 17 of the Financial Statements.
Details of unissued shares or interest under options as at the date of this report are:
5. SHARE OPTIONS
ISSUING ENTITY NUMBER OF OPTIONS EXERCISE PRICE EXPIRY DATE OF OPTIONCitigold Corporation Limited - - -

Citigold Corporation LimitedPage 3
Since the end of the financial year the Company issued 241,537,612 shares to raise working capital of $1.21 million. In addition, the existing loan facility has been increased to $700,000 and extended to June 2021.
6. POST BALANCE DATE EVENTS
During the 2019 Financial Year, the Charters Towers Gold Project remained the Company’s prime focus. The Project comprises the very large gold deposits, as set out in the Technical Report: Mineral Resources and Reserves 2012 (See ASX announcement dated 21 May 2012 Mineral Resources and Reserves Report). The material assumptions and technical parameters underpinning the estimates continue to apply and have not materially changed. There was no gold production during the year with all the project sites and assets being maintained in care and maintenance ready for recommencement of mining operations.
The Company does not require additional mine acquisitions to recommence and sustain long term gold production. Citigold has already invested over $200 million in acquiring the gold deposit, developing the infrastructure and mines at Charters Towers. Trial mining operations have produced over 100,000 ounces of gold. The past year has seen the Company further refine its development strategy, and innovation plans, that aim to optimise the assets at Charters Towers and become an ultra-low cost gold producer. Additionally, these savings will include reducing the environmental surface footprint of the mine as it moves back into larger scale gold production.
The Charters Towers Project still remains one of Australia’s largest high-grade pure gold deposits.
7. REVIEW OF OPERATIONS
Likely developments in the operations of the consolidated entity are:
a. the continuation of exploration activity aimed at increasing resources and reserves,
b. the continuation of mining activity at Charters Towers.
Additional comments on expected results are included in the Review of Operations.
8. LIKELY DEVELOPMENTS AND EXPECTED RESULTS OF OPERATIONS
During or since the end of the financial year, the company has not given an indemnity or entered into an agreement to indemnify the directors, officers and auditors of the consolidated entity against liabilities for costs and expenses incurred by them in defending legal proceedings arising from their conduct whilst acting in the capacity of a director, officer and/or auditor of the consolidated entity.
The consolidated entity has not otherwise, during or since the end of the financial year, except to the extent permitted by law, indemnified or agreed to indemnify a director, officer and/or auditor of the consolidated entity or any related body corporate against a liability incurred.
9. INDEMNIFICATION AND INSURANCE
No person has applied to the Court under section 237 of the Corporations Act 2001 for leave to bring proceedings on behalf of the company, or to intervene in any proceedings to which the company is a party, for the purpose of taking responsibility on behalf of the company for all or part of those proceedings.
10. PROCEEDINGS ON BEHALF OF THE COMPANY
Entities in the consolidated entity are subject to significant environmental regulation in respect of its exploration and mining activities in gold.
The organisation has developed criteria to determine areas of ‘particular’ or ‘significant’ importance, with regard to environmental performance. These are graded 1 to 4 in terms of priority.
Level 1 incident - major non-compliance with regulatory requirements resulting in potential political outcry and significant environmental damage of both a long and short-term nature.
Level 2 incident - significant non-compliance resulting in regulatory action, however, environmental damage is only of a short term nature.
Level 3 incident - minor non-compliance, however, regulatory authority may be notified.Level 4 incident - non-compliance with internal policies and procedures. The incident is contained on site.
11. ENVIRONMENTAL REGULATIONS

Citigold Corporation LimitedPage 4
LEVEL 1 LEVEL 2 LEVEL 3 LEVEL 4
Incidents - - - -
The objective of the consolidated entities and company’s executive reward framework is to ensure reward for performance is competitive and appropriate for the results delivered. The framework aligns executive reward with the achievement of strategic objectives and the creation of value for shareholders and conforms to the market best practice for delivery of reward. The Board of Directors (‘the Board’) ensures that executive reward satisfies the following key criteria for good reward governance practices:
• competitiveness and reasonableness• acceptability to shareholders• performance linkage / alignment of executive compensation• transparency
While the Board has overall responsibility for the executive structure and outcomes, it has appointed a Nomination and Remuneration Committee for advice and makes recommendations on remuneration matters.
The performance of the consolidated entity and the company depends on the quality and dedication of its directors and executives. The remuneration philosophy is to attract, motivate and retain high performance, dedicated and high quality personnel.
The Remuneration Committee annually considers the appropriate levels and structure of remuneration for Directors and Key Management Personnel relative to the Company’s circumstances, size and nature of business, as well as company performance. This is done by reference to independent data and advice.
The Company competes for labour in the broader resources industry. In selecting, retaining and remunerating directors and executives the committee considers the appropriateness, taking into account the corporate and operational regulatory environment that a mining enterprise operates on these days in Australia that places substantial and ever increasing burdens of responsibility upon these officers of the Company in addition to the usual business performance.
Reward structures are transparent and align with shareholders’ interests by:
• being market competitive to attract and retain high calibre individuals motivated and skilled in the business of the Company;
• recognising the contribution of each senior executive to the continued growth and success of the Company;• encouraging, recognising and rewarding high individual performance; and• ensuring that long term incentives are based on total shareholder return outperformance over a period of three years.
In accordance with best practice corporate governance, the structures of non-executive directors and executive remunerations are separate.
The remuneration report, which has been audited, outlines the director and executive remuneration arrangements for the consolidated entity and the company, in accordance with the requirements of the Corporations Act 2001 and its Regulations.
The remuneration report is set out under the following main headings:
a. Principles used to determine the nature and amount of remuneration
b. Details of remuneration
c. Service agreements
d. Additional information
The fees paid or payable for services provided by the auditor of the Company are set out in Note 5 of the Financial Statements. The Auditor’s independence declaration is included on page 7.
The Company has an internal reporting and monitoring system with regard to environmental management on the site. The Company monitors water, noise and air quality issues as well as liaising with the community on activities that may impact on the local area.
A. Principles used to determine the nature and amount of remuneration
13. REMUNERATION REPORT - Audited
12. AUDIT/NON-AUDIT SERVICES AND AUDITOR INDEPENDENCE
In the last year the following incidents have occurred:

Citigold Corporation LimitedPage 5
Details of the remuneration of the directors, other key management personnel (defined as those who have the authority and responsibility for planning, directing and controlling the major activities of the consolidated entity) and specified executives of Citigold Corporation Limited are set out in the following tables.
B. DETAILS OF REMUNERATION
Non-Executive Directors Remuneration
Non-executive directors are paid fixed fees. In addition, Non-Executive directors may also be remunerated for additional service, for example, if they take consulting work on behalf of the company outside the scope of their normal Directors duties. Fees and payments to non-executive Directors are set to attract individuals of appropriate calibre and reflect the demands which are made on, and the responsibilities of, the Directors. Non-Executive Directors’ fees and payments are reviewed annually by the Remuneration Committee and determined based on comparative roles in the external market.
In order to maintain their independence and impartiality, the fees paid to Non-Executive Directors are not linked to the performance of the Company. Non-Executive Directors have no involvement in the day to day management of the Company.
ASX listing rules require that the aggregate Non-Executive Directors remuneration shall be determined periodically by a general meeting. The most recent determination was at the Annual General Meeting held on 17 November 2010, where the shareholders approved an aggregate remuneration of $400,000.
Executive Remuneration
The consolidated entity and company aims to reward executives with a level and mix of remuneration based on their position and responsibility, which is both fixed and variable.
The executive remuneration and reward may consist of the following
• Fixed remuneration• Variable performance incentives
- Short term incentives - Long term incentives
The combination of these comprises the executive’s total remuneration.
Fixed Remuneration
Fixed remuneration consisting of base salary, superannuation, long service leave and non-monetary benefits are reviewed annually by the Remuneration Committee, based on individual and business unit performance, the overall performance of the consolidated entity and comparable market remunerations.
Executives can receive their fixed remuneration in the form of cash or other fringe benefits (for example motor vehicle benefits) where it does not create any additional costs to the consolidated entity and adds additional value to the executive.
Variable Performance Incentives
Short-Term Incentives
The short-term incentive program is designed to align the targets of the business units with the targets of those executives in charge of meeting those targets and to improve the company’s short term and long term performance. These incentives are meant to reward executives only when performance targets are met to increase shareholders value. They are granted to executives based on individual contribution to profit, production costs, leadership contribution and safety outcomes. Short-term incentives are currently paid in cash. No short-term incentives were paid during the reporting period.
Long-Term Incentives
The long-term incentive include performance rights or share-based payments. No options were issued or exercised by any executive during the reporting period. No long-term incentives were paid during the reporting period. The Remuneration Committee may revisit the long-term equity-linked performance incentives specifically for executives during the year ending 30 June 2019.
The majority of bonus and incentive payments are at the discretion of the Nomination and Remuneration Committees.
The following persons were Directors and/or key management personnel of the Group during the year:
M.J. Lynch (Executive Chairman)
J.J. Foley (Non Executive Director)
A. Panchariya (Non Executive Director)
S. Acharya (Non Executive Director)

Citigold Corporation LimitedPage 6
3) PAYMENTS TO DIRECTORS AND KEY MANAGEMENT PERSONNEL
SHORT-TERM EMPLOYEE BENEFITS PAID OR PAYABLEPOST
EMPLOYMENT BENEFITS
SHARE-BASED
PAYMENTS
2019CASH SALARY
AND FEESCASH
BONUS
NON MONETARY BENEFITS
RELATED PARTY
PAYMENTS1 SUPERANNUATION OPTIONS TOTALDirectors $ $ $ $ $ $ $J J Foley - - - 203,710 - - 203,710M J Lynch - - - 611,886 - - 611,886 S. Acharya 72,875 - - - - - 72,875. 72,875 - - 815,596 - - 888,471
SHORT-TERM EMPLOYEE BENEFITS PAID OR PAYABLEPOST
EMPLOYMENT BENEFITS
SHARE-BASED
PAYMENTS
2018CASH SALARY
AND FEESCASH
BONUS
NON MONETARY BENEFITS
RELATED PARTY
PAYMENTS1 SUPERANNUATION OPTIONS TOTALDirectors $ $ $ $ $ $ $J J Foley 82,380 - - - 7,826 - 90,206M J Lynch - - - 582,750 - - 582,750S. Acharya 40,000 - - - - - 40,000. 122,380 - - 582,750 7,826 - 712,956
This concludes the remuneration report, which has been audited.
Share options exercised during the current yearNo options were exercised during the year by Key Management Personnel or Executives of the consolidated entities.
This report is made in accordance with a resolution of Directors.For and on behalf of the BoardDated at Brisbane this 25th day of September 2019.
C. SERVICE CONTRACTS
Contract Term: 1 July 2019 to 30 December 2025
Base Salary: $626,808 Package, may be reviewed annually by the Remuneration Committee
Termination Payments: Payment on early termination by the Group, other than for gross misconduct, equal to one year of employment.
1The related party payments are payments to entities related to the Directors and/or Key Management Personnel for work carried out by that entity.
EXECUTIVE CHAIRMAN
Mark LynchChairman

Citigold Corporation LimitedPage 7
AUDITORS INDEPENDENCE DECLARATION

Citigold Corporation LimitedPage 8
CONSOLIDATED STATEMENT OF PROFIT OR LOSS AND OTHER COMPREHENSIVE INCOMEFOR THE YEAR ENDED 30 JUNE 2019
The above statement should be read in conjunction with the accompanying notes.
NOTES 2019 $
2018 $
Revenue - -Cost of Sales - -Gross Profit - -
Other Income 2 74,897 11,920,140Personnel benefits expense (869,867) (824,942)Depreciation and amortisation expense 3 (54,563) (382,117)Finance costs 4 (253,983) 5,560,111Consulting expense (736,944) (460,856)Other expenses 3 (633,414) (2,498,869)(Loss)/Profit before income tax expense (2,473,874) 13,313,467Income tax 6 - -
(Loss)/Profit after tax from continuing operations (2,473,874) 13,313,467
Total comprehensive income (2,473,874) 13,313,467
Profit attributable to:(Loss)/Profit attributable to non-controlling interest - -(Loss)/Profit attributable to members of the company (2,473,874) 13,313,467
(2,473,874) 13,313,467
Total comprehensive income attributable: (Loss)/Profit attributable to non-controlling interest - -(Loss)/Profit attributable to members of the company (2,473,874) 13,313,467
(2,473,874) 13,313,467
Basic and diluted EPS (Cents per share) 7 (0.1172) 0.6960

Citigold Corporation LimitedPage 9
The above statement should be read in conjunction with the accompanying notes.
NOTES 2019$
2018$
Current assetsCash and cash equivalents 9 10,498 165,918Trade and other receivables 10 17,477 319,821Inventories 11 - -Other financial assets 13 1,517,340 1,517,340
Total current assets 1,545,315 2,003,079Non - current assetsProperty, plant and equipment 12 109,098,476 109,082,891Other financial assets 13 501,568 493,568Total non-current assets 109,600,044 109,576,459Total assets 111,145,359 111,579,538Current liabilitiesTrade and other payables 14 2,483,619 3,675,355Borrowings 15 - -Provisions 16 1,923,553 2,641,880Total current liabilities 4,407,172 6,317,235Non-current liabilitiesTrade and other payables 14 5,926,244 3,147,620Borrowings 15 349,203 714,667Provisions 16 489,472 489,472Total non-current liabilities 6,764,919 4,351,759Total liabilities 11,172,091 10,668,994Net assets 99,973,268 100,910,544EquityIssued capital 17 215,215,917 213,679,319
Reserves 18 39,257,542 39,257,542Accumulated losses 19 (154,569,274) (152,095,400)Total equity attributable to shareholders of the company 99,904,185 100,841,461Non-controlling Interest 69,083 69,083Total equity 99,973,268 100,910,544
CONSOLIDATED STATEMENT OF FINANCIAL POSITIONAS AT 30 JUNE 2019

Citigold Corporation LimitedPage 10
The above statement should be read in conjunction with the accompanying notes.
CONSOLIDATED STATEMENT OF CHANGES IN EQUITYFOR THE YEAR ENDED 30 JUNE 2019
ISSUED CAPITAL
$
ASSET REVALUATION
RESERVE $
CAPITAL RESERVE
$
SHARE BASED
PAYMENTS RESERVE
$
RETAINING EARNING
$
ATTRIBUTABLE TO OWNERS OF PARENT
$
NONCONTROLLING
INTEREST$
TOTAL $
CONSOLIDATED
Balance as at 1 July 2018 213,679,319 37,851,949 571,430 834,163 (152,095,400) 100,841,461 69,083 100,910,544 Profit for period - - - - (2,473,874) (2,473,874) - (2,473,874) Totalcomprehensive income - - - - (2,473,874) (2,473,874) - (2,473,874)
Owners contribution, net of transaction cost 1,536,598 - - - - 1,536,598 - 1,536,598 Balance as at 30 June 2019 215,215,917 37,851,949 571,430 834,163 (154,569,274) 99,904,185 69,083 99,973,268
Balance as at 1 July 2017 212,820,319 37,851,949 571,430 834,163 (165,408,867) 86,668,994 69,083 86,738,077Profit for period - - - - 13,313,467 13,313,467 - 13,313,467Totalcomprehensive income - - - - 13,313,467 13,313,467 - 13,313,467
Owners contribution, net of transaction cost 859,000 - - - - 859,000 - 859,000Balance as at 30 June 2018 213,679,319 37,851,949 571,430 834,163 (152,095,400) 100,841,461 69,083 100,910,544

Citigold Corporation LimitedPage 11
CONSOLIDATED STATEMENT OF CASH FLOWSFOR THE YEAR ENDED 30 JUNE 2019
The above statement should be read in conjunction with the accompanying notes.
NOTES 2019$
2018$
Cash flows from operating activitiesReceipts from customers 4,710 542,705Interest received 39 1,075Payments to suppliers and employees (1,091,329) (3,976,831) Interest and other costs of finance paid - -
Net cash (used in) /provided by operating activities 8 (1,086,580) (3,433,051)
Cash flows from investing activitiesProceeds from property, plant and equipment - 12,085,876Net cash (used in) / provided by investing activities - 12,085,876
Cash flows from financing activitiesProceeds from issues of equity securities 763,660 -Proceeds from borrowings 167,500 412,726Repayment of borrowings - (9,146,526)Net cash provided by/(used in) financing activities 931,160 (8,733,800)Net (decrease) / increase in cash and cash equivalents (155,420) (80,975)Cash and cash equivalents at the beginning of the financial year 165,918 246,893Cash and cash equivalents at end of the financial year 9 10,498 165,918

Citigold Corporation LimitedPage 12
NOTES TO THE FINANCIAL STATEMENTSFOR THE YEAR ENDED 30 JUNE 2019
The financial report of Citigold Corporation Limited for the year ended 30 June 2019 covers Citigold Corporation Limited as an individual entity as well as the consolidated entity consisting of Citigold Corporation Limited and its subsidiaries as required by the Corporations Act 2001.
Citigold Corporation Limited is a company limited by shares incorporated in Australia whose shares is publicly traded on the ASX Limited.
1. SUMMARY OF SIGNIFICANT ACCOUNTING POLICIES
The following significant accounting policies have been adopted in the preparation and presentation of the yearly financial report. The financial reports include separate financial statements for Citigold Corporation Limited as an individual entity and the consolidated entity consisting of Citigold Corporation Limited and its subsidiaries. BASIS OF PREPARATIONThe financial report is a general purpose financial report, which has been prepared in accordance with Australian equivalents to International Financial Reporting Standards (AIFRS), other authoritative pronouncements of the Australian Accounting Standards Board and the Corporations Act 2001.
The financial report has been prepared on the basis of historical cost. Cost is based on the fair values of the consideration given in exchange for assets.
A) BASIS OF CONSOLIDATION The financial report of the Citigold Corporation Group (“the consolidated entity”) includes the consolidation of Citigold Corporation Limited and its respective subsidiaries. Subsidiaries are entities controlled by the parent entity. Control exists where the parent entity has the power to govern the financial and operating policies of an entity so as to obtain benefits from its activities. Subsidiaries are included in the consolidated financial report from the date control commences until the date control ceases. The effects of all transactions between entities within the Citigold Corporation Group have been eliminated.
Intercompany transactions, balances and unrealised gains on transactions between Group companies are eliminated. Unrealised losses are also eliminated unless the transaction provides evidence of the impairment of the asset transferred. Accounting policies of subsidiaries have been changed where necessary to ensure consistency with the policies adopted by the Group.
Where the Citigold Corporation Group’s interest is less than 100 percent, the interest attributable to outside shareholders is reflected in non-controlling interests. Non-controlling interests in the results and equity of subsidiaries are shown separately in the consolidated statement of profit or loss and other comprehensive income and statement of financial position respectively.
B) FOREIGN CURRENCY TRANSLATIONThe results and financial position of each entity are expressed in Australian dollars, which are the functional currency of Citigold Corporation Limited and the presentation currency for the consolidated financial statements.
In preparing the financial statements of individual entities, transactions in currencies other than the entity’s functional currency are recorded at the rates of exchange prevailing on the dates of transactions. At balance date, monetary items denominated in foreign currencies are retranslated at the rates prevailing at the balance date. Non-monetary items carried at fair value that are denominated in foreign currencies are retranslated at the rates prevailing on the date when fair value is determined. Non-monetary items that are measured in terms of historical cost in a foreign currency are not retranslated.
C) LOAN AND BORROWINGSLoan and borrowings are initially recognised at fair value, net of transaction costs incurred. Borrowings are subsequently measured at amortised cost, less any impairment. Any difference between the proceeds (net of transaction costs) and the redemption amount is recognised in the statement of profit or loss and other comprehensive income over the period of the loans and borrowings using the effective interest method.
D) CASH AND CASH EQUIVALENTSFor the purposes of the statement of cash flow, cash and cash equivalents including, cash on hand and at bank, deposits held at call with financial institutions, other short term, highly liquid investments with maturities of three months or less, that are readily convertible to known amounts of cash and which are subject to an insignificant risk of changes in value.
E) TRADE AND OTHER RECEIVABLESTrade receivables are recognised at original invoice amounts less an allowance for uncollectible amounts and have repayment terms normally between 7 - 90 days payment terms or longer from time to time. Collectability of trade receivables is assessed on an ongoing basis. Debts which are known to be uncollectible are written off.

Citigold Corporation LimitedPage 13
F) EMPLOYEE BENEFITS
1) Provision for wages and salaries, annual leave and long service leave
Provision is made for the benefits accruing to employees in respect of wages and salaries, annual leave and long service leave when it is probable that the settlement will be required and they are capable of being measured reliably.
Provisions made in respect of employee benefits expected to be settled within 12 months are measured at their nominal values using the remuneration rate expected to apply at the time of settlement.
Provisions made in respect of employee benefits which are not expected to be settled within 12 months are measured as the present value of the estimated future cash outflows to be made by the consolidated entity in respect of services provided by employees up to reporting date.
The liability for long service leave is recognised in the provision for employee benefits and measured as the present value of expected future payments to be made in respect of services provided by employees up to the reporting date using the projected unit credit method. Consideration is given to expected future wage and salary levels, experience of employee departures and periods of service. Expected future payments are discounted using market yields at the reporting date on national government bonds with terms to maturity and currency that match, as closely as possible, the estimated future cash flows.
2) Share-based payment transactions
The fair value of any options granted under any share option plan is recognised as an employee benefit expense with a corresponding increase in equity (share option reserve). The fair value is measured at grant date and recognised over the period during which the employees become unconditionally entitled to the options. Fair value is determined by using the Black-Scholes option pricing model. In determining fair value, no account is taken of any performance conditions other than those related to the share price of the Company (“market conditions”). The cumulative expense recognised between grant date and vesting date is adjusted to reflect the director’s best estimate of the number of options that will ultimately vest because of internal conditions of the options, such as the employees having to remain with the company until vesting date, or such that employees are required to meet production targets. No expense is recognised for options that do not ultimately vest because internal conditions were not met. An expense is still recognised for options that do not ultimately vest because a market condition was not met.
No employee share option plan currently exists.
G) EXPLORATION, EVALUATION AND DEVELOPMENT EXPENDITUREExploration and evaluation costs are written off in the year they are incurred, apart from acquisition costs which are carried forward where right of tenure of the area of interest is current and the expenditure is expected to be recouped through sale or successful development and exploration of the area of interest or where exploration and evaluation activities in the area of interest have not at the reporting date reached a stage which permits a reasonable assessment of the existence or otherwise of economically recoverable reserves, and active and significant operations in, or in relation to, the area of interest are continuing.
Development expenditure is capitalised in the year it is incurred.
H) IMPAIRMENT OF ASSETSAt each reporting date, the consolidated entity reviews the carrying amounts of its tangible and intangible assets to determine whether there is any indication that those assets have suffered an impairment loss. If any such indication exists, the recoverable amount of the asset is estimated in order to determine the extent of the impairment loss (if any). Where the asset does not generate cash flows that are independent from other assets, the consolidated entity estimates the recoverable amount of the cash-generating unit to which the asset belongs.
The recoverable amount is the higher of fair value less costs to sell and value in use. In assessing value in use, the estimated future cash flows are discounted to their present value using a pre-tax discount rate that reflects current market assessments of the time value of money and the risks specific to the asset for which the estimates of future cash flows have not been adjusted.
I) TAXATION
Current taxCurrent tax is the expected tax payable on the taxable income for the period, using tax rates and tax laws that have been enacted or substantively enacted by the reporting date. Current tax for current and prior periods is recognised as a liability (or asset) to the extent that it is unpaid (or refundable).
Deferred TaxDeferred tax is accounted for using the comprehensive statement of financial position liability method in respect of temporary differences arising from differences between the carrying amount of the assets and liabilities in the financial statements and the corresponding tax base of those items.

Citigold Corporation LimitedPage 14
Deferred tax liabilities are recognised for all taxable temporary differences. Deferred tax assets are recognised to the extent that it is probable that sufficient taxable amounts will be available against which deductible temporary differences or the unused tax losses can be utilised.
Deferred tax assets and liabilities are measured at the tax rates that are expected to apply to the period(s) when the assets and liabilities, giving rise to them are realised or settled, based on tax rates and tax laws that have been enacted by the reporting date.
Current and deferred tax for the period is recognised as an expense or income in the statement of profit or loss and other comprehensive income, except when it relates to items credited or debited directly to equity, in which case the deferred tax is recognised directly in equity.
Tax consolidationThe parent entity company and all its wholly-owned Australian resident entities are part of a tax consolidated group under the Australian taxation law. Citigold Corporation Limited is the head entity in the tax-consolidated group.
Goods and services taxRevenues, expenses and assets are recognised net of the amount of goods and services tax (GST), except for receivables and payables which are recognised inclusive of GST.
The net amount of GST recoverable from, or payable to, the taxation authority is included as part of receivables or payables.
Cash flows are included in the statement of cash flow on a gross basis. The GST component of cash flows arising from investing and financing activities which is recoverable from, or payable to, the taxation authority is classified as operating cash flows.
J) INVENTORIES Gold in solution form and the ore is physically measured or estimated and valued at the lower of cost and net realisable value. Costs include direct costs and appropriate portion of fixed and variable production costs.
Consumables are valued at the lower of cost and net realisable value. Costs are assigned to inventory on hand using the first in first out method. Net realisable value is the estimated selling price in the ordinary course of business less the estimated costs of completion and the estimated costs necessary to make the sale.
K) LEASED ASSETSAssets held under leases which result in entities in the consolidated entity receiving substantially all the risks and rewards of ownership of the asset (finance leases) are capitalised at the lower of the fair value of the property, plant and equipment or the estimated present value of the minimum lease payments. The corresponding finance lease obligation is included within interest bearing liabilities. The interest element is allocated to accounting periods during the lease term to reflect a constant rate of interest on the remaining balance of the obligation for each accounting period. Finance lease assets are amortised at a straight line method over the estimated useful life of the asset. Operating lease assets are not capitalised and rental payments are included in the statement of profit or loss and other comprehensive income on a straight-line basis over the lease term.
L) FINANCIAL ASSETS The group classifies its financial assets as available for sale financial assets. The classification depends on the purpose for which the investments were acquired. Management determines the classification of its investments at initial recognition.
Available-for-sale financial assetsAvailable-for-sale financial assets comprise investments in unlisted entities and any non-derivatives that are not classified as any other category, and are classified as non-current assets. After initial recognition, these investments are measured at fair value with gains or losses recognised as a separate component of equity (available-for-sale investments revaluation reserve). Where losses have been recognised in equity and there is objective evidence that the asset is impaired, the cumulative loss, being the difference between the acquisition cost and current fair value less any impairment loss previously recognised in the statement of profit or loss and other comprehensive income, is removed from equity and recognised in the statement of profit or loss and other comprehensive income.
Reversals of impairment losses on equity instruments classified as available-for-sale cannot be reversed through statement of profit or loss and other comprehensive income. Reversals of impairment losses on debt instruments classified as available-for-sale can be reversed through the statement of profit or loss and other comprehensive income where the reversal relates to an increase in the fair value of the debt instrument occurring after the impairment loss was recognised in the statement of profit or loss and other comprehensive income.
The fair values of quoted investments are determined by reference to Stock Exchange quoted market bid prices at the close of business on the balance date. For investments where there is no quoted market price, fair value is determined by reference to the current market value of another instrument which is substantially the same or is calculated based on the expected cash flows of the underlying net asset base of the investment.
Citigold Corporation LimitedPage 15
Impairment of Financial AssetsFinancial assets, other than those at fair value through profit and loss, are assessed for indicators of impairment at each balance date. Financial assets are impaired where there is objective evidence that as a result of one or more events that occurred after initial recognition of the financial asset, the estimated future cash flows of the investment have been impacted.
For equity instruments, including listed or unlisted shares, objective evidence of impairment includes information about significant changes with an adverse effect that have taken place in technological, market, economic or legal environment in which the issuer operates, and indicates that the cost of the investment in the equity instrument may not be recovered. Where there is a significant or prolonged decline in the fair value of an available for sale financial asset (which constitutes objective evidence of impairment), the full amount of the impairment, including any amount previously charged to equity, is recognised in the statement of profit or loss and other comprehensive income
In respect of available for sale equity instruments, any subsequent increase in fair value after an impairment loss is recognised directly in equity.
M) TRADE AND OTHER PAYABLESTrade payables and other accounts payable are recognised when entities in the consolidated entity become obliged to make future payments resulting from the purchase of goods and services. These amounts are unsecured and have normally 30-60 days payment terms or longer from time to time.
N) PROPERTY, PLANT AND EQUIPMENTDevelopment Properties are measured at cost less accumulated amortisation.
Freehold land is not depreciated.
All other plant and equipment are stated at historical cost less depreciation. Historical cost includes expenditure that is directly attributable to the acquisition of the items.
Subsequent costs are included in the asset’s carrying value or recognised as a separate asset only when it is probable that a future economic benefit associated with the item will flow to the Company and the cost can be measured reliably. All other repairs and maintenance are charged to the statement of profit or loss and other comprehensive income during the reporting period in which they are incurred.
Depreciation of property, plant and equipmentThe carrying amounts of property, plant and equipment (including the original capital expenditure and any subsequent capital expenditure) are depreciated to their residual value over the useful economic life of the specific assets concerned or the life of the mine or lease, if shorter. The rates vary between 4% and 40%.
Depreciation is calculated on a straight line basis so as to write off the net cost or other re-valued amount of each asset over its expected useful life to its estimated residual value. Leasehold improvements are depreciated over the period of the lease or estimated useful life, whichever is the shorter, using the straight line method.
Depreciation rates and methods shall be reviewed at least annually and, where changed, shall be accounted for as a change in accounting estimate. Where depreciation rates or methods are changed, the net written down value of the asset is depreciated from the date of the change in accordance with the new depreciation rate or method. Depreciation recognised in prior financial years shall not be changed, that is, the change in depreciation rate or method shall be accounted for on a ‘prospective’ basis.
O) PROVISION FOR RESTORATION AND REHABILITATIONEntities in the consolidated entity are generally required to decommission and rehabilitate mine and processing sites at the end of their producing lives to a condition consistent with its Plan of Operations, environmental policies and acceptable to the relevant authorities. The expected cost of any approved decommissioning or rehabilitation programme is provided when the related environmental disturbance occurs, based on the interpretation of environmental and regulatory requirements.
Where there is a change in the expected decommissioning and restoration costs, an adjustment is recorded against the carrying value of the provision and any related asset, and the effect is then recognised in the statement of profit or loss and other comprehensive income in the year incurred.
The provisions referred to above do not include any amounts related to remediation costs associated with unforeseen circumstances. Such costs are recognised when environmental contamination as a result of oil and chemical spills or other unforeseen events gives rise to a loss which is probable and reliably estimable. The cost of other activities to prevent and control pollution is charged to the statement of profit or loss and other comprehensive income as incurred.
P) CONTRIBUTED EQUITYOrdinary shares are classified as equity.
Costs directly attributable to the issue of new shares or options are shown as a deduction from the equity proceeds, net of any income tax benefit. Costs directly attributable to the issue of new shares or options associated with the acquisition of a business are included as part of the purchase consideration.

Citigold Corporation LimitedPage 16
Q) EARNINGS PER SHARE
1) Basic earnings per shareBasic earnings per share are calculated by dividing the profit attributable to members of the Group, adjusted for the weighted average number of ordinary shares outstanding during the financial year, adjusted for bonus elements in ordinary shares during the year. The weighted average number of issued shares outstanding during the financial year does not include shares issued as part of any Employee Share Option Plan that are treated as in-substance options.
2) Diluted Earnings per shareEarnings used to calculate diluted earnings per share are calculated by adjusting the basic earnings by the after-tax effect of dividends and interest associated with dilutive potential ordinary shares. The weighted average number of shares used is adjusted for the weighted average number of shares assumed to have been issued for no consideration in relation to dilutive potential ordinary shares.
R) REVENUE RECOGNITIONRevenue is measured at the fair value of the consideration received or receivable.
Sale of goodsRevenue from the sale of goods is recognised when the consolidated entity has transferred to the buyer the significant risks and rewards of ownership of the goods.
Other incomeOther income is recognised on a receivable basis.
S) NEW ACCOUNTING STANDARDS AND INTERPRETATIONS Certain new accounting standards and interpretations have been published that are not mandatory for 30 June 2019 reporting periods. The Company’s and consolidated entity’s assessment of the impact of these new standards and interpretations is that the application of the standards and interpretation will have no material impact on the Company’s or Consolidated Entity’s financial reports.
T) GOING CONCERN In consideration of the management’s use of the going concern basis of reporting, a distinction is made between the Company and consolidated entity’s ability to pay its operating debts as and when they fall due within the next 12 months and the Company’s ability to exploit its tenements and other factors that may impact on the Company continuing as a going concern.
Operating expenditureThe Company’s cash flow forecast includes management’s estimates of operating expenses for the next 12 months of approximately $1million.
The Company had a cash balance at reporting date of $10,498, capital raising of $1.21 million post balance date, and no gold sales occurred during the period.
The Company has a track record of being able to raise sufficient cash through capital placements and or assets sales to pay its operating expenses as and when they fall due.
2. REVENUE AND OTHER INCOMECONSOLIDATED
2019$
2018$
Interest received 39 1,075
Sundry Income 74,858 11,919,065
Total 74,897 11,920,140

Citigold Corporation LimitedPage 17
6. INCOME TAX EXPENSECONSOLIDATED
2019 $
2018$
Prima facie income tax benefit calculated at 27.5% (2018: 27.5%) (680,315) 3,661,204on the (loss)/profit from continuing operationsDeferred tax benefit accrued/(utilised): 680,315 (3,661,204)Income tax attributable to net loss for year - -
At 30 June 2019 consolidated deferred tax assets of $46,797,506 ($45,509,742 at 30 June 2018) arising from carried forward income tax losses calculated at a tax rate of 27.5% (30 June 2018, 27.5%) have not been recognised as an asset.
The benefit of these losses will only be obtained if:
(i) the company and / or the consolidated entity derives future assessable income of a nature and of an amount sufficient to enable the benefit from the deduction for the losses to be realised;
(ii) the company and / or the consolidated entity continues to comply with the conditions for deductibility imposed by tax legislation; and
(iii) future changes in tax legislation do not adversely impact on the utilisation of the carried forward tax losses.
5. AUDITORS REMUNERATION CONSOLIDATED
2019 $
2018$
Audit and review of financial reports 39,730 39,660Other services - 10,000Total 39,730 49,660
4. FINANCE COSTSCONSOLIDATED
2019 $
2018$
Other Interest 238,339 2,814
Interest Paid and Other Funding Costs 15,644 (5,562,925)
Total 253,983 (5,560,111)
3. EXPENSESOTHER EXPENSES CONSOLIDATED
2019$
2018$
Office administration costs 290,034 598,177Site Maintenance 11,936 30,256Corporate administration 71,422 211,838Tenement charges and costs 229,421 1,010,180Travel expenses 34,001 12,898Professional fees (3,282) 415,380Loss on Currency Exchange (118) 220,140Total 633,414 2,498,869Depreciation and Amortisation ExpensePlant and Equipment 54,563 382,117
Superannuation ExpenseSuperannuation Expense - 9,555

Citigold Corporation LimitedPage 18
10. TRADE AND OTHER RECEIVABLESCONSOLIDATED
2019$
2018$
CURRENTSecurity Bonds 2,976 2,976Other Receivables and Accrued Income 1,999 40,339Prepayments - 16,429GST paid on acquisitions 12,502 260,077Total 17,477 319,821
All of the above receivables are held by a credit worthy party. Recoverability of the receivables is highly probable.
8. RECONCILIATION OF CASH FLOWS FROM OPERATING ACTIVITIESCONSOLIDATED
2019 $
2018 $
(Loss) / Profit for the year (2,473,874) 13,313,467Adjustments for:Impairment, Depreciation and Amortisation net after write back of assets sold
54,563 382,117
(Increase)/ decrease in Trade and other receivables 294,344 (571,106)(Increase)/ decrease in inventories - 221,399(Decrease)/ increase in trade, financing costs and other payables
1,756,715 (16,333,099)
Increase/ (decrease) in Employee provisions (718,328) (445,829)Net Cash (used in) / provided by operating activities (1,086,580) (3,433,051)
9. CASH AND CASH EQUIVALENTSCONSOLIDATED
2019$
2018$
Bank Balances 10,498 165,918
Cash and cash equivalents 10,498 165,918
7. EARNINGS PER SHARE (EPS)A) BASIC EARNINGS PER SHAREThe calculation of basic earnings per share at 30 June 2019 was based on the loss attributable to ordinary shareholders of $2,473,874 (Profit of $13,313,467 in 2018) and weighted average number of ordinary shares outstanding during the financial year ended 30 June 2019 2,110,201,316 (1,912,813,714 in 2018), calculation as follows:
* all attributable to ordinary shareholders
CONSOLIDATED2019
$2018
$(Loss) / Profit for the period* (2,473,874) 13,313,467
Weighted average number of ordinary sharesOpening Balance 1,915,254,811 1,828,921,386Effect of shares issued during the year 194,946,505 83,892,328
Total weighted average number of ordinary shares used in calculating basic and diluted earnings per share 2,110,201,316 1,912,813,714 (Loss) / Profit per share – cents (0.1172) 0.6960

Citigold Corporation LimitedPage 19
12. PLANT, PROPERTY AND EQUIPMENTCONSOLIDATED
2019$
2018$
PLANT, PROPERTY AND EQUIPMENTExploration, Evaluation and Development expenditure
Costs brought forward in respect of areas of interest: 131,416,290 131,416,290Costs incurred/reversed in period (360,000) (360,000)Less: Accumulated amortisation (1,142,988) (1,142,988)
Total exploration, evaluation and development expenditure
129,913,302 129,913,302
Development Property Costs brought forward 74,439,914 74,439,914Less: Accumulated amortisation - -
Total development property 74,439,914 74,439,914Freehold Land and Buildings at cost
Carrying amount at beginning of year 121,048 151,048Less: Sale of land during year - (30,000)Carrying amount at end of year 121,048 121,048
Plant and EquipmentAt Cost 9,203,450 9,203,450Less: accumulated depreciation (8,579,237) (8,594,823)Carrying amount at end of year 624,212 608,627
Less Impairment of Property, Plant and Equipment (96,000,000) (96,000,000)Total Carrying Value of Property, Plant and Equipment 109,098,476 109,082,891RECONCILIATION OF PLANT AND EQUIPMENT:Plant and Equipment
Carrying amount at beginning of year 608,627 1,605,521Net additions/(sale) during year - (614,777)Less: depreciation charged in year (54,563) (382,117)Adjustment - Prior Period Transaction 70,148 -Carrying amount at end of year 624,212 608,627
LEASED PLANT AND MACHINERYAt reporting date, the consolidated entity did not have any motor vehicles or other equipment under hire purchase or finance lease.
EXPLORATION, EVALUATION AND DEVELOPMENT EXPENDITURE The recoverability of the carrying amount of the exploration and evaluation assets is dependent on successful development and commercial exploitation, or alternatively, sale of the respective areas of interest.
IMPAIRMENT OF ASSETSThe carrying values of property, plant and equipment are reviewed for impairment, and adjusted if appropriate, at each reporting date. The Directors have considered internal and external factors and believe that the net present value of the group’s projects remains well above the carrying value of its Capitalised Exploration, Evaluation and Development Expenditure.
11. INVENTORIESCONSOLIDATED
2019$
2018$
CURRENT
Consumables - -
Total - -

Citigold Corporation LimitedPage 20
13. OTHER FINANCIAL ASSETSCONSOLIDATED
2019$
2018$
CURRENTSecurity deposit against restoration costs lodged with the Department of Natural Resources, Mines & Energy 1,517,340 1,517,340
NON CURRENTSecurity deposit against restoration costs lodged with the Department of Natural Resources, Mines & Energy 501,568 493,568
2,018,908 2,010,908
14. TRADE AND OTHER PAYABLES
15. BORROWINGSCONSOLIDATED
2019$
2018$
CURRENTUnsecured LiabilitiesLoan from unrelated parties - -Loan from related parties - -Secured LiabilitiesLoan from unrelated parties - -
Total - -
LOANS FROM UNRELATED PARTIESThe loans are all fixed interest at the rate of 12% per annum.
CONSOLIDATED2019
$2018
$CURRENT
Trade creditors 2,254,524 2,022,345Sundry creditors and accrued expenses 229,095 1,653,010
2,483,619 3,675,355NON CURRENT
Trade creditors 4,312,612 3,147,620Sundry creditors 1,613,632
5,926,244 3,147,620Total 8,409,863 6,822,975
As part of the sale of the Black Jack gold processing plant (Announced to ASX on 8 December 2017), the security deposit of $1,517,340 will be transferred to the buyer when the Department of Natural Resources, Mines & Energy completes the financial assurance transfer.
NON CURRENTUnsecured LiabilitiesLoan from unrelated parties 179,188 497,049Loan from related parties 170,015 217,618
Total 349,203 714,667
The Company acknowledges that one of the indicators that impairment needs to be considered is that the market capitalisation of the Entity (currently $12.01 million) is less than the carrying value as at the date of this report. The Company has determined in accordance with the Accounting Standard that the recoverable amount of the assets based on the future discounted cash flows, supported by the independent valuation report, significantly exceeds the carrying amount of the assets and therefore no impairment is required.
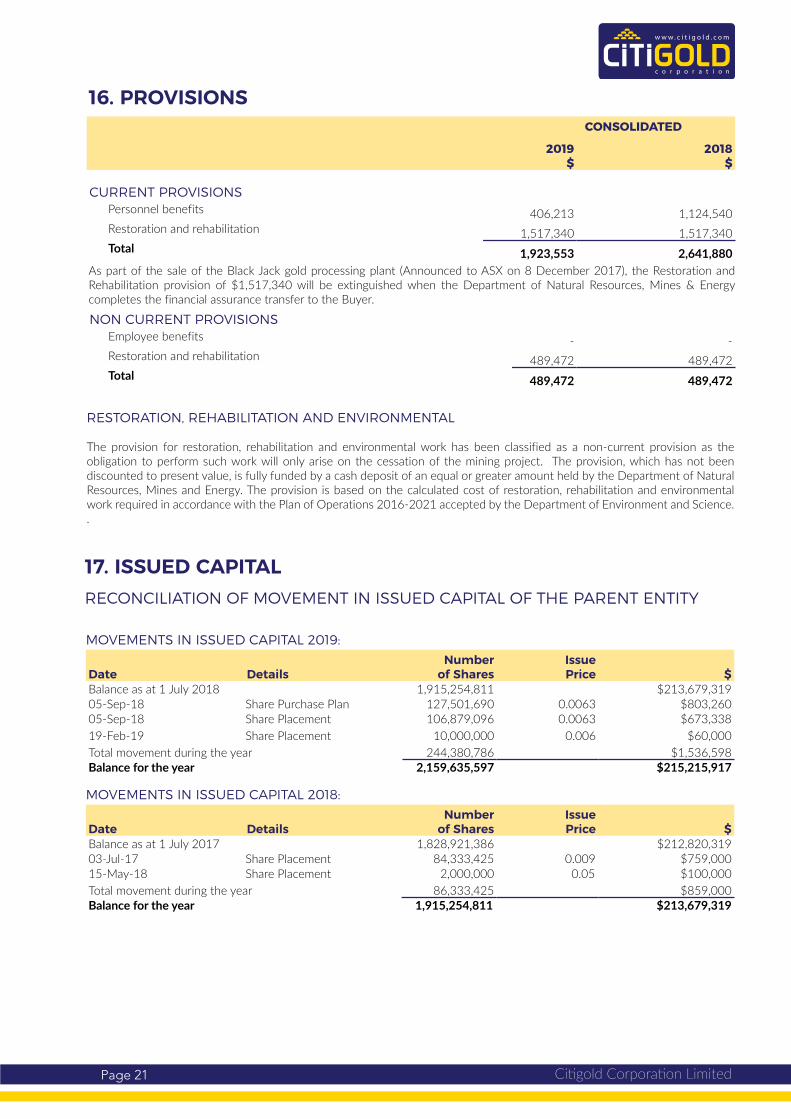
Citigold Corporation LimitedPage 21
16. PROVISIONSCONSOLIDATED
2019$
2018$
CURRENT PROVISIONSPersonnel benefits 406,213 1,124,540Restoration and rehabilitation 1,517,340 1,517,340Total 1,923,553 2,641,880
NON CURRENT PROVISIONSEmployee benefits - -Restoration and rehabilitation 489,472 489,472Total 489,472 489,472
As part of the sale of the Black Jack gold processing plant (Announced to ASX on 8 December 2017), the Restoration and Rehabilitation provision of $1,517,340 will be extinguished when the Department of Natural Resources, Mines & Energy completes the financial assurance transfer to the Buyer.
17. ISSUED CAPITAL
MOVEMENTS IN ISSUED CAPITAL 2019:
Date DetailsNumber
of SharesIssue Price $
Balance as at 1 July 2018 1,915,254,811 $213,679,31905-Sep-18 Share Purchase Plan 127,501,690 0.0063 $803,260 05-Sep-18 Share Placement 106,879,096 0.0063 $673,33819-Feb-19 Share Placement 10,000,000 0.006 $60,000Total movement during the year 244,380,786 $1,536,598Balance for the year 2,159,635,597 $215,215,917
MOVEMENTS IN ISSUED CAPITAL 2018:
Date DetailsNumber
of SharesIssue Price $
Balance as at 1 July 2017 1,828,921,386 $212,820,31903-Jul-17 Share Placement 84,333,425 0.009 $759,00015-May-18 Share Placement 2,000,000 0.05 $100,000Total movement during the year 86,333,425 $859,000Balance for the year 1,915,254,811 $213,679,319
RESTORATION, REHABILITATION AND ENVIRONMENTAL
The provision for restoration, rehabilitation and environmental work has been classified as a non-current provision as the obligation to perform such work will only arise on the cessation of the mining project. The provision, which has not been discounted to present value, is fully funded by a cash deposit of an equal or greater amount held by the Department of Natural Resources, Mines and Energy. The provision is based on the calculated cost of restoration, rehabilitation and environmental work required in accordance with the Plan of Operations 2016-2021 accepted by the Department of Environment and Science. .
RECONCILIATION OF MOVEMENT IN ISSUED CAPITAL OF THE PARENT ENTITY

Citigold Corporation LimitedPage 22
SHARE OPTIONS
The terms, amount and number of options are as follows:
MOVEMENT IN SHARE OPTIONSThe movement in the company’s share options during the year ended 30 June 2019 were as follows:
Date Details Number of Options Issue Price $- - - -- - - -
The movement in the company’s share options during the year ended 30 June 2018 were as follows:Date Details Number of Options Issue Price $
30/11/2017 Expiry 5,000,000 $0.05 30 November 2017
NUMBER OF OPTIONS OUTSTANDING AS AT 30 JUNE 2019:Issuing Entity Number of options Exercise Price Expiry date of OptionCitigold Corporation Limited - - -Balance as at 30 June 2019 - - -
NUMBER OF OPTIONS OUTSTANDING AS AT 30 JUNE 2018:Issuing Entity Number of options Exercise Price Expiry date of OptionCitigold Corporation Limited - - -Balance as at 30 June 2018 - - -
CAPITAL RISK MANAGEMENT
The Group considers its capital to comprise of ordinary share capital plus reserves.
In managing its capital, the Group’s primary objective is to ensure its continued ability to provide a return for its equity shareholders through capital growth. In order to achieve this objective, the Group seeks to maintain a gearing ratio that balances risks and returns at an acceptable level and also to maintain a sufficient funding base to enable the Group to meet its working capital and strategic investment needs. In making decisions to adjust its capital structure to achieve these aims, either through its new share issues, or the reduction of debt, the Group considers not only its short-term position but also its long-term operational and strategic objectives.
It is the Group’s practice to maintain its gearing ratio within the range of 0 – 15% (2018: 0 - 15%). The Group’s gearing ratio at the balance date is shown below
CONSOLIDATED
2019$
2018$
Gearing Ratio:Net debt 349,203 714,667Total equity 99,973,269 100,910,544Total capital 100,322,472 101,625,211Gearing Ratio 0.3% 0.7%
ORDINARY SHARES
Ordinary shareholders are entitled to participate in dividends and the proceeds on winding up of the company in proportion to the number of and amounts paid on the shares held. Every ordinary shareholder present at a meeting in person or by proxy is entitled to one vote on a show of hands or by poll.

Citigold Corporation LimitedPage 23
18. RESERVESCONSOLIDATED
2019$
2018$
CompositionAsset Revaluation Reserve 37,851,949 37,851,949Capital Profits Reserve 571,430 571,430Share Based Remuneration Reserve 834,163 834,163Total 39,257,542 39,257,542Asset Revaluation ReserveBalance at beginning of the year 37,851,949 37,851,949Revaluation (decrease)/ increase during the year - -Balance at end of Year 37,851,949 37,851,949Capital Profits ReserveBalance at beginning of the year 571,430 571,430Revaluation (decrease)/ increase during the year - -Balance at end of Year 571,430 571,430Share Based Remuneration ReserveBalance at beginning of the year 834,163 834,163Revaluation (decrease) / increase during the year - -Balance at end of Year 834,163 834,163
ASSET REVALUATIONThe asset revaluation reserve contains net revaluation increments and decrements arising on the revaluation of non-current assets.
CAPITAL PROFITSUpon disposal of re-valued assets, and increments standing to the credit of the asset revaluation reserve they are transferred to the capital profits reserve.
SHARE-BASED PAYMENT RESERVEComprises the fair value of options and performance share rights recognised as an expense.
19. ACCUMULATED LOSSES CONSOLIDATED
2019$
2018$
Accumulated losses at beginning of the year (152,095,400) (165,408,867)Net Profit/ (loss) attributable to members of the parent entity for the year (2,473,874) 13,313,467Total (154,569,274) (152,095,400)
20. FINANCIAL RISK MANAGEMENTThere have been no substantive changes in the Group’s exposure to financial instrument risks, its objectives, policies and processes for managing those risks or the methods used to measure them from previous periods unless otherwise stated in this note.
These are the principal financial instruments from which financial instrument risk arises:
- Trade receivables- Cash at bank- Trade and other payables
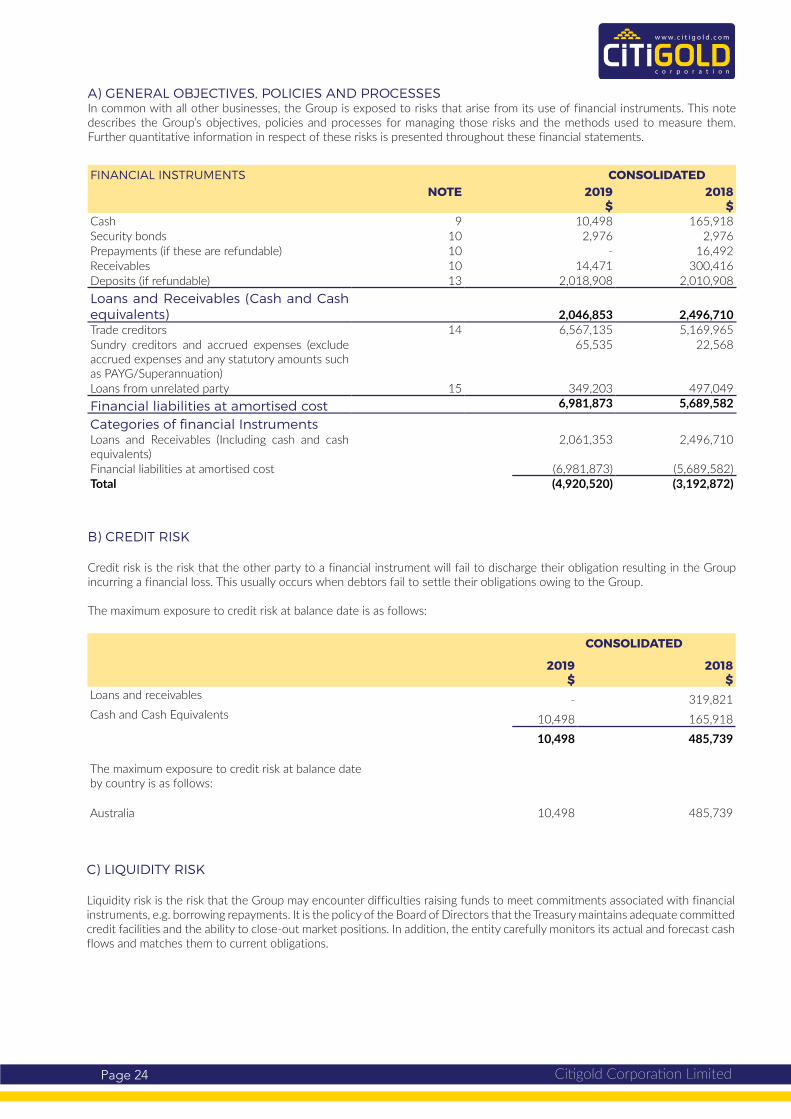
Citigold Corporation LimitedPage 24
FINANCIAL INSTRUMENTS CONSOLIDATEDNOTE 2019
$2018
$Cash 9 10,498 165,918Security bonds 10 2,976 2,976Prepayments (if these are refundable) 10 - 16,492Receivables 10 14,471 300,416Deposits (if refundable) 13 2,018,908 2,010,908Loans and Receivables (Cash and Cash equivalents)
2,046,853 2,496,710
Trade creditors 14 6,567,135 5,169,965Sundry creditors and accrued expenses (exclude accrued expenses and any statutory amounts such as PAYG/Superannuation)
65,535 22,568
Loans from unrelated party 15 349,203 497,049Financial liabilities at amortised cost 6,981,873 5,689,582
Categories of financial InstrumentsLoans and Receivables (Including cash and cash equivalents)
2,061,353 2,496,710
Financial liabilities at amortised cost (6,981,873) (5,689,582)Total (4,920,520) (3,192,872)
B) CREDIT RISK
Credit risk is the risk that the other party to a financial instrument will fail to discharge their obligation resulting in the Group incurring a financial loss. This usually occurs when debtors fail to settle their obligations owing to the Group.
The maximum exposure to credit risk at balance date is as follows:
CONSOLIDATED
2019$
2018$
Loans and receivables - 319,821Cash and Cash Equivalents 10,498 165,918
10,498 485,739
The maximum exposure to credit risk at balance dateby country is as follows:
Australia 10,498 485,739
C) LIQUIDITY RISK
Liquidity risk is the risk that the Group may encounter difficulties raising funds to meet commitments associated with financial instruments, e.g. borrowing repayments. It is the policy of the Board of Directors that the Treasury maintains adequate committed credit facilities and the ability to close-out market positions. In addition, the entity carefully monitors its actual and forecast cash flows and matches them to current obligations.
A) GENERAL OBJECTIVES, POLICIES AND PROCESSESIn common with all other businesses, the Group is exposed to risks that arise from its use of financial instruments. This note describes the Group’s objectives, policies and processes for managing those risks and the methods used to measure them. Further quantitative information in respect of these risks is presented throughout these financial statements.

Citigold Corporation LimitedPage 25
FINANCIAL LIABILITIES
CARRYING AMOUNT
$
CONTRACTUAL CASH FLOWS
$< 6 MTHS
$6- 12 MTHS $
1-3 YEARS $
> 3 YEARS $
Trade Creditors 6,567,136 6,567,136 2,254,524 - 4,312,612 -Term Loans 349,203 349,203 - - 349,203 -TOTAL 6,916,339 6,916,339 2,254,524 - 4,661,815 -
FINANCIAL LIABILITIES
CARRYING AMOUNT
$
CONTRACTUAL CASH FLOWS
$< 6 MTHS
$6- 12 MTHS $
1-3 YEARS $
> 3 YEARS $
Trade Creditors 5,169,965 5,169,965 2,022,345 - 3,147,620 -Term Loans 714,667 714,667 - - 714,667 -TOTAL 5,884,632 5,884,632 2,022,345 - 3,862,287 -
FINANCIAL ASSETS
CARRYING AMOUNT
$
CONTRACTUAL CASH FLOWS
$< 6 MTHS
$6- 12 MTHS $
1-3 YEARS $
> 3 YEARS $
Trade Debtors - - - - - -Other Receivables 5,154 5,154 5,154 - - -TOTAL 5,154 5,154 5,154 - - -
FINANCIAL ASSETS
CARRYING AMOUNT
$
CONTRACTUAL CASH FLOWS
$< 6 MTHS
$6- 12 MTHS $
1-3 YEARS $
> 3 YEARS $
Trade Debtors 38,338 38,338 38,338 - - -Other Receivables 18,686 18,686 18,686 - - -TOTAL 57,024 57,024 57,024 - - -
Maturity Analysis - Group 2019
Maturity Analysis - Group 2018
D) MARKET RISKMarket risk arises from the use of foreign currency financial instruments. It is a risk that the fair value or future cash flows of a financial instrument will fluctuate because of changes in foreign exchange rates (currency risk).
E) INTEREST RATE RISKAll loans have fixed interest rates, cash and cash equivalents and are invested at variable interest rates subjecting the interest amount received to interest rate risk. The balance in cash and cash equivalents will not drop regardless of the interest rate therefore there is no downside interest rate risk.
D) FINANCING ARRANGEMENTS
CONSOLIDATED - 2019 CARRYING AMOUNT
AUD
+1% PROFIT
$
- 1% PROFIT
$Cash and cash equivalents $ 10,498 105 (105)Tax charge of 27.5% (29) 29After tax increase/ (decrease) 76 (76)
CONSOLIDATED - 2018 CARRYING AMOUNT
AUD
+1% PROFIT
$
- 1% PROFIT
$Cash and cash equivalents $ 165,818 1,658 (1,658)Tax charge of 27.5% (456) 456After tax increase/ (decrease) 1,202 (1,202)
The above analysis assumes all other variables remain constant.
The above analysis assumes all other variables remain constant.

Citigold Corporation LimitedPage 26
CONSOLIDATED
2019$
2018$
Exploration expenditure commitments payable:- not later than one year - -- later than one year but not later than five years 2,583,400 4,612,722Total 2,583,400 4,612,722
21. COMMITMENTS
EXPLORATION EXPENDITURE COMMITMENTS
The consolidated entity and the Company have the following discretionary exploration expenditure commitments in respect of exploration to maintain current mineral rights of tenure. These commitments may be reduced by renegotiation upon renewal of the tenements, or by relinquishment of tenure.
23. FINANCIAL INSTRUMENTS
2019 2018CARRYING
AMOUNT$
FAIR VALUE
$
CARRYING AMOUNT
$
FAIR VALUE
$Trade and other receivables 17,477 17,176 319,821 313,826Cash and equivalents 10,498 10,498 165,918 165,918Trade and other payables (8,409,863) (8,009,393) (6,822,975) (6,300,069)Non-current assets (Note 15) (349,203) (332,574) (714,667) (659,896)
Exposure to credit, interest rate risk and currency risk arise in the normal course of the consolidated entity’s business. No hedging of this risk is undertaken by the consolidated entity.
FAIR VALUES
22. CONSOLIDATED ENTITIESCOUNTRY OF
INCORPORATIONOWNERSHIP
INTEREST2019
OWNERSHIP INTEREST
2018
DATE OF INCORPORATION
Charters Towers Gold Pty Ltd Australia 100 100 5 Oct 1995Charters Towers Mines Pty Ltd Australia 91.5 91.5 14 Mar 1984Charters Technology Pty Ltd Australia 100 100 13 Jan 2000Deeprock Mining Pty Ltd Australia 81.2 81.2 18 Jun 1984Gold Management Pty Ltd Australia 100 100 28 Jan 2000Gold Projects Pty Ltd Australia 100 100 25 Jan 2000Great Mines Pty Ltd Australia 100 100 19 Mar 1984MLXenergy Pty Ltd Australia 100 - 25 Jul 2018Queensland Gold Mines Pty Ltd Australia 100 100 27 Feb 2006
SECURITIES
Fair value is based on quoted market prices at the balance date without any deduction for transaction costs.
24. RELATED PARTY TRANSACTIONS (a) Parent entity
The ultimate parent entity within the Consolidated Group is Citigold Corporation Limited.
(b) Subsidiaries
Interests in subsidiaries are set out in Note 22.
(c) Key management personnel

Citigold Corporation LimitedPage 27
Disclosures relating to key management personnel are set out in Note 30.
(d) Loans to related parties
Citigold Corporation Limited has provided unsecured, interest free loans to its wholly owned subsidiaries. An impairment assessment is undertaken each financial year by examining the financial position of the subsidiary and the market in which the subsidiaries operate to determine whether there is objective evidence that the loan to each subsidiary is impaired. When such objective evidence exists, the Company recognises an allowance for the impairment.
(e) Loans from related parties
Citigold Corporation Limited has been provided unsecured, interest free loans from its wholly owned subsidiaries.
25. SUBSEQUENT EVENTSSince the end of the financial year the Company issued 241,537,612 shares to raise working capital. In addition, the existing loan facility has been increased to $700,000 and extended to June 2021.
26. CONTINGENT ASSEST / LIABILITYThere is currently no contingent asset or liability.
27. GOING CONCERNThe financial statements have been prepared on a going concern basis. The loss after tax for the Group was $2.47 million during the year ended 30 June 2019 and as of that date the group had current assets of $1.52 million and current liabilities of $4.41 million. At post balance date, the Company raised a total capital of $1.21 million.
28. SIGNIFICANT EVENTS AND TRANSACTIONSThere were no significant events or transactions during the financial year.
29. SEGMENT REPORTINGThe consolidated entity operates in the mining exploration industry. Details of the mining exploration activities are set out in the review of operations. Each company within the consolidated entity operates within the one geographic area, being Australia.
30. KEY MANAGEMENT PERSONNEL DISCLOSURES A) DIRECTORSThe following persons were Directors of Citigold Corporation Ltd during or since the financial year:
M.J. Lynch (Executive Chairman)J.J. Foley (Non Executive Director)A. Panchariya (Non Executive Director)S. Acharya (Non Executive Director)
B) OTHER KEY MANAGEMENT PERSONNELNo Key Management Personnel appointed during the financial year.
C) KEY MANAGEMENT PERSONNEL COMPENSATION
CONSOLIDATED
2019$
2018$
Short term employee benefits 888,471 705,130Post-employment benefits - 7,826
888,471 712,956
Further information regarding the identity of key management personnel and their compensation can be found in the Audited Remuneration Report contained in the Directors’ Report on pages 4 to 6 of this report.

Citigold Corporation LimitedPage 28
D) KEY MANAGEMENT PERSONNEL EQUITY INTEREST
Shares The number of shares held in the Company during the financial year by each Director and each of the Key Management Personnel of the Group, including related entities, is set out below:
2019 BALANCE AT THE START OF THE YEAR
EXERCISE OF OPTIONS
OTHER NET CHANGES DURING
THE YEAR
BALANCE AT THE END OF THE YEAR
DirectorsJ J Foley 7,307,879 - 7,142,859 14,450,738
M J Lynch 100,013,753 - 89,841,300 189,855,053
S Acharya - - - -
A Panchariya - - - -
Other Key Management Personnel- - - - -
2018 BALANCE AT THE START OF THE YEAR
EXERCISE OF OPTIONS
OTHER NET CHANGES DURING
THE YEAR
BALANCE AT THE END OF THE YEAR
DirectorsJ J Foley 7,307,879 - - 7,307,879
M J Lynch 88,347,084 - 11,666,669 100,013,753
S Acharya - - - -
A Panchariya - - - -
Other Key Management Personnel- - - - -
OPTIONS (a) Details of options provided as remuneration and shares issued on the exercise of such options, together with terms and
conditions of the options can be found in the detailed remuneration disclosures to the Directors Report.
(b) The number of options held in the Company during the financial year by each Director and each of the Key Management Personnel of the Group, including related entities, is set out below:
2019 BALANCE AT THE START OF
THE YEAR
EXERCISE OF OPTIONS
GRANTED DURING THE
YEAR AS REMUNERATION
OTHER CHANGES
DURING THE YEAR
BALANCE AT THE END OF
THE YEAR
VESTED AND EXERCISABLE
AT THE END OF THE YEAR
Directors No Directors held options in the group during the period
Other Key Management PersonnelNo Other Key Management Personnel held options in the group during the period
2018 BALANCE AT THE START OF
THE YEAR
EXERCISE OF OPTIONS
GRANTED DURING THE
YEAR AS REMUNERATION
OTHER CHANGES
DURING THE YEAR
BALANCE AT THE END OF
THE YEAR
VESTED AND EXERCISABLE
AT THE END OF THE YEAR
Directors No Directors held options in the group during the period
Other Key Management PersonnelNo Other Key Management Personnel held options in the group during the period

Citigold Corporation LimitedPage 29
PARENT ENTITY
2019$
2018$
Balance SheetCurrent assets 1,540,860 2,002,365Total assets 116,081,735 116,465,092Current liabilities 3,059,379 5,964,291Total Liabilities 4,048,428 3,357,299Shareholders’ equityIssued Capital 215,215,917 213,679,318Reserves 38,686,113 38,686,113Accumulated losses (141,868,723) (139,257,639)Profit and LossLoss / (profit) for the year (2,611,084) (14,160,021)Total comprehensive loss / (profit) (2,611,084) (14,160,021)
LOANS TO DIRECTORS OR KEY MANAGEMENT PERSONNELNo loans were granted to any directors or other key management personnel of the Company and the group during the period ending 30 June 2019.
TRANSACTION RELATING TO KEY MANAGEMENT PERSONNEL A Key Management Personnel has provided a $170,015 unsecured loan to the company at the interest rate of 12% per year.
31. PARENT ENTITY FINANCIAL INFORMATION
A) SUMMARY FINANCIAL INFORMATION
The individual financial statements for the parent entity show the following aggregate amounts:
B) GUARANTEES ENTERED INTO BY THE PARENT ENTITY
Citigold Corporation Limited has provided unsecured guarantees in respect of the provisions of financial assistance to some of the subsidiaries within the Group. No liability was recognised by Citigold Corporation Limited in relation to these guarantees as the likelihood of payment is not probable.
C) CONTINGENT LIABILITIES OF THE PARENT ENTITY
Refer to Note 26.
D) CONTRACTUAL COMMITMENTS BY THE PARENT ENTITY FOR THE ACQUISITION OF PROPERTY, PLANT AND EQUIPMENT.
There are no contractual commitments by the parent entity for the acquisition of property, plant and equipment.

Citigold Corporation LimitedPage 30
DIRECTORS’ DECLARATION
In the opinion of the directors of Citigold Corporation Limited
a) The financial statements and notes set out on pages 8 to 29 are in accordance with the Corporations Act 2001 including:
(i) complying with Accounting Standards, the Corporations Regulations 2001 and other mandatory professional reporting requirements; and
(ii) giving a true and fair view of the Company’s and consolidated entity’s financial position as at 30 June 2019 and of their performance, as represented by the results of their operations and their cash flows, for the financial year ended on that date; and
b) There are reasonable grounds to believe that the company will be able to pay its debts as and when they become due and payable; and
c) The remuneration disclosures included in pages 4 to 6 of the Directors’ Report (as part of the Remuneration Report), for the year ended 30 June 2019, comply with section 300A of the Corporations Act 2001; and
d) There are reasonable grounds to believe that the company and the group entities identified in Note 22 will be able to meet any obligations or liabilities to which they are or may become subject to by virtue of the Deed of Cross Guarantee between the Company and those group entities pursuant to ASIC Class Order 98/1418. The directors have been given the declarations by the chief executive officer and chief financial officer for the financial year ended 30 June 2019 pursuant to Section 295A of the Corporations Act.
This declaration is made in accordance with a resolution of the directors.
M J LynchChairman
J J FoleyDirector
Dated at Brisbane this 25th September 2019

Citigold Corporation LimitedPage 31
AUDITORS REPORT
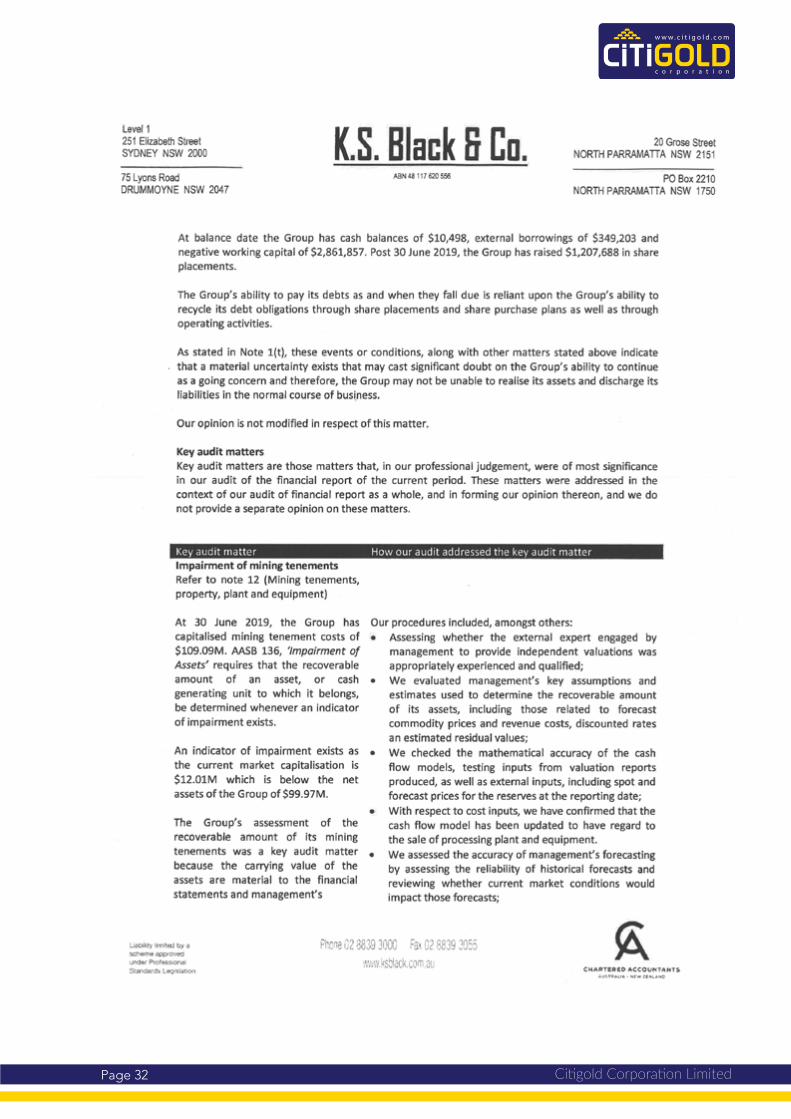
Citigold Corporation LimitedPage 32

Citigold Corporation LimitedPage 33

Citigold Corporation LimitedPage 34
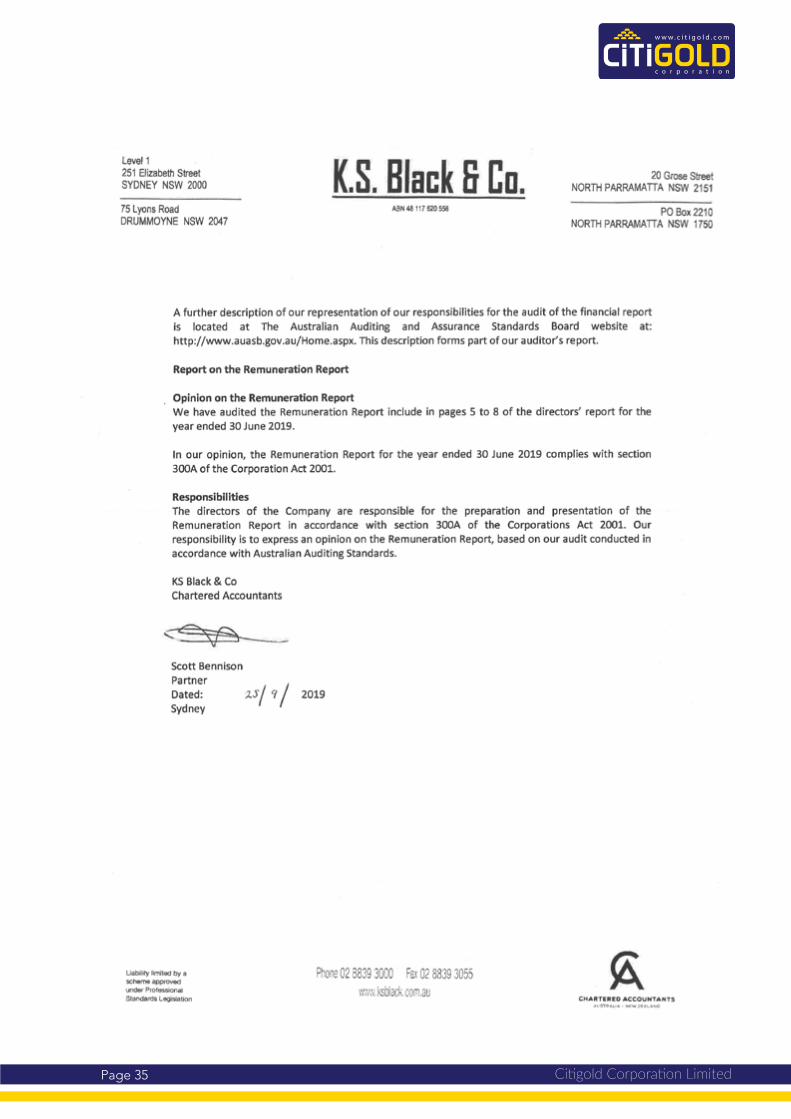
Citigold Corporation LimitedPage 35

Citigold Corporation LimitedPage 36
ASX ADDITIONAL INFORMATION1. SHAREHOLDINGS AS AT 23 SEPTEMBER 2019Distribution of Members and their Shareholdings
RANGE TOTAL HOLDERS NUMBER OF SHARES
1 - 1,000 246 43,0991,001 - 5,000 188 592,8305,001 - 10,000 192 1,553,42510,001 - 100,000 906 48,589,422100,001 1,341 2,350,394,433Total 2,873 2,401,173,209
1,399 Shareholders have less than marketable parcel of ordinary sharesVoting rights - all shares carry voting rights of one vote per share
Substantial Shareholdingsas at 23 September 2019NAME NUMBER OF SHARES % OF ISSUED SHARE
CAPITALR G F LAND SDN BHD 188,554,719 7.85AURORA INVESTMENTS LIMITED 186,813,741 7.78
Twenty Largest Shareholders as at 23 September 2019NAME NUMBER OF
SHARES% OF ISSUED
SHARE CAPITALCITICORP NOMINEES PTY LIMITED 252,411,382 10.51R G F LAND SDN BHD 188,554,719 7.85AURORA INVESTMENTS LIMITED 186,813,741 7.78K SERA SERA HOLDINGS PTY LTD 96,485,307 4.02PAL GROUP PTY LTD <KATHLEEN THERESE LYNCH A/C> 72,237,612 3.01J P MORGAN NOMINEES AUSTRALIA LIMITED 69,547,404 2.90CHARTERS CTO PTY LTD <THE RAY LARKIN S/F A/C> 54,150,000 2.26RHB SECURITIES SINGAPORE PTE LTD <CLIENTS A/C> 43,020,555 1.79MR JINHUA GUAN 36,000,000 1.50MR FRANCIS MARTIN RIGBY & MRS PORTIA ANASTASIA RIGBY <THE RIGBY SUPER FUND A/C> 34,928,572 1.45HSBC CUSTODY NOMINEES (AUSTRALIA) LIMITED 30,115,121 1.25G & J ARNOLD PTY LTD <G & J ARNOLD SUPER FUND A/C> 30,000,000 1.25MS MARIA IRINOUS 27,518,708 1.15LIM KOK 25,000,000 1.04MR NIALL LESTER-BLAIR NAND 21,034,309 0.88MR IAN MCDONALD FRASER & MS JILLIAN BACON <IAN FRASER SUPER FUND A/C> 17,000,000 0.71MR ANTHONY NORMAN BUIST 14,064,416 0.59STEVEN LIAN 13,000,000 0.54JAMES JOSEPH LYNCH 12,500,972 0.52MR IAN MCDONALD FRASER 12,500,000 0.52
1,236,882,818 51.52
2. RESTRICTED SECURITIESAt the time of this report there are no ordinary shares classified as restricted securities.
3. ON MARKET BUY BACKThere is no current on-market buy back.
4. SUMMARY OF MINING TENEMENTS & AREAS OF INTEREST AS AT 23 SEPTEMBER 2019The Consolidated Entity has a 100% control of the following mining tenements at Charters Towers:
Exploration Permit Minerals EPM 15964 EPM 15966 EPM 18465 EPM 18813 EPM 27287
Minerals Development Licences MDL 118 MDL 119 MDL 252
Mining Leases ML 1343 ML 1472 ML 1585 ML 10208ML 1344 ML 1488 ML 10005 ML 10222ML 1347 ML 1490 ML 10032 ML 10281ML 1348 ML 1491 ML 10042 ML 10282ML 1385 ML 1499 ML 10091 ML 10283ML 1398 ML 1521 ML 10093 ML 10284ML 1424 ML 1545 ML 10193 ML 10335ML 1430 ML 1549 ML 10196

CITIGOLD CORPORATION LIMITED86 Brookes Street, (PO Box 1133) Fortitude Valley, QLD, 4006, Australia
T: +61 7 3839 4041 E: [email protected] W: www.citigold.com
Cautionary Note: This release may contain forward-looking statements that are based upon management’s expectations and beliefs in regards to future events. These statements are subjected to risk and uncertainties that might be out of the control of Citigold Corporation Limited and may cause actual results to differ from the release. Citigold Corporation Limited takes no responsibility to make changes to these statements to reflect change of events or circumstances after the release.
Competent Person Statement:The following statements apply in respect of the information in this report that relates to Exploration Results, Mineral Resources and Ore Reserves: The information is based on, and accurately reflects, information compiled by Mr Christopher Alan John Towsey, who is a Corporate Member and Fellow of the Australasian Institute of Mining and Metallurgy. Mr Towsey is a Chartered Professional (Geology) and currently independent of Citigold Corporation Limited, having previously been a Director of the Company from 2014-June 2016. He has the relevant experience in relation to the mineralisation being reported on to qualify as a Competent Person as defined in the Joint Ore Reserves Committee (JORC) Australasian Code for Reporting of Exploration Results, Identified Mineral Resources and Ore Reserves 2012. Mr Towsey has consented in writing to the inclusion in this report of the matters based on the information in the form and context in which it appears.
For full details see Technical Report on the Mineral Resources and Reserves at www.citigold.com click Mining >Technical Reports >Mineral Resources and Reserves 2012
Diagramatic representation of the underground mining method proposed for the Central area of Charters Towers gold mine. It is a fully mechanised narrow width open stoping method, that was successfully used previously. Initially haulage to surface will be by truck then by vertical shaft as the ore tonnes increase

CORPORATE DIRECTORY
REGISTERED OFFICE & PRINCIPAL PLACE OF BUSINESS86 Brookes Street,[PO Box 1133]Fortitude Valley, QLD, 4006, AustraliaTelephone: +61 7 3839 4041Email: [email protected]: www.citigold.com
CHARTERS TOWERS MINE SITE10 Nagle Street [PO Box 10]Charters Towers, QLD, 4820, Australia
DIRECTORSMr Mark Lynch (Executive Chairman)Mr John Foley (Non-Executive Director)Mr Arun Panchariya (Non-Executive Director)Dr Sibasis Acharya (Non-Executive Director)
COMPANY SECRETARYMr Niall Nand