Embed Size (px)
Citation preview

2019 ANNUAL RESULTS PRESENTATION
March 2020

Disclaimer
⚫ The slides/materials used in this presentation are confidential and for reference only. No person shall remove, directly or indirectly reproduce,
distribute, spread or send the slides/materials used in this presentation or any part thereof to any person for any purpose (whether or not he/she
and you belong to the same institution). In particular, no person shall, in any form, reproduce, distribute, spread or send any of the contents in
this presentation directly or indirectly in any way to the United Kingdom, Australia, the People’s Republic of China, the United States, Canada or
Japan, or to any “American” (as defined in accordance with the S Rules in the latest updated US 1933 Securities Act (“1933 Securities Act ”)).
⚫ Any of the slides/materials used in this presentation or any information contained therein will not constitute any offer for sale or any subscription
or purchase of securities. Any part of the slides/materials used in this presentation will not constitute a basis for any contract, undertaking or
investment, and any contract, undertaking or investment shall not rely on any part of the slides/materials used in this presentation.
⚫ This presentation may contain forward-looking statements. These forward-looking statements are based on a series of assumptions regarding the
operation of the Bank and some factors beyond the control of the Bank. Such assumptions may have significant risks and are affected by
unknown factors, and such factors may cause actual results to differ materially from those in the forward-looking statements in this document.
The Bank is not responsible for updating the forward-looking statements regarding the events or circumstances occurring after the date of the
presentation.
⚫ The information expressed or included in this presentation only reflects the situation as of the date of the presentation and is not updated as to the
significant progress occurring after the date of the presentation. This presentation and the information contained therein shall not be deemed or
relied upon as a complete and comprehensive analysis of the Bank’s finances, operations or prospects. Some of the information is still in the draft
stage.
⚫ This document also contains a number of information and statistics concerning China’s banking sector, which is obtained from an external
unofficial source by the Bank and has not been independently audited. The Bank can not guarantee that such source is of the same standards as
those of other industries or are comparable to the accuracy and completeness of the relevant information in other industries. You shall not heavily
rely on any statements concerning China’s banking sector in this presentation. The information contained in this presentation is not a due
diligence review and shall not be considered as a due diligence review. The information contained in this presentation has not been verified by an
independent third party. No person has made any express or implicit representations or warranties with respect to the impartiality, accuracy,
completeness or correctness of the information and opinions contained in this presentation, and no one shall rely on the impartiality, accuracy,
completeness or correctness of such information or opinions. The Bank, its advisers, or their respective directors, senior executives, employees,
agents or advisors are not responsible for this document or its contents and are not liable for any loss arising from any use of this document or its
contents (due to negligence or any other reason) or any loss arising out of or in connection with this document in any other way. The above
persons do not have any fiduciary responsibility for this presentation to you.
2
Note:1. The data of this material are in compliance with the IFRSs, and the currency is RMB unless otherwise stated.
2. Some of the data have been rounded up according to the Annual Report.

2019Performance
2019Business Highlights
2020Outlook
3
Contents
0 1 0 2 03

2019 Performance
4
0 1

(in RMB100 million) 31 Dec. 2019 31 Dec. 2018 Change
Total assets 102,167.06 95,162.11 7.36%
Total loans to customers 49,741.86 42,768.65 16.30%
Total liabilities 96,718.27 90,408.98 6.98%
Customer deposits 93,140.66 86,274.40 7.96%
31 Dec. 2019 31 Dec. 2018 Change
Core tier 1 capital adequacy ratio 9.90% 9.77% 13bps
NPLs ratio 0.86% 0.86%
Allowance to NPLs ratio 389.45% 346.80% 42.65ppts
(in RMB100 million) 2019 2018 Change
Operating income 2,771.16 2,612.45 6.08%
Net fee & commission income 170.85 144.34 18.37%
Net profit 610.36 523.84 16.52%
Key Financial Indicators
5

• Total assets and liabilities grew by and
respectively compared to prior year end.
16.30%• YoY increase of the balance of loans
Balance of loans
(in RMB trillion)
Total assets
and liabilities
(in RMB trillion)
9.04
9.67 9.52
10.22
2018 2019
Liabilities Assets
7.96%• YoY increase of customer deposits
Balance of deposits
(in RMB trillion)
8.63 9.31
2018 2019
7.36% 6.98%
2019 Performance
4.28 4.97
2018 2019
1.68%
Debt securities issued
1.00%
Financial assets sold
under repurchase
agreements
1.02%
Note: Other liabilities consist of deposits from banks and other financial institutions, placements from banks
and other financial institutions, dividend payable, provisions, employee benefits payable, lease liabilities,
agency business liabilities, tax payable and other liabilities.
96.30%
Other liabilities
Customer deposits
6
• Composition of Liabilities

12.31% 13.10%
2018 2019
0.57%0.62%
2018 2019
79bps• YoY increase of return on weighted
average equity
Return on weighted
average equity
• YoY increase of return on average total
assets
Return on average
total assets
5bps
• YoY increase of operating income 6.08%
Operating income
(in RMB100 million)
2,612.45 2,771.16
2018 2019
523.84 610.36
2018 2019
• YoY increase of net profit 16.52%
Net profit
(in RMB100 million)
7
2019 Performance

• Credit rating
S&P
A(stable)
Moody's
A1(stable)
Fitch
A+(stable)
AAAspc(stable)
S&P Global
(China)
The Banker (UK)Ranked 22nd in terms of total
assets among Top 1000 World
BanksForbesRanked 60th among the World’s
2000 Largest Public Companies Fortune ChinaRanked 37th in terms of
operating income among
China Top 500 Companies
Completion ofJoint stock reform, introduction
of strategic investors and
A-share and H-share IPO
The largest A-share IPO in
nearly a decade
CCXI
AAA(stable)
57.60% 56.29%
2018 2019
1.31ppts• YoY decrease of cost to income ratio
Cost to income ratio
• Profitability
2.50%
Net interest spread 2.45%
Net interest margin
8
2019 Performance

Business Highlights
9
2019 Business Highlights02

1.69 2.02
2018 2019
5,449.92 6,531.85
2018 2019
• YoY increase of the balance of inclusive loans
to small and micro enterprises
• YoY increase of the balance of
consumer loans
Balance of consumer
loans
(in RMB trillion)
19.85%
Balance of inclusive loans
to small and micro
enterprises
(in RMB100 million)
19.13%
• YoY increase of the balance of
agriculture-related loans 8.83%
Balance of agriculture-
related loans
(in RMB trillion)
1.16 1.26
2018 2019
1.55 1.74
2018 2019
• YoY increase of the balance of
corporate loans12.12%
Balance of corporate
loans
(in RMB trillion)
10
2019 Business Highlights

5.78 6.05
2018 2019
• Number of personal customers 605 million
Number of
personal customers
(100 million)
2.18 2.60
2018 2019
Number of
mobile banking customers
(100 million)
260 million
2.77 3.18
2018 2019
Number of
E-banking customers
(100 million)
318 million
• Composition of deposits
Note: Other deposits consist of remittance payable, credit card deposits and outbound remittance, etc.
11
• Number of mobile banking customers
• Number of E-banking customers
12.12%
87.86%
Corporate Deposits0.02%
Other Deposits
Personal Deposits
2019 Business Highlights

18.58%• YoY increase of the balance of
personal loans
Balance of
personal loans
(in RMB trillion)
2.32
2.75
2018 2019
• Sticking to the strategic positioning &
consolidating advantages in retail banking7.96%
• YoY increase of operating income from
personal banking
Operating income from
personal banking
(in RMB100 million)
1,636.11 1,766.36
2018 2019
9.58%• YoY increase of the balance of
personal deposits
Balance of
personal deposits
(in RMB trillion)
7.47 8.18
2018 2019
• Accelerating the transformation to a new retail bank
featuring data-driven, channel coordination, interaction
between wholesale and retail, and efficient operation, and
effectively promoting the launch of differentiated retail
banking strategic positioning, with the AUM exceeding
RMB10 trillion.
• Transforming to the Internet scenario-based services, and
further building multi-dimensional financial and life
scenarios, with a year-on-year increase of 31.53% for
monthly active mobile banking users.
12
2019 Business Highlights

13
Deepening the transformation
and development
• Reforming the organizational
structure of the Bank, with smooth
and efficient operation of all
departments and institutions
• Expanding the scope for talents
selection
• Recruiting senior management
personnel internally and externally
to establish a talent pool for
outstanding management personnel
• Building a talent pool for
management personnel and selecting
outstanding young talents at tier-1
branches
• Accelerating the building of a high-
quality and professional team of
talents
Enhancing the technologicalempowerment
• Continuously promoting the
development of financial technology
across the Bank
• Advancing the regular recruitment
of IT talents and strengthening the
building of an IT talents team
• Accelerating financial technology
innovation and the application of
new technologies, and setting up a
technological innovation fund
• Investing more in information
technology
• Strengthening the role of technology
in supporting the business, and
greatly improving the operational
efficiency
2019 Business Highlights

• NPLs ratio keeping the same as at the end of last year
NPLs ratio
0.86% 0.86%
2018 2019
• Capital adequacy ratio
Core tier 1 capital adequacy ratio 9.90%
Tier 1 capital adequacy ratio 10.87%
Capital adequacy ratio 13.52%
346.80% 389.45%
2018 2019
• Allowance to NPLs ratio increased
from the end of last year
Allowance to
NPLs ratio
42.65ppts
• Asset quality
1.52%
Non-performing loans/loans
overdue for over 90 days 1.48
Proportion of NPLs + special
mention loans
14
2019 Business Highlights

• Keeping sound growth
17-19 CAGR of operating income 11.01%
13.11%
17.06%
3.84ppts• The increase of loan to deposit ratio
Loan to deposit
ratio
49.57%53.41%
2018 2019
144.34 170.85
2018 2019
• YoY increase of net fee & commission
income
Net fee &
commission income
(in RMB100 million)
18.37%
2,309.98
3,110.07
2018 2019
• YoY increase of credit cards in circulation
Credit cards in
circulation
(10,000 cards)
34.64%
17-19 CAGR of net profit
17-19 CAGR of loans
15
2019 Business Highlights

16
2020 Outlook03

17
Doing a good job in the
COVID-19 prevention and
control, and resuming
production in time; making a
comprehensive follow-up and
inspection of the asset quality
by business lines and types of
customers
Making every effort to empower the Bank with transformation, technology, talent and organization, so as to open up a new chapter for the building of a first-tier modern commercial bank
Shouldering the Responsibility as a State-owned Bank and Supporting Society with High-quality Financial Services
Carrying out customer
maintenance and marketing
through a variety of online means
of "contactless services"
Launching the cloud customer
manager studio to empower
outlets; strengthening the remote
customer service ability by
improving services on electronic
channels
Adhering to the business
philosophy of high-quality,
customer-centered and value
creation-oriented development
2020 Outlook

18
Comprehensively speeding up business
transformation to improve the operation
and development
2020 Outlook
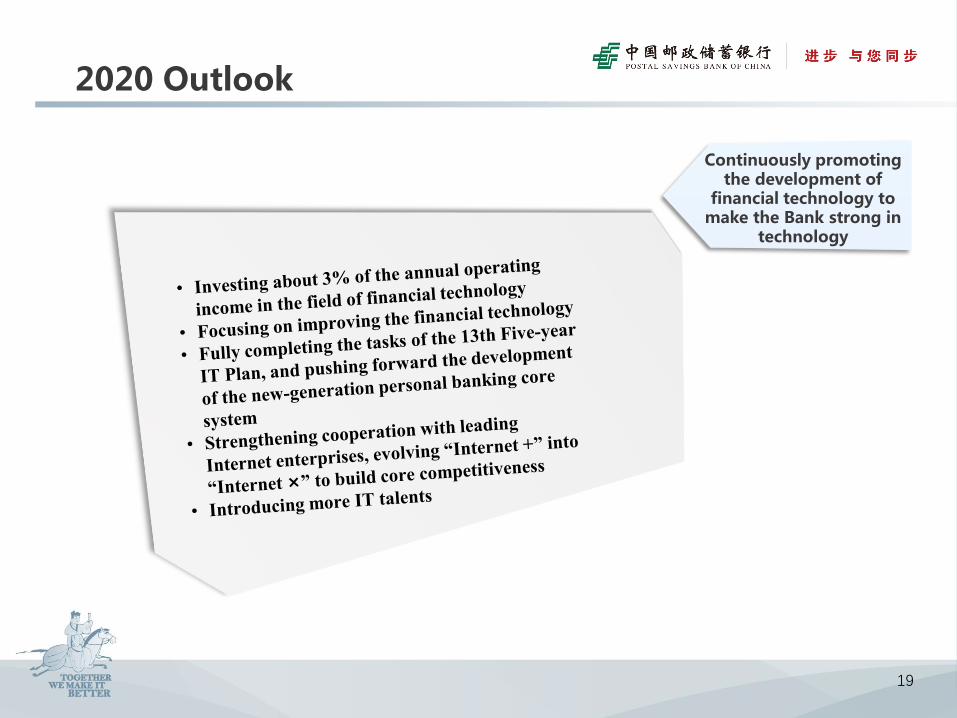
Continuously promoting the development of
financial technology to make the Bank strong in
technology
19
2020 Outlook

Continuously strengthening risk
management to safeguard bottom line
of risks
20
2020 Outlook

Deepening institutional and mechanism reform in all aspects to unleash the vitality of development
21
2020 Outlook

Copyright © 2019 Postal Savings Bank of China.
Without the consent of Postal Savings Bank of China, no one shall copy or edit the materials.
THANKS!