Embed Size (px)
Citation preview
2019 Citizen Survey
Summary & Findings | Feb. 11, 2020
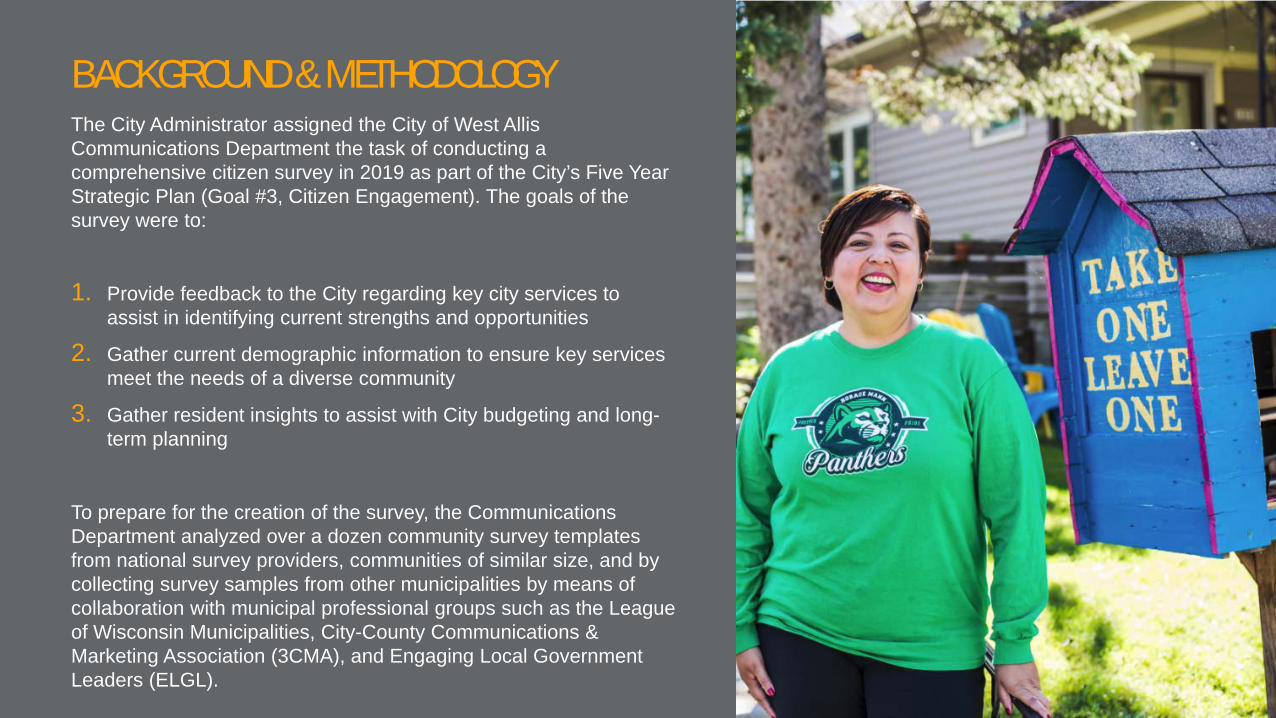
The City Administrator assigned the City of West Allis Communications Department the task of conducting a comprehensive citizen survey in 2019 as part of the City’s Five Year Strategic Plan (Goal #3, Citizen Engagement). The goals of the survey were to:
1. Provide feedback to the City regarding key city services to assist in identifying current strengths and opportunities
2. Gather current demographic information to ensure key services meet the needs of a diverse community
3. Gather resident insights to assist with City budgeting and long-term planning
To prepare for the creation of the survey, the Communications Department analyzed over a dozen community survey templates from national survey providers, communities of similar size, and by collecting survey samples from other municipalities by means of collaboration with municipal professional groups such as the League of Wisconsin Municipalities, City-County Communications & Marketing Association (3CMA), and Engaging Local Government Leaders (ELGL).
BACKGROUND & METHODOLOGY
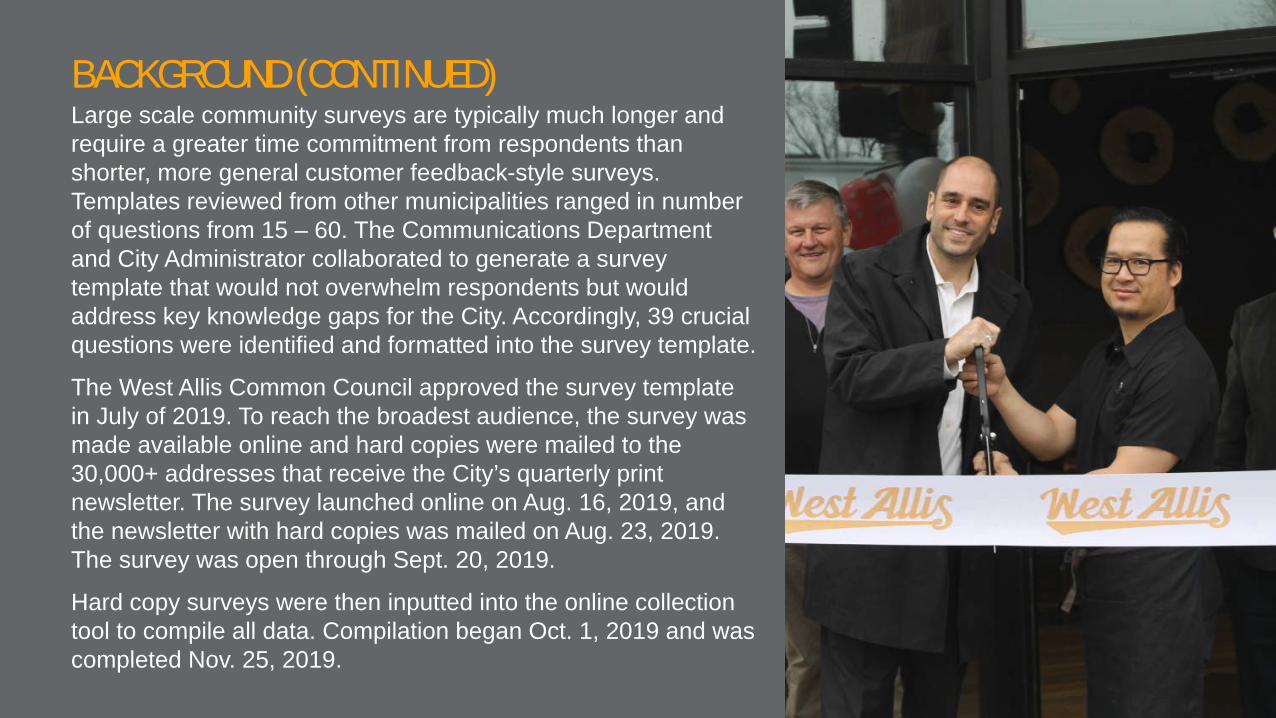
Large scale community surveys are typically much longer and require a greater time commitment from respondents than shorter, more general customer feedback-style surveys. Templates reviewed from other municipalities ranged in number of questions from 15 – 60. The Communications Department and City Administrator collaborated to generate a survey template that would not overwhelm respondents but would address key knowledge gaps for the City. Accordingly, 39 crucial questions were identified and formatted into the survey template.
The West Allis Common Council approved the survey template in July of 2019. To reach the broadest audience, the survey was made available online and hard copies were mailed to the 30,000+ addresses that receive the City’s quarterly print newsletter. The survey launched online on Aug. 16, 2019, and the newsletter with hard copies was mailed on Aug. 23, 2019. The survey was open through Sept. 20, 2019.
Hard copy surveys were then inputted into the online collection tool to compile all data. Compilation began Oct. 1, 2019 and was completed Nov. 25, 2019.
BACKGROUND (CONTINUED)

To execute the survey in a cost-effective manner, the City opted to conduct the survey in-house rather than use a third party survey company, an estimated savings of over $21,000. This also allowed for greater customization of the survey questions in order to gather relevant data.
To save postage expenses, the survey was mailed with the fall issue of the City’s print newsletter, reaching over 30,000 addresses. This allowed for a cost savings of over $6,500 on separate postage as this expense was already planned for as part of the scheduled newsletter mailing.
Printing the survey for mailing cost the City $7,721.21. This was the only major expense associated with this project.
Costs & Resources By leveraging business reply mail (BRM), the City only paid postage for surveys that were returned, a savings of over $14,000 vs. the City sending postage pre-paid stamped envelopes, many of which would not have been returned.

5
2,848 RESPONSES 52% ONLINE 48% MAILED BACK

6
81% COMPLETION
RATE

7
AVERAGE RESPONSE TIME:
19 MINUTES

Key Findings: Strengths Resident Access to Technology Access to the internet is very high in West Allis, with over 90% of respondents having internet at home (even among those age 55+, 87% have internet access at home). 82% of respondents own smartphones. The City’s website and e-newsletter are survey respondents’ second and third preferences, respectively, to receive City news and information, with 51% of respondents preferring the website and nearly 40% preferring e-news. The City is on the Right Track 64% of respondents agree the City is moving in a positive direction. 69% are proud to call West Allis home, and 80% rate the City as a “good” or “excellent” place to live. Residents Are Satisfied with Many City Services, Particularly Public Works & Public Safety 60% of respondents are “very satisfied” or “satisfied” overall with City services. 57% are “very satisfied” or “satisfied with the ease of accessing City services. 51% of respondents are “very satisfied” or “satisfied” with customer service provided by City staff. 84% are “very satisfied” or “satisfied” with trash and recycling services, and 83% are “very satisfied” or “satisfied” with police, fire, and ambulance services (though still more emphasis on public safety services was requested). Parks Performing 77% of respondents reported being “very satisfied” or “satisfied” with the quality of West Allis parks and park facilities.

Key Findings: Opportunities Reviewing Business Start-Up Process and Plan for Growth of In-Demand Businesses Only 7% of respondents were “satisfied” or “very satisfied” with the ease of opening a business in West Allis. 58% of respondents suggest “supporting new business growth” as a high priority in the next three years. 59% of respondents requested “independent shops/retail” as the preferred businesses the City should make an effort to attract and retain, and 41% suggest “providing entertainment/arts/cultural opportunities” as most important in ten years. Permitting Process Problems Only 20% of respondents were “satisfied” or “very satisfied” with the ease of permitting for residential projects, with just 6% “satisfied” or “very satisfied” with the ease of permitting for commercial projects. Roads & Infrastructure Warrant Focus The majority - 68% - of respondents requested that the City focus on maintenance of City streets, sidewalks, and infrastructure in the next two years. Over 40% of respondents noted they were willing to pay more to support pothole repair and road resurfacing and reconstruction. Planning for Changing Demographics While 57% of survey respondents noted West Allis is a “good” or “excellent” inclusive, welcoming community, only 39% were “satisfied” or “very satisfied” with the City’s ability to adapt to the community’s changing demographics.
10
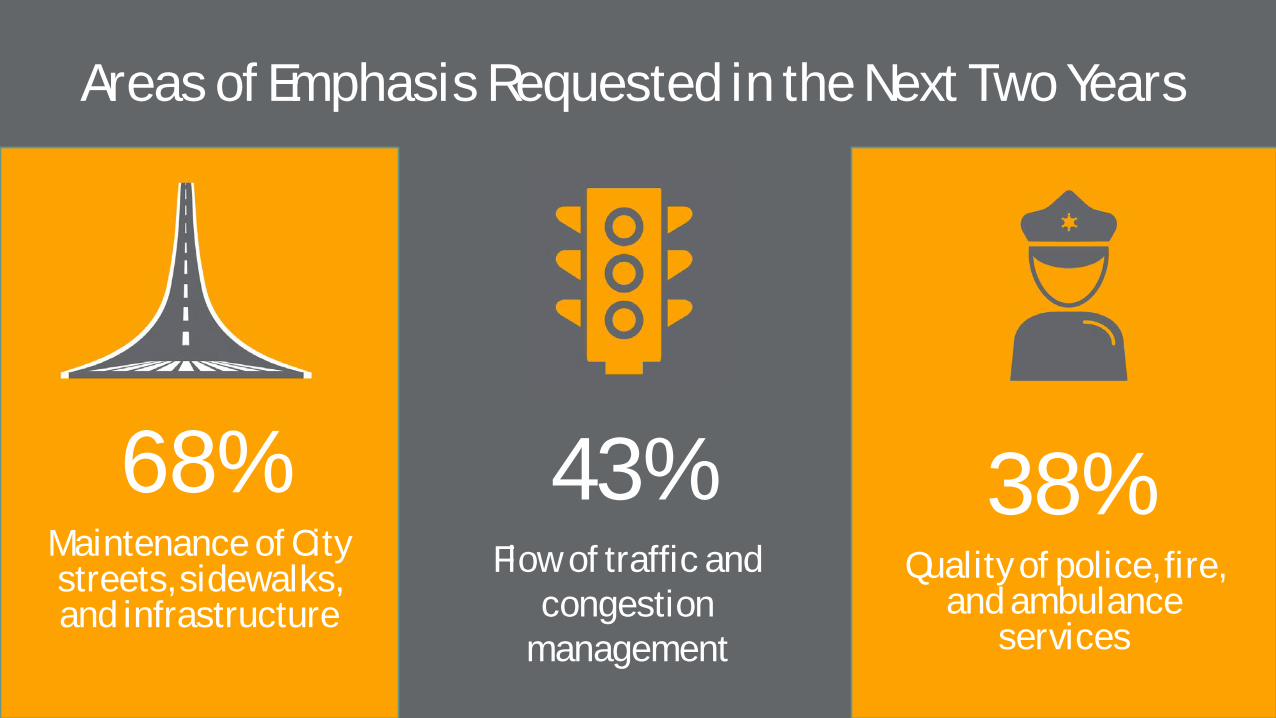
Areas of Emphasis Requested in the Next Two Years
38% Quality of police, fire,
and ambulance services
43% Flow of traffic and
congestion management
68% Maintenance of City streets, sidewalks, and infrastructure

Survey Demographics
Respondent Make-Up & Access to Technology

55% of respondents have lived in West Allis for
20+ years 85% own their
current residence
28% of respondents under age 44
72% age 45+
35% of respondents
report household incomes under
$25,000 27% have earned
bachelor’s degrees
95% of respondents white or Caucasian
13
The 2019 City of West Allis Citizen Survey was the first of its kind, other than national Census surveys, to attempt to gather detailed demographic information about the West Allis community since the creation of the 2017 Fact Book as part of planning for the creation of the City’s Five Year Strategic Plan. On average, respondents to the 2019 Citizen Survey spent 19 minutes on the survey, much longer than the five minutes online survey tool SurveyMonkey suggests surveys be to keep respondents engaged, but less than the estimated time of completion of 30 minutes. Indeed, the length of the survey was criticized by many respondents. However, the seemingly exhaustive 39 question survey tool was shorter than many other community survey templates of its type, as benchmarked prior to the creation of the City of West Allis’ survey tool. Despite its length, 81% of respondents completed the
entire survey. With an estimated population of 59,492 as of 2017 U.S. Census data, 4.8% of West Allis residents responded to the survey, with the majority (72%) being over age 45. 55% of respondents age 45+ had resided in West Allis for more than 20 years. For respondents under age 44, most (58%) had resided in West Allis for nine years or less. 55% of all respondents reported residing in West Allis for more than 20 years. Overall, respondents were evenly represented among the City of West Allis’ five districts, with the most respondents from District 4 (25%) and the least from District 1 (17%).
DEMOGRAPHICS
14
The 2017 City of West Allis Fact Book and U.S. Census data revealed that West Allis has a median resident age of 38 and a nearly 20% non-white population. Yet the majority of Citizen Survey respondents were age 45+ (72%) and white (95%). 99% of respondents reported English as their first language. 85% of respondents own their current residence, while U.S. Census data suggests 53% of all West Allis residents own their homes. The majority of respondents reported a household income of less than $75,000, aligning with U.S. Census data, which reports a median household income in 2017 for West Allis of $47,669. Currently, the U.S. poverty limit for a household of four is $25,750. Approximately 35% of survey respondents reported a household income of less than $25,000, much higher than the U.S. Census
reported poverty rate for West Allis of 13%. Respondents age 44 and younger reported higher incomes than their older counterparts, with 53% of this cohort reporting household incomes of $75,000 or more. By comparison, only 34% of respondents over age 45 reported incomes topping $75,000. 27% of respondents noted they had earned bachelor’s degrees, with 14% having earned a graduate degree or higher. 19% received no additional higher education after earning high school diplomas, and 18% completed some college but did not complete their schooling to earn a degree. 40% of respondents under age 44 had earned a bachelors degree, while only 22% of those over 45 had done so.
DEMOGRAPHICS (CONTINUED)

15
62% Female 35% Male .11% Third Gender/Non-Binary
4% Members of LGBTQA
Community
20% Allies of LGBTQA
Community

16
62% of respondents identified their gender as female, while 35% identified as male. .11% (three respondents) identified as third gender or non-binary. Neither the U.S. Census data or 2017 Fact Book provided any insights into the Lesbian, Gay, Bisexual, Transgender, Queer/Questioning, Ally (LGBTQA) community in West Allis, and the 2019 Citizen Survey did. As this population faces unique issues related to economics, employment, nutrition, healthcare and mental healthcare access, these questions were included to aid the City in reviewing available services provided to this community. 4% of respondents identified as members of this
community, while 20% identified as allies, or positive supporters, of this community. The ally number increased significantly among younger respondents, with 35% of those under 44 identifying as allies, vs. only 15% among respondents 45 and over. Reuters reported in 2019 that 4.5% of U.S. adults identify as lesbian, gay, bisexual, or transgender, and the respondent numbers from the 2019 Citizen Survey align with this national data. It is worth noting that all three respondents who identified as third gender/non-binary were under age 44; and of respondents 44 and younger, a higher percentage, 6.51%, identified as members of the LGBTQA community.
DEMOGRAPHICS (CONTINUED)

17
90% of respondents have internet
access at home
82% of respondents own
smartphones
87% of respondents 55+
have internet at home
18
The 2019 Citizen Survey also revealed encouraging data about residents’ access to the internet and technology.
• Over 90% of respondents reported having internet access at home
• 87% of those 55+ reported having internet in their home. 82% of all respondents own smartphones
• 71% of those 55+ own smartphones
• Of those who mailed back surveys, 84% have internet access at home
This supports the City’s continued efforts to offer
more services online (Strategic Goal #3, Citizen Engagement, Virtual City Hall), as the vast majority of residents have readily available access to the internet.
91% of respondents over age 45 reported having no children under age 18 currently residing in their households. 50% of those under 44 reported the same. Respondents age 44 and under were more likely to have minors residing in their households, with 50% of these households having children under age 18 at home, vs. only 9% of households headed by adults age 45 and over.
Demographics (Continued)

Quality of Life, Sense of Safety, and Overall Satisfaction with Services
67% “Satisfied” or “Very
Satisfied” with quality of life in
West Allis

21
88% Feel “very safe” or “safe” walking in neighborhoods during the day
47% Feel “very safe” or “safe” walking in
neighborhoods after dark

22
69% “West Allis is a place I
am proud to call home.”
64% “West Allis is a city
moving in a positive direction.”
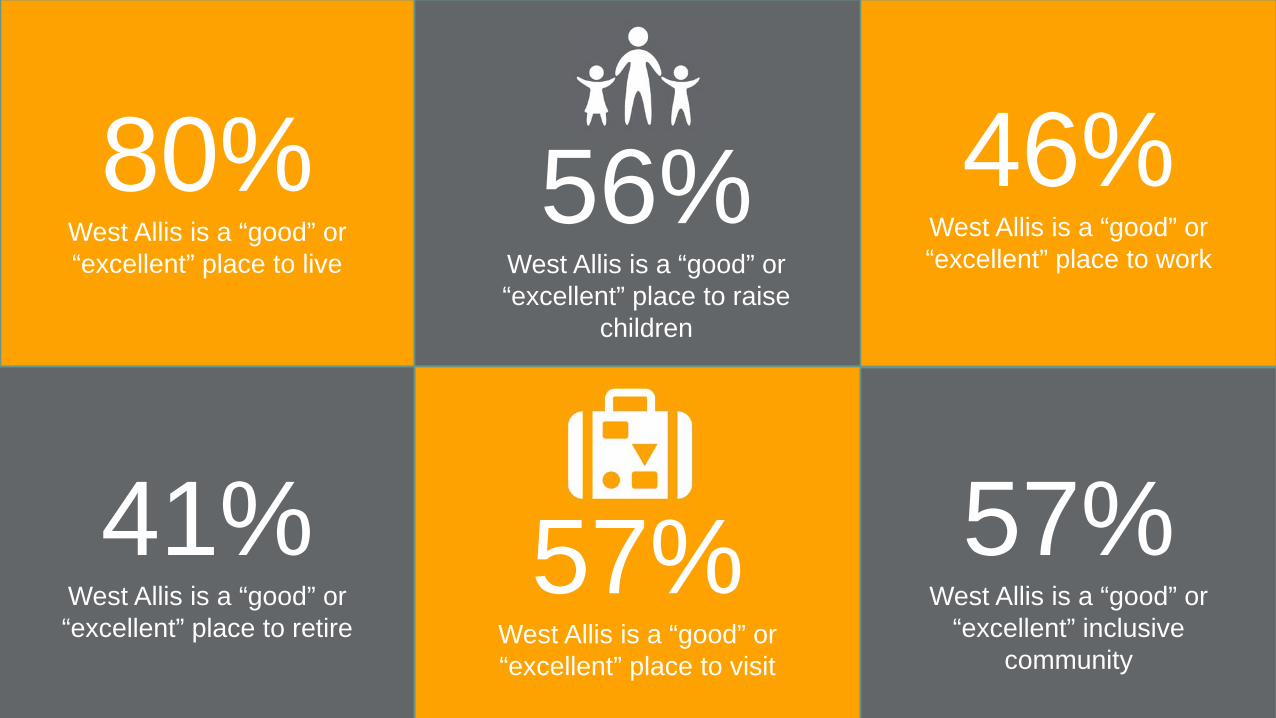
80% West Allis is a “good” or “excellent” place to live
56% West Allis is a “good” or “excellent” place to raise
children
46% West Allis is a “good” or “excellent” place to work
41% West Allis is a “good” or “excellent” place to retire
57% West Allis is a “good” or “excellent” place to visit
57% West Allis is a “good” or
“excellent” inclusive community
24
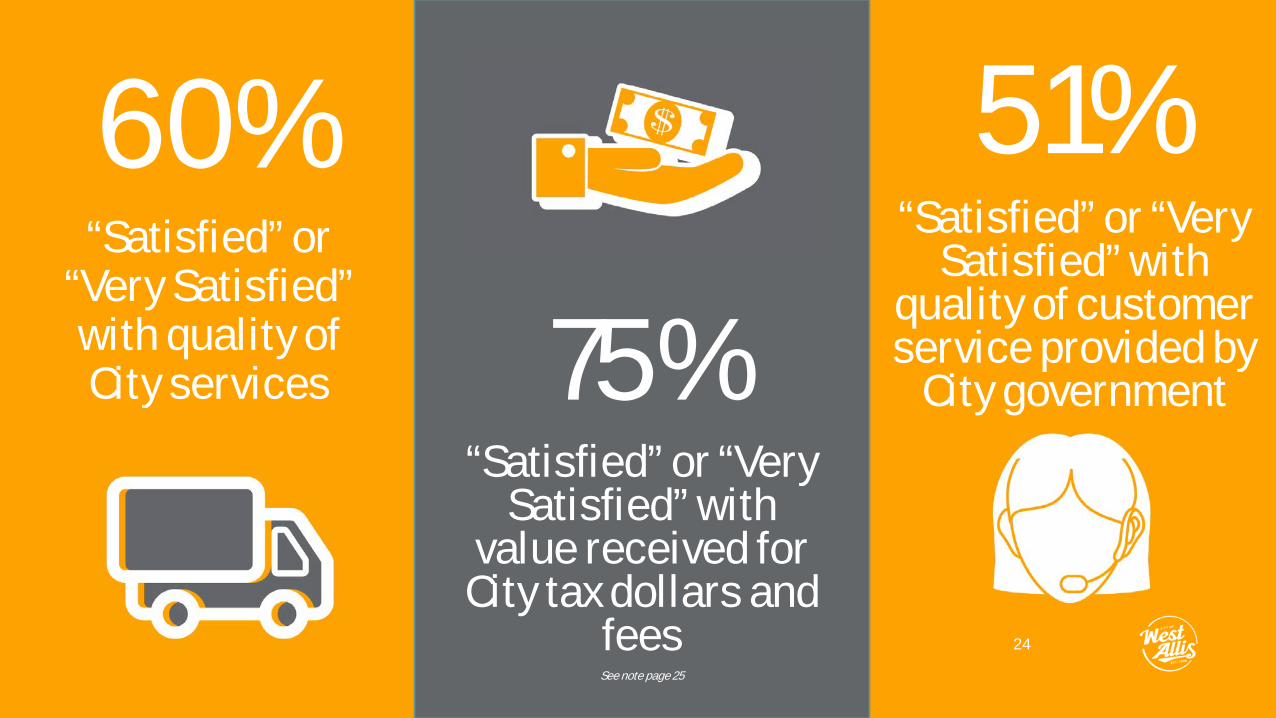
60% “Satisfied” or
“Very Satisfied” with quality of City services 75%
“Satisfied” or “Very Satisfied” with
value received for City tax dollars and
fees See note page 25
51% “Satisfied” or “Very
Satisfied” with quality of customer service provided by
City government
25
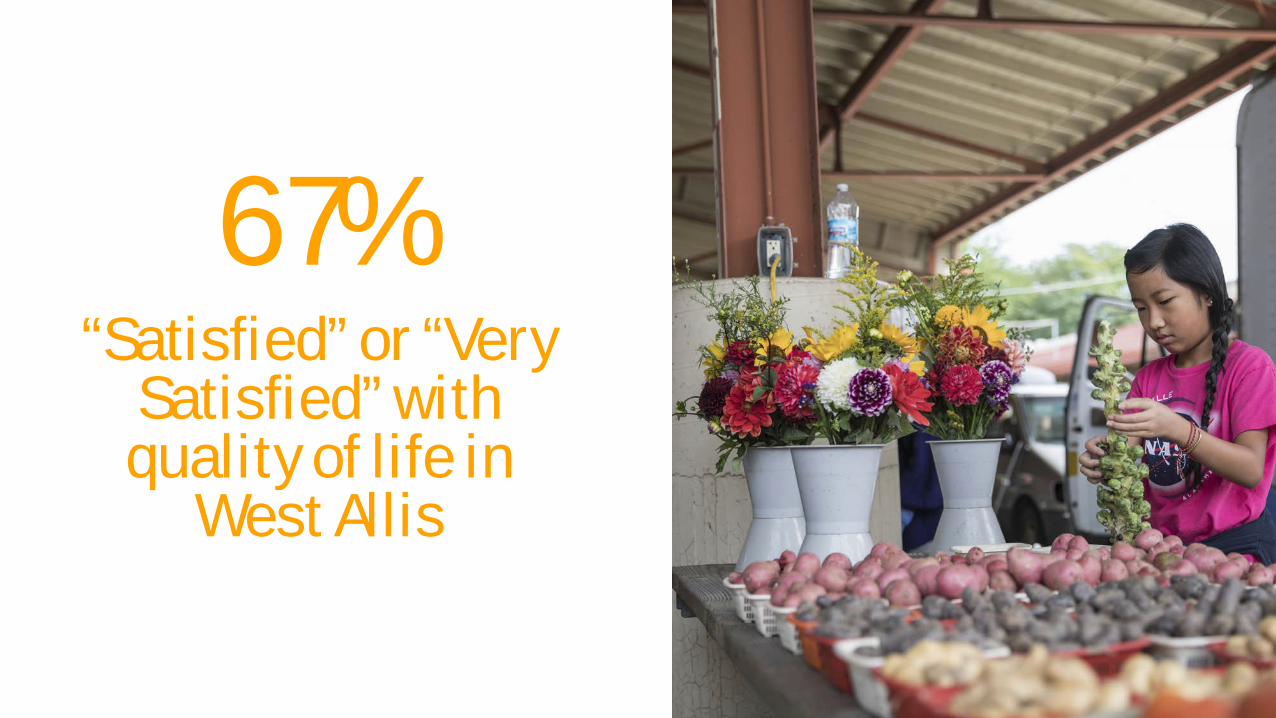
Overall, survey respondents reported satisfaction with City services, tax dollars paid for City services, and quality of life. 67% were “very satisfied” or “satisfied” with overall quality of life in West Allis. Younger respondents under age 44 were more satisfied with quality of life, as 71% of these respondents reported being “very satisfied” or “satisfied” vs. 64% of adults 45 or older.
64% of respondents over age 45 agreed the City (is) moving in a positive direction, yet 74% of those under 44 agreed. Overall, 64% of respondents agreed the City is moving in a positive direction.
60% of all respondents reported satisfaction with City services, and 75% were “very satisfied” or “satisfied” with the value they receive for City taxes paid (Note: two questions in the survey, questions 17 and 36, addressed satisfaction with tax dollars paid and services rendered. The two questions were phrased differently and accordingly had different results, with only 49%
“satisfied” or “very satisfied” in question 17 and 75% “satisfied” or better in question 36).
52% of survey respondents reported satisfaction with the City’s ability to plan for growth. 50% were satisfied with the appearance of West Allis, while 46% were satisfied with the image of the community. Although 57% agreed West Allis is a “good” or “excellent” community when it comes to inclusivity, just 39% of all respondents were “very satisfied” or “satisfied” with the City’s ability to adapt to changing demographics.
Respondents reported lower rates of satisfaction with local leadership. Only 50% of respondents reported being satisfied with the leadership of elected officials, while fewer still – 42% - were “satisfied” or “very satisfied” with the leadership provided by City department leaders. 43% were “satisfied” or “very satisfied” with the ease of accessing elected officials.
SATISFACTION WITH SERVICES & QUALITY OF LIFE
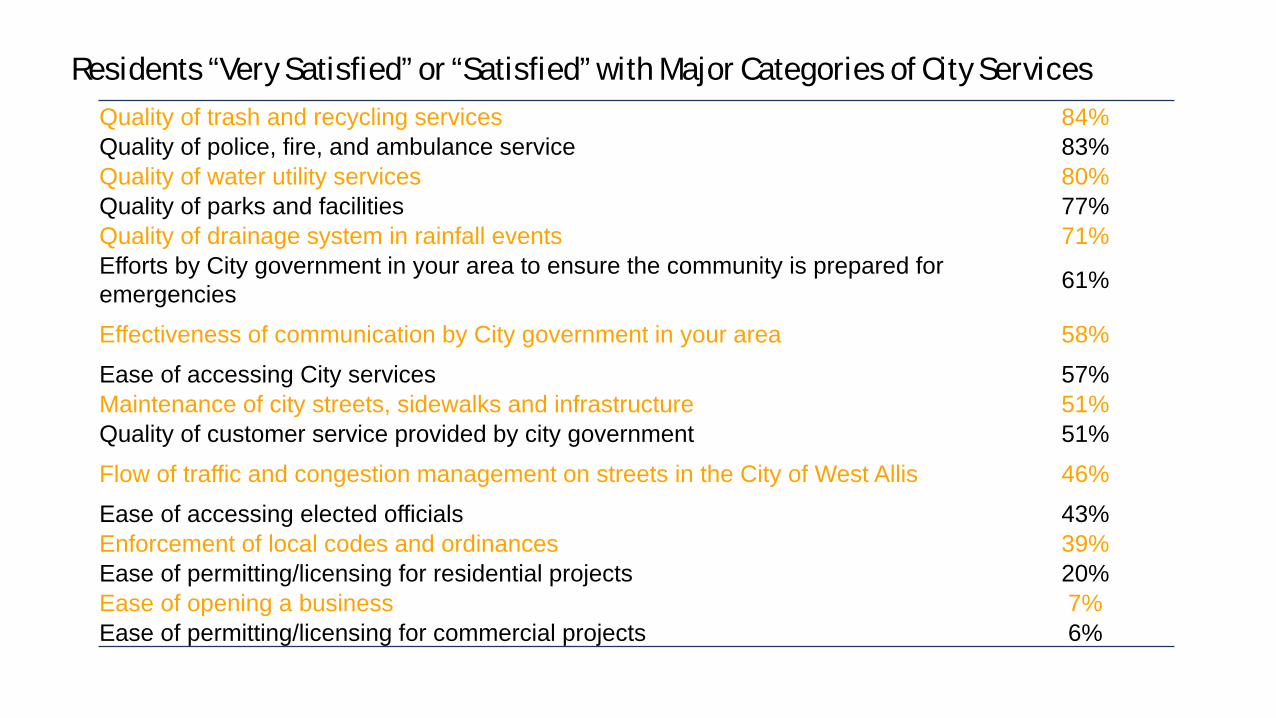
Residents “Very Satisfied” or “Satisfied” with Major Categories of City Services Quality of trash and recycling services 84% Quality of police, fire, and ambulance service 83% Quality of water utility services 80% Quality of parks and facilities 77% Quality of drainage system in rainfall events 71% Efforts by City government in your area to ensure the community is prepared for emergencies 61%
Effectiveness of communication by City government in your area 58% Ease of accessing City services 57% Maintenance of city streets, sidewalks and infrastructure 51% Quality of customer service provided by city government 51% Flow of traffic and congestion management on streets in the City of West Allis 46% Ease of accessing elected officials 43% Enforcement of local codes and ordinances 39% Ease of permitting/licensing for residential projects 20% Ease of opening a business 7% Ease of permitting/licensing for commercial projects 6%
0.00%
10.00%
20.00%
30.00%
40.00%
50.00%
60.00%
Image/Brand/Destination Quality of Life Citizen Engagement Economic Vitality andSustainability
Excellence in Government
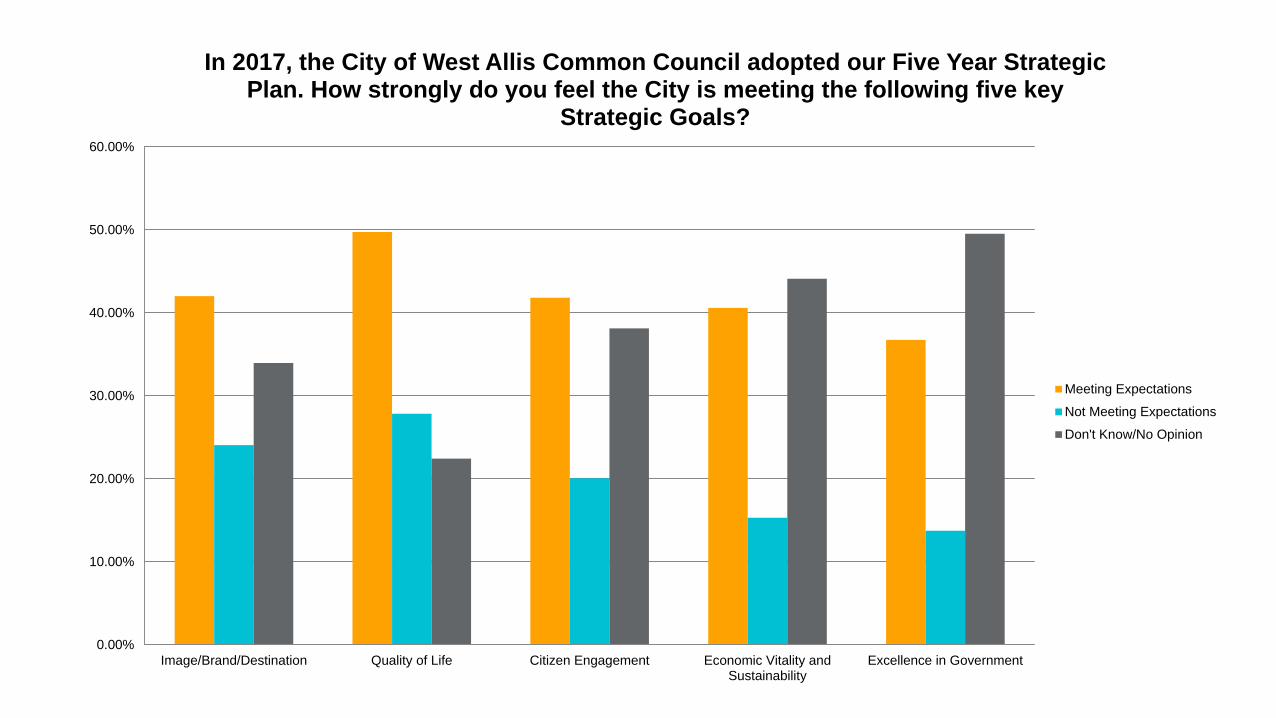
In 2017, the City of West Allis Common Council adopted our Five Year Strategic Plan. How strongly do you feel the City is meeting the following five key
Strategic Goals?
Meeting ExpectationsNot Meeting ExpectationsDon't Know/No Opinion
28
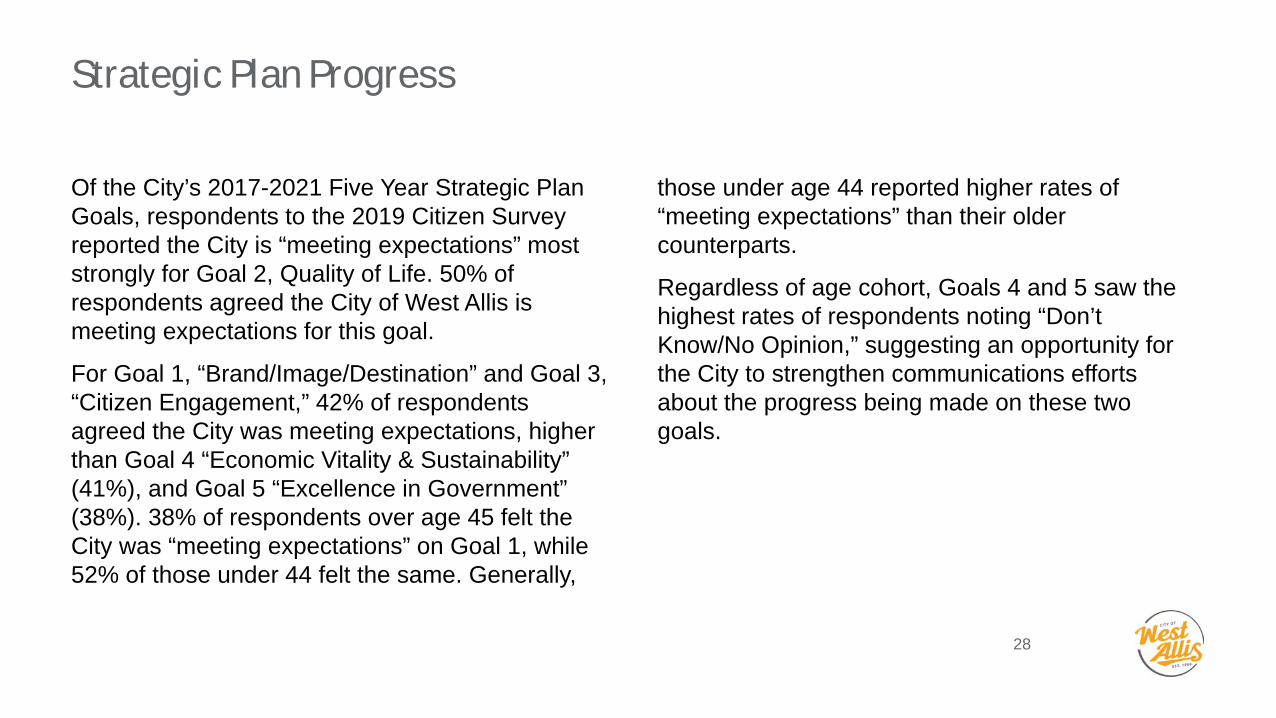
Of the City’s 2017-2021 Five Year Strategic Plan Goals, respondents to the 2019 Citizen Survey reported the City is “meeting expectations” most strongly for Goal 2, Quality of Life. 50% of respondents agreed the City of West Allis is meeting expectations for this goal.
For Goal 1, “Brand/Image/Destination” and Goal 3, “Citizen Engagement,” 42% of respondents agreed the City was meeting expectations, higher than Goal 4 “Economic Vitality & Sustainability” (41%), and Goal 5 “Excellence in Government” (38%). 38% of respondents over age 45 felt the City was “meeting expectations” on Goal 1, while 52% of those under 44 felt the same. Generally,
those under age 44 reported higher rates of “meeting expectations” than their older counterparts.
Regardless of age cohort, Goals 4 and 5 saw the highest rates of respondents noting “Don’t Know/No Opinion,” suggesting an opportunity for the City to strengthen communications efforts about the progress being made on these two goals.
Strategic Plan Progress
Satisfaction with Key Departments
Public Safety, Public Works, Health, Library, Code Enforcement, Communications

30
Questions 19 – 33 asked survey respondents to rate their satisfaction level with the following City services/departments:
• Public Safety
• Public Works, Engineering, & Utility Services
• Parks & Playgrounds (see Slide 7)
• Code Enforcement & Property Maintenance
• City Communications
• Health & Senior Services
• Library Services
For each service/department, nine or more specific services or responsibilities were listed for respondents to rate their level of satisfaction. For this report, the five highest-rated services are documented.
Of the specific services listed for each department, respondents were also asked to identify which services should receive the most emphasis and least emphasis in the next two years. For this report, the three highest and three lowest rated services are documented in the following pages.
Departmental Services & Needed Areas of Emphasis
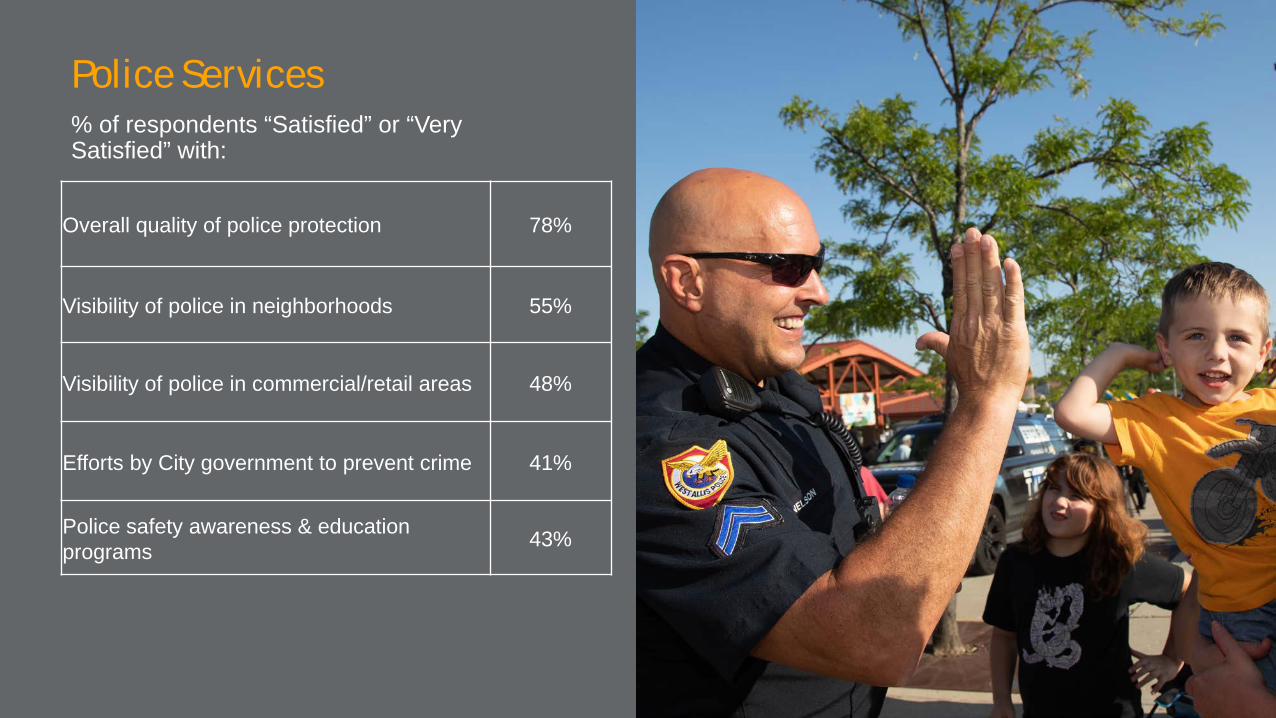
% of respondents “Satisfied” or “Very Satisfied” with:
Police Services
Overall quality of police protection 78%
Visibility of police in neighborhoods 55%
Visibility of police in commercial/retail areas 48%
Efforts by City government to prevent crime 41%
Police safety awareness & education programs 43%

% of respondents “Satisfied” or “Very Satisfied” with:
Fire Services
Overall quality of fire services 61%
Fire safety awareness and education programs* 49%
How quickly fire services personnel respond to emergencies* 60%
Overall quality of ambulance/emergency medical services* 62%
Overall quality of fire services* 61%
*Note: For all of these questions, 25% or more of respondents selected “Don’t Know,” assuming they have not had experience with fire or emergency services.
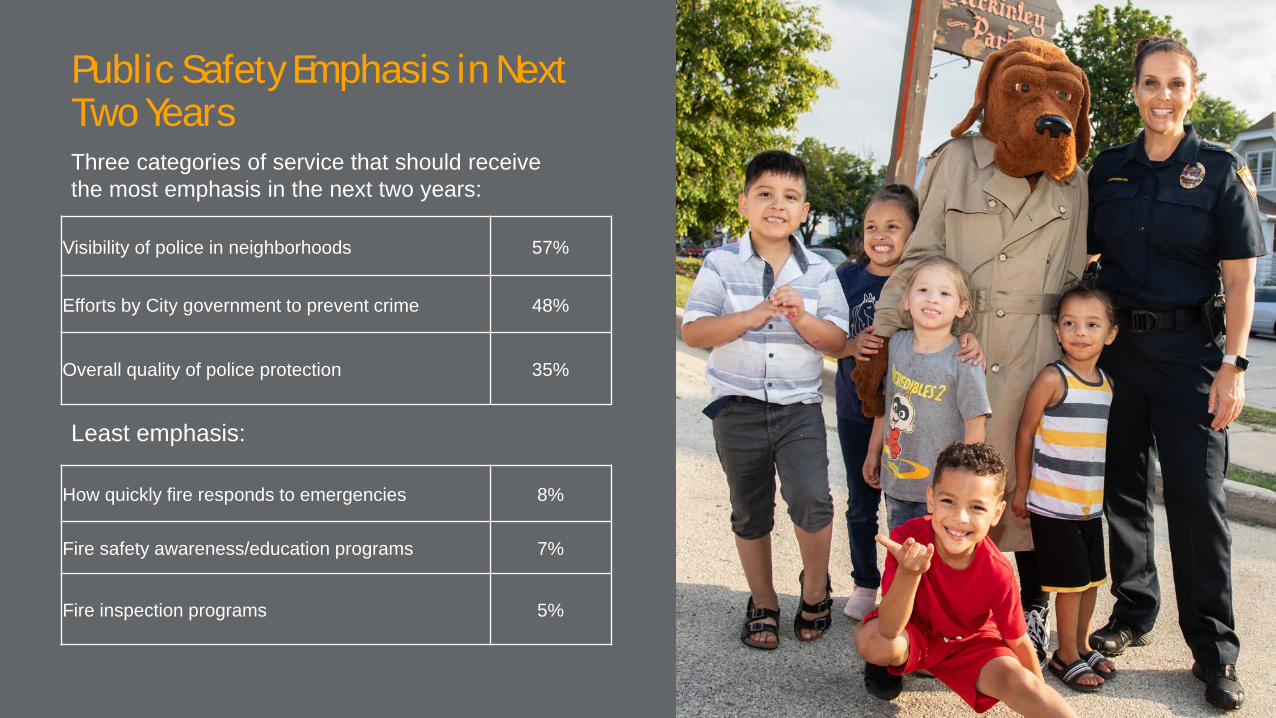
Public Safety Emphasis in Next Two Years Three categories of service that should receive the most emphasis in the next two years:
Visibility of police in neighborhoods 57%
Efforts by City government to prevent crime 48%
Overall quality of police protection 35%
Least emphasis:
How quickly fire responds to emergencies 8%
Fire safety awareness/education programs 7%
Fire inspection programs 5%
34
Overall, respondents reported high levels of satisfaction with public safety and police and fire services. 88% of respondents reported feeling safe walking in their neighborhoods during the day, although efforts to increase the sense of safety may be needed after dark, when only 47% of survey respondents reported feeling safe walking in neighborhoods. Of note, only 39% of respondents reported feeling “very safe” or “safe” walking on City trails or in City parks. Police received higher levels of “satisfied” or “very satisfied” in relation to the specific services provided by the Police Department itemized in the survey. However, it is important to note that lower percentages of satisfaction with fire services are offset by higher numbers of respondents noting “don’t know/no opinion” when asked to rate fire services. Presumably, these individuals have not had
interaction with fire, EMS, or emergency services and did not feel comfortable providing a rating. Respondents requested emphasis on strengthening police services in the future, with 57% requesting more visibility of officers in neighborhoods and 48% suggesting City government should emphasize efforts to prevent crime. Comments left for question 20 in the survey suggest a misperception that crime is rampant in the City, despite year-over-year decreases in crime rates of over 20%. There are opportunities to educate the community about the success of recent crime reduction efforts.
Public Safety Summary
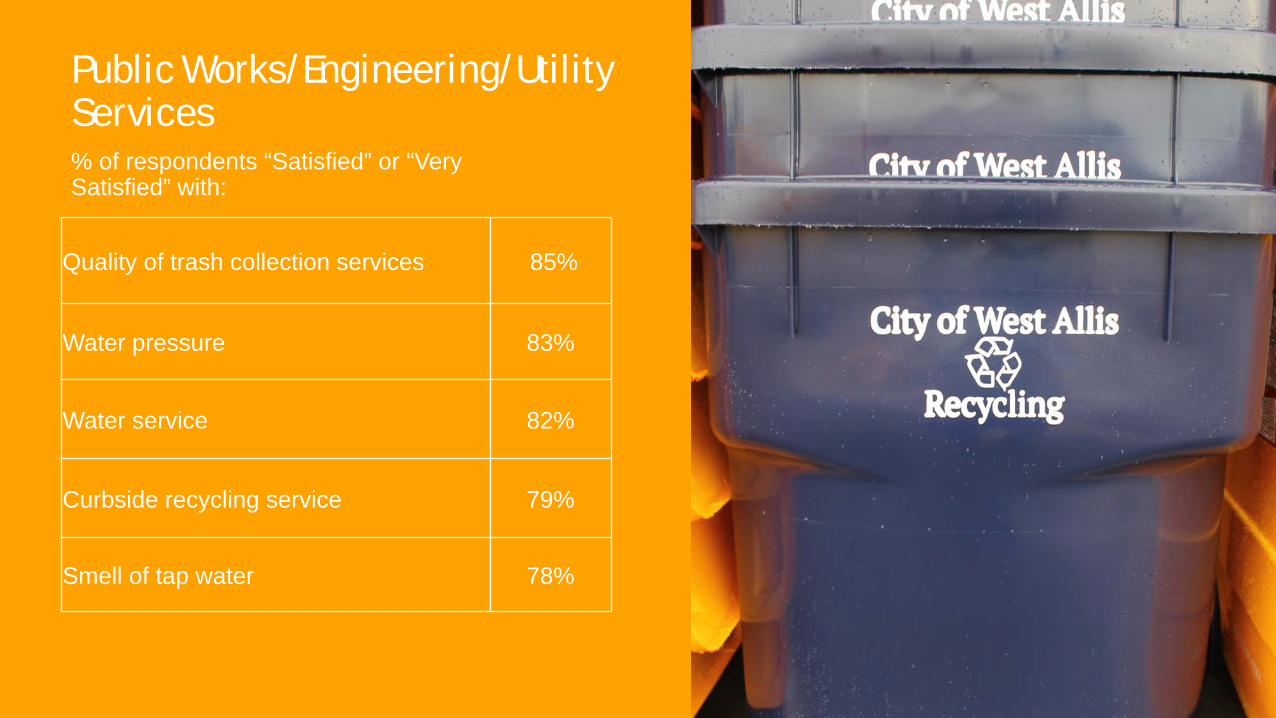
Public Works/Engineering/Utility Services
Quality of trash collection services 85%
Water pressure 83%
Water service 82%
Curbside recycling service 79%
Smell of tap water 78%
% of respondents “Satisfied” or “Very Satisfied” with:
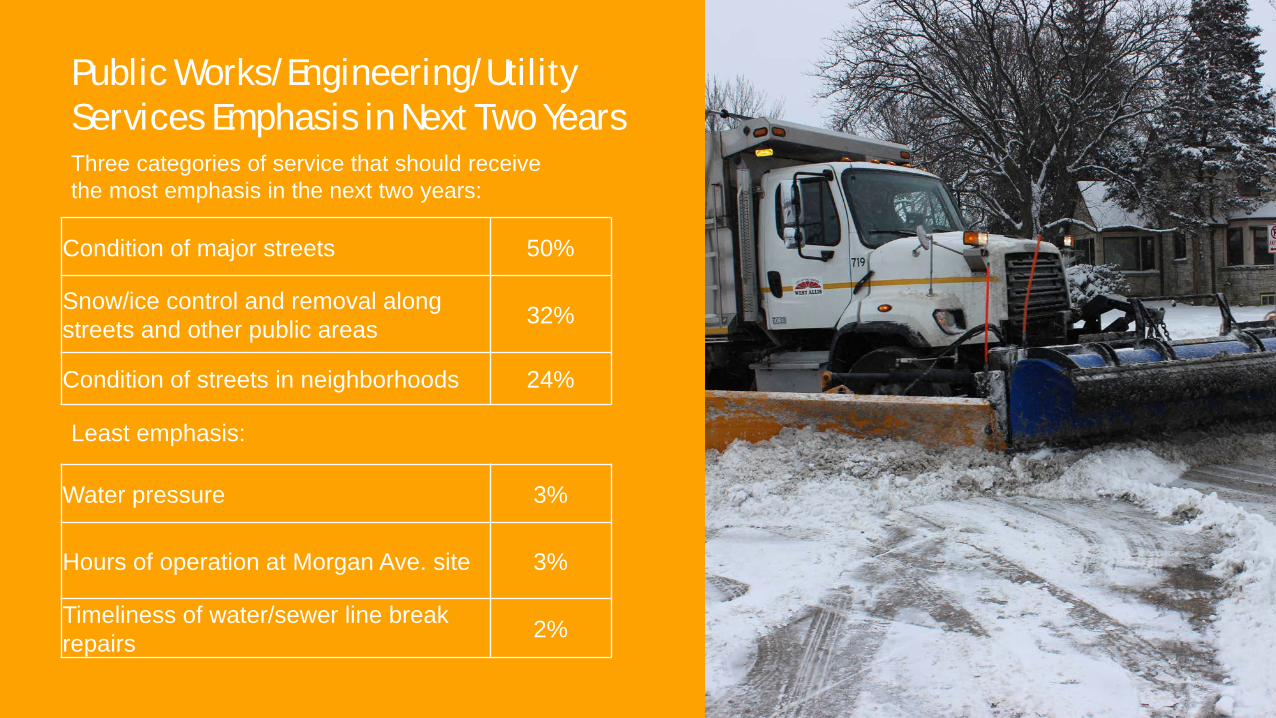
Public Works/Engineering/Utility Services Emphasis in Next Two Years
Condition of major streets 50%
Snow/ice control and removal along streets and other public areas 32%
Condition of streets in neighborhoods 24%
Three categories of service that should receive the most emphasis in the next two years:
Least emphasis:
Water pressure 3%
Hours of operation at Morgan Ave. site 3%
Timeliness of water/sewer line break repairs 2%
37
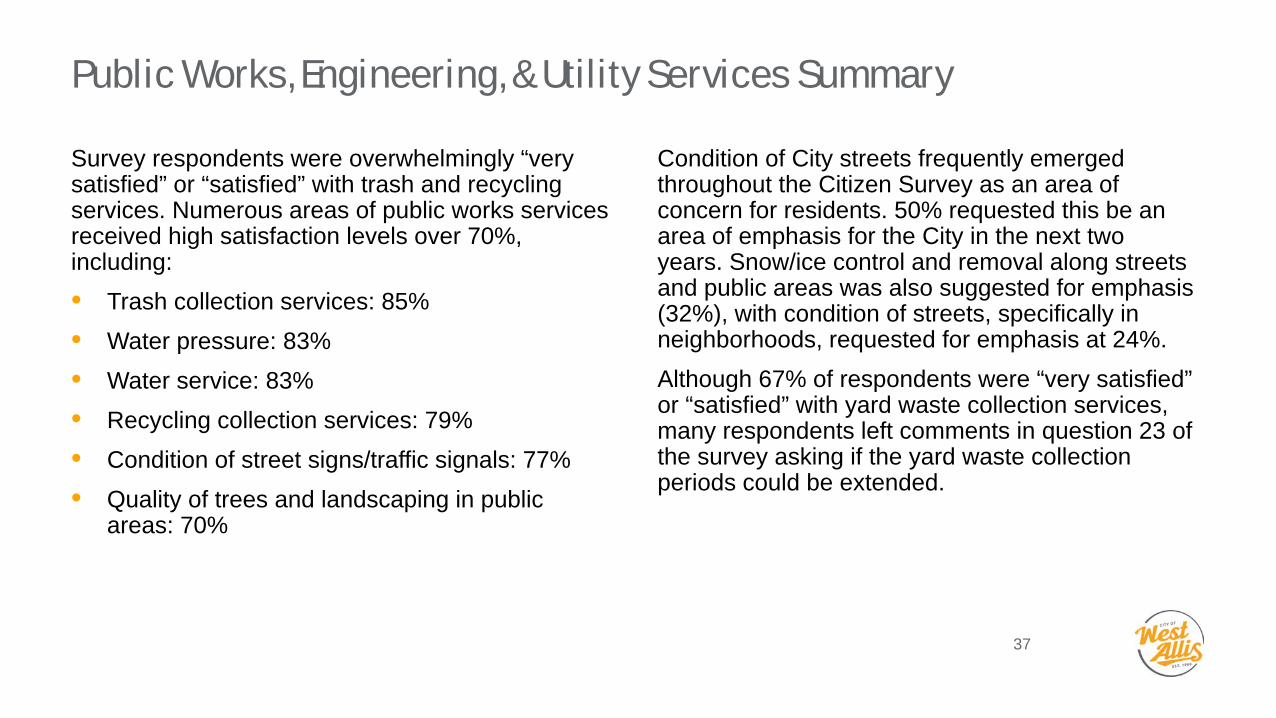
Survey respondents were overwhelmingly “very satisfied” or “satisfied” with trash and recycling services. Numerous areas of public works services received high satisfaction levels over 70%, including: • Trash collection services: 85% • Water pressure: 83% • Water service: 83% • Recycling collection services: 79% • Condition of street signs/traffic signals: 77% • Quality of trees and landscaping in public
areas: 70%
Condition of City streets frequently emerged throughout the Citizen Survey as an area of concern for residents. 50% requested this be an area of emphasis for the City in the next two years. Snow/ice control and removal along streets and public areas was also suggested for emphasis (32%), with condition of streets, specifically in neighborhoods, requested for emphasis at 24%. Although 67% of respondents were “very satisfied” or “satisfied” with yard waste collection services, many respondents left comments in question 23 of the survey asking if the yard waste collection periods could be extended.
Public Works, Engineering, & Utility Services Summary
% of respondents “Satisfied” or “Very Satisfied” with:
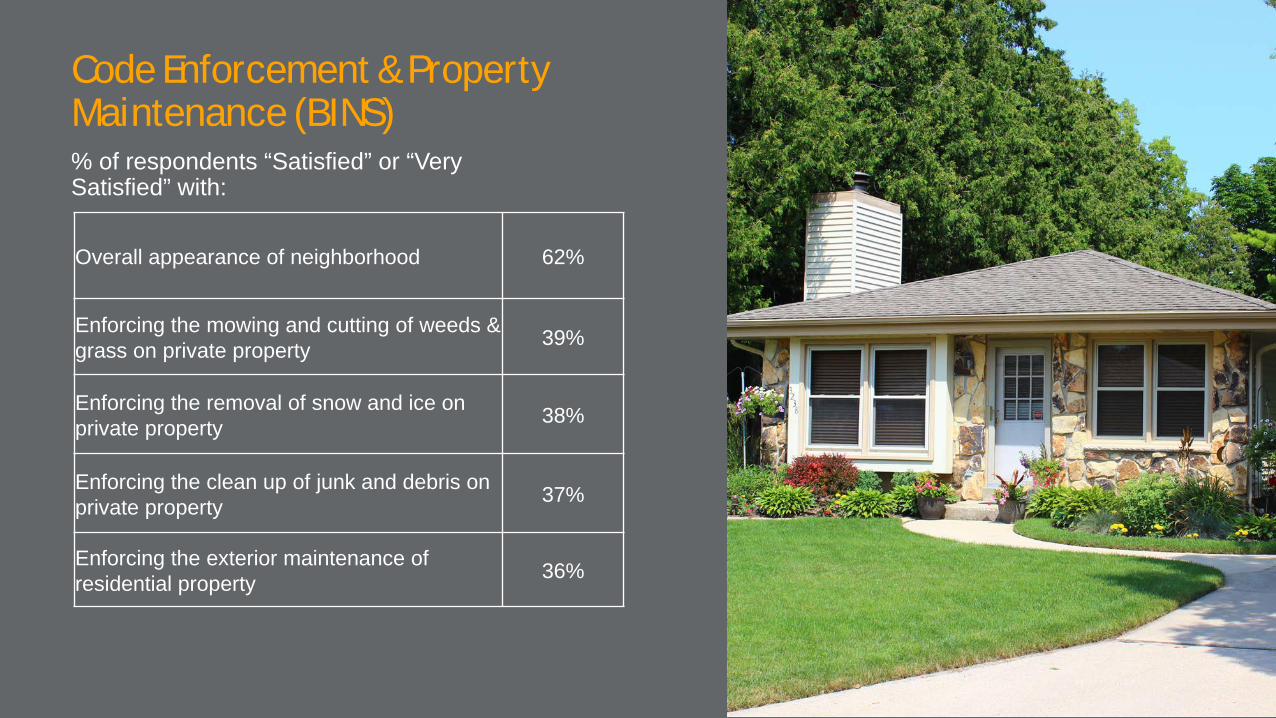
Code Enforcement & Property Maintenance (BINS)
Overall appearance of neighborhood 62%
Enforcing the mowing and cutting of weeds & grass on private property 39%
Enforcing the removal of snow and ice on private property 38%
Enforcing the clean up of junk and debris on private property 37%
Enforcing the exterior maintenance of residential property 36%
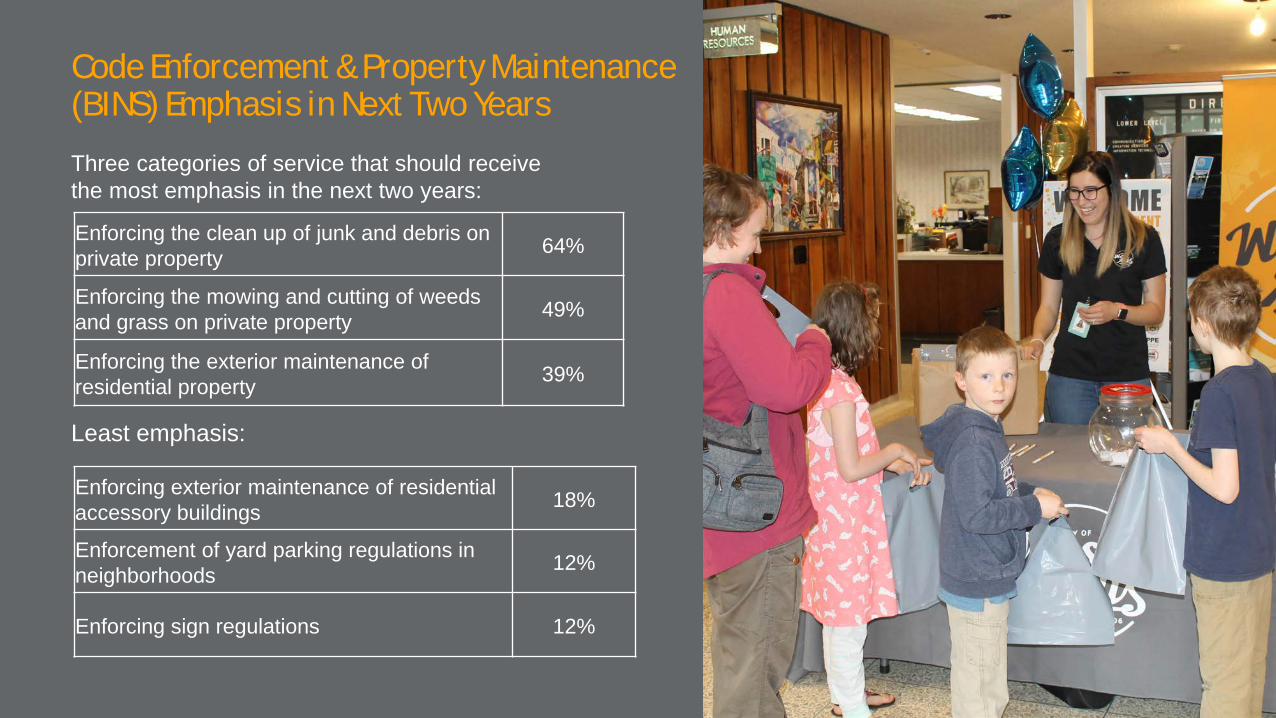
Code Enforcement & Property Maintenance (BINS) Emphasis in Next Two Years
Enforcing the clean up of junk and debris on private property 64%
Enforcing the mowing and cutting of weeds and grass on private property 49%
Enforcing the exterior maintenance of residential property 39%
Three categories of service that should receive the most emphasis in the next two years:
Least emphasis:
Enforcing exterior maintenance of residential accessory buildings 18%
Enforcement of yard parking regulations in neighborhoods 12%
Enforcing sign regulations 12%
40
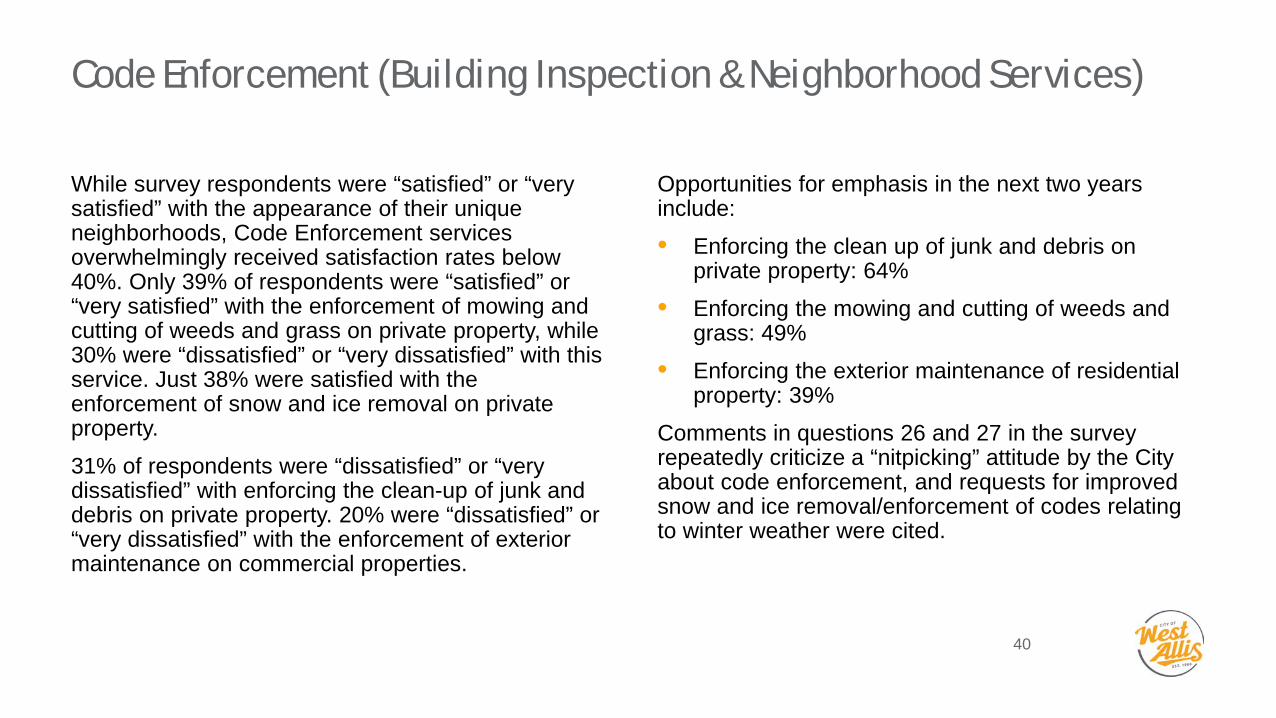
While survey respondents were “satisfied” or “very satisfied” with the appearance of their unique neighborhoods, Code Enforcement services overwhelmingly received satisfaction rates below 40%. Only 39% of respondents were “satisfied” or “very satisfied” with the enforcement of mowing and cutting of weeds and grass on private property, while 30% were “dissatisfied” or “very dissatisfied” with this service. Just 38% were satisfied with the enforcement of snow and ice removal on private property. 31% of respondents were “dissatisfied” or “very dissatisfied” with enforcing the clean-up of junk and debris on private property. 20% were “dissatisfied” or “very dissatisfied” with the enforcement of exterior maintenance on commercial properties.
Opportunities for emphasis in the next two years include: • Enforcing the clean up of junk and debris on
private property: 64% • Enforcing the mowing and cutting of weeds and
grass: 49% • Enforcing the exterior maintenance of residential
property: 39% Comments in questions 26 and 27 in the survey repeatedly criticize a “nitpicking” attitude by the City about code enforcement, and requests for improved snow and ice removal/enforcement of codes relating to winter weather were cited.
Code Enforcement (Building Inspection & Neighborhood Services)
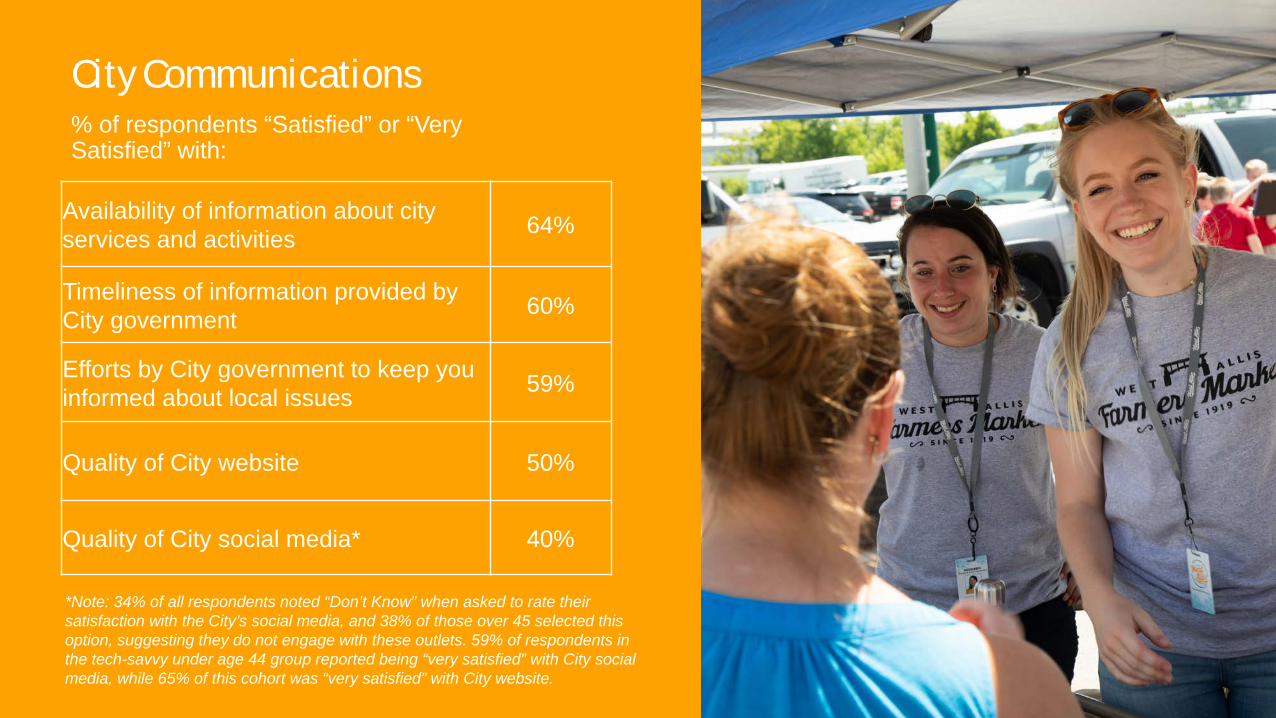
City Communications
Availability of information about city services and activities 64%
Timeliness of information provided by City government 60%
Efforts by City government to keep you informed about local issues 59%
Quality of City website 50%
Quality of City social media* 40%
% of respondents “Satisfied” or “Very Satisfied” with:
*Note: 34% of all respondents noted “Don’t Know” when asked to rate their satisfaction with the City’s social media, and 38% of those over 45 selected this option, suggesting they do not engage with these outlets. 59% of respondents in the tech-savvy under age 44 group reported being “very satisfied” with City social media, while 65% of this cohort was “very satisfied” with City website.
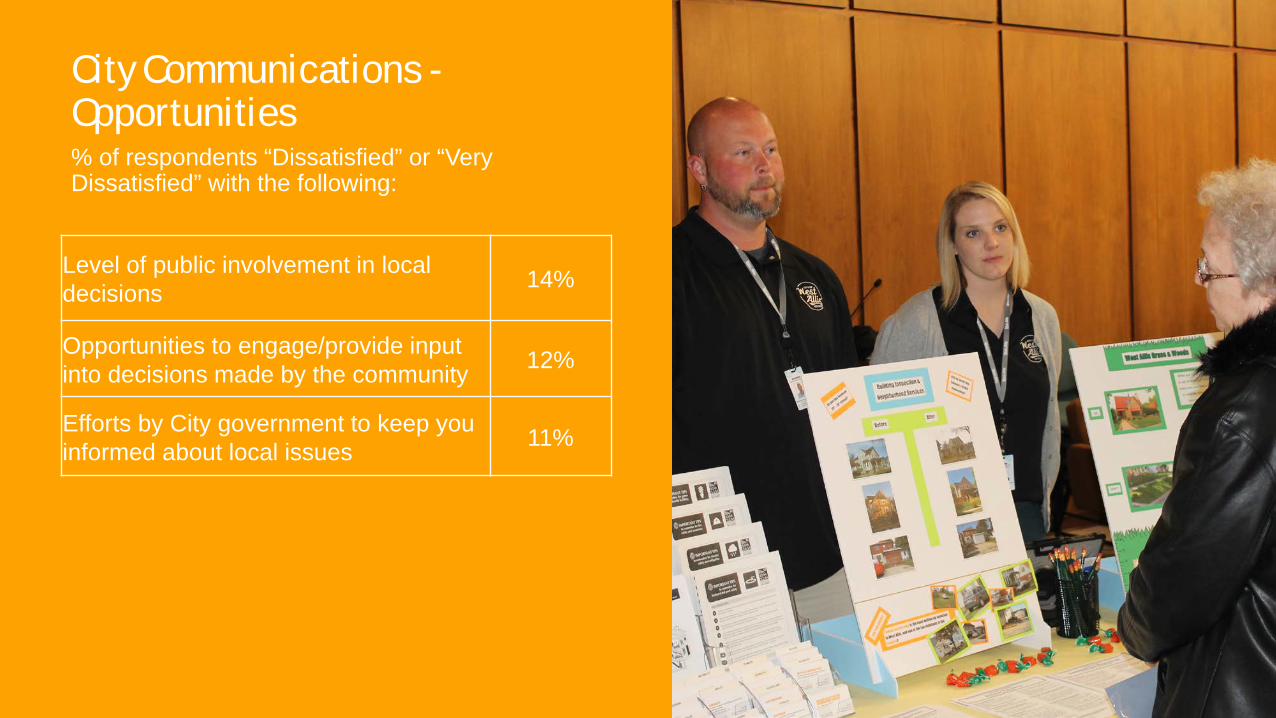
City Communications - Opportunities
Level of public involvement in local decisions 14%
Opportunities to engage/provide input into decisions made by the community 12%
Efforts by City government to keep you informed about local issues 11%
% of respondents “Dissatisfied” or “Very Dissatisfied” with the following:
43
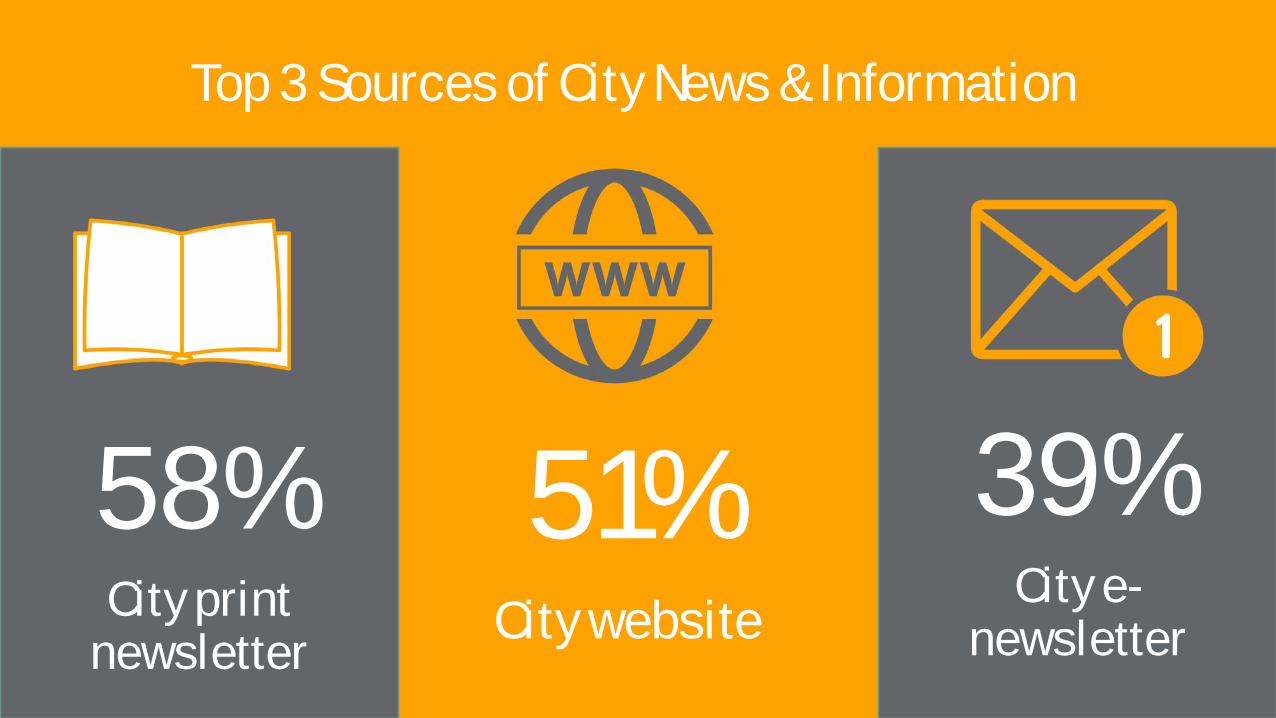
Top 3 Sources of City News & Information
58% City print
newsletter
51% City website
39% City e-
newsletter
44
In 2015, the City conducted a communications survey to assess residents’ preferred methods of receiving City communications. That survey showed 66% of residents favored the City’s print newsletter, “It’s Your City,” as their preferred method of communication. The 2019 Citizen Survey revealed a lower percentage: 58%, prefer the print newsletter, but it remains survey respondents’ preferred communications platform.
In 2015, only 32% of survey respondents relied on the City’s website for information. This number increased significantly as 51% of 2019 respondents selected the website as their preferred platform for City information. A higher percentage of younger respondents (under 44) selected the website as their first choice for news (65%) and the print newsletter second (57%).
Introduced in 2017, the City’s e-newsletter emerged as survey respondents’ third choice of information, with 39%
utilizing this communications tool. For all respondents, local newspapers (38%) and TV news channels (36%) rounded out the top five selections.
With the majority of respondents to the 2019 survey over age 45, it is expected that a large portion of this cohort may not be as technologically inclined as younger residents. Among all survey respondents, 40% were “very satisfied” or “satisfied” with City social media, yet a higher number, 59%, of those under 44 reported these satisfaction levels. Younger survey respondents were also more likely to report high levels of satisfaction with the City’s recently redesigned, mobile responsive website than older counterparts.
Survey respondents requested more opportunities to provide input or become involved in local decision making.
City Communications
% of respondents “Satisfied” or “Very Satisfied” with:
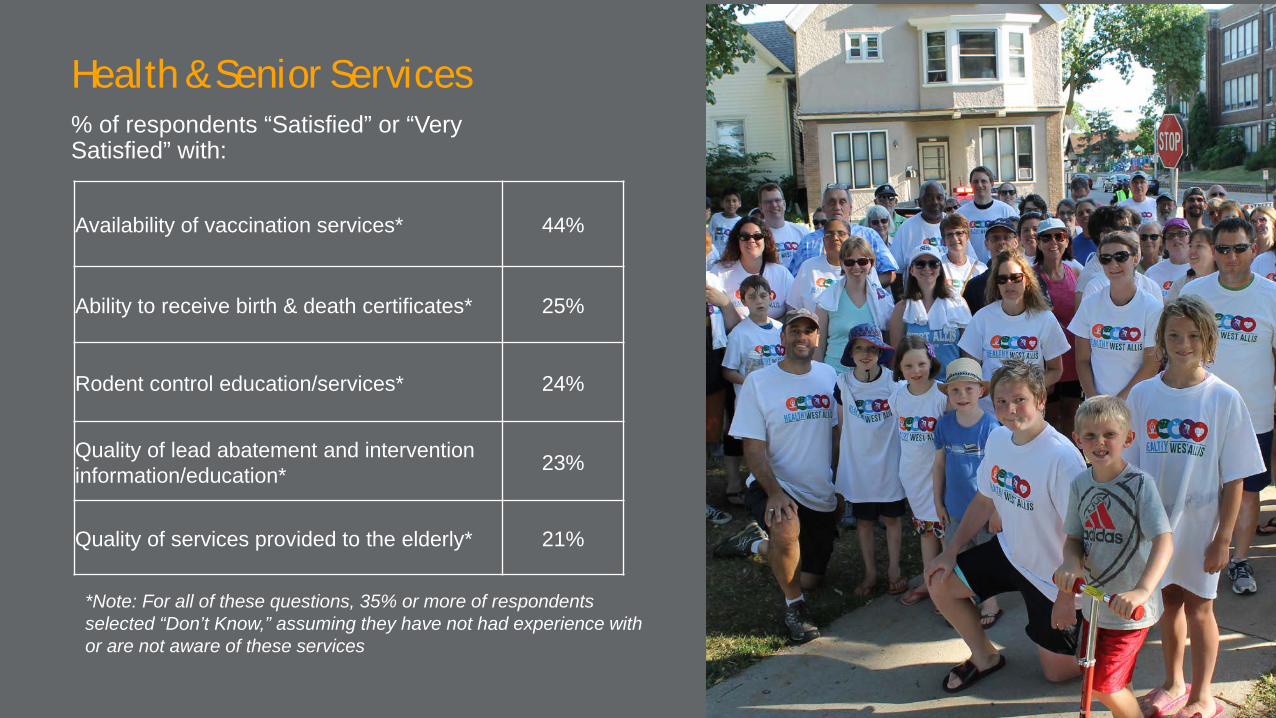
Health & Senior Services
Availability of vaccination services* 44%
Ability to receive birth & death certificates* 25%
Rodent control education/services* 24%
Quality of lead abatement and intervention information/education* 23%
Quality of services provided to the elderly* 21%
*Note: For all of these questions, 35% or more of respondents selected “Don’t Know,” assuming they have not had experience with or are not aware of these services
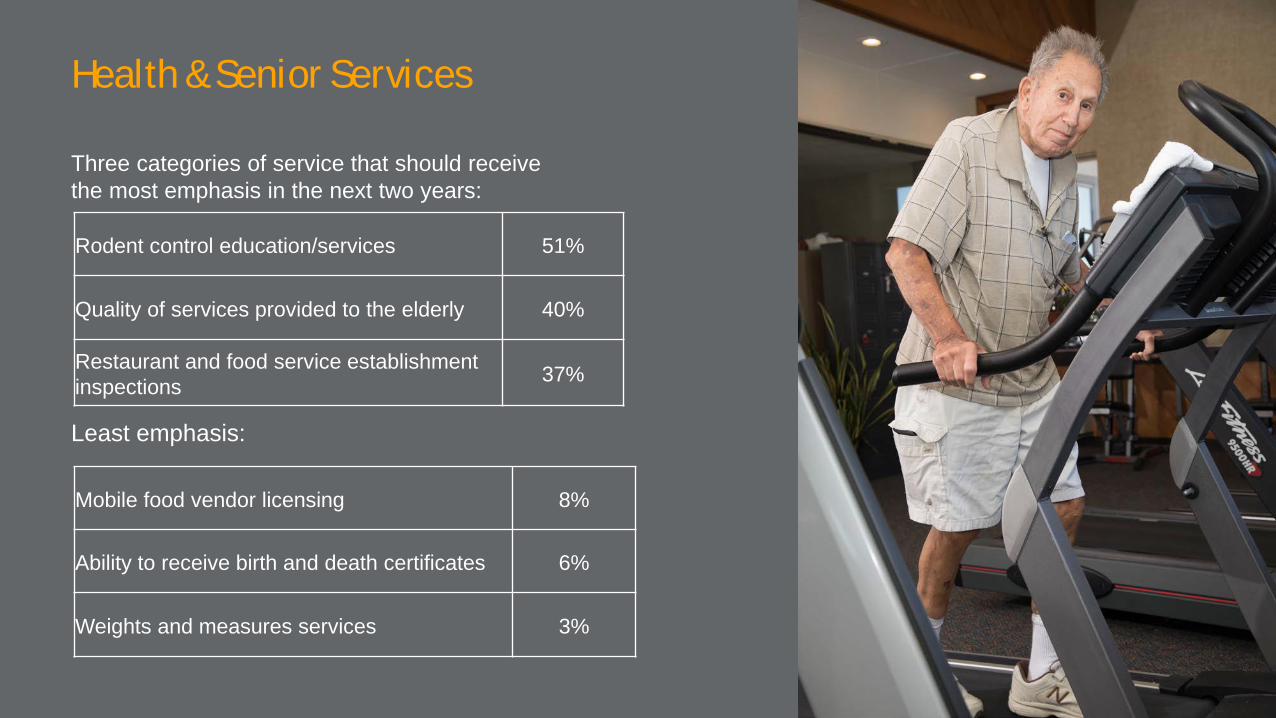
Health & Senior Services
Rodent control education/services 51%
Quality of services provided to the elderly 40%
Restaurant and food service establishment inspections 37%
Three categories of service that should receive the most emphasis in the next two years:
Least emphasis:
Mobile food vendor licensing 8%
Ability to receive birth and death certificates 6%
Weights and measures services 3%

47
Health and Senior Services received the largest percentages of respondents selecting “don’t know” when asked to rate key services provided by this department. This suggests a great opportunity for the Health Department to enhance communication to the community about available services. The highest percentages of “don’t know” responses were for the following services: • Weights & measure: 71% • Mobile food licensing: 70% • Senior Center dining program: 69% • Dental services for children: 67% Of the 14 key services listed for assessment, all had
“don’t know” responses above 35%. Rodent control should receive emphasis in the next two years, as 51% of survey respondents noted this and numerous comments for questions 30 and 31 in the survey were critical of the City’s perceived lack of rodent control efforts. Despite increased rodent prevention education efforts, 39% of respondents selected “don’t know” in relation to rodent control. 40% of respondents would like emphasis on services to the elderly, but it is worth noting that 55% of respondents chose “don’t know” when asked to rate this service, suggesting an opportunity to educate the community about existing programs for the elderly, particularly the Senior Center’s dining program.
Health & Senior Services
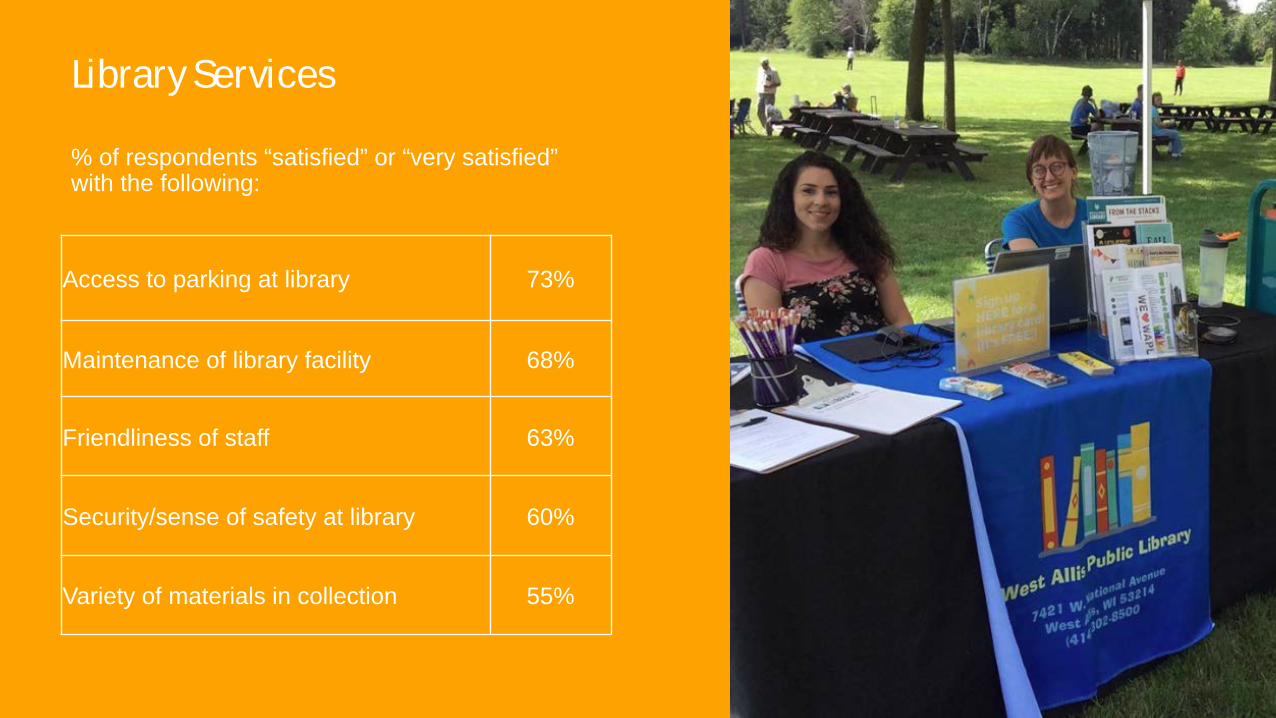
Library Services
Access to parking at library 73%
Maintenance of library facility 68%
Friendliness of staff 63%
Security/sense of safety at library 60%
Variety of materials in collection 55%
% of respondents “satisfied” or “very satisfied” with the following:

Library Services Emphasis in Next Two Years Three categories of service that should receive the most emphasis in the next two years:
Least emphasis:
Maintenance of library facility 38%
Security/sense of safety 35%
Access to new or current materials 32%
Quality of print communications (newsletter, brochures, flyers) 9%
Quality of social media outlets (Facebook, Twitter, Instagram) 6%
Access to materials in languages other than English 5%
50
Conflictingly, the areas of assessment survey respondents most praised at the West Allis Public Library were also the areas they requested be emphasized in the next two years. 68% of respondents were “satisfied” or “very satisfied” with maintenance of the library facility, yet this was also the highest-rated area for emphasis in the next two years at 38%. Likewise, 60% of respondents were “satisfied” or “very satisfied” with the feeling of safety at the library, yet 34% requested emphasis on this area in the next two years.
Since the majority of survey respondents were older adults without children residing in their
households, it is not unsurprising that 51% of respondents chose “don’t know” when asked to assess children’s programming and 58% chose “don’t know” when asked to assess teen programming. Even so, 45% of respondents chose “don’t know” in relation to adult programming.
Just 18% of all respondents reported accessing the internet at the Library in the past year.
Comments in questions 32 and 33 pertaining to the library included many noting “I don’t use the library.” Those who do use the library generally praised staff and services.
Library Services

Resource Allocation & Planning

52
Three Areas to Increase Funding
82% Pothole repair
57% Road
resurfacing and reconstruction
55% Police presence
in neighborhoods

53
Three Areas to Decrease Funding
19% Affordable
housing
15% Parking
enforcement
11% Tree planting
54
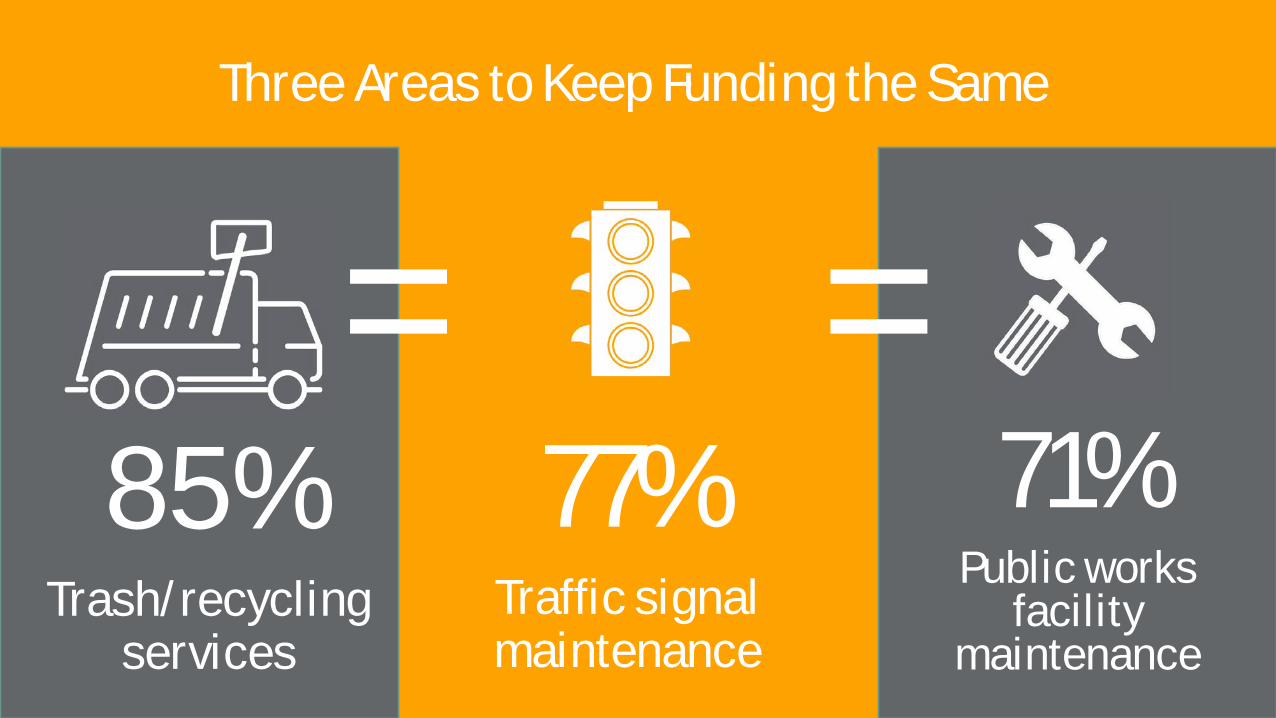
Three Areas to Keep Funding the Same
85% Trash/recycling
services
77% Traffic signal maintenance
71% Public works
facility maintenance
= =
55
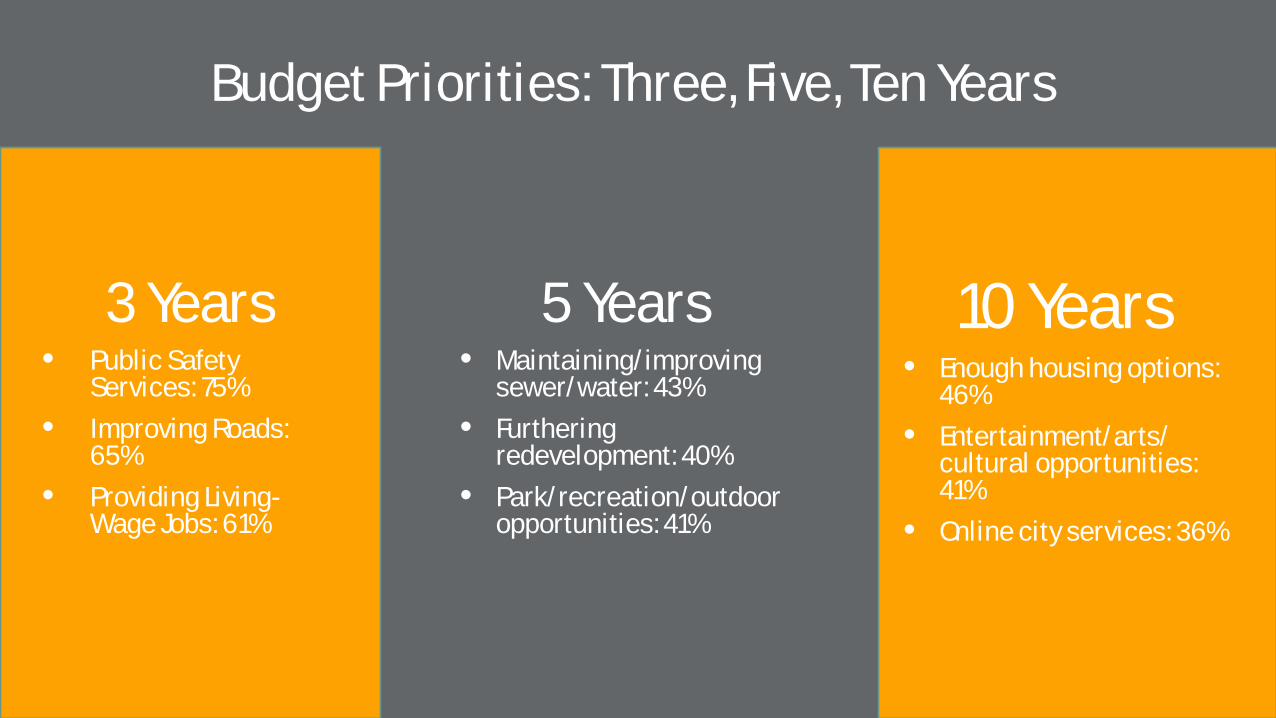
Budget Priorities: Three, Five, Ten Years
3 Years • Public Safety
Services: 75% • Improving Roads:
65% • Providing Living-
Wage Jobs: 61%
5 Years • Maintaining/improving
sewer/water: 43% • Furthering
redevelopment: 40% • Park/recreation/outdoor
opportunities: 41%
10 Years • Enough housing options:
46% • Entertainment/arts/
cultural opportunities: 41%
• Online city services: 36%
56
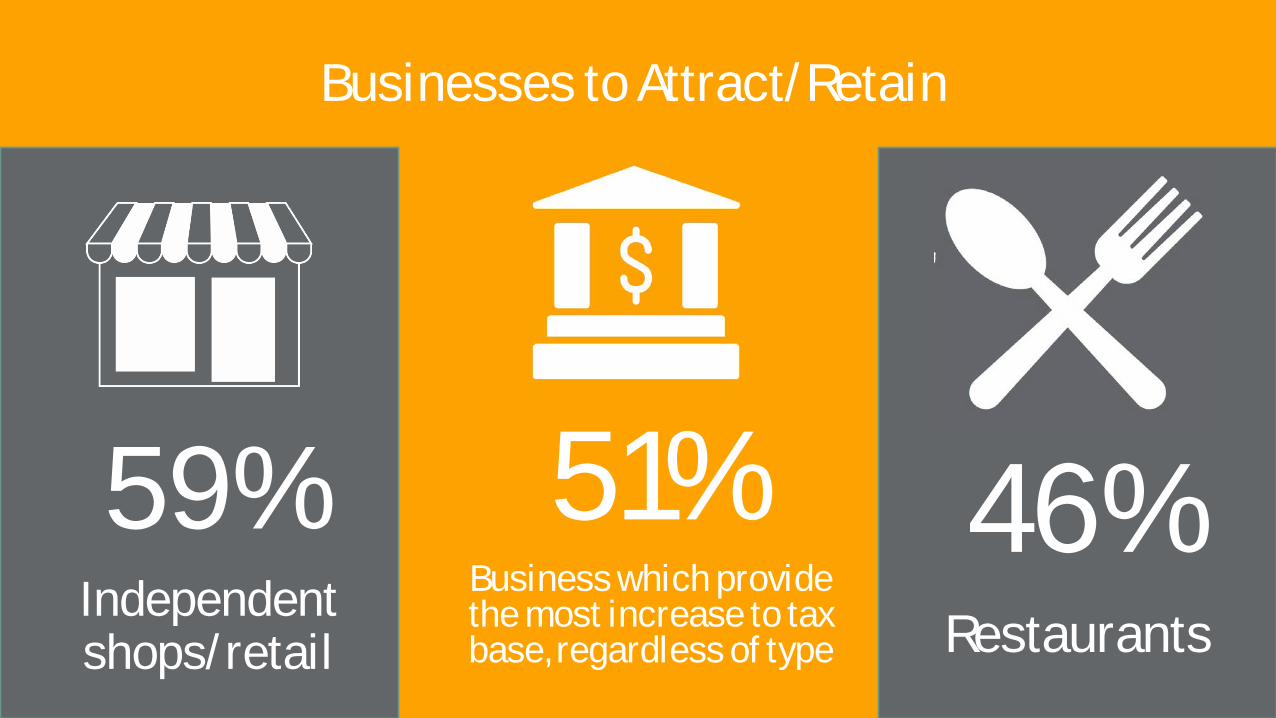
Businesses to Attract/Retain
59% Independent shops/retail
51% Business which provide the most increase to tax base, regardless of type
46% Restaurants
57
Questions 34, 35 and 37 in the survey asked respondents to assist with prioritization of budget allocation in upcoming years. They were asked to itemize what services should receive increased or decreased funding, or which services should retain the same level of funding they currently have. Respondents requested increased funding for pothole repairs (82%), street maintenance (57%), and police presence in neighborhoods (55%). They supported decreased funding for affordable housing (19%), parking enforcement (15%), and tree planting (11%). With high satisfaction rates for current trash and recycling services, respondents felt funding for these services should remain the same, as should
funding for traffic signal maintenance (77%) and public works facility maintenance (71%). Respondents were asked to assess budget priorities in the next three, five, and ten years. All respondents prioritized public safety services as most important in the next three years (75%), followed by improving roads (65%) and providing living-wage jobs (61%). In five years, priorities shifted to maintaining/improving sewer/water (43%), furthering redevelopment (40%), and providing park/recreation/outdoor opportunities (41%).
Budget Priorities & Resource Allocation
58
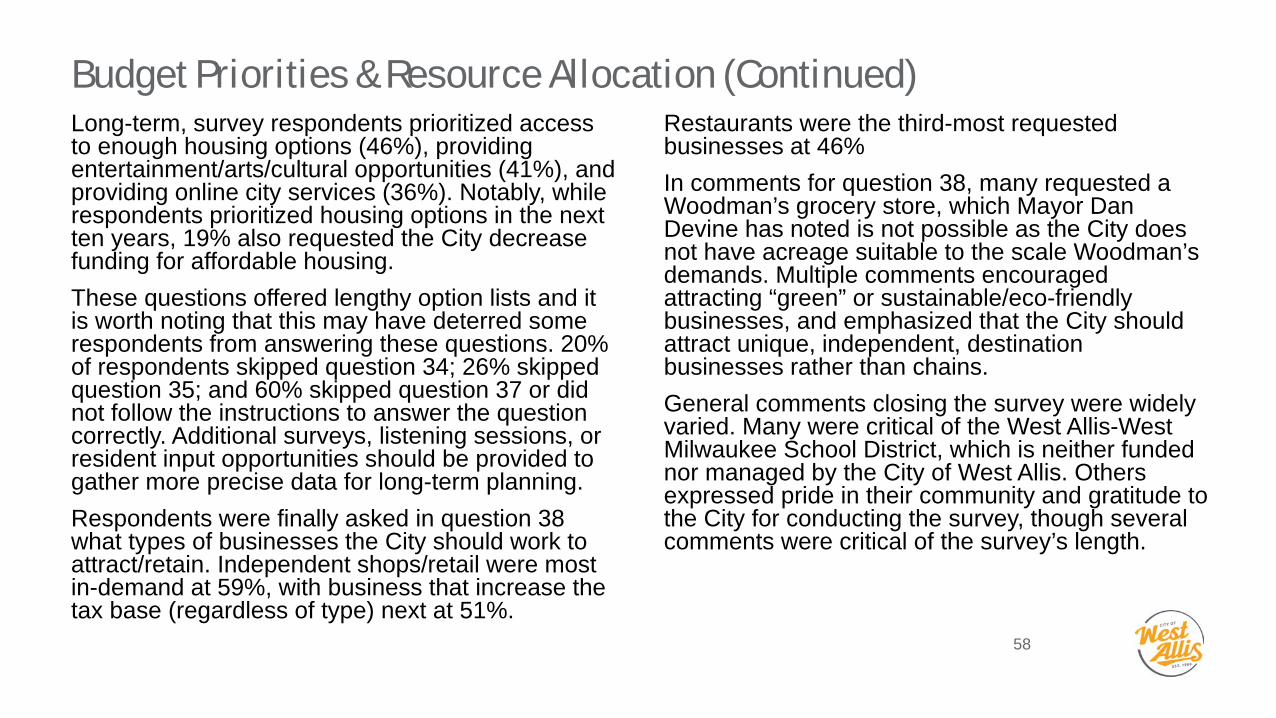
Long-term, survey respondents prioritized access to enough housing options (46%), providing entertainment/arts/cultural opportunities (41%), and providing online city services (36%). Notably, while respondents prioritized housing options in the next ten years, 19% also requested the City decrease funding for affordable housing. These questions offered lengthy option lists and it is worth noting that this may have deterred some respondents from answering these questions. 20% of respondents skipped question 34; 26% skipped question 35; and 60% skipped question 37 or did not follow the instructions to answer the question correctly. Additional surveys, listening sessions, or resident input opportunities should be provided to gather more precise data for long-term planning. Respondents were finally asked in question 38 what types of businesses the City should work to attract/retain. Independent shops/retail were most in-demand at 59%, with business that increase the tax base (regardless of type) next at 51%.
Restaurants were the third-most requested businesses at 46% In comments for question 38, many requested a Woodman’s grocery store, which Mayor Dan Devine has noted is not possible as the City does not have acreage suitable to the scale Woodman’s demands. Multiple comments encouraged attracting “green” or sustainable/eco-friendly businesses, and emphasized that the City should attract unique, independent, destination businesses rather than chains. General comments closing the survey were widely varied. Many were critical of the West Allis-West Milwaukee School District, which is neither funded nor managed by the City of West Allis. Others expressed pride in their community and gratitude to the City for conducting the survey, though several comments were critical of the survey’s length.
Budget Priorities & Resource Allocation (Continued)


![Allis Ubba 2ªEdiçãO[1]](https://img.pdfslide.net/doc/110x75/55b1fc24bb61eb6b7f8b4673/allis-ubba-2aedicao1.jpg)