Embed Size (px)
Citation preview
2019 Costs and Technical Parameter Review
Consultation Report
Australian Energy Market Operator (AEMO)
Reference: 506837
Revision: 3
2020-03-04
2019 Costs and Technical Parameter Review - Revision 3
Document prepared by Aurecon Australasia Pty Ltd
ABN 54 005 139 873
Ground Floor, 25 King Street Bowen Hills QLD 4006
Locked Bag 331 Brisbane QLD 4001 Australia
T
F
E
W
+61 7 3173 8000
+61 7 3173 8001
aurecongroup.com
Document control
Report title Consultation Report
Document code Project number 506837
File path 2019 Cost and Technical Parameters Review Report_Rev 3.docx
Client Australian Energy Market Operator (AEMO)
Client contact Dane Winch Client reference
Rev Date Revision details/status Author Reviewer Verifier (if required)
Approver
0 2019-08-11 Draft in progress for comment SHM PCG PCG
1 2019-10-01 Second draft in progress SHM TA PCG
2 2019-12-10 Issue for industry consultation SHM Multiple PCG
3 2020-03-04 Final issue following industry consultation
SHM SW PCG
Current revision 3
A person using Aurecon documents or data accepts the risk of: a) Using the documents or data in electronic form without requesting and checking them for accuracy against the original hard copy
version. b) Using the documents or data for any purpose not agreed to in writing by Aurecon.
Approval
Author signature
Approver signature
Name Shannon Moss Name Paul Godden
Title Senior Power Generation Engineer
Title Global Service Leader – Power Generation
2019 Costs and Technical Parameter Review - Revision 3 3
Contents 1 Introduction .................................................................................................................................................. 5
1.1 Background .............................................................................................................................. 5
1.2 Scope of study .......................................................................................................................... 5
1.3 Abbreviations ............................................................................................................................ 6
2 Limitations ................................................................................................................................................... 7
2.1 General ..................................................................................................................................... 7
2.2 Thermoflow Inc. Software ......................................................................................................... 7
2.3 Costs and Budget ..................................................................................................................... 7
3 Methodology and Definitions ..................................................................................................................... 8
3.1 Methodology ............................................................................................................................. 8
3.2 Assumptions and Basis ............................................................................................................ 8
3.3 Definitions ............................................................................................................................... 10
4 New Entrant Generation Development Candidates ............................................................................... 13
4.1 Overview ................................................................................................................................. 13
4.2 Onshore wind ......................................................................................................................... 13
4.3 Offshore wind ......................................................................................................................... 16
4.4 Large-scale solar photovoltaic (PV) ....................................................................................... 20
4.5 Concentrated solar thermal .................................................................................................... 23
4.6 Reciprocating engines ............................................................................................................ 27
4.7 Open Cycle Gas Turbine ........................................................................................................ 30
4.8 Combined-cycle Gas Turbines ............................................................................................... 33
4.9 Electrolysers / fuel cells .......................................................................................................... 36
4.10 Battery Energy Storage System (BESS) ................................................................................ 42
5 Capacity Factors for New Solar and Wind Generators.......................................................................... 46
Appendices
Appendix A
AEMO GenCost 2019 Excel Spreadsheets
2019 Costs and Technical Parameter Review - Revision 3 4
Figures
Figure 4-1 Increase in wind turbine size over time
Figure 5-1 Capacity Factors for new solar and wind generators over time – NEM wide trend
Tables
Table 1-2 Acronyms / Abbreviations
Table 3-1 Power generation / storage facility key assumptions
Table 3-1 Power generation / storage facility terminal points
Table 3-2 Definition of key terms
Table 4-1 Configuration and performance
Table 4-2 Technical parameters and project timeline
Table 4-3 Cost estimates
Table 4-4 Configuration and performance
Table 4-5 Technical parameters and project timeline
Table 4-6 Cost estimates
Table 4-7 Configuration and performance
Table 4-8 Technical parameters and project timeline
Table 4-9 Cost estimates
Table 4-10 Configuration and performance
Table 4-11 Technical parameters and project timeline
Table 4-12 Cost estimates
Table 4-13 Configuration and performance
Table 4-14 Technical parameters and project timeline
Table 4-15 Cost estimates
Table 4-16 Configuration and performance
Table 4-17 Technical parameters and project timeline
Table 4-18 Cost estimates
Table 4-19 Configuration and performance
Table 4-20 Technical parameters and project timeline
Table 4-21 Cost estimates
Table 4-22 Electrolyser configuration and performance
Table 4-23 Technical parameters and project timeline
Table 4-24 Cost estimates
Table 4-25 Fuel cell configuration and performance
Table 4-26 Technical parameters and project timeline
Table 4-27 Cost estimates
Table 4-28 Fuel cell configuration and performance
Table 4-29 Technical parameters and project timeline
Table 4-30 Cost estimates
Table 5-1 Capacity Factors for new solar and wind generators
2019 Costs and Technical Parameter Review - Revision 3 5
1 Introduction
1.1 Background
The Australian Energy Market Operator (AEMO) is responsible for operating the National Electricity Market
(NEM) in Eastern and South-Eastern Australia, and the Wholesale Electricity Market (WEM) in Western
Australia.
AEMO’s forecasting functions can influence the behaviour of existing generation assets and the economics
and location of future investment and retirement decisions. These forecasts rely on various input assumptions.
AEMO has engaged Aurecon to review and prepare an updated set of generation technology input data to be
used in AEMO forecasting studies and to be published on the AEMO website.
The updated dataset includes current technology costs and technical operating parameters for both existing
and emerging generation technologies, including those with minimal current local or international deployment.
The dataset is intended to be used by AEMO, and shared with industry, to conduct market simulation studies
for medium and long-term forecasting purposes. This data will be then used in various AEMO forecasting
publications.
1.2 Scope of study
The scope of this study was to prepare an updated set of costs and technical parameters for a concise list of
new entrant generation (and storage) technologies, including the following:
◼ Onshore wind
◼ Offshore wind
◼ Large-scale solar PV
◼ Solar thermal (with and without storage)
◼ Reciprocating engines
◼ Combined-cycle gas turbine (CCGT)
◼ Open-cycle gas turbine (OCGT)
◼ Electrolysers / fuel cells
◼ Battery Energy Storage Systems (BESSs) with 1 to 8 hours storage
The parameters to be updated or developed include the following:
◼ Performance – such as output, efficiencies, and capacity factors
◼ Timeframes – such as for development and operational life
◼ Technical and operational parameters – such as configuration, ramp rates, and minimum generation
◼ Costs – including for development, capital costs and O&M costs (both fixed and variable)
The updated dataset is provided in the accompanying Microsoft Excel spreadsheet (see Appendix A) the
template for which was developed by AEMO. This report provides supporting information for the dataset and
an overview of the scope, methodology, assumptions, and definition of terms used in the dataset and its
development.
The intention is for the updated dataset to form a key input to the long-term capital cost curves in the 2019
GenCost publication to be prepared by CSIRO in conjunction with AEMO as well as other various AEMO
forecasting publications.

2019 Costs and Technical Parameter Review - Revision 3 6
1.3 Abbreviations
Table 1-1 Acronyms / Abbreviations
Acronym Definition
AEMO Australian Energy Market Operator
AUD Australian Dollar
BESS Battery Energy Storage System
C&I Commercial and Industrial
CAPEX Capital Expenditure
CCGT Combined-cycle Gas Turbine
DNI Direct Normal Irradiance
EPC Engineer Procure and Construct
FFR Fast Frequency Response
GJ Gigajoule
GST Goods and Services Tax
HHV Higher Heating Value
LCOE Levelised Cost Of Electricity
LHV Lower Heating Value
MCR Maximum Continuous Rating
MW Megawatt
MWh Megawatt-hour
NEM National Electricity Market
OCGT Open Cycle Gas Turbine
OEM Original Equipment Manufacturer
OPEX Operational Expenditure
O&M Operations and Maintenance
PEM Proton Exchange Membrane
PV Photovoltaic
SAT Single-axis Tracking
WEM Wholesale Electricity Market

2019 Costs and Technical Parameter Review - Revision 3 7
2 Limitations
2.1 General
This report has been prepared by Aurecon on behalf of, and for the exclusive use of, AEMO. It is subject to -
and issued in connection with the provisions of the agreement between Aurecon and AEMO.
Power generation conceptual design is not an exact science, and there are several variables that may affect
the results. Bearing this in mind, the results provide reasonable guidance as to the ability of the power
generation facility to perform adequately, rather than an exact analysis of all the parameters involved.
This report is not a certification, warranty, or guarantee. It is a report scoped in accordance with the instructions
given by AEMO and limited by the agreed time allowed.
The findings, observations, and conclusions expressed by Aurecon in this report are not and should not be
considered an opinion concerning the commercial feasibility of such a project.
This report is partly based on information provided to Aurecon by AEMO. This report is provided strictly on the
basis that the information provided to Aurecon is accurate, complete and adequate, unless stated otherwise.
If AEMO or a third party should become aware of any inaccuracy in, or change to, any of the facts, findings or
assumptions made either in this report or elsewhere, AEMO or a third party should inform Aurecon so that
Aurecon can assess its significance and review its comments and recommendations.
2.2 Thermoflow Inc. Software
This report relies on outputs generated from Thermoflow Inc. software by personnel in Aurecon experienced
in using this software. The provider of this software does not guarantee results obtained using this software,
nor accept liability for any claimed damages arising out of use or misuse of its software. Aurecon's report is
provided strictly on the basis that the outputs that have been generated are accurate, complete, and adequate.
Aurecon takes no responsibility and disclaims all liability whatsoever for any loss or damage that AEMO may
suffer resulting from any conclusions based on outputs generated by Aurecon using this software.
2.3 Costs and Budget
Aurecon has no control over the cost of labour, materials, equipment, or services furnished by others. Aurecon
similarly has no control over Contractors’ methods of determining prices, or over competitive bidding or market
conditions. Any opinion or estimate of costs by Aurecon is made on the basis of Aurecon’s experience and
qualifications, and represents Aurecon’s judgment as an experienced and qualified professional engineering
organisation, familiar with the construction industry. However, Aurecon cannot and does not guarantee that
proposals, bids, or actual construction costs will not vary from Aurecon’s estimates.
2019 Costs and Technical Parameter Review - Revision 3 8
3 Methodology and Definitions
3.1 Methodology
The dataset for the new entrant technologies has been developed and updated based on a hypothetical project
selected as being representative for each examined technology, and which would or could be typically installed
in the NEM as a market participant.
The size and configuration for each hypothetical project has been selected based on Aurecon’s current
experience with existing and recent / proposed new entrant power generation and storage projects in Australia,
particularly in the NEM. The intent is that the technical and cost information developed for these hypothetical
projects can be used as a basis by others with adjustment as needed for its specific purpose or project (i.e.
scale on a $/MW basis, inflate to account for regional or remote cost factors, etc).
The performance figures and technical parameters have been based on actual project information where
available, or vendor provided information. Throughout the report, the source and basis of this information is
identified.
Our cost estimates have been developed based on collating information from the following sources:
◼ Aurecon’s internal database of projects – recently constructed or under construction
◼ Recent bid information from EPC competitive tendering processes
◼ Industry publications and publicly available data
This cost data has been levelised or adjusted to account for differences in battery limits, scope, location factors,
technical factors (where relevant), etc.
A representative cost has been selected for the hypothetical project from the data available, and cost certainty
qualified based on the spread and quality of data available.
Recent trends for each technology have been reviewed and discussed throughout the report. These have been
considered when selecting the hypothetical project, nominating technical parameters, and developing the cost
estimates on a 2019 basis.
3.2 Assumptions and Basis
3.2.1 General
This section defines the basis used for the hypothetical projects and for determining the technical parameters
and cost estimates.
3.2.2 Power generation / storage facility
Power generation or storage facility equipment and installation scope is based on the assumptions as
described in the following table.
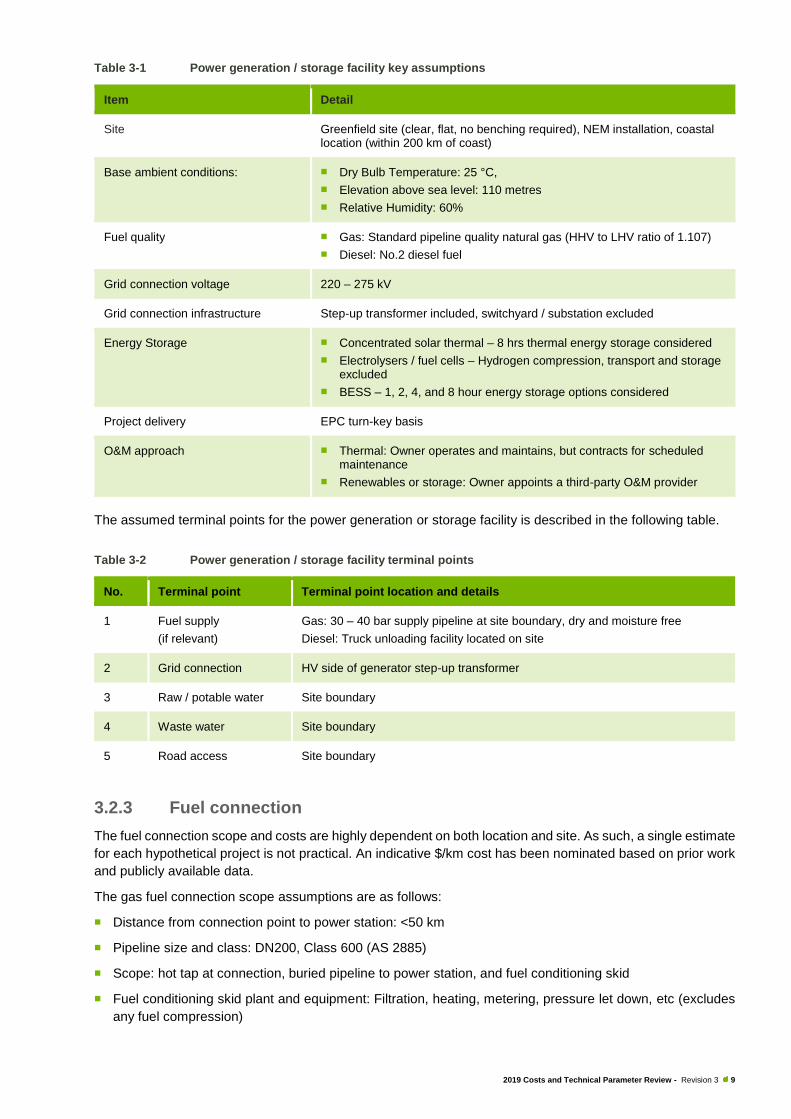
2019 Costs and Technical Parameter Review - Revision 3 9
Table 3-1 Power generation / storage facility key assumptions
Item Detail
Site Greenfield site (clear, flat, no benching required), NEM installation, coastal location (within 200 km of coast)
Base ambient conditions:
◼ Dry Bulb Temperature: 25 °C,
◼ Elevation above sea level: 110 metres
◼ Relative Humidity: 60%
Fuel quality ◼ Gas: Standard pipeline quality natural gas (HHV to LHV ratio of 1.107)
◼ Diesel: No.2 diesel fuel
Grid connection voltage 220 – 275 kV
Grid connection infrastructure Step-up transformer included, switchyard / substation excluded
Energy Storage ◼ Concentrated solar thermal – 8 hrs thermal energy storage considered
◼ Electrolysers / fuel cells – Hydrogen compression, transport and storage excluded
◼ BESS – 1, 2, 4, and 8 hour energy storage options considered
Project delivery EPC turn-key basis
O&M approach ◼ Thermal: Owner operates and maintains, but contracts for scheduled maintenance
◼ Renewables or storage: Owner appoints a third-party O&M provider
The assumed terminal points for the power generation or storage facility is described in the following table.
Table 3-2 Power generation / storage facility terminal points
No. Terminal point Terminal point location and details
1 Fuel supply
(if relevant)
Gas: 30 – 40 bar supply pipeline at site boundary, dry and moisture free
Diesel: Truck unloading facility located on site
2 Grid connection HV side of generator step-up transformer
3 Raw / potable water Site boundary
4 Waste water Site boundary
5 Road access Site boundary
3.2.3 Fuel connection
The fuel connection scope and costs are highly dependent on both location and site. As such, a single estimate
for each hypothetical project is not practical. An indicative $/km cost has been nominated based on prior work
and publicly available data.
The gas fuel connection scope assumptions are as follows:
◼ Distance from connection point to power station: <50 km
◼ Pipeline size and class: DN200, Class 600 (AS 2885)
◼ Scope: hot tap at connection, buried pipeline to power station, and fuel conditioning skid
◼ Fuel conditioning skid plant and equipment: Filtration, heating, metering, pressure let down, etc (excludes
any fuel compression)
2019 Costs and Technical Parameter Review - Revision 3 10
3.2.4 Development and land costs
The development and land costs for a power generation or storage project typically include the following
components:
◼ Legal and technical advisory costs
◼ Financing and insurance
◼ Project administration, grid connection studies, and agreements
◼ Permits and licences, approvals (development, environmental, etc)
◼ Land procurement and applications
The costs for project and land procurement are highly variable and project specific. An indicative estimate has
been determined based on a percentage of CAPEX estimate for each technology from recent projects, and
experience with development processes.
3.2.5 Financial assumptions
The following key assumptions have been made regarding the cost estimates:
◼ Prices in AUD, 2019 basis
◼ New plant (no second hand or refurbished equipment assumed)
◼ Competitive tender process for the plant and equipment
◼ Taxes and import / custom duties excluded
◼ No contingency applied
It is important to note that without specific engagement with potential OEM suppliers and/or issuing a detailed
EPC specification for tender, it is not possible to obtain a high accuracy estimate of the costs. The risk and
profit components of EPC contracts can vary considerably from project to project and are dependent upon
factors such as:
◼ Project location
◼ Cost of labour
◼ Cost of materials
◼ Market conditions
◼ Exchange rates
The accuracy / certainty of the cost estimates is targeted at +/- 30% based on the spread and quality of data
available and our experience with the impact of the above factors.
3.3 Definitions
The following table provides definitions for each of the key terms used throughout this document and in the
Excel-based dataset.
Table 3-3 Definition of key terms
Term Definition
Summer rating conditions DBT: 35°C
Base / design conditions DBT: 25°C, RH: 60%, 110 m elevation
Not summer rating conditions DBT: 15°C
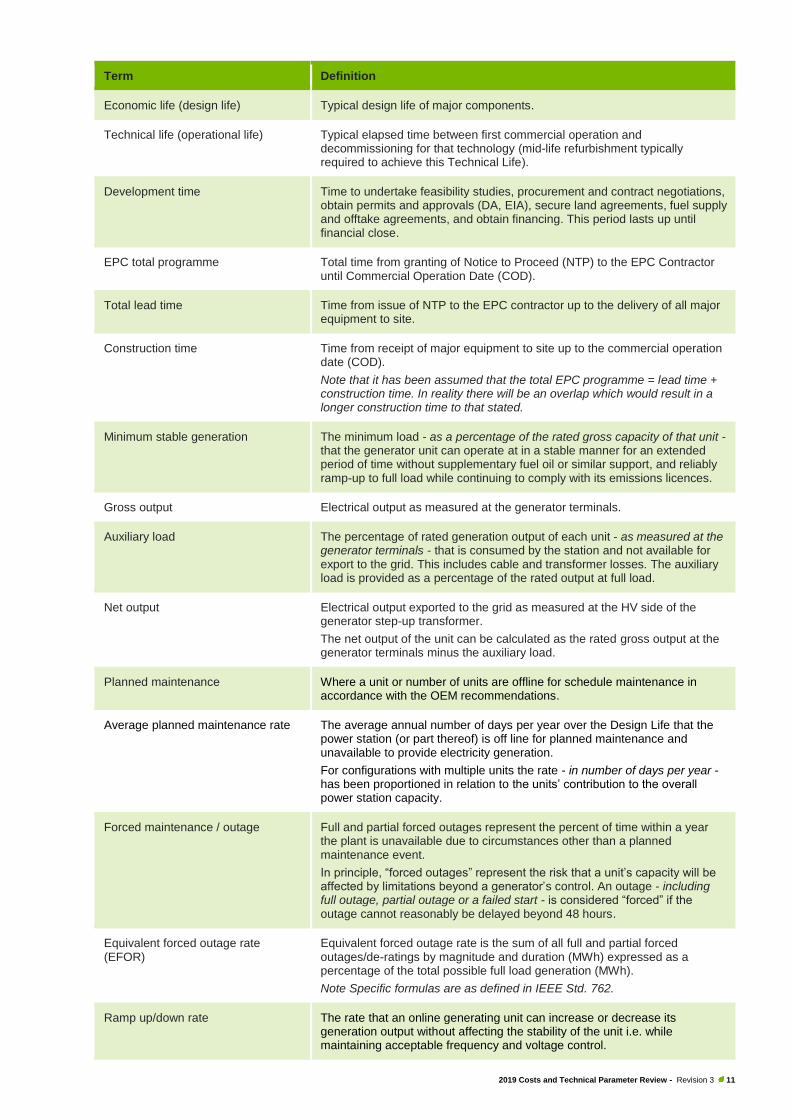
2019 Costs and Technical Parameter Review - Revision 3 11
Term Definition
Economic life (design life) Typical design life of major components.
Technical life (operational life) Typical elapsed time between first commercial operation and decommissioning for that technology (mid-life refurbishment typically required to achieve this Technical Life).
Development time Time to undertake feasibility studies, procurement and contract negotiations, obtain permits and approvals (DA, EIA), secure land agreements, fuel supply and offtake agreements, and obtain financing. This period lasts up until financial close.
EPC total programme Total time from granting of Notice to Proceed (NTP) to the EPC Contractor until Commercial Operation Date (COD).
Total lead time Time from issue of NTP to the EPC contractor up to the delivery of all major equipment to site.
Construction time Time from receipt of major equipment to site up to the commercial operation date (COD).
Note that it has been assumed that the total EPC programme = lead time + construction time. In reality there will be an overlap which would result in a longer construction time to that stated.
Minimum stable generation The minimum load - as a percentage of the rated gross capacity of that unit - that the generator unit can operate at in a stable manner for an extended period of time without supplementary fuel oil or similar support, and reliably ramp-up to full load while continuing to comply with its emissions licences.
Gross output Electrical output as measured at the generator terminals.
Auxiliary load The percentage of rated generation output of each unit - as measured at the generator terminals - that is consumed by the station and not available for export to the grid. This includes cable and transformer losses. The auxiliary load is provided as a percentage of the rated output at full load.
Net output Electrical output exported to the grid as measured at the HV side of the generator step-up transformer.
The net output of the unit can be calculated as the rated gross output at the generator terminals minus the auxiliary load.
Planned maintenance Where a unit or number of units are offline for schedule maintenance in accordance with the OEM recommendations.
Average planned maintenance rate
The average annual number of days per year over the Design Life that the power station (or part thereof) is off line for planned maintenance and unavailable to provide electricity generation.
For configurations with multiple units the rate - in number of days per year - has been proportioned in relation to the units’ contribution to the overall power station capacity.
Forced maintenance / outage Full and partial forced outages represent the percent of time within a year the plant is unavailable due to circumstances other than a planned maintenance event.
In principle, “forced outages” represent the risk that a unit’s capacity will be affected by limitations beyond a generator’s control. An outage - including full outage, partial outage or a failed start - is considered “forced” if the outage cannot reasonably be delayed beyond 48 hours.
Equivalent forced outage rate (EFOR)
Equivalent forced outage rate is the sum of all full and partial forced outages/de-ratings by magnitude and duration (MWh) expressed as a percentage of the total possible full load generation (MWh).
Note Specific formulas are as defined in IEEE Std. 762.
Ramp up/down rate The rate that an online generating unit can increase or decrease its generation output without affecting the stability of the unit i.e. while maintaining acceptable frequency and voltage control.

2019 Costs and Technical Parameter Review - Revision 3 12
Term Definition
Heat rate The ratio thermal energy consumed in fuel over the electrical energy generated.
Efficiency Calculated using: Efficiency (%) = 3600 / Heat Rate (kJ/kWh) x 100
Battery storage: Charge efficiency The efficiency of the battery energy storage system (in %) when the battery is being charged.
Battery storage: Discharge efficiency The efficiency of the battery energy storage system (in %) when the battery is being discharged.
Battery storage: Allowable maximum state of charge (%)
The maximum charge % of the battery system.
Battery storage: Allowable minimum state of charge (%)
The minimum charge % of the battery system.
Battery storage: Maximum number of cycles
The maximum total number of cycles within a typical battery lifetime.
Battery storage: Depth of discharge (DoD)
The percentage to which the battery can be discharged – i.e. the difference between the maximum allowable charge state and the minimum allowance charge state.
Total EPC cost The EPC contract sum.
Equipment cost The component of the EPC contract sum that is primarily attributed to the supply of the major equipment.
Note that the EPC cost has been split into “equipment cost” and “installation cost” for the purpose of this study, based on a typical proportion for that technology. Other EPC cost factors such as engineering, overhead, risk, profit, etc have been generally distributed.
Installation cost
The component of the EPC contract sum that is primarily attributed to the site construction, installation, and commissioning works.
Note that the EPC cost has been split into “equipment cost” and “installation cost” for the purpose of this study based on a typical proportion for that technology. Other EPC cost factors such as engineering, overhead, risk, profit, etc have been generally distributed.
Fixed operating cost ($/MW Net/year) Fixed costs include; plant O&M staff, insurance, minor contract work, and miscellaneous fixed charges such as service contracts, overheads, and licences.
For some technologies where operation and maintenance are holistically covered by O&M and/or LTMA type contracts, all of the Operating Costs have been classed as “fixed” for the purposes of this study.
Variable operating cost ($/MWh Net) Variable costs include; spare parts, scheduled maintenance, and consumables (chemicals and oils).
Variable costs exclude fuel consumption costs.
Total annual O&M Cost Annual average O&M cost over the design life.

2019 Costs and Technical Parameter Review - Revision 3 13
4 New Entrant Generation
Development Candidates
4.1 Overview
The following sections provide the technical and cost parameters for each of the nominated new entrant
technologies, along with a brief discussion of typical options and recent trends. The information in the
respective tables has been used to populate the AEMO GenCost 2019 Excel spreadsheets, which are included
in Appendix A.
4.2 Onshore wind
4.2.1 Overview
Wind energy - along with solar PV - is one of the leading types of new renewable power generation
technologies installed, both globally and in Australia. The most common technology used is the three-bladed
horizontal-axis wind turbines (HAWT), with the blades upwind of the tower. These turbines are typically
classified by the design wind speed and turbulence intensity of the wind (i.e. Class IA to IIIC). Grid-connected
wind turbines are considered a reliable and mature technology with many years of operational experience.
4.2.2 Typical options
Currently deployed utility-scale wind turbine sizes range from 1 to 4 MW with hub heights of 50 to 150 m and
rotor diameters of 60 m to 140 m. New models proposed for future projects are approaching 6 MW capacity
with 160 m rotors.
Onshore wind developments are critically dependent on:
◼ Access to land
◼ Planning permissions / development consents
◼ Nearby grid transmission capacity
Depending on the above, modern onshore wind farms can range from 1 to over 150 turbines. Different OEMs
and turbine models have slightly different power curves, with some more suited to a particular site wind
resource than others. As such, selection of the optimal and lowest levelised cost of energy (LCOE) option is
highly site-specific.
Modern projects are also increasingly being delivered with a battery and or adjoined solar PV generation to
reduce intermittency of generation.
4.2.3 Recent trends
The design wind range for wind turbines has changed over the last few decades. Early focus was on very
windy sites for best economics e.g. Class I = 8.5m/s to 10m/s. Class I wind turbines now only represents a
small fraction (10%) of total manufacturing worldwide. Currently large turbines are being used in medium
(Class II) and low wind speed sites (Class III) to achieve net capacity factors that can exceed 40%.
2019 Costs and Technical Parameter Review - Revision 3 14
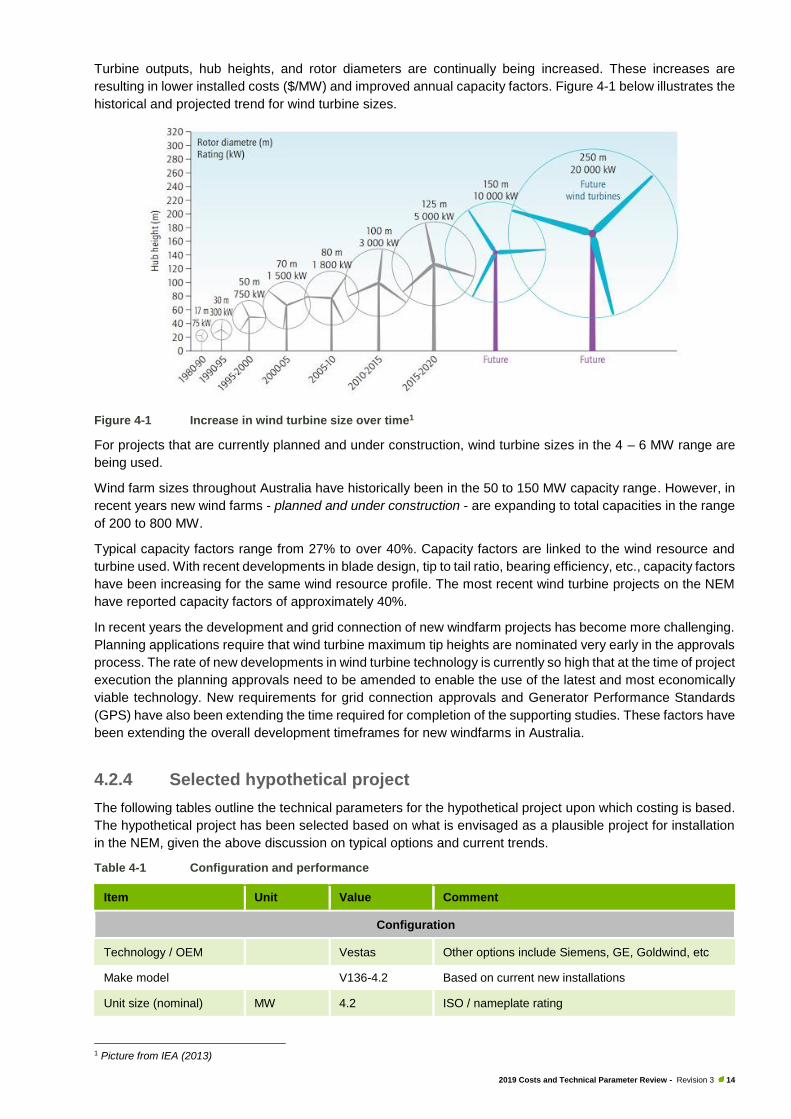
Turbine outputs, hub heights, and rotor diameters are continually being increased. These increases are
resulting in lower installed costs ($/MW) and improved annual capacity factors. Figure 4-1 below illustrates the
historical and projected trend for wind turbine sizes.
Figure 4-1 Increase in wind turbine size over time1
For projects that are currently planned and under construction, wind turbine sizes in the 4 – 6 MW range are
being used.
Wind farm sizes throughout Australia have historically been in the 50 to 150 MW capacity range. However, in
recent years new wind farms - planned and under construction - are expanding to total capacities in the range
of 200 to 800 MW.
Typical capacity factors range from 27% to over 40%. Capacity factors are linked to the wind resource and
turbine used. With recent developments in blade design, tip to tail ratio, bearing efficiency, etc., capacity factors
have been increasing for the same wind resource profile. The most recent wind turbine projects on the NEM
have reported capacity factors of approximately 40%.
In recent years the development and grid connection of new windfarm projects has become more challenging.
Planning applications require that wind turbine maximum tip heights are nominated very early in the approvals
process. The rate of new developments in wind turbine technology is currently so high that at the time of project
execution the planning approvals need to be amended to enable the use of the latest and most economically
viable technology. New requirements for grid connection approvals and Generator Performance Standards
(GPS) have also been extending the time required for completion of the supporting studies. These factors have
been extending the overall development timeframes for new windfarms in Australia.
4.2.4 Selected hypothetical project
The following tables outline the technical parameters for the hypothetical project upon which costing is based.
The hypothetical project has been selected based on what is envisaged as a plausible project for installation
in the NEM, given the above discussion on typical options and current trends.
Table 4-1 Configuration and performance
Item Unit Value Comment
Configuration
Technology / OEM Vestas Other options include Siemens, GE, Goldwind, etc
Make model V136-4.2 Based on current new installations
Unit size (nominal) MW 4.2 ISO / nameplate rating
1 Picture from IEA (2013)
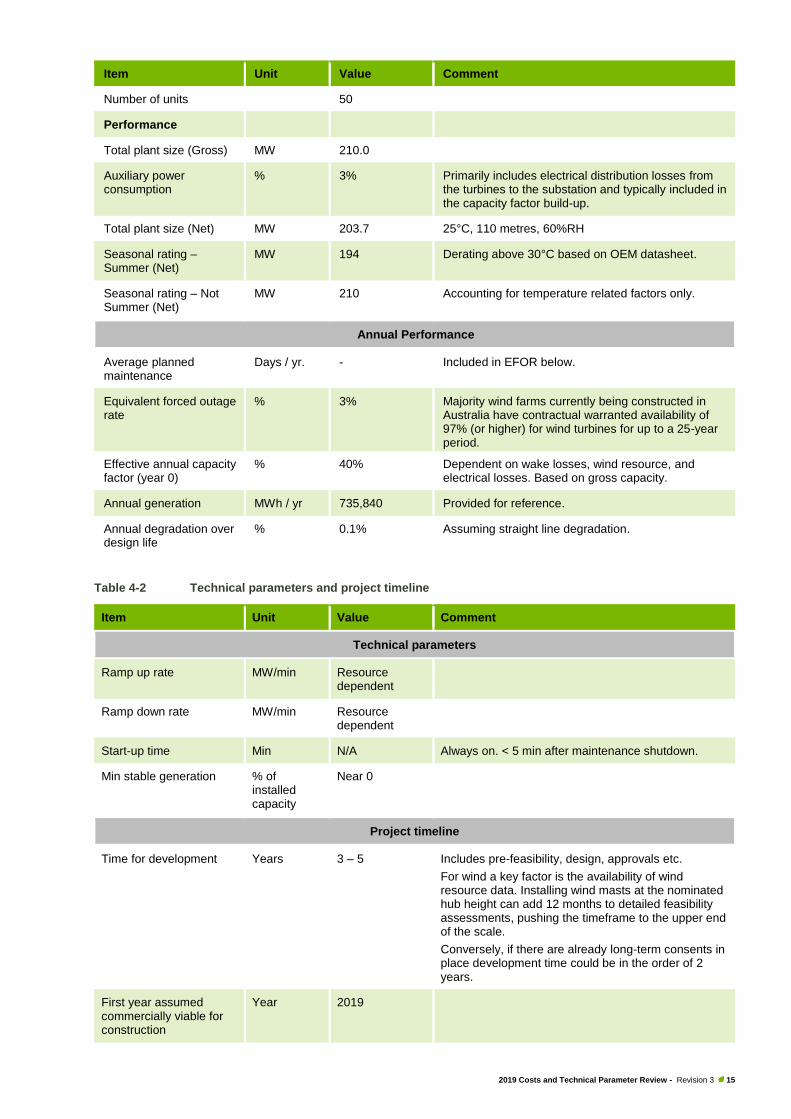
2019 Costs and Technical Parameter Review - Revision 3 15
Item Unit Value Comment
Number of units 50
Performance
Total plant size (Gross) MW 210.0
Auxiliary power consumption
% 3% Primarily includes electrical distribution losses from the turbines to the substation and typically included in the capacity factor build-up.
Total plant size (Net) MW 203.7 25°C, 110 metres, 60%RH
Seasonal rating – Summer (Net)
MW 194 Derating above 30°C based on OEM datasheet.
Seasonal rating – Not Summer (Net)
MW 210 Accounting for temperature related factors only.
Annual Performance
Average planned maintenance
Days / yr. - Included in EFOR below.
Equivalent forced outage rate
% 3% Majority wind farms currently being constructed in Australia have contractual warranted availability of 97% (or higher) for wind turbines for up to a 25-year period.
Effective annual capacity factor (year 0)
% 40% Dependent on wake losses, wind resource, and electrical losses. Based on gross capacity.
Annual generation MWh / yr 735,840 Provided for reference.
Annual degradation over design life
% 0.1% Assuming straight line degradation.
Table 4-2 Technical parameters and project timeline
Item Unit Value Comment
Technical parameters
Ramp up rate MW/min Resource dependent
Ramp down rate MW/min Resource dependent
Start-up time Min N/A Always on. < 5 min after maintenance shutdown.
Min stable generation % of installed capacity
Near 0
Project timeline
Time for development Years 3 – 5 Includes pre-feasibility, design, approvals etc.
For wind a key factor is the availability of wind resource data. Installing wind masts at the nominated hub height can add 12 months to detailed feasibility assessments, pushing the timeframe to the upper end of the scale.
Conversely, if there are already long-term consents in place development time could be in the order of 2 years.
First year assumed commercially viable for construction
Year 2019
2019 Costs and Technical Parameter Review - Revision 3 16
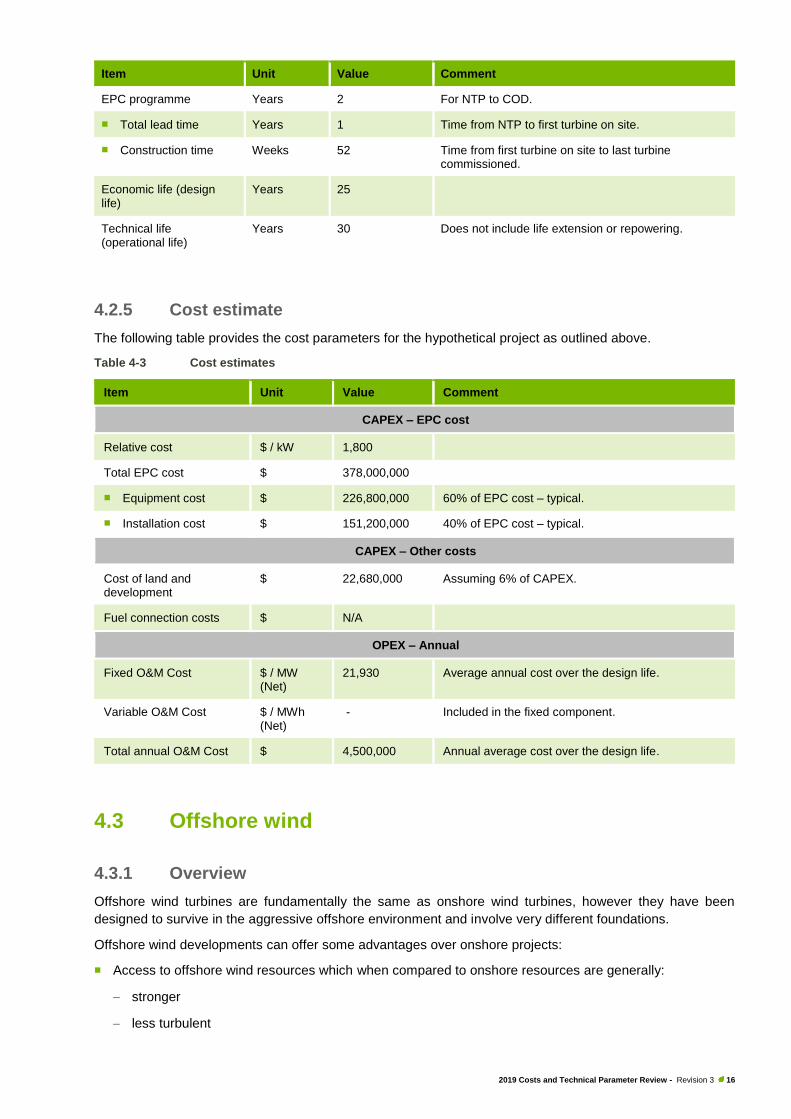
Item Unit Value Comment
EPC programme Years 2 For NTP to COD.
◼ Total lead time Years 1 Time from NTP to first turbine on site.
◼ Construction time Weeks 52 Time from first turbine on site to last turbine commissioned.
Economic life (design life)
Years 25
Technical life (operational life)
Years 30 Does not include life extension or repowering.
4.2.5 Cost estimate
The following table provides the cost parameters for the hypothetical project as outlined above.
Table 4-3 Cost estimates
Item Unit Value Comment
CAPEX – EPC cost
Relative cost $ / kW 1,800
Total EPC cost $ 378,000,000
◼ Equipment cost $ 226,800,000 60% of EPC cost – typical.
◼ Installation cost $ 151,200,000 40% of EPC cost – typical.
CAPEX – Other costs
Cost of land and development
$ 22,680,000 Assuming 6% of CAPEX.
Fuel connection costs $ N/A
OPEX – Annual
Fixed O&M Cost $ / MW (Net)
21,930 Average annual cost over the design life.
Variable O&M Cost $ / MWh (Net)
- Included in the fixed component.
Total annual O&M Cost $ 4,500,000 Annual average cost over the design life.
4.3 Offshore wind
4.3.1 Overview
Offshore wind turbines are fundamentally the same as onshore wind turbines, however they have been
designed to survive in the aggressive offshore environment and involve very different foundations.
Offshore wind developments can offer some advantages over onshore projects:
◼ Access to offshore wind resources which when compared to onshore resources are generally:
− stronger
− less turbulent
2019 Costs and Technical Parameter Review - Revision 3 17
− can have better temporal alignment with generic demand profiles (i.e. windier in the late afternoon
than onshore)
◼ Reduced visual and noise pollution concerns, due to being out at sea
◼ An offshore development adjacent to a large demand centre (city) can avoid expensive overland
transmission compared to some onshore projects
◼ Turbines are typically manufactured near cannels or ports and barged to site
A combination of the above factors permits the use of much larger wind turbines offshore which can improve
project economics. Commonly cited challenges include:
◼ Proximity to onshore transmission infrastructure and associated costs
◼ Harsh conditions from marine operating environment
◼ Expensive operation and maintenance costs of offshore sites
◼ High balance of plant costs (foundations and electrical connections) which are the major cost for offshore
sites where as for onshore projects the major costs are the turbines
It is also worth noting that development of an offshore project - especially given the non-existent offshore wind
market in Australia compared to Europe - would be significantly more complicated and involved than an
onshore project, which would impact project development timelines accordingly.
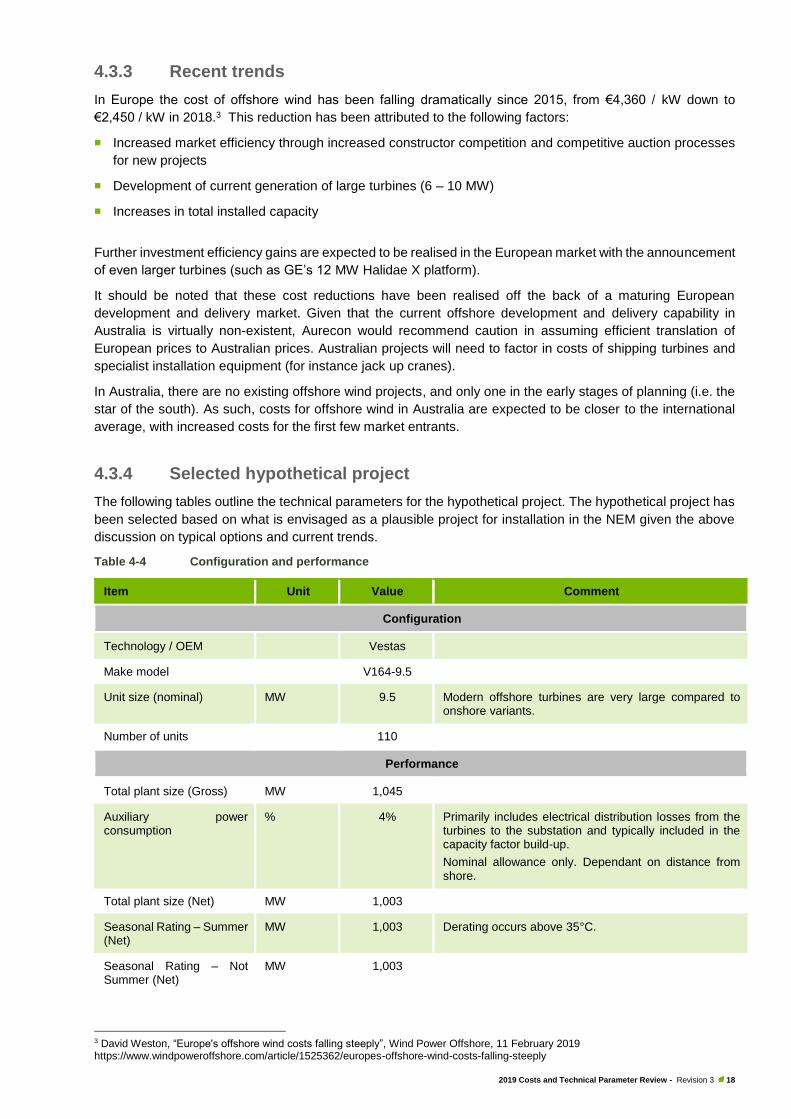
4.3.2 Typical options
Existing offshore wind turbines range in nameplate capacity from 3 MW to 7 MW, with correspondingly large
rotor diameters but hub-heights in similar or slightly larger ranges than onshore equivalents. Aurecon notes
however, that the market is trending towards much larger turbines (see section 4.3.3 below).
Offshore wind farms are typically larger in both turbine number and total output due to the following:
◼ Significant capital expenditure associated with the challenging nature of offshore construction and
maintenance requires lager builds to drive down normalised capital and operational costs
◼ Reduced limitations arising from land parcel boundaries and associated complications
As such it is not uncommon to have offshore projects in development with 50-150 turbines and 400 MW+
capacity. Aurecon notes that globally there are multiple projects in the development pipeline with capacities in
excess of 1,000 MW.
Contrary to the use of the term ‘offshore’ in the oil and gas industry, offshore wind turbines are currently limited
to fjords, lakes and continental shelves with a depth upper limit of 50 – 60 m. Note that:
◼ Traditionally mounted wind turbines are mounted on a single monopile in water depths <30 m.
◼ More recently complex structures have been developed to reach deeper waters, including tripod style piled
structures, which are suitable for depths of up to 60 – 80 m.
For depths over 60 – 80 m floating type structures have been used with a number or demonstration turbines
installed or in planning. The first commercially operating wind farm using floating type structure, Hywind
Scotland, was commissioned in late 20172 and so this is still considered to be in the early commercialisation
stage.
2 https://www.windpowerengineering.com/business-news-projects/worlds-first-floating-wind-farm-delivers-promising-results/
2019 Costs and Technical Parameter Review - Revision 3 18
4.3.3 Recent trends
In Europe the cost of offshore wind has been falling dramatically since 2015, from €4,360 / kW down to
€2,450 / kW in 2018.3 This reduction has been attributed to the following factors:
◼ Increased market efficiency through increased constructor competition and competitive auction processes
for new projects
◼ Development of current generation of large turbines (6 – 10 MW)
◼ Increases in total installed capacity
Further investment efficiency gains are expected to be realised in the European market with the announcement
of even larger turbines (such as GE’s 12 MW Halidae X platform).
It should be noted that these cost reductions have been realised off the back of a maturing European
development and delivery market. Given that the current offshore development and delivery capability in
Australia is virtually non-existent, Aurecon would recommend caution in assuming efficient translation of
European prices to Australian prices. Australian projects will need to factor in costs of shipping turbines and
specialist installation equipment (for instance jack up cranes).
In Australia, there are no existing offshore wind projects, and only one in the early stages of planning (i.e. the
star of the south). As such, costs for offshore wind in Australia are expected to be closer to the international
average, with increased costs for the first few market entrants.
4.3.4 Selected hypothetical project
The following tables outline the technical parameters for the hypothetical project. The hypothetical project has
been selected based on what is envisaged as a plausible project for installation in the NEM given the above
discussion on typical options and current trends.
Table 4-4 Configuration and performance
Item Unit Value Comment
Configuration
Technology / OEM Vestas
Make model V164-9.5
Unit size (nominal) MW 9.5 Modern offshore turbines are very large compared to onshore variants.
Number of units 110
Performance
Total plant size (Gross) MW 1,045
Auxiliary power consumption
% 4% Primarily includes electrical distribution losses from the turbines to the substation and typically included in the capacity factor build-up.
Nominal allowance only. Dependant on distance from shore.
Total plant size (Net) MW 1,003
Seasonal Rating – Summer (Net)
MW 1,003 Derating occurs above 35°C.
Seasonal Rating – Not Summer (Net)
MW 1,003
3 David Weston, “Europe's offshore wind costs falling steeply”, Wind Power Offshore, 11 February 2019 https://www.windpoweroffshore.com/article/1525362/europes-offshore-wind-costs-falling-steeply
2019 Costs and Technical Parameter Review - Revision 3 19
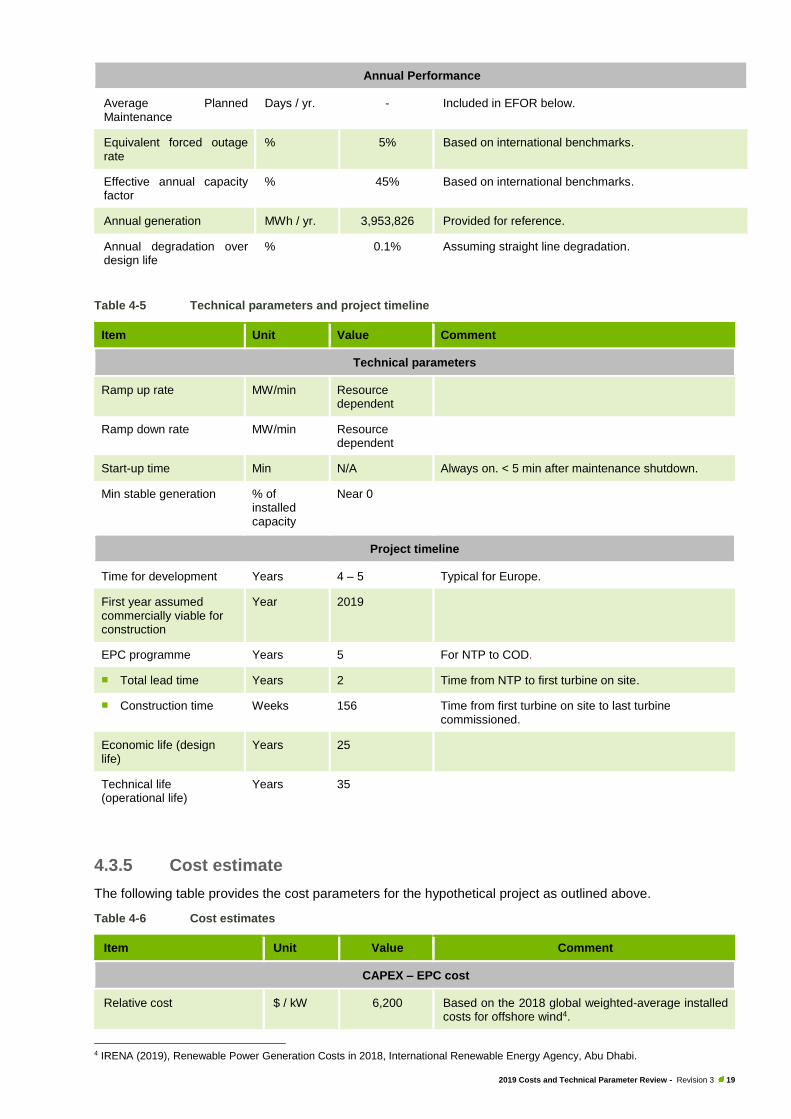
Annual Performance
Average Planned Maintenance
Days / yr. - Included in EFOR below.
Equivalent forced outage rate
% 5% Based on international benchmarks.
Effective annual capacity factor
% 45% Based on international benchmarks.
Annual generation MWh / yr. 3,953,826 Provided for reference.
Annual degradation over design life
% 0.1% Assuming straight line degradation.
Table 4-5 Technical parameters and project timeline
Item Unit Value Comment
Technical parameters
Ramp up rate MW/min Resource dependent
Ramp down rate MW/min Resource dependent
Start-up time Min N/A Always on. < 5 min after maintenance shutdown.
Min stable generation % of installed capacity
Near 0
Project timeline
Time for development Years 4 – 5 Typical for Europe.
First year assumed commercially viable for construction
Year 2019
EPC programme Years 5 For NTP to COD.
◼ Total lead time Years 2 Time from NTP to first turbine on site.
◼ Construction time Weeks 156 Time from first turbine on site to last turbine commissioned.
Economic life (design life)
Years 25
Technical life (operational life)
Years 35
4.3.5 Cost estimate
The following table provides the cost parameters for the hypothetical project as outlined above.
Table 4-6 Cost estimates
Item Unit Value Comment
CAPEX – EPC cost
Relative cost $ / kW 6,200 Based on the 2018 global weighted-average installed costs for offshore wind4.
4 IRENA (2019), Renewable Power Generation Costs in 2018, International Renewable Energy Agency, Abu Dhabi.
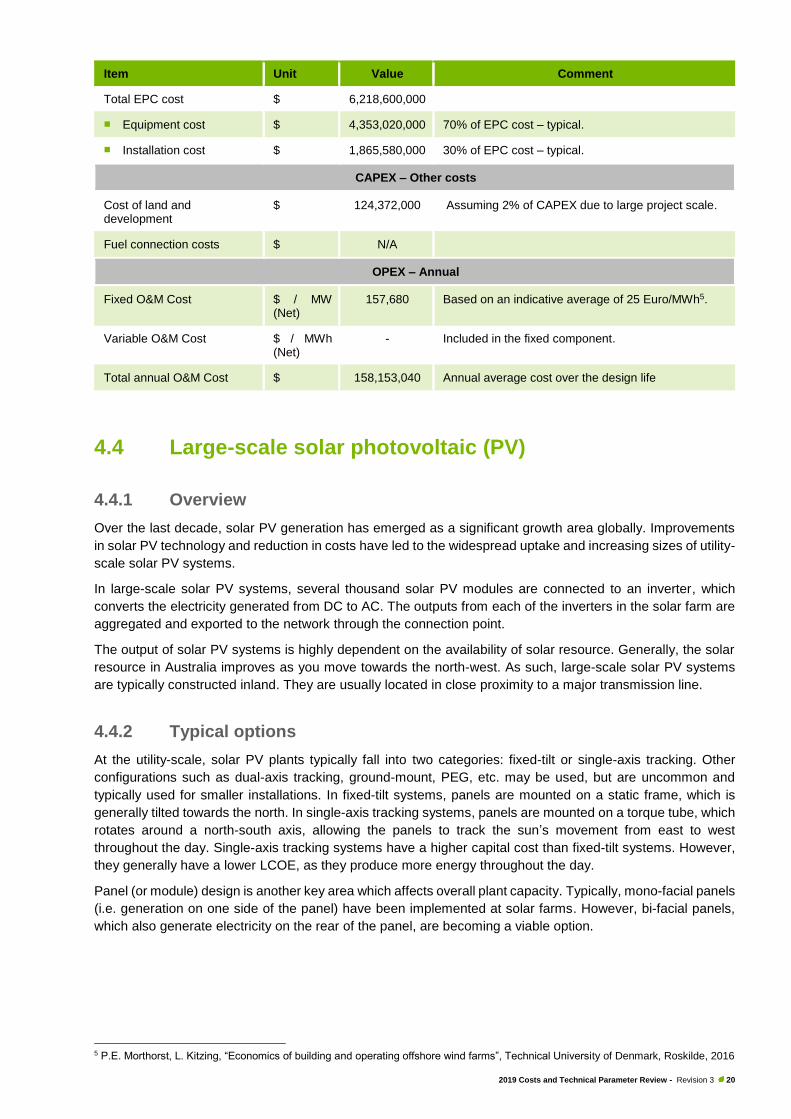
2019 Costs and Technical Parameter Review - Revision 3 20
Item Unit Value Comment
Total EPC cost $ 6,218,600,000
◼ Equipment cost $ 4,353,020,000 70% of EPC cost – typical.
◼ Installation cost $ 1,865,580,000 30% of EPC cost – typical.
CAPEX – Other costs
Cost of land and development
$ 124,372,000 Assuming 2% of CAPEX due to large project scale.
Fuel connection costs $ N/A
OPEX – Annual
Fixed O&M Cost $ / MW (Net)
157,680 Based on an indicative average of 25 Euro/MWh5.
Variable O&M Cost $ / MWh (Net)
- Included in the fixed component.
Total annual O&M Cost $ 158,153,040 Annual average cost over the design life
4.4 Large-scale solar photovoltaic (PV)
4.4.1 Overview
Over the last decade, solar PV generation has emerged as a significant growth area globally. Improvements
in solar PV technology and reduction in costs have led to the widespread uptake and increasing sizes of utility-
scale solar PV systems.
In large-scale solar PV systems, several thousand solar PV modules are connected to an inverter, which
converts the electricity generated from DC to AC. The outputs from each of the inverters in the solar farm are
aggregated and exported to the network through the connection point.
The output of solar PV systems is highly dependent on the availability of solar resource. Generally, the solar
resource in Australia improves as you move towards the north-west. As such, large-scale solar PV systems
are typically constructed inland. They are usually located in close proximity to a major transmission line.
4.4.2 Typical options
At the utility-scale, solar PV plants typically fall into two categories: fixed-tilt or single-axis tracking. Other
configurations such as dual-axis tracking, ground-mount, PEG, etc. may be used, but are uncommon and
typically used for smaller installations. In fixed-tilt systems, panels are mounted on a static frame, which is
generally tilted towards the north. In single-axis tracking systems, panels are mounted on a torque tube, which
rotates around a north-south axis, allowing the panels to track the sun’s movement from east to west
throughout the day. Single-axis tracking systems have a higher capital cost than fixed-tilt systems. However,
they generally have a lower LCOE, as they produce more energy throughout the day.
Panel (or module) design is another key area which affects overall plant capacity. Typically, mono-facial panels
(i.e. generation on one side of the panel) have been implemented at solar farms. However, bi-facial panels,
which also generate electricity on the rear of the panel, are becoming a viable option.
5 P.E. Morthorst, L. Kitzing, “Economics of building and operating offshore wind farms”, Technical University of Denmark, Roskilde, 2016
2019 Costs and Technical Parameter Review - Revision 3 21
4.4.3 Recent trends
The widespread deployment of solar PV systems globally has led to significant reduction in the cost of solar
panels in recent years. Although the rate of solar panel cost reduction is slowing, investment in the sector is
growing, with several large-scale (i.e. >200 MW) solar farms under development in Australia.
Due to the relatively low cost of the solar PV modules, solar developers are increasingly installing more solar
panel capacity than inverter capacity (i.e. higher DC:AC ratio). Though some power generation is curtailed in
the middle of the day, this allows a more consistent, flatter generation profile, with increased generation in the
early morning and late afternoon.
Single-axis tracking systems are becoming widely deployed, due to the increased energy capacity they offer
over fixed-tilt systems in the early morning and late afternoon. This results in improved project economics.
Solar module capacities have been rising over recent years, with modules on utility-scale solar farms under
construction typically around 400 W. Bi-facial panels are increasingly being considered for utility projects,
allowing greater power generation for the same overall footprint.
Many solar farms under construction are experiencing delays in the grid connection process. In order to meet
power quality restrictions enforced under the Generator Performance Standards, several projects have been
required to implement harmonic filters or other power quality remediation measures (i.e. synchronous
condensers), adding cost and time to the project.
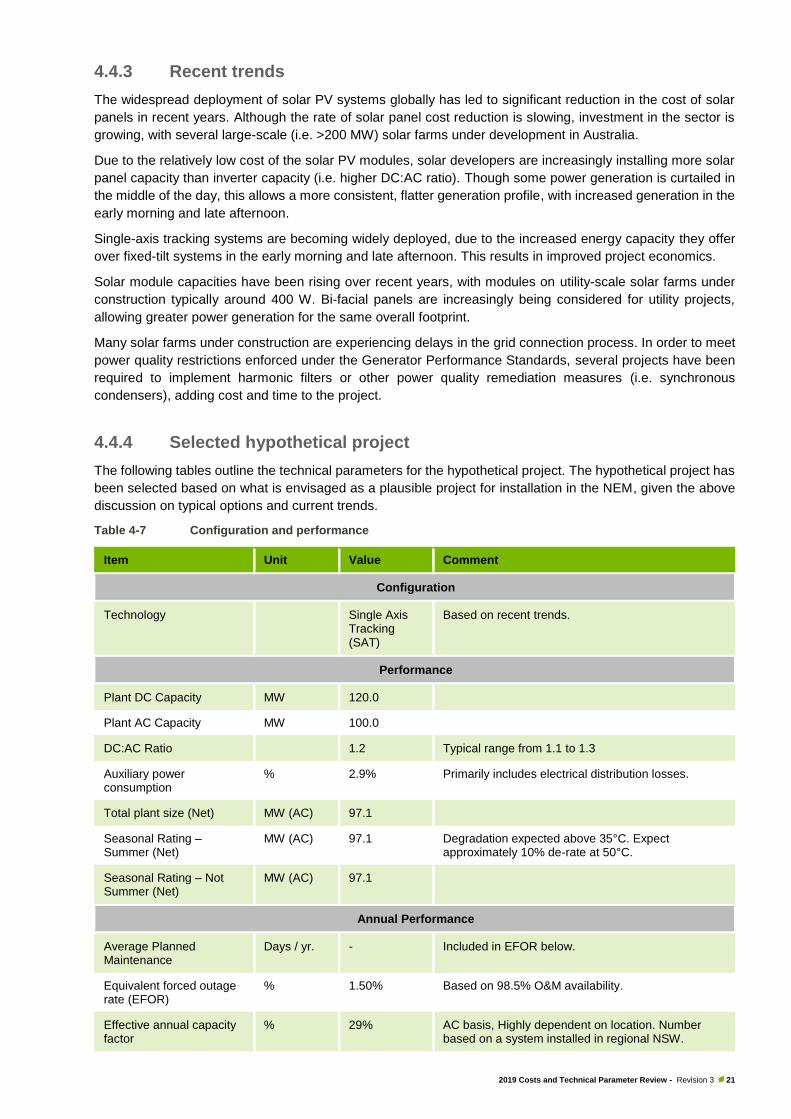
4.4.4 Selected hypothetical project
The following tables outline the technical parameters for the hypothetical project. The hypothetical project has
been selected based on what is envisaged as a plausible project for installation in the NEM, given the above
discussion on typical options and current trends.
Table 4-7 Configuration and performance
Item Unit Value Comment
Configuration
Technology Single Axis Tracking (SAT)
Based on recent trends.
Performance
Plant DC Capacity MW 120.0
Plant AC Capacity MW 100.0
DC:AC Ratio 1.2 Typical range from 1.1 to 1.3
Auxiliary power consumption
% 2.9% Primarily includes electrical distribution losses.
Total plant size (Net) MW (AC) 97.1
Seasonal Rating – Summer (Net)
MW (AC) 97.1 Degradation expected above 35°C. Expect approximately 10% de-rate at 50°C.
Seasonal Rating – Not Summer (Net)
MW (AC) 97.1
Annual Performance
Average Planned Maintenance
Days / yr. - Included in EFOR below.
Equivalent forced outage rate (EFOR)
% 1.50% Based on 98.5% O&M availability.
Effective annual capacity factor
% 29% AC basis, Highly dependent on location. Number based on a system installed in regional NSW.
2019 Costs and Technical Parameter Review - Revision 3 22
Item Unit Value Comment
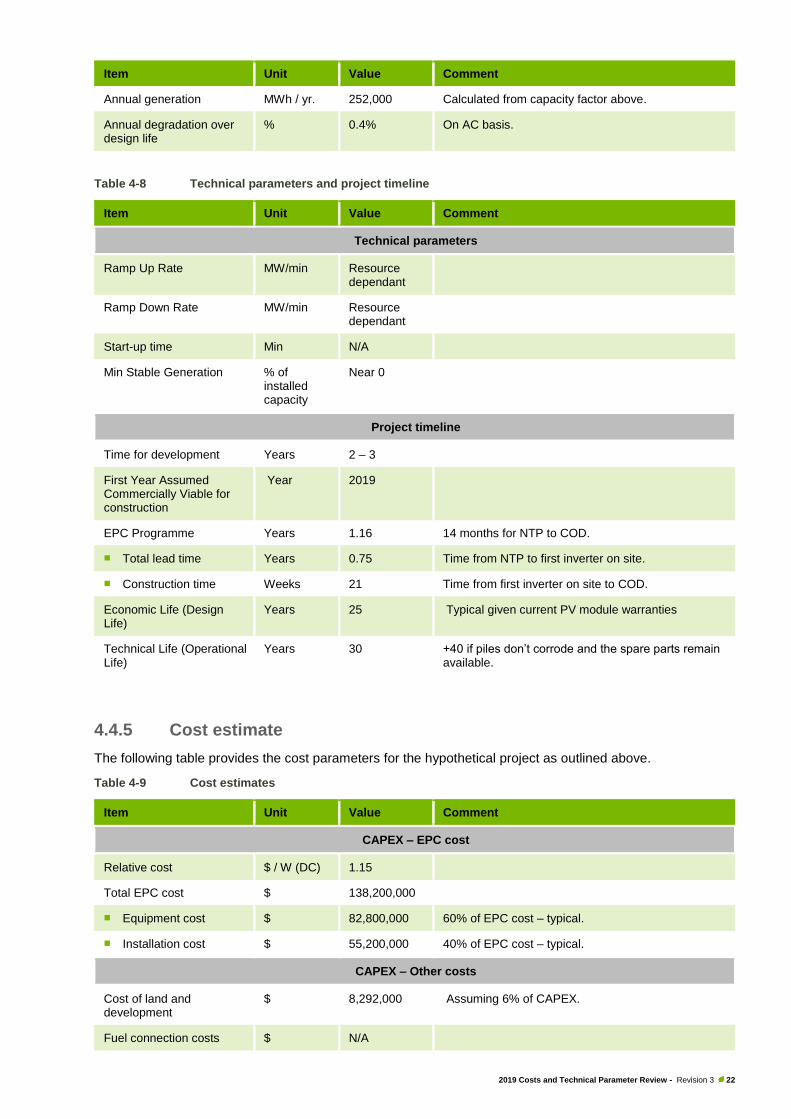
Annual generation MWh / yr. 252,000 Calculated from capacity factor above.
Annual degradation over design life
% 0.4% On AC basis.
Table 4-8 Technical parameters and project timeline
Item Unit Value Comment
Technical parameters
Ramp Up Rate MW/min Resource dependant
Ramp Down Rate MW/min Resource dependant
Start-up time Min N/A
Min Stable Generation % of installed capacity
Near 0
Project timeline
Time for development Years 2 – 3
First Year Assumed Commercially Viable for construction
Year 2019
EPC Programme Years 1.16 14 months for NTP to COD.
◼ Total lead time Years 0.75 Time from NTP to first inverter on site.
◼ Construction time Weeks 21 Time from first inverter on site to COD.
Economic Life (Design Life)
Years 25 Typical given current PV module warranties
Technical Life (Operational Life)
Years 30 +40 if piles don’t corrode and the spare parts remain available.
4.4.5 Cost estimate
The following table provides the cost parameters for the hypothetical project as outlined above.
Table 4-9 Cost estimates
Item Unit Value Comment
CAPEX – EPC cost
Relative cost $ / W (DC) 1.15
Total EPC cost $ 138,200,000
◼ Equipment cost $ 82,800,000 60% of EPC cost – typical.
◼ Installation cost $ 55,200,000 40% of EPC cost – typical.
CAPEX – Other costs
Cost of land and development
$ 8,292,000 Assuming 6% of CAPEX.
Fuel connection costs $ N/A
2019 Costs and Technical Parameter Review - Revision 3 23
Item Unit Value Comment
OPEX – Annual
Fixed O&M Cost $ / MW (Net) 16,990
Variable O&M Cost $ / MWh (Net)
- Included in the fixed component.
Total annual O&M Cost $ 1,650,000 Annual average cost over the design life
4.5 Concentrated solar thermal
4.5.1 Overview
Concentrating solar thermal technology in power generation applications generally refers to the use of mirrors
to collect solar energy over a wide area and concentrate the reflected energy onto a central receiver. The
energy is then captured by a thermal fluid which is cycled through the receiver and either stored or used direct
for power generation.
There are four primary types of concentrated solar thermal power plants available in the current market. These
include:
◼ Parabolic Trough Collectors (PTC) – PTC systems consist of parabolic, trough-shaped solar collectors
which concentrate the sun rays onto a tubular heat receiver placed at the focal line of the solar collector. A
single-axis tracking system is used to orient both solar collectors and heat receivers toward the sun.
◼ Linear Fresnel Collectors (LFC) – LFCs use long flat, or slightly curved, mirrors placed at different angles.
These move independently on a single axis, to concentrate the sunlight on either side of a fixed receiver.
The fixed receivers are mounted above the mirrors on towers.
◼ Solar Tower (ST) – Solar tower technologies use a ground-based field of sun-tracking mirrors or heliostats
to focus sunlight onto a receiver mounted on top of a central tower. A heat transfer fluid is heated in the
receiver, which is then used to generate steam. This steam is used in a conventional steam turbine
generator to produce electricity. The heliostats use two-axis tracking systems to follow the sun.
◼ Parabolic Dish (PD) – a PD consists of a parabolic dish-shaped concentrator that reflects the solar direct
radiation on to a receiver placed at the focal point of the dish. The dish-shaped concentrators are mounted
on structures with two-axis tracking systems that follow the sun. The collected heat is used directly by a
heat engine mounted on the receiver. Typical heat engine cycles deployed are Stirling or Brayton cycle
(micro-turbine).
Parabolic trough collectors are by far the most mature technology and account for the largest number of
installations globally. Solar tower projects are currently transitioning from pilot plants to commercial pants, with
a number of large-scale solar tower commercial plants under construction or operation globally. Linear Fresnel
and Parabolic dish systems are still in pilot or demonstration state.
The key advantage of concentrated solar thermal, in comparison to solar PV and wind technologies, is that
solar thermal plants can incorporate thermal energy storage. This increases the capacity factor and could
provide dispatchable renewable power.
Solar thermal plants are however capital intensive, with cost drivers including whether or not storage is
included, the solar multiple, and the DNI of the location.
O&M of solar thermal is lower in comparison to fossil fuel plants. However, these costs are still significant.
Much of the O&M costs are related to the fixed labour cost. Key O&M cost include replacement of receivers
and mirrors due to breakage, cost of field mirror cleaning including water cost, and plant insurance.
2019 Costs and Technical Parameter Review - Revision 3 24
4.5.2 Typical options
As mentioned above, the key differentiation of the concentrated solar thermal technologies as against solar
PV or wind is the ability to integrate thermal energy storage. Although inclusion of thermal energy storage
increases the installed cost of the plant, current trends show thermal energy storage is being included on most
projects under construction and all projects under development6.
Typical plant configuration under development are split between parabolic trough and solar tower with thermal
storage. Utility-scale plants currently under development globally range from 50 MW to 395 MW with 4.5 hrs
to 16 hrs storage6.
4.5.3 Recent trends
Solar thermal capacity grew tenfold globally between 2006 and 2016 on the back of incentive schemes in key
markets like Spain and the USA. Currently an estimated 3.2 GW of concentrated solar thermal projects are
either under development or under construction6. The actual status of these projects is unclear, as some may
have been abandoned. As mentioned above, the trend is to have thermal storage integrated with the solar
thermal plant. Molten salt is the preferred heat transfer fluid for solar tower technology, while mineral oils
continue to be preferred for parabolic trough technology. However, the use of molten salt is also increasing
with parabolic troughs. Use of molten salt results in increased steam cycle efficiencies in comparison to mineral
oils.
Plant capacity factors have increased over time, leading to larger thermal storage capacities of over 50%
recorded with plants with over 8 hour storage.
In Australia, there is currently no utility-scale concentrated solar thermal project in commercial operation. The
following utility-scale solar thermal projects have been proposed:
◼ Aurora Solar Energy Project – 150 MW solar tower with 8 hours molten salt energy storage. This has been
proposed by SolarReserve to be built in Port Augusta, South Australia (SA). The project entered into a
power purchase agreement with the South Australia Government in 2017, but that agreement was
terminated in early 2019 following delays in achieving financial close. It is believed SolarReserve is seeking
a potential purchaser for the project development.
◼ Vast Solar – Vast Solar is currently developing a 30 MW solar tower demonstration plant with 10 hours
energy storage7. The project is in development stage and follows Vast Solar’s 1.1 MW Pilot Project in NSW.
Given the lack of projects in Australia, there is very little information on the cost of solar thermal projects for
the region.
4.5.4 Selected hypothetical project
The following tables outline the technical parameters for the hypothetical project. The hypothetical project has
been selected based on what is envisaged as a plausible project for installation in the NEM, given the above
discussion on typical options and current trends.
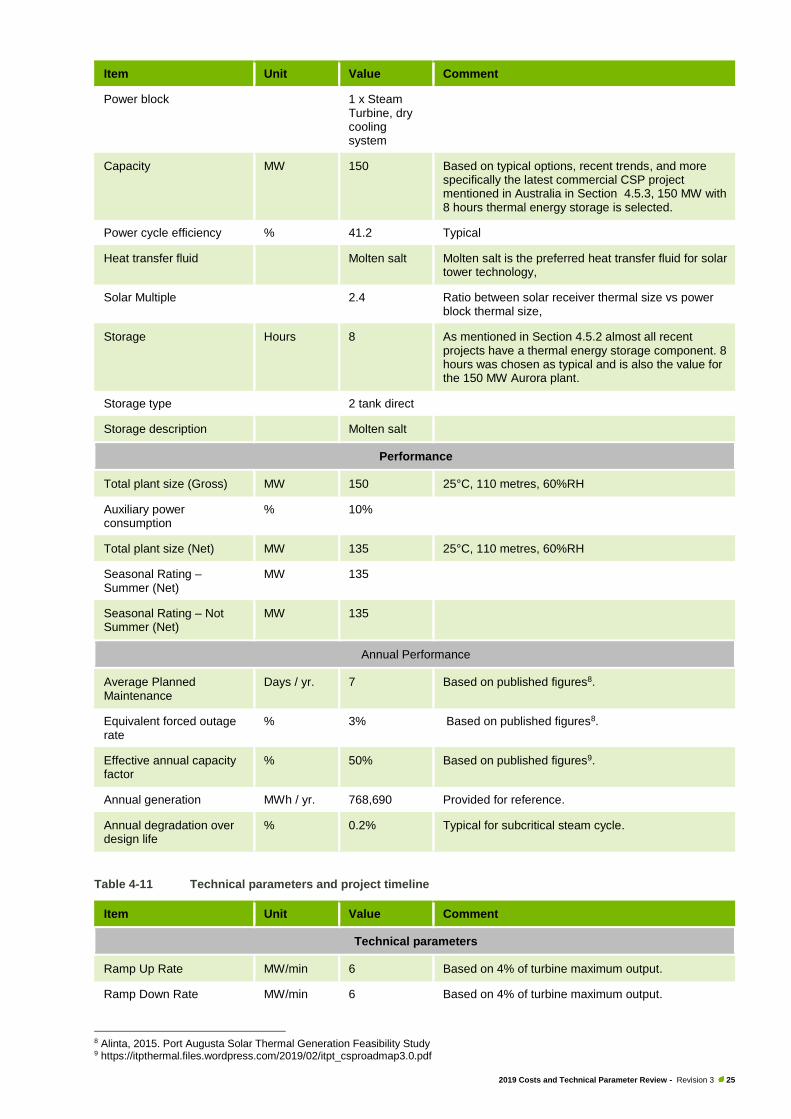
Table 4-10 Configuration and performance
Item Unit Value Comment
Configuration
Technology Solar Tower with Thermal Energy Storage
Based on typical options, recent trends and more specifically the latest proposed CSP projects mentioned in Australia in Section 4.5.3.
6 https://solarpaces.nrel.gov/by-status 7 https://www.afr.com/business/energy/solar-energy/vast-solar-in-75m-raising-as-it-advances-240m-solar-thermal-plant-20190221-h1bkix
2019 Costs and Technical Parameter Review - Revision 3 25
Item Unit Value Comment
Power block 1 x Steam Turbine, dry cooling system
Capacity MW 150 Based on typical options, recent trends, and more specifically the latest commercial CSP project mentioned in Australia in Section 4.5.3, 150 MW with 8 hours thermal energy storage is selected.
Power cycle efficiency % 41.2 Typical
Heat transfer fluid Molten salt Molten salt is the preferred heat transfer fluid for solar tower technology,
Solar Multiple 2.4 Ratio between solar receiver thermal size vs power block thermal size,
Storage Hours 8 As mentioned in Section 4.5.2 almost all recent projects have a thermal energy storage component. 8 hours was chosen as typical and is also the value for the 150 MW Aurora plant.
Storage type 2 tank direct
Storage description Molten salt
Performance
Total plant size (Gross) MW 150 25°C, 110 metres, 60%RH
Auxiliary power consumption
% 10%
Total plant size (Net) MW 135 25°C, 110 metres, 60%RH
Seasonal Rating – Summer (Net)
MW 135
Seasonal Rating – Not Summer (Net)
MW 135
Annual Performance
Average Planned Maintenance
Days / yr. 7 Based on published figures8.
Equivalent forced outage rate
% 3% Based on published figures8.
Effective annual capacity factor
% 50% Based on published figures9.
Annual generation MWh / yr. 768,690 Provided for reference.
Annual degradation over design life
% 0.2% Typical for subcritical steam cycle.
Table 4-11 Technical parameters and project timeline
Item Unit Value Comment
Technical parameters
Ramp Up Rate MW/min 6 Based on 4% of turbine maximum output.
Ramp Down Rate MW/min 6 Based on 4% of turbine maximum output.
8 Alinta, 2015. Port Augusta Solar Thermal Generation Feasibility Study 9 https://itpthermal.files.wordpress.com/2019/02/itpt_csproadmap3.0.pdf
2019 Costs and Technical Parameter Review - Revision 3 26
Item Unit Value Comment
Start-up time Minutes Hot: 60 - 120
Warm: 120 - 270
Cold: 200 - 480
Standard operation.
Min Stable Generation % of installed capacity
20%
Project timeline
Time for development Years 2 – 3 includes pre/feasibility, design, approvals etc.
First Year Assumed Commercially Viable for construction
Year 2019
Total EPC programme Years 3 36 months from NTP to COD.
◼ Total Lead Time Years 1.5 Time from NTP to main equipment on site.
◼ Construction time Weeks 78 Time from main equipment on site to COD.
Economic Life (Design Life)
Years 25
Technical Life (Operational Life)
Years 40
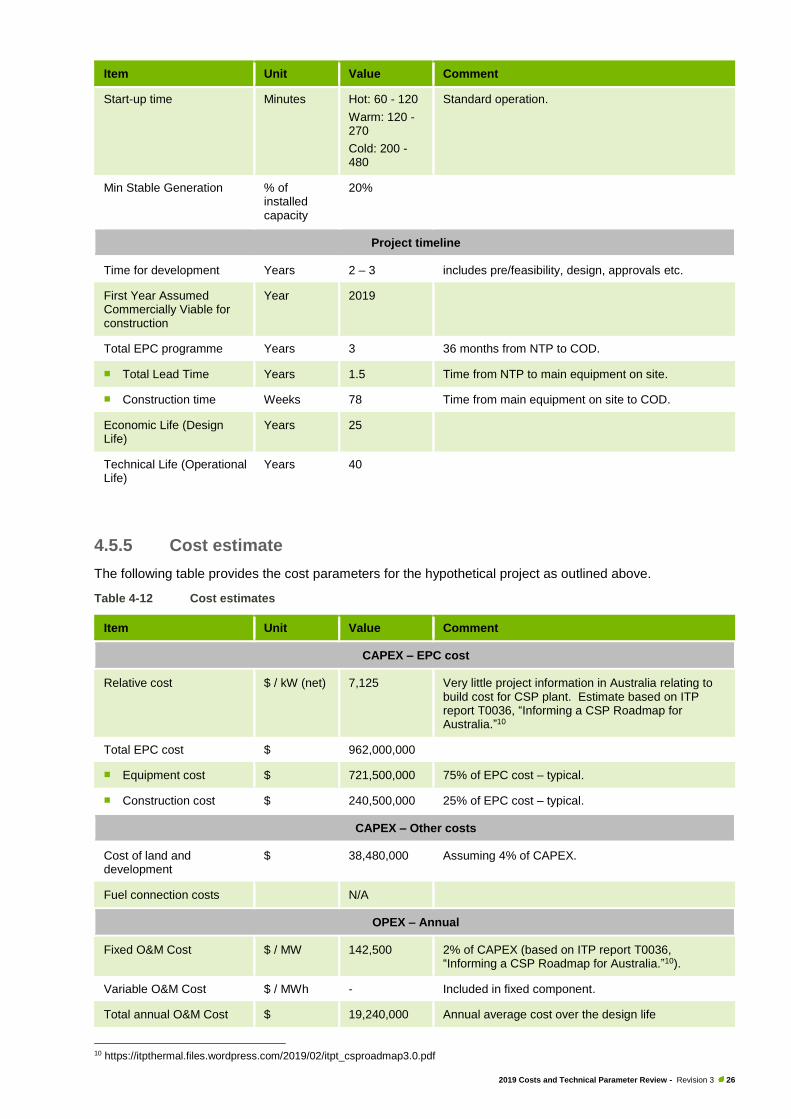
4.5.5 Cost estimate
The following table provides the cost parameters for the hypothetical project as outlined above.
Table 4-12 Cost estimates
Item Unit Value Comment
CAPEX – EPC cost
Relative cost $ / kW (net) 7,125 Very little project information in Australia relating to build cost for CSP plant. Estimate based on ITP report T0036, “Informing a CSP Roadmap for Australia.”10
Total EPC cost $ 962,000,000
◼ Equipment cost $ 721,500,000 75% of EPC cost – typical.
◼ Construction cost $ 240,500,000 25% of EPC cost – typical.
CAPEX – Other costs
Cost of land and development
$ 38,480,000 Assuming 4% of CAPEX.
Fuel connection costs N/A
OPEX – Annual
Fixed O&M Cost $ / MW 142,500 2% of CAPEX (based on ITP report T0036, “Informing a CSP Roadmap for Australia.”10).
Variable O&M Cost $ / MWh - Included in fixed component.
Total annual O&M Cost $ 19,240,000 Annual average cost over the design life
10 https://itpthermal.files.wordpress.com/2019/02/itpt_csproadmap3.0.pdf
2019 Costs and Technical Parameter Review - Revision 3 27
4.6 Reciprocating engines
4.6.1 Overview
Reciprocating engines are a widespread and well-known technology used in a variety of applications. They
are typically categorised by speed, stroke, configuration, and ignition/fuel type.
For power generation applications, reciprocating engines are coupled to a generator on the same base frame.
For grid scale applications, centralised installations are typically installed in a common power house structure
in a multi-unit configuration with separate cooling systems, air intake/filter, exhaust silencer, stack structure,
etc.
Reciprocating engines utilise synchronous generators, which provide high fault current contribution and
support the NEM network strength.
4.6.2 Typical options
For power generation applications, there are two general classifications of reciprocating engine - medium-
speed and high-speed. Medium-speed engines operate at 500 – 750 rpm and typically range in output from 4
to 18 MW. High-speed engines operate at 1,000 – 1,500 rpm with a typical output below 4 MW.
Additionally, there are three general fuel classes for reciprocating engines. These are gaseous fuel, liquid fuel,
and dual fuel. Gaseous fuel engines - also known as spark ignition engines - operate on the thermodynamic
Otto cycle, and typically use natural gas as the fuel source. Liquid fuel engines operate based on the
thermodynamic Diesel cycle, and typically use no. 2 diesel (or heavy fuel oil) as the fuel source. Duel fuel
engines can operate on either gaseous or liquid fuel, however always rely on a small consumption of diesel as
a pilot fuel.
4.6.3 Recent trends
Traditionally multi-unit reciprocating engine installations on the NEM have consisted of high-speed spark-
ignition engines, fuelled from coal seam methane or waste gas where the fuel gas is not suited to gas turbines.
Installed capacities of these power stations are in the <50 MW range. Historically, capacity factors have been
dependant on fuel gas availability.
Given the high degree of uncertainty around medium to long-term market factors, large-scale medium-speed
reciprocating engine power stations are increasing in popularity for firming applications. This is driven by their
favourable fuel efficiency merits, and high degree of flexibility in start times and turn-down. This provides a
strong business case for a wide range of capacity factors.
There are currently three large-scale medium-speed reciprocating engine power stations either under
construction or in development for installation in the NEM. These include;
◼ AGL’s Barker Inlet Power Station (Stage 1 – 210 MW, Stage 2 – 210 MW)
◼ AGL’s Newcastle Power Station (250 MW)
◼ APA’s Dandenong Power Project (Stage 1 – 220 MW, Stage 2 – 110 MW)
Equipment pricing is not expected to decrease materially in the near future however the EPC cost could come
down over time with increased popularity and competition. Marginal performance improvements are also
expected over time with ongoing technology developments.
4.6.4 Selected hypothetical project
The following tables outline the technical parameters for the hypothetical project. The hypothetical project has
been selected based on what is envisaged as a plausible project for installation in the NEM given the above
discussion on typical options and current trends.
2019 Costs and Technical Parameter Review - Revision 3 28
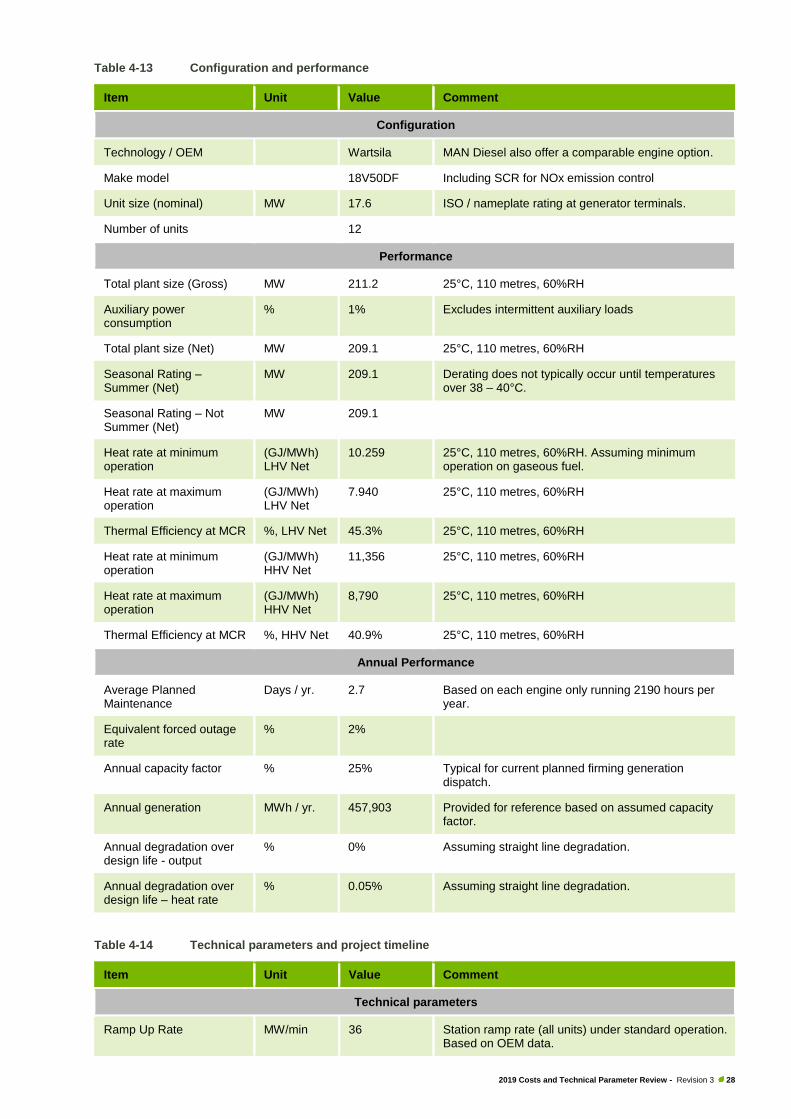
Table 4-13 Configuration and performance
Item Unit Value Comment
Configuration
Technology / OEM Wartsila MAN Diesel also offer a comparable engine option.
Make model 18V50DF Including SCR for NOx emission control
Unit size (nominal) MW 17.6 ISO / nameplate rating at generator terminals.
Number of units 12
Performance
Total plant size (Gross) MW 211.2 25°C, 110 metres, 60%RH
Auxiliary power consumption
% 1% Excludes intermittent auxiliary loads
Total plant size (Net) MW 209.1 25°C, 110 metres, 60%RH
Seasonal Rating – Summer (Net)
MW 209.1 Derating does not typically occur until temperatures over 38 – 40°C.
Seasonal Rating – Not Summer (Net)
MW 209.1
Heat rate at minimum operation
(GJ/MWh) LHV Net
10.259 25°C, 110 metres, 60%RH. Assuming minimum operation on gaseous fuel.
Heat rate at maximum operation
(GJ/MWh) LHV Net
7.940 25°C, 110 metres, 60%RH
Thermal Efficiency at MCR %, LHV Net 45.3% 25°C, 110 metres, 60%RH
Heat rate at minimum operation
(GJ/MWh) HHV Net
11,356 25°C, 110 metres, 60%RH
Heat rate at maximum operation
(GJ/MWh) HHV Net
8,790 25°C, 110 metres, 60%RH
Thermal Efficiency at MCR %, HHV Net 40.9% 25°C, 110 metres, 60%RH
Annual Performance
Average Planned Maintenance
Days / yr. 2.7 Based on each engine only running 2190 hours per year.
Equivalent forced outage rate
% 2%
Annual capacity factor % 25% Typical for current planned firming generation dispatch.
Annual generation MWh / yr. 457,903 Provided for reference based on assumed capacity factor.
Annual degradation over design life - output
% 0% Assuming straight line degradation.
Annual degradation over design life – heat rate
% 0.05% Assuming straight line degradation.
Table 4-14 Technical parameters and project timeline
Item Unit Value Comment
Technical parameters
Ramp Up Rate MW/min 36 Station ramp rate (all units) under standard operation. Based on OEM data.
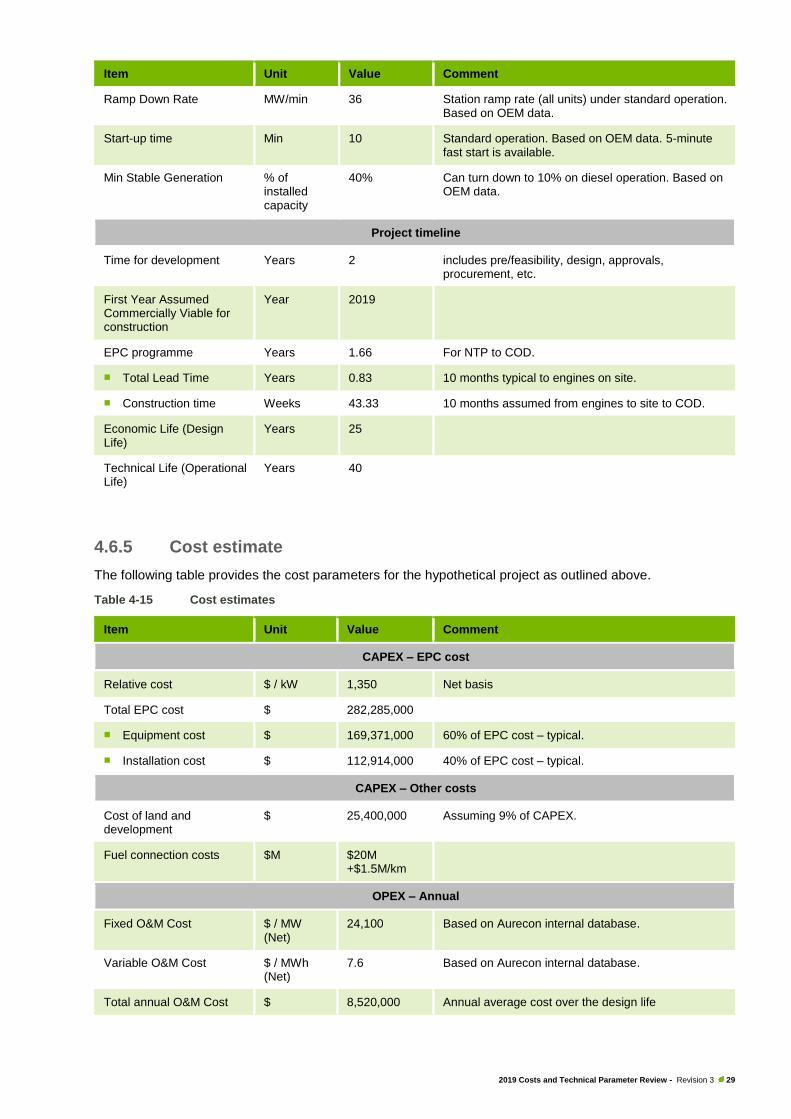
2019 Costs and Technical Parameter Review - Revision 3 29
Item Unit Value Comment
Ramp Down Rate MW/min 36 Station ramp rate (all units) under standard operation. Based on OEM data.
Start-up time Min 10 Standard operation. Based on OEM data. 5-minute fast start is available.
Min Stable Generation % of installed capacity
40% Can turn down to 10% on diesel operation. Based on OEM data.
Project timeline
Time for development Years 2 includes pre/feasibility, design, approvals, procurement, etc.
First Year Assumed Commercially Viable for construction
Year 2019
EPC programme Years 1.66 For NTP to COD.
◼ Total Lead Time Years 0.83 10 months typical to engines on site.
◼ Construction time Weeks 43.33 10 months assumed from engines to site to COD.
Economic Life (Design Life)
Years 25
Technical Life (Operational Life)
Years 40
4.6.5 Cost estimate
The following table provides the cost parameters for the hypothetical project as outlined above.
Table 4-15 Cost estimates
Item Unit Value Comment
CAPEX – EPC cost
Relative cost $ / kW 1,350 Net basis
Total EPC cost $ 282,285,000
◼ Equipment cost $ 169,371,000 60% of EPC cost – typical.
◼ Installation cost $ 112,914,000 40% of EPC cost – typical.
CAPEX – Other costs
Cost of land and development
$ 25,400,000 Assuming 9% of CAPEX.
Fuel connection costs $M $20M +$1.5M/km
OPEX – Annual
Fixed O&M Cost $ / MW (Net)
24,100 Based on Aurecon internal database.
Variable O&M Cost $ / MWh (Net)
7.6 Based on Aurecon internal database.
Total annual O&M Cost $ 8,520,000 Annual average cost over the design life
2019 Costs and Technical Parameter Review - Revision 3 30
4.7 Open Cycle Gas Turbine
4.7.1 Overview
Gas turbines are one of the most widely-used power generation technologies today. The technology is well
proven, and is used in both open-cycle gas turbine (OCGT) and combined-cycle gas turbine (CCGT)
configurations. Gas turbines are classified into two main categories - aero-derivatives and industrial turbines.
Both of these find application in the power generation industry, although for baseload applications, industrial
gas turbines are preferred. Conversely, for peaking applications, the areo-derivative is more suitable
primarily due to its faster start up time. Within the industrial turbines class, gas turbines are further classified
as E - class, F - class and H (G/J) - class turbines. This classification depends on their development
generation and the associated advancement in size and efficiencies. Gas turbines can operate on both
natural gas and liquid fuel.
Gas turbines utilise synchronous generators, which provide relatively high fault current contribution in
comparison to other technologies and support the NEM network strength.
Gas turbines currently provide high rotating inertia to the NEM. The rotating inertia is a valuable feature that
increases the NEM frequency stability.
4.7.2 Typical options
An OCGT plant consists of a gas turbine connected to an electrical generator via a shaft. A gearbox may be
required depending on the rpm of the gas turbine and the grid frequency. The number of gas turbines deployed
in an OCGT plant will depend mainly on the output and redundancy levels required. OCGT plants are typically
used to meet peak demand. Both industrial and aero-derivative gas turbines can be used for peaking
applications. However, aero-derivatives have some advantages that make them more suitable for peaking
applications, including;
◼ Better start-up time
◼ Operational flexibility i.e. quick ramp up and load change capability
◼ No penalties on O&M for number of starts
Irrespective of the benefits of aero-gas turbines, industrial gas turbines have also been widely used in OCGT
mode. Traditionally, E or D class machines are used in OCGT mode. Rarely are F or H class machines used
in OCGT applications. However, as mentioned in Section 4.7.3, there are instances where F class machines
have been installed on OCGT configuration in Australia. Ultimately, the choice of gas turbine will depend on
the many factors including the operating regimes of the plant, size, and more importantly, life cycle cost.
4.7.3 Recent trends
The increased installation of renewables has created opportunities for capacity firming solutions, that are
currently largely met by gas-fired power generation options. OCGT and reciprocating engines compete in this
market. Recent gas turbine power projects proposed or under development in Australia are summarised below:
◼ 250 MW peaking/mid-merit OCGT in Newcastle. This project is currently under development. It is likely that
if an OCGT solution, it would be multiple units of aero-derivative machines.
◼ 300 MW OCGT plant in Tallawara. It is understood that the developer of this project has specified an F
class machine for this project, possibly to enable future conversion of the unit to combined-cycle mode.
◼ 250 MW Emergency power generation plant in South Australia. Various OCGT and Reciprocating engine
solutions were considered for this project, including LM6000, TM2500, and GE Frame 6 gas turbines.
2019 Costs and Technical Parameter Review - Revision 3 31
Overall, demand for gas turbines has declined over the last year, with a corresponding drop in prices. Gas
turbine prices for utility-scale power generation units are expected to decline by 10% in 2019-2020 relative to
those seen in 2017-201811.
4.7.4 Selected hypothetical project
The following tables outline the technical parameters for the hypothetical project. The hypothetical project has
been selected based on what is envisaged as a plausible project for installation in the NEM, given the above
discussion on typical options and current trends.
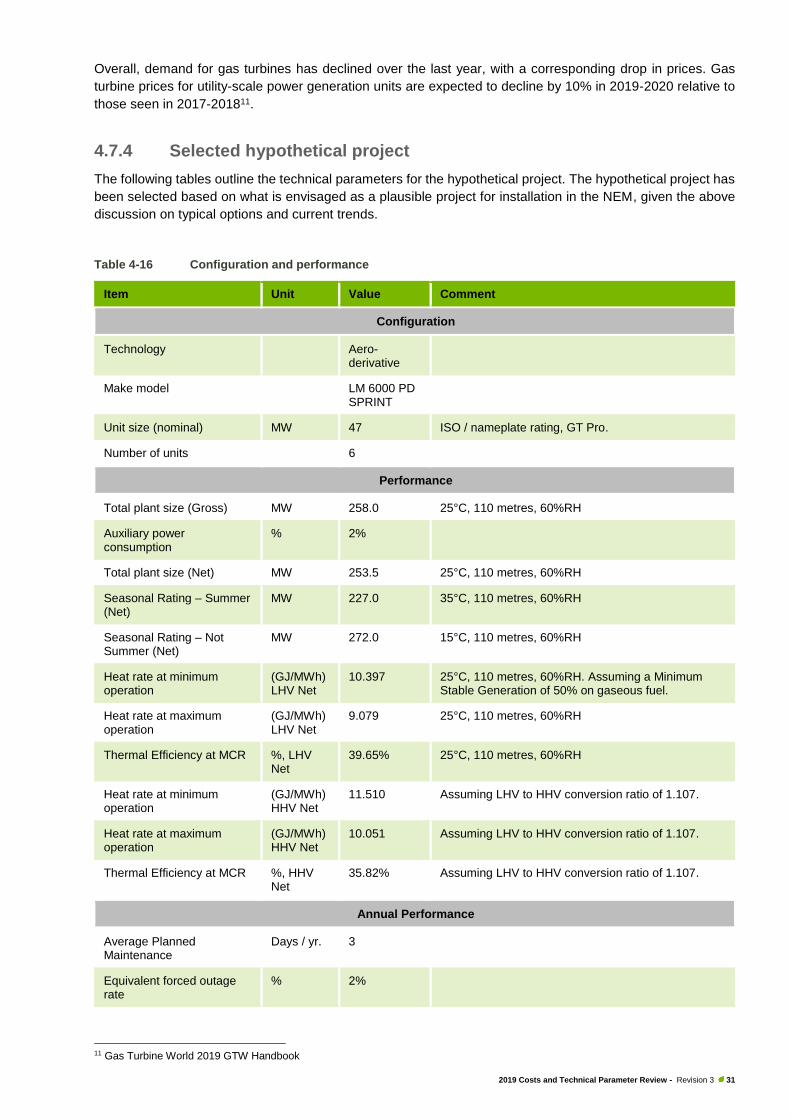
Table 4-16 Configuration and performance
Item Unit Value Comment
Configuration
Technology Aero-derivative
Make model LM 6000 PD SPRINT
Unit size (nominal) MW 47 ISO / nameplate rating, GT Pro.
Number of units 6
Performance
Total plant size (Gross) MW 258.0 25°C, 110 metres, 60%RH
Auxiliary power consumption
% 2%
Total plant size (Net) MW 253.5 25°C, 110 metres, 60%RH
Seasonal Rating – Summer (Net)
MW 227.0 35°C, 110 metres, 60%RH
Seasonal Rating – Not Summer (Net)
MW 272.0 15°C, 110 metres, 60%RH
Heat rate at minimum operation
(GJ/MWh) LHV Net
10.397 25°C, 110 metres, 60%RH. Assuming a Minimum Stable Generation of 50% on gaseous fuel.
Heat rate at maximum operation
(GJ/MWh) LHV Net
9.079 25°C, 110 metres, 60%RH
Thermal Efficiency at MCR %, LHV Net
39.65% 25°C, 110 metres, 60%RH
Heat rate at minimum operation
(GJ/MWh) HHV Net
11.510 Assuming LHV to HHV conversion ratio of 1.107.
Heat rate at maximum operation
(GJ/MWh) HHV Net
10.051 Assuming LHV to HHV conversion ratio of 1.107.
Thermal Efficiency at MCR %, HHV Net
35.82% Assuming LHV to HHV conversion ratio of 1.107.
Annual Performance
Average Planned Maintenance
Days / yr. 3
Equivalent forced outage rate
% 2%
11 Gas Turbine World 2019 GTW Handbook
2019 Costs and Technical Parameter Review - Revision 3 32
Item Unit Value Comment
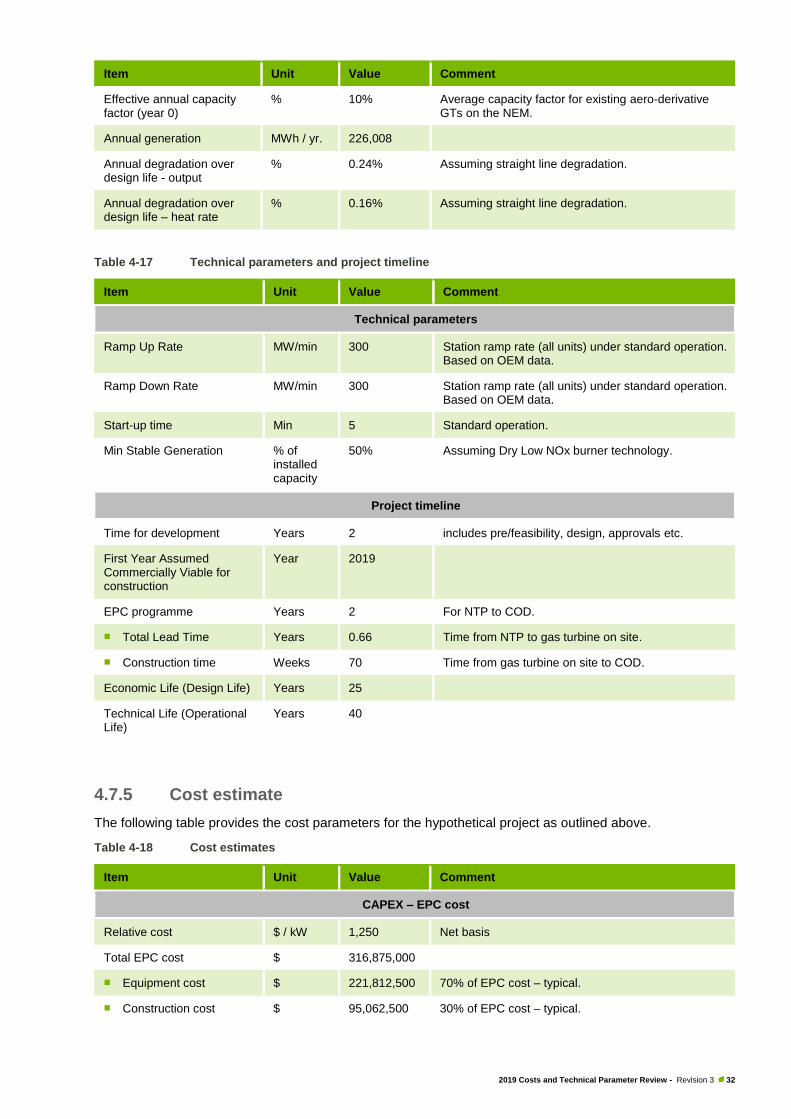
Effective annual capacity factor (year 0)
% 10% Average capacity factor for existing aero-derivative GTs on the NEM.
Annual generation MWh / yr. 226,008
Annual degradation over design life - output
% 0.24% Assuming straight line degradation.
Annual degradation over design life – heat rate
% 0.16% Assuming straight line degradation.
Table 4-17 Technical parameters and project timeline
Item Unit Value Comment
Technical parameters
Ramp Up Rate MW/min 300 Station ramp rate (all units) under standard operation. Based on OEM data.
Ramp Down Rate MW/min 300 Station ramp rate (all units) under standard operation. Based on OEM data.
Start-up time Min 5 Standard operation.
Min Stable Generation % of installed capacity
50% Assuming Dry Low NOx burner technology.
Project timeline
Time for development Years 2 includes pre/feasibility, design, approvals etc.
First Year Assumed Commercially Viable for construction
Year 2019
EPC programme Years 2 For NTP to COD.
◼ Total Lead Time Years 0.66 Time from NTP to gas turbine on site.
◼ Construction time Weeks 70 Time from gas turbine on site to COD.
Economic Life (Design Life) Years 25
Technical Life (Operational Life)
Years 40
4.7.5 Cost estimate
The following table provides the cost parameters for the hypothetical project as outlined above.
Table 4-18 Cost estimates
Item Unit Value Comment
CAPEX – EPC cost
Relative cost $ / kW 1,250 Net basis
Total EPC cost $ 316,875,000
◼ Equipment cost $ 221,812,500 70% of EPC cost – typical.
◼ Construction cost $ 95,062,500 30% of EPC cost – typical.
2019 Costs and Technical Parameter Review - Revision 3 33
Item Unit Value Comment
CAPEX – Other costs
Cost of land and development
$ 28,500,000 Assuming 9% of CAPEX.
Fuel connection costs $M $20M +$1.5M/km
OPEX – Annual
Fixed O&M Cost $ / MW (Net)
12,600 Based on Aurecon internal database.
Variable O&M Cost $ / MWh (Net)
4.1 Based on Aurecon internal database.
Total annual O&M Cost $ 4,120,000 Annual average cost over the design life
4.8 Combined-cycle Gas Turbines
4.8.1 Overview
Over time, combined-cycle gas turbines (CCGT) have become the technology of choice for gas-fired base load
and intermediate load power generation. Typically, they consist of 1 or more gas turbine generator sets (gas
turbines plus the electric generator), dedicated heat recovery steam generators (HRSG), and a steam turbine
generator set (steam turbine plus the electric generator).
Advancements in gas turbine technology have led to significant increase in CCGT efficiencies, with some gas
CCGT plants - namely those with H-class gas turbines - offering efficiencies of above 60%.
4.8.2 Typical options
Both aero and industrial gas turbines are widely used for CCGT applications. However, traditionally industrial
gas turbines were preferred. Popular CCGT configuration options are:
◼ 1-on-1 (1 x 1) option consisting of 1 gas turbine generator set, a dedicated HRSG, and a steam turbine
generator set.
◼ 2-on-1 (2 x 1) option consisting of 2 gas turbine generator sets, 2 dedicated HRSGs, and a steam turbine
generator set.
Other options have also been used e.g. 3 x 1 configuration, but they are not a typical offering by manufacturers.
4.8.3 Recent trends
The focus of all major gas turbine manufactures over the last couple of decades was to improve the thermal
efficiency of the gas turbines. In recent years, OEMs have announced record high efficiencies in CCGT mode
(over 60%). This quest for higher efficiencies - which is founded on the traditional operation of baseload power
plants - is expected to continue. Although higher efficiencies are important, with the expansion of intermittent
renewable energy in all major markets, the need for CCGT to be flexible and operate on a cyclic pattern is
becoming equally important. As such, OEMs are now focusing on making improvements to start-up time and
ability to ramp-up/down CCGT plant.
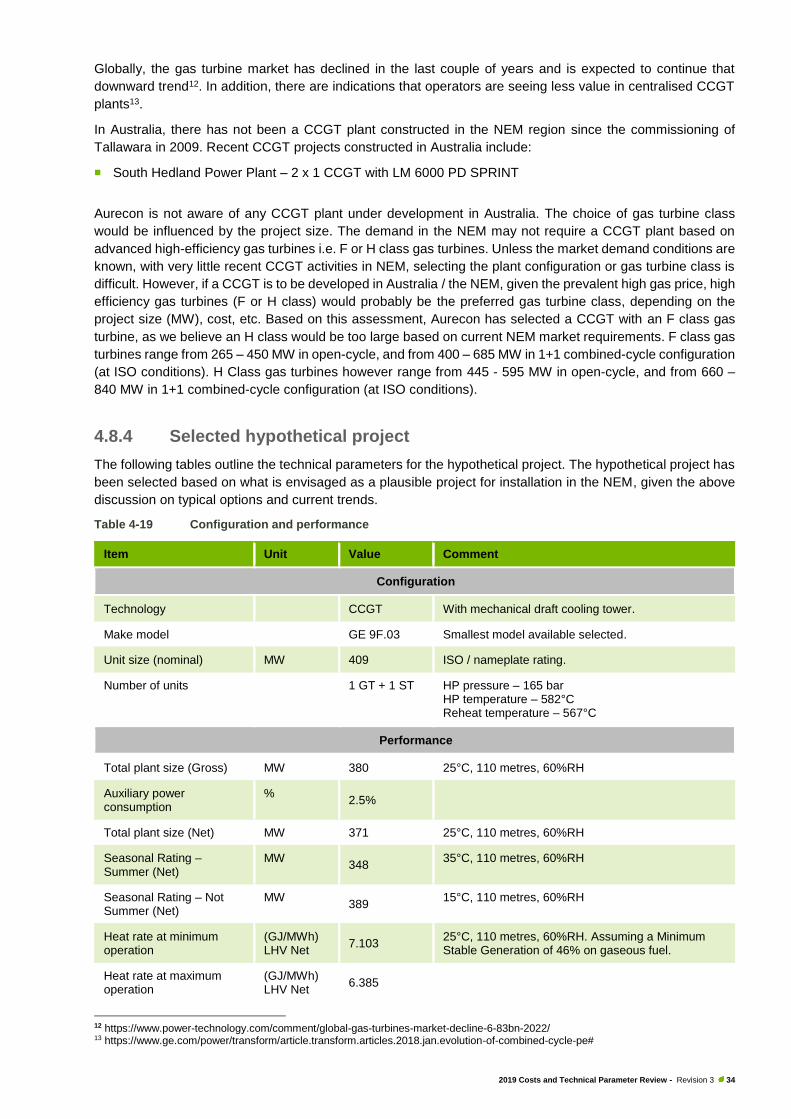
2019 Costs and Technical Parameter Review - Revision 3 34
Globally, the gas turbine market has declined in the last couple of years and is expected to continue that
downward trend12. In addition, there are indications that operators are seeing less value in centralised CCGT
plants13.
In Australia, there has not been a CCGT plant constructed in the NEM region since the commissioning of
Tallawara in 2009. Recent CCGT projects constructed in Australia include:
◼ South Hedland Power Plant – 2 x 1 CCGT with LM 6000 PD SPRINT
Aurecon is not aware of any CCGT plant under development in Australia. The choice of gas turbine class
would be influenced by the project size. The demand in the NEM may not require a CCGT plant based on
advanced high-efficiency gas turbines i.e. F or H class gas turbines. Unless the market demand conditions are
known, with very little recent CCGT activities in NEM, selecting the plant configuration or gas turbine class is
difficult. However, if a CCGT is to be developed in Australia / the NEM, given the prevalent high gas price, high
efficiency gas turbines (F or H class) would probably be the preferred gas turbine class, depending on the
project size (MW), cost, etc. Based on this assessment, Aurecon has selected a CCGT with an F class gas
turbine, as we believe an H class would be too large based on current NEM market requirements. F class gas
turbines range from 265 – 450 MW in open-cycle, and from 400 – 685 MW in 1+1 combined-cycle configuration
(at ISO conditions). H Class gas turbines however range from 445 - 595 MW in open-cycle, and from 660 –
840 MW in 1+1 combined-cycle configuration (at ISO conditions).
4.8.4 Selected hypothetical project
The following tables outline the technical parameters for the hypothetical project. The hypothetical project has
been selected based on what is envisaged as a plausible project for installation in the NEM, given the above
discussion on typical options and current trends.
Table 4-19 Configuration and performance
Item Unit Value Comment
Configuration
Technology CCGT With mechanical draft cooling tower.
Make model GE 9F.03 Smallest model available selected.
Unit size (nominal) MW 409 ISO / nameplate rating.
Number of units 1 GT + 1 ST HP pressure – 165 bar HP temperature – 582°C Reheat temperature – 567°C
Performance
Total plant size (Gross) MW 380 25°C, 110 metres, 60%RH
Auxiliary power consumption
% 2.5%
Total plant size (Net) MW 371 25°C, 110 metres, 60%RH
Seasonal Rating – Summer (Net)
MW 348
35°C, 110 metres, 60%RH
Seasonal Rating – Not Summer (Net)
MW 389
15°C, 110 metres, 60%RH
Heat rate at minimum operation
(GJ/MWh) LHV Net
7.103 25°C, 110 metres, 60%RH. Assuming a Minimum Stable Generation of 46% on gaseous fuel.
Heat rate at maximum operation
(GJ/MWh) LHV Net
6.385
12 https://www.power-technology.com/comment/global-gas-turbines-market-decline-6-83bn-2022/ 13 https://www.ge.com/power/transform/article.transform.articles.2018.jan.evolution-of-combined-cycle-pe#
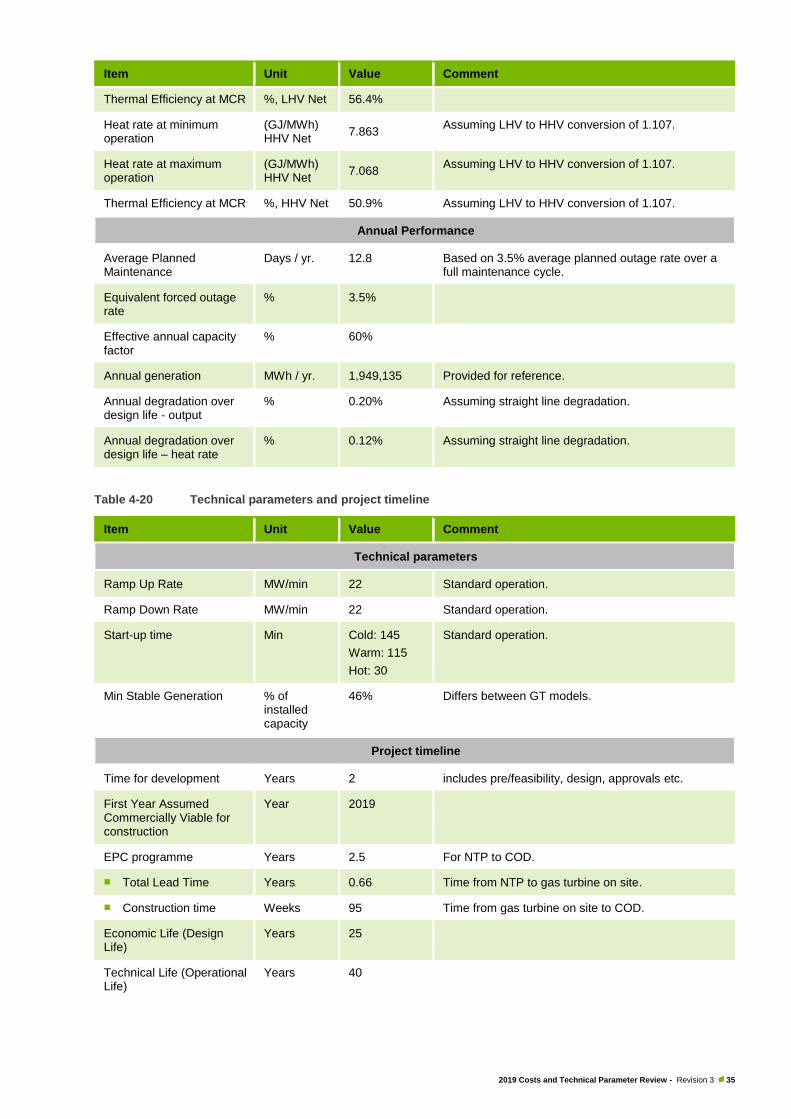
2019 Costs and Technical Parameter Review - Revision 3 35
Item Unit Value Comment
Thermal Efficiency at MCR %, LHV Net 56.4%
Heat rate at minimum operation
(GJ/MWh) HHV Net
7.863 Assuming LHV to HHV conversion of 1.107.
Heat rate at maximum operation
(GJ/MWh) HHV Net
7.068 Assuming LHV to HHV conversion of 1.107.
Thermal Efficiency at MCR %, HHV Net 50.9% Assuming LHV to HHV conversion of 1.107.
Annual Performance
Average Planned Maintenance
Days / yr. 12.8 Based on 3.5% average planned outage rate over a full maintenance cycle.
Equivalent forced outage rate
% 3.5%
Effective annual capacity factor
% 60%
Annual generation MWh / yr. 1,949,135 Provided for reference.
Annual degradation over design life - output
% 0.20% Assuming straight line degradation.
Annual degradation over design life – heat rate
% 0.12% Assuming straight line degradation.
Table 4-20 Technical parameters and project timeline
Item Unit Value Comment
Technical parameters
Ramp Up Rate MW/min 22 Standard operation.
Ramp Down Rate MW/min 22 Standard operation.
Start-up time Min Cold: 145
Warm: 115
Hot: 30
Standard operation.
Min Stable Generation % of installed capacity
46% Differs between GT models.
Project timeline
Time for development Years 2 includes pre/feasibility, design, approvals etc.
First Year Assumed Commercially Viable for construction
Year 2019
EPC programme Years 2.5 For NTP to COD.
◼ Total Lead Time Years 0.66 Time from NTP to gas turbine on site.
◼ Construction time Weeks 95 Time from gas turbine on site to COD.
Economic Life (Design Life)
Years 25
Technical Life (Operational Life)
Years 40
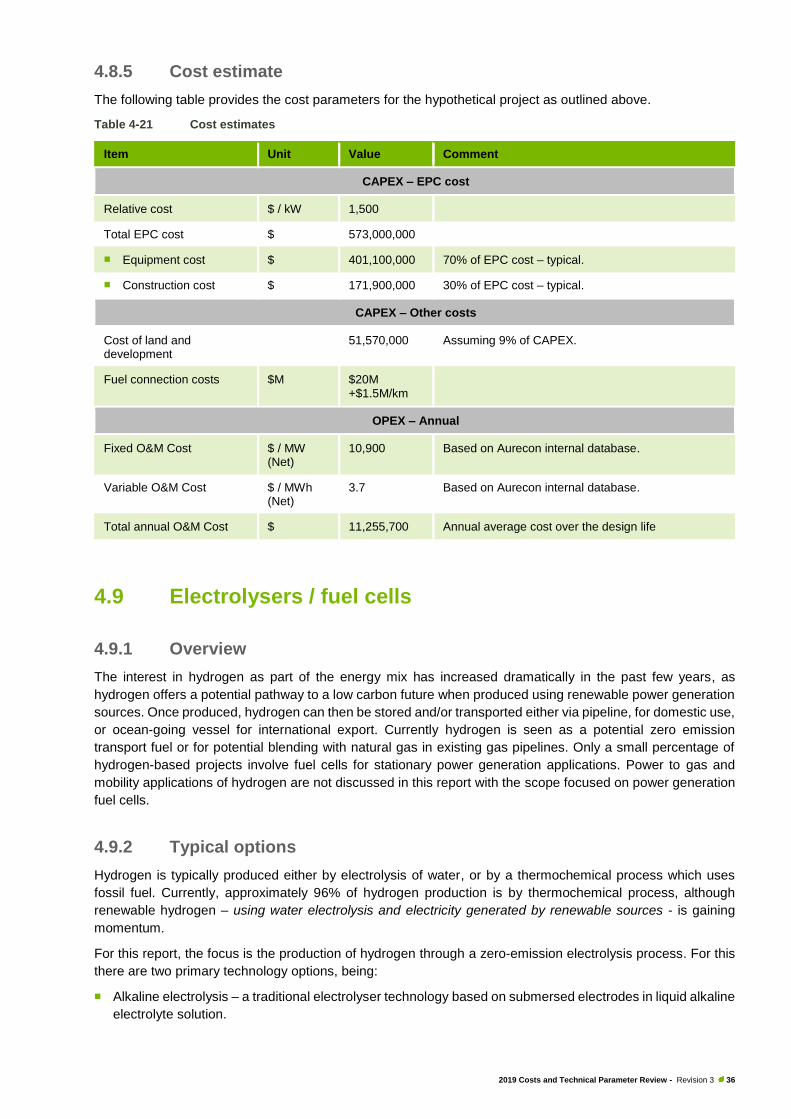
2019 Costs and Technical Parameter Review - Revision 3 36
4.8.5 Cost estimate
The following table provides the cost parameters for the hypothetical project as outlined above.
Table 4-21 Cost estimates
Item Unit Value Comment
CAPEX – EPC cost
Relative cost $ / kW 1,500
Total EPC cost $ 573,000,000
◼ Equipment cost $ 401,100,000 70% of EPC cost – typical.
◼ Construction cost $ 171,900,000 30% of EPC cost – typical.
CAPEX – Other costs
Cost of land and development
51,570,000 Assuming 9% of CAPEX.
Fuel connection costs $M $20M +$1.5M/km
OPEX – Annual
Fixed O&M Cost $ / MW (Net)
10,900 Based on Aurecon internal database.
Variable O&M Cost $ / MWh (Net)
3.7 Based on Aurecon internal database.
Total annual O&M Cost $ 11,255,700 Annual average cost over the design life
4.9 Electrolysers / fuel cells
4.9.1 Overview
The interest in hydrogen as part of the energy mix has increased dramatically in the past few years, as
hydrogen offers a potential pathway to a low carbon future when produced using renewable power generation
sources. Once produced, hydrogen can then be stored and/or transported either via pipeline, for domestic use,
or ocean-going vessel for international export. Currently hydrogen is seen as a potential zero emission
transport fuel or for potential blending with natural gas in existing gas pipelines. Only a small percentage of
hydrogen-based projects involve fuel cells for stationary power generation applications. Power to gas and
mobility applications of hydrogen are not discussed in this report with the scope focused on power generation
fuel cells.
4.9.2 Typical options
Hydrogen is typically produced either by electrolysis of water, or by a thermochemical process which uses
fossil fuel. Currently, approximately 96% of hydrogen production is by thermochemical process, although
renewable hydrogen – using water electrolysis and electricity generated by renewable sources - is gaining
momentum.
For this report, the focus is the production of hydrogen through a zero-emission electrolysis process. For this
there are two primary technology options, being:
◼ Alkaline electrolysis – a traditional electrolyser technology based on submersed electrodes in liquid alkaline
electrolyte solution.
2019 Costs and Technical Parameter Review - Revision 3 37
◼ Proton Exchange Membrane (PEM) – a new electrolyser technology categorised by its solid polymer
electrolyte which separate the electrodes.
Electrolyser unit sizes of the individual modules vary in sizes up to 20 MW comprising of individual cell stacks
of 2 to 5 MW depending on the suppliers.
For fuel cells in stationery power generation applications, these are currently limited to small off-grid
installations supporting back-up power for homes, businesses, and hospitals. Below are some of the most
commonly used fuel cells14.
◼ Proton Exchange Membrane Fuel Cell (PEMFC): PEMFCs use a polymer membrane for their electrolyte
and a precious metal, typically platinum, for their catalyst. PEMFCs operate between 40% to 60% efficiency
and are capable of handling large and sudden shifts in power output.
◼ Direct Methanol Fuel Cells (DMFCs): DMFCs also use a polymer membrane as an electrolyte and
commonly a platinum catalyst as well. DMFCs draw hydrogen from liquid methanol instead of using
hydrogen directly as a fuel.
◼ Alkaline Fuel Cell (AFC): AFCs use porous electrolytes saturated with an alkaline solution and have an
alkaline membrane. AFCs have approximately 60% electrical efficiency.
◼ Phosphoric Acid Fuel Cell (PAFC): PAFCs use a liquid phosphoric acid and ceramic electrolyte and a
platinum catalyst. They have similar efficiencies to those of PEMFCs. PAFCs are often seen in applications
with a high energy demand, such as hospitals, schools, and manufacturing and processing centres.
◼ Solid Oxide Fuel Cell (SOFC): SOFCs operate at high temperatures and use a solid ceramic electrolyte
instead of a liquid or membrane. SOFCs are used in large and small stationary power generation and small
cogeneration facilities.
Stationery fuel cell stack sizes vary from <1 kW to 3 MW. Fuel cell installation could either be standalone
plants, or may be installed in addition to other power (e.g. Rooftop PV) or energy storage (e.g. Lithium battery)
solutions.
4.9.3 Recent trends
For hydrogen production, PEM electrolysers have been growing in popularity relative to more traditional
alkaline technology. This is primarily due to the improved dynamic operation of the PEM-based technology,
with improved responsiveness, and improved current densities. PEM also produces hydrogen at around 30
bar compared to atmospheric pressures achieved with Alkaline electrolysers which reduces the need for costly
first stage compression.
Most proposed and planned hydrogen production projects in Australia are in the 10 – 100 MW range using
either PEM or Alkaline electrolysers, most notably including:
◼ Neoen Hydrogen Superhub Project – 50 MW Electrolyser (21 tonnes/day) in Crystal Brook, South Australia
◼ Hydrogen Supply Chain Demonstration Project: 20 MW (4 x 5 MW units) Electrolyser, 10 tonnes/day, H2
production and 5 MWe PEM-FC generator in Port Lincoln, South Australia.
It is important to note that the choice made between PEM and Alkaline electrolyser technologies is project
specific with both having a role to play in the current market. Generally speaking Alkaline electrolyser
technology is lower in cost compared to PEM with both undergoing dramatic reductions in cost (on a $/MW
basis) as projects and manufacturing is being increased in scale. Although PEM is seen as more responsive
and/or flexible, recent improvements have been made with the latest Alkaline electrolyses which has closed
the gap in some areas and offer improved benefits in others (such as reduced water consumption).
14 http://www.fchea.org/fuelcells
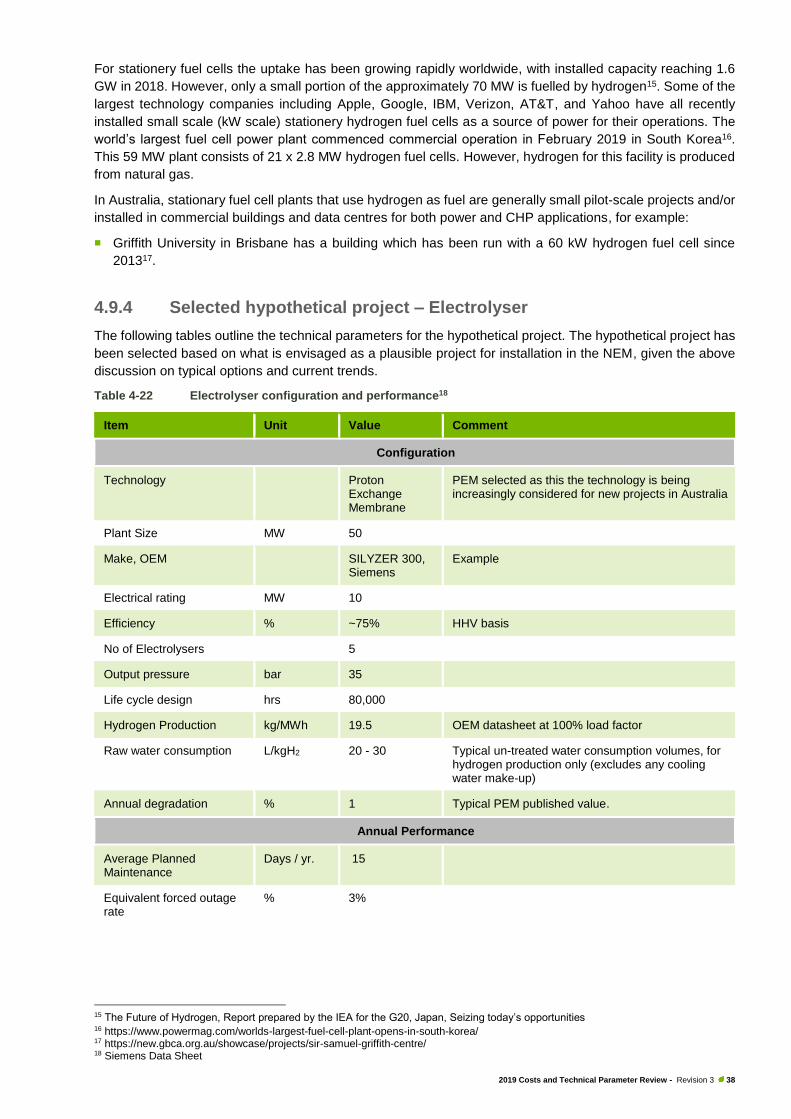
2019 Costs and Technical Parameter Review - Revision 3 38
For stationery fuel cells the uptake has been growing rapidly worldwide, with installed capacity reaching 1.6
GW in 2018. However, only a small portion of the approximately 70 MW is fuelled by hydrogen15. Some of the
largest technology companies including Apple, Google, IBM, Verizon, AT&T, and Yahoo have all recently
installed small scale (kW scale) stationery hydrogen fuel cells as a source of power for their operations. The
world’s largest fuel cell power plant commenced commercial operation in February 2019 in South Korea16.
This 59 MW plant consists of 21 x 2.8 MW hydrogen fuel cells. However, hydrogen for this facility is produced
from natural gas.
In Australia, stationary fuel cell plants that use hydrogen as fuel are generally small pilot-scale projects and/or
installed in commercial buildings and data centres for both power and CHP applications, for example:
◼ Griffith University in Brisbane has a building which has been run with a 60 kW hydrogen fuel cell since
201317.
4.9.4 Selected hypothetical project – Electrolyser
The following tables outline the technical parameters for the hypothetical project. The hypothetical project has
been selected based on what is envisaged as a plausible project for installation in the NEM, given the above
discussion on typical options and current trends.
Table 4-22 Electrolyser configuration and performance18
Item Unit Value Comment
Configuration
Technology Proton Exchange Membrane
PEM selected as this the technology is being increasingly considered for new projects in Australia
Plant Size MW 50
Make, OEM SILYZER 300, Siemens
Example
Electrical rating MW 10
Efficiency % ~75% HHV basis
No of Electrolysers 5
Output pressure bar 35
Life cycle design hrs 80,000
Hydrogen Production kg/MWh 19.5 OEM datasheet at 100% load factor
Raw water consumption L/kgH2 20 - 30 Typical un-treated water consumption volumes, for hydrogen production only (excludes any cooling water make-up)
Annual degradation % 1 Typical PEM published value.
Annual Performance
Average Planned Maintenance
Days / yr. 15
Equivalent forced outage rate
% 3%
15 The Future of Hydrogen, Report prepared by the IEA for the G20, Japan, Seizing today’s opportunities 16 https://www.powermag.com/worlds-largest-fuel-cell-plant-opens-in-south-korea/ 17 https://new.gbca.org.au/showcase/projects/sir-samuel-griffith-centre/ 18 Siemens Data Sheet

2019 Costs and Technical Parameter Review - Revision 3 39
Table 4-23 Technical parameters and project timeline
Item Unit Value Comment
Technical parameters
Ramp Up Rate MW/min N/A 10% to 100% achievable in 30 sec
Ramp Down Rate MW/min N/A 100% to 10% achievable in 30 sec
Start-up time Min Cold: 5 min
Warm: 30 secs
Typical PEM value, depends on manufacturer. (note that Alkaline electrolysers can be in the order of 1 minute for a warm start)
Min Stable Generation % of installed capacity
10% Typical PEM value.
Project timeline
Time for development Years 2 includes pre/feasibility, design, approvals etc.
First Year Assumed Commercially Viable for construction
Year 2019
EPC programme Years 2 For NTP to COD.
◼ Total Lead Time Years 1.5 Time from NTP to main equipment on site.
◼ Construction time Weeks 26 Time from main equipment on site to COD.
Economic Life (Design Life)
Years 8 Typical PEM value (time to membrane replacement).
Technical Life (Operational Life)
Years 20 Typical PEM value.
4.9.5 Cost estimate – Electrolyser
The following table provides the cost parameters for the hypothetical project as outlined above.
Table 4-24 Cost estimates
Item Unit Value Comment
CAPEX – EPC cost
Relative cost $ / kW 1,800 For PEM. Note that Alkaline electrolysers may be 30 – 40% lower in cost compared to PEM.
Total EPC cost $ 90,000,000
◼ Equipment cost $ 72,000,000 80% of EPC cost – typical.
◼ Construction cost $ 18,000,000 20% of EPC cost – typical.
CAPEX – Other costs
Cost of land and development
$ 7,2000,000 Based on 8% of CAPEX per annum.
Fuel connection costs $ N/A
OPEX – Annual
Fixed O&M Cost $ / MW (Net) 54,000 Based on 3% of CAPEX per annum. Note that this includes allowance for the 8 year overhaul.
Excludes power consumption costs
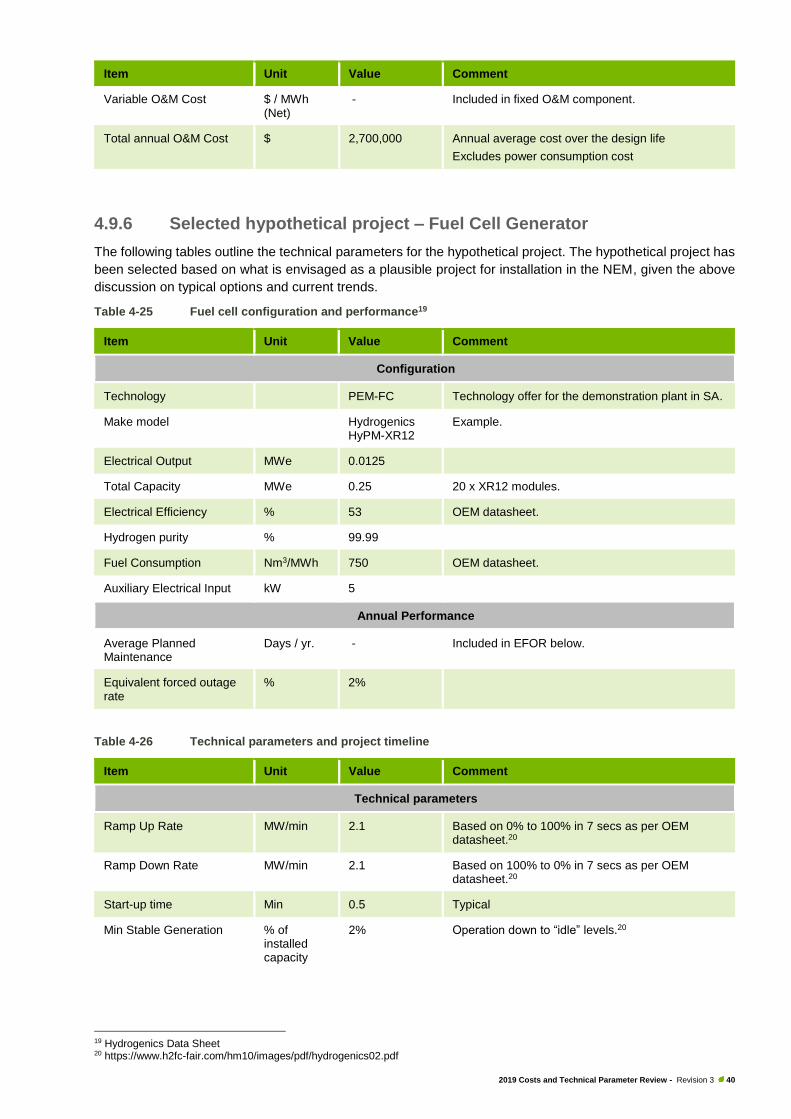
2019 Costs and Technical Parameter Review - Revision 3 40
Item Unit Value Comment
Variable O&M Cost $ / MWh (Net)
- Included in fixed O&M component.
Total annual O&M Cost $ 2,700,000 Annual average cost over the design life
Excludes power consumption cost
4.9.6 Selected hypothetical project – Fuel Cell Generator
The following tables outline the technical parameters for the hypothetical project. The hypothetical project has
been selected based on what is envisaged as a plausible project for installation in the NEM, given the above
discussion on typical options and current trends.
Table 4-25 Fuel cell configuration and performance19
Item Unit Value Comment
Configuration
Technology PEM-FC Technology offer for the demonstration plant in SA.
Make model Hydrogenics HyPM-XR12
Example.
Electrical Output MWe 0.0125
Total Capacity MWe 0.25 20 x XR12 modules.
Electrical Efficiency % 53 OEM datasheet.
Hydrogen purity % 99.99
Fuel Consumption Nm3/MWh 750 OEM datasheet.
Auxiliary Electrical Input kW 5
Annual Performance
Average Planned Maintenance
Days / yr. - Included in EFOR below.
Equivalent forced outage rate
% 2%
Table 4-26 Technical parameters and project timeline
Item Unit Value Comment
Technical parameters
Ramp Up Rate MW/min 2.1 Based on 0% to 100% in 7 secs as per OEM datasheet.20
Ramp Down Rate MW/min 2.1 Based on 100% to 0% in 7 secs as per OEM datasheet.20
Start-up time Min 0.5 Typical
Min Stable Generation % of installed capacity
2% Operation down to “idle” levels.20
19 Hydrogenics Data Sheet 20 https://www.h2fc-fair.com/hm10/images/pdf/hydrogenics02.pdf
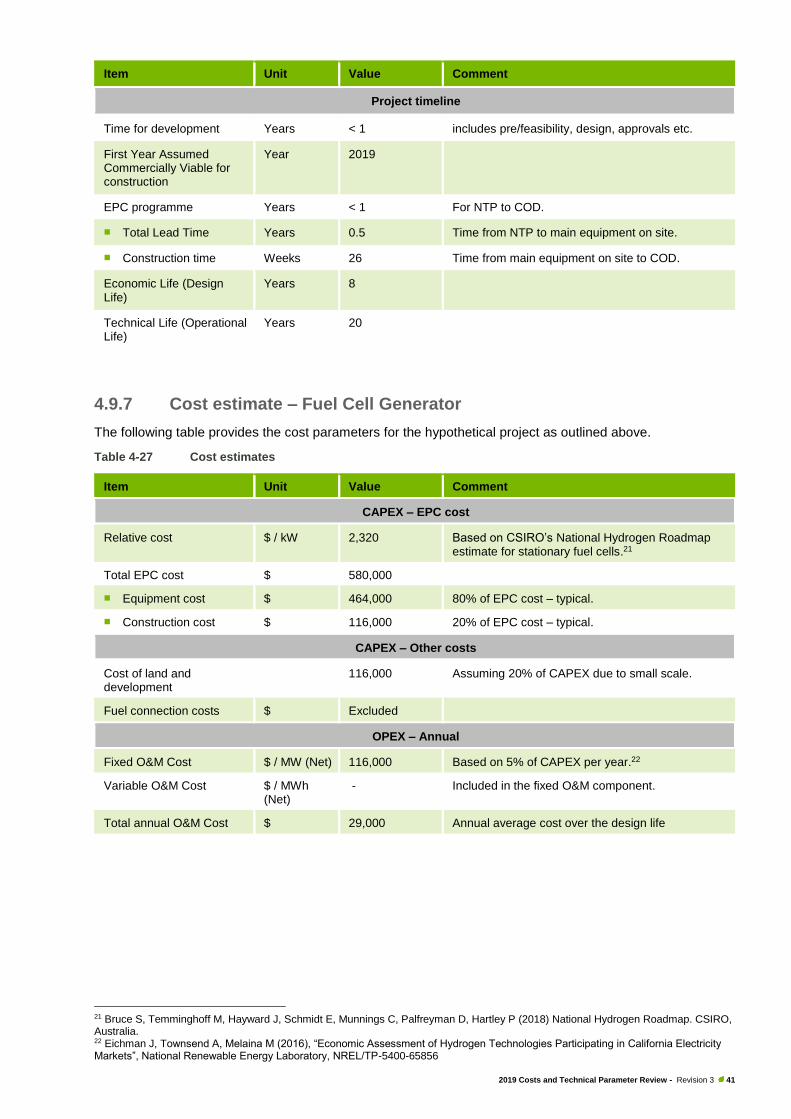
2019 Costs and Technical Parameter Review - Revision 3 41
Item Unit Value Comment
Project timeline
Time for development Years < 1 includes pre/feasibility, design, approvals etc.
First Year Assumed Commercially Viable for construction
Year 2019
EPC programme Years < 1 For NTP to COD.
◼ Total Lead Time Years 0.5 Time from NTP to main equipment on site.
◼ Construction time Weeks 26 Time from main equipment on site to COD.
Economic Life (Design Life)
Years 8
Technical Life (Operational Life)
Years 20
4.9.7 Cost estimate – Fuel Cell Generator
The following table provides the cost parameters for the hypothetical project as outlined above.
Table 4-27 Cost estimates
Item Unit Value Comment
CAPEX – EPC cost
Relative cost $ / kW 2,320 Based on CSIRO’s National Hydrogen Roadmap estimate for stationary fuel cells.21
Total EPC cost $ 580,000
◼ Equipment cost $ 464,000 80% of EPC cost – typical.
◼ Construction cost $ 116,000 20% of EPC cost – typical.
CAPEX – Other costs
Cost of land and development
116,000 Assuming 20% of CAPEX due to small scale.
Fuel connection costs $ Excluded
OPEX – Annual
Fixed O&M Cost $ / MW (Net) 116,000 Based on 5% of CAPEX per year.22
Variable O&M Cost $ / MWh (Net)
- Included in the fixed O&M component.
Total annual O&M Cost $ 29,000 Annual average cost over the design life
21 Bruce S, Temminghoff M, Hayward J, Schmidt E, Munnings C, Palfreyman D, Hartley P (2018) National Hydrogen Roadmap. CSIRO, Australia. 22 Eichman J, Townsend A, Melaina M (2016), “Economic Assessment of Hydrogen Technologies Participating in California Electricity Markets”, National Renewable Energy Laboratory, NREL/TP-5400-65856
2019 Costs and Technical Parameter Review - Revision 3 42
4.10 Battery Energy Storage System (BESS)
4.10.1 Overview
A battery energy storage system (BESS) stores electricity from the network or collocated generation plant, for
use as needed at a later point. The power is converted to low voltage in alternating current source, then
converted to direct current source through four-quadrant inverters and then stored in batteries. The power can
be regenerated back from the batteries to the high voltage AC network through the reverse path.
A BESS contains several primary components, including the battery system (with cells assembled into modules
and racks), battery management system, bi-directional inverters, step-up transformer(s), plant control and
monitoring system, HVAC / thermal management systems, and other balance of plant.
4.10.2 Typical options
The key driver for BESS design is the intended operating regime and purpose of the installation. A BESS can
be used for a wide range of network services, including energy market participation, load shifting, a range of
market and non-market ancillary services (in particular FCAS services), and cost mitigation to avoid or reduce
network upgrades, demand charges, fuel costs, and the FCAS ‘causer pays’ exposure of intermittent wind and
solar generators. A BESS can also be used to protect the NEM interconnectors, with for example the Hornsdale
Power Reserve BESS participating in the Special Integrated Protection Scheme (SIPS) of the SA-VIC
Heywood interconnector. The modular nature of a BESS enables it to be sized in both power and energy to
meet highly specific project requirements.
Batteries used for bulk energy shifting and arbitrage typically have greater than one hour of energy storage,
whereas, batteries used primarily for network support services or renewable integration may have less than
one hour of storage.
Lithium ion has become the dominant battery technology in recent years, primarily due to falling costs,
developments in the range of cell chemistries for different applications, high power and energy density (small
physical size), and high efficiency. Within the lithium ion battery class are a number of sub-categories of cell
chemistries. Each of these has different performance, life, and cost characteristics which may be used for
different purposes.
BESS units have a range of packaging approaches, including separate or combined battery and inverter
enclosures, stand-alone buildings, or outdoor modular cabinet type arrangements (e.g. Tesla Powerpack).
4.10.3 Recent trends
Grid-connected batteries installed within the last couple of years range from residential systems, to the
100 MW/129 MWh Hornsdale Power Reserve system. Generally, large-scale batteries have been installed
with less than two hours energy storage. As battery prices continue to fall (circa -50% over last 3 years) and
market price trends shift with increasing penetration of variable renewable energy, there may be some
incentive to construct grid scale batteries with more storage. However, this has yet to be demonstrated.
Battery energy storage systems have been installed by a range of companies, including generators,
transmission and distribution operators, and C&I customers. Given the flexibility of operating regimes and
modularity of systems, battery systems are being adopted to serve a wide range of challenges and customer
bases.
Due to restrictions placed on generators in South Australia by the Office of the Technical Regulator, many
generators are increasingly looking to install battery systems with their generation to meet Fast Frequency
Response (FFR) requirements.
The BESS flexibility in controlling the power supply, with their four quadrant inverters, provides a range of
capabilities that have not been yet deployed in large numbers in the NEM, but that have been proven as
reliable in other systems. These features include synthetic inertia (primary frequency response) and Static
Synchronous Compensator (STATCOM) type services.
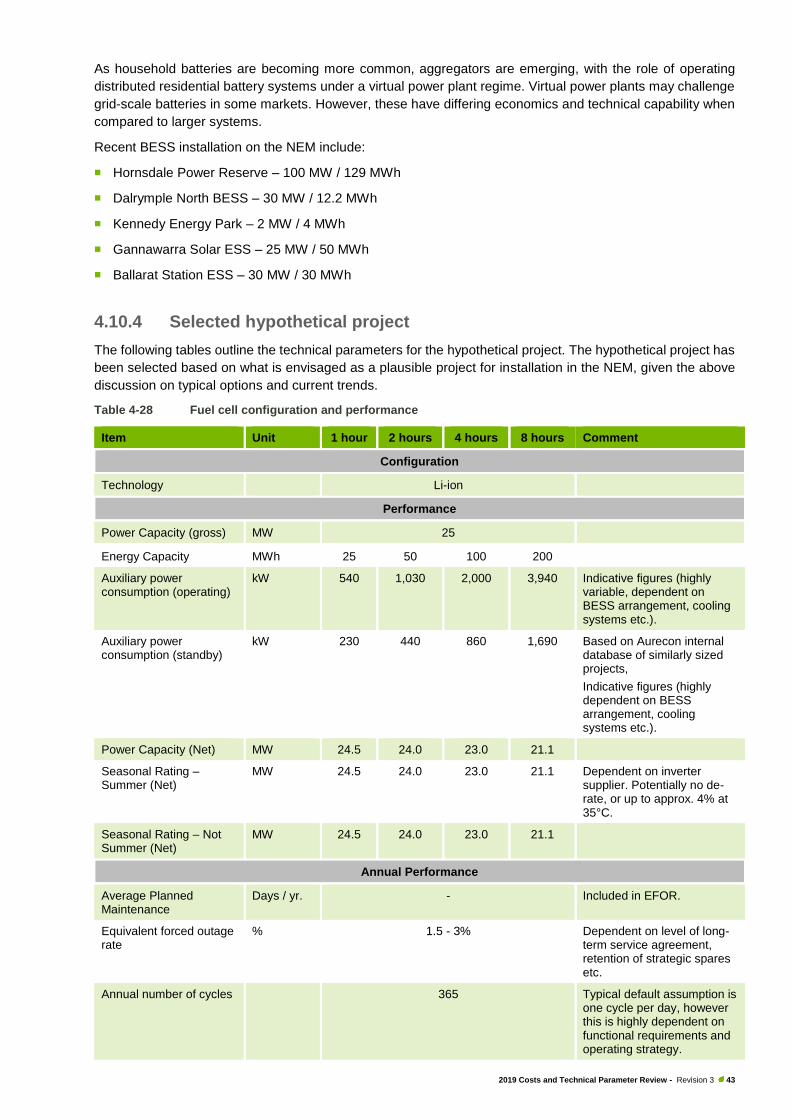
2019 Costs and Technical Parameter Review - Revision 3 43
As household batteries are becoming more common, aggregators are emerging, with the role of operating
distributed residential battery systems under a virtual power plant regime. Virtual power plants may challenge
grid-scale batteries in some markets. However, these have differing economics and technical capability when
compared to larger systems.
Recent BESS installation on the NEM include:
◼ Hornsdale Power Reserve – 100 MW / 129 MWh
◼ Dalrymple North BESS – 30 MW / 12.2 MWh
◼ Kennedy Energy Park – 2 MW / 4 MWh
◼ Gannawarra Solar ESS – 25 MW / 50 MWh
◼ Ballarat Station ESS – 30 MW / 30 MWh
4.10.4 Selected hypothetical project
The following tables outline the technical parameters for the hypothetical project. The hypothetical project has
been selected based on what is envisaged as a plausible project for installation in the NEM, given the above
discussion on typical options and current trends.
Table 4-28 Fuel cell configuration and performance
Item Unit 1 hour 2 hours 4 hours 8 hours Comment
Configuration
Technology Li-ion
Performance
Power Capacity (gross) MW 25
Energy Capacity MWh 25 50 100 200
Auxiliary power consumption (operating)
kW 540 1,030 2,000 3,940 Indicative figures (highly variable, dependent on BESS arrangement, cooling systems etc.).
Auxiliary power consumption (standby)
kW 230 440 860 1,690 Based on Aurecon internal database of similarly sized projects,
Indicative figures (highly dependent on BESS arrangement, cooling systems etc.).
Power Capacity (Net) MW 24.5 24.0 23.0 21.1
Seasonal Rating – Summer (Net)
MW 24.5 24.0 23.0 21.1 Dependent on inverter supplier. Potentially no de-rate, or up to approx. 4% at 35°C.
Seasonal Rating – Not Summer (Net)
MW 24.5 24.0 23.0 21.1
Annual Performance
Average Planned Maintenance
Days / yr. - Included in EFOR.
Equivalent forced outage rate
% 1.5 - 3% Dependent on level of long-term service agreement, retention of strategic spares etc.
Annual number of cycles 365 Typical default assumption is one cycle per day, however this is highly dependent on functional requirements and operating strategy.
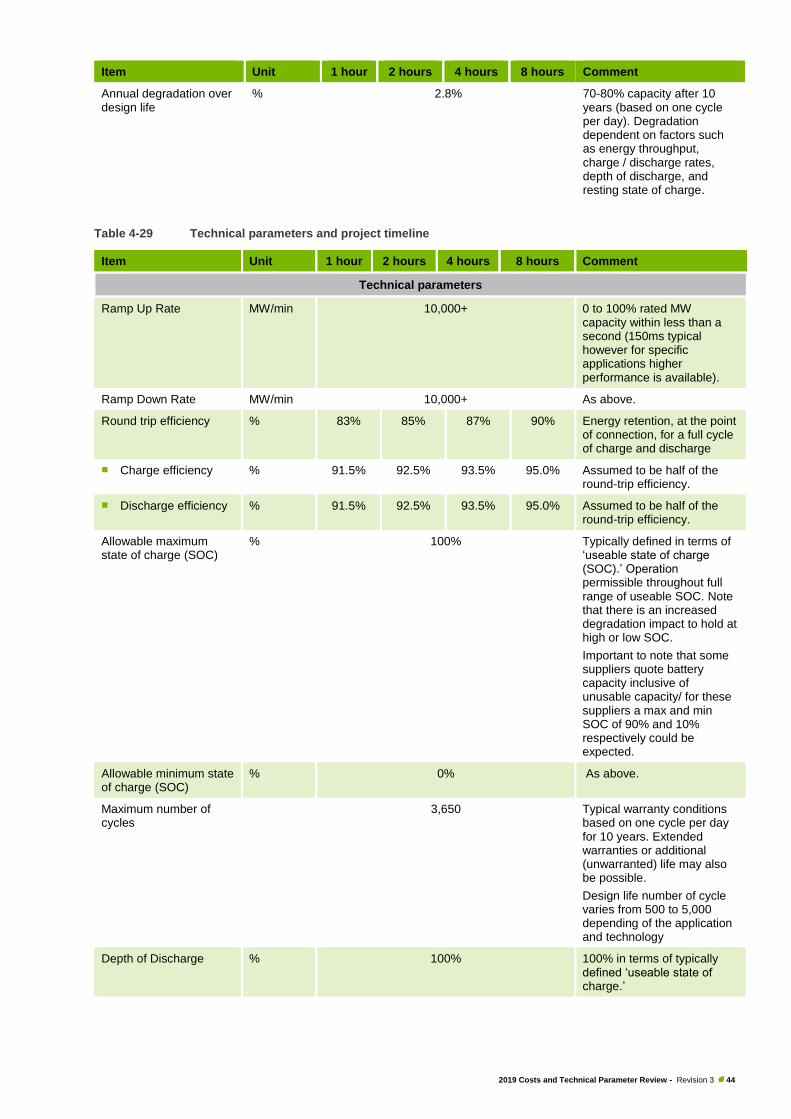
2019 Costs and Technical Parameter Review - Revision 3 44
Item Unit 1 hour 2 hours 4 hours 8 hours Comment
Annual degradation over design life
% 2.8% 70-80% capacity after 10 years (based on one cycle per day). Degradation dependent on factors such as energy throughput, charge / discharge rates, depth of discharge, and resting state of charge.
Table 4-29 Technical parameters and project timeline
Item Unit 1 hour 2 hours 4 hours 8 hours Comment
Technical parameters
Ramp Up Rate MW/min 10,000+ 0 to 100% rated MW capacity within less than a second (150ms typical however for specific applications higher performance is available).
Ramp Down Rate MW/min 10,000+ As above.
Round trip efficiency % 83% 85% 87% 90% Energy retention, at the point of connection, for a full cycle of charge and discharge
◼ Charge efficiency % 91.5% 92.5% 93.5% 95.0% Assumed to be half of the round-trip efficiency.
◼ Discharge efficiency % 91.5% 92.5% 93.5% 95.0% Assumed to be half of the round-trip efficiency.
Allowable maximum state of charge (SOC)
% 100% Typically defined in terms of ‘useable state of charge (SOC).’ Operation permissible throughout full range of useable SOC. Note that there is an increased degradation impact to hold at high or low SOC.
Important to note that some suppliers quote battery capacity inclusive of unusable capacity/ for these suppliers a max and min SOC of 90% and 10% respectively could be expected.
Allowable minimum state of charge (SOC)
% 0% As above.
Maximum number of cycles
3,650 Typical warranty conditions based on one cycle per day for 10 years. Extended warranties or additional (unwarranted) life may also be possible.
Design life number of cycle varies from 500 to 5,000 depending of the application and technology
Depth of Discharge % 100% 100% in terms of typically defined ‘useable state of charge.’

2019 Costs and Technical Parameter Review - Revision 3 45
Item Unit 1 hour 2 hours 4 hours 8 hours Comment
Project timeline
Time for development Years 1
First Year Assumed Commercially Viable for construction
Year 2019
Total EPC Programme Years 0.66 0.75 1 1 For NTP to COD.
◼ Total lead time Years 0.5 0.6 0.75 0.75
◼ Construction time Weeks 8 8 12 12 Significantly dependent on BESS arrangement.
Economic Life (Design Life)
Years 10 Nominally based on initial 10-year battery life however highly dependent on the technology and function supplied
Technical Life (Operational Life)
Years 20 Extended project life with battery upgrades.
4.10.5 Cost estimate
The following table provides the cost parameters for the hypothetical project as outlined above.
Table 4-30 Cost estimates
Item Unit 1 hour 2 hours 4 hours 8 hours Comment
CAPEX – EPC cost
Total EPC cost $M 19.9 26.3 44.3 84.3 Based on Aurecon internal database of similarly sized projects and scaled for additional energy storage capacity.
◼ Equipment cost $M 15.9 21.0 35.4 67.4 As above.
◼ Installation cost $M 4.0 5.3 8.9 16.9 As above.
CAPEX – Other costs
Cost of land and development
$ 4,800,000
OPEX – Annual
Fixed O&M Cost $/MW (Net)
4,833 9,717 19,239 39,314 Provided on $/MW basis for input into GenCost template only.
Variable O&M Cost $/MWh (Net)
- - - - BESS long term service agreements not typically based on fixed / variable.
Total annual O&M Cost $ 120,000 240,000 470,000 940,000 Highly variable between OEMs.
Annual average cost over the design life
Does not include battery replacement cost at end of Economic Life (Design Life)

2019 Costs and Technical Parameter Review - Revision 3 46
5 Capacity Factors for New Solar
and Wind Generators
As part of this exercise, AEMO has requested a forecast of benchmark new entrant capacity factors for the
following technologies:
◼ Solar PV - single axis tracking
◼ Wind - onshore
◼ Wind - offshore
The intention is to provide an indication of the likely future capacity factor improvements in a NEM context for
long term forecast purposes.
It is important to note that capacity factors for wind and solar PV are highly variable and dependent on the
resource availability at the project location. Generally speaking the achieved capacity factor for a specific
project location has been a result of optimising the cost of energy and not technological advancement.
Achieving notably higher capacity factors with wind turbines, and to a lesser extent Solar PV, is possible today
however with inefficient increases in capital cost. As the capital cost of wind farms (on a $/MW basis) and solar
PV modules continues to come down project capacity factors are likely to continue to increase in the near
term. In the medium to long term continued improvements in capacity factors for NEM based projects are
increasingly unlikely.
For this analysis NEM based projects has been assumed in line with the hypothetical projects represented
throughout this report. The projected capacity factor trends are shown in the figure below with the raw data in
the subsequent table which are intended to indicate NEM fleet wide trends over time taking into account the
range of factors as discussed above.
Figure 5-1 Capacity Factors for new solar and wind generators over time – NEM wide trend
0
10
20
30
40
50
60
2019 2024 2029 2034 2039 2044 2049
Capacity
Facto
r
Year
Onshore wind
Offshore wind
Solar PV (SAT)
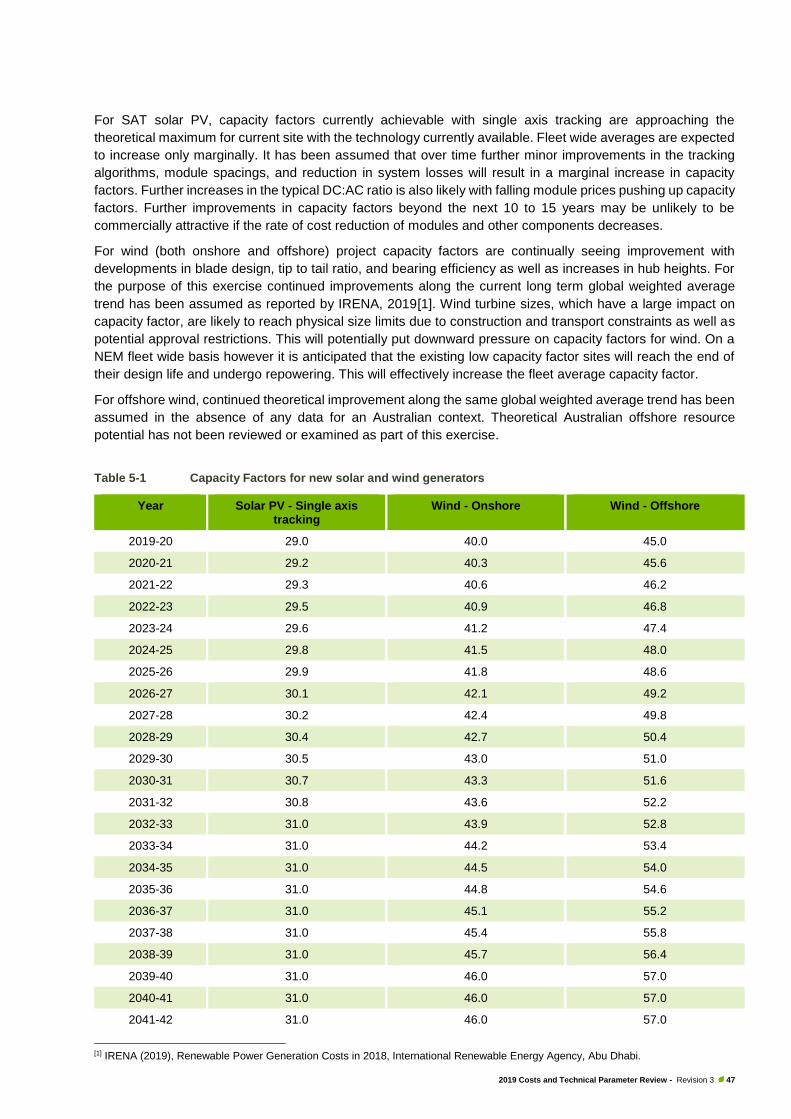
2019 Costs and Technical Parameter Review - Revision 3 47
For SAT solar PV, capacity factors currently achievable with single axis tracking are approaching the
theoretical maximum for current site with the technology currently available. Fleet wide averages are expected
to increase only marginally. It has been assumed that over time further minor improvements in the tracking
algorithms, module spacings, and reduction in system losses will result in a marginal increase in capacity
factors. Further increases in the typical DC:AC ratio is also likely with falling module prices pushing up capacity
factors. Further improvements in capacity factors beyond the next 10 to 15 years may be unlikely to be
commercially attractive if the rate of cost reduction of modules and other components decreases.
For wind (both onshore and offshore) project capacity factors are continually seeing improvement with
developments in blade design, tip to tail ratio, and bearing efficiency as well as increases in hub heights. For
the purpose of this exercise continued improvements along the current long term global weighted average
trend has been assumed as reported by IRENA, 2019[1]. Wind turbine sizes, which have a large impact on
capacity factor, are likely to reach physical size limits due to construction and transport constraints as well as
potential approval restrictions. This will potentially put downward pressure on capacity factors for wind. On a
NEM fleet wide basis however it is anticipated that the existing low capacity factor sites will reach the end of
their design life and undergo repowering. This will effectively increase the fleet average capacity factor.
For offshore wind, continued theoretical improvement along the same global weighted average trend has been
assumed in the absence of any data for an Australian context. Theoretical Australian offshore resource
potential has not been reviewed or examined as part of this exercise.
Table 5-1 Capacity Factors for new solar and wind generators
Year Solar PV - Single axis tracking
Wind - Onshore Wind - Offshore
2019-20 29.0 40.0 45.0
2020-21 29.2 40.3 45.6
2021-22 29.3 40.6 46.2
2022-23 29.5 40.9 46.8
2023-24 29.6 41.2 47.4
2024-25 29.8 41.5 48.0
2025-26 29.9 41.8 48.6
2026-27 30.1 42.1 49.2
2027-28 30.2 42.4 49.8
2028-29 30.4 42.7 50.4
2029-30 30.5 43.0 51.0
2030-31 30.7 43.3 51.6
2031-32 30.8 43.6 52.2
2032-33 31.0 43.9 52.8
2033-34 31.0 44.2 53.4
2034-35 31.0 44.5 54.0
2035-36 31.0 44.8 54.6
2036-37 31.0 45.1 55.2
2037-38 31.0 45.4 55.8
2038-39 31.0 45.7 56.4
2039-40 31.0 46.0 57.0
2040-41 31.0 46.0 57.0
2041-42 31.0 46.0 57.0
[1] IRENA (2019), Renewable Power Generation Costs in 2018, International Renewable Energy Agency, Abu Dhabi.

2019 Costs and Technical Parameter Review - Revision 3 48
Year Solar PV - Single axis tracking
Wind - Onshore Wind - Offshore
2042-43 31.0 46.0 57.0
2043-44 31.0 46.0 57.0
2044-45 31.0 46.0 57.0
2045-46 31.0 46.0 57.0
2046-47 31.0 46.0 57.0
2047-48 31.0 46.0 57.0
2048-49 31.0 46.0 57.0
2049-50 31.0 46.0 57.0
Click or tap here to enter text.
Appendices

2019 Costs and Technical Parameter Review - Revision 3
Appendix A
AEMO GenCost 2019 Excel Spreadsheets
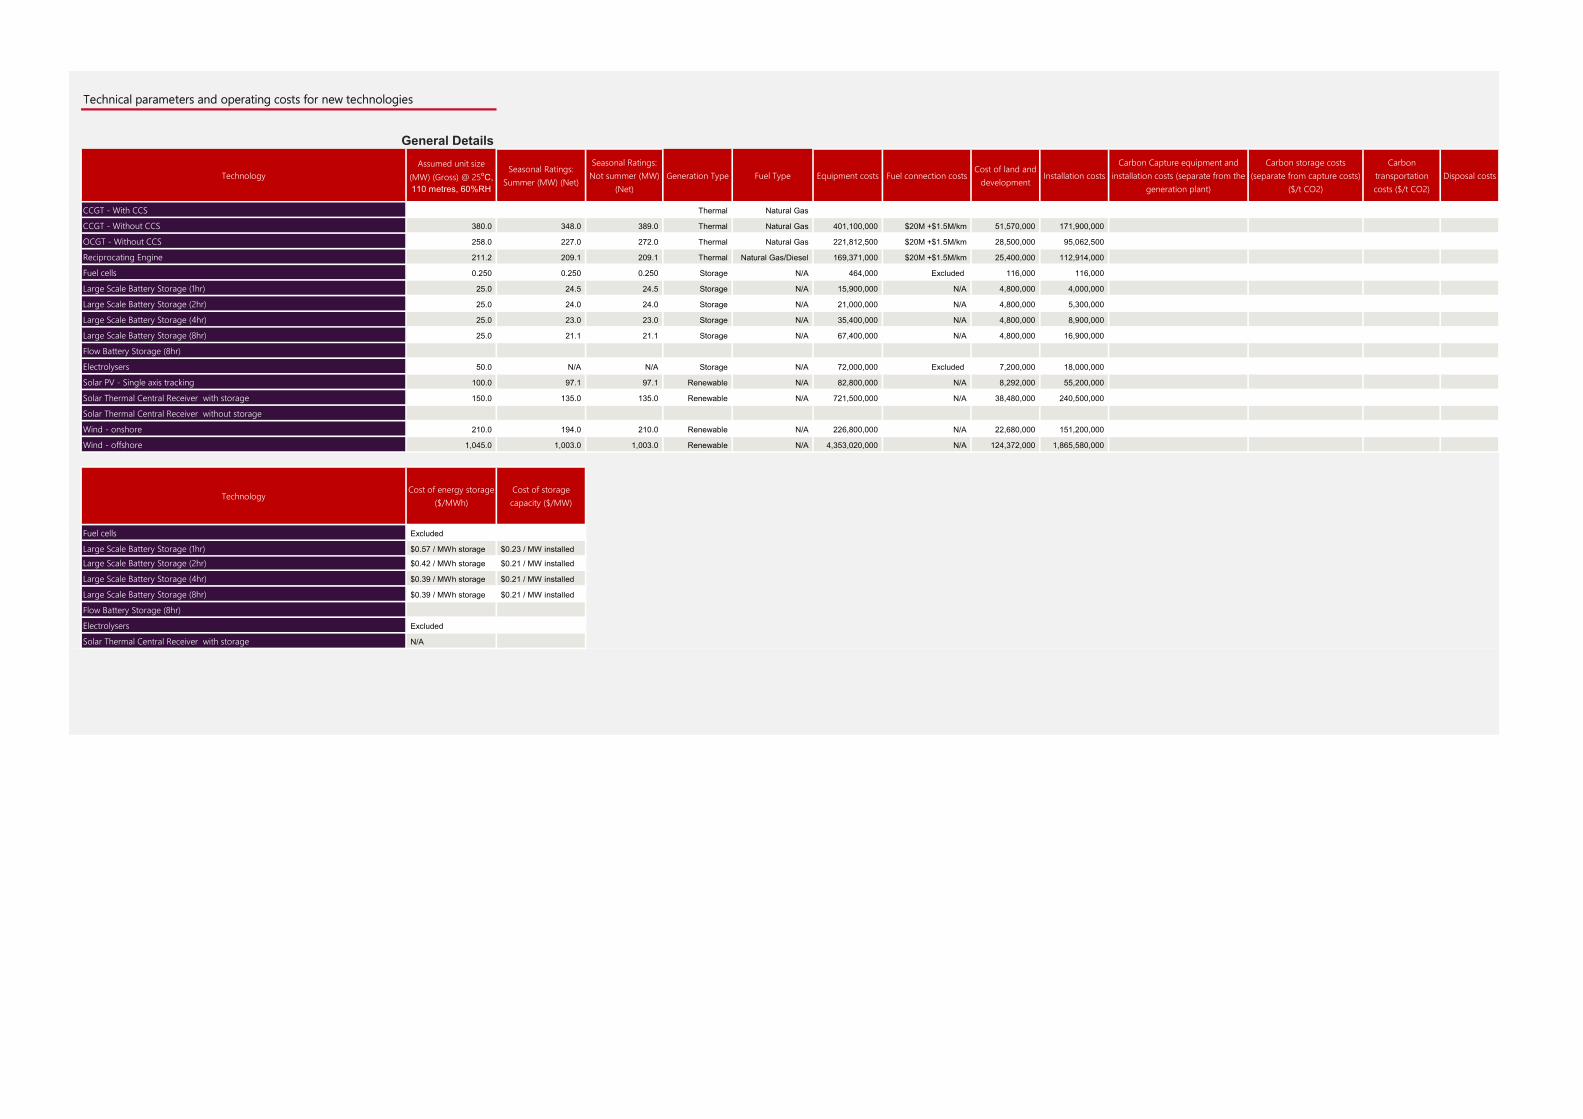
TechnologyAssumed unit size
(MW) (Gross) @ 25oC, 110 metres, 60%RH
Seasonal Ratings: Summer (MW) (Net)
Seasonal Ratings: Not summer (MW)
(Net) Generation Type Fuel Type Equipment costs Fuel connection costs
Cost of land and development
Installation costs Carbon Capture equipment and
installation costs (separate from the generation plant)
Carbon storage costs (separate from capture costs)
($/t CO2)
Carbon transportation costs ($/t CO2)
Disposal costs
CCGT - With CCS Thermal Natural Gas
CCGT - Without CCS 380.0 348.0 389.0 Thermal Natural Gas 401,100,000 $20M +$1.5M/km 51,570,000 171,900,000
OCGT - Without CCS 258.0 227.0 272.0 Thermal Natural Gas 221,812,500 $20M +$1.5M/km 28,500,000 95,062,500
Reciprocating Engine 211.2 209.1 209.1 Thermal Natural Gas/Diesel 169,371,000 $20M +$1.5M/km 25,400,000 112,914,000
Fuel cells 0.250 0.250 0.250 Storage N/A 464,000 Excluded 116,000 116,000
Large Scale Battery Storage (1hr) 25.0 24.5 24.5 Storage N/A 15,900,000 N/A 4,800,000 4,000,000
Large Scale Battery Storage (2hr) 25.0 24.0 24.0 Storage N/A 21,000,000 N/A 4,800,000 5,300,000
Large Scale Battery Storage (4hr) 25.0 23.0 23.0 Storage N/A 35,400,000 N/A 4,800,000 8,900,000
Large Scale Battery Storage (8hr) 25.0 21.1 21.1 Storage N/A 67,400,000 N/A 4,800,000 16,900,000
Flow Battery Storage (8hr)
Electrolysers 50.0 N/A N/A Storage N/A 72,000,000 Excluded 7,200,000 18,000,000
Solar PV - Single axis tracking 100.0 97.1 97.1 Renewable N/A 82,800,000 N/A 8,292,000 55,200,000
Solar Thermal Central Receiver with storage 150.0 135.0 135.0 Renewable N/A 721,500,000 N/A 38,480,000 240,500,000
Solar Thermal Central Receiver without storage
Wind - onshore 210.0 194.0 210.0 Renewable N/A 226,800,000 N/A 22,680,000 151,200,000
Wind - offshore 1,045.0 1,003.0 1,003.0 Renewable N/A 4,353,020,000 N/A 124,372,000 1,865,580,000
TechnologyCost of energy storage
($/MWh)Cost of storage capacity ($/MW)
Fuel cells Excluded
Large Scale Battery Storage (1hr) $0.57 / MWh storage $0.23 / MW installed
Large Scale Battery Storage (2hr) $0.42 / MWh storage $0.21 / MW installed
Large Scale Battery Storage (4hr) $0.39 / MWh storage $0.21 / MW installed
Large Scale Battery Storage (8hr) $0.39 / MWh storage $0.21 / MW installed
Flow Battery Storage (8hr)
Electrolysers Excluded
Solar Thermal Central Receiver with storage N/A
General Details
Technical parameters and operating costs for new technologies
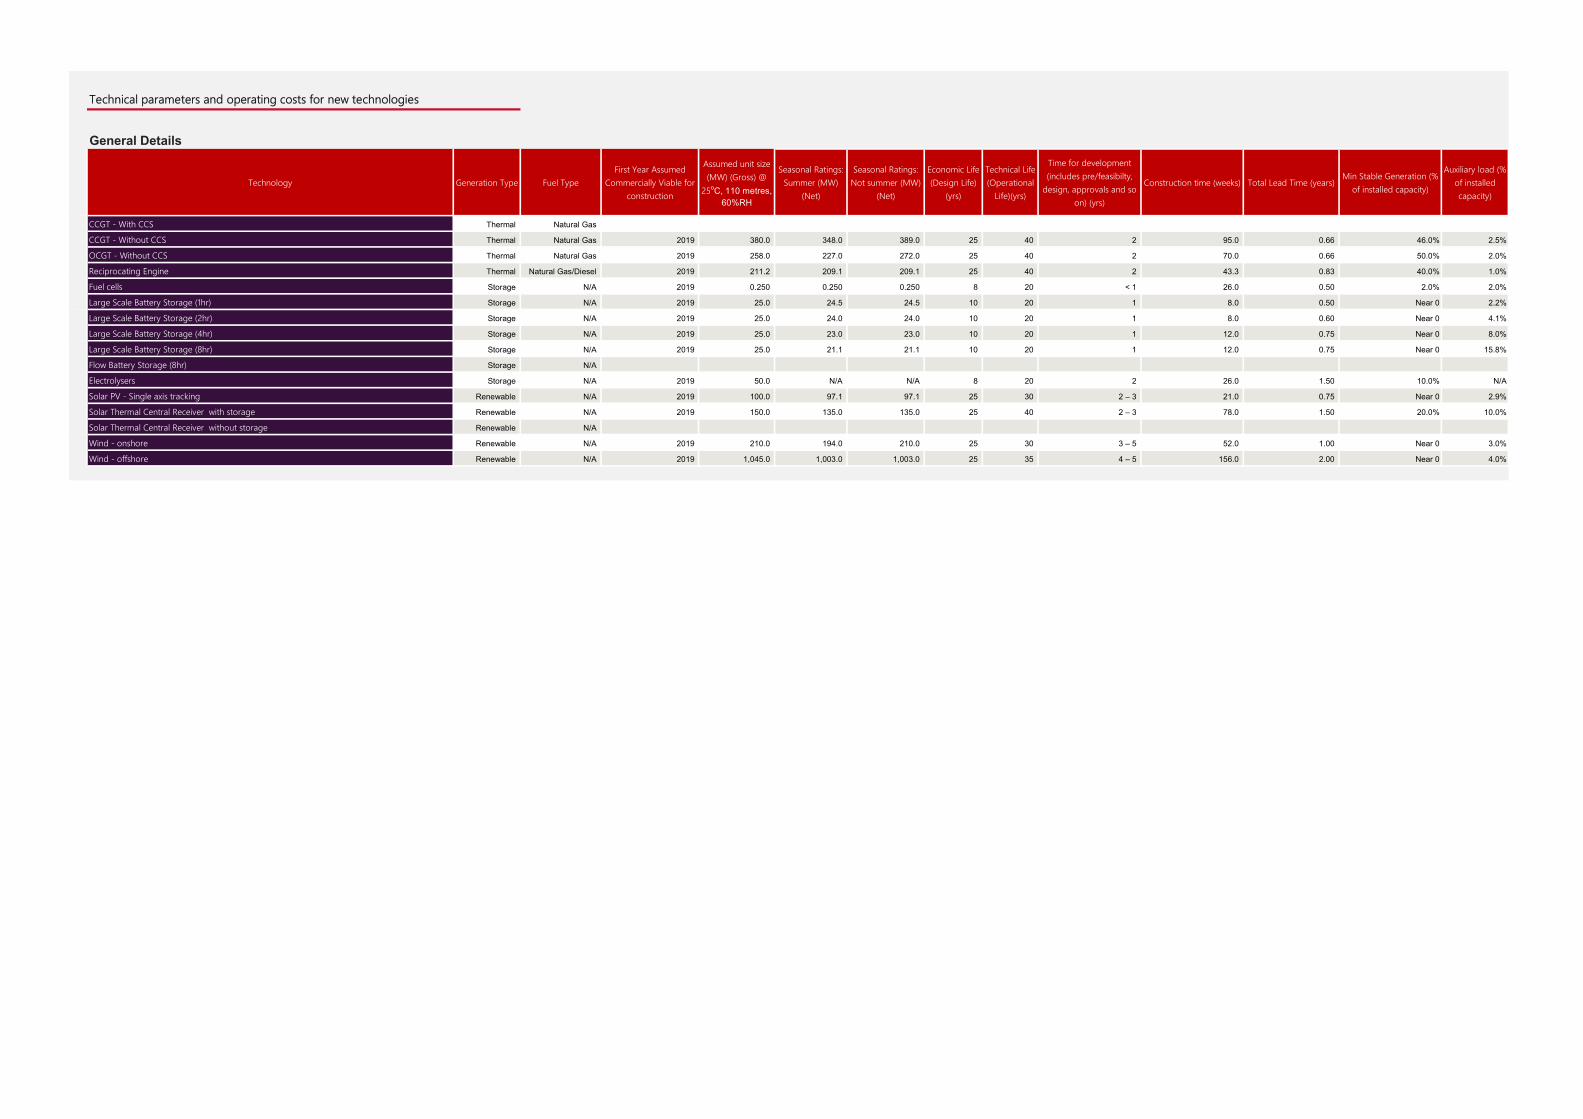
Technology Generation Type Fuel TypeFirst Year Assumed
Commercially Viable for construction
Assumed unit size (MW) (Gross) @
25oC, 110 metres, 60%RH
Seasonal Ratings: Summer (MW)
(Net)
Seasonal Ratings: Not summer (MW)
(Net)
Economic Life (Design Life)
(yrs)
Technical Life (Operational
Life)(yrs)
Time for development (includes pre/feasibilty,
design, approvals and so on) (yrs)
Construction time (weeks) Total Lead Time (years)Min Stable Generation (%
of installed capacity)
Auxiliary load (% of installed capacity)
CCGT - With CCS Thermal Natural Gas
CCGT - Without CCS Thermal Natural Gas 2019 380.0 348.0 389.0 25 40 2 95.0 0.66 46.0% 2.5%
OCGT - Without CCS Thermal Natural Gas 2019 258.0 227.0 272.0 25 40 2 70.0 0.66 50.0% 2.0%
Reciprocating Engine Thermal Natural Gas/Diesel 2019 211.2 209.1 209.1 25 40 2 43.3 0.83 40.0% 1.0%
Fuel cells Storage N/A 2019 0.250 0.250 0.250 8 20 < 1 26.0 0.50 2.0% 2.0%
Large Scale Battery Storage (1hr) Storage N/A 2019 25.0 24.5 24.5 10 20 1 8.0 0.50 Near 0 2.2%
Large Scale Battery Storage (2hr) Storage N/A 2019 25.0 24.0 24.0 10 20 1 8.0 0.60 Near 0 4.1%
Large Scale Battery Storage (4hr) Storage N/A 2019 25.0 23.0 23.0 10 20 1 12.0 0.75 Near 0 8.0%
Large Scale Battery Storage (8hr) Storage N/A 2019 25.0 21.1 21.1 10 20 1 12.0 0.75 Near 0 15.8%
Flow Battery Storage (8hr) Storage N/A
Electrolysers Storage N/A 2019 50.0 N/A N/A 8 20 2 26.0 1.50 10.0% N/A
Solar PV - Single axis tracking Renewable N/A 2019 100.0 97.1 97.1 25 30 2 – 3 21.0 0.75 Near 0 2.9%
Solar Thermal Central Receiver with storage Renewable N/A 2019 150.0 135.0 135.0 25 40 2 – 3 78.0 1.50 20.0% 10.0%
Solar Thermal Central Receiver without storage Renewable N/A
Wind - onshore Renewable N/A 2019 210.0 194.0 210.0 25 30 3 – 5 52.0 1.00 Near 0 3.0%
Wind - offshore Renewable N/A 2019 1,045.0 1,003.0 1,003.0 25 35 4 – 5 156.0 2.00 Near 0 4.0%
Technical parameters and operating costs for new technologies
General Details
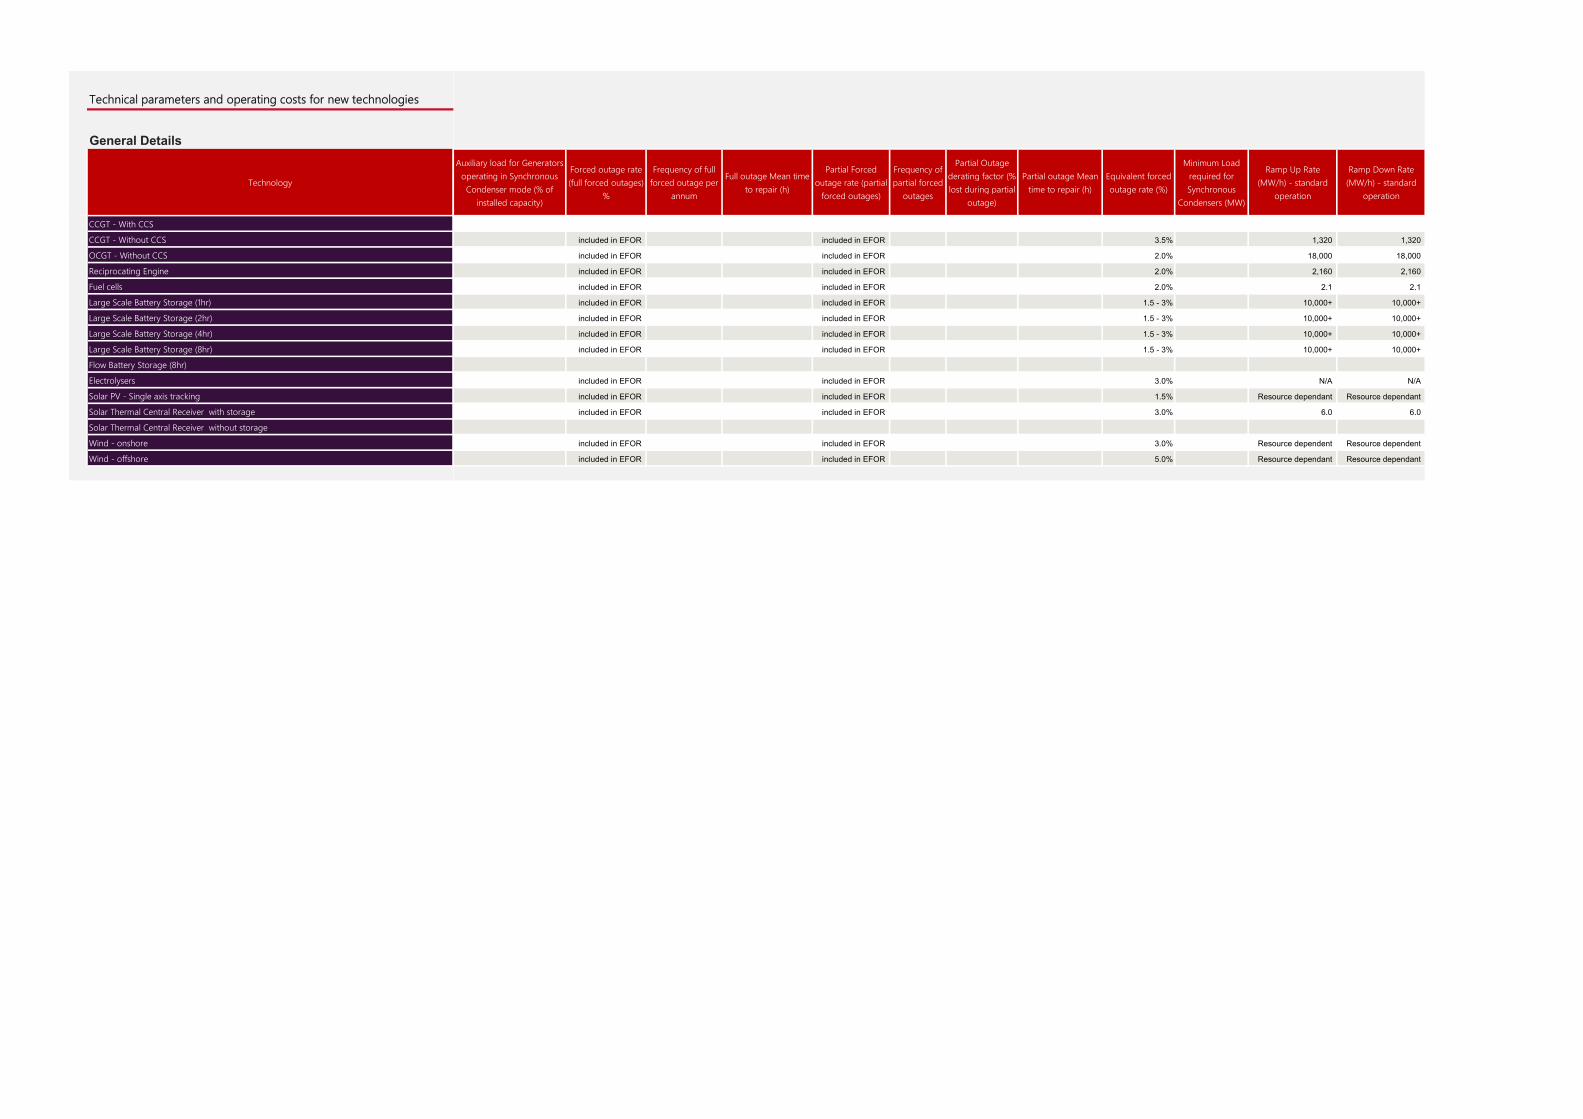
Technology
CCGT - With CCS
CCGT - Without CCS
OCGT - Without CCS
Reciprocating Engine
Fuel cells
Large Scale Battery Storage (1hr)
Large Scale Battery Storage (2hr)
Large Scale Battery Storage (4hr)
Large Scale Battery Storage (8hr)
Flow Battery Storage (8hr)
Electrolysers
Solar PV - Single axis tracking
Solar Thermal Central Receiver with storage
Solar Thermal Central Receiver without storage
Wind - onshore
Wind - offshore
Technical parameters and operating costs for new technologies
General Details
Auxiliary load for Generators operating in Synchronous Condenser mode (% of
installed capacity)
Forced outage rate (full forced outages)
%
Frequency of full forced outage per
annum
Full outage Mean time to repair (h)
Partial Forced outage rate (partial
forced outages)
Frequency of partial forced
outages
Partial Outage derating factor (% lost during partial
outage)
Partial outage Mean time to repair (h)
Equivalent forced outage rate (%)
Minimum Load required for Synchronous
Condensers (MW)
Ramp Up Rate (MW/h) - standard
operation
Ramp Down Rate (MW/h) - standard
operation
included in EFOR included in EFOR 3.5% 1,320 1,320
included in EFOR included in EFOR 2.0% 18,000 18,000
included in EFOR included in EFOR 2.0% 2,160 2,160
included in EFOR included in EFOR 2.0% 2.1 2.1
included in EFOR included in EFOR 1.5 - 3% 10,000+ 10,000+
included in EFOR included in EFOR 1.5 - 3% 10,000+ 10,000+
included in EFOR included in EFOR 1.5 - 3% 10,000+ 10,000+
included in EFOR included in EFOR 1.5 - 3% 10,000+ 10,000+
included in EFOR included in EFOR 3.0% N/A N/A
included in EFOR included in EFOR 1.5% Resource dependant Resource dependant
included in EFOR included in EFOR 3.0% 6.0 6.0
included in EFOR included in EFOR 3.0% Resource dependent Resource dependent
included in EFOR included in EFOR 5.0% Resource dependant Resource dependant

Technology
CCGT - With CCS
CCGT - Without CCS
OCGT - Without CCS
Reciprocating Engine
Fuel cells
Large Scale Battery Storage (1hr)
Large Scale Battery Storage (2hr)
Large Scale Battery Storage (4hr)
Large Scale Battery Storage (8hr)
Flow Battery Storage (8hr)
Electrolysers
Solar PV - Single axis tracking
Solar Thermal Central Receiver with storage
Solar Thermal Central Receiver without storage
Wind - onshore
Wind - offshore
Technical parameters and operating costs for new technologies
General Details
Heat rate at minimum operation (GJ/MWh)
HHV Net
Heat rate at maximum operation (GJ/MWh) HHV Net
Thermal Efficiency (%, HHV, Net) MCR
Maintenance Frequency (no of
maintenance events per year)
Average Planned Maintenance (no of
days/year)
Hydro units: Pumping Efficiency (MWh pumped per MWh generated) -
within 24 hours
Pump load (MW)Battery storage:
Charge efficiencyBattery storage:
Discharge efficiency
Battery Storage: Allowable max State
of Charge (%)
Battery Storage: Allowable min State
of Charge (%)
Battery Storage: maximum number of
Cycles
7.863 7.068 50.90% 12.8
11.510 10.051 35.82% 3.0
11,356.000 8,790.000 40.90% 2.7
N/A N/A N/A -
N/A N/A N/A - 92% 92% 0% 100% 3,650
N/A N/A N/A - 93% 93% 0% 100% 3,650
N/A N/A N/A - 94% 94% 0% 100% 3,650
N/A N/A N/A - 95% 95% 0% 100% 3,650
N/A N/A N/A 15.0
N/A N/A N/A -
N/A N/A N/A 7.0
N/A N/A N/A -
N/A N/A N/A -
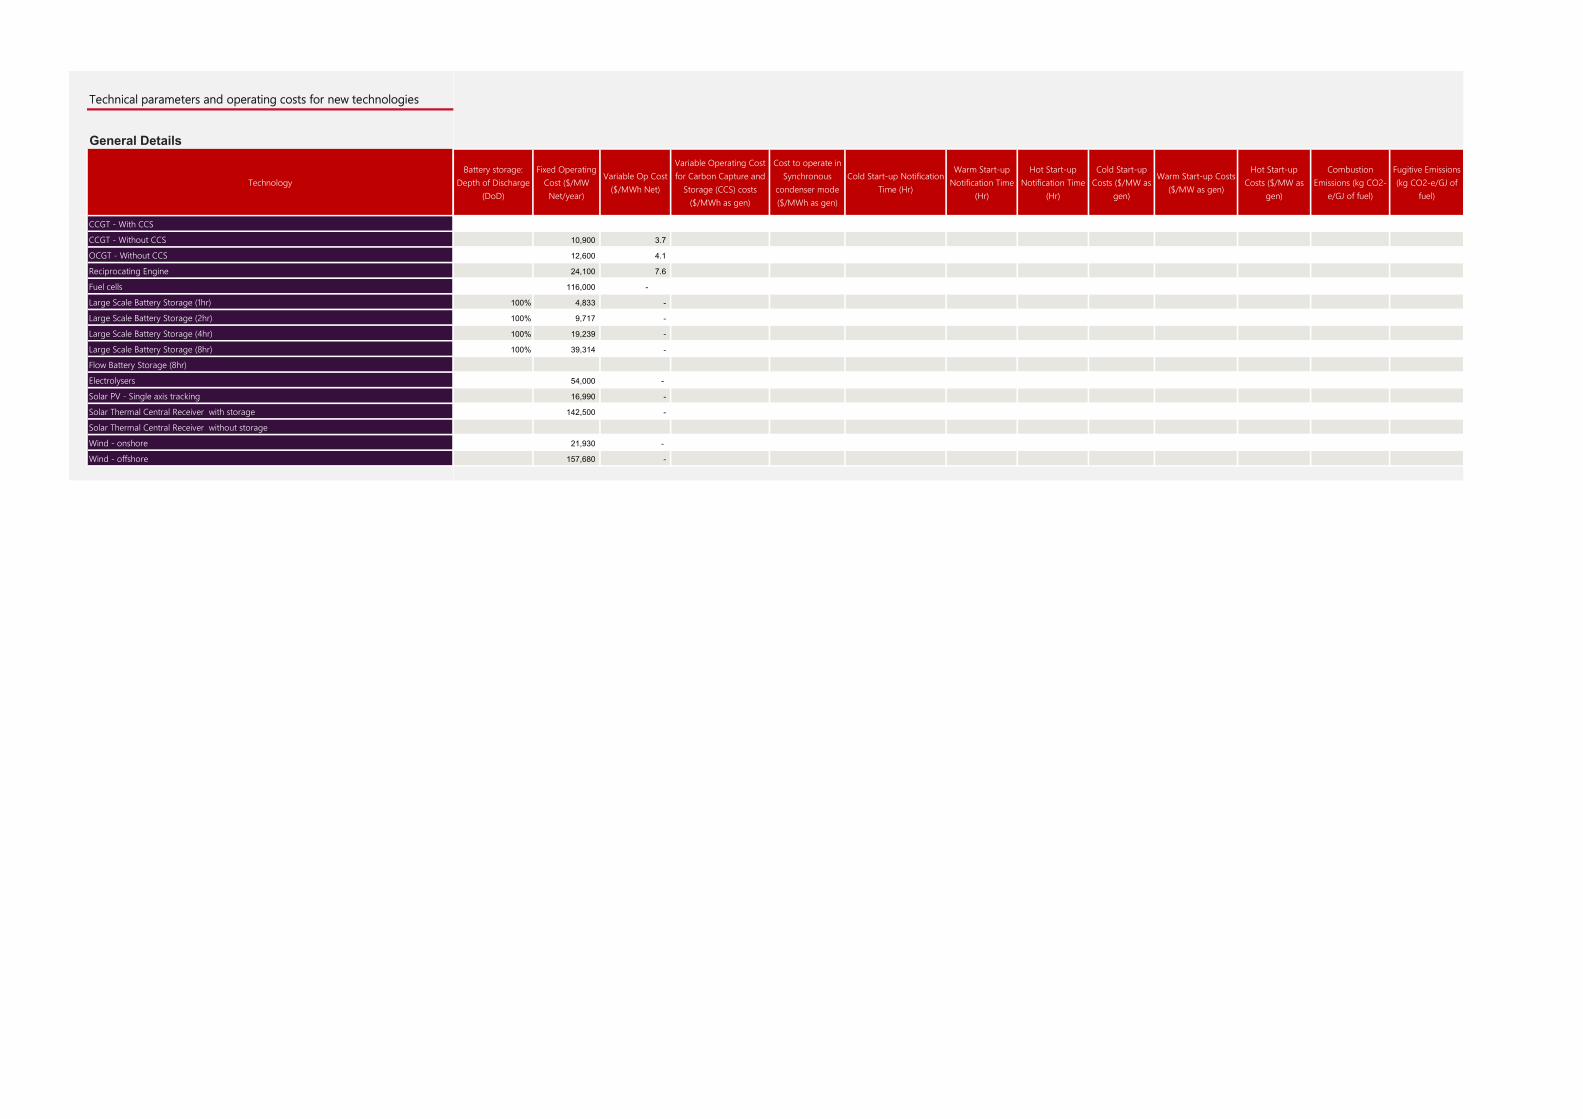
Technology
CCGT - With CCS
CCGT - Without CCS
OCGT - Without CCS
Reciprocating Engine
Fuel cells
Large Scale Battery Storage (1hr)
Large Scale Battery Storage (2hr)
Large Scale Battery Storage (4hr)
Large Scale Battery Storage (8hr)
Flow Battery Storage (8hr)
Electrolysers
Solar PV - Single axis tracking
Solar Thermal Central Receiver with storage
Solar Thermal Central Receiver without storage
Wind - onshore
Wind - offshore
Technical parameters and operating costs for new technologies
General Details
Battery storage: Depth of Discharge
(DoD)
Fixed Operating Cost ($/MW Net/year)
Variable Op Cost ($/MWh Net)
Variable Operating Cost for Carbon Capture and
Storage (CCS) costs ($/MWh as gen)
Cost to operate in Synchronous
condenser mode ($/MWh as gen)
Cold Start-up Notification Time (Hr)
Warm Start-up Notification Time
(Hr)
Hot Start-up Notification Time
(Hr)
Cold Start-up Costs ($/MW as
gen)
Warm Start-up Costs ($/MW as gen)
Hot Start-up Costs ($/MW as
gen)
Combustion Emissions (kg CO2-
e/GJ of fuel)
Fugitive Emissions (kg CO2-e/GJ of
fuel)
10,900 3.7
12,600 4.1
24,100 7.6
116,000 -
100% 4,833 -
100% 9,717 -
100% 19,239 -
100% 39,314 -
54,000 -
16,990 -
142,500 -
21,930 -
157,680 -
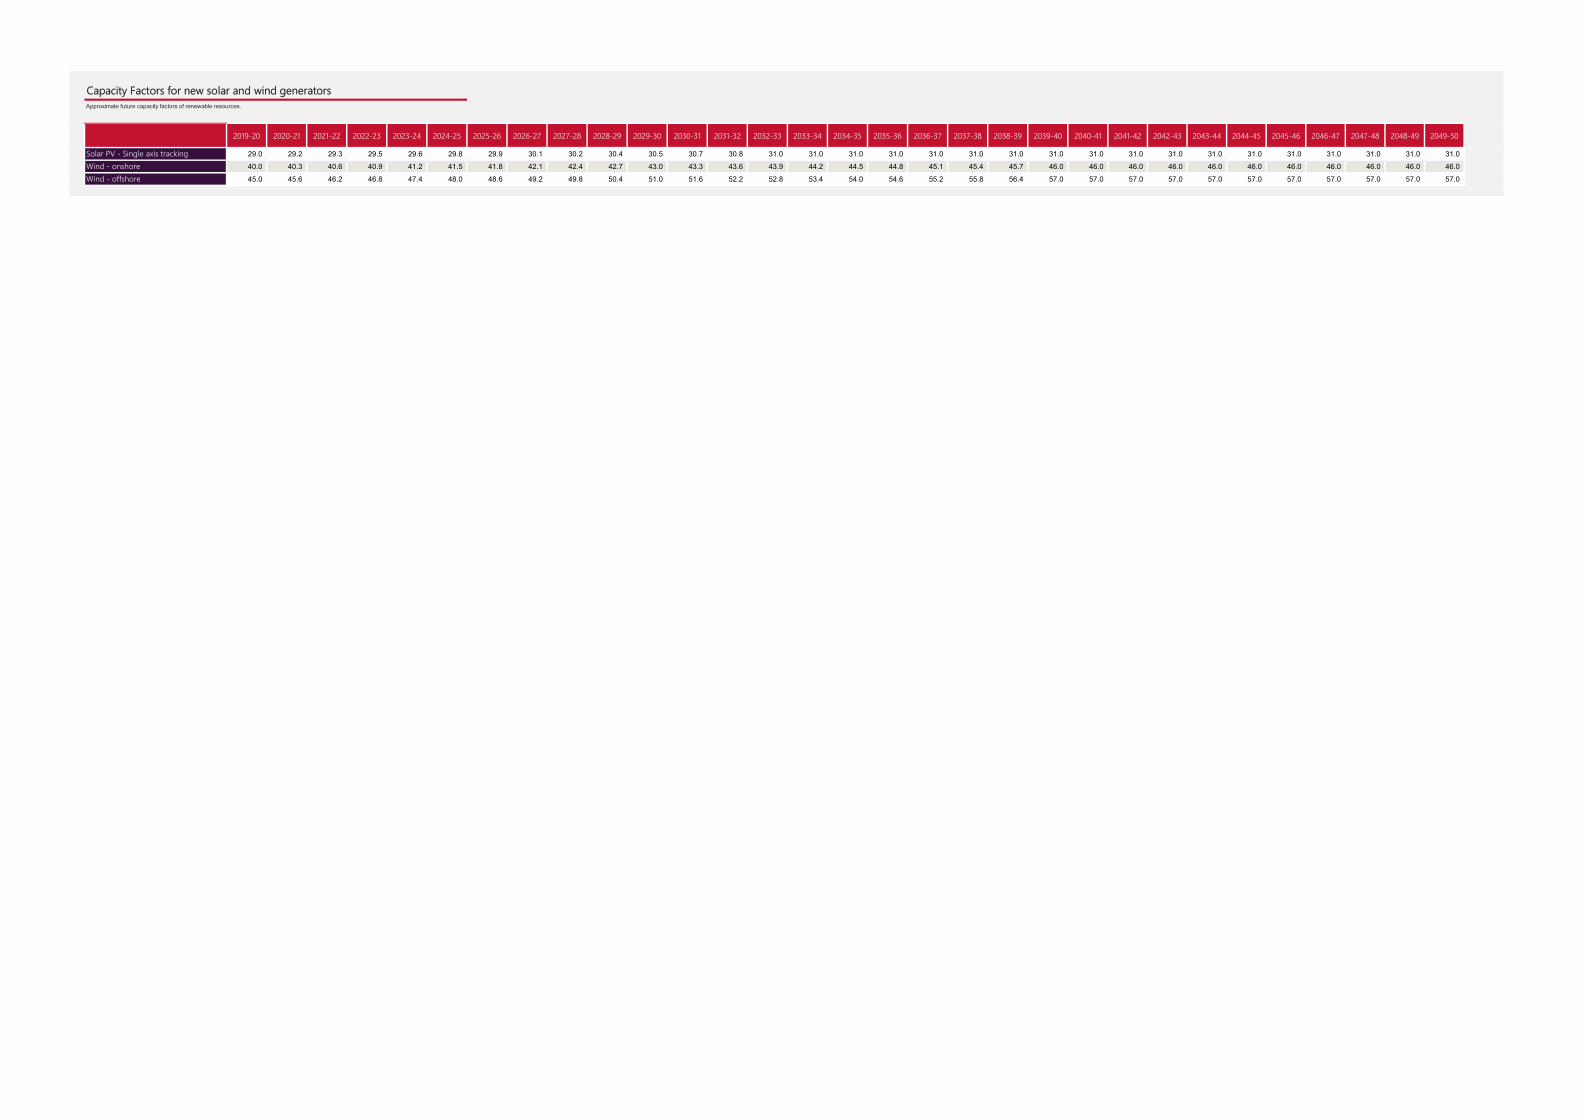
Capacity Factors for new solar and wind generatorsApproximate future capacity factors of renewable resources.
2019-20 2020-21 2021-22 2022-23 2023-24 2024-25 2025-26 2026-27 2027-28 2028-29 2029-30 2030-31 2031-32 2032-33 2033-34 2034-35 2035-36 2036-37 2037-38 2038-39 2039-40 2040-41 2041-42 2042-43 2043-44 2044-45 2045-46 2046-47 2047-48 2048-49 2049-50
Solar PV - Single axis tracking 29.0 29.2 29.3 29.5 29.6 29.8 29.9 30.1 30.2 30.4 30.5 30.7 30.8 31.0 31.0 31.0 31.0 31.0 31.0 31.0 31.0 31.0 31.0 31.0 31.0 31.0 31.0 31.0 31.0 31.0 31.0
Wind - onshore 40.0 40.3 40.6 40.9 41.2 41.5 41.8 42.1 42.4 42.7 43.0 43.3 43.6 43.9 44.2 44.5 44.8 45.1 45.4 45.7 46.0 46.0 46.0 46.0 46.0 46.0 46.0 46.0 46.0 46.0 46.0
Wind - offshore 45.0 45.6 46.2 46.8 47.4 48.0 48.6 49.2 49.8 50.4 51.0 51.6 52.2 52.8 53.4 54.0 54.6 55.2 55.8 56.4 57.0 57.0 57.0 57.0 57.0 57.0 57.0 57.0 57.0 57.0 57.0
Aurecon offices are located in:
Angola, Australia, Botswana, China,
Ghana, Hong Kong, Indonesia, Kenya,
Lesotho, Mozambique,
Namibia, New Zealand, Nigeria,
Philippines, Qatar, Rwanda, Singapore, South Africa,
Swaziland, Tanzania, Thailand, Uganda,
United Arab Emirates, Vietnam, Zambia,
Document prepared by
Aurecon Australasia Pty Ltd
ABN 54 005 139 873
Ground Floor, 25 King Street Bowen Hills QLD 4006
Locked Bag 331 Brisbane QLD 4001 Australia
T
F
E
W
+61 7 3173 8000
+61 7 3173 8001
aurecongroup.com