Embed Size (px)
Citation preview
Environmental Monitoring Report 2 0 1 9 D A T A – P U B L I S H E D D E C E M B E R 3 1 , 2 0 2 0
This document is made available electronically by the Minnesota Legislative Reference Library as part of an ongoing digital archiving project. https://www.lrl.mn.gov

i
Environmental Monitoring Report
Minnesota Department of Health Radioactive Materials Unit PO Box 64975 St. Paul, MN 55164-0975 651-201-4400 [email protected] www.health.state.mn.us
To obtain this information in a different format, call: 651-201-4400.
E N V I R O N M E N T A L M O N I T O R I N G R E P O R T 2 0 1 9
ii
Contents Program Summary ...................................................................................................................... 1
Air Monitoring ............................................................................................................................. 2
Data Analysis ........................................................................................................................... 2
Surface Water Monitoring .......................................................................................................... 3
Data Analysis ........................................................................................................................... 3
Milk Monitoring .......................................................................................................................... 3
Data Analysis ........................................................................................................................... 4
Ambient Gamma Radiation Monitoring ..................................................................................... 4
Data Analysis ........................................................................................................................... 4
Well Water and Community Water Monitoring ......................................................................... 4
Data Analysis ........................................................................................................................... 5
Precipitation Monitoring............................................................................................................. 5
Data Analysis ........................................................................................................................... 5
Program Modifications ............................................................................................................... 6
Sampling Sites/OSLD Locations ................................................................................................... 6
Image 1: Monticello Environmental Sampling Sites ............................................................... 6
Image 2: Prairie Island Environmental Sampling Sites ........................................................... 7
Image 3: Monticello Area OSLD Locations .............................................................................. 8
Image 4: Prairie Island Area OSLD Locations .......................................................................... 9
Tables ........................................................................................................................................ 10
Table 1: Sample Summary for 2019 ...................................................................................... 10
Table 2: 2019 Air Sampling Results for Monticello Nuclear Generating Plant ..................... 10
Table 3: 2019 Air Sampling Result for Prairie Island Nuclear Generating Plant ................... 12
Table 4: 2019 Air Sampling Results for St. Paul .................................................................... 13
Table 5: 2019 Surface Water Results for Monticello Nuclear Generating Plant .................. 15
Table 6: 2019 Surface Water Results for Prairie Island Nuclear Generating Plant .............. 16
Table 7: 2019 Milk Analysis Results for Monticello Nuclear Generating Plant .................... 16
Table 8: 2019 Milk Analysis Results for Prairie Island Nuclear Generating Plant ................. 17
Table 9: 2019 Minnesota Department of Health OSLD Results (Monticello) ....................... 17
Table 10: 2019 Minnesota Department of Health OSLD Results (Prairie Island) ................. 18
Table 11: 2019 Well Water Analysis Results - City of Redwing ............................................ 19
E N V I R O N M E N T A L M O N I T O R I N G R E P O R T 2 0 1 9
ii
Table 12: 2019 Community Water Analysis Results - City of Redwing ................................. 19
Table 13: 2019 Precipitation Water Results for St. Paul ....................................................... 19
1
The Minnesota Department of Health (MDH) maintains an environmental monitoring program for radioactivity around the two nuclear power generating plants in the state. The program is designed to provide an independent evaluation of the impact of the nuclear power generating plants to the environment and the public over a period of time. Data collected is used to verify compliance with appropriate standards, provide the public with reliable data regarding the environmental impact of the nuclear power generating plants, and establish trends. Annual reports are generated and available for public review. Sample data not included in the annual reports is available through the MDH Public Health Lab.
Monitoring for radioactivity began in Minnesota in response to nuclear weapons testing. A baseline for certain radionuclides has been established and current environmental monitoring continues to validate the natural background levels in Minnesota. Throughout the years, the Minnesota Department of Health environmental monitoring program has transformed. Careful analysis of potential risks and data collected has lead MDH to make alterations in its sampling program from time to time. Some collection points and sample mediums have been discontinued while others added.
The major components of the Minnesota Department of Health environmental monitoring program are sample collection, data analysis, and interpretation. Around the Monticello Nuclear generating plant and the Prairie Island Nuclear generating plant samples that are collected include: air, surface water, and milk. Ambient gamma radiation doses are monitored through the use of optically-stimulated luminescence dosimeters. Well water samples are collected near the Prairie Island plant only.
Besides those samplings, from 1995 to June of 2015 MDH received data from two pressurized ion chambers (PIC) located at the Prairie Island Nuclear generating plant near the Independent Spent Fuel Storage Installation (ISFSI). Data from the PICs was transmitted to a computer. Every fifteen minutes a modem would relay the data, via phone line, to an MDH computer. The system also conveyed alarm messages to MDH staff members if the radiation levels were significantly high or communication between the PIC and the computer was disrupted.
In the fall of 2008 Monticello began storing spent fuel in its own ISFSI on site. This ISFSI is monitored using an automatic switching, two Geiger-Mueller-tube based dose rate monitor called the Data Radiation Monitor (DRM). The DRM continuously measures gamma radiation dose rates. Readings are taken approximately every four seconds and transmitted via radio waves to a base computer. MDH connects to the base computer and receives dose rate readings. Alarm messages are sent if communication is disrupted or radiation levels are exceeded.
In June of 2015, the two ion chambers located at the Prairie Island Generating Plant ISFSI were replaced with two DRMs. The system is modeled after the Monticello ISFSI monitors.
Program Summary In 2019, no sample results within the current environmental monitoring program areas were found to exceed any federal or state standards or guidelines.

E N V I R O N M E N T A L M O N I T O R I N G R E P O R T 2 0 1 9
2
Air Monitoring Continuous air monitoring allows the Minnesota Department of Health to determine the level of radioactive contamination that could expose the public through inhalation. Air sampler particulate filters and cartridges are collected weekly or every other week and analyzed for radioactive particulates in the air.
In 2019, air samples were collected from three locations in Minnesota; one at each of the nuclear power generating plants and one in downtown St. Paul. The air samplers at the nuclear power generating plants are located downwind of the plant based on predominant wind directions.
The location of the Prairie Island air sampler is near Lock and Dam No. 3, downstream from the Prairie Island Nuclear Generating Plant. The air sampler at Monticello is located near the Monticello Xcel Training Center, downstream from the Monticello Nuclear Power Generating Plant.
The St. Paul air sampler is located on the roof of the Freeman Building at 625 Robert Street North in St. Paul and is used as a standard for comparison.
Air sampler locations are shown in Image 1 Monticello Sampling Sites and Image 2 Prairie Island Sampling Sites.
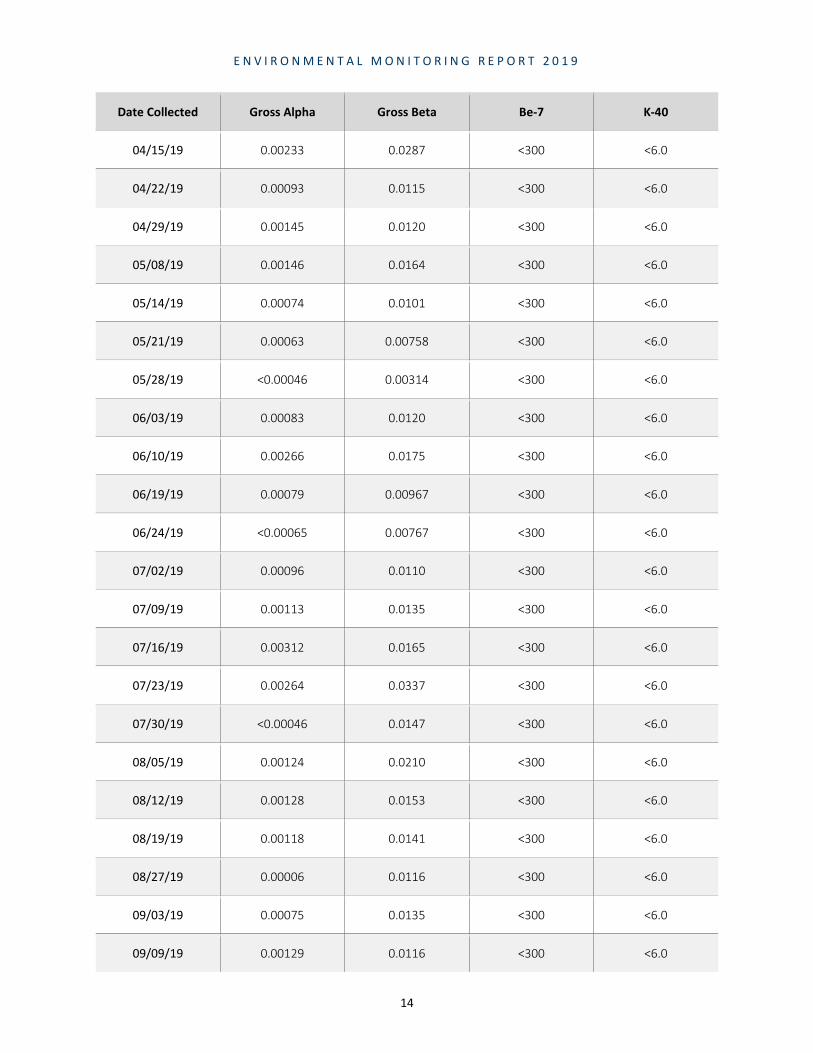
Air sample results for gross alpha, gross beta, and naturally occurring Beryllium-7 and Potassium-40 are shown in Table 2 Air Sampling Results for Monticello Nuclear Generating Plant, Table 3 Air Sampling Results for Prairie Island Nuclear Generating Plant, and Table 4 Air Sampling Results for St. Paul.
Data Analysis Data collected from the Prairie Island and Monticello air samplers are compared to data from the St. Paul sampler, historical data, U.S. Environmental Protection Agency (EPA) standards, and MDH Radioactive Material Rules, Chapter 4731.2750. Specific isotopes of interest are examined using the limits indicated in MDH Chapter 4731 designating concentrations such that a dose limit of 50 mrems per year is not exceeded for each isotope.
The majority of data for these radioisotopes are below MDH Public Health Lab’s (PHL) detection levels. In instances where the detection levels exceeded the Chapter 4731 concentrations or established standards, review of the gross alpha and gross beta values were considered. It is understood that the gross alpha or gross beta values represent the maximum value any individual alpha or beta emitter could indicate. Gross alpha levels were below 0.00658 pCi/m3 at all locations. Gross beta levels were below 0.0907pCi/m3 at all locations.
Whenever applicable, naturally occurring Potassium-40 and Beryllium-7 are tracked as a means of quality control for accuracy of lab data. It is expected that these levels will remain somewhat constant throughout time.
All air sample results for 2019 were within the EPA and MDH standards and guidelines.
E N V I R O N M E N T A L M O N I T O R I N G R E P O R T 2 0 1 9
3
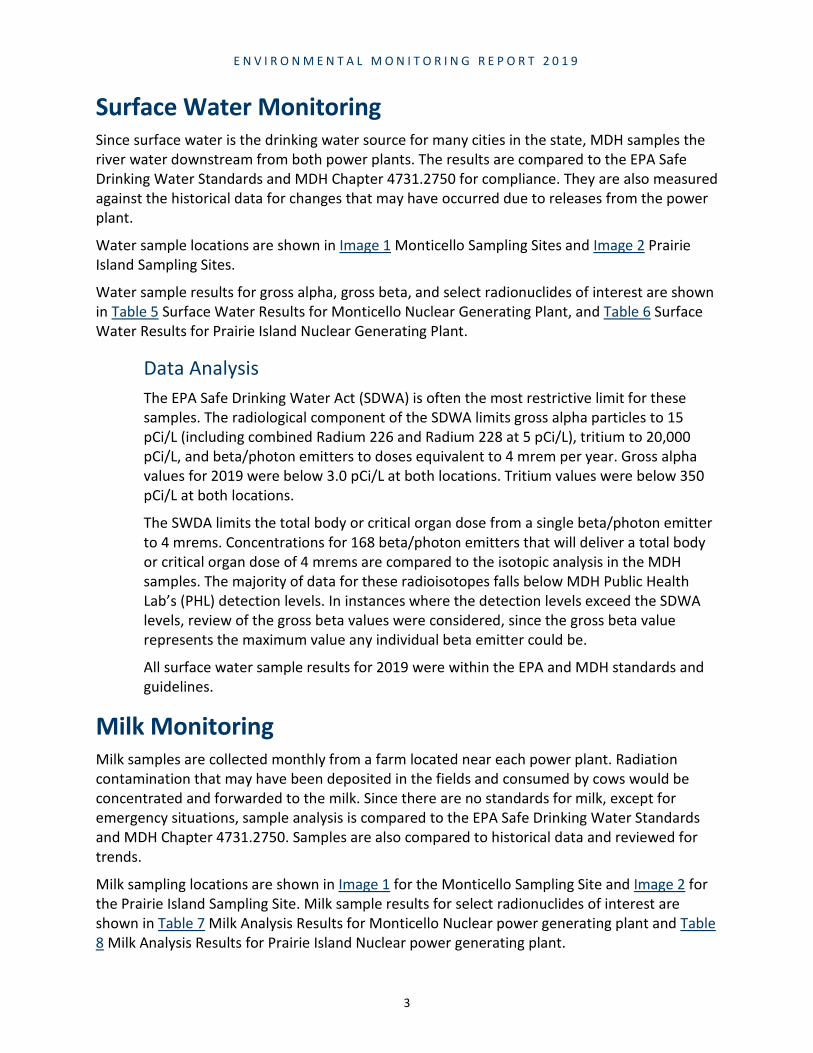
Surface Water Monitoring Since surface water is the drinking water source for many cities in the state, MDH samples the river water downstream from both power plants. The results are compared to the EPA Safe Drinking Water Standards and MDH Chapter 4731.2750 for compliance. They are also measured against the historical data for changes that may have occurred due to releases from the power plant.
Water sample locations are shown in Image 1 Monticello Sampling Sites and Image 2 Prairie Island Sampling Sites.
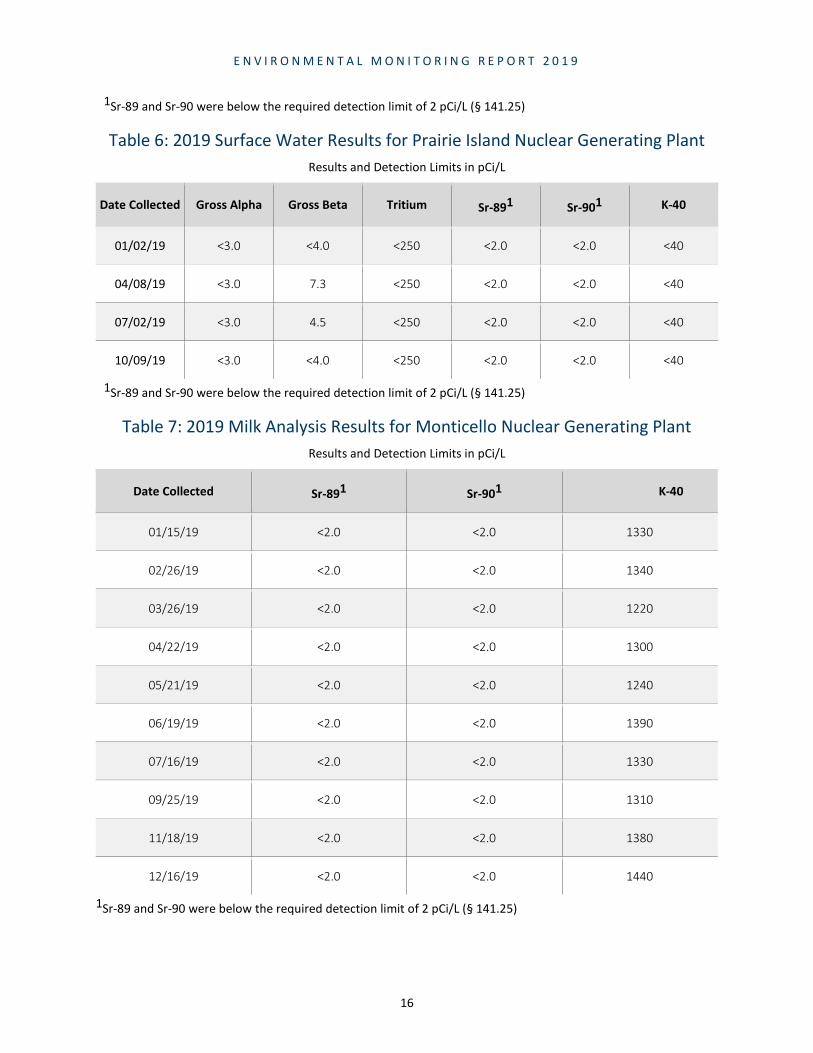
Water sample results for gross alpha, gross beta, and select radionuclides of interest are shown in Table 5 Surface Water Results for Monticello Nuclear Generating Plant, and Table 6 Surface Water Results for Prairie Island Nuclear Generating Plant.
Data Analysis The EPA Safe Drinking Water Act (SDWA) is often the most restrictive limit for these samples. The radiological component of the SDWA limits gross alpha particles to 15 pCi/L (including combined Radium 226 and Radium 228 at 5 pCi/L), tritium to 20,000 pCi/L, and beta/photon emitters to doses equivalent to 4 mrem per year. Gross alpha values for 2019 were below 3.0 pCi/L at both locations. Tritium values were below 350 pCi/L at both locations.
The SWDA limits the total body or critical organ dose from a single beta/photon emitter to 4 mrems. Concentrations for 168 beta/photon emitters that will deliver a total body or critical organ dose of 4 mrems are compared to the isotopic analysis in the MDH samples. The majority of data for these radioisotopes falls below MDH Public Health Lab’s (PHL) detection levels. In instances where the detection levels exceed the SDWA levels, review of the gross beta values were considered, since the gross beta value represents the maximum value any individual beta emitter could be.
All surface water sample results for 2019 were within the EPA and MDH standards and guidelines.
Milk Monitoring Milk samples are collected monthly from a farm located near each power plant. Radiation contamination that may have been deposited in the fields and consumed by cows would be concentrated and forwarded to the milk. Since there are no standards for milk, except for emergency situations, sample analysis is compared to the EPA Safe Drinking Water Standards and MDH Chapter 4731.2750. Samples are also compared to historical data and reviewed for trends.
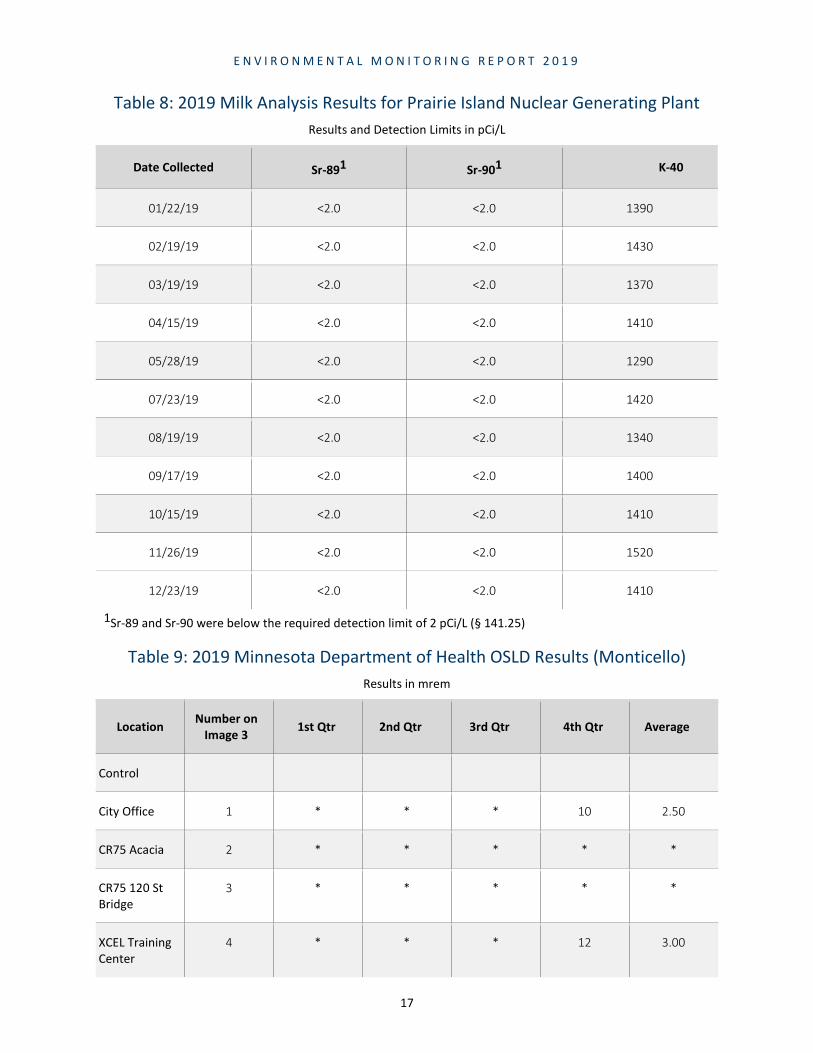
Milk sampling locations are shown in Image 1 for the Monticello Sampling Site and Image 2 for the Prairie Island Sampling Site. Milk sample results for select radionuclides of interest are shown in Table 7 Milk Analysis Results for Monticello Nuclear power generating plant and Table 8 Milk Analysis Results for Prairie Island Nuclear power generating plant.

E N V I R O N M E N T A L M O N I T O R I N G R E P O R T 2 0 1 9
4
Data Analysis MDH recognizes that the EPA Safe Drinking Water Act (SDWA) is often a more restrictive limit for these samples because there are no specific standards for milk samples. However, by meeting these standards MDH continues to ensure that public health and safety is maintained. Due to the physical properties of milk, analyzing for gross alpha and gross beta values is difficult and highly unreliable; therefore these results are not available.
The SWDA limits the total body or critical organ dose from a single beta/photon emitter to 4 mrems. Concentrations for 168 beta/photon emitters that will deliver a total body or critical organ dose of 4 mrems are compared to the isotopic analysis in the MDH samples. Again, the majority of data for these radioisotopes are below MDH Public Health Lab’s (PHL) detection levels. In instances where the detection levels exceed the SDWA levels, review of past air sample results were considered. It should be noted that if a release were to occur, before it would be observed in milk samples it would most likely be detected in air samples.
All milk sample results for 2019 were within the EPA and MDH standards and guidelines.
Ambient Gamma Radiation Monitoring Ambient gamma radiation levels are measured around the power plants by using optically-stimulated luminescence dosimeters (OSLDs). MDH has placed OSLDs beyond the plant’s boundaries to estimate the dose received by a member of the public if they were to be at that location continuously throughout the monitoring period. OSLDs are changed and analyzed quarterly. In 2006, MDH transferred the analysis of the dosimeters from an internal evaluation to Mirion Technologies (formerly Global Dosimetry), a processor approved by the National Voluntary Laboratory Accreditation Program. These results are compared to control readings, historical data, and MDH regulatory limits.
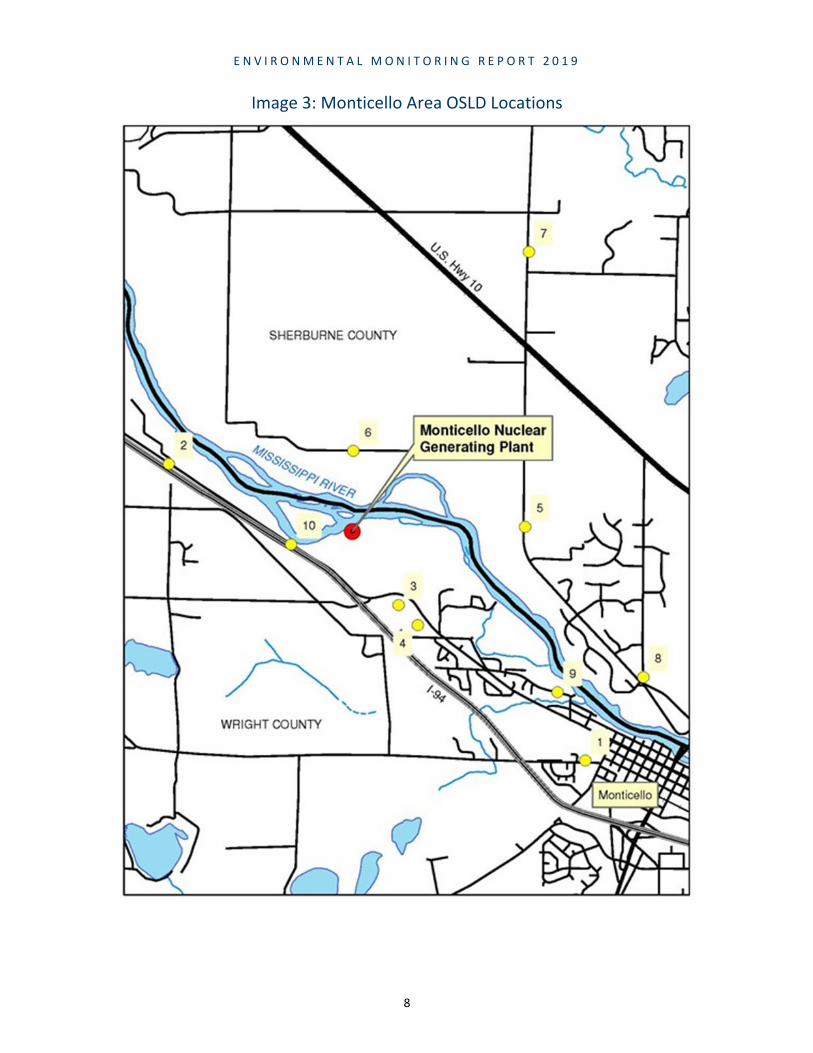
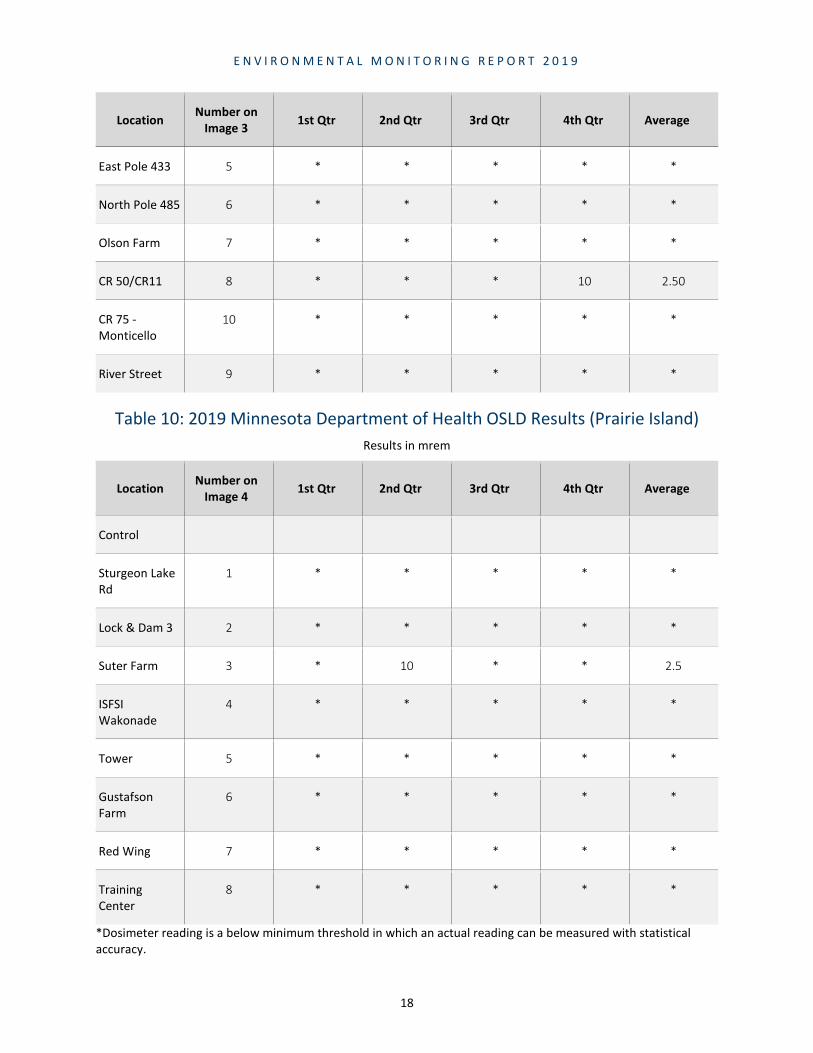
OSLD locations are shown in Image 3 Monticello Area OSLD Locations and Image 4 Prairie Island Area OSLD Locations.
OSLD results are shown in Table 9 and Table 10 OSLD Results.
Data Analysis Mirion Technologies results from the field OSLDs are compared to the control readings. Control badges are kept in St. Paul for the monitoring period so that control readings indicate background radiation levels.
All OSLD results for 2019 were within MDH regulatory limits to members of the public.
Well Water and Community Water Monitoring Well water is periodically reviewed since radioactivity may seep through the soil and enter the water table. The collection point was selected to be a private farm located close to the Prairie

E N V I R O N M E N T A L M O N I T O R I N G R E P O R T 2 0 1 9
5
Island nuclear power plant. Community Water samples are collected at Prairie Island as part of the EPA RADNET system. MDH also collects a sample to represent the community water supply at Prairie Island. These samples are collected quarterly and again compared to the EPA Safe Drinking Water Standards, MDH Chapter 4731.2750, and historical data.
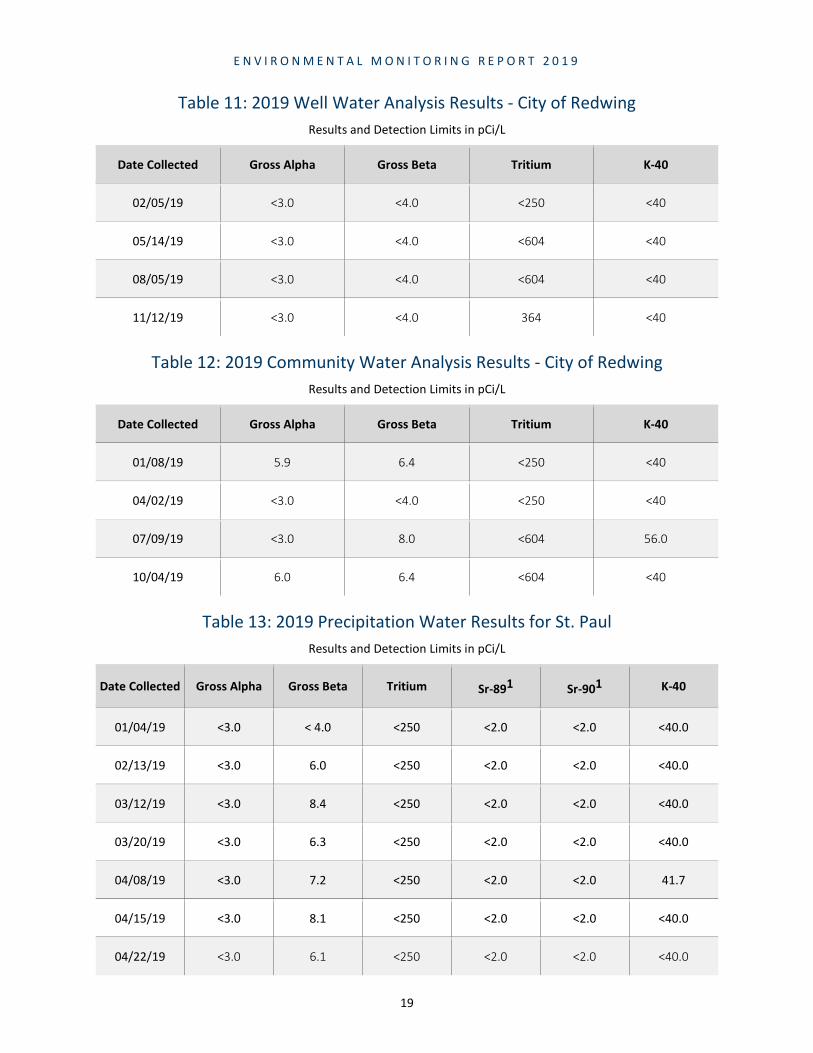
Well water sample location is shown in Image 2 Prairie Island Sampling Sites. Community water samples are collected from the Dakota Station at Prairie Island. Well water sample results for gross alpha, gross beta, and select radionuclides of interest are shown in Table 11 Well Water Analysis Results. Community Water sample results are shown in Table 12 Community Water Analysis Results.
Data Analysis Well water and community water data is analyzed similar to surface water. The EPA Safe Drinking Water Act (SDWA) is often the most restrictive limit for these samples. The radiological component of the SDWA limits gross alpha particles to 15 pCi/L (including combined Radium 226 and Radium 228 at 5 pCi/L), tritium to 20,000 pCi/L, and beta/photon emitters to doses equivalent to 4 mrem per year. Gross alpha values for 2019 at or below 6.0 pCi/L and Tritium values were below 604 pCi/L.
The SWDA limits the total body or critical organ dose from a single beta/photon emitter to 4 mrems. Concentrations for 168 beta/photon emitters that will deliver a total body or critical organ dose of 4 mrems are compared to the isotopic analysis in the MDH samples. In instances where the detection levels exceed the SDWA levels, review of the gross beta values were considered, since the gross beta value represents the maximum value any individual beta emitter could be.
All well water and community water sample results for 2019 were within the EPA and MDH standards and guidelines.
Precipitation Monitoring As part of the EPA RADNET program, MDH also collects precipitation samples at the air sampling location in St. Paul. These samples are collected when enough precipitation is in the collection bucket to fill an analysis container. Samples are split, one going to EPA RADNET and one to MDH PHL. Data collected is compared to the EPA Safe Drinking Water Standards, MDH Chapter 4731.2750 and historical data.
Precipitation sample results for gross alpha, gross beta, and select radionuclides of interest are shown in Table 13 Precipitation Water Results for St. Paul.
Data Analysis Precipitation data is analyzed similar to surface water. The EPA Safe Drinking Water Act (SDWA) is often the most restrictive limit for these samples. The radiological component of the SDWA limits gross alpha particles to 15 pCi/L (including combined Radium 226 and Radium 228 at 5 pCi/L), tritium to 20,000 pCi/L, and beta/photon emitters to doses equivalent to 4 mrem per year. Gross alpha values for 2019 were below 3.1 pCi/L. and Tritium values were below 250 pCi/L.

E N V I R O N M E N T A L M O N I T O R I N G R E P O R T 2 0 1 9
6
The SWDA limits the total body or critical organ dose from a single beta/photon emitter to 4 mrems. Concentrations for 168 beta/photon emitters that will deliver a total body or critical organ dose of 4 mrems are compared to the isotopic analysis in the MDH samples. In instances where the detection levels exceed the SDWA levels, review of the gross beta values were considered, since the gross beta value represents the maximum value any individual beta emitter could be.
All precipitation sample results for 2019 were within the EPA and MDH standards and guidelines.
Program Modifications There were no significant program modifications in 2019.
Sampling Sites/OSLD Locations Image 1: Monticello Environmental Sampling Sites

E N V I R O N M E N T A L M O N I T O R I N G R E P O R T 2 0 1 9
7
Image 2: Prairie Island Environmental Sampling Sites
E N V I R O N M E N T A L M O N I T O R I N G R E P O R T 2 0 1 9
8
Image 3: Monticello Area OSLD Locations

E N V I R O N M E N T A L M O N I T O R I N G R E P O R T 2 0 1 9
9
Image 4: Prairie Island Area OSLD Locations

E N V I R O N M E N T A L M O N I T O R I N G R E P O R T 2 0 1 9
10
Tables Table 1: Sample Summary for 2019
Sample Type Collection and Frequency Number of Samples Collected Analyses Performed
Air C, W & BW 104 GA, GB, GI, Sr, I
Surface Water G, Q 8 GA, GB, GI, Sr, H
Well Water G, Q 4 GA, GB, GI, Sr, H
Community Water G, Q 4 GA, GB, GI, Sr, H
Milk G, M 19 GI, Sr, I
OSLD C, Q 72 Direct exposure
Precipitation C 19 GA, GB, GI, Sr, H
Collection type: C = continuous; G = grab Frequency: W = weekly; M = monthly; Q = quarterly; A = annually; BW = bi-weekly Analyses performed: GA = gross alpha; GB = gross beta; GI = gamma isotopic; Sr = strontium; I = iodine; H = tritium
Table 2: 2019 Air Sampling Results for Monticello Nuclear Generating Plant Results and Detection Limits in pCi/m3
Date Collected Gross Alpha Gross Beta Be-7 K-40
01/02/19 0.00111 0.0202 <300 <6.0
01/15/19 0.00132 0.0241 <300 <6.0
01/29/19 0.00197 0.0228 <300 <6.0
02/13/19 0.00155 0.0205 <300 <6.0
02/27/19 0.00179 0.0229 <300 <6.0
02/26/19 0.00658 0.0579 <300 <6.0
03/12/19 0.00283 0.0246 <300 <6.0
03/26/19 0.00108 0.0147 <300 <6.0

E N V I R O N M E N T A L M O N I T O R I N G R E P O R T 2 0 1 9
11
Date Collected Gross Alpha Gross Beta Be-7 K-40
04/08/19 0.00111 0.0136 <300 <6.0
04/22/19 0.00071 0.0907 <300 <6.0
05/08/19 0.00086 0.0150 <300 <6.0
05/21/19 0.00098 0.00914 <300 <6.0
06/03/19 0.00056 0.00775 <300 <6.0
06/19/19 0.00076 0.0120 <300 <6.0
07/02/19 0.00095 0.0102 <300 <6.0
07/16/19 0.00256 0.0150 <300 <6.0
07/30/19 0.00125 0.0212 <300 <6.0
08/12/19 0.00111 0.0183 <300 <6.0
08/27/19 0.00072 0.0128 <300 <6.0
09/09/19 0.00114 0.0124 <300 <6.0
09/25/19 0.00096 0.0183 <300 <6.0
10/09/19 0.00056 0.00764 <300 <6.0
10/22/19 0.00068 0.0110 <300 <6.0
11/04/19 0.00105 0.0115 <300 <6.0
11/18/19 0.00297 0.0227 <300 <6.0
02/27/19 0.00179 0.0229 <300 <6.0
02/26/19 0.00658 0.0579 <300 <6.0
12/02/19 0.00271 0.0264 <300 <6.0
12/16/19 <0.00046 <0.00071 <300 <6.0
12/30/19 0.00541 0.0361 <300 <6.0

E N V I R O N M E N T A L M O N I T O R I N G R E P O R T 2 0 1 9
12
Table 3: 2019 Air Sampling Result for Prairie Island Nuclear Generating Plant Results and Detection Limits in pCi/m3
Date Collected Gross Alpha Gross Beta Be-7 K-40
01/22/19 0.00107 0.0224 <300 <6.0
02/05/19 0.00162 0.0247 <300 <6.0
02/19/19 0.00100 0.0192 <300 <6.0
03/05/19 0.00230 0.0291 <300 <6.0
03/19/19 0.00171 0.0225 <300 <6.0
04/02/19 0.00087 0.0156 <300 <6.0
04/15/19 <0.00021 0.00287 <300 <6.0
04/29/19 0.00096 0.0126 <300 <6.0
05/14/19 0.00079 0.0107 <300 <6.0
05/28/19 0.00057 0.00715 <300 <6.0
06/10/19 0.00148 0.0160 <300 <6.0
06/24/19 0.00080 0.0114 <300 <6.0
07/09/19 0.00091 0.0132 <300 <6.0
07/23/19 0.00030 0.0051 <300 <6.0
08/05/19 0.00073 0.0118 <300 <6.0
08/19/19 0.00136 0.0173 <300 <6.0
09/03/19 0.00071 0.0135 <300 <6.0
09/17/19 0.00097 0.0136 <300 <6.0
10/04/19 0.00117 0.0148 <300 <6.0
10/15/19 0.00033 0.0115 <300 <6.0
10/29/19 0.00066 0.0134 <300 <6.0

E N V I R O N M E N T A L M O N I T O R I N G R E P O R T 2 0 1 9
13
Date Collected Gross Alpha Gross Beta Be-7 K-40
11/12/19 0.00096 0.0179 <300 <6.0
11/26/19 <0.00038 0.0169 <300 <6.0
12/11/19 0.00198 0.0161 <300 <6.0
12/23/19 0.00563 0.0337 <300 <6.0
Table 4: 2019 Air Sampling Results for St. Paul Results and Detection Limits in pCi/m3
Date Collected Gross Alpha Gross Beta Be-7 K-40
01/02/19 0.00099 0.0210 <300 <6.0
01/08/19 0.00078 0.0233 <300 <6.0
01/15/19 0.00130 0.0227 <300 <6.0
01/22/19 0.00091 0.0185 <300 <6.0
01/29/19 0.00207 0.0260 <300 <6.0
02/05/19 0.00130 0.0211 <300 <6.0
02/12/19 0.00099 0.0160 <300 <6.0
02/19/19 0.00092 0.0210 <300 <6.0
02/26/19 0.00116 0.0138 <300 <6.0
03/05/19 0.00192 0.0209 <300 <6.0
03/12/19 0.00223 0.0282 <300 <6.0
03/19/19 0.00140 0.0175 <300 <6.0
03/26/19 0.00120 0.0146 <300 <6.0
04/02/19 0.00086 0.0138 <300 <6.0
04/08/19 0.00100 0.0142 <300 <6.0
E N V I R O N M E N T A L M O N I T O R I N G R E P O R T 2 0 1 9
14
Date Collected Gross Alpha Gross Beta Be-7 K-40
04/15/19 0.00233 0.0287 <300 <6.0
04/22/19 0.00093 0.0115 <300 <6.0
04/29/19 0.00145 0.0120 <300 <6.0
05/08/19 0.00146 0.0164 <300 <6.0
05/14/19 0.00074 0.0101 <300 <6.0
05/21/19 0.00063 0.00758 <300 <6.0
05/28/19 <0.00046 0.00314 <300 <6.0
06/03/19 0.00083 0.0120 <300 <6.0
06/10/19 0.00266 0.0175 <300 <6.0
06/19/19 0.00079 0.00967 <300 <6.0
06/24/19 <0.00065 0.00767 <300 <6.0
07/02/19 0.00096 0.0110 <300 <6.0
07/09/19 0.00113 0.0135 <300 <6.0
07/16/19 0.00312 0.0165 <300 <6.0
07/23/19 0.00264 0.0337 <300 <6.0
07/30/19 <0.00046 0.0147 <300 <6.0
08/05/19 0.00124 0.0210 <300 <6.0
08/12/19 0.00128 0.0153 <300 <6.0
08/19/19 0.00118 0.0141 <300 <6.0
08/27/19 0.00006 0.0116 <300 <6.0
09/03/19 0.00075 0.0135 <300 <6.0
09/09/19 0.00129 0.0116 <300 <6.0

E N V I R O N M E N T A L M O N I T O R I N G R E P O R T 2 0 1 9
15
Date Collected Gross Alpha Gross Beta Be-7 K-40
09/17/19 0.00093 0.0139 <300 <6.0
09/25/19 0.00096 0.0230 <300 <6.0
10/01/19 <0.00055 0.00863 <300 <6.0
10/09/19 < 0.00038 0.00578 <300 <6.0
10/15/19 < 0.00055 0.00911 <300 <6.0
10/22/19 0.00106 0.0136 <300 <6.0
10/29/19 0.00064 0.0105 <300 <6.0
11/04/19 0.00108 0.0131 <300 <6.0
11/12/19 0.00101 0.0158 <300 <6.0
11/18/19 0.00334 0.0271 <300 <6.0
11/25/19 0.00121 0.0161 <300 <6.0
12/02/19 0.00136 0.0180 <300 <6.0
12/11/19 0.00338 0.0246 <300 <6.0
12/16/19 0.00297 0.0260 <300 <6.0
12/23/19 0.01020 0.0496 <300 <6.0
Table 5: 2019 Surface Water Results for Monticello Nuclear Generating Plant Results and Detection Limits in pCi/L
Date Collected Gross Alpha Gross Beta Tritium Sr-891 Sr-901 K-40
01/02/19 <3.0 <4.0 <250 <2.0 <2.0 <40
04/08/19 <3.0 7.3 <250 <2.0 <2.0 <40
07/02/19 <3.0 4.5 <250 <2.0 <2.0 <40
10/09/19 <3.0 <4.0 <250 <2.0 <2.0 <40
E N V I R O N M E N T A L M O N I T O R I N G R E P O R T 2 0 1 9
16
1Sr-89 and Sr-90 were below the required detection limit of 2 pCi/L (§ 141.25)
Table 6: 2019 Surface Water Results for Prairie Island Nuclear Generating Plant Results and Detection Limits in pCi/L
Date Collected Gross Alpha Gross Beta Tritium Sr-891 Sr-901 K-40
01/02/19 <3.0 <4.0 <250 <2.0 <2.0 <40
04/08/19 <3.0 7.3 <250 <2.0 <2.0 <40
07/02/19 <3.0 4.5 <250 <2.0 <2.0 <40
10/09/19 <3.0 <4.0 <250 <2.0 <2.0 <40
1Sr-89 and Sr-90 were below the required detection limit of 2 pCi/L (§ 141.25)
Table 7: 2019 Milk Analysis Results for Monticello Nuclear Generating Plant Results and Detection Limits in pCi/L
Date Collected Sr-891 Sr-901 K-40
01/15/19 <2.0 <2.0 1330
02/26/19 <2.0 <2.0 1340
03/26/19 <2.0 <2.0 1220
04/22/19 <2.0 <2.0 1300
05/21/19 <2.0 <2.0 1240
06/19/19 <2.0 <2.0 1390
07/16/19 <2.0 <2.0 1330
09/25/19 <2.0 <2.0 1310
11/18/19 <2.0 <2.0 1380
12/16/19 <2.0 <2.0 1440
1Sr-89 and Sr-90 were below the required detection limit of 2 pCi/L (§ 141.25)
E N V I R O N M E N T A L M O N I T O R I N G R E P O R T 2 0 1 9
17
Table 8: 2019 Milk Analysis Results for Prairie Island Nuclear Generating Plant Results and Detection Limits in pCi/L
Date Collected Sr-891 Sr-901 K-40
01/22/19 <2.0 <2.0 1390
02/19/19 <2.0 <2.0 1430
03/19/19 <2.0 <2.0 1370
04/15/19 <2.0 <2.0 1410
05/28/19 <2.0 <2.0 1290
07/23/19 <2.0 <2.0 1420
08/19/19 <2.0 <2.0 1340
09/17/19 <2.0 <2.0 1400
10/15/19 <2.0 <2.0 1410
11/26/19 <2.0 <2.0 1520
12/23/19 <2.0 <2.0 1410
1Sr-89 and Sr-90 were below the required detection limit of 2 pCi/L (§ 141.25)
Table 9: 2019 Minnesota Department of Health OSLD Results (Monticello) Results in mrem
Location Number on Image 3 1st Qtr 2nd Qtr 3rd Qtr 4th Qtr Average
Control
City Office 1 * * * 10 2.50
CR75 Acacia 2 * * * * *
CR75 120 St Bridge
3 * * * * *
XCEL Training Center
4 * * * 12 3.00
E N V I R O N M E N T A L M O N I T O R I N G R E P O R T 2 0 1 9
18
Location Number on Image 3 1st Qtr 2nd Qtr 3rd Qtr 4th Qtr Average
East Pole 433 5 * * * * *
North Pole 485 6 * * * * *
Olson Farm 7 * * * * *
CR 50/CR11 8 * * * 10 2.50
CR 75 - Monticello
10 * * * * *
River Street 9 * * * * *
Table 10: 2019 Minnesota Department of Health OSLD Results (Prairie Island) Results in mrem
Location Number on Image 4 1st Qtr 2nd Qtr 3rd Qtr 4th Qtr Average
Control
Sturgeon Lake Rd
1 * * * * *
Lock & Dam 3 2 * * * * *
Suter Farm 3 * 10 * * 2.5
ISFSI Wakonade
4 * * * * *
Tower 5 * * * * *
Gustafson Farm
6 * * * * *
Red Wing 7 * * * * *
Training Center
8 * * * * *
*Dosimeter reading is a below minimum threshold in which an actual reading can be measured with statistical accuracy.
E N V I R O N M E N T A L M O N I T O R I N G R E P O R T 2 0 1 9
19
Table 11: 2019 Well Water Analysis Results - City of Redwing Results and Detection Limits in pCi/L
Date Collected Gross Alpha Gross Beta Tritium K-40
02/05/19 <3.0 <4.0 <250 <40
05/14/19 <3.0 <4.0 <604 <40
08/05/19 <3.0 <4.0 <604 <40
11/12/19 <3.0 <4.0 364 <40
Table 12: 2019 Community Water Analysis Results - City of Redwing Results and Detection Limits in pCi/L
Date Collected Gross Alpha Gross Beta Tritium K-40
01/08/19 5.9 6.4 <250 <40
04/02/19 <3.0 <4.0 <250 <40
07/09/19 <3.0 8.0 <604 56.0
10/04/19 6.0 6.4 <604 <40
Table 13: 2019 Precipitation Water Results for St. Paul Results and Detection Limits in pCi/L
Date Collected Gross Alpha Gross Beta Tritium Sr-891 Sr-901 K-40
01/04/19 <3.0 < 4.0 <250 <2.0 <2.0 <40.0
02/13/19 <3.0 6.0 <250 <2.0 <2.0 <40.0
03/12/19 <3.0 8.4 <250 <2.0 <2.0 <40.0
03/20/19 <3.0 6.3 <250 <2.0 <2.0 <40.0
04/08/19 <3.0 7.2 <250 <2.0 <2.0 41.7
04/15/19 <3.0 8.1 <250 <2.0 <2.0 <40.0
04/22/19 <3.0 6.1 <250 <2.0 <2.0 <40.0

E N V I R O N M E N T A L M O N I T O R I N G R E P O R T 2 0 1 9
20
Date Collected Gross Alpha Gross Beta Tritium Sr-891 Sr-901 K-40
05/09/19 <3.0 < 4.0 <250 <2.0 <2.0 <40.0
05/21/19 <3.0 6.0 <250 <2.0 <2.0 <40.0
05/23/19 <3.0 4.9 <250 <2.0 <2.0 <40.0
05/28/19 <3.0 < 4.0 <250 <2.0 <2.0 <40.0
06/24/19 <3.0 5.9 <350 <2.0 <2.0 <40.0
07/02/19 <3.0 5.3 <350 <2.0 <2.0 <40.0
07/16/19 <3.0 4.8 <350 <2.0 <2.0 <40.0
07/23/19 <3.0 6.5 <350 <2.0 <2.0 63.4
07/30/19 <3.0 < 4.0 <350 <2.0 <2.0 <40.0
08/12/19 <3.0 < 4.0 <350 <2.0 <2.0 <40.0
08/19/19 <3.0 < 4.0 <350 <2.0 <2.0 <40.0
08/27/19 <3.0 < 4.0 <350 <2.0 <2.0 <40.0
09/03/19 <3.0 < 4.0 <350 <2.0 <2.0 <40.0
09/13/19 <3.0 < 4.0 <350 <2.0 <2.0 54.6
10/09/19 <3.0 < 4.0 <350 <2.0 <2.0 <40.0
10/15/19 3.1 7.9 <350 <2.0 <2.0 <40.0
10/22/19 <3.0 < 4.0 <350 <2.0 <2.0 <40.0
11/25/19 <3.0 5.0 <350 <2.0 <2.0 <40.0
12/12/19 <3.0 < 4.0 <350 <2.0 <2.0 <40.0
1Sr-89 and Sr-90 were below the required detection limit of 2 pCi/L (§ 141.25)